bus rapid transit lane assist technology systems … rapid transit lane assist technology systems...
TRANSCRIPT

U.S. Department of Transportation Federal Transit Administration
Bus Rapid Transit Lane Assist Technology Systems Volume 1
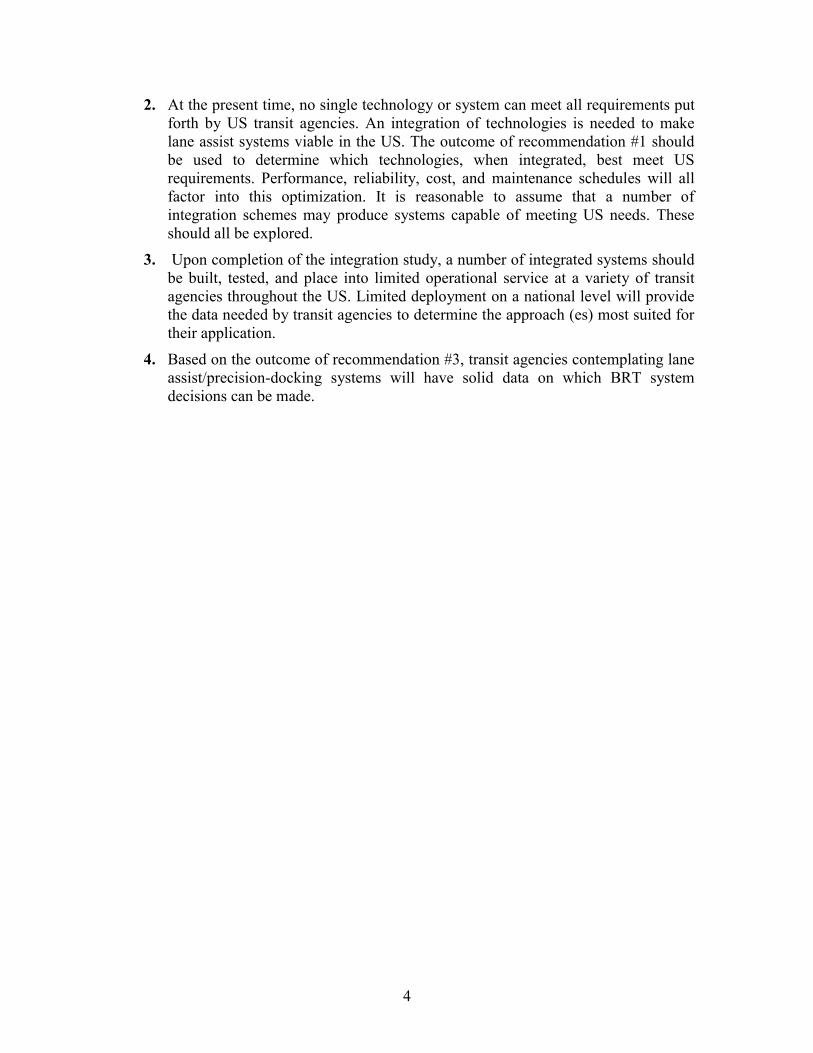
Technology Assessment
February 2003
FTA-MN-26-7003

REPORT DOCUMENTATION PAGE Form Approved OMB No. 0704-0188
Public reporting burden for this collection of information is estimated to average 1 hour per response, including the time for reviewing instructions, searching existing data sources, gathering and maintaining the data needed, and completing and reviewing the collection of information. Send comments regarding this burden estimate or any other aspect of this collection of information, including suggestions for reducing this burden, to W ashington Headquarters Services, Directorate for Information Operations and Reports, 1215 Jefferson Davis Highway, Suite 1204, Arlington, VA 22202-4302, and to the Office of Management and Budget, Paperwork Reduction Project (0704-0188), Washington, DC 20503.
1. AGENCY USE ONLY (Leave blank) 2. REPORT DATE
February 2003 3. REPORT TYPE AND DATES COVERED
4. TITLE AND SUBTITLE
Bus Rapid Transit Lane Assist Technology Systems Vol. 1 Tech. Assessment 6. AUTHOR(S)
Max Donath, Craig Shankwitz, Lee Alexander, Alec Gorjestani, Pi-Ming Cheng, Bryan Newstrom
5. FUNDING NUMBERS
7. PERFORMING ORGANIZATION NAME(S) AND ADDRESS(ES)
Metro Transit 560 6th Avenue North Minneapolis, MN 55411 and University of Minnesota, ITS Institute, 213 Mechanical Engineering 111 Church St SE Minneapolis, MN 55455
8. PERFORMING ORGANIZATION REPORT NUMBER
9. SPONSORING/MONITORING AGENCY NAME(S) AND ADDRESS(ES)
Federal Transit Administration U.S. Department of Transportation Washington, DC 20590
10. SPONSORING/MONITORING AGENCY REPORT NUMBER
11. SUPPLEMENTARY NOTES
12a. DISTRIBUTION/AVAILABILITY STATEMENT
Available From: National Technical Information Service/NTIS, Springfield, Virginia, 22161. Phone 703.605.6000, Fax 703.605.6900, Email [[email protected]]
12b. DISTRIBUTION CODE
13. ABSTRACT (Maximum 200 words)
According to the FTA, “BRT combines the quality of rail transit and the flexibility of buses. It can operate on exclusive transitways, HOV lanes, expressways, or ordinary streets. One of the more likely candidate IVI applications to be initially implemented on BRT systems will be lane assist technology. The premise behind lane assist technology is to increase the safety of BRT vehicles as they operate in the more unique environments, such as narrow lanes. Lane assist technology will allow BRT vehicles to operate at the desired higher operating speeds while maintaining the safety of the passengers, BRT vehicle and the motoring public.”
Issues associated with lane assist and precision docking systems are addressed in this report. Report specifics include: (1) the results of a study to determine US requirements for lane assist and precision docking systems, (2) a review of available lane assist and precision docking system technologies, (3) a comparison of lane assist and precision docking technologies based on system functionality, and (4) an assessment of these technologies with respect to national requirements.
A comprehensive review of human factors issues associated with narrow lane usage, including a pilot study to assess driver response to a lane assist system.
15. NUMBER OF PAGES14. SUBJECT TERMS
Driver Assistive System, Lane Assist Technology, Lateral Guidance, DGPS, High Accuracy Digital Maps, Narrow Lanes, Bus Rapid Transit, Precision Docking
16. PRICE CODE
17. SECURITY CLASSIFICATION OF REPORT
Unclassified
18. SECURITY CLASSIFICATION OF THIS PAGE
Unclassified
19. SECURITY CLASSIFICATION OF ABSTRACT
Unclassified
20. LIMITATION OF ABSTRACT

Bus Rapid Transit Lane Assist Technology Systems
Volume 1 Technology Assessment
Final Report Submitted to
U.S. Department of Transportation Federal Transit Administration
February 2003
Submitted by Metro Transit
Michael Setzer, General Manager 560 6th Avenue North
Minneapolis, MN 55411
In collaboration with the
University of Minnesota ITS Institute
Correspondence and questions about this report may be directed to: Metro Transit 560 6th Avenue North Minneapolis, MN 55411
Aaron Isaacs, Program Manager Susan Stensland, Grant Manager Phone: 612-349-7690 612-349-7603 Fax: 612-349-7548 612-349-7503 E-Mail: [email protected] [email protected]

Volume 1
Prepared byUniversity of Minnesota ITS Institute
Craig Shankwitz, Lee Alexander, Alec Gorjestani, Pi-Ming Cheng, Bryan Newstrom and Max Donath
Intelligent Vehicles Laboratory Department of Mechanical Engineering
and the ITS Institute University of Minnesota
111 Church St. SE Minneapolis, MN 55455

NOTICE:
This document is disseminated under the sponsorship of the United States Department of Transportation in the interest of information exchange. The United States Government assumes no liability for its contents or use thereof.
The United States Government does not endorse manufacturers or products. Trade names appear in the document only because they are essential to the content of the report.

Table of Contents
EXECUTIVE SUMMARY .......................................................................................................................... 1
CHAPTER 1: INTRODUCTION................................................................................................................ 5
CHAPTER 2: INTERPRETATION OF LANE ASSIST REQUIREMENT SURVEY AND WORKSHOP RESULTS ........................................................................................................................... 10
BACKGROUND .......................................................................................................................................... 10LANE ASSIST SYSTEM SURVEY: TECHNOLOGY OVERVIEW....................................................................... 10SURVEY AND WORKSHOP RESULT SUMMARY ............................................................................................ 12
Operations........................................................................................................................................... 13Lanes for Lane Assist .......................................................................................................................... 14Performance, Reliability, and Maintenance Requirements ................................................................. 15Deployment ......................................................................................................................................... 16
LEGAL REQUIREMENTS FOR LANE ASSIST SYSTEMS. ................................................................................. 16LEGAL REQUIREMENTS FOR PRECISION DOCKING SYSTEMS. ..................................................................... 17SUMMARY OF SURVEY AND WORKSHOP LANE ASSIST SYSTEM REQUIREMENT ....................................... 19
CHAPTER 3: BUS RAPID TRANSIT GUIDANCE TECHNOLOGIES............................................. 21
EUROPEAN TECHNOLOGIES – COMMERCIALLY AVAILABLE SYSTEMS ..................................................... 21Curb Guided Buses.............................................................................................................................. 21Rail guided buses ................................................................................................................................ 23Civis/Irisbus ........................................................................................................................................ 25Frog/Phileas........................................................................................................................................ 27
UNITED STATES TECHNOLOGIES – PROTOTYPE SYSTEMS......................................................................... 28California PATH ................................................................................................................................. 283M Magnetic Tape .............................................................................................................................. 29University of Minnesota Intelligent Vehicles Lab ............................................................................... 30
CHAPTER 4: TECHNOLOGY ASSESSMENT. .................................................................................... 35
TECHNOLOGY / SYSTEM COMPARISON. .................................................................................................... 36Systems with high infrastructure costs. ............................................................................................... 37Systems with medium infrastructure costs........................................................................................... 39System with low infrastructure costs. .................................................................................................. 42Comparison conclusion....................................................................................................................... 43
SYSTEM PERFORMANCE GUIDELINES......................................................................................................... 43
CHAPTER 5: LANE ASSIST VS. PRECISION DOCKING ................................................................. 50
CHAPTER 6: CONCLUSIONS AND RECOMMENDATIONS ........................................................... 52
REFERENCES............................................................................................................................................ 54
APPENDIX A: REQUIREMENTS SURVEY RAW DATA.................................................................A-1
APPENDIX B: ANALYSIS OF USABILITY SCALES FROM APPENDIX A ................................. B-1
APPENDIX C: MINNEAPOLIS LANE ASSIST TECHNOLOGY WORKSHOP............................C-1
APPENDIX D: TECHNOLOGY QUESTIONNAIRE..........................................................................D-1

Table of Figures
Figure 1. Twin Cites Map indicating bus-only-shoulder routes. Red indicates bus-only-shoulder lanes, and blue represents HOV lanes. ......................................................... 7
Figure 2. Geographic distribution of transit agency survey respondents. Four of the twenty-one respondents failed to provide geographic location information............. 13
Figure 3. Directional Accuracies....................................................................................... 19 Figure 4. Cross section of the infrastructure needed to support curb guided bus
operations. ................................................................................................................. 22 Figure 5. Translohr rail connection ................................................................................... 25 Figure 6. Projection of test route showing radius of curves. Quality 4 indicates that the
DGPS system provided a “fix” level of solution quality, indicating dynamic lateral accuracy of approximately 2 – 4 cm (.8 – 1.5 inches). ............................................. 44
Figure 7. Technobus lateral error as a function of test time. Test speed was steady at 56 km/h (35 mph), with a small standard deviation of 4.5 km/h (2.8 mph). This data is for one northbound trip up the test corridor. The trip duration was 202 seconds (about 3.5 minutes) at an average speed of 56 km/h (35 mph) (the maximum allowable speed). This example was based on GPS alone with no inertial measurements used in the vehicle controller............................................................. 45
Figure 8. Distribution of lateral errors for the data of Figure 6 from Technobus testing. Mean error is –5.6 cm (2.2 inches), with a standard deviation of 13 cm (5.1 inches). This data is for one northbound trip up the test corridor. The trip duration was 202 seconds (about 3.5 minutes) at an average speed of 56 km/h (35 mph) (the maximum allowable speed). As discussed in Volume 2, this performance would be difficult for a skilled human to replicate. ................................................................................ 46
Figure 9. Plot of usefulness and satisfaction for a range of telematic devices including new lane assist concept (based on Figure 2 from van der Laan, Heino, & de Waard, 1997). Lane assist device coordinate is denoted with the diamond. Please note that the abscissa is scaled from –2 to +2, whereas the ordinate is scaled from 0 to 2. .. B-3

Table of Pictures
Picture 1. Wide bus in narrow shoulder on I-35W south of downtown Minneapolis......... 8 Picture 2. A curb guided bus in operation in Leeds, U.K. Bogey wheels ride on both
sides of the bus, providing tight lateral control, preventing the bus from “banging” against the sides of the dedicated lane. ..................................................................... 21
Picture 3. Picture illustrating the “bogey” wheels mounted to the front wheels used to guide the bus along a curb......................................................................................... 22
Picture 4. Bombardier TVR which uses a rail embedded in the pavement as means of controlling the lateral position of the bus.................................................................. 24
Picture 5. A Translohr BRT vehicle.................................................................................. 25 Picture 6 Las Vegas CIVIS bus parked at test docking station......................................... 26 Picture 7. Phileaus BRT vehicle showing multiple steered axles and high
maneuverability. ........................................................................................................ 28 Picture 8. Sequence showing bus operating in lane with adjacent truck........................... 30 Picture 9. Bus driver accessing control panel. ................................................................. 31 Picture 10. Bus showing dual GPS receivers ................................................................... 31 Picture 11. HUD Image. Vehicles located in front of the bus and in close proximity are
highlighted in red. ..................................................................................................... 33 Picture 12. LIDAR ........................................................................................................... 33Picture 13. Three views as seen in the virtual mirror of vehicles located in the lane
adjacent to the bus (on the right). .............................................................................. 34 Picture 14 Las Vegas CIVIS bus negotiating a “hands-free” turn during system
demonstration. Note the location of the painted guidance reference. Note “no hands” status of the driver. .................................................................................................... 50
Picture 15. Photo of test docking station for Las Vegas CIVIS bus. Note lane reference markers used for docking are the same as those used for lane assistance. The only difference between docking and lane assist is the reference used to position the bus. The deviation of the lane reference markers to the right of the picture represents the change of reference from the center of the lane to the curb. ..................................... 51

Table of Tables
Table 1. Summary of Survey and Workshop Lane Assist System Requirement.............. 20 Table 2. Summary of Infrastructure Characteristics for Various Lane Assist and Precision
Guidance Systems ..................................................................................................... 48 Table 3. Summary of Vehicle Characteristics for Various Lane Assist and Precision
Guidance Systems ..................................................................................................... 49

Acknowledgements
We would like to thank all of the Metro Transit bus drivers and maintenance crew who have been so cooperative and helpful in participating in the various tests and demonstrations of the technology. We would also like to thank Gina Baas, Dawn Spanhake and Rick Odgers of the University of Minnesota for their help in the completion of this document.

1
Executive Summary
The Federal Transit Administration (FTA) has identified the concept of Bus Rapid Transit (BRT) as a means to increase the efficiency of transit operations while maintaining transit’s proven safety record. According to the FTA website www.fta.dot.gov, “BRT combines the quality of rail transit and the flexibility of buses. It can operate on exclusive transitways, High Occupancy Vehicle (HOV) lanes, expressways, or ordinary streets. A BRT system combines intelligent transportation systems technology, priority for transit, cleaner and quieter vehicles, rapid and convenient fare collection, and integration with land use policy.”
Because of the limited right-of-way available to build new (and possibly dedicated) lanes for BRT operations, the FTA has identified lane assist and precision docking as two emerging technologies which will enable deployment of BRT systems. The FTA has stated in their request for letters of application for this project that, “One of the more likely candidate IVI applications to be initially implemented on BRT systems will be lane assist technology. The premise behind lane assist technology is to increase the safety of BRT vehicles as they operate in the more unique environments, such as narrow lanes. Lane assist technology will allow BRT vehicles to operate at the desired higher operating speeds while maintaining the safety of the passengers, BRT vehicle and the motoring public.”
This report addresses requirements, technologies, infrastructure, and human factors issues associated with lane assist and precision docking systems to be used as part of a comprehensive Bus Rapid Transit system. Five primary tasks were associated with this project:
1. Requirements for Lane Assist Systems and Precision Docking
2. Available Technologies for Lane Assist Systems
3. Lane Assist vs. Precision Docking Technologies
4. Technology Assessment
5. Human Factors Issues
Tasks 1 – 4 are addressed in this volume; Volume II addresses Human Factors issues. Both a task description and a summary of the results of each task are provided below; detailed information is provided in subsequent report chapters.
Task 1: Requirements for Lane Assist Systems and Precision Docking. The purpose of this task was to document National requirements for Lane Assist and Precision Docking Systems. Two approaches were used to solicit input from transit properties throughout the US. First, a requirements survey was developed and sent to forty-eight US transit agencies. Representatives of the participating transit agencies responded and returned surveys, the results of which were compiled, analyzed, and are presented in Appendices A and B. Second, a requirements workshop was held in Minneapolis, MN, on May 7, 2002. BRT stakeholders were invited to participate in this workshop, and were provided an opportunity to address issues and concerns regarding lane assist and

2
precision docking systems. The results of this workshop were organized, compiled, and are presented in Appendix C.
The main conclusion of this task is that transit agencies throughout the US have similar requirements regarding system reliability, cost, and maintenance. However, serious requirement differences are noted in terms of environmental conditions, operational expectations, and performance capabilities. This large variance in system requirements has a significant impact on the technologies which can be used on these lane assist / precision docking systems.
Task 2: Available Technologies for Lane Assist Systems. The outcome of this task provides a description of the systems presently available for lane assist and precision docking as well as technologies under development that could be used for this application. When available, performance data, anecdotal information, operational history, acceptable operational environments, and cost information have been provided.
The main result of this task is that no “turn key” approaches to lane assist and precision docking systems exist, and that in the present state of development, no one system or technology will satisfy all of the requirements determined in Task 1. Lane assist and precision docking technologies still require significant development before they are ready for full-scale deployment.
Task 3: Lane Assist vs. Precision Docking Technologies. This task examined the commonality between lane assist and precision docking technologies, both in terms of system performance and on regulations governing their use. Functionally, lane assist and precision docking systems provide a means to accurately and repeatedly laterally position a bus in a lane. The functional difference between the two is the speed at which this takes place.
Operationally, differences arise between these two technologies. A Differential Global Positioning Systems (DGPS) based approach, for instance, may provide required lane assist and precision docking capabilities in outdoor locations where a clear view of the sky is available. However, DGPS based precision docking will be ineffective under a canopy where GPS satellite access is blocked.
In terms of requirements, very little legislation or official government policy regulates lane assist systems. Precision docking performance, however, affects the passage of riders on to and off of the bus, and is therefore governed by the Americans with Disabilities Act. These requirements are discussed in Chapter 4 below.
Task 4: Technology Assessment. The original goal of the technology assessment was to match national requirements with available technologies to provide guidance to transit agencies considering lane assist and precision docking systems. Through the course of the project, it became evident that the state of technology development and the breadth of requirements provided by transit agencies would make an assessment so general that it would be nearly irrelevant, and of little use to transit agencies. Clearly, a different direction was needed.
Instead of a generalized assessment, three distinct efforts were undertaken. First, a technology comparison is provided to highlight differences between different approaches to lane assist and precision docking systems. Second, a technology survey was developed

3
which allows a transit agency to solicit specific, relevant information from a lane assist / precision docking system provider or technology developer. This is a tool that can be used by a transit agency to compare systems on a consistent basis. Third, to provide a measure of what lane assist performance can be achieved, a description of the performance of the Metro Transit / University of Minnesota Technobus is provided. The results provide a reference against which other systems can be measured; the results are not intended to serve as a performance specification for lane assist systems in general.
Conclusions and Recommendations. This research program has provided significant insight into the issues associated with lane assist and precision docking systems. This work has led to the following conclusions and recommendations.
Conclusions.
1. National operational and environmental requirements are so broad that a single technology or system available today is unable to meet the core set of national requirements.
2. Lane assist and precision docking systems are still in the early stages of system development. Insufficient operational experience disallows any statistically valid claim to system performance, system reliability, maintenance requirements, failure modes, etc. Too few of these systems have been deployed worldwide. Systems, which have been deployed, have suffered from a lack of development and testing. This premature deployment has reduced public and driver acceptance of these systems.
3. No single technology exists which will meet a reasonable subset of the requirements provided by US transit properties. If lane assist and precision docking systems are to be deployed in the US, these systems (in the near term) will require an integration of the emerging technologies discussed in Chapter 3.
4. In the near term, individual transit agency requirements will dictate which mix of technologies will be used for lane assist and precision docking systems. Each transit agency will be required to perform a benefits/cost analysis to determine both the technologies to be utilized and the role each will play in their BRT system.
Recommendations.
1. Core technologies require further research, development and testing in a limited operational context. Operational testing will provide data from which reliability, maintenance, cost, and performance measures and models can be constructed. Key issues include how narrow a lane can be used for busways, the tradeoff between vehicle speed and lane width, and the degree to which a driver is involved in typical operations and in emergency intervention1.
1 Specific human factors issues are addressed in volume 2.
4
2. At the present time, no single technology or system can meet all requirements put forth by US transit agencies. An integration of technologies is needed to make lane assist systems viable in the US. The outcome of recommendation #1 should be used to determine which technologies, when integrated, best meet US requirements. Performance, reliability, cost, and maintenance schedules will all factor into this optimization. It is reasonable to assume that a number of integration schemes may produce systems capable of meeting US needs. These should all be explored.
3. Upon completion of the integration study, a number of integrated systems should be built, tested, and place into limited operational service at a variety of transit agencies throughout the US. Limited deployment on a national level will provide the data needed by transit agencies to determine the approach (es) most suited for their application.
4. Based on the outcome of recommendation #3, transit agencies contemplating lane assist/precision-docking systems will have solid data on which BRT system decisions can be made.

5
Chapter 1: Introduction
The FTA has acknowledged that the evolution of mass transit will require an intelligent application of existing and emerging technology. To support the application of this emerging technology to transit systems, the FTA has sponsored three previous Intelligent Vehicle Initiative (IVI) advanced technology programs:
1. Forward Collision Warning System (FCWS) with partners Federal Highway Administration, California Department of Transportation, San Mateo County Transit District, University of California at Berkeley Partners for Advanced Transit and Highways (PATH), and Gillig Corp. (a bus manufacturer).
2. Side Collision Warning System (SCWS) with partners Port Authority of Allegheny County, Pennsylvania Department of Transportation, Carnegie Mellon University, and Clever Devices.
3. Rear Collision Warning System (RCWS) with partners Ann Arbor Transportation Authority, Veridian Engineering, and PATH.
The FTA has also identified the concept of Bus Rapid Transit as a means to increase the efficiency of transit operations while maintaining transit proven safety record. According to the FTA website www.fta.dot.gov, “BRT combines the quality of rail transit and the flexibility of buses. It can operate on exclusive transitways, HOV lanes, expressways, or ordinary streets. A BRT system combines intelligent transportation systems technology, priority for transit, cleaner and quieter vehicles, rapid and convenient fare collection, and integration with land use policy.”
To achieve the objective of reducing travel time (or variability of travel time), BRT systems can provide several service types that require certain forms of operational roadway (Hardy et al, 2001):
• Express BRT Service – high speed, large capacity, infrequent stop service connecting urban areas with to outside areas along expressway routes using dedicated or semi-dedicated lane roadway operations.
• Urban Shuttle BRT Service – large capacity service in heavily congested (downtown) areas using semi-dedicated lane roadway operations (and dedicated lanes if right-of-way is available).
• Local Collector BRT Service – standard bus operations coupled to the other BRT services.
In its request for letters of interest, the FTA has stated that, “One of the more likely candidate IVI applications to be initially implemented on BRT systems will be lane assist technology. The premise behind lane assist technology is to increase the safety of BRT vehicles as they operate in the more unique environments, such as narrow lanes. Lane

6
assist technology will allow BRT vehicles to operate at the desired higher operating speeds while maintaining the safety of the passengers, BRT vehicle and the motoring public.”
This report deals directly with the issues associated with the use of narrow lanes for BRT applications, including system requirements and the effects narrow lane operations have on professional bus drivers. In many areas throughout the county, the operation of buses in narrow lanes is necessary because of the limited right-of-way and the expense associated with the creation of new infrastructure. Because of these conditions and limitations, new paradigms are needed to ensure the safe, rapid transport of transit customers as well as preserve the well being of the bus driver.
Narrow Lane Operation Example: Metro Transit Minneapolis/ St. Paul Minnesota.
An early example of BRT operations can be found in the Minneapolis/ St. Paul Minnesota Metro area. Metro Transit and Mn/DOT created Team Transit in 1992, the objective of which was to develop rules, regulations, and procedures which would enable a transit bus to safely operate on highway shoulders during periods of heavy congestion and stop-and-go traffic. The safety of such bus-only shoulder operations was the subject of a study (McCarthy and Davis, 1996), which indicated that if particular operational “rules of engagement” are followed, bus-only shoulder operation should prove safe and efficient. Working with the local FHWA Office, the utilization of the highway shoulders as a busway during specified conditions was approved, and operation began in the fall of 1992.
Rules of bus only shoulder operation are relatively straightforward, and can be summarized as follows:
• Shoulder must be authorized with official signs for bus use. • With traffic moving, bus speed limited to 56 km/h (35 mph) on shoulder, and may
travel no more than 24 km/h (15 mph) faster than adjacent traffic.• If traffic is moving along at 56km/h (35 mph) or faster, buses must stay off
shoulder.
The decision to use the bus only shoulder is left to the driver; no driver is required to use the bus-only shoulder during periods of high congestion. However, passengers are aware that if the bus is not utilizing the shoulder lane, their destination will be reached later. There have been instances where passengers on buses not using the shoulder have used their cell phones to call the Metro Transit Customer Relations Department, demanding that their bus driver move to the bus-only shoulder. Clearly, bus-only shoulder operations are a critical component of the Metro Transit system, both from an efficiency viewpoint and from a customer satisfaction standpoint.
Metro Transit has operated this BRT service in the Minneapolis/ St. Paul Minnesota metro area for the past 10 years. Over these years, the routes for which this BRT service was provided has grown substantially, from 6 miles in 1992 to over 200 miles in 2003.

7
Figure 1. Twin Cites Map indicating bus-only-shoulder routes. Red indicates bus-only-shoulder lanes, and blue represents HOV lanes.

8
A number of key operational advantages are associated with operating buses on shoulders. First, infrastructure costs are low. It is far easier (and cheaper) to modify existing shoulders for bus only operations than it is to construct new roadways. Second, because of the lack of congestion on the shoulders, Metro Transit is able to increase its percentage of on-time stops even during rush hour. Third, passengers on buses traveling on bus only shoulder lanes perceive timesavings roughly twice the actual timesavings. In a Metro Transit study (MnDOT Final Report, 1998), an actual 8 minute time saving on a particular route was perceived to be a 15 minute time saving by the passengers. Passengers in the Minneapolis/ St. Paul Minnesota metro area have become accustomed to the advantages of bus only shoulder operation.
Although Metro Transit practice of operating bus only shoulders was mentioned as a successful program, it is not without its problems. As it turns out, maintaining the proper lane position of a 9 ½ foot wide bus in a 10 foot wide lane is a difficult task in good weather, and nearly impossible in bad weather. A graphic illustration of the task the driver faces is illustrated in Picture 1 below.
Picture 1. Wide bus in narrow shoulder on I-35W south of downtown Minneapolis.
In bad weather, drivers have a difficult time determining where the right boundary of the shoulder is. Drivers are therefore reluctant to use the shoulder for fear of dropping a

9
wheel off of the pavement, and risking getting a bus stuck in the soft dirt adjacent to the shoulder. This is further complicated in snow events and in winter in general, where snow removal operations have left some shoulders snow covered and the right edge of the shoulder even more obscured. Lane assist technology development underway in Minnesota is addressing these and similar problems faced by drivers.
Two volumes comprise the final report for this project. This volume reports on system requirements for lane assist systems, including narrow lane guidance and precision docking. It also provides a description of technologies2 which are presently available for lane assist systems, as well as a description of the performance of the Metro Transit/University of Minnesota Technobus as it operates on a narrow bus only shoulder on highway 252 in Brooklyn Park, MN. Volume One includes with a technology survey which can be used as a tool for transit agencies considering incorporating lane assist systems for their operations3. This survey can be provided by transit properties to potential system suppliers for their completion. Use of a single survey allows transit properties to judge systems based on consistent questioning. Moreover, the survey may help technology providers determine which issues are key to users of these systems. Volume one closes with a list of conclusions and recommended steps necessary to expedite the use of lane assist systems for BRT operations.
Volume Two covers the pilot human factors study associated with this effort. This pilot study examines the effects of lane width, traffic volumes, and the lane assist system on a bus-only shoulder corridor in the Minneapolis/ St. Paul Minnesota metro area. For this pilot study, 12 drivers were trained with the lane assist system, and tested during rush hour to determine their stress and driving performance under conditions typically faced by drivers on bus-only shoulders. The motivation, experimental protocol, results, and recommendations for further work and study are provided in Volume Two.
2 The emphasis here is on technologies as no “turn key” production systems are presently available either in the US or abroad. 3 In the original Request for Letters of Application, a “technology assessment” which would have matched requirements with technologies was to have been performed. However, because of the dearth of available systems lane assist systems, the technical survey was created to facilitate the decision-making and procurement processes of the transit agency.

10
Chapter 2: Interpretation of Lane Assist Requirement Survey and Workshop Results
Background
In this chapter, core requirements for lane assist and precision docking systems are discussed. Lane assist and precision docking systems are relatively new concepts, and have only been available in either limited numbers or experimental configurations. As such, an experiential history is unavailable. At this time only the Regional Transportation Commission of Southern Nevada (through the Citizens Area Transit in Las Vegas) has made a commitment to purchase and put into service a lane assist / precision docking system. This particular system is a CIVIS system provided by IRISBUS.
To determine a more complete understanding of the requirements of BRT stakeholders throughout the United States, three efforts were undertaken. First, Metro Transit and the University of Minnesota produced a requirements survey that was sent to approximately 50 transit agencies throughout the US. The survey was designed to gain information relative to BRT lane assist systems in five areas of focus: operations, narrow lanes / right-of-way, performance and reliability expectations, deployment issues, and technology applications. Second, to supplement the survey, a requirements workshop was held in Minneapolis on 07 May 2002 (during the APTA Bus and Paratransit conference) to solicit additional requirement input from BRT stakeholders. The workshop attracted 37 participants. Third, the Americans with Disabilities Act (ADA) was reviewed to determine the legal requirements for precision docking stations.
As will become evident in this chapter, lane assist requirements are quite disparate among both the agencies who responded to the survey and those who attended the workshop. To illustrate the range of responses, and to highlight salient differences, TABLE 1 at the end of this chapter provides a summary of the survey and workshop requirements results.
Lane Assist System Survey: Technology overview
Due to the limited exposure that many US Transit agencies have to lane assist and precision docking systems, it was necessary to provide a context under which the requirements survey was to be completed. The following represents the overview of lane assist and precision docking background information provided to the (potential) survey respondents.
Lane assist technologies are systems which give feedback to the driver or control the bus lane position while driving in dedicated or semi-dedicated lanes that may be narrower than standard traffic lanes (i.e., perhaps 10 feet wide as opposed to a standard lane width of 12 feet). Such systems are necessary to sustain safety because of the smaller margin for error associated with operating a bus with less lane width, especially adjacent to regular traffic. Lane assist systems typically utilize one or more of the technologies described below:

11
• Vision-based Guidance systems use machine vision equipment (cameras, image processing equipment, pattern recognition algorithms, etc.) to provide the lane assist system information pertaining to the lateral and longitudinal position of the equipped vehicle.
• Magnetic Guidance systems use a magnetic material (i.e., magnetic tape, magnetic plugs) either located on or embedded in the roadway to provide a reference magnetic field. A sensor, consisting of multiple magnetometers, compares the relative field strength measured by each magnetometer. From those measurements, the lateral distance to the magnetic reference is determined. Knowledge of where the magnetic reference material is placed in the lane provides the additional information necessary to determine the lateral position of the bus with respect to the lane center.
Limited longitudinal information can be provided by “coding” the magnetic reference material. This is accomplished through selective polarization of different sections of the magnetic material. A positive polarity can represent 1, and a negative polarity can represent 0 in the same manner information is stored on a computer disk.
• Wire Guidance is similar to magnetic guidance in that a reference material is embedded in the pavement. In this case, a wire is embedded in the road, and is energized with electricity. The energized wire creates a magnetic field (Maxwell’s Law), and sensors similar to those described for magnetic guidance measure the relative magnetic field, and determine a distance from the buried wire.
• Mechanically Guided systems rely upon physical contact for vehicle guidance. Freight and passenger trains can be considered mechanically guided system. As applied to BRT, mechanical guidance is often executed through the use of small “bogey” wheels that run in or along a track. These bogey wheels are connected through a linkage to the vehicle steering mechanism. The linkage is designed so that if the bus drifts to the left, the steering mechanism steers the bus to the right, and vice versa.
• Global Positioning System (GPS) Guidance uses a constellation of satellites located in orbits around the earth at an altitude of 20,200 km (12,500 miles). Using triangulation, the position of a receiving antenna can be computed to typical accuracies of approximately 25 - 30 meters (82 – 98 ft). System accuracy can be improved through the use of a technique known as differential correction. Using one GPS receiver as a base station at a fixed, known location, errors between the computed position and the known position of that antenna can be computed. The errors at that base station are computed, and corrections are applied to the other GPS receivers close to that base station. Using variations of this correction methodology, position accuracies within 2-5 cm (.8-1.9 inches) are achievable using dual frequency GPS receivers.

12
GPS will provide position information; however, alone it will not provide information regarding the position of the bus with respect to the lane. To determine bus position relative to the lane, the location of lane boundaries must be known. A digital map (more correctly, a digital geospatial database) containing the location of all relevant elements of the local landscape is used in conjunction with the GPS based position information. The database is queried based on vehicle location, and the query results provide the location of the lane boundaries and other objects. From that information, the position of the vehicle with respect to the lane can then be determined and used by the lane assist system.
Other technologies that are relevant and which were discussed in the survey are:
• Platooning is the technique of electronically coupling vehicles together in small groups that follow a lead vehicle. It generally refers to high-speed, high-density travel on limited access highways under small headways.
• Precision Docking uses an electronic guidance system to “dock” the bus with a platform at exact locations. This may be useful for fast loading and unloading of passengers, especially those with special needs. The same system is also useful as a component of an advanced maintenance station, such as an automated refueling station.
Survey and workshop result summary
In this section, survey results are interpreted and summarized. Because of the subjective nature of interpretation, a copy of the survey is included in Appendix A. Appendix B contains results regarding the perceived “usefulness” of the technology that was incorporated into the survey (question 25 of the survey dealt with this perception issue). Results and comments from the 07 May 2002 workshop are included in Appendix C. A summary of the results from each of the five focus areas is provided below after a brief description of the survey respondents.
Of the 48 survey documents that were sent to a variety of transit agencies and professionals throughout the US, 21 surveys were returned. Of the 21 respondents, 9 listed their position as “manager,” 4 listed their position as “executive,” and 8 respondents did not report their position. The geographical distribution of transit agencies was reasonably uniform throughout the US; only one state (California) was represented with more than 2 responses. The greatest number of respondents came from the east coast.
Given respondent demographic information, the results are now summarized. Highly recommended is the review of the complete survey results that are captured in a series of bar charts located in Appendix A.

13
Figure 2. Geographic distribution of transit agency survey respondents. Four of the twenty-one respondents failed to provide geographic location information.
Operations
The roadways on which BRT Lane Assist technology will be required to operate range from free flowing traffic to congested roads, and from neighborhoods to HOV lanes. The distribution of roadways appears to be fairly uniform. Fifteen of twenty-one respondents mentioned that they will require lane assist systems to be used on roadway shoulders; 9 of the respondents require lane assist systems on other
1
1
1
1
1
1
4
2
2
2
12
Key:-Indicates number of agencies from state. -Black triangle is pointer from state.

14
dedicated roadway. According to survey respondents, buses using lane assist technology are likely to encounter the same roadway features as normal traffic. Among the respondents, nearly equal numbers of transit agencies are likely to see intersections, bridges, toll plazas, tunnels, etc., along the routes used by vehicles with lane assist systems. Roadway elements including ice, snow, debris, disable vehicles, etc. are also likely to be encountered. Narrow Rights of Way (ROW) were a larger concern for workshop participants than survey respondents. This should not be overlooked, as it appears to be a critical issue. Workshop participants were clear that this issue needs to be dealt with.
Both survey and workshop results point to the fact that buses equipped with lane assist technologies will face the same challenges that conventional bus operations face today. Limited ROW is a key issue in that the majority of these buses will operate on narrow lanes adjacent to existing roads.
At the present time, only 3 transit agencies are presently running buses in narrow lanes, with 15 responses indicating that they are not utilizing narrow lanes in their present routes. For many transit agencies, adaptation of narrow lanes and lane assist technology represents a substantial change in operational philosophy.
Lanes for Lane Assist
Given operational conditions, the next logical step is to describe the lane on which buses with lane assist technology will run. First, survey respondents overwhelmingly (15:4) agreed that other motorists would violate bus only lanes. The response that motorists are likely to violate narrow bus lane likely motivated the response that these lanes would be required to be separated from other lanes. Survey results indicate that hard physical barriers (guard rails, curbs, etc. for a total of 27 responses) are equally as likely to be used as visual or tactile barriers (paint stripes, rumble strips, etc. for a total of 24 responses) to maintain separation.
Barriers may presently exist or be incorporated as part of the narrow lane design. Drop-offs (one side or both sides) and barriers (one or both sides, at or behind curb) are likely to be elements adjacent to the narrow lanes.
The narrow lanes are equally likely to be located on the left or right sides of existing roadways4. The range of acceptable speed differentials between a bus traveling on an open narrow lane adjacent to high density traffic was nearly uniformly distributed in the 0 – 64 km/h (0 – 40 mph) region, with a slight preference appearing for the 0 – 14 km/h (0-9 mph) band. It is important to note, however, that almost as many people failed to respond as there were respondents. The high frequency of “no response” is likely due to the difficulty visualizing a particular speed differential and then determining at what speed differential safety issues become critical.
4 One respondent indicated that it would work only on the left side of an existing lane of traffic.

15
Performance, Reliability, and Maintenance Requirements
Responses regarding the traffic environment and the lane itself have been addressed. How the lane assist equipped bus is to perform under these conditions is addressed next.
As background information, many transit agencies are already involved with the use of emerging technology for their bus operations. These technologies include smart cards, video surveillance, automated vehicle location systems, etc. This provides a good basis from which to determine performance and reliability requirements.
Performance and reliability issues received more attention in the workshop than in the survey. From a safety point of view, lane assist systems should in no way compromise the safety record of present bus transit systems, nor should the public perceive risk associated with the deployment of these systems. In the event of a system failure, a backup system5 should be present, and immediately be engaged.
The driver is a key component in the system. Survey respondents overwhelmingly indicated that a driver would be required in a bus at all times (15 yes: 2 no). The lane assist system must be designed with the driver in mind, and reduce stress, fatigue, and workload during the driving shift. With the system on, the driver must remain engaged and ready to respond should a potentially dangerous situation arise. Driver stress is the focus of the Human Factors pilot study undertaken as part of this project.
The transit passenger must also welcome the system. The passenger needs to be convinced that the lane assist system improves system safety while at the same time improving the on-time record of the transit agency. The presence of lane assist technology should not degrade the customers perceived ride quality of the bus ride.
Workshop comments and survey responses indicate that the lane assist system must work in all weather and road conditions because that is when the driving task is most difficult, driver stress is highest and safety is most compromised. To ensure driver acceptance, drivers must be involved with system development. Technology and infrastructure needs to be operational in all types of weather and road conditions such as snow, ice, heavy rainfall, high humidity, hot, cold, day, night, sand & salt on road, and withstand dust, sand, and water damage to the external hardware.
Reliability of the system is the next issue addressed. Ideally, the system should work all of the time in all circumstances. However, it appears that transit agencies want to know “when shouldn’t the system operate?” Transit agencies need guidelines and need to know the limits of the technology.
5 The driver can act as a back up provided she/he can be immediately engaged at a high level of effectiveness. This is presently a topic under investigation by Dick de Waard at the University of Groningen in the Netherlands, who is associated with the Minnesota Study team.

16
Generally, good maintenance practices produce good system reliability. The survey posed the question regarding an acceptable frequency for system maintenance. The overwhelming response was “Don’t know” (10 responses) followed by monthly (4 responses) and quarterly (3 responses). It is likely premature to ask this question; the cost of the maintenance is also a factor which should be factored into the maintenance question.
Deployment
Two elements affect deployment (or the rate thereof) of new processes and technologies: need and cost. Survey results indicate that seventeen (seven “yes”, ten “depends on cost”) of twenty one respondents would pursue funding to provide for the use of lane assist technologies for narrow transit lanes (the states that answered “yes” to the question are CA, NV, MN, IL, FL DC and 2 agencies from CT). A follow up question asked whether transit agencies had sufficient opportunities to use narrow lanes, and whether that agency would invest in lane assist technology to support narrow lane usage. Eight responded “yes,” and eight responded “don’t know.” Clearly, interest exists in providing BRT service in narrow lanes.
The “depends on cost” and “don’t know” are legitimate answers. Narrow lane usage has proved to be very successful for Metro Transit . Passengers perceive a time saved by bus only shoulder use twice what the actual timesavings are. Ridership is up, and the main costs to provide this service have been limited to upgrades in shoulder infrastructure.
Bus-only-shoulder service is good, but it could be better. A 9.5 foot wide bus in a 10 foot wide lane is difficult in good weather, and extremely difficult in bad weather. This difficulty motivated the lane assist project in Minnesota. However, before a commitment to this technology is made, a benefit: cost study must be undertaken to determine whether full deployment is warranted. A Field Operational Test is first needed, however, to fully quantify the benefits gained with lane assistance. Benefits and costs can be quantified with limited deployment and extrapolated to represent an estimate thereof on a wide scale.
Legal Requirements for lane assist systems.
Few rules and regulations govern the use of lane assist systems in the United States, primarily because none have been widely deployed on a national level. For instance, in the case of Minneapolis/ St. Paul Minnesota where Metro Transit operates buses on narrow shoulders, use of the shoulders had been controlled through an agreement between Metro Transit, Mn/DOT, and the FHWA. However, private coach operators and school buses lobbied for the use of bus-only shoulders, and in 2001, Minnesota state law was passed to allow school buses and private coaches access to the bus-only shoulder. This legislation, however, does not govern the performance of a bus in a narrow lane, but rather defines the conditions under which a bus can operate in these lanes.

17
In the State of Minnesota, the following regulates the use of the shoulder as a busway for BRT operations (for complete regulations, see www.revisor.leg.state.mn.us/stats/169/):
Sec. 10. [169.306] [USE OF SHOULDERS BY BUSES.] 11.28 If the commissioner of transportation permits the use by11.29 transit buses of a shoulder of a freeway or expressway, as11.30 defined in section 160.02, in the seven-county metropolitan11.31 area, the commissioner shall permit the use on that shoulder of11.32 a bus with a seating capacity of 40 passengers or more operated11.33 by a motor carrier of passengers, as defined in section 221.011,11.34 subdivision 48, while operating in intrastate commerce.11.35 Buses authorized to use the shoulder under this section may11.36 be operated on the shoulder only when main line traffic speeds12.1 are less than 35 miles per hour. Drivers of buses being12.2 operated on the shoulder, may not exceed the speed of main line12.3 traffic by more than 15 miles per hour and may never exceed 3512.4 miles per hour. Drivers of buses being operated on the shoulder12.5 must yield to merging, entering, and exiting traffic and must12.6 yield to other vehicles on the shoulder. Buses operated on the12.7 shoulder must be registered with the department of12.8 transportation.
Legal Requirements for precision docking systems.
Precision docking, on the other hand, is subject to legal performance requirements. The primary source of the performance comes from the Americans with Disabilities Act (ADA). The ADA provides guidelines for the access to a bus for a disabled passenger.
According to the ADA, “New bus stations must be accessible. Alterations to existing stations must be accessible. When alterations to primary function areas are made, an accessible path of travel to the altered area (the bathrooms, telephones and drinking fountains serving that area) must be provided to the extent that the added accessibility costs are not disproportionate to the overall cost of the alterations.” (See http://www.ed.gov/offices/OCR/docs/hq9805.html).
Specific to docking, the ADA provides design guidelines for bus access at a docking station. According to the ADA Accessibility Guidelines for Buildings and Facilities, section 10.3.1 provides regulations for new facilities, and section 10.3.2 provides regulations for existing facilities and stations. Both are provided for convenience below (relevant sections only); a more complete review can be found in http://www.usdoj.gov/crt/ada/reg3a.html - Anchor-94867.

18
10.3 Fixed Facilities and Stations.
10.3.1 New Construction. New stations in rapid rail, light rail, commuter rail, intercity bus, intercity rail, high speed rail, and other fixed guideway systems (e.g., automated guideway transit, monorails, etc.) shall comply with the following provisions, as applicable.
(9) In stations covered by this section, rail-to-platform height in new stations shall be coordinated with the floor height of new vehicles so that the vertical difference, measured when the vehicle is at rest, is within plus or minus 5/8 inch under normal passenger load conditions. For rapid rail, light rail, commuter rail, high speed rail, and intercity rail systems in new stations, the horizontal gap, measured when the new vehicle is at rest, shall be no greater than 3 in. For slow moving automated guideway "people mover" transit systems, the horizontal gap in new stations shall be no greater than 1 in.
EXCEPTION 1: Existing vehicles operating in new stations may have a vertical difference with respect to the new platform within plus or minus 1-1/2 in.
EXCEPTION 2: In light rail, commuter rail and intercity rail systems where it is not operationally or structurally feasible to meet the horizontal gap or vertical difference requirements, mini-high platforms, car-borne or platform-mounted lifts, ramps or bridge plates, or similar manually deployed devices, meeting the applicable requirements of 36 C.F.R. part 1192, or 49 C.F.R. part 38 shall suffice.
10.3.2 Existing Facilities: Key Stations.
(4) In light rail, rapid rail and commuter rail key stations, the platform or a portion thereof and the vehicle floor shall be coordinated so that the vertical difference, measured when the vehicle is at rest, is within plus or minus 1-1/2 inches under all normal passenger load conditions, and the horizontal gap, measured when the vehicle is at rest, is no greater than 3 inches for at least one door of each vehicle or car required to be accessible by 49 CFR part 37.
EXCEPTION 1: Existing vehicles retrofitted to meet the requirements of 49 CFR 37.93 (one-car-per-train rule) shall be coordinated with the platform such that, for at least one door, the vertical difference between the vehicle floor and the platform, measured when the vehicle is at rest with 50% normal passenger capacity, is within plus or minus 2 inches and the horizontal gap is no greater than 4 inches.
EXCEPTION 2: Where it is not structurally or operationally feasible to meet the horizontal gap or vertical difference requirements, mini-high platforms, car-borne or platform mounted

19
lifts, ramps or bridge plates, or similar manually deployed devices, meeting the applicable requirements of 36 CFR part 1192, or 49 CFR part 38, shall suffice.
Clearly, precision docking stations fall into the category of automated guideway systems. The ADA therefore provides performance guidelines on horizontal and vertical gap distances for precision docking stations. However, longitudinal accuracies (or errors) in positioning the vehicle along the fore-aft direction are not provided.
Figure 3. Directional Axes
Summary of Survey and Workshop Lane Assist System Requirement
Table 1 below highlights the substantial variation in both survey and workshop responses to salient lane assist system requirement issues. As shown by the range of responses illustrated in Table 1, a universal set of functional requirements applicable to transit agencies throughout the US is unlikely. The development of regionally applicable system requirements that address similar environmental, climate, and operational conditions faced by transit agencies in a particular region is more likely.
Vertical
Fore-Aft (Longitudinal)
Horizontal (Lateral)

20
Table 1 Summary of Survey and Workshop Lane Assist System Requirements
Minimal and Maximal National Functional Requirements for Lane Assist Systems: Operations
Category Minimal Functional Requirements Maximal Functional Requirement Operational Weather Sunny Rain, Fog, Snow
Operational Speed Differential 0 – 14 km/h (0-9 mph) 80 – 94 km/h (50-59 mph) Degree of Bus Autonomous Operation No Lane Assist System, Normal bus
operationsLane Assist System aids operation, Driver
RequiredPrecision Docking Used for Maintenance (no passengers) At Bus Stops (passengers)
Applicable Vehicles Van Transit bus
Minimal and Maximal National Functional Requirements for Lane Assist Systems: Lanes
Category Minimal Functional Requirements Maximal Functional Requirement Shared Lanes HOV Mixed Freeway Traffic Dedicated Busways Exclusive Busways Narrow Lanes, including bus shoulders and
median lanes Bus Lane Separation Paint Stripes/Markings Concrete Barriers Physical Obstacle Conflicts Gravel, Debris Pedestrians, Stalled Vehicles
Minimal and Maximal National Functional Requirements for Lane Assist Systems: Performance, Vehicles, and Reliability
Category Minimal Functional Requirements Maximal Functional Requirement Platoon Capability None Yes Acceptable Maintenance Schedule Weekly Annual Maintenance personnel Contractor from Outside Within Organization

21
Chapter 3: Bus Rapid Transit Guidance Technologies
In this section, descriptions of systems and technologies which may be appropriate for lane assist and precision docking systems are provided. During the course of this project, it was determined that no “turn key” systems are available for deployment in the US. As such, what follows is primarily an overview of systems which have been deployed but apparently are no longer in production (i.e., “curb guided buses”), or systems which are under development, but have not yet seen a wide scale deployment (i.e., the CIVIS and Phileas buses from Europe). It should be noted that the CIVIS buses operated by the Regional Transportation Commission of Southern Nevada (RTCSN) are used only for precision docking. Because of the effects of heat and sunlight on pavement markings in Southern Nevada, RTCSN is unable to properly maintain road markings on the corridors on which these buses will operate. RTSCN, however, is able to maintain the pavement markings near bus stops, facilitating precision docking functionality.”
European Technologies – Commercially Available Systems
Curb Guided Buses
In this system a bogey wheel is attached to the front steering mechanism on each side of the bus. These bogey wheels ride along the vertical part of a curb (also spelled kerb in some references) that has been constructed specifically to guide the bus along the intended route. The bogey wheel, as mounted on a bus, is shown in Picture 3. While the bogey wheels ride along the vertical part of the curb, the bus tires run on the horizontal part of the curb. Variations in horizontal curvature are sensed by the bogey wheels and mechanically fed back to the steering mechanism on the bus. This system was developed by Mercedes-Benz with initial experiments done in Essen, Germany.
Picture 2. A curb guided bus in operation in Leeds, U.K. Bogey wheels ride on both sides of the bus, providing tight lateral control, preventing the bus from
“banging” against the sides of the dedicated lane.

22
Picture 3. Picture illustrating the “bogey” wheels mounted to the front wheels used to guide the bus along a curb.
The infrastructure needed to support curb guided lane assist is illustrated in Figure 4 below. Because of the design of the curbs on which the bus operates, these lanes are dedicated for bus use only. As is shown below, “deterrent” paving surrounds the dedicated lane, preventing unauthorized use.
Figure 4. Cross section of the infrastructure needed to support curb guided bus operations.

23
Because the cost of the infrastructure is relatively high, the curb guided bus system in Leeds, U.K. is used primarily to bypass traffic backed up at stoplights. To design a bypass, traffic engineers estimate the length of a typical line of vehicles stopped at a busy controlled intersection during rush hour. This provides a measure of the length of the needed bypass. Once a length has been determined, a narrow curbed guideway of that length is constructed in the median to allow buses to continue past the stopped traffic. The estimated infrastructure cost for a curbed guideway in Leeds is 1 million pounds per lane kilometer. This price includes boarding stations and an interface with traffic signals to give approaching buses a signal priority. Riders can save about 10 minutes by taking the bus instead of driving a car over the same route. Most current transit bus designs can be converted to curb guidance for about 5 to 10% of the cost of the bus. The Leeds transit agency has created an extensive web site to describe their Superbus system (www.firstleeds.co.uk/superbus/newindex.html).
A second implementation of a curb guided bus was initially installed in Essen, Germany, with another 12 km (7.5 miles) O’Bahn route deployed later in Adelaide, Australia. The Adelaide O’Bahn system is reported to carry up to 30,000 passengers per day at a top speed of 100 km/h (62.1 mph) making it the longest and fastest guided bus system in the world. Buses from 15 different routes pick up passengers at normal bus stops downtown, enter the guideway and drive to the suburbs faster than car traffic. These buses then leave the guideway to deliver passengers to dispersed locations.
A more thorough description of the O’Bahn system can be found at their website (http://www.adelaidemetro.com.au/guides/obahn.html).
Rail guided buses
Bombardier and Translohr have separately developed large, rubber tired, doubly articulated buses that are guided by a single central rail embedded in the pavement6.The intention of both manufacturers is to give passengers a light rail experience at a lower overall cost.
Bombardier installed their first commercial system in the city of Nancy, France and began operation in February of 2001. Operation was shut down in March of 2001 pending the investigation of 2 accidents. These accidents were the result of the rear car becoming laterally unstable while transitioning from the guideway to the unguided road. The instability was manifest in uncontrolled lateral oscillations of the rear car. Operations resumed in March of 2002; the transition from a guided condition to an unguided condition is now done at 5 km/h (3.1 mph). Maximum operational
6 Although conceptually similar, each manufacturer takes a different approach to the rail guidance system.

24
speed on conventional roads is limited to 20 km/h (12.4 mph). At these low speeds, the unstable lateral mode of the rear car apparently is not excited.
The Bombardier guidance system uses hydraulic actuators to apply 4000 lbs. of force to the rail to minimize problems with snow and ice in the track. The Bombardier TVR weighs 25.2 metric tons (empty) and has a top speed of 70 km/h (43.5 mph)
Although the reported cost varies from source to source, infrastructure cost for the system is estimated to be approximately $15.5 million/mile, according to “Light Rail Progress”, March 2001 (Problems with the Nancy, France system have been documented at http://www.lightrailnow.org/features/f_ncy001.htm).
Picture 4. Bombardier TVR which uses a rail embedded in the pavement as means of controlling the lateral position of the bus.
The Translohr from Lohr Industrie in Strasbourg, France uses a mechanical linkage to access the central rail as opposed to the TVR’s hydraulic linkage. It is designed to be relatively lightweight so as to put the least strain on existing pavement. The Translohr weighs 19.5 tons empty for a 25 meter (82 ft), 116-passenger version with 32 seats. Various versions are available from 18 to 39 meters (59 to 128 feet) long; passenger capacity varies from 2000 to 5000 passengers per hour per lane.

25
Picture 5. A Translohr BRT vehicle
Figure 5. Translohr rail connection
Civis/Irisbus
The CIVIS rubber tired tram is an articulated transit vehicle similar to the Bombardier and Translohr buses except that instead of an embedded rail it uses a camera that tracks a coded stripe painted on the road. The CIVIS is being developed by the Irisbus consortium. The camera guidance system was developed by Matra Transport International, which is now a part of Siemens Transportation Systems. CIVIS buses are assembled at an Irisbus plant in Rorthias, France. A CIVIS bus system is currently running in the city of Rouen, France. In the US, a system is planned for Las Vegas. Las Vegas plans are to use the guidance system only for docking at stations. Five CIVIS buses measuring 18.5 meters (60 ft) long will service the Boulevard North Corridor line which joins 15 stations along 3.2 km (2 miles), Pecos Road to the South and Bruce Road to the North. The first trials on real lines were scheduled to start in 2002. Commissioning and opening to the public is set for late 2003.
The CIVIS control system uses a camera mounted outside of the bus, mounted on the roof, and looking down at stripes painted in the center of the lane. Snow must be cleared from the roadway for the optical guidance system to be operational in cold

26
climates. The camera is connected to a vision module that analyzes the image and sends information to a guidance module that also receives data from the steering system, gyros, odometers, etc. The guidance module uses all of the input data to compute a path correction and sends the appropriate commands to an electric steering actuator. The Las Vegas CIVIS bus, with camera, is shown in Picture 6.
A CIVIS bus is an 18 meter (59 ft) long articulated vehicle with a capacity of 110 people. One lane dedicated to CIVIS buses can carry up to 3000 passengers per hour. The CIVIS has a top speed of 70 km/h (43.5 mph). According to information from Irisbus the lateral guidance system is capable of keeping the bus within 5 cm (1.9 inches) of the desired lateral position at a forward speed of 50 km/h (31 mph). Docking accuracy at low speed is 35 mm (1.4 inches) so the horizontal docking gap will typically be 40 mm ± 35 mm (1.6 inches ± 1.4 inches).
Picture 6. Las Vegas CIVIS bus parked at test docking station.
Forward looking camera
Lane markers used by camera

27
Irisbus estimates the system failure rate to be 3 failures that will require repair every 100,000 km (62,100 miles). This estimate will need be verified as more experience is gained with installed systems. In addition to failures requiring repair the CIVIS is currently experiencing about 1 transitory failure requiring driver intervention for every 1000 dockings. These transitory failures do not interrupt the operation of the vehicle.
In case of a malfunction the automatic steering system is shut down, a warning is sounded and control is returned to the driver. The driver also can overpower the system at any time. Irisbus has determined by simulation and experimentation that the path deviation caused by a system failure should be approximately 20 to 30 cm (7.8 to 11.8 inches) in addition to the normal operating errors caused by crosswinds, etc.
Frog/Phileas
The Phileas bus being developed by Advanced Public Transport Systems BV, a consortium of four companies: Berkhof-Jonckheere Group, annually which produces 1500 buses; BOVA, which annually produces 800 coaches; SIMAC which operates in the field of information technology and industrial electronics and automation, and BOM (Brabantse Ontwikkelings Maatschappij), a regional investment company.
The Phileas bus uses guidance technology from Frog Navigation Systems in Utrecht, Netherlands. FROG stands for Free Ranging On Grid. This system uses dead reckoning based on vehicle kinematics to navigate along a grid of predetermined points. Each point on the grid is associated with an absolute location technology that corrects for the drift in the dead reckoning system. The location technology associated with the gridpoints can be magnetic markers embedded in the pavement, radio beacon transponders, DGPS, or some other form of accurate local position sensor7. Magnetic markers seem to be the currently preferred grid markers. The Phileas will be available with a capacity of from 48 to 240 people and has a top speed of 70 km/h (43.5 mph).
Phileas claims that only slight modifications to existing infrastructure are necessary to support guided operation. No rails or overhead cables are required. The infrastructure requirements for the vehicles are typically: • dedicated concrete lanes; • 3.2 meter (10 ft) wide double lanes; • magnetic markers every 4 meters (13 ft) in the road surface; • interfaces with the existing traffic control systems; • adapted pavement height at stops (300 mm (11.8 inches));
7 The choice of location technology employed depends upon position accuracy requirements as well as cost and availability.

28
According to APTS, while driving in automatic mode, the Phileas automatically follows a predetermined trajectory; the required lane-width required is 3.2 meters (9.84 feet) at speeds up to 70 km/h (43.5 mph). The system performance is based on magnetic plugs in the road surface and works under most weather conditions, even with snow on the road surface. The Phileas also uses multiple steered axles, which provides for tight maneuverability even with dual articulated systems. More information on the Phileas can be found at http://www.apts-phileas.com/.
Picture 7. Phileaus BRT vehicle showing multiple steered axles and high maneuverability.
United States Technologies – Prototype Systems
California PATH
PATH has developed an automated steering system for automobiles that uses magnetic plugs in the pavement to determine the lateral position of a vehicle with respect to its present lane of travel. Efforts are underway to adapt this technology to BRT.
From the PATH website, the following description of project BRT 64A0028-18366: Bus Rapid Transit Research Task 2 - Development of a Transit Precision Docking System is provided:
Brief Description of Work: The Bus Precision Docking System (BPDS) seeks to achieve, with the help of automation technologies, a high docking accuracy that

29
allows fast loading and unloading of passengers with special needs. The utilization of precision docking at bus stations could improve bus movement efficiency, drivers productivity, work-life quality and reduce the needs of bus driver training. The stress associated with achieving the high accuracy by the bus driver, and quick fueling at the bus maintenance stations will be dramatically reduced. BPDS can further improve the operational efficiency of Queue Jump Lanes through more efficient operations and at advanced bus stops it can significantly benefit Adaptive Bus Priority Systems.
California has demonstrated precision docking capability using their magnetic plug reference systems, using passenger vehicles as experimental testbeds. In Tan et al. (2002), PATH researchers claim that using a Buick LeSabre as their test vehicle, precision docking with lateral accuracies of approximately 1 cm (.4 inches) can be repeatedly demonstrated8.
3M Magnetic Tape
3M has developed a lane lateral positioning system that uses a solid-state magneto-resistive sensor array on a vehicle to determine the relative lateral position of the array with respect to a magnetic lane marking tape on the road surface. Lateral distance from the magnetic tape is determined by the relative magnetic field strength detected by each of the magneto-resist sensors that comprise the array. The lateral position can be used for driver assistance via a graphical display or it could be used to provide automated steering assistance by actuation the vehicle steering mechanism.
3M developed a graphical display used to help a driver keep a vehicle properly positioned in a lane. The position of the vehicle with respect to the tape is shown on an operator interface display that allows the driver to manually maintain a desired lane position in near zero visibility conditions. This system was designed for high speed snowplowing operations (5 – 40 mph) and has been used in the US DOT FHWA Intelligent Vehicle Initiative Generation Zero Field Operational Tests over the last 4 years with few failures. The lateral accuracy of this high-speed system has been measured to be 5 to 10 cm (1.9 to 3.8 inches). This was more than adequate for the snowplow driver assist systems tested.
The cost per vehicle was estimated to be between $5,000 and $10,000 depending on the installation requirements. The development goal was to get the infrastructure cost per lane mile down to the cost of normal pavement marking tape. Normal magnetic tape installations average from $3.00 - $5.00 per lineal foot. This price includes the price of the magnetic tape. It should also be noted that the tape would need to be continuous over the length of the road surface.
8 A measurement system independent of the magnetic marker system was not indicated, so the lateral accuracy measurement cited likely is based on the magnetic sensing system.

30
A California company, Barrier Systems Inc. has developed a prototype design for a low speed magnetic tape based system. They are operationally achieving cm accuracy with a machine that moves portable traffic barriers from one side of a lane to the other to create HOV lanes in major cities. The tape used for their application is identical to the tape used in the high-speed applications. This low speed capability is needed for precision docking applications.
Unfortunately, the Magnetic Guidance System developed by 3M is no longer being supported. The development has been discontinued and will not be supported for any additional tests or applications. The information provided above is only meant to give an account of the projects status at the time it was discontinued.
University of Minnesota Intelligent Vehicles Lab
The Intelligent Vehicles Lab (IV Lab) in the Mechanical Engineering Department at the University of Minnesota has developed and demonstrated a lane support system on a Metro Transit bus that is capable of steering the 9.5 ft. wide bus along a 10 ft. wide “bus only shoulder” in the Minneapolis/ St. Paul Minnesota Metro Area. One example of it’s operation is the sequence shown in Picture 8 (see Picture 1 for an additional example).
Picture 8. Sequence showing bus operating in narrow lane with adjacent truck.
The lane support system is comprised of a DGPS based positioning system, on-board high accuracy geospatial database, on-board computers, forward looking radar, and a driver interface system which includes a Head Up Display, driver control panel display, a tactile seat, and steering wheel haptic feedback.

31
Picture 9. Bus driver accessing control panel. The HUD is seen in profile in front of the driver. The panel over the driver’s shoulder projects the image onto the HUD.
The system is able to provide a driver with high fidelity representations of the local geospatial landscape through a Head Up Display, as discussed in Lim et al, (2001). Pictures representative of the accuracy of these projections are provided below in Picture 11.
Real time GPS corrections are provided to the bus using the Trimble Virtual Reference station and a digital cell phone as the communication downlink. A pair of Trimble MS750 receivers are used to provide centimeter accurate positions, roll and heading information at a 10 Hz data rate.
Picture 10. Bus showing dual GPS receivers

32
A high accuracy geospatial database is used to provide guidance information to the bus and driver. Lane and shoulder boundaries are located in the database at an accuracy level of 5 cm (1.9 inches) or better. Queries to the database are based on vehicle position; the database query returns lane boundary positions of the bus shoulder and adjacent lane.
With the results of the database query, the lateral position of the bus can be compared to the location of the lane (or shoulder) boundaries. The lateral position of the bus with respect to the center of the lane, its width, speed, and heading are used to determine both lateral error and whether the bus is moving out of lane.
For the HUD system, an in-vehicle geospatial database combined with a query processor allows us to extract the needed geospatial data in real time. As the vehicle moves along a stretch of highway, the vehicle's DGPS derived position (and orientation) is used to pull data from this centimeter accuracy "digital map" and provide it to the HUD's graphics processor, which in turn computes the projection perspective needed for registration with the driver’s eyes. In order to avoid eye fatigue, the optical properties of the HUD have been designed with a virtual focus located approximately 12 meters (39 ft) in front of the vehicle.
The system allows the driver of the vehicle to see the 'computed' road boundaries projected upon the 'actual' road boundaries even if they are obscured by snow, rain, or darkness. Icons representing radar sensed obstacles are projected into the image to provide the driver with the correct cueing information as to distance and location of obstacles in the field of view.
The haptic feedback system applies torque through the steering wheel. Steering wheel torque feedback is directly proportional to lateral position error. This “advisory” is provided continuously. The torque feedback on the steering system is limited to 2 ft-lbs at the steering wheel, ensuring that any feedback can be overridden by a driver should they so choose.
Tactile and visual lane departure “warnings” are provided when the bus is determined to be departing the lane/shoulder. The tactile warning is a vibration of the driver’s seat, left side for left lane departure, and vice versa. Warnings are provided in the HUD as well, with the left lane boundary turning red for a left lane departure, and vice versa. It should be noted that the shoulder boundaries are continuously projected in the HUD as the bus travels along the shoulders, and the warnings are applied only when an imminent lane departure is detected.

33
Picture 11. HUD Image. Vehicles that are located both in front of the bus and in close proximity are highlighted in red. Note that the lane boundary on the left has also turned red because the bus has crossed the left lane boundary.
A virtual mirror, as discussed in Sergi et al, (2003) is a computer display that imitates the properties of a physical optical mirror on a display inside of the vehicle. The virtual mirror generates a display using various sets of sensor based information which are fused together. The virtual mirror does not suffer from the line of sight issue associated with an optical mirror. For example, drivers typically adjust a side rearview mirror such that part of the view contains the side of the vehicle, effectively reducing the area that can be seen. The virtual mirror may be calibrated to display the same view that would be seen in the real mirror, but the vehicle would be made semi-transparent so that the driver can view what would otherwise be a blind zone, yet maintain the visual reference of the vehicle edge.
A geospatial database or detailed digital map is used to display the static surroundings of the vehicle at a given location, but other dynamically moving objects that may pose navigational threats still must be detected. Due to the high degree of spatial resolution and accuracy desired, a Light Detection and Ranging (LIDAR) sensor (see Picture 12) was used to track vehicles adjacent to the bus.
Picture 12. LIDAR

34
Typical views that can be generated in the virtual mirror are (a) the ‘standard mirror’ view, (b) a bird’s eye view, and (c) an overhead plan view (Picture 13).
Picture 13. Three views as seen in the virtual mirror of vehicles located in the lane adjacent to the bus (on the right in each picture).
The performance of the IV Lab system is provided in Chapter 4. Its performance is provided to give the reader a measure of the performance capabilities which can be achieved with a lane assist / precision docking system.
(a) (b)
(c)

35
Chapter 4: Technology Assessment.
The original intent of this task was to match requirements as determined from both the requirements survey and the requirements workshop with technologies and systems available for use in lane assist / precision docking systems. However, as the requirements survey and workshop data was analyzed and the applicable technologies and approaches reviewed, it became evident that a comprehensive match of technologies with requirements is far beyond the scope of this project. The specific reasons for this inability to match technologies with requirements include
1. The range of environmental conditions under which lane assist systems are required to operate indicates that multiple technologies are either suited or needed for these applications.
2. Cost constraints were mentioned, but no hard limits were provided or determined in either the requirements survey or workshop.
3. In terms of system reliability and performance measures, only the curb-guided systems have sufficient operational history from which failure modes, rates, and effects can be quantified.
4. Aside from the curb-guided buses, no proven “turn key” lane assist systems are available. All other technologies are either at the prototype or experimental stage. Manufacturers and technology developers were unable/unwilling to provide specific data regarding their systems to the project team.
A request was made to the FTA to change the scope of this task. The change of scope was to move from a technology assessment to the provision of a “technology assessment” tool that can be used by a transit agency considering lane assist / precision docking technologies. This tool is in the form of a technical survey to be answered by technology provider. The technology survey was developed during the course of the project as an internal tool to question technology providers and systems integrators as a means to gain a better understanding of their technology in terms of performance, reliability, and cost.
The problem faced by the team was that technology providers were unwilling or unable to respond to our request to complete the survey. Any unwillingness was probably due to high workloads, tight deadlines, or the perception that trade secrets may be compromised by providing data to the University of Minnesota who itself has a lane assist system. An inability to provide answers to the survey may also be due to the lack of experiential data to support claims regarding maintenance needs and costs, system reliability, system failure rates and modes, etc. Both reasons are plausible given the early state of development for lane assist systems.
Should a transit agency be interested in a lane assist system, completed technology surveys from technology providers would enable a transit agency to perform a relativecomparison of lane assist systems. The results of this technical questionnaire, combined with an understanding of the transit agencies requirements, will provide transit agency management an initial milestone in the process of deploying lane assist systems.

36
The remainder of this chapter is organized as follows. First, based on the technology review provided in Chapter 3 above, a relative comparison between technologies and systems is summarized. Second, performance data for the University of Minnesota Lane Assist System is provided. This data should not be considered to be a performance specification, but can be used as a reference against which other systems can be measured. Third, Appendix D provides the full technology survey prepared for transit agencies to use in their pursuit of lane assist / precision docking systems.
Finally, Table 2 and Table 3 located at the end of this chapter provide a high level infrastructure and vehicle comparison of the technologies and systems considered herein.
Technology / System Comparison.
A number of different tacks can be use to approach a comparison of various systems applicable to both lane guidance and precision docking. Presented herein are systems grouped according to infrastructure costs: high, medium, and low. As transit agencies are forced to do more with limited resources, cost becomes a primary requirement. Grouping systems by infrastructure costs addresses this fundamental concern.
Systems classified as having high infrastructure costs include curb-guided buses, rail guided systems, and grid-based systems. The reported infrastructure costs for these systems range from approximately $3M per lane mile to $15.5 M per lane mile, and are likely to be deployed on a relatively limited basis. Systems associated with medium infrastructure costs are vision and magnetic plug/tape based. The infrastructure costs associated with these systems are approximately $20,000 per lane mile. Systems with infrastructure costs at this level are likely to see reasonably wide distributions of deployment. Finally, DGPS systems can be considered to have low infrastructure costs. No physical changes of the existing infrastructure are required to implement DGPS based lane assistance; costs for building the digital map needed for lane guidance are on the order of $250 per lane mile.
It should be noted that the medium and low infrastructure cost system classifications are based on the assumption that the roadways on which these vehicles will run are designed and built to support continuous operation. In Minnesota, older shoulders were typically not designed for bus operations. To support bus only shoulder operations, these shoulders required (in the worst case) modifications at a cost of $100k per mile. Because of the use of bus only shoulders, Minnesota now (re)builds shoulders to support future bus only shoulder operation.
The creation of digital geospatial databases (aka, digital map) consists to two key components: the collection of data used to create the database, and the processing of that data into useful geospatial information.
Data can be collected in a number of ways, including photogrammetry, paint stripe operations, and specifically designed probe vehicles. Each of these techniques has been

37
used by the Intelligent Vehicles Lab at the University of Minnesota to create digital geospatial databases of roadways used for research and demonstrations.
1. In areas where photogrammetry data of sufficient accuracy is available, the data files representing the roadway can be converted to the vehicle specific format developed by the IV Lab.
2. For paint stripe operations, a paint striping machine equipped with DGPS and additional sensors can be used to determine the location of paint strips as they are applied to the road. Probe vehicles can be used in one of two ways to collected requisite road data.
3. In areas where the road geometries are simple and where intersection density is low, driving roads and recording lane centers can serve as the basis for the geospatial database. Known road geometry and design guidelines are fused with centerline information to create a high accuracy representation of the road and its surroundings.
4. For areas with complex or highly variable road geometry, vehicles equipped with DGPS and image capture and image processing equipment can be used to located existing lane boundaries. With this technique, a camera looking at the pavement captures images of the roadway. Once an image is captured, image processing algorithms are used to determine the location of the lines in the image in real-time. An accurate camera calibration computation of the location of the paint stripe with respect
Once data has been collected, the next step is to process the raw data and place it into the geospatial database. The process is proprietary (and an active area of research), but involves a number of steps, including data reduction, data smoothing, and the optimization of the representation of the data in the database. One component of this optimization is to properly balance database density and the level of detail contained therein.
Systems with high infrastructure costs.
Systems with high infrastructure costs include curb guided buses, rail guided systems, and grid-based systems. The advantages and disadvantages of each of these systems is discussed below.
Curb guided buses.
Advantages. Curb guided buses exhibit four primary advantages. First, of the systems discussed, curb guided buses provide the highest degree of operational reliability. They have a proven track record as can be documented by the Leeds and Adelaide systems. Because the systems are mechanical with

38
exposed parts, visual and manual inspection is straightforward and can be performed at the beginning of each driver’s shift. Margins of safety are built into the mechanical design; based on route schedules, routine maintenance is both easy to schedule and carry out. Finally, in the (rare) event of a system failure, the design of the busway, with its vertical curbs, provides a physical means with which to keep the bus out of the adjacent lanes, keeping the passengers and motorists in the adjacent lanes safe.
Disadvantages. Although the least expensive of the systems whose infrastructure cost could be considered high, at approximately $3M per lane mile, cost still might be sufficiently high to prohibit its construction. However, what may be a larger issue still is the procurement of the land and adjacent right-of-way on which the dedicated lane will be build. A transit agency for whom right-of–way is extremely limited may be forced to eliminate this system from consideration.
A surrogate disadvantage to this system lies in the use of a lane dedicated to only curb guided buses. The motoring public is quick to become disenfranchised when lane miles are not used to full capacity. A decision to invest in the infrastructure needed to support curb guided buses must be accompanied by the decision to place routes in high demand areas and support that route with a sufficiently large number of buses. The construction of dedicated lanes requires a significant commitment by a transit agency.
Rail Guided buses.
Advantages. One significant potential advantage to rail guided buses is that if the roadway rail interface is properly designed, the rail guided bus can operate in mixed (but controlled access) traffic. Although the Bombardier and TVR buses have been shown to possess early developmental problems, once those problems are addressed and rectified, the mechanical rail guidance approach should prove to offer reliable lane keeping performance. The mechanical and/or hydraulic approach to rail guidance facilitates straightforward maintenance schedules and procedures. These systems are relatively insensitive to weather and other environmental conditions; however, ice jamming of the buried guidance rail can be a problem. During winter months, a rail guided vehicle may need to be equipped with an ice removing device to keep the rail accessible.
Disadvantages. The primary disadvantage to the rail guided bus is cost. The quoted infrastructure cost (based on the rail guided bus in Nancy, France) is $15M per lane mile. Although the highest priced technology listed in this document, it does offer the opportunity for mixed traffic in the lane on which this bus operates. The degree to which this flexibility is offset by the high cost depends greatly upon how a transit agency decides to operate this system.

39
The secondary disadvantage to this system is the early developmental problems experienced by this technology in the Nancy, France, application. The instability of the third car in the set has drawn significant attention to this system, and the system critics have been quite vocal in their opposition to this approach to lane assist. However, given the profile of the Nancy project and its cost, additional system development will eventually result in high performance and reliability.
Grid guidance.
Advantages. As in the case with the rail guided bus, lane assist and precision docking based on grid technology could allow buses to operate in mixed traffic under access controlled conditions. Grid based guidance has been well proven in factory automation applications (autonomous ground vehicles) and airport “people movers.” Once development is complete, Grid guidance should offer reliable, safe operation.
The design of the vehicle side of the system enables the performance validation of each bus before it begins its daily shift to ensure adequate system performance. A small portion of a road Grid can be built at the bus storage/maintenance facility, and the system can be tested every time a bus leaves that facility. Similarly, the infrastructure is designed to facilitate periodic integrity and performance tests so that system availability is kept at necessary levels.
The Grid based system should be relatively insensitive to environmental and topographical conditions. Specific roadway maintenance is likely limited to plowing to keep system sensors from damage caused by snow and ice buildup.
Disadvantages. The primary disadvantage to this system is cost. At $7.5M per lane mile, the cost of this system is at least twice that for the curb guided buses. Unlike the curb or rail guided systems, the grid system is not mechanically connected to the roadway. In the event of a system failure, the responsibility of failure recovery lies with the bus driver. The ability of a driver to recover from a system failure is presently under investigation by the University of Grogenhime in a study led by Dick de Waard.
Systems with medium infrastructure costs.
Systems with medium infrastructure costs include vision based system and magnetic nail and magnetic tape guidance systems. Transit agencies can initially expect to pay approximately $20,000 per lane mile to support these lane assist systems. Infrastructure maintenance costs will vary depending upon how these systems are deployed, the amount of mixed traffic allowed on the lanes, and on the environments in which these systems are deployed.

40
Vision based systems. Advantages. Vision based vehicle guidance systems have an extensive history, dating to the late 1980’s when pioneering work was done by Dickmanns et al (1989,1995). In the US, work by Pomerleau in the 1990’s motivated significant improvements to road going vehicles (Pomerleau 1988, 1990). Exponential increases in computer processor power and decreases in price also have improved the performance of vision based systems, allowing for systems of relative low cost.
Typical vision based vehicle lateral guidance systems “look” for specific lane attributes and determine the lateral position of a vehicle based on its relative position to the identified lane markers. In the case of the CIVIS system, the reference used by the vision system is a pair of dashed lines painted in the center of the roadway. To provide good ride quality, a smooth desired trajectory is determined. Points lying on this trajectory are marked by professional surveyors. Once the reference markers are placed, the lines used by the vision system are painted onto the roadway using white pavement marking paint.
This infrastructure is simple to monitor for maintenance purposes. If lines become worn away, or if paint is scraped or burned off, those lines are simply repainted. It is important to note, however, that this repainting of lines is not an inexpensive proposition; in fact, Las Vegas intends to use the CIVIS system only for precision docking, and not for lane assist. This decision is based on the fact that painted stripes last only for a short period of time when exposed to the high heat and intense UV rays of the desert. It is simply too expensive to periodically repaint the lane markers over the entirety of the bus route.
Disadvantages. Even in light of advances in image processing software and on the computer hardware on which it runs, the applicability of vision based systems are limited to relatively structured environments for which good atmospheric conditions exist. This is evidenced by the CIVIS system. For its operation, the CIVIS needs a specific pattern to recognize, and it needs a clear view of that pattern. Areas for which snow, heavy rain, and fog are endemic cannot reliably be serviced by a vision based system. As these conditions are faced by a significant number of US transit agencies, vision systems should be ruled out as a primary lane assist mechanism for these transit agencies.
Depending on how the system is deployed, maintenance costs associated with vision based systems could be high. High maintenance costs have forced Las Vegas to use only part of the system capability for precision docking. Its lane keeping capability has been lost.

41
Magnetic plugs / magnetic tape.
Advantages. A magnetic plug or tape system offers performance reasonably close to that of a Grid based system for significantly lower infrastructure costs. Much of this cost savings is attributed to the design of the system, which requires a rectilinear or simple curved line of magnetic markers as opposed to a two dimensional grid. Over the past decade, these systems have proven their performance and reliability with applications ranging from passenger automobiles, snowplows and snow blowers used on both the prairie and in the mountains. Moreover, the lateral position of a vehicle with respect to the tape is determined using a relatively low cost vehicle mounted sensor. Selectively polarizing magnets embedded in the road provides a means with which to provide information regarding the road ahead. The road magnets act as a coded magnetic storage device, and the vehicle mounted sensor passing overhead acts as a hard disk read head. Bit rates are a function of magnet spacing and vehicle speeds.
Disadvantages. Vehicle ride quality is a function of the accuracy with which sensor magnets are placed. To assure good ride quality, a desired vehicle trajectory is determined from this trajectory. A survey team is then employed to determine locations on the road where magnets are to be placed. The safe execution of this process requires a survey crew, a maintenance crew, and traffic control.
The low field strength provided by the in-road magnets limits the maximum range for which lateral position can be reliably estimated. The 3M system, for instance, can only determine a distance from the tape at a range of less than one meter. Similar performance is exhibited by the magnetic plug approach. If the orientation of a magnet is altered, the maximum sensing distance is reduced because of the resultant weakening of the local magnetic field.
Finally, the installation of magnetic plugs in a pavement requires that the surface of the pavement be broken. In northern states, this becomes problematic in that surface breaks in the pavement surface often lead to pavement failure because of freeze-thaw cycles. A pavement break allows moisture into the pavement; when this moisture freezes, it expands, compressing the surrounding pavement. Repeated freeze-thaw cycles eventually lead to expanded cracking, and eventually pavement failure.
The magnetic tape is installed in a slot milled into the road so that snow removal equipment does not abrade or pull up the tape. As such, the problem with freeze-thaw cycles does not apply.

42
System with low infrastructure costs.
Based on the classification presented herein, only the DGPS system classifies as a system with low infrastructure cost. This classification, however, is based on the assumption that the provision of DGPS corrections is a cooperative effort, and that costs are leveraged against a number of government agencies.9
DGPS based systems.
Advantages. The primary advantage of the DGPS based system is its low infrastructure costs. At $250/ lane mile, infrastructure costs are approximately two orders of magnitude less than the next less expensive technology. This low cost should be attractive to transit properties looking at using lane assist technology over a wide geographical area, where the cost of other technologies may be cost prohibitive.
The cost of DGPS can be leveraged against other functional capabilities associated with transit operations. DGPS used for lane guidance can also be used for Automated Vehicle Locating systems (AVL), real-time determination of traffic flow rates for traffic management systems, real-time road friction measurements, etc.
Although sensor cost per vehicle is presently high, as the deployment of DGPS expands, production rates will climb, and prices will drop. The degree to which DGPS costs will drop is far greater than the other technologies described. The DGPS system used for lane assist and precision docking are commercial-off-the-shelf products with a broad potential market, as opposed to the application specific systems found elsewhere. Trimble, the manufacturer of the ms750 DPGS system used on the Technobus, has just introduced a new DGPS receiver with performance capabilities of the ms750 in a package approximately 50% smaller than the ms750 for a price less than 50% of the ms750. The model of increased performance for a lower price is clearly substantiated.
Disadvantages. Although the price potential and performance capabilities of a DGPS system are substantial, DGPS is not a panacea. First, DGPS requires a clear view of a substantial portion of the sky above to receive signal from the satellites overhead. This poses a serious problem for urban applications where buses are required to operate in urban canyons. Operation in tunnels, bridges, and some transit stops is also compromised.
The precision docking capability of a DGPS system can also be compromised if a docking station is located beneath a canopy. The canopy can block the reception of satellite signals, eliminating DGPS as a guidance technology.
9 This is the operational model in the Minnesota Minneapolis/ St. Paul Minnesota Metro Area.

43
The DGPS system is also at the mercy of the satellite constellation. Over the past few months, problems have arisen with the space based GPS constellation. Two satellites were scheduled for replacement in 2002; however, the launch of the replacements was delayed. Three launches were scheduled for 2003; whether these 5 satellites will be replaced in 2003 is highly unlikely.
Comparison conclusion.
In the present state of lane assist and precision docking system development, no one system or technology offers a solution for all transit agencies in the United States. The CIVIS vision system employed in Las Vegas would likely be operational less than 50% of the time in Minneapolis. The DGPS system used on busways outside of downtown Minneapolis would exhibit very limited usefulness on a BRT route operating in the Loop in downtown Chicago. Rail guided systems are likely too expensive for any widely deployed BRT system in the US.
The decision to deploy a lane assist or precision docking system, how and where that system will be deployed, and the technology which will be utilized is the responsibility of the transit property. Given the breadth of environmental and operational conditions indicated by the transit agencies responding to the requirements survey, it is likely that an integration of the technologies described herein will be needed to meet the operational requirements associated with a lane assist / precision docking project.
As was determined through the research involved with this project, technology developers have spent little effort in the area of integrating technologies. Because of this limited experience, a systems technical questionnaire has been developed to assist the transit agency exploring lane assist and precision docking. This technical questionnaire would be provided by a transit agency, and would be completed by technology provider. Completed responses from technology providers would enable a transit agency to perform a relative comparison of lane assist systems. The results of this technical questionnaire, combined with an understanding of the transit agencies requirements, will provide transit agency management an initial milestone in the process of deploying lane assist systems.
The Technology Questionnaire is provided in Appendix D below.
System performance guidelines.
Lane assist and precision docking manufacturers and technology developers appear hesitant to provide performance data to back up their performance claims. CIVIS does provide performance specifications for both lane assistance (to 48 km/h (30 mph)) and for precision docking.

44
To provide a stronger sense of system performance, performance of the Technobus is provided. The test route is projected into a plane to give the reader a sense of the route and the radius of the curves traveled by the bus. The lateral performance and relevant statistics are also provided. Independent documentation of the bus performance is provided by a video in the attached CD where a front bumper mounted camera looking down at the pavement illustrates the accuracy with which the Technobus can maintain lane position. Additional information regarding the performance results presented below can be found in Gorjestani et al (2003).
The roadway on which experiments were undertaken is illustrated in Figure 6 below. The topology of the area on which this bus only shoulder is located is essentially flat. The bus-only shoulder pavement is in relatively good condition, but does suffer from the presence of drain grates, occasional broken pavement, some washboard conditions, slight crowns, and undulating sections. The guidance system is relatively robust to these road conditions. This robustness can be seen in the response of the system shown below in the following figures as well as in the video provided on the CD included with this report.
Figure 6. Projection of test route showing radius of curves. Quality 4 indicates that the DGPS system provided a “fix” level of solution quality, indicating dynamic
lateral accuracy of approximately 2 – 4 cm (.8 – 1.5 inches).
Nor
thD
ista
nce,
East Distance, meters
Highway 252 Test Corridor Plan View

45
Test conditions were as follows. The Technobus was operated with IV Lab personnel in the driver’s seat. For the testing, the driver was to not operate the steering wheel unless intervention was needed to maintain safety. The driver was to maintain the speed of the bus at 56 km/h (35 mph) whenever possible to illustrate the performance of the system at the maximum speed allowed by law in Minnesota.
Figure 7 and Figure 8 below provide an illustration of the system lateral errors as the system is “driven” on the Highway 252 shoulder at an average speed of 56 km/h (35 mph). As is shown, performance is quite good.
Figure 7. Technobus lateral error as a function of test time. Test speed was steady at 56 km/h (35 mph), with a small standard deviation of 4.5 km/h (2.8 mph). This data is for one northbound trip up the test corridor. The trip duration was 202 seconds (about 3.5 minutes) at an average speed of 56 km/h (35 mph) (the maximum allowable speed). This example was based on GPS alone with no inertial measurements used in the vehicle controller.
The steering actuation motor is provided with a +/- 2.0 ft-lb torque limit. Limiting steering wheel actuation torque at this value ensures that a driver will be able to overcome the lane assist system should he or she feel it is necessary to do so. The 2.0 ft-lb limit represents a compromise between the performance of the lane assist system and a

46
level of comfort experienced by the driver. Increasing the torque limit would increase the speed of response of the lane assist system, but would decrease the ability of the driver to respond to critical situations.
Figure 8. Distribution of lateral errors for the data of Figure 7 from Technobus testing. Mean error is –5.6 cm (2.2 inches), with a standard deviation of 13 cm (5.1 inches). This data is for one northbound trip up the test corridor. The trip duration was 202 seconds (about 3.5 minutes) at an average speed of 56 km/h (35 mph) (the maximum allowable speed). As discussed in Volume 2, this performance would be difficult for a skilled human to replicate.
It is important to note that the approach taken by the IV Lab is to mount the DGPS antenna as far forward as possible on the bus. In terms of feedback control, forward mounting of the antennae array provides the greatest position measurement “gain” in terms of yawing motions of the bus (i.e., when the bus is steered from left to right, the front of the bus moves a greater lateral distance than the rear of the bus). This high measurement gain facilitates robust performance in terms of disturbance rejection.

47
However, using the GPS Antennae mounted forward to quantify lane keeping performance also increases its measurement sensitivity to disturbances. Mounting of the performance measurement antenna on the rear of the bus would show markedly decreased lateral error variance. Transit agencies must be careful when evaluating vehicles and/or technologies to ensure that measurement practices are consistent between vendors, and are designed to show the worst case behavior.
To provide an independent measure of bus lateral performance, a camera mounted on the front bumper, pointed at the ground, is used. The video clips included in the CD accompanying this report show the lateral position performance of the bus. It is important to note that the camera is mounted on the front bumper of the bus. Just as mounting GPS antennae on the front of the bus provides the greatest sensitivity to errors and disturbances, so to does the mounting of the camera in the front of the bus. Had the camera been mounted on the rear of the bus, lane keeping performance would have appeared even better.10 This reinforces the notion that transit agencies considering lane assist and precision docking station must be cognizant of the relationship between sensor location and system performance measurement, and that measurements done by prospective vendors must be done consistently.
10 Even with a forward mounted camera, the down looking camera shows excellent lane keeping performance by the Technobus.

48
Table 2. Summary of Infrastructure Characteristics for Various Lane Assist and Precision Guidance Systems
Technology Production Status
RoadInfrastructure Cost/Mile
Supporting Infrastructure Costs
Dedicated lane
WeatherLimitations
TopographicalLimitations
Curb Guidance Presently out of production
$2.65M / mile 0 Yes Heavy snow & ice problematic
None
Rail Guidance Prototype (2 systems)
$15.5 M / mile 0 No Ice may jam up guide rail
None
Grid Guidance Prototype (one bus system)
$7.5M / mile (including pavement)
0 No Likely just plowing of deep snow
None
Vision Guidance In Production None Cost of surveying, painting and re-painting reference stripes
No Yes – fog, heavy rain, snow in air, UV & heat on paint stripes
Some – roads must be kept clear so stripes are visible.
PATH Magnets Prototype None $20,000 mile (survey & installation of magnets)
No No None
3M Magnetic Tape
No Longer Supported
None $3 - $5 per lineal foot of magnetic tape, installed
No No None
University of MinnesotaDGPS
Prototype (one system on one bus)
None $250 / lane-mile to map roadway, GPS base stations at $25k each + base station software~$100,000
No No Yes – need clear view to sky for satellite signals

49
Table 3. Summary of Vehicle Characteristics for Various Lane Assist and Precision Guidance Systems
Technology Vehicle sensor cost Computational Complexity
Lane Assist/ Precision Docking
Control Features
Bus Features
Curb Guidance $15,000 - $30,000 None Yes/Yes Mechanical Actuation of steering system
Conventional bus equipped with mechanism
Rail Guidance Not Known Low Yes/Yes Mechanical or Hydraulic connection to guide rail
Low floors, Euro design, 3 articulated sections
Grid Guidance Vehicle cost not clear Medium Yes/Yes Electrically actuated steering,
Low floors, Euro design, 3 articulated sections
Vision Guidance (CIVIS)
Vehicle cost is ~$1M per vehicle, estimate 10% is technology cost
High Yes / Yes Electric actuation of steering
CIVIS – Low floors, Euro styling
PATH Magnets $5000-$10000 for sensors,
Medium Yes/Yes Electric actuation of steering, retrofit
Retrofit onto existing bus
3M Magnetic Tape
$5000-$10000 for sensors,
Medium Yes/Yes (modificationsneeded for low
speeds)
Electric Steering, retrofit
Retrofit onto existing bus
University of MinnesotaDGPS
$25,000 - $30000 for sensors (in volume)
Medium Yes/Yes Electric Steering, retrofit
Retrofit onto existing bus

50
Chapter 5: Lane Assist vs. Precision Docking
Lane assist and precision docking systems provide the same functionality. The purpose of both is to accurately position a vehicle at a desired lateral position in a particular lane. Lane assist systems attempt to position the center of the vehicle at approximately the center of the lane of travel; precision docking systems attempt to place the doors of the bus (which can be on either side) close to the curb or station where passengers enter and exit the bus. The goal is the same, only the point of reference changes.
Lane assist and precision docking system can easily be incorporated into the same system. An operating example of this dual functionality is exhibited by the CIVIS bus in Las Vegas. Picture 14 shows the CIVIS bus negotiating a corner using the standard center lane reference markers; Picture 15 shows the same system and references used for precision docking.
Picture 14. Las Vegas CIVIS bus negotiating a “hands-free” turn during system demonstration. Note the location of the painted guidance reference. Note “no
hands” status of the driver.

51
Picture 15. Photo of test docking station for Las Vegas CIVIS bus. Note lane reference markers used for docking are the same as those used for lane assistance.
The only difference between docking and lane assist is the reference used to position the bus. The deviation of the lane reference markers to the right of the picture
represents the change of reference from the center of the lane to the curb.
The main issue with lane assistance vs. precision docking is that of functionality, not of technology. A system capable of providing lane guidance of a wide bus in a narrow lane is intrinsically capable of providing the accuracy needed for precision docking.
What is at issue, however, are the conditions under which precision docking and lane assistance are executed. Clearly, the CIVIS bus above has demonstrated lane assist and precision docking with the same hardware and software in Las Vegas. However, this system is unlikely to provide lane assistance or precision docking capability in the winter in Minnesota because the reference lines will be covered with “dirty” ice and snow.
System functionality for lane assistance and precision docking is therefore much more of an operational and environmental issue then a capability issue. In the early design stage, transit agencies must develop a comprehensive functionality specification to assure that systems procured by that agency are capable of providing necessary features.

52
Chapter 6: Conclusions and Recommendations
This research program has provided significant insight into the issues associated with lane assist and precision docking systems, both from the technology point of view and the human interface point of view. The most significant finding is that the state of the art for any type of lane assist and precision docking system is immature. No systems have been deployed on what could be considered a “wide scale.” The only system in continuous reliable operation to date are curb guided systems, and these have been deployed on a very limited basis (just 3 systems, with routes only a few km long). The remaining lane assist and precision docking systems which have been described can only be considered experimental or prototype systems because of known problems and lack of operational experience and data.
The present state of the art for lane assist and precision docking stations is not at a level where systems, which meet US National requirements, can be deployed. This fundamental conclusion is supported by the following:
1. National operational and environmental requirements are so broad that a single technology or system available today is unable to meet a core set of national requirements.
2. Lane assist and precision docking systems are still in the early stages of system development. Insufficient operational experience disallows any statistically valid claim to system performance, system reliability, maintenance requirements, failure modes, etc. Too few of these systems have been deployed worldwide. Emerging technologies have suffered from a lack of development and testing. Deployment of an unproven system can lead to severe acceptance problems from both the traveling public and drivers of buses equipped with lane assist and precision docking technologies.
3. No single technology exists which will meet a reasonable subset of the requirements provided by US transit properties. If lane assist and precision docking systems are to be deployed in the US, these systems (in the near term) will require an integration of the emerging technologies discussed in Chapter 3.
4. In the near term, individual transit agency requirements will dictate which mix of technologies will be used for lane assist and precision docking systems. Each transit agency will be required to perform a benefit: cost analysis to determine both the technologies to be utilized and the role each will play. Factors affecting these decisions include, but are not limited to, length of route, projected ridership, docking station locations, lane width, available right-of-way, etc.
5. It is necessary for the safety of passengers, employees and the general public to complete a Hazards Analysis for Transit Projects and include Failure Modes and Effect Analysis (FMEA) report for critical items identified in order to ensure all parties involved are aware of the potential risks and liability.
6. In order for lane assist technology to be viable, a critical and necessary element of future development plans is a clear path to commercialization. For obvious safety considerations as well as bus system component compatibility requirements,

53
transit equipment manufacturer involvement is vital to the success and eventual implementation of lane assist technology.
Presented with the state of the art of lane assist and precision docking systems, and comparing these systems with the national requirements, it is clear that only a few transit agencies are able to support the deployment of lane assist. Moreover, these initial deployments will be on a very limited basis.
To make lane assist and precision docking systems deployable to transit agencies on a broad basis throughout the US, additional research and development is needed. The main focus of this work is two fold: the further development of enabling technologies, and the integration of these enabling technologies into a relatively “generic” system which will meet a high percentages of the system requirements put forth by US transit properties. A generic system will lead to higher production volumes, and therefore lower costs to transit agencies.
Putting the following recommendations into practice will lead to the development and eventual deployment of a generic lane assist and precision guidance system which will meet the requirements of US transit properties as provided in this study.
1. Core technologies require further research, development and testing in a limited operational context. Operational testing will provide data from which reliability, maintenance, cost, and performance measures and models can be constructed. Key issues include how narrow a lane can be used for busways, the tradeoff between vehicle speed and lane width, and the degree to which a driver is involved in typical operations and in emergency intervention11.
2. Clearly, no single technology or system can meet all requirements put forth by US Transit Agencies. An integration of technologies is needed to make lane assist systems viable in the US. Results of recommendation #1 should be used to determine which technologies, when integrated, best meet US requirements. Performance, reliability, cost, and maintenance schedules will all factor into this optimization. It is reasonable to assume that a number of integration schemes may produce systems capable of meeting US needs. These should all be explored.
3. Upon completion of the integration study, a number of integrated systems should be built, tested, and place into limited operational service at a variety of transit agencies throughout the US. Limited deployment on a national level will provide the data needed by transit agencies to determine the approach(es) most suited for their application.
4. Based on the outcome of recommendation #3, transit agencies contemplating lane assist / precision docking systems will have solid data on which BRT system decisions can be made. The desired outcome is that transit agencies will use the generic system described above as their baseline system, and that that system will only require simple modifications to meet specific requirements imposed by a specific BRT application.
11 Specific human factors issues are addressed in volume 2.

54
References
Dickmanns E. D., Christians T., “Relative 3D-State Estimation for Autonomous Visual Guidance of Road Vehicles,’ IAS 1989, pp. 683-693.
Dickmanns E.D., Thomanek F., “Autonomous Road Vehicle Guidance in Normal Traffic,” ACCV, 1995, pp. 499-507.
Gorjestani A., Alexander L., Cheng P., Newstrom B., Shankwitz C., Trach W., “Bus Rapid Transit Technologies: Assisting Drivers Operating Buses on Road Shoulders,” University of Minnesota Intelligent Vehicles Laboratory Final Report, in preparation, 2003.
Hardy, M., Stevens, W., & Roberts, Donald. (2001).”Bus Rapid Transit Vehicle Characteristics,” Washington DC: U.S. Department of Transportation, Federal Transit Administration Office of Research, Demonstration, and Innovation.
Lim H., Newstrom B., Shankwitz C. and Donath M. (2000). “A Conformal Augmented Heads Up Display for Driving under Low Visibility Conditions,” Proceedings of the 5th International Symposium on Advanced Vehicle Control, Ann Arbor, MI.
McCarthy, J.P., Davis, G.A., “A Method to Estimate the Safety of the Operation of Transit Buses on Freeway Shoulders,” 1996: paper 960736 presented at 75th Annual Transportation Research Board meeting, Washington, DC.
Pomerleau, D., “ALVINN: An Autonomous Land Vehicle in a Neural Network,” Neural Information Processing Systems (NIPS), 1988: pp. 305-313
Pomerleau, D., “Rapidly Adapting Artificial Neural Networks for Autonomous Navigation,” Neural Information Processing Systems (NIPS), 1990: 429-435.
Sergi, M., Shankwitz C., and Donath M., “LIDAR-based Vehicle Tracking for a Virtual Mirror” Proceedings of the IEEE Intelligent Vehicles 2003 (IV2003) Conference, Columbus, OH, 2003.
Tan, Han-Shue, Zbulgler, Benedicte, Zhang, Wei-Bin, “Automated Steering Based on Roadway Markers: From Highway Driving to Precision Docking,” Vehicle System Dynamics, vol. 37, no. 5, pp. 315 – 338, 2002.
“Study of Bus-Only Shoulders,” Mn/DOT Final Report 1998-06U, 1998.

A-1
Appendix A: Requirements Survey Raw Data
Demographic Information:
Professional Position of the Respondents:(N=21)
Types of Organizations Represented by Respondents:(N=21)
POSITION
executivemanagernot reported
Cou
nt
10
9
8
7
6
5
4
3
4
9
8
Organization Type
Transit AgencyDOTNot Reported
Cou
nt
16
14
12
10
8
6
4
2
0
14
3
4

A-2
Operations
1. Under what conditions might a lane assist system be required to operate? Mark all that apply:
1a. Shared and/or Semi-Dedicated Lanes
� Freeway traffic – free flowing � Freeway traffic – congested � Arterial street � HOV lane � Other shared/semi-dedicated lanes:
Describe:� Highway shoulder [Connecticut Transit, CT]
Other
HOVLane
Neighborhood Traffic
Congested Freeway
FreeFlowing
Sum
10
8
6
4
2
0 1
9
6
9
5
(N=21)

A-3
1b. Dedicated Bus Lanes� Roadway Shoulders � Other dedicated bus lanes: � Exclusive bus lanes and easements [LYNX, Florida] � Similar to Lane Transit District [California DOT, CA] � Separate bus-only guideway [Connecticut DOT, CT] � Approaching uptown station [Metro Transit, MN] � Exclusive bus lanes [California DOT, CA] � Narrow dedicated guideways [Washington DC] � Bus map [PENNDOT, Pittsburgh, PA] � Narrow dedicated lanes in street median [Orange County Transportation Authority, CA] & [VIA Metropolitan Transit, San Antonio, TX]
Other Bus LaneRoadway shoulders
Sum
16
15
14
13
12
11
10
9
89
15
(N=21)

A-4
1c.Roadway Features� Signalized intersection � Toll plaza � Locations with limited Right-of-Way
� Bridges � Tunnels� Other locations - limited ROW
� “Green” easements (blocks for tire track only) [LYNX, FL] � Station Areas [CT DOT, CT] � Downtown [CA DOT, CA]
� Other roadway features � Railroad crossings and bus terminal [LYNX, FL] � Construction Zones [Metro Transit, MN] � Precision docking at a bus station [CT Transit, CT] � Any Location with sub-standard width bus lane [Metro Transit Authority New
York City Transit, NY]
� Don’t Know
Other features
Other limited ROW
Tunnels
Bridges
Toll plaza
Intersection
Sum
11
10
9
8
7
6
5
4
3
4
5
7
10
7
10
(N=21)

A-5
2. In your region, is there a concern that motorists would violate bus-only narrow lanes? � Don’t Know � No� Yes.
2a. If yes, how would enforcement be conducted?� A violation fee would be assessed, similar to occupancy violations for HOV lane use.
[California DOT, CA] � Virtual barriers. Law enforcement/video enforcement? Similar to neo light camera
system [California DOT, CA] � Separation control, auto gate access. [Connecticut Transit, CT] � Highway patrol/ Transit Police [San Mateo County Transit District, CA] � Law enforcement with highway patrol [Charlotte Area Transit System, NC] � Law enforcement agency and lane separation [Anonymous] � Uncertain [Regional Transportation Commission of Southern Nevada, NV] � Unknown [Port Authority of Allegheny County, PA] � Physical barrier [Anonymous] � To be determined [Regional Transportation Authority, Chicago, IL] � Electronic camera enforcement [Penn DOT, Pittsburgh, PA] � Enforcement has been a difficult issue with existing, low tech bus lanes. It is not
certain how it would be conducted for narrow lanes. [MTA NYC Transit, NY] � Too early to respond [Orange County Transportation Authority, CA]
yesNoDon't know
Cou
nt
16
14
12
10
8
6
4
2
0
15
4
2
(N=21)

A-6
Would you require that the narrow lane be separated from other lanes? � Don’t Know � No� Yes. Why? � Orlando has a high level of transient drivers who are unaware of traffic flow. Added
restrictions become confusing. [LYNX, FL] � Safety would dictate if separator were needed. [CTDOT] � If possible, perception of safety [CT Transit] � Depends on R/W, land use, operating scenario safety needs. [CADOT] � To prevent motorists from violating bus-only lanes [Anonymous] � Delineation for both motorists and transit driver [Regional Transportation
Commission of Southern Nevada, NV] � Control is central to prediction of better rapid transit travel times. There are other
issues. [Anonymous] � To ensure some degree of predictability [PENNDOT, PA] � Safety [Orange county Transportation Authority, CA] � Enforcement, Travel time, Reliability [Metropolitan Transit, Houston, TX]
yesNoDon't know
Cou
nt
12
10
8
6
4
2
11
4
6
(N=21)

A-7
3a. If yes, what methods would you consider using to separate the lanes?
� Physical barrier such as a Jersey Barrier or guardrail
� Physical barrier such as a raised median or curb
� Paint/striping
� Grass, gravel, or other material
� Dedicated, separate roadway
� Rumble strips
� In-pavement lighting (similar to airport runway lights)
� Other
(N=15)
Other
In-pavement Lighting
Rumble Strips
Separate Roadway
Grass/Gravel
Paint/Striping
Barrier-Curb
Barrier-Guardrail
Sum
14
12
10
8
6
4
2
0
4
8
5
3
12
7
8

A-8
3. Which of the following situations might be possible for locations with narrow lanes? Mark all that apply.
� Drop off on one side of the lane
� Drop off on both sides of the lane
� Adjacent barrier, wall, or structure flush with curb face
� Adjacent barrier, wall, or structure behind the curb
� Adjacent barrier, wall, or structure on one side of the lane
For the situation marked above, how close to the lane might the barrier/wall/structure be located? Feet
� Adjacent barrier, wall, or structure on both sides of the lane
For the situation marked above, how close to the lane might the barrier/wall/structure be located? Feet
� None of the situations are possible
� Don’t Know
Don't Know
NoneBarrier-Both Side
Barrier-One Side
Barrier Behind Curb
Barrier with Curb
Drop off-both side
Dropoff-one side
Sum
16
14
12
10
8
6
4
2
0
45
7
11
10
6
15
(N=21)
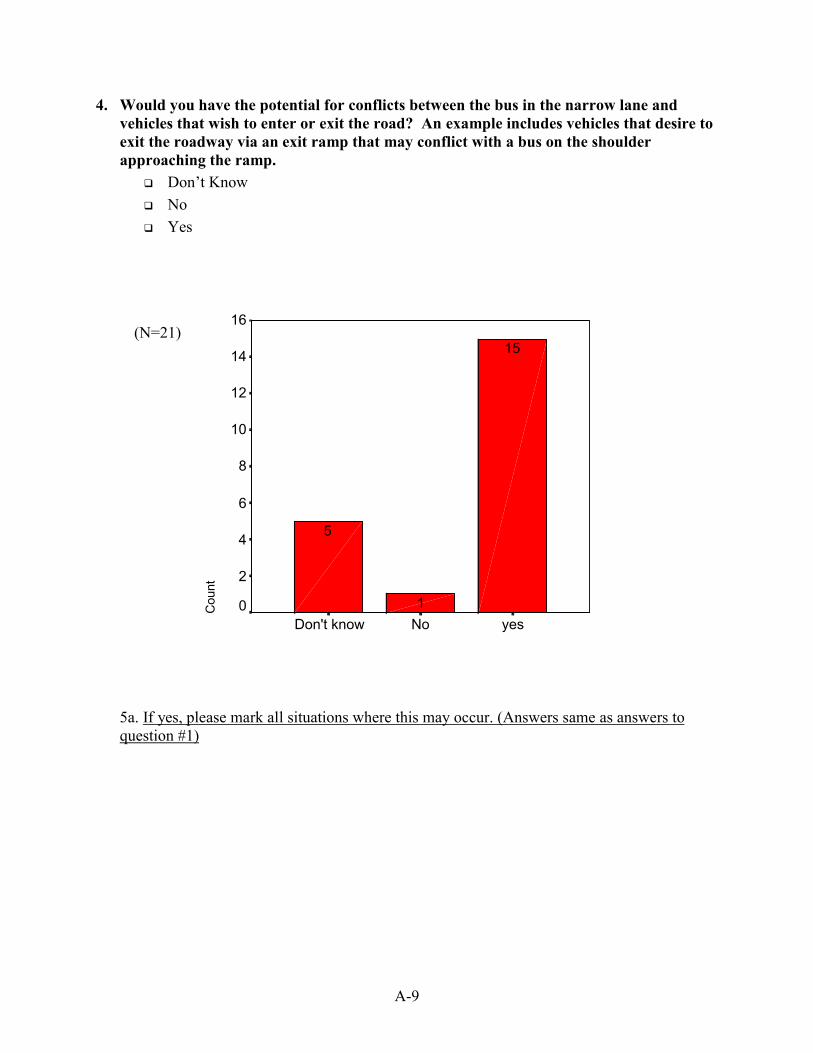
A-9
4. Would you have the potential for conflicts between the bus in the narrow lane and vehicles that wish to enter or exit the road? An example includes vehicles that desire to exit the roadway via an exit ramp that may conflict with a bus on the shoulder approaching the ramp.
� Don’t Know � No� Yes
5a. If yes, please mark all situations where this may occur. (Answers same as answers to question #1)
yesNoDon't know
Cou
nt
16
14
12
10
8
6
4
2
0
15
1
5
(N=21)

A-10
5. On what side of the road might narrow lanes be located? � Right only � Left only � Either right or left � Other� Center [CA DOT], [Regional Transportation Authority, Chicago, IL] � 2 way bus lane [Anonymous] � Median [Orange County Transportation Authority, CA]
� Don’t Know
Don't know
Other
Either right or left
Left only
Right only
Sum
12
10
8
6
4
2
01
4
9
1
10
(N=21)

A-11
6. Do anticipated routes for narrow lanes require tight turns or turns at intersections? � Yes� No� Don’t Know
yesNoDon't know
Cou
nt
11
10
9
8
7
6
5
4
6
5
10(N=21)

A-12
8. Please mark the types of physical obstacle that could conflict with the type of lane assist technologies you might employ:
� Ice and/or snow
� Gravel
� Debris
� Poles or signs that could strike bus mirror
� Other: Strong wind (Washington DC area)
� Deeply recessed catch basin or manhole
� Disabled vehicles
� Pedestrians (legal or not)
� Animals
� None
NoneOther
Animals
Pedestrians
Disabled vehicles
Catch Basin
Poles/Signs
Debris
Gravel
Ice/Snow
Sum
20
15
10
5
0
6
11
14
16
10
15
12
5
12
(N=20)

A-13
8a. For the obstacles mentioned above, what is the likelihood of the obstacle occurrence?
Ice and/or snow: � Rare � Occasional � Often
Gravel � Rare � Occasional � Often
Debris � Rare � Occasional � Often
Poles or signs � Rare � Occasional � Often
Catch basin or manhole
� Rare � Occasional � Often
Disabled vehicles � Rare � Occasional � Often
Pedestrians � Rare � Occasional � Often
Animals � Rare � Occasional � Often
Other (list below)
� Rare � Occasional � Often
� Rare � Occasional � Often
8b. The likelihood of the obstacle occurrence (N =20)1-rare, 2-occasional, 3-often
Animals
Pedestrians
Disabled Vehicles
Catch Basin
Poles/Signs
Debris
Gravel
Ice/Snow
Mea
n
2.4
2.2
2.0
1.8
1.6
1.4
1.2
1.0
.8
1.2
1.8
2.3
1.3
1.7
1.5
1.1
1.4

A-14
Ice or Snow
OftenOccasionalRareNo
Sum
12
10
8
6
4
2
0
11
5
3
Gravel
OftenOccasionalRareNo
Sum
9
8
7
6
5
4
3
2
12
5
4
8(N=19)
(N=19)

A-15
Poles/Signs
OftenOccasionalRareNo
Sum
9
8
7
6
5
4
3
2
1
5
8
2
4
Catch Basin
OftenOccasionalRareNo
Sum
10
8
6
4
2
0
5
4
1
9
(N=19)
(N=19)

A-16
Debris
OftenOccasionalRareNo
Sum
14
12
10
8
6
4
2
0 1
13
1
4
Disabled Vehicles
OftenOccasionalRareNo
Sum
10
8
6
4
2
0
8
9
11
(N=19)
(N=19)

A-17
9. For situations with a speed differential between the bus in one lane (e.g. HOV, bus-only shoulder, dedicated bus lane) and the traffic in an adjacent lane:
Pedestrians (legal or not)
OftenOccasionalRareNo
Sum
12
10
8
6
4
2
0
4
10
2
3
Animals
OftenOccasionalRareNo
Sum
8
7
6
5
4
3
2
1
2
6
4
7
(N=19)
(N=19)

A-18
9a. What is the typical speed difference observed: __________mph
Mph
60-6930-3920-2910-190-9Not Reported
Cou
nt
10
8
6
4
2
01
33
1
4
9
Mph
50-5940-4910-190-9Not Reported
Cou
nt
14
12
10
8
6
4
2
0
22
3
2
12
(N=21)
(N = 21)

A-19
9b. What is the maximum speed differential permitted: __________mph
Mph
50-5940-4910-190-9Not Reported
Cou
nt
14
12
10
8
6
4
2
0
22
3
2
12
10. If you were to use lane assist technology, what maximum speed differential would you allow? ________ mph
Mph
50-5940-4920-2910-190-9Not Reported
Cou
nt
10
8
6
4
2
011
3
4
3
9
(N=21)
(N=21)

A-20
11. Under what weather conditions will a lane assist system be required to operate? Mark all that apply:
� Sunny/clear
� Rain
� Snow/Ice
� Fog
� High humidity
� Other
12. Besides buses, what other vehicles will be allowed to use the narrow lanes? Mark all that apply.
� Shuttle � Van� Automobile
� Truck� Motorcycle � Bicycle
� Don’t Know
� Other � Emergency vehicles [LYNX, FL],[Washington DC Area] & [VIA
Metropolitan Transit, San Antonio, TX] � Police and emergency vehicles [Anonymous] � Service trucks and police [Anonymous]
OtherFogRainHumiditySnow/IceSunny
Sum
25
20
15
10
5
0
19
21
17
13
20
(N=21)
� Strong wind
[Wash DC Area]

A-21
Others
Don't know
Bicycle
Motorcycle
Truck
Automobile
Van
Shuttle
Sum
8
7
6
5
4
3
2
1
0
7
5
22
1
2
44
(N=21)

A-22
13. If technology could provide reliable autonomous control of vehicles, would you consider using unmanned vehicles, or would a driver still be required?
� Unmanned
� Driver required at all times
� Driver required for certain instances, such as:___________________________________
� Don’t Know
14. Responses of Different Types of Organizations:
Don't know
Certain instances
Driver required
Unmanned
Cou
nt
16
14
12
10
8
6
4
2
0
Organization
Transit Agency
DOT
Not Reported
21
10
11
2
3
1
(N=21)
Don't know
Certain instances
Driver required
Unmanned
Co
un
t
16
14
12
10
8
6
4
2
0
22
15
2
(N=21)

A-23
15. Platooning is the technique of electronically coupling vehicles together in small groups that follow a lead vehicle. It generally refers to high-speed, high-density travel on limited access highways under small headway. Do you currently platoon buses?
� Don’t Know
� Yes
� No
16. Do you see the need for bus platoons in the future? � Don’t Know
� Yes
� No
yesNo
Cou
nt
20
15
10
5
02
19
yesNoDon't know
Cou
nt
14
12
10
8
6
4
2
12
5
4
(N=21)
(N=21)

A-24
Would you accept a driver in the first lead bus and no drivers in the follower buses? � Don’t Know � Yes� No
yesNoDon't know
Cou
nt
10.0
9.0
8.0
7.0
6.0
5.0
4.0
3.0
2.0
1.0
0.0
6.0
8.0
7.0
(N=21)

A-25
17. Precision docking uses an electronic guidance system to “dock” the bus with a platform at exact locations. Under what situations might you use precision docking?
� Don’t Know
� Bus stops
� Maintenance stations, describe examples:
� Maintenance bays, fueling, parking (general lot), bus wash (fixed structure) [LYNX, FL]
� Automated refueling, washing, and parking. [CA DOT, CA]
� Automated fueling, automated bus wash and etc. [PA]
� Automated refueling station [VIA Metropolitan Transit, San Antonio, TX]
Maintenance stations
Bus Stops
Don't know
Sum
16
14
12
10
8
6
4
6
14
7
(N=21)

A-26
18. What are your peak morning and afternoon hours?
19a. Morning peak hours
19b. Afternoon peak hours
10AM
930AM
9AM
830AM
8AM
730AM
7AM
630AM
6AM
530AM
5AM
430AM
4AM
Sum
20
15
10
5
0
45
12
15
171717
14
10
111
730pm7PM630PM6PM530PM5PM430PM4PM330PM3PM
Sum
20
15
10
5
0
4
11
1717
181818
9
6
(N=18)
(N=18)

A-27
19. What is your peak and off-service frequency?
• Only 5 out of 21 answered this question.
Agency and State PEAK OFF PEAK CT DOT, CT Up to 30 buses per hour 12-20 buses per hour Charlotte Area Transit System, NC 6 minutes 20 – 30 minutes Anonymous 6 – 15 minutes NA MTA Houston, TX 3 minutes headways Regional Transportation Authority, IL 5-7 minutes headways MTA New York City Transit, NY 2 – 30 minutes Up to 60 minutes

A-28
Performance and Reliability
15. What types of vehicles would require lane assist technology? � “Standard” bus (non-articulated) � Articulated bus � Shuttle vehicle � Van� Paratransit
� School bus � Automobile � O
ther � Don’t Know
Don't know
Other
Automobile
School bus
Paratransit
VanShuttle vehicle
Articulatedbus
"Standard" bus
Sum
25
20
15
10
5
03
7
23
17
21
(N=21)

A-29
16. What is the acceptable frequency for bus/technology maintenance or repair? � Daily � Weekly � Monthly
� Quarterly � Annually � Don’t Know
(N=21)
Other
Don't know
Annually
Quarterly
Monthly
Weekly
Not reported
Cou
nt
12
10
8
6
4
2
01
10
1
3
4
11
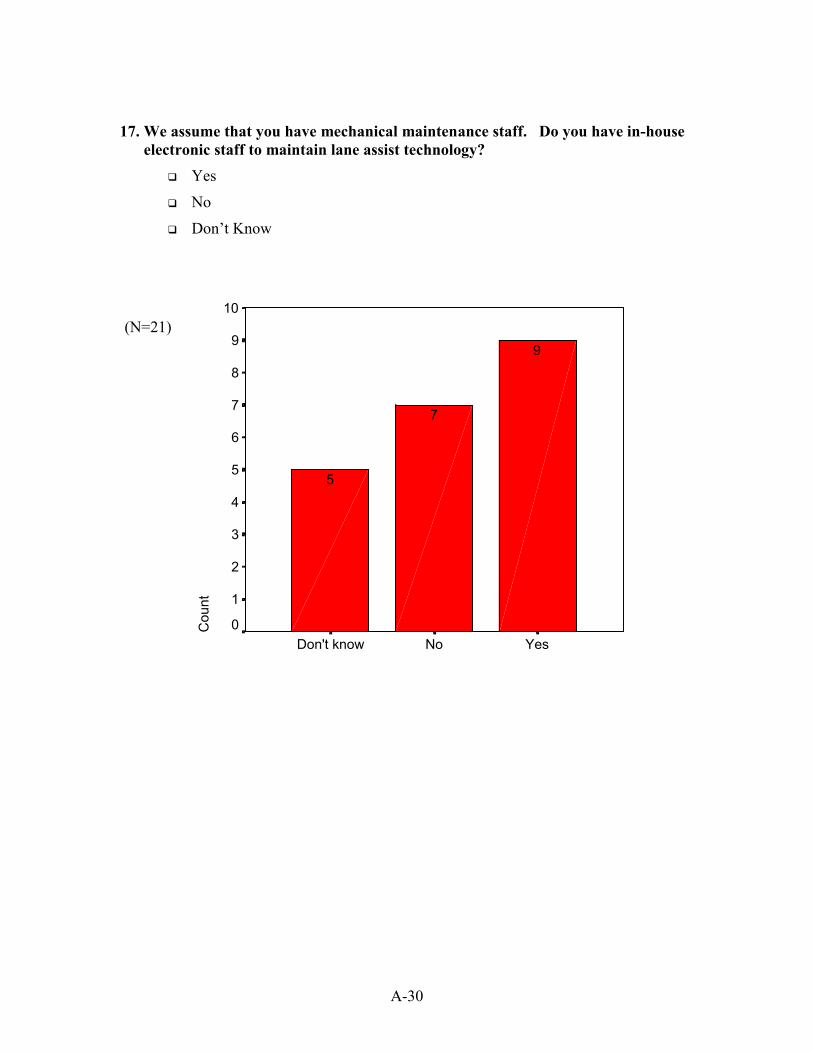
A-30
17. We assume that you have mechanical maintenance staff. Do you have in-house electronic staff to maintain lane assist technology?
� Yes
� No
� Don’t Know
(N=21)
YesNoDon't know
Cou
nt
10
9
8
7
6
5
4
3
2
1
0
9
7
5

A-31
18. For technical maintenance, would you contract or hire in-house expertise?
� Contract
� In-house
� Don’t Know
� Other� Contract out and hire in-house expertise, combined [CA Dot] [Regional
Transportation Authority, Chicago, IL] [CT transit] � Initially contract, long term hire in-house staff [PENNDOT, Pittsburgh, PA]
(N=21)
Other
Don't know
In-house
Contract
Not Reported
Cou
nt
8
7
6
5
4
3
2
1
0
4
7
4
5
1

A-32
19. What experience do you currently have with technology? Mark all that apply: � Smartcard � Automated passenger counter � Automated fare collector � Fare kiosk � Automatic Vehicle Locator � Security camera � Mobile Data Terminal � Don’t Know � Other� Collision warning systems
[CADOT] � Card swipe [OH] � Automated vehicle monitor
[PENNDOT, Pittsburgh, PA
Don't know
Other
DataTerm
inal
Security Camera
Vehicle Locator
Farekiosk
Fare Collector
Automated Counter
Smartcard
Sum
20
15
10
5
0
6
11
16
14
7
9
11
4
(N=18)

A-33
20. Do you currently have some of your fleet operating in narrow lanes?
� No
� Yes
� Don’t Know
21a. If yes, in comparison to standard lane route, have any of your drivers indicated concerns about operating in narrow lanes in terms of:
� Effort to keep bus in lane [2]
� Stress from driving at free-flow speed in dedicated lane next to stationary traffic [2]
� Risk of conflict with other traffic cutting into lane [2]
� Anxiety of passengers [0]
� Lack of courtesy from other traffic [1]
� Danger of collision with roadside infrastructure [3]
Not ReportedYesNoDon't know
Cou
nt
16
14
12
10
8
6
4
2
0
2
3
15
1
(N=21)

A-34
Cost
21. If a roadway/tunnel/bridge could be modified to incorporate an extra narrow lane for buses, would you pursue funding for lane assist technology?
� Yes
� No
� Depends on the cost. My cost threshold would be:
$ /mile roadway
$ /vehicle
Among all the ones who chose “depends on the cost”, only 2 had indicated the amount:
� $1,000,000/mile roadway, $50,000/vehicle [LYNX, FL]
� $ 5,000/vehicle [Anonymous]
Depends on the cost
No
Yes
Not reported
Cou
nt
12
10
8
6
4
2
0
10
1
7
3
(N=21)

A-35
22. Do you have a sufficient number of opportunities to use narrow lanes for BRT that you would be willing to invest in lane assist technology?
(N=21)
Yes
No
Don't know
Not Reported
Cou
nt
10
8
6
4
2
0
Organization
Transit Agency
DOT
Missing
6
1
6
1 111
1111Unidentified or

A-36
23. Do you have the authority to modify the infrastructure?
(N=21)
N/AYesNoDon't know
Cou
nt
10
8
6
4
2
0
Organization
Transit Agency
DOT
Not reported
6
5
3
1
1
1 1
3
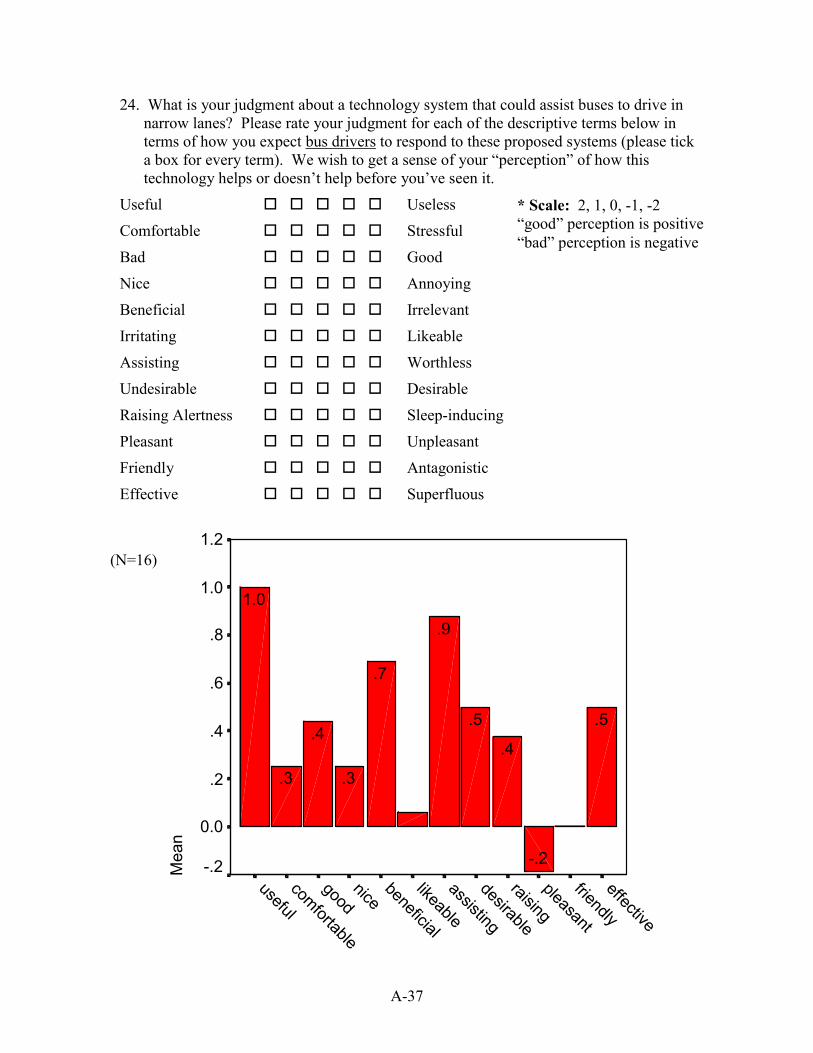
A-37
24. What is your judgment about a technology system that could assist buses to drive in narrow lanes? Please rate your judgment for each of the descriptive terms below in terms of how you expect bus drivers to respond to these proposed systems (please tick a box for every term). We wish to get a sense of your “perception” of how this technology helps or doesn’t help before you’ve seen it.
Useful � � � � � Useless
Comfortable � � � � � Stressful
Bad � � � � � Good
Nice � � � � � Annoying
Beneficial � � � � � Irrelevant
Irritating � � � � � Likeable
Assisting � � � � � Worthless
Undesirable � � � � � Desirable
Raising Alertness � � � � � Sleep-inducing
Pleasant � � � � � Unpleasant
Friendly � � � � � Antagonistic
Effective � � � � � Superfluous
effective
friendly
pleasant
raising
desirable
assisting
likeable
beneficial
nicegood
comfortable
useful
Mea
n
1.2
1.0
.8
.6
.4
.2
0.0
-.2
.5
-.2
.4
.5
.9
.7
.3
.4
.3
1.0
(N=16)
* Scale: 2, 1, 0, -1, -2 “good” perception is positive “bad” perception is negative

A-38
useful-useless
210-1
Cou
nt
8
7
6
5
4
3
2
1
0
5
7
3
1
comfortable-stressful
210-1
Cou
nt
7
6
5
4
3
2
1
2
4
6
4
Useless � Useful
Stressful� Comfortable
(N=16)
(N=16)

A-39
good-bad
210-1-2
Cou
nt
7
6
5
4
3
2
1
0
2
66
11
nice-annoying
210-1-2
Cou
nt
8
7
6
5
4
3
2
1
0
2
4
7
2
1
Bad � Good
Annoying � Nice
(N=16)
(N=16)

A-40
beneficial-irrelevant
210-1
Cou
nt
8
7
6
5
4
3
2
1
3
7
4
2
likeable-irritating
10-1-2
Cou
nt
7
6
5
4
3
2
1
0
66
3
1
Irrelevant � Beneficial
Irritating � Likable
(N=16)
(N=16)
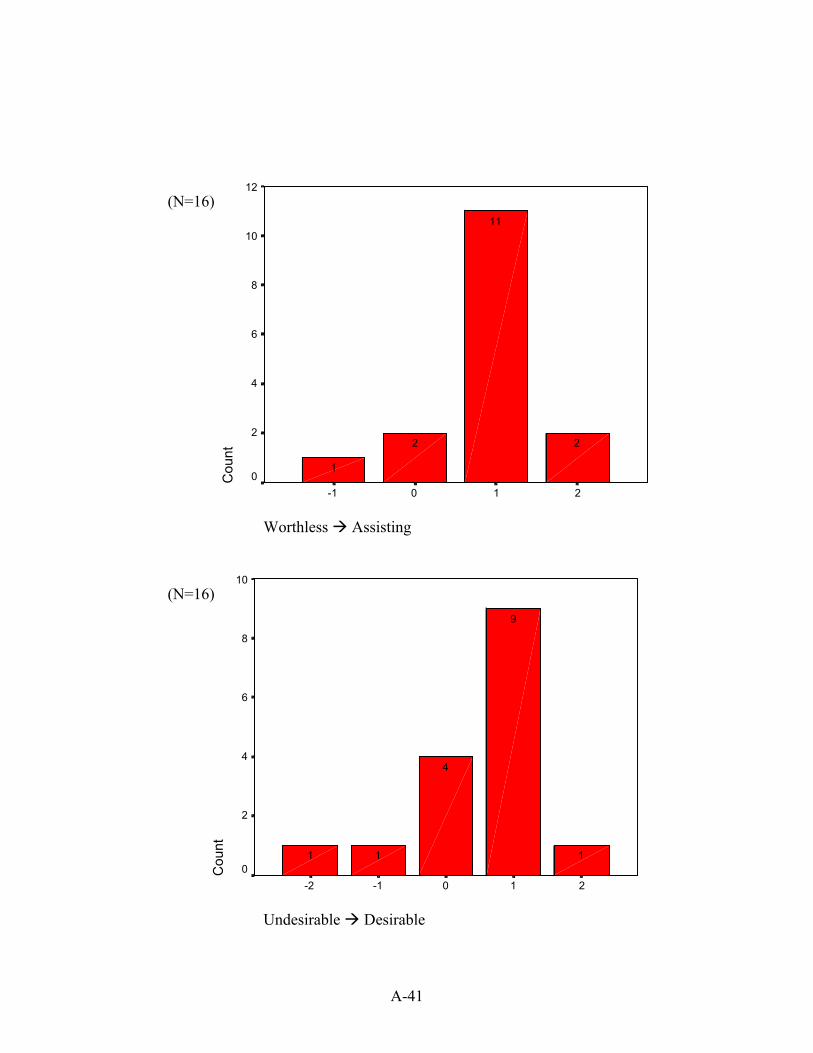
A-41
assisting-worthless
210-1
Cou
nt
12
10
8
6
4
2
0
2
11
2
1
desirable-undesirable
210-1-2
Cou
nt
10
8
6
4
2
01
9
4
11
Worthless � Assisting
Undesirable� Desirable
(N=16)
(N=16)

A-42
raising alertmess-sleep inducing
210-1
Cou
nt
8
7
6
5
4
3
2
1
0
1
6
7
2
pleasant-unpleasant
10-1-2
Cou
nt
14
12
10
8
6
4
2
0 1
12
2
1
Sleep Inducing � Raising Alertness
Unpleasant � Pleasant
(N=16)
(N=16)

A-43
friendly-antagonistic
210-1-2
Cou
nt
10
8
6
4
2
01
3
9
1
2
effective-superfluous
210-1
Cou
nt
10
8
6
4
2
01
9
33
Antagonistic � Friendly
Superfluous� Effective
(N=16)
(N=16)

B-1
Appendix B: Analysis of Usability Scales from Appendix A
In the survey, sixteen respondents (N = 16) answered the following question:
What is your judgment about a technology system that could assist buses to drive in narrow lanes? Please rate your judgment for each of the descriptive terms below in terms of how you expect bus drivers to respond to these proposed systems (please tick a box for every term). We wish to get a sense of your “perception” of how this technology helps or doesn’t help before you’ve seen it.
Useful � � � � � Useless Good � � � � � Bad Effective � � � � � Superfluous Assisting � � � � � Worthless Raising Alertness � � � � � Sleep-inducing
Pleasant � � � � � Unpleasant Nice � � � � � Annoying Desirable � � � � � Undesirable Likeable � � � � � Irritating
Comfortable � � � � � Stressful Beneficial � � � � � Irrelevant Friendly � � � � � Antagonistic
This question is based on a usability measure developed by the Traffic Research Centre at the University of Groningen in the Netherlands.12 This measure is an attempt to derive a standard questionnaire that is simple to implement in assessing operator acceptance of telematic devices.13
The original items were derived from surveys made of several telematic devices including violation warning systems (Tutor), intelligent speed adaptation (ISA), collision avoidance systems (CAS), and adaptive cruise control (ACC). These devices represent a range of autonomous control over the driving task and methods of interfacing with the driver (e.g., auditory, visual, haptic). The items in this question are conceived from two dimensions of usability; namely, perceived “usefulness” in terms of the apparent utility of the system functions, and how “satisfying” the system is to use in terms of enjoyment. These scales are scored such that larger numbers mean greater perceived usefulness and satisfaction.
12 Van der Laan, J.D., Heino, A., & de Waard, D. (1997). A simple procedure for the assessment of acceptance of advanced transportation telematics. Transportation Research C, 5(1), 1 – 10. 13 A number of items were added to this measure (italics) in an attempt to extend its application for the US market. These will not be analyzed in this dataset.
Usefulness
Satisfying
B-2
Figure 9 shows a plot of usability ratings based on the original questionnaire applied to a number of studies (the Van der Laan paper) that evaluated a range of telematic devices. It is apparent that these devices cluster in different regions of the usability space defined by the “usefulness” and “satisfying” scales.
It is tentative to conclude that the degree of control over the driving task determines the perceived usefulness of the device. Notably, devices that have autonomous control over driving functions such as speed or braking are perceived as less useful (CAS, ACC) than those only providing information to the driver (Tutor). This may indicate that usability is related to the drivers’ perception of their own capacity (skill) and authority to control the vehicle. Perhaps the format of feedback used in the device interface is related to satisfaction with the system. Notably, it is suggestive in Figure 9 that haptic feedback may not be liked as much as other interface channels. Thus, the acceptance of a system may depend on both factors. Whereas what a system is perceived to do may be related to judgments of usefulness, how satisfying the system may be could depend on the method by which this use is communicated to the driver.
Analysis
For the present study, averaging the first set of 5 question items created the Usefulness Scale. This yielded a mean usefulness value of 0.64 (with an acceptable scale reliability of 0.87). Averaging the second set of 4 question items created the Satisfying Scale. This yielded a mean satisfaction value of 0.16 (with an acceptable scale reliability of 0.90). These data suggest that respondents believed that system to be significantly more useful than satisfying [t(15) = 4.26, p < .001].
Figure 9 includes the acceptability ratings of the lane assist concept plotted (diamond symbol) with respect to published data for other telematic devices (circle). It is apparent that the lane assist concept for BRT is perceived to be comparably useful in relation to other telematic devices such as CAS and ISA. Lane assist is also seen as more satisfying than CAS and ACC. Indeed, it is interesting to note the more positive satisfaction with this system in spite of its use of haptic feedback.
Conclusion
The analysis is based upon the expected perception by drivers to a system that currently doesn’t exist. The lane assist system was rated favorably in comparison to other telematic devices, although it is perceived as more useful than enjoyable to operate. Of course, there are limitations to the generalization of these comparisons given that the benchmark data in Figure 9 were obtained in Europe rather than the USA where attitudes about telematic systems may be different.

B-3
System Acceptance
Figure 9. Plot of usefulness and satisfaction for a range of telematic devices including new lane assist concept (based on Figure 2 from van der Laan, Heino, & de Waard, 1997). Lane assist
device coordinate is denoted with the diamond. Please note that the abscissa is scaled from –2 to +2, whereas the ordinate is scaled from 0 to 2.

C-1
Appendix C: Minneapolis Lane Assist Technology Workshop
Issues And Challenges: Round Robin Discussion
Participants were asked to identify challenges that their agencies face, or that transit faces in general that could be addressed by lane-assist technologies. Some highlights from the discussion include:
• Many areas of the country have a limited amount of right-of-way (ROW) to work with along their local roads and highways. Normally bus-only lanes are not feasible if the lane is taken away from the general driving public.
• The use of lane-assist technologies would enable transit providers to operate in narrow lanes or on shoulders along the existing roads and highways in their system, potentially without the need for new ROW.
• Benefits of lane-assist technologies are reduced driver stress, increased on-time performance, increased ridership, and decreased vehicle dwell time.
• Studies show that commuters that choose to utilize transit instead of their automobile do so because they see the system as safe, fast, attractive, clean, and on-time. Lane-assist technologies will enhance the system in many of these areas.
Major themes that emerged from this discussion are shown below, in addition to the bulleted comments from participants.
Limited Right Of Way / Land Use Impacts • Limited ROW is a challenge that limits expansion options • 3-lane streets that can’t be widened due to limited ROW could take one of the lanes
and turn it into a bus only lane • Lane-assist technology could help buses drive on strips of pavement into greenways
which allow for a shared-use of the space and a pedestrian friendly environment with no curbs
• Emergency vehicles currently use shoulders so there is a potential conflict with buses in the shoulders
• Should not convert bus lanes to HOV lanes • These technologies may enable systems to serve more outlying areas which may lead
to a need for more park and ride lots
Public And Rider Perception • Lane-assist technologies can provide rail-like feel to the system which would attract
more riders • Smarter looking buses are key when selling to the public

C-2
• Precision docking from passenger point of view is key (technology could improve safety & on-time performance)
• May help with the NIMBY (not in my back yard) issues • Lane-assist technologies may affect passenger perceptions in a positive way
by reducing the dwell times that passengers now experience in mixed flow traffic conditions
• Helps fight traffic congestion by feeding into current system and gaining ridership
• Speed differential is currently 56 km/h (35 mph). Lane assist technology might help increase the speed differential and improve schedule performance during congestion, which will lead to increased ridership
Driver Issues • Concern with driver overload and that adding more technologies might add to
the problem • Driver assist technology that takes steering away from the driver could allow
the use of even narrower lanes • Need control in the bus by allowing the drivers to adjust the speed of the
buses• Tight turn movements are hard for drivers especially in construction zones in
which bus lanes are narrowed on a temporary basis
Other• Precision docking needed • Infrastructure cost of LRT vs. BRT vs. other modes is key • Need to ensure and increase safety in the center city and work zone areas,
where driving is often more difficult in confined spaces
Design and Implementation Requirements: Round Robin Discussion
Participants were asked to identify the general requirements needed to design and implement lane-assist technologies into a transit system. They were also asked to categorize their comments by safety, reliability, performance, costs, and other. The basic requirements included:
• The system must be safe and provide for manual operation in the event of a technology failure.
• The vehicle needs to be able to maneuver around road debris. • The technologies must be simple and inexpensive to install, operate and
maintain. • The technologies must be adaptable to all types of vehicles and easily
transferable from vehicle-to-vehicle and road-to-road. • The technology and infrastructure needs to be operational in all types of road
and weather conditions. • The system must be simple for the drivers to use. • A strong marketing campaign will be required on many different levels.

C-3
The input offered from the group is shown below by the designated categorizes. If a similar answer was given, the number of responses is shown in parentheses.
Safety • The system must be fail safe (against tampering & interference) and have low critical
failure rates • Manual operation must be possible in the event of a guidance system failure • Cannot decrease the existing level of safety for the transit or highway system • Need standard safety verification methods • Safety perception by general public is key • Need to enhance driver’s abilities rather than eliminate need for driver • Speed differential between buses and cars is a key safety issue • Where can breakdown vehicles go if shoulders are off limits?• Need to make sure that there is not a conflict with the radar that the buses use and
those that police cars use to monitor speed• If failure occurs then need a backup and the driver needs to be ready to take over.
Onboard diagnostic testing may be needed. The driver needs to be engaged in the driving and ready to react
• How is one product safer than the other?
Reliability • Need to compensate for and anticipate, road debris in the lane • Needs to be reliable from maintenance and operations perspective • System must be able to withstand dust, sand, and water damage to the external
hardware • Need to ensure that the GPS does not degrade in rain or snow • System redundancy and fault diagnostics due to limited human recovery time if
system fails • Reliability standards for precision docking to reduce dwell time & facilitate
wheelchair access. Big ADA concern if using technology to minimize lift deployment.
Performance• Technology and infrastructure needs to be operational in all types of weather and road
conditions such as snow, ice, heavy rainfall, high humidity, hot, cold, day, night, sand & salt on road
• Technology needs to be generic, fit into different systems and different buses, readily available, and fit any vendor’s bus. Should be able to change the route and the technology should be able to go with that bus
• Technology needs to be applicable and flexible for different environments such as urban, rural, and suburban
• System must be user-friendly and fully integrated into the current systems

C-4
• Flexibility of technology for regional applications (e.g. vehicle size, neighborhoods, turning movements, transfer centers)
• System needs to have the ability to interact with other ITS technologies • Bus power consumption is limited due to limited bus electrical power so there is a
need to consider this when adding more technology • How do you detect side mirrors of other vehicles? Could bus side mirrors be folded in
to limit incidents • When shouldn’t the system operate? Need guidelines and need to know the limits of
the technology • Need to define if system is for guidance or driver assistance, as there will be different
requirements for each option • Physically separated right-of-way may be needed in some areas • Signal priority at at-grade intersections with public highways needed • Need a driver interface that will be accepted by drivers and passengers
Costs• Relatively low cost for design, installation, operation and infrastructure is needed • What are the liability issues if an accident occurs? • Insurance issues & coverage due to high speeds may be an issue • Technology can’t cost more than the bus • Need to consider the life cycle costs of equipment • The technology should be integrated with the electronically controlled braking system
(ECBs) and transmission retarders, etc… to control the overall system costs • New technologies in large fleet could lead to maintenance and installation issues like
high costs, retrofitting buses, maintenance of software costs & updates, and need to keep software current
• Must be able to defend benefits to management • Would have impact on the infrastructure – road would need to be reinforced as
vehicle is on same “spot” over and over • Cost could make BRT the winner over rail
Other• Concern with driver overload, stress and fatigue so a positive driver interface is
needed• Institutional, public, political, passenger and driving motorist acceptance of the
technologies • Public involvement, marketing, and education of the new technologies are critical to
success• Need to teach people like emergency vehicle operators and the general driving public
about the new technology • Need to involve the drivers early in the planning process to determine if they will use
the system and where is it most appropriate to use it • Need traffic engineers buy into transit signal preemption technology • Who will train the drivers? • Who will train the maintenance personnel or who will perform the maintenance? • Some transit agencies have driver unions that limit what drivers can do and might ask
for a pay increase due to the increased work.

C-5
• Internal marketing campaign for the operator is needed • Highway design acceptance is needed • Location of the lanes combined with land-use concerns could be a public issue • Address economic impact along the corridor
Evaluation: Round Robin Discussion
Participants were asked to comment on how the lane-assist technologies should be and will be evaluated. One participant commented that there are multiple ways to evaluate the technologies and multiple factors that should be considered. Some participants suggested the following questions be answered as a means of evaluation:
• Do the technologies maintain or improve on-time performance? • Is the system acceptable by drivers and passengers? • Is there a reduction of preventable accidents? • What is the failure rate of the technologies compared to the failure rate of
other technologies on the bus? • Does ridership increase as a result of the technology?
Major themes that emerged from this discussion are shown below, in addition to the bulleted comments from participants. If a similar answer was given, the number of responses is shown in parentheses.
Rider And Driver Perception • On-time performance • Acceptance by customers; do they feel they are getting better service and a time
savings • Acceptance by drivers; will they use it • Increased ridership • Technology is located in the right place; will there be enough riders in low density
areas
Safety / Failure Rate • Reduction of preventable/changeable accidents • Measure technology failure rate compared to other technologies on the bus • Operating in a means you wouldn’t normally operate • Verifiable safety under all condition failures • Breakdown failure vs. degradation vs. calibration
Service Performance • How much does it cost in relationship to service improvements (travel time savings
for customer) expressed as a cost benefit • Performance needs to be defined before evaluation occurs • Don’t want the bus out of service at any time

C-6
• Operations needs to get out of crisis mode at peak times and offer service that is reliable so customers will use it
• Provide level of performance within acceptable spare ratio • Success is a service not a technology; technology can only be a success if it is
incorporated into the service • Smooth implementation • Relative increase in service performance when compared with a purely manual
system • Will the additional rider increment make this technology beneficial?
Other• Do before and after analysis • Establish minimum criteria to have a system qualified as “lane assist” (e.g. minimum
distance to side objects, minimum width of lane required, operator information and feedback)
• After market analysis of implementation on a vehicle

D-1
Appendix D: Technology Questionnaire
1. Please provide a general description of the technology and its intended application. Please include how this technology is used to perform the following operations:
a. Lateral guidance b. Precision docking c. Collision avoidance (related to unexpected obstacles in operating lane)
2. Please provide an overview of the driver interfaces and how they are intended to be used. (More specific questions regarding the user interface are asked below).
3. Please provide an overview of the infrastructure needed to support your technology. (More specific questions regarding the necessary infrastructure are asked below).
4. Vehicle based elements of the systema. Please list and describe the components for your technology, including
i. sensors ii. processing hardware
iii. communication protocols and interfaces iv. actuators v. power sources
b. Please provide a block diagram and data flow diagram of the technology / system
c. Please describe the driver interface, including i. how is information conveyed to the driver about
1. lane position, 2. collision avoidance, and 3. the status of the system itself
ii. Please describe the transition between lane assist system on and lane assist system off, and vice versa. Please describe the typical reaction of the driver to the transition
iii. Please describe the interface modalities, including visual, audible, haptic, tactile
iv. For each of the driver interface modalities, please provide characteristics, including
a. brightness, b. loudness, c. vibration frequency, d. amplitude, etc.
v. Please provide a description of the content of the information conveyed to the driver

D-2
vi. Please provide the method used to determine the criticality of the information (for example, what algorithm and criteria is used to determine when a lane boundary crossing is likely or when a car ahead in the lane is a potential hazard?)
vii. Please provide the following additional information about the system itself:
1. how many modes of operation the system has (on, off, standby, lane boundary detection, forward hazard detection, etc…)
2. how the active mode is communicated to the driver 3. describe the user selected choices the driver has 4. describe how much control does the driver retain 5. describe how the system is over-ridden by the driver 6. describe the internal checks the system makes to evaluate
its own status and reliability viii. If possible, please provide pictures or videos of the driver interface
in action. d. Please describe the physical attributes of the system, including
i. power draw, ii. size,
iii. weight, iv. temperature and other environmental limitations v. mounting limitations
e. Please quantify lane assist system performance, including i. rates,
ii. limits, iii. mean errors (lateral and longitudinal), iv. variance, v. absolute errors (lateral and longitudinal),
vi. minimum lane width, vii. lane width as a function of vehicle speed (i.e., lanes likely need to
be wider for higher speed operation) viii. repeatability
ix. other constraining limitations f. Please quantify precision docking performance, including
i. accuracy (lateral and longitudinal) ii. minimum stopping distance needed to meet accuracy specifications
at maximum operating speed iii. acceleration or deceleration requirements for precision docking iv. additional precision docking issues
1. can precision docking bus stops be either in lane or off to the side?
2. is special handling required for stopping at bus stops? 3. are there any other docking issues as a result of technology
or imposed based on customer needs? g. Please describe system performance limitations, including

D-3
i. won’t work at night, ii. won’t work under a metal roof or in a tunnel,
iii. won’t operate under what humidity or temperature conditions, iv. won’t operate in snowy conditions, v. streets must be clean,
vi. paint stripes needed on roadway, vii. etc.
h. Please describe other operational, environmental, and topological limitations, including
i. speed limitations (maximum and minimum) ii. radius of curvature
iii. weather or road surface (icy or snow-covered) i. Does the technology limit the passenger carrying capacity of standard
buses (i.e. does the technology require space normally used for carrying passengers)?
j. Please describe the modifications which need to be made to the vehicle if a retro-fit of existing buses is required.
k. Please list special requirements required for the buses to transition from BRT lanes to regular streets, or vice versa? (Consider the Nancy, France, Bombardier system as an example.)
l. Aftermarket/retrofit systems i. If a retro-fit system, please list the skills needed by installer (does
the bus need to be sent out, or are bus maintenance personnel capable of installing technology?).
ii. Is your technology after-market or OEM only? If it is after-market only, please indicate limitations.
iii. Please provide the time to install, if after-market m. Please describe system failure modes and detection methods (describe
what happens if any failure is detected) n. Please indicate system failure rates o. Please estimate system maintenance requirements/needs and spare parts
availability p. Please estimate annual maintenance costs q. Please provide capital costs per vehicle. Do discounts for high volume
applications exist? Please provide the pricing structure. r. Please provide an estimate of the annual software upgrade costs s. Please describe the age/maturity of technology. Please list future
enhancements. Please list the timeframes for enhancements. Please estimate the cost of upgrades.
t. Please provide the number of systems that have been deployed and how long they have been in operation.
u. Please provide examples and/or names of users, including contact names, addresses, phone numbers and email addresses.
v. Please describe your standard warranty, and the cost of additional warranty.

D-4
w. Please provide a company history, the age of the company, and a description of your ability to support your product.
x. Please list your competitors. Please describe the advantages of your technology over your competitors. What are the advantages of your competitors’ technology to yours?
y. Please describe the passenger acceptance of technology (where applicable – include basis for response).
z. Please describe the role of a driver in the system. Is one required? How does a driver handle one of the identified failure modes that might appear in the lane assist technology?
aa. Please describe any special driver training that is required. bb. Please describe any selection criteria used for determining which drivers
will be assigned to the buses equipped with the system. cc. Please describe the driver acceptance of technology (where applicable –
include basis for response). dd. Please describe the customer satisfaction with the system
(verified/documented/names of contacts).
5. Supporting infrastructure a. Please provide a detailed description of infrastructure needed to support
vehicle systems (if required) i. New infrastructure (rails, Curbs, Overhead lines)
ii. Modified infrastructure (magnetic markers, magnetic tape, paint stripes, signs/posts for triangulation, retroreflectors, strengthened shoulders and pavement, stealth street signs, etc.). Also identify those needed for precision docking.
iii. Modifications to common road infrastructure (In addition, describe any known long-term effects that modifications will have on the infrastructure due to incursion of frost or moisture, for example. Also describe if any of these modifications need to be re-applied regularly due to wear and tear, and how often.)
iv. Soft infrastructure (digital maps) v. Electronic infrastructure such as DGPS base stations, radio
transponders or beacons (for triangulation), digital or analog communications, telemetry, etc. (Please describe any special requirements or restrictions related to wireless communications or satellite communications, and note if an FCC license is required.)
b. Please provide infrastructure design details (sketches, prints, diagrams, drawings, etc.)
c. Please note if operating lanes can be shared with other vehicles (in emergencies).
d. Please note if any minimum lane width or if a minimum right-of-way is required.
e. Please describe if any changes to the infrastructure are required at at-grade crossings with regular traffic and if at-grade crossings are feasible.
f. Please describe any special requirements at entry or exits to BRT lanes.

D-5
g. Please estimate infrastructure cost (per mile, per square mile, per site, per system, etc). Can this be verified/documented (other systems)? If so, please provide documentation.
h. Please provide estimates regarding time to build, modify, install, and/or get approval for infrastructure (based on past installations or systems sold).
i. Please describe any known issues that would affect whether cities would accept the infrastructure construction or changes required by the system
i. Government ii. Citizens
iii. Environmentalists (green space issues…e.g. Oregon with tireways) j. Given the nature of how the system’s costs are partitioned between the
cost of additions to the vehicle and the cost of the newly required infrastructure, please describe how your system might be financed, or how other transit agencies have financed in the past:
i. Bonds ii. Federal $
iii. State $ iv. Increased Fares for improved performance.