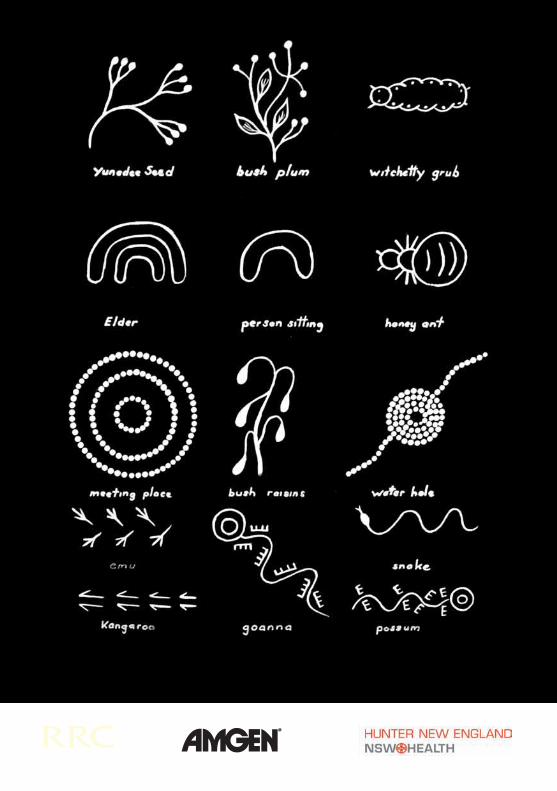
bush tucker art
TRANSCRIPT
This book has been supported by an unrestricted educational grant from AMGEN
Lesley Salem Nephrology Nurse Practitioner Hunter New England Health
Elizabeth Thompson Research Assistant
Herbert Leslie Elvin Artist
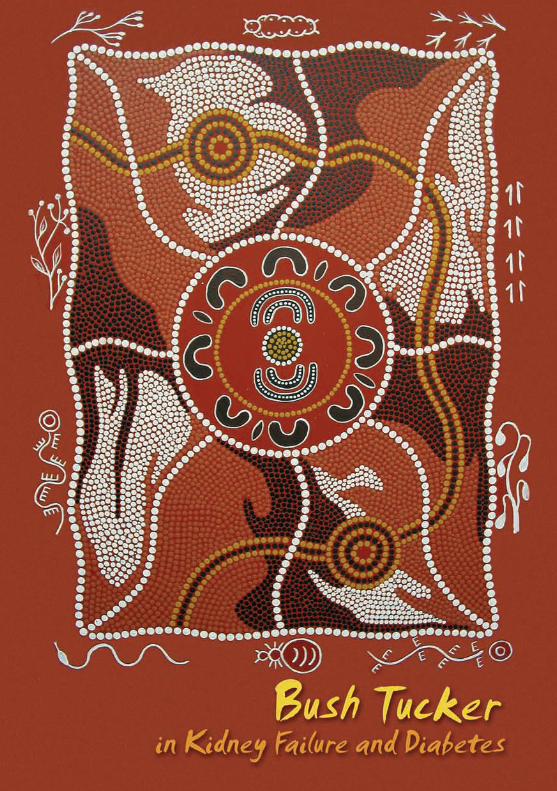
BBuusshh TTuucckkeerr iinn KKiiddnneeyy FFaaii ll uurree aanndd DDiiaabbeetteess
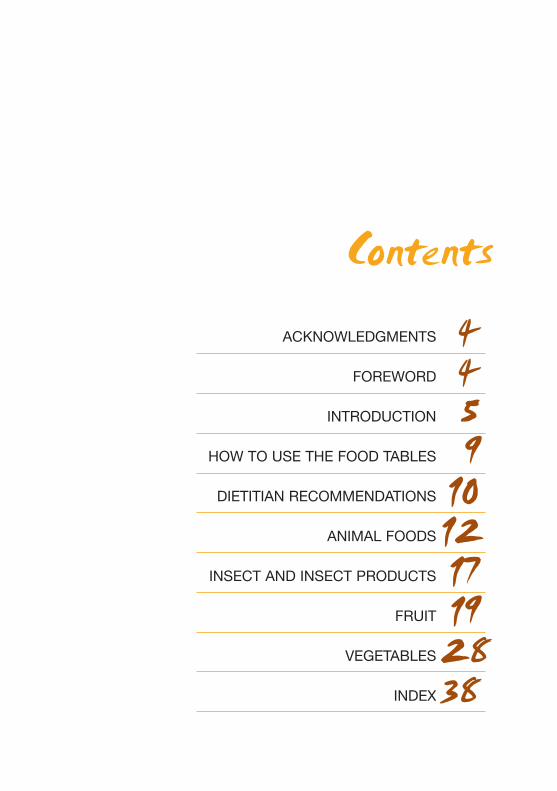
Contents
ACKNOWLEDGMENTS 4FOREWORD 4
INTRODUCTION 5HOW TO USE THE FOOD TABLES 9
DIETITIAN RECOMMENDATIONS 10ANIMAL FOODS 12
INSECT AND INSECT PRODUCTS 17FRUIT 19
VEGETABLES 28INDEX 38
4
ACKNOWLEDGMENTS
Miller, J.B., James, J.K. & Maggiore, P.M.A. 1993, Tables of Compositionof Australian Aboriginal Foods. Aboriginal Studies Press, Canberra.
AMGEN
Herbert Leslie Elvin for the wonderful artwork throughout the publication.
Barbara Harvie. Nephrology Nurse Practitioner Greater Southern AreaHealth Service.
Jenny Blissett for her help with editing.
The Nephrology Department at John Hunter Hospital.
FOREWORD
This book has been put together for people with chronic kidneydisease who wish to eat Indigenous foods.
It is designed to assist you and the dietician to make choices ofIndigenous food.
This is a selection of the more common foods eaten. For thecomposition of other foods, a more complete reference is availablein “Tables of Composition of Australian Aboriginal Foods” byJanette Brand Miller, Keith W. James and Patricia M A Maggiore
Available through Aboriginal Studies Press GPO Box 553, Canberra ACT 2601 www.aiatsis.gov.au/aboriginal studies press aboriginal
5
INTRODUCTION
About Kidney failure and the need for a ‘Kidney diet’A ‘kidney diet’ may help to slow down kidney damage and help to keep youwell. In later stages of kidney damage, the diet may also help you control theamount of waste products in your blood and body. If these waste productsbuild up to very high levels, they may cause nausea, vomiting, hiccups,tiredness, weakness, sleepiness and other problems.
Your diet is determined from the blood tests that you have. They tell usabout how well your kidney is working and what your diet needs to control.
The controlled amounts of each of these nutrients are based on the bloodlevels of potassium, sodium, protein and urea.
Kidney Failure and your dietIf you have kidney failure you need a special diet to keep you healthy.
Your kidneys remove waste products and excess fluid that come from yourdiet and what you drink. When they fail, there are stages the kidneys gothrough and with each of these stages your diet needs to change also. Aspecial diet can slow the rate of kidney failure and limit the build up of wasteproducts and fluid in your body.
In kidney failure we are mainly concerned about salt (sodium), phosphate,protein, potassium, and calories.
Your Nephrologist or GP will refer you to a Dietician. It is important that youlet the dietician know what types of food you like. You will still be able tohave them but the dietician will let you know how much and how often sothat you keep well.
6
ProteinYou need protein for building muscles and repairing itself.
Excess protein turns into urea, which the kidney normally gets rid of. Inkidney failure this waste product builds up and can affect all parts of yourbody and blood.
To avoid a lot of this waste in your body you need to eat less protein. Eatingless protein has been shown to lessen the stress on the kidney and slowdown the rate at which it is failing.
Protein is found in two types of foods:
● Animal sources- meat, bird, seafood, milk have large amounts
● Plant sources- breads, grains, vegetables and fruits have smalleramounts
Even though you have to limit protein in your diet it is essential that you stilleat the right amount of protein to keep well.
If you are on peritoneal dialysis, you will need to increase the amount ofprotein you eat because dialysis removes some protein from your system.
In the later stages of kidney failure, a low-protein diet can lead tomalnutrition and should only be implemented under the guidance of a kidneyspecialist.
PhosphorusA good level of phosphorus is necessary for the good health of your bones.In kidney failure your kidney cannot get rid of all the phosphate that is infood.
Too much phosphate causes your bones to weaken. If this happens theycan ache and possibly break easily.
To help prevent this, it would be good to have a diet of foods low inphosphate but if diet alone does not work medication will also have to beused. The phosphate level is listed in the tables and your dietician will giveyou a daily allowance.
7
High phosphorus levels are found in the following foods:
● Milk
● Nuts
● Beer and cola drinks
Sodium (salt)Sodium helps to regulate your blood pressure and the amount of fluid youretain in your body. In kidney failure where your kidney does not get rid ofexcess sodium high blood pressure and fluid retention occur.
To prevent these problems you may need to limit the amount of sodium inyour diet.
Sodium is found in many foods
● Table salt
● Snack foods, processed cheese, some canned foods, “fast foods”, ham,bacon and luncheon meats
Substitutes for salt can include spices, lemon or pepper.
Potassium Potassium helps your heart and muscles function properly. The amount youneed varies, depending on your body size, how well your kidney works andthe tablets you take. In the early stages of kidney failure this does not haveto be restricted.
Potassium is found in many foods.
● Foods high in potassium include fruits, vegetables, breads, cereals,starches
You can reduce the potassium in some food before you eat it. For exampleyou can: cut peeled potatoes into small pieces, soak them for at least twohours in a large amount of warm water, drain, and then cook.
8
CaloriesThe calories in food are what give you energy. Because you are restricted inthe amount of protein you eat, you need to increase other foods to getenough calories.
With all the restrictions in the type and quantity of foods you can consume itis important to work with your dietician to formulate a balanced diet. Losingtoo much weight can cause you to be ill. Your weight should be monitoredregularly.
If you are diabetic or overweight, talk with your renal dietician about the bestway for you to loose weight.
Your new diet may have more fats and carbohydrates (starches and sweets)than you are used to eating. These are added to help maintain weight andprotect your muscle tissue. However this does not mean that the Australiannative foods that you would like to eat cannot be included in your ‘kidneydiet’.
FluidsIt is only in the later stages of kidney failure when the fluid you drink isretained in your body. Drinking fluid is only restricted when you accumulateexcessive amounts in your body.
Vitamins Whether you need extra vitamins depends on your various dietaryrestrictions and how much kidney damage there is. A good diet gives youenough vitamins A, E, and K. You may need to supplement your diet withvitamins B and C when you start dialysis.
9
HOW TO USE THE FOOD TABLES
There are some symbols in the tables that you need to understand.
BDL (below detectable limit) indicates that a trace amount of thecomponent is present. It is not considered to be of dieteticsignificance.
ND (not determined) means that no value is available for this component.
* indicates that the value in the carbohydrate column was derived bydirect measurement, rather than calculated by difference.
(T) indicates that the average total carbohydrate content (that is includingfibre) of the food has been calculated.
N/A indicates that data was not available
The tables are put together in four sections.
Table 1: AnimalsTable 2: Insects and Insect ProductsTable 3: FruitsTable 4: Vegetables
Tables 1,2 and 3 have been put together linking the Common Names ingroups according to type. For example, all kangaroos are together and allreptiles are together rather than listing by their scientific names. Table 4 hasbeen put together using the ‘part’ to link the groups together. For example,all seeds are together, all tubers are together etc. This also means that thescientific names are not in alphabetical order.
A column under the heading ‘Local Name’ is for the patient’s use, this is tocater for local knowledge of plant and animal names in the patients ownarea.
10
Dietician RecommendationsDATE RECOMMENDATIONS

11
DATE RECOMMENDATIONS
Animal Foods
13
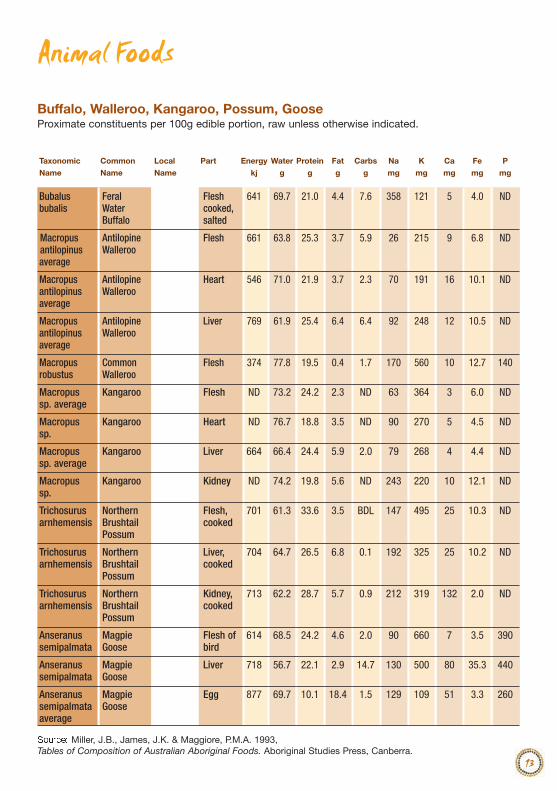
Source: Miller, J.B., James, J.K. & Maggiore, P.M.A. 1993, Tables of Composition of Australian Aboriginal Foods. Aboriginal Studies Press, Canberra.
Animal Foods
Buffalo, Walleroo, Kangaroo, Possum, GooseProximate constituents per 100g edible portion, raw unless otherwise indicated.
Taxonomic Common Local Part Energy Water Protein Fat Carbs Na K Ca Fe P
Name Name Name kj g g g g mg mg mg mg mg
Bubalus Feral Flesh 641 69.7 21.0 4.4 7.6 358 121 5 4.0 NDbubalis Water cooked,
Buffalo salted
Macropus Antilopine Flesh 661 63.8 25.3 3.7 5.9 26 215 9 6.8 NDantilopinus Walleroo average
Macropus Antilopine Heart 546 71.0 21.9 3.7 2.3 70 191 16 10.1 NDantilopinus Wallerooaverage
Macropus Antilopine Liver 769 61.9 25.4 6.4 6.4 92 248 12 10.5 NDantilopinus Wallerooaverage
Macropus Common Flesh 374 77.8 19.5 0.4 1.7 170 560 10 12.7 140robustus Walleroo
Macropus Kangaroo Flesh ND 73.2 24.2 2.3 ND 63 364 3 6.0 NDsp. average
Macropus Kangaroo Heart ND 76.7 18.8 3.5 ND 90 270 5 4.5 NDsp.
Macropus Kangaroo Liver 664 66.4 24.4 5.9 2.0 79 268 4 4.4 NDsp. average
Macropus Kangaroo Kidney ND 74.2 19.8 5.6 ND 243 220 10 12.1 NDsp.
Trichosurus Northern Flesh, 701 61.3 33.6 3.5 BDL 147 495 25 10.3 NDarnhemensis Brushtail cooked
Possum
Trichosurus Northern Liver, 704 64.7 26.5 6.8 0.1 192 325 25 10.2 NDarnhemensis Brushtail cooked
Possum
Trichosurus Northern Kidney, 713 62.2 28.7 5.7 0.9 212 319 132 2.0 NDarnhemensis Brushtail cooked
Possum
Anseranus Magpie Flesh of 614 68.5 24.2 4.6 2.0 90 660 7 3.5 390semipalmata Goose bird
Anseranus Magpie Liver 718 56.7 22.1 2.9 14.7 130 500 80 35.3 440semipalmata Goose
Anseranus Magpie Egg 877 69.7 10.1 18.4 1.5 129 109 51 3.3 260semipalmata Gooseaverage
14
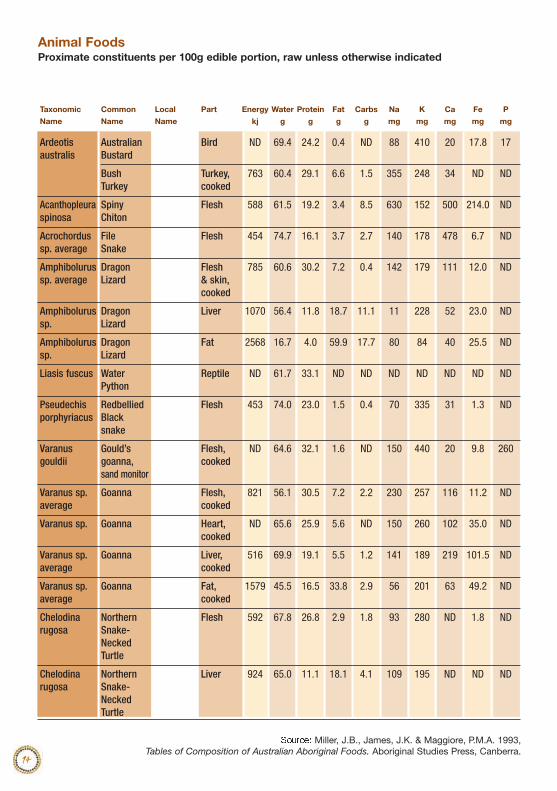
Source: Miller, J.B., James, J.K. & Maggiore, P.M.A. 1993, Tables of Composition of Australian Aboriginal Foods. Aboriginal Studies Press, Canberra.
Animal Foods Proximate constituents per 100g edible portion, raw unless otherwise indicated
Taxonomic Common Local Part Energy Water Protein Fat Carbs Na K Ca Fe P
Name Name Name kj g g g g mg mg mg mg mg
Ardeotis Australian Bird ND 69.4 24.2 0.4 ND 88 410 20 17.8 17australis Bustard
Bush Turkey, 763 60.4 29.1 6.6 1.5 355 248 34 ND NDTurkey cooked
Acanthopleura Spiny Flesh 588 61.5 19.2 3.4 8.5 630 152 500 214.0 NDspinosa Chiton
Acrochordus File Flesh 454 74.7 16.1 3.7 2.7 140 178 478 6.7 NDsp. average Snake
Amphibolurus Dragon Flesh 785 60.6 30.2 7.2 0.4 142 179 111 12.0 NDsp. average Lizard & skin,
cooked
Amphibolurus Dragon Liver 1070 56.4 11.8 18.7 11.1 11 228 52 23.0 NDsp. Lizard
Amphibolurus Dragon Fat 2568 16.7 4.0 59.9 17.7 80 84 40 25.5 NDsp. Lizard
Liasis fuscus Water Reptile ND 61.7 33.1 ND ND ND ND ND ND NDPython
Pseudechis Redbellied Flesh 453 74.0 23.0 1.5 0.4 70 335 31 1.3 NDporphyriacus Black
snake
Varanus Gould’s Flesh, ND 64.6 32.1 1.6 ND 150 440 20 9.8 260gouldii goanna, cooked
sand monitor
Varanus sp. Goanna Flesh, 821 56.1 30.5 7.2 2.2 230 257 116 11.2 NDaverage cooked
Varanus sp. Goanna Heart, ND 65.6 25.9 5.6 ND 150 260 102 35.0 NDcooked
Varanus sp. Goanna Liver, 516 69.9 19.1 5.5 1.2 141 189 219 101.5 NDaverage cooked
Varanus sp. Goanna Fat, 1579 45.5 16.5 33.8 2.9 56 201 63 49.2 NDaverage cooked
Chelodina Northern Flesh 592 67.8 26.8 2.9 1.8 93 280 ND 1.8 NDrugosa Snake-
Necked Turtle
Chelodina Northern Liver 924 65.0 11.1 18.1 4.1 109 195 ND ND NDrugosa Snake-
Necked Turtle
15
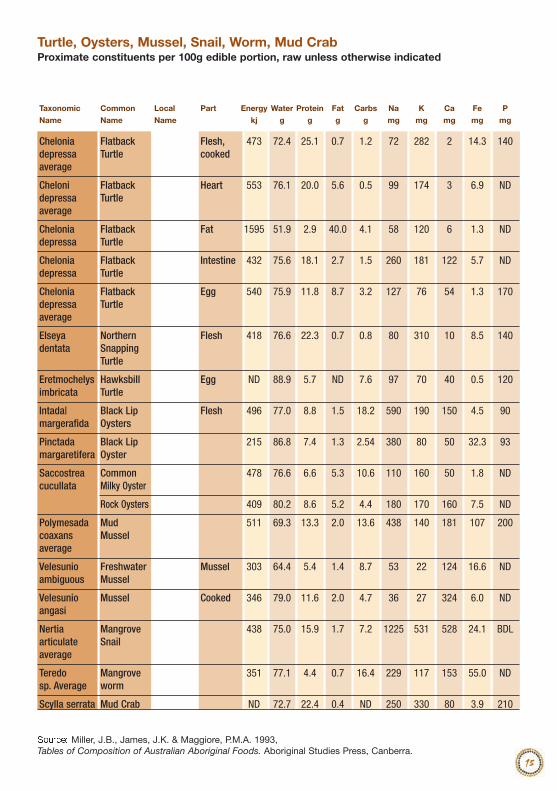
Source: Miller, J.B., James, J.K. & Maggiore, P.M.A. 1993, Tables of Composition of Australian Aboriginal Foods. Aboriginal Studies Press, Canberra.
Turtle, Oysters, Mussel, Snail, Worm, Mud CrabProximate constituents per 100g edible portion, raw unless otherwise indicated
Taxonomic Common Local Part Energy Water Protein Fat Carbs Na K Ca Fe P
Name Name Name kj g g g g mg mg mg mg mg
Chelonia Flatback Flesh, 473 72.4 25.1 0.7 1.2 72 282 2 14.3 140depressa Turtle cookedaverage
Cheloni Flatback Heart 553 76.1 20.0 5.6 0.5 99 174 3 6.9 NDdepressa Turtleaverage
Chelonia Flatback Fat 1595 51.9 2.9 40.0 4.1 58 120 6 1.3 NDdepressa Turtle
Chelonia Flatback Intestine 432 75.6 18.1 2.7 1.5 260 181 122 5.7 NDdepressa Turtle
Chelonia Flatback Egg 540 75.9 11.8 8.7 3.2 127 76 54 1.3 170depressa Turtleaverage
Elseya Northern Flesh 418 76.6 22.3 0.7 0.8 80 310 10 8.5 140dentata Snapping
Turtle
Eretmochelys Hawksbill Egg ND 88.9 5.7 ND 7.6 97 70 40 0.5 120imbricata Turtle
Intada| Black Lip Flesh 496 77.0 8.8 1.5 18.2 590 190 150 4.5 90margerafida Oysters
Pinctada Black Lip 215 86.8 7.4 1.3 2.54 380 80 50 32.3 93margaretifera Oyster
Saccostrea Common 478 76.6 6.6 5.3 10.6 110 160 50 1.8 NDcucullata Milky Oyster
Rock Oysters 409 80.2 8.6 5.2 4.4 180 170 160 7.5 ND
Polymesada Mud 511 69.3 13.3 2.0 13.6 438 140 181 107 200coaxans Musselaverage
Velesunio Freshwater Mussel 303 64.4 5.4 1.4 8.7 53 22 124 16.6 NDambiguous Mussel
Velesunio Mussel Cooked 346 79.0 11.6 2.0 4.7 36 27 324 6.0 NDangasi
Nertia Mangrove 438 75.0 15.9 1.7 7.2 1225 531 528 24.1 BDLarticulate Snailaverage
Teredo Mangrove 351 77.1 4.4 0.7 16.4 229 117 153 55.0 NDsp. Average worm
Scylla serrata Mud Crab ND 72.7 22.4 0.4 ND 250 330 80 3.9 210
16
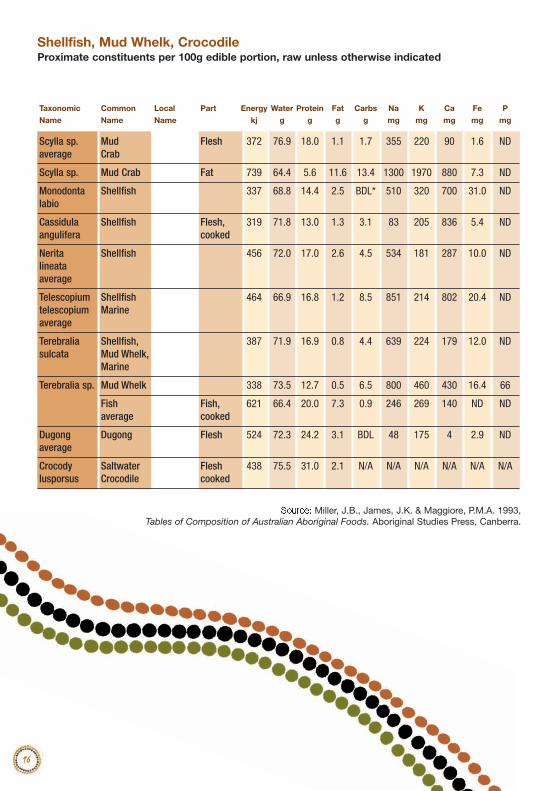
Source: Miller, J.B., James, J.K. & Maggiore, P.M.A. 1993, Tables of Composition of Australian Aboriginal Foods. Aboriginal Studies Press, Canberra.
Shellfish, Mud Whelk, CrocodileProximate constituents per 100g edible portion, raw unless otherwise indicated
Taxonomic Common Local Part Energy Water Protein Fat Carbs Na K Ca Fe P
Name Name Name kj g g g g mg mg mg mg mg
Scylla sp. Mud Flesh 372 76.9 18.0 1.1 1.7 355 220 90 1.6 NDaverage Crab
Scylla sp. Mud Crab Fat 739 64.4 5.6 11.6 13.4 1300 1970 880 7.3 ND
Monodonta Shellfish 337 68.8 14.4 2.5 BDL* 510 320 700 31.0 NDlabio
Cassidula Shellfish Flesh, 319 71.8 13.0 1.3 3.1 83 205 836 5.4 NDangulifera cooked
Nerita Shellfish 456 72.0 17.0 2.6 4.5 534 181 287 10.0 NDlineata average
Telescopium Shellfish 464 66.9 16.8 1.2 8.5 851 214 802 20.4 NDtelescopium Marineaverage
Terebralia Shellfish, 387 71.9 16.9 0.8 4.4 639 224 179 12.0 NDsulcata Mud Whelk,
Marine
Terebralia sp. Mud Whelk 338 73.5 12.7 0.5 6.5 800 460 430 16.4 66
Fish Fish, 621 66.4 20.0 7.3 0.9 246 269 140 ND NDaverage cooked
Dugong Dugong Flesh 524 72.3 24.2 3.1 BDL 48 175 4 2.9 NDaverage
Crocody Saltwater Flesh 438 75.5 31.0 2.1 N/A N/A N/A N/A N/A N/Alusporsus Crocodile cooked
Insect and Insect Products
18
Source: Miller, J.B., James, J.K. & Maggiore, P.M.A. 1993, Tables of Composition of Australian Aboriginal Foods. Aboriginal Studies Press, Canberra.
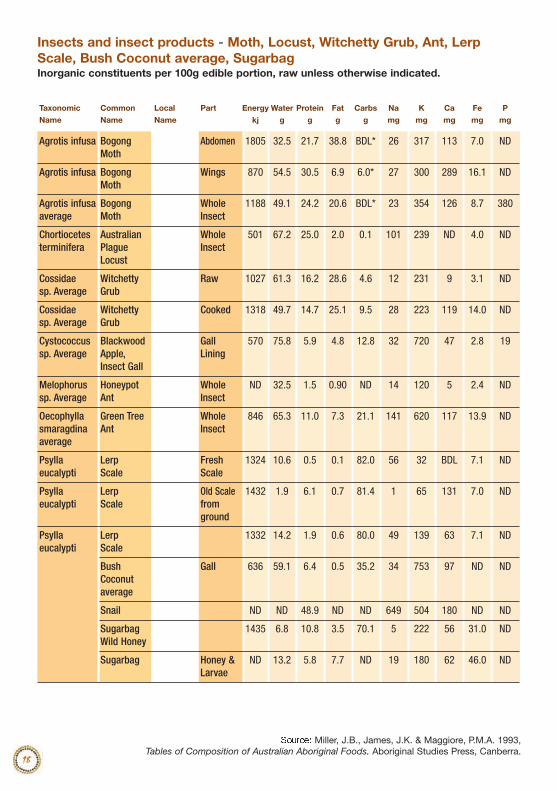
Insects and insect products - Moth, Locust, Witchetty Grub, Ant, LerpScale, Bush Coconut average, SugarbagInorganic constituents per 100g edible portion, raw unless otherwise indicated.
Taxonomic Common Local Part Energy Water Protein Fat Carbs Na K Ca Fe P
Name Name Name kj g g g g mg mg mg mg mg
Agrotis infusa Bogong Abdomen 1805 32.5 21.7 38.8 BDL* 26 317 113 7.0 NDMoth
Agrotis infusa Bogong Wings 870 54.5 30.5 6.9 6.0* 27 300 289 16.1 NDMoth
Agrotis infusa Bogong Whole 1188 49.1 24.2 20.6 BDL* 23 354 126 8.7 380average Moth Insect
Chortiocetes Australian Whole 501 67.2 25.0 2.0 0.1 101 239 ND 4.0 NDterminifera Plague Insect
Locust
Cossidae Witchetty Raw 1027 61.3 16.2 28.6 4.6 12 231 9 3.1 NDsp. Average Grub
Cossidae Witchetty Cooked 1318 49.7 14.7 25.1 9.5 28 223 119 14.0 NDsp. Average Grub
Cystococcus Blackwood Gall 570 75.8 5.9 4.8 12.8 32 720 47 2.8 19sp. Average Apple, Lining
Insect Gall
Melophorus Honeypot Whole ND 32.5 1.5 0.90 ND 14 120 5 2.4 NDsp. Average Ant Insect
Oecophylla Green Tree Whole 846 65.3 11.0 7.3 21.1 141 620 117 13.9 NDsmaragdina Ant Insectaverage
Psylla Lerp Fresh 1324 10.6 0.5 0.1 82.0 56 32 BDL 7.1 NDeucalypti Scale Scale
Psylla Lerp Old Scale 1432 1.9 6.1 0.7 81.4 1 65 131 7.0 NDeucalypti Scale from
ground
Psylla Lerp 1332 14.2 1.9 0.6 80.0 49 139 63 7.1 NDeucalypti Scale
Bush Gall 636 59.1 6.4 0.5 35.2 34 753 97 ND NDCoconut average
Snail ND ND 48.9 ND ND 649 504 180 ND ND
Sugarbag 1435 6.8 10.8 3.5 70.1 5 222 56 31.0 NDWild Honey
Sugarbag Honey & ND 13.2 5.8 7.7 ND 19 180 62 46.0 NDLarvae
Fruits
20
Source: Miller, J.B., James, J.K. & Maggiore, P.M.A. 1993, Tables of Composition of Australian Aboriginal Foods. Aboriginal Studies Press, Canberra.
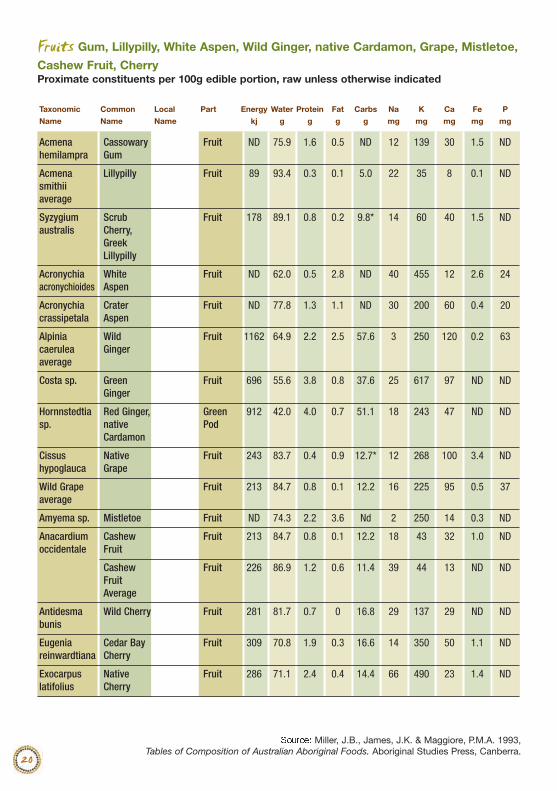
Fruits Gum, Lillypilly, White Aspen, Wild Ginger, native Cardamon, Grape, Mistletoe,
Cashew Fruit, CherryProximate constituents per 100g edible portion, raw unless otherwise indicated
Taxonomic Common Local Part Energy Water Protein Fat Carbs Na K Ca Fe P
Name Name Name kj g g g g mg mg mg mg mg
Acmena Cassowary Fruit ND 75.9 1.6 0.5 ND 12 139 30 1.5 NDhemilampra Gum
Acmena Lillypilly Fruit 89 93.4 0.3 0.1 5.0 22 35 8 0.1 NDsmithii average
Syzygium Scrub Fruit 178 89.1 0.8 0.2 9.8* 14 60 40 1.5 NDaustralis Cherry,
GreekLillypilly
Acronychia White Fruit ND 62.0 0.5 2.8 ND 40 455 12 2.6 24acronychioides Aspen
Acronychia Crater Fruit ND 77.8 1.3 1.1 ND 30 200 60 0.4 20crassipetala Aspen
Alpinia Wild Fruit 1162 64.9 2.2 2.5 57.6 3 250 120 0.2 63caerulea Gingeraverage
Costa sp. Green Fruit 696 55.6 3.8 0.8 37.6 25 617 97 ND NDGinger
Hornnstedtia Red Ginger, Green 912 42.0 4.0 0.7 51.1 18 243 47 ND NDsp. native Pod
Cardamon
Cissus Native Fruit 243 83.7 0.4 0.9 12.7* 12 268 100 3.4 NDhypoglauca Grape
Wild Grape Fruit 213 84.7 0.8 0.1 12.2 16 225 95 0.5 37average
Amyema sp. Mistletoe Fruit ND 74.3 2.2 3.6 Nd 2 250 14 0.3 ND
Anacardium Cashew Fruit 213 84.7 0.8 0.1 12.2 18 43 32 1.0 NDoccidentale Fruit
Cashew Fruit 226 86.9 1.2 0.6 11.4 39 44 13 ND NDFruit Average
Antidesma Wild Cherry Fruit 281 81.7 0.7 0 16.8 29 137 29 ND NDbunis
Eugenia Cedar Bay Fruit 309 70.8 1.9 0.3 16.6 14 350 50 1.1 NDreinwardtiana Cherry
Exocarpus Native Fruit 286 71.1 2.4 0.4 14.4 66 490 23 1.4 NDlatifolius Cherry
21
Source: Miller, J.B., James, J.K. & Maggiore, P.M.A. 1993, Tables of Composition of Australian Aboriginal Foods. Aboriginal Studies Press, Canberra.
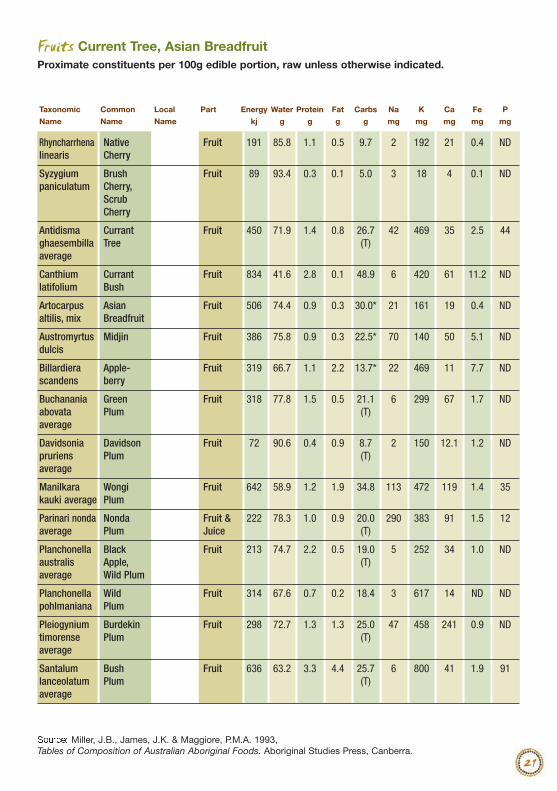
Fruits Current Tree, Asian BreadfruitProximate constituents per 100g edible portion, raw unless otherwise indicated.
Taxonomic Common Local Part Energy Water Protein Fat Carbs Na K Ca Fe P
Name Name Name kj g g g g mg mg mg mg mg
Rhyncharrhena Native Fruit 191 85.8 1.1 0.5 9.7 2 192 21 0.4 NDlinearis Cherry
Syzygium Brush Fruit 89 93.4 0.3 0.1 5.0 3 18 4 0.1 NDpaniculatum Cherry,
Scrub Cherry
Antidisma Currant Fruit 450 71.9 1.4 0.8 26.7 42 469 35 2.5 44ghaesembilla Tree (T)average
Canthium Currant Fruit 834 41.6 2.8 0.1 48.9 6 420 61 11.2 NDlatifolium Bush
Artocarpus Asian Fruit 506 74.4 0.9 0.3 30.0* 21 161 19 0.4 NDaltilis, mix Breadfruit
Austromyrtus Midjin Fruit 386 75.8 0.9 0.3 22.5* 70 140 50 5.1 NDdulcis
Billardiera Apple- Fruit 319 66.7 1.1 2.2 13.7* 22 469 11 7.7 NDscandens berry
Buchanania Green Fruit 318 77.8 1.5 0.5 21.1 6 299 67 1.7 NDabovata Plum (T)average
Davidsonia Davidson Fruit 72 90.6 0.4 0.9 8.7 2 150 12.1 1.2 NDpruriens Plum (T)average
Manilkara Wongi Fruit 642 58.9 1.2 1.9 34.8 113 472 119 1.4 35kauki average Plum
Parinari nonda Nonda Fruit & 222 78.3 1.0 0.9 20.0 290 383 91 1.5 12average Plum Juice (T)
Planchonella Black Fruit 213 74.7 2.2 0.5 19.0 5 252 34 1.0 NDaustralis Apple, (T)average Wild Plum
Planchonella Wild Fruit 314 67.6 0.7 0.2 18.4 3 617 14 ND NDpohlmaniana Plum
Pleiogynium Burdekin Fruit 298 72.7 1.3 1.3 25.0 47 458 241 0.9 NDtimorense Plum (T)average
Santalum Bush Fruit 636 63.2 3.3 4.4 25.7 6 800 41 1.9 91lanceolatum Plum (T)average
22
Source: Miller, J.B., James, J.K. & Maggiore, P.M.A. 1993, Tables of Composition of Australian Aboriginal Foods. Aboriginal Studies Press, Canberra.
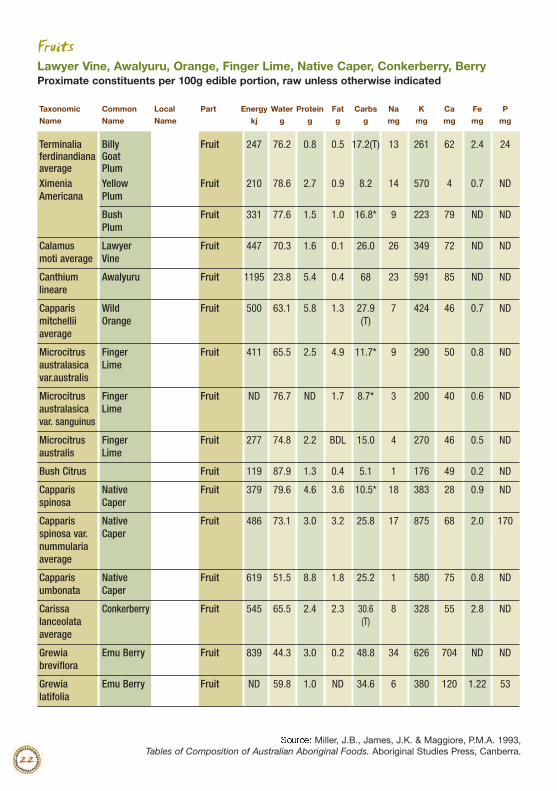
FruitsLawyer Vine, Awalyuru, Orange, Finger Lime, Native Caper, Conkerberry, BerryProximate constituents per 100g edible portion, raw unless otherwise indicated
Taxonomic Common Local Part Energy Water Protein Fat Carbs Na K Ca Fe P
Name Name Name kj g g g g mg mg mg mg mg
Terminalia Billy Fruit 247 76.2 0.8 0.5 17.2(T) 13 261 62 2.4 24ferdinandiana Goataverage PlumXimenia Yellow Fruit 210 78.6 2.7 0.9 8.2 14 570 4 0.7 NDAmericana Plum
Bush Fruit 331 77.6 1.5 1.0 16.8* 9 223 79 ND NDPlum
Calamus Lawyer Fruit 447 70.3 1.6 0.1 26.0 26 349 72 ND NDmoti average Vine
Canthium Awalyuru Fruit 1195 23.8 5.4 0.4 68 23 591 85 ND NDlineare
Capparis Wild Fruit 500 63.1 5.8 1.3 27.9 7 424 46 0.7 NDmitchellii Orange (T)average
Microcitrus Finger Fruit 411 65.5 2.5 4.9 11.7* 9 290 50 0.8 NDaustralasica Limevar.australis
Microcitrus Finger Fruit ND 76.7 ND 1.7 8.7* 3 200 40 0.6 NDaustralasica Limevar. sanguinus
Microcitrus Finger Fruit 277 74.8 2.2 BDL 15.0 4 270 46 0.5 NDaustralis Lime
Bush Citrus Fruit 119 87.9 1.3 0.4 5.1 1 176 49 0.2 ND
Capparis Native Fruit 379 79.6 4.6 3.6 10.5* 18 383 28 0.9 NDspinosa Caper
Capparis Native Fruit 486 73.1 3.0 3.2 25.8 17 875 68 2.0 170spinosa var. Capernummularia average
Capparis Native Fruit 619 51.5 8.8 1.8 25.2 1 580 75 0.8 NDumbonata Caper
Carissa Conkerberry Fruit 545 65.5 2.4 2.3 30.6 8 328 55 2.8 NDlanceolata (T)average
Grewia Emu Berry Fruit 839 44.3 3.0 0.2 48.8 34 626 704 ND NDbreviflora
Grewia Emu Berry Fruit ND 59.8 1.0 ND 34.6 6 380 120 1.22 53latifolia
23
Source: Miller, J.B., James, J.K. & Maggiore, P.M.A. 1993, Tables of Composition of Australian Aboriginal Foods. Aboriginal Studies Press, Canberra.
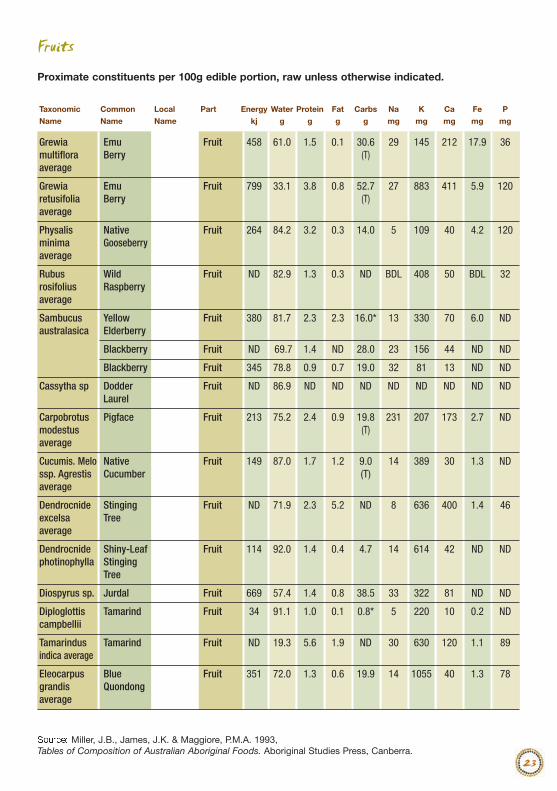
Fruits
Proximate constituents per 100g edible portion, raw unless otherwise indicated.
Taxonomic Common Local Part Energy Water Protein Fat Carbs Na K Ca Fe P
Name Name Name kj g g g g mg mg mg mg mg
Grewia Emu Fruit 458 61.0 1.5 0.1 30.6 29 145 212 17.9 36multiflora Berry (T)average
Grewia Emu Fruit 799 33.1 3.8 0.8 52.7 27 883 411 5.9 120retusifolia Berry (T)average
Physalis Native Fruit 264 84.2 3.2 0.3 14.0 5 109 40 4.2 120minima Gooseberryaverage
Rubus Wild Fruit ND 82.9 1.3 0.3 ND BDL 408 50 BDL 32rosifolius Raspberryaverage
Sambucus Yellow Fruit 380 81.7 2.3 2.3 16.0* 13 330 70 6.0 NDaustralasica Elderberry
Blackberry Fruit ND 69.7 1.4 ND 28.0 23 156 44 ND ND
Blackberry Fruit 345 78.8 0.9 0.7 19.0 32 81 13 ND ND
Cassytha sp Dodder Fruit ND 86.9 ND ND ND ND ND ND ND NDLaurel
Carpobrotus Pigface Fruit 213 75.2 2.4 0.9 19.8 231 207 173 2.7 NDmodestus (T)average
Cucumis. Melo Native Fruit 149 87.0 1.7 1.2 9.0 14 389 30 1.3 NDssp. Agrestis Cucumber (T)average
Dendrocnide Stinging Fruit ND 71.9 2.3 5.2 ND 8 636 400 1.4 46excelsa Treeaverage
Dendrocnide Shiny-Leaf Fruit 114 92.0 1.4 0.4 4.7 14 614 42 ND NDphotinophylla Stinging
Tree
Diospyrus sp. Jurdal Fruit 669 57.4 1.4 0.8 38.5 33 322 81 ND ND
Diploglottis Tamarind Fruit 34 91.1 1.0 0.1 0.8* 5 220 10 0.2 NDcampbellii
Tamarindus Tamarind Fruit ND 19.3 5.6 1.9 ND 30 630 120 1.1 89indica average
Eleocarpus Blue Fruit 351 72.0 1.3 0.6 19.9 14 1055 40 1.3 78grandis Quondongaverage
24
Source: Miller, J.B., James, J.K. & Maggiore, P.M.A. 1993, Tables of Composition of Australian Aboriginal Foods. Aboriginal Studies Press, Canberra.
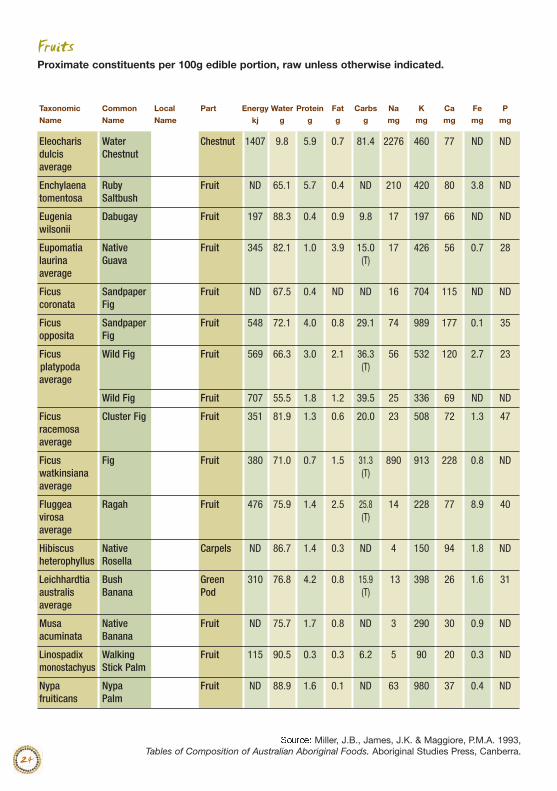
FruitsProximate constituents per 100g edible portion, raw unless otherwise indicated.
Taxonomic Common Local Part Energy Water Protein Fat Carbs Na K Ca Fe P
Name Name Name kj g g g g mg mg mg mg mg
Eleocharis Water Chestnut 1407 9.8 5.9 0.7 81.4 2276 460 77 ND NDdulcis Chestnutaverage
Enchylaena Ruby Fruit ND 65.1 5.7 0.4 ND 210 420 80 3.8 NDtomentosa Saltbush
Eugenia Dabugay Fruit 197 88.3 0.4 0.9 9.8 17 197 66 ND NDwilsonii
Eupomatia Native Fruit 345 82.1 1.0 3.9 15.0 17 426 56 0.7 28laurina Guava (T)average
Ficus Sandpaper Fruit ND 67.5 0.4 ND ND 16 704 115 ND NDcoronata Fig
Ficus Sandpaper Fruit 548 72.1 4.0 0.8 29.1 74 989 177 0.1 35opposita Fig
Ficus Wild Fig Fruit 569 66.3 3.0 2.1 36.3 56 532 120 2.7 23platypoda (T)average
Wild Fig Fruit 707 55.5 1.8 1.2 39.5 25 336 69 ND ND
Ficus Cluster Fig Fruit 351 81.9 1.3 0.6 20.0 23 508 72 1.3 47racemosa average
Ficus Fig Fruit 380 71.0 0.7 1.5 31.3 890 913 228 0.8 NDwatkinsiana (T)average
Fluggea Ragah Fruit 476 75.9 1.4 2.5 25.8 14 228 77 8.9 40virosa (T)average
Hibiscus Native Carpels ND 86.7 1.4 0.3 ND 4 150 94 1.8 NDheterophyllus Rosella
Leichhardtia Bush Green 310 76.8 4.2 0.8 15.9 13 398 26 1.6 31australis Banana Pod (T)average
Musa Native Fruit ND 75.7 1.7 0.8 ND 3 290 30 0.9 NDacuminata Banana
Linospadix Walking Fruit 115 90.5 0.3 0.3 6.2 5 90 20 0.3 NDmonostachyus Stick Palm
Nypa Nypa Fruit ND 88.9 1.6 0.1 ND 63 980 37 0.4 NDfruiticans Palm
25
Source: Miller, J.B., James, J.K. & Maggiore, P.M.A. 1993, Tables of Composition of Australian Aboriginal Foods. Aboriginal Studies Press, Canberra.
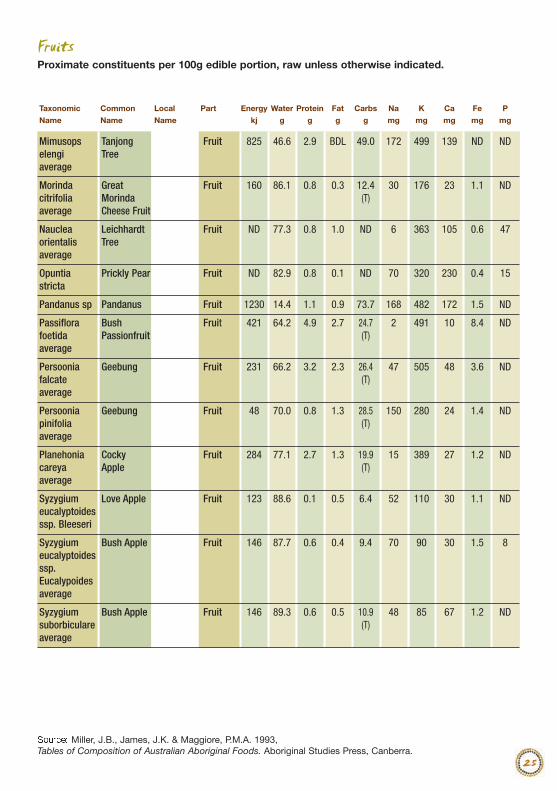
FruitsProximate constituents per 100g edible portion, raw unless otherwise indicated.
Taxonomic Common Local Part Energy Water Protein Fat Carbs Na K Ca Fe P
Name Name Name kj g g g g mg mg mg mg mg
Mimusops Tanjong Fruit 825 46.6 2.9 BDL 49.0 172 499 139 ND NDelengi Treeaverage
Morinda Great Fruit 160 86.1 0.8 0.3 12.4 30 176 23 1.1 NDcitrifolia Morinda (T)average Cheese Fruit
Nauclea Leichhardt Fruit ND 77.3 0.8 1.0 ND 6 363 105 0.6 47orientalis Treeaverage
Opuntia Prickly Pear Fruit ND 82.9 0.8 0.1 ND 70 320 230 0.4 15stricta
Pandanus sp Pandanus Fruit 1230 14.4 1.1 0.9 73.7 168 482 172 1.5 ND
Passiflora Bush Fruit 421 64.2 4.9 2.7 24.7 2 491 10 8.4 NDfoetida Passionfruit (T)average
Persoonia Geebung Fruit 231 66.2 3.2 2.3 26.4 47 505 48 3.6 NDfalcate (T)average
Persoonia Geebung Fruit 48 70.0 0.8 1.3 28.5 150 280 24 1.4 NDpinifolia (T)average
Planehonia Cocky Fruit 284 77.1 2.7 1.3 19.9 15 389 27 1.2 NDcareya Apple (T)average
Syzygium Love Apple Fruit 123 88.6 0.1 0.5 6.4 52 110 30 1.1 NDeucalyptoides ssp. Bleeseri
Syzygium Bush Apple Fruit 146 87.7 0.6 0.4 9.4 70 90 30 1.5 8eucalyptoides ssp. Eucalypoides average
Syzygium Bush Apple Fruit 146 89.3 0.6 0.5 10.9 48 85 67 1.2 NDsuborbiculare (T)average
26
Source: Miller, J.B., James, J.K. & Maggiore, P.M.A. 1993, Tables of Composition of Australian Aboriginal Foods. Aboriginal Studies Press, Canberra.
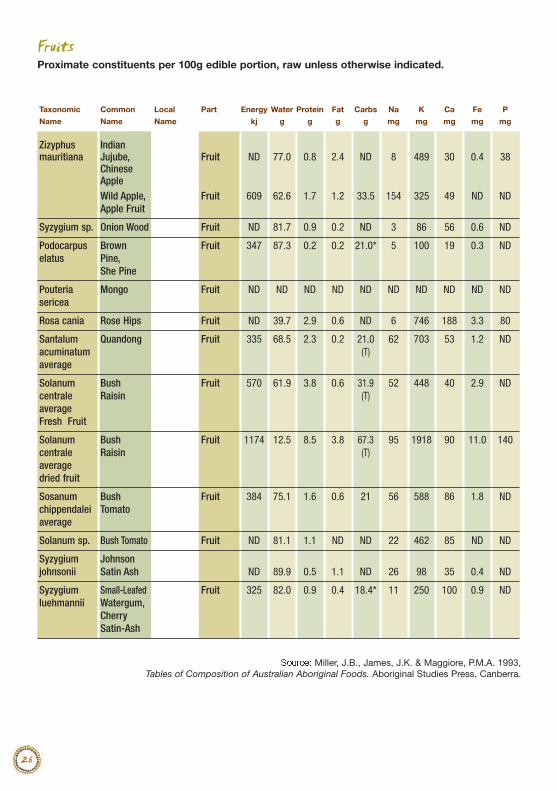
FruitsProximate constituents per 100g edible portion, raw unless otherwise indicated.
Taxonomic Common Local Part Energy Water Protein Fat Carbs Na K Ca Fe P
Name Name Name kj g g g g mg mg mg mg mg
Zizyphus Indian mauritiana Jujube, Fruit ND 77.0 0.8 2.4 ND 8 489 30 0.4 38
Chinese AppleWild Apple, Fruit 609 62.6 1.7 1.2 33.5 154 325 49 ND NDApple Fruit
Syzygium sp. Onion Wood Fruit ND 81.7 0.9 0.2 ND 3 86 56 0.6 ND
Podocarpus Brown Fruit 347 87.3 0.2 0.2 21.0* 5 100 19 0.3 NDelatus Pine,
She Pine
Pouteria Mongo Fruit ND ND ND ND ND ND ND ND ND NDsericea
Rosa cania Rose Hips Fruit ND 39.7 2.9 0.6 ND 6 746 188 3.3 80
Santalum Quandong Fruit 335 68.5 2.3 0.2 21.0 62 703 53 1.2 NDacuminatum (T)average
Solanum Bush Fruit 570 61.9 3.8 0.6 31.9 52 448 40 2.9 NDcentrale Raisin (T)average Fresh Fruit
Solanum Bush Fruit 1174 12.5 8.5 3.8 67.3 95 1918 90 11.0 140centrale Raisin (T)average dried fruit
Sosanum Bush Fruit 384 75.1 1.6 0.6 21 56 588 86 1.8 NDchippendalei Tomatoaverage
Solanum sp. Bush Tomato Fruit ND 81.1 1.1 ND ND 22 462 85 ND ND
Syzygium Johnsonjohnsonii Satin Ash ND 89.9 0.5 1.1 ND 26 98 35 0.4 ND
Syzygium Small-Leafed Fruit 325 82.0 0.9 0.4 18.4* 11 250 100 0.9 NDluehmannii Watergum,
Cherry Satin-Ash
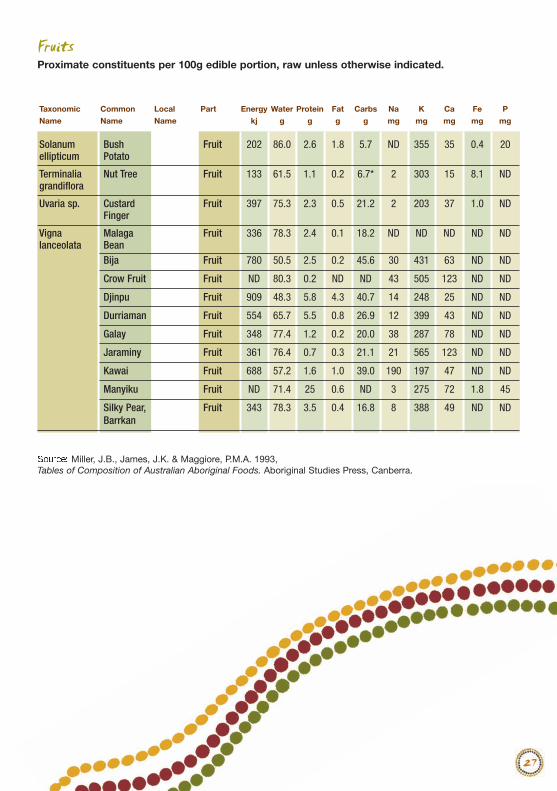
FruitsProximate constituents per 100g edible portion, raw unless otherwise indicated.
Taxonomic Common Local Part Energy Water Protein Fat Carbs Na K Ca Fe P
Name Name Name kj g g g g mg mg mg mg mg
Solanum Bush Fruit 202 86.0 2.6 1.8 5.7 ND 355 35 0.4 20ellipticum Potato
Terminalia Nut Tree Fruit 133 61.5 1.1 0.2 6.7* 2 303 15 8.1 NDgrandiflora
Uvaria sp. Custard Fruit 397 75.3 2.3 0.5 21.2 2 203 37 1.0 NDFinger
Vigna Malaga Fruit 336 78.3 2.4 0.1 18.2 ND ND ND ND NDlanceolata Bean
Bija Fruit 780 50.5 2.5 0.2 45.6 30 431 63 ND ND
Crow Fruit Fruit ND 80.3 0.2 ND ND 43 505 123 ND ND
Djinpu Fruit 909 48.3 5.8 4.3 40.7 14 248 25 ND ND
Durriaman Fruit 554 65.7 5.5 0.8 26.9 12 399 43 ND ND
Galay Fruit 348 77.4 1.2 0.2 20.0 38 287 78 ND ND
Jaraminy Fruit 361 76.4 0.7 0.3 21.1 21 565 123 ND ND
Kawai Fruit 688 57.2 1.6 1.0 39.0 190 197 47 ND ND
Manyiku Fruit ND 71.4 25 0.6 ND 3 275 72 1.8 45
Silky Pear, Fruit 343 78.3 3.5 0.4 16.8 8 388 49 ND NDBarrkan
27
Source: Miller, J.B., James, J.K. & Maggiore, P.M.A. 1993, Tables of Composition of Australian Aboriginal Foods. Aboriginal Studies Press, Canberra.
Vegetables
29
Source: Miller, J.B., James, J.K. & Maggiore, P.M.A. 1993, Tables of Composition of Australian Aboriginal Foods. Aboriginal Studies Press, Canberra.
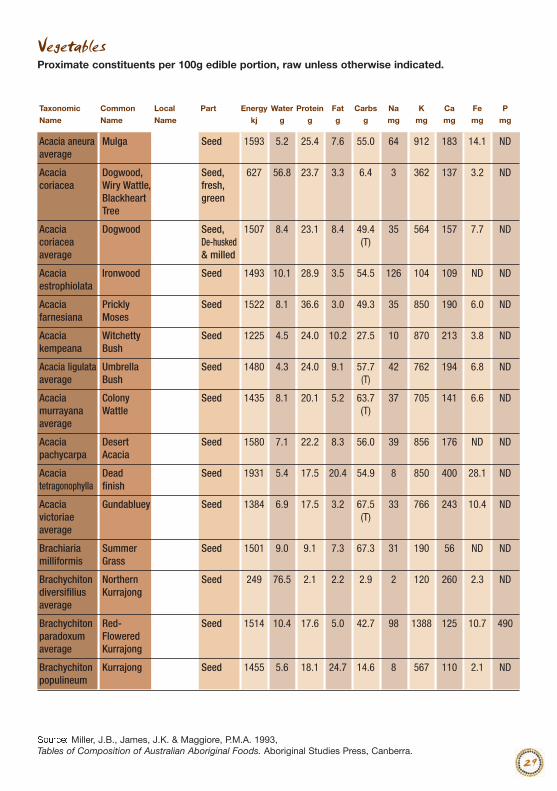
VegetablesProximate constituents per 100g edible portion, raw unless otherwise indicated.
Taxonomic Common Local Part Energy Water Protein Fat Carbs Na K Ca Fe P
Name Name Name kj g g g g mg mg mg mg mg
Acacia aneura Mulga Seed 1593 5.2 25.4 7.6 55.0 64 912 183 14.1 NDaverage
Acacia Dogwood, Seed, 627 56.8 23.7 3.3 6.4 3 362 137 3.2 NDcoriacea Wiry Wattle, fresh,
Blackheart greenTree
Acacia Dogwood Seed, 1507 8.4 23.1 8.4 49.4 35 564 157 7.7 NDcoriacea De-husked (T)average & milled
Acacia Ironwood Seed 1493 10.1 28.9 3.5 54.5 126 104 109 ND NDestrophiolata
Acacia Prickly Seed 1522 8.1 36.6 3.0 49.3 35 850 190 6.0 NDfarnesiana Moses
Acacia Witchetty Seed 1225 4.5 24.0 10.2 27.5 10 870 213 3.8 NDkempeana Bush
Acacia ligulata Umbrella Seed 1480 4.3 24.0 9.1 57.7 42 762 194 6.8 NDaverage Bush (T)
Acacia Colony Seed 1435 8.1 20.1 5.2 63.7 37 705 141 6.6 NDmurrayana Wattle (T)average
Acacia Desert Seed 1580 7.1 22.2 8.3 56.0 39 856 176 ND NDpachycarpa Acacia
Acacia Dead Seed 1931 5.4 17.5 20.4 54.9 8 850 400 28.1 NDtetragonophylla finish
Acacia Gundabluey Seed 1384 6.9 17.5 3.2 67.5 33 766 243 10.4 NDvictoriae (T)average
Brachiaria Summer Seed 1501 9.0 9.1 7.3 67.3 31 190 56 ND NDmilliformis Grass
Brachychiton Northern Seed 249 76.5 2.1 2.2 2.9 2 120 260 2.3 NDdiversifilius Kurrajongaverage
Brachychiton Red- Seed 1514 10.4 17.6 5.0 42.7 98 1388 125 10.7 490paradoxum Floweredaverage Kurrajong
Brachychiton Kurrajong Seed 1455 5.6 18.1 24.7 14.6 8 567 110 2.1 NDpopulineum
30
Source: Miller, J.B., James, J.K. & Maggiore, P.M.A. 1993, Tables of Composition of Australian Aboriginal Foods. Aboriginal Studies Press, Canberra.
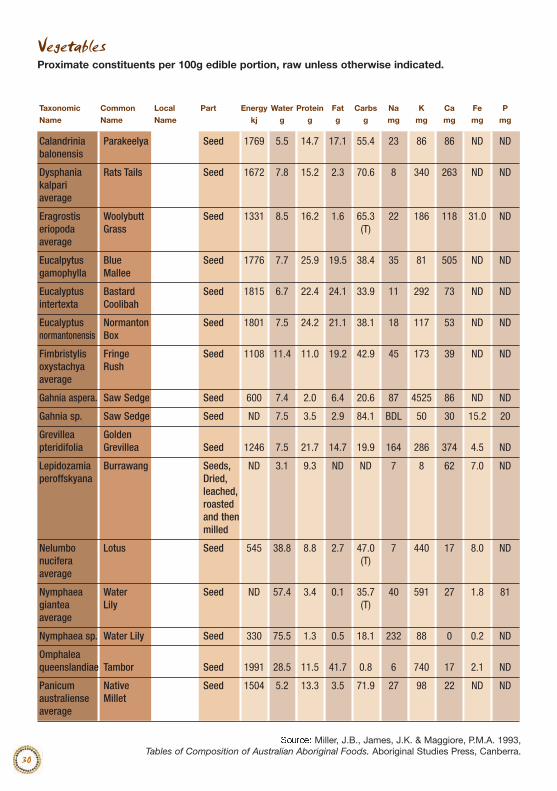
VegetablesProximate constituents per 100g edible portion, raw unless otherwise indicated.
Taxonomic Common Local Part Energy Water Protein Fat Carbs Na K Ca Fe P
Name Name Name kj g g g g mg mg mg mg mg
Calandrinia Parakeelya Seed 1769 5.5 14.7 17.1 55.4 23 86 86 ND NDbalonensis
Dysphania Rats Tails Seed 1672 7.8 15.2 2.3 70.6 8 340 263 ND NDkalpari average
Eragrostis Woolybutt Seed 1331 8.5 16.2 1.6 65.3 22 186 118 31.0 NDeriopoda Grass (T)average
Eucalpytus Blue Seed 1776 7.7 25.9 19.5 38.4 35 81 505 ND NDgamophylla Mallee
Eucalyptus Bastard Seed 1815 6.7 22.4 24.1 33.9 11 292 73 ND NDintertexta Coolibah
Eucalyptus Normanton Seed 1801 7.5 24.2 21.1 38.1 18 117 53 ND NDnormantonensis Box
Fimbristylis Fringe Seed 1108 11.4 11.0 19.2 42.9 45 173 39 ND NDoxystachya Rushaverage
Gahnia aspera. Saw Sedge Seed 600 7.4 2.0 6.4 20.6 87 4525 86 ND ND
Gahnia sp. Saw Sedge Seed ND 7.5 3.5 2.9 84.1 BDL 50 30 15.2 20
Grevillea Goldenpteridifolia Grevillea Seed 1246 7.5 21.7 14.7 19.9 164 286 374 4.5 ND
Lepidozamia Burrawang Seeds, ND 3.1 9.3 ND ND 7 8 62 7.0 NDperoffskyana Dried,
leached,roasted and then milled
Nelumbo Lotus Seed 545 38.8 8.8 2.7 47.0 7 440 17 8.0 NDnucifera (T)average
Nymphaea Water Seed ND 57.4 3.4 0.1 35.7 40 591 27 1.8 81giantea Lily (T)average
Nymphaea sp. Water Lily Seed 330 75.5 1.3 0.5 18.1 232 88 0 0.2 ND
Omphalea queenslandiae Tambor Seed 1991 28.5 11.5 41.7 0.8 6 740 17 2.1 ND
Panicum Native Seed 1504 5.2 13.3 3.5 71.9 27 98 22 ND NDaustraliense Milletaverage
31
Source: Miller, J.B., James, J.K. & Maggiore, P.M.A. 1993, Tables of Composition of Australian Aboriginal Foods. Aboriginal Studies Press, Canberra.
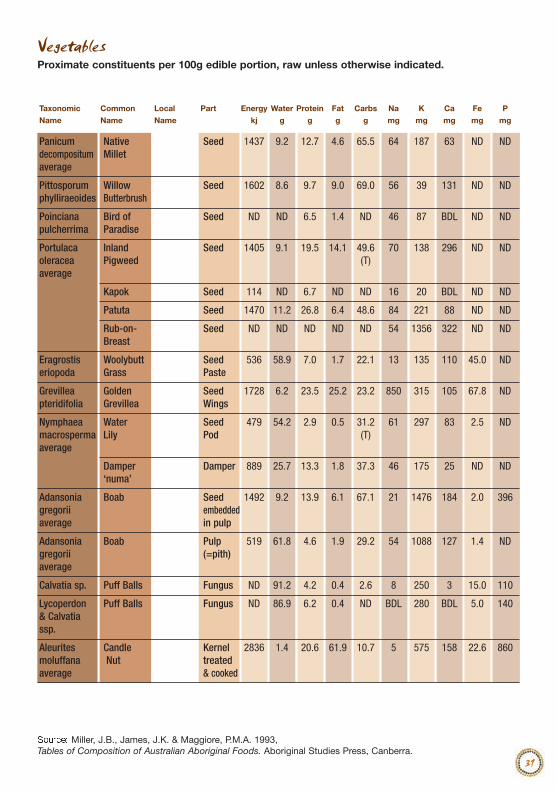
VegetablesProximate constituents per 100g edible portion, raw unless otherwise indicated.
Taxonomic Common Local Part Energy Water Protein Fat Carbs Na K Ca Fe P
Name Name Name kj g g g g mg mg mg mg mg
Panicum Native Seed 1437 9.2 12.7 4.6 65.5 64 187 63 ND NDdecompositum Milletaverage
Pittosporum Willow Seed 1602 8.6 9.7 9.0 69.0 56 39 131 ND NDphylliraeoides Butterbrush
Poinciana Bird of Seed ND ND 6.5 1.4 ND 46 87 BDL ND NDpulcherrima Paradise
Portulaca Inland Seed 1405 9.1 19.5 14.1 49.6 70 138 296 ND NDoleracea Pigweed (T)average
Kapok Seed 114 ND 6.7 ND ND 16 20 BDL ND ND
Patuta Seed 1470 11.2 26.8 6.4 48.6 84 221 88 ND ND
Rub-on- Seed ND ND ND ND ND 54 1356 322 ND NDBreast
Eragrostis Woolybutt Seed 536 58.9 7.0 1.7 22.1 13 135 110 45.0 NDeriopoda Grass Paste
Grevillea Golden Seed 1728 6.2 23.5 25.2 23.2 850 315 105 67.8 NDpteridifolia Grevillea Wings
Nymphaea Water Seed 479 54.2 2.9 0.5 31.2 61 297 83 2.5 NDmacrosperma Lily Pod (T)average
Damper Damper 889 25.7 13.3 1.8 37.3 46 175 25 ND ND‘numa’
Adansonia Boab Seed 1492 9.2 13.9 6.1 67.1 21 1476 184 2.0 396gregorii embeddedaverage in pulp
Adansonia Boab Pulp 519 61.8 4.6 1.9 29.2 54 1088 127 1.4 NDgregorii (=pith)average
Calvatia sp. Puff Balls Fungus ND 91.2 4.2 0.4 2.6 8 250 3 15.0 110
Lycoperdon Puff Balls Fungus ND 86.9 6.2 0.4 ND BDL 280 BDL 5.0 140& Calvatia ssp.
Aleurites Candle Kernel 2836 1.4 20.6 61.9 10.7 5 575 158 22.6 860moluffana Nut treatedaverage & cooked
32
Source: Miller, J.B., James, J.K. & Maggiore, P.M.A. 1993, Tables of Composition of Australian Aboriginal Foods. Aboriginal Studies Press, Canberra.
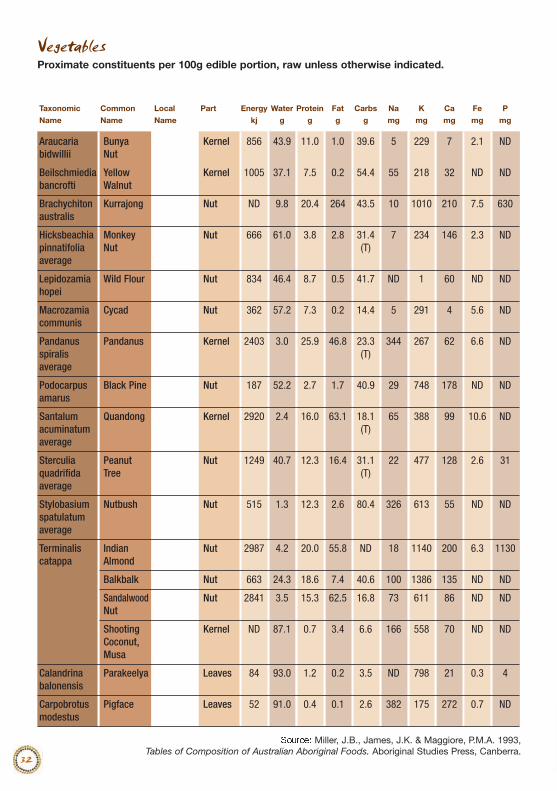
Vegetables Proximate constituents per 100g edible portion, raw unless otherwise indicated.
Taxonomic Common Local Part Energy Water Protein Fat Carbs Na K Ca Fe P
Name Name Name kj g g g g mg mg mg mg mg
Araucaria Bunya Kernel 856 43.9 11.0 1.0 39.6 5 229 7 2.1 NDbidwillii Nut
Beilschmiedia Yellow Kernel 1005 37.1 7.5 0.2 54.4 55 218 32 ND NDbancrofti Walnut
Brachychiton Kurrajong Nut ND 9.8 20.4 264 43.5 10 1010 210 7.5 630 australis
Hicksbeachia Monkey Nut 666 61.0 3.8 2.8 31.4 7 234 146 2.3 NDpinnatifolia Nut (T)average
Lepidozamia Wild Flour Nut 834 46.4 8.7 0.5 41.7 ND 1 60 ND NDhopei
Macrozamia Cycad Nut 362 57.2 7.3 0.2 14.4 5 291 4 5.6 NDcommunis
Pandanus Pandanus Kernel 2403 3.0 25.9 46.8 23.3 344 267 62 6.6 NDspiralis (T)average
Podocarpus Black Pine Nut 187 52.2 2.7 1.7 40.9 29 748 178 ND NDamarus
Santalum Quandong Kernel 2920 2.4 16.0 63.1 18.1 65 388 99 10.6 NDacuminatum (T)average
Sterculia Peanut Nut 1249 40.7 12.3 16.4 31.1 22 477 128 2.6 31quadrifida Tree (T)average
Stylobasium Nutbush Nut 515 1.3 12.3 2.6 80.4 326 613 55 ND ND spatulatum average
Terminalis Indian Nut 2987 4.2 20.0 55.8 ND 18 1140 200 6.3 1130catappa Almond
Balkbalk Nut 663 24.3 18.6 7.4 40.6 100 1386 135 ND ND
Sandalwood Nut 2841 3.5 15.3 62.5 16.8 73 611 86 ND NDNut
Shooting Kernel ND 87.1 0.7 3.4 6.6 166 558 70 ND NDCoconut,Musa
Calandrina Parakeelya Leaves 84 93.0 1.2 0.2 3.5 ND 798 21 0.3 4balonensis
Carpobrotus Pigface Leaves 52 91.0 0.4 0.1 2.6 382 175 272 0.7 NDmodestus
33
Source: Miller, J.B., James, J.K. & Maggiore, P.M.A. 1993, Tables of Composition of Australian Aboriginal Foods. Aboriginal Studies Press, Canberra.
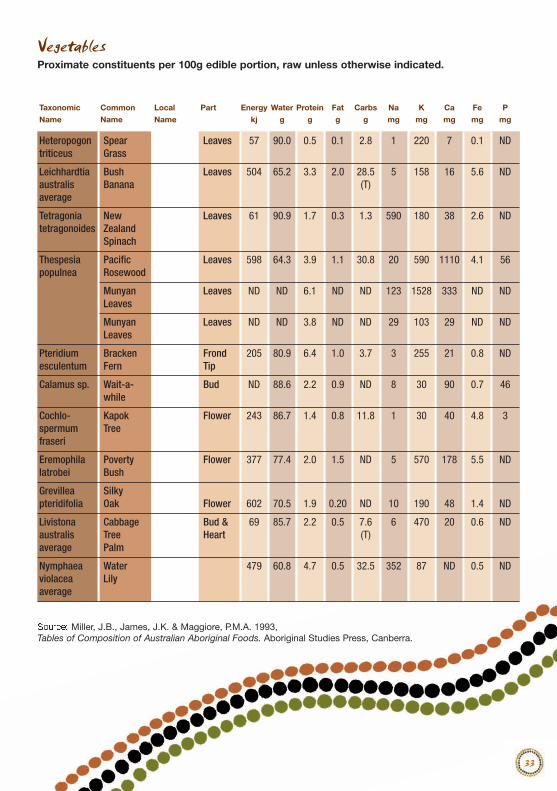
Vegetables Proximate constituents per 100g edible portion, raw unless otherwise indicated.
Taxonomic Common Local Part Energy Water Protein Fat Carbs Na K Ca Fe P
Name Name Name kj g g g g mg mg mg mg mg
Heteropogon Spear Leaves 57 90.0 0.5 0.1 2.8 1 220 7 0.1 NDtriticeus Grass
Leichhardtia Bush Leaves 504 65.2 3.3 2.0 28.5 5 158 16 5.6 NDaustralis Banana (T)average
Tetragonia New Leaves 61 90.9 1.7 0.3 1.3 590 180 38 2.6 NDtetragonoides Zealand
Spinach
Thespesia Pacific Leaves 598 64.3 3.9 1.1 30.8 20 590 1110 4.1 56populnea Rosewood
Munyan Leaves ND ND 6.1 ND ND 123 1528 333 ND NDLeaves
Munyan Leaves ND ND 3.8 ND ND 29 103 29 ND NDLeaves
Pteridium Bracken Frond 205 80.9 6.4 1.0 3.7 3 255 21 0.8 NDesculentum Fern Tip
Calamus sp. Wait-a- Bud ND 88.6 2.2 0.9 ND 8 30 90 0.7 46while
Cochlo- Kapok Flower 243 86.7 1.4 0.8 11.8 1 30 40 4.8 3spermum Treefraseri
Eremophila Poverty Flower 377 77.4 2.0 1.5 ND 5 570 178 5.5 NDlatrobei Bush
Grevillea Silkypteridifolia Oak Flower 602 70.5 1.9 0.20 ND 10 190 48 1.4 ND
Livistona Cabbage Bud & 69 85.7 2.2 0.5 7.6 6 470 20 0.6 NDaustralis Tree Heart (T)average Palm
Nymphaea Water 479 60.8 4.7 0.5 32.5 352 87 ND 0.5 NDviolacea Lilyaverage
34
Source: Miller, J.B., James, J.K. & Maggiore, P.M.A. 1993, Tables of Composition of Australian Aboriginal Foods. Aboriginal Studies Press, Canberra.
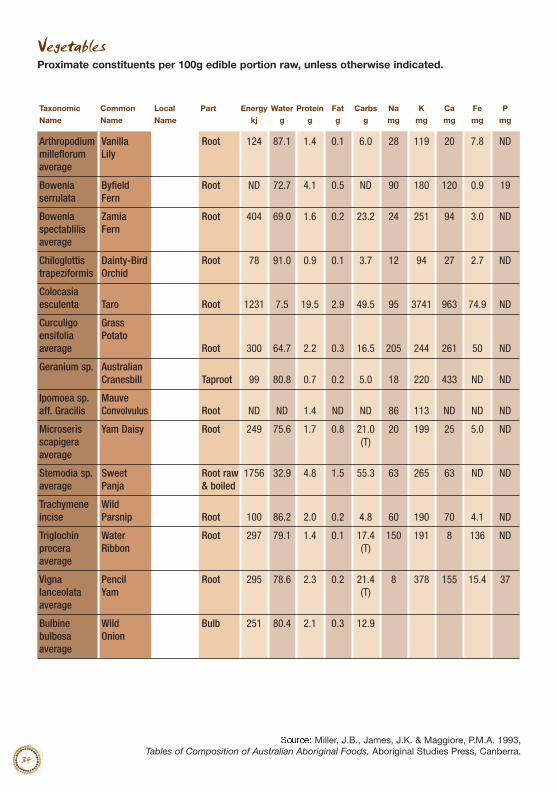
Vegetables Proximate constituents per 100g edible portion raw, unless otherwise indicated.
Taxonomic Common Local Part Energy Water Protein Fat Carbs Na K Ca Fe P
Name Name Name kj g g g g mg mg mg mg mg
Arthropodium Vanilla Root 124 87.1 1.4 0.1 6.0 28 119 20 7.8 NDmilleflorum Lilyaverage
Bowenia Byfield Root ND 72.7 4.1 0.5 ND 90 180 120 0.9 19serrulata Fern
Bowenia Zamia Root 404 69.0 1.6 0.2 23.2 24 251 94 3.0 NDspectablilis Fernaverage
Chiloglottis Dainty-Bird Root 78 91.0 0.9 0.1 3.7 12 94 27 2.7 NDtrapeziformis Orchid
Colocasia esculenta Taro Root 1231 7.5 19.5 2.9 49.5 95 3741 963 74.9 ND
Curculigo Grassensifolia Potatoaverage Root 300 64.7 2.2 0.3 16.5 205 244 261 50 ND
Geranium sp. Australian Cranesbill Taproot 99 80.8 0.7 0.2 5.0 18 220 433 ND ND
Ipomoea sp. Mauveaff. Gracilis Convolvulus Root ND ND 1.4 ND ND 86 113 ND ND ND
Microseris Yam Daisy Root 249 75.6 1.7 0.8 21.0 20 199 25 5.0 NDscapigera (T)average
Stemodia sp. Sweet Root raw 1756 32.9 4.8 1.5 55.3 63 265 63 ND NDaverage Panja & boiled
Trachymene Wildincise Parsnip Root 100 86.2 2.0 0.2 4.8 60 190 70 4.1 ND
Triglochin Water Root 297 79.1 1.4 0.1 17.4 150 191 8 136 NDprocera Ribbon (T)average
Vigna Pencil Root 295 78.6 2.3 0.2 21.4 8 378 155 15.4 37lanceolata Yam (T)average
Bulbine Wild Bulb 251 80.4 2.1 0.3 12.9bulbosa Onionaverage
35
Source: Miller, J.B., James, J.K. & Maggiore, P.M.A. 1993, Tables of Composition of Australian Aboriginal Foods. Aboriginal Studies Press, Canberra.
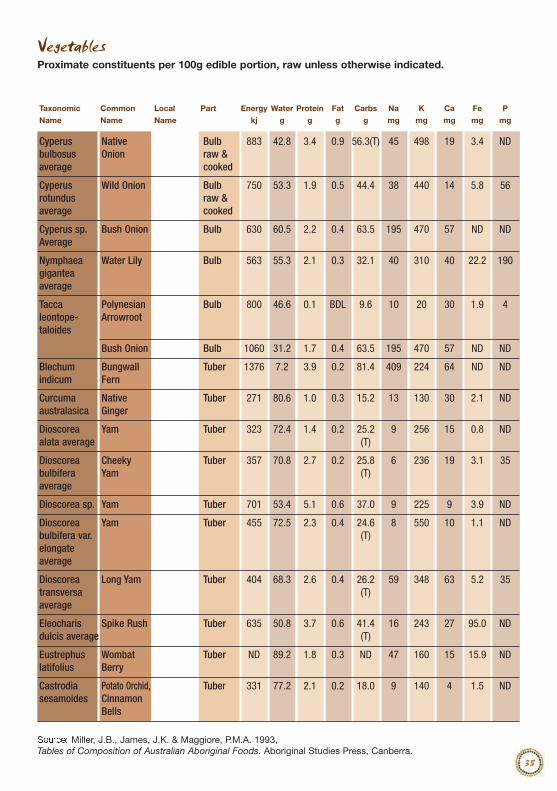
Vegetables Proximate constituents per 100g edible portion, raw unless otherwise indicated.
Taxonomic Common Local Part Energy Water Protein Fat Carbs Na K Ca Fe P
Name Name Name kj g g g g mg mg mg mg mg
Cyperus Native Bulb 883 42.8 3.4 0.9 56.3(T) 45 498 19 3.4 NDbulbosus Onion raw &average cooked
Cyperus Wild Onion Bulb 750 53.3 1.9 0.5 44.4 38 440 14 5.8 56rotundus raw &average cooked
Cyperus sp. Bush Onion Bulb 630 60.5 2.2 0.4 63.5 195 470 57 ND NDAverage
Nymphaea Water Lily Bulb 563 55.3 2.1 0.3 32.1 40 310 40 22.2 190gigantea average
Tacca Polynesian Bulb 800 46.6 0.1 BDL 9.6 10 20 30 1.9 4leontope- Arrowroottaloides
Bush Onion Bulb 1060 31.2 1.7 0.4 63.5 195 470 57 ND ND
Blechum Bungwall Tuber 1376 7.2 3.9 0.2 81.4 409 224 64 ND NDindicum Fern
Curcuma Native Tuber 271 80.6 1.0 0.3 15.2 13 130 30 2.1 NDaustralasica Ginger
Dioscorea Yam Tuber 323 72.4 1.4 0.2 25.2 9 256 15 0.8 NDalata average (T)
Dioscorea Cheeky Tuber 357 70.8 2.7 0.2 25.8 6 236 19 3.1 35bulbifera Yam (T)average
Dioscorea sp. Yam Tuber 701 53.4 5.1 0.6 37.0 9 225 9 3.9 ND
Dioscorea Yam Tuber 455 72.5 2.3 0.4 24.6 8 550 10 1.1 NDbulbifera var. (T)elongate average
Dioscorea Long Yam Tuber 404 68.3 2.6 0.4 26.2 59 348 63 5.2 35transversa (T)average
Eleocharis Spike Rush Tuber 635 50.8 3.7 0.6 41.4 16 243 27 95.0 NDdulcis average (T)
Eustrephus Wombat Tuber ND 89.2 1.8 0.3 ND 47 160 15 15.9 NDlatifolius Berry
Castrodia Potato Orchid, Tuber 331 77.2 2.1 0.2 18.0 9 140 4 1.5 NDsesamoides Cinnamon
Bells
36
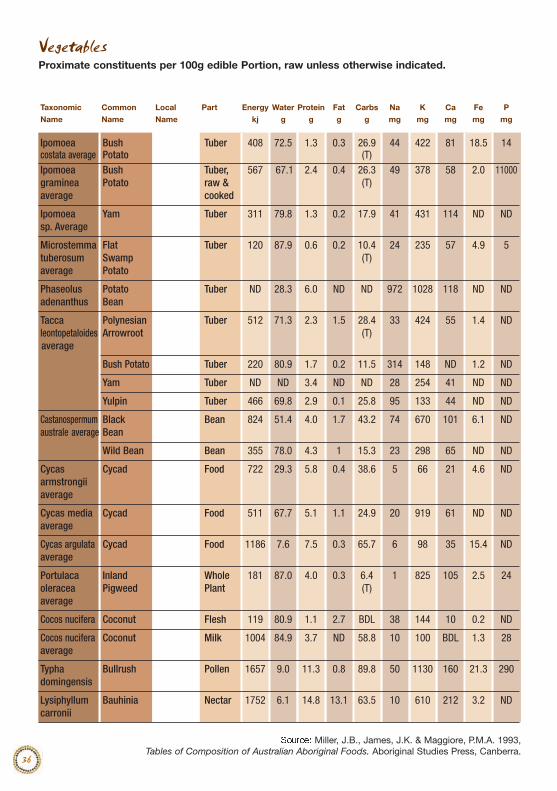
Source: Miller, J.B., James, J.K. & Maggiore, P.M.A. 1993, Tables of Composition of Australian Aboriginal Foods. Aboriginal Studies Press, Canberra.
Vegetables Proximate constituents per 100g edible Portion, raw unless otherwise indicated.
Taxonomic Common Local Part Energy Water Protein Fat Carbs Na K Ca Fe P
Name Name Name kj g g g g mg mg mg mg mg
Ipomoea Bush Tuber 408 72.5 1.3 0.3 26.9 44 422 81 18.5 14costata average Potato (T)Ipomoea Bush Tuber, 567 67.1 2.4 0.4 26.3 49 378 58 2.0 11000graminea Potato raw & (T)average cooked
Ipomoea Yam Tuber 311 79.8 1.3 0.2 17.9 41 431 114 ND NDsp. Average
Microstemma Flat Tuber 120 87.9 0.6 0.2 10.4 24 235 57 4.9 5tuberosum Swamp (T)average Potato
Phaseolus Potato Tuber ND 28.3 6.0 ND ND 972 1028 118 ND NDadenanthus Bean
Tacca Polynesian Tuber 512 71.3 2.3 1.5 28.4 33 424 55 1.4 NDleontopetaloides Arrowroot (T)average
Bush Potato Tuber 220 80.9 1.7 0.2 11.5 314 148 ND 1.2 ND
Yam Tuber ND ND 3.4 ND ND 28 254 41 ND ND
Yulpin Tuber 466 69.8 2.9 0.1 25.8 95 133 44 ND ND
Castanospermum Black Bean 824 51.4 4.0 1.7 43.2 74 670 101 6.1 NDaustrale average Bean
Wild Bean Bean 355 78.0 4.3 1 15.3 23 298 65 ND ND
Cycas Cycad Food 722 29.3 5.8 0.4 38.6 5 66 21 4.6 NDarmstrongii average
Cycas media Cycad Food 511 67.7 5.1 1.1 24.9 20 919 61 ND NDaverage
Cycas argulata Cycad Food 1186 7.6 7.5 0.3 65.7 6 98 35 15.4 NDaverage
Portulaca Inland Whole 181 87.0 4.0 0.3 6.4 1 825 105 2.5 24oleracea Pigweed Plant (T)average
Cocos nucifera Coconut Flesh 119 80.9 1.1 2.7 BDL 38 144 10 0.2 ND
Cocos nucifera Coconut Milk 1004 84.9 3.7 ND 58.8 10 100 BDL 1.3 28average
Typha Bullrush Pollen 1657 9.0 11.3 0.8 89.8 50 1130 160 21.3 290domingensis
Lysiphyllum Bauhinia Nectar 1752 6.1 14.8 13.1 63.5 10 610 212 3.2 NDcarronii

Notes
38
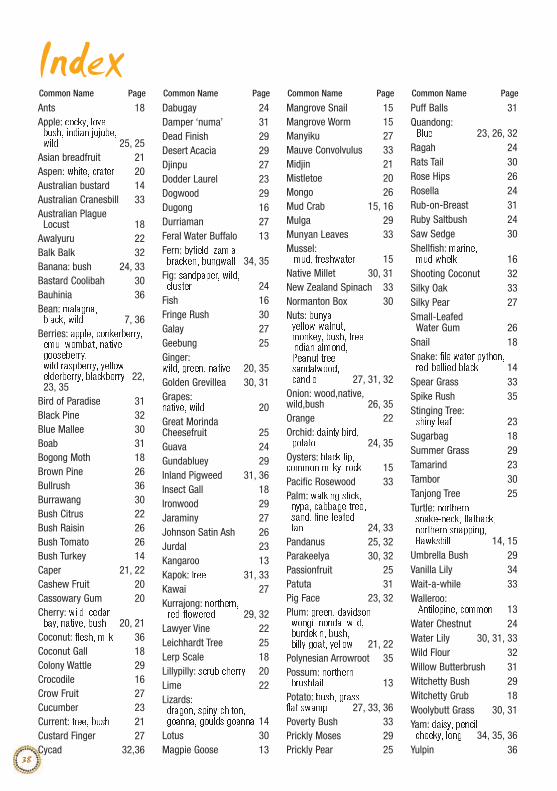
IndexAnts 18Apple: cocky, love,bush, indian jujube,wild 25, 25
Asian breadfruit 21Aspen: white, crater 20Australian bustard 14Australian Cranesbill 33Australian Plague
Locust 18Awalyuru 22Balk Balk 32Banana: bush 24, 33Bastard Coolibah 30Bauhinia 36Bean: malagna,black, wild 7, 36
Berries: apple, conkerberry,emu, wombat, nativegooseberry,wild raspberry, yellowelderberry, blackberry 22,23, 35
Bird of Paradise 31Black Pine 32Blue Mallee 30Boab 31Bogong Moth 18Brown Pine 26Bullrush 36Burrawang 30Bush Citrus 22Bush Raisin 26Bush Tomato 26Bush Turkey 14Caper 21, 22Cashew Fruit 20Cassowary Gum 20Cherry: wild, cedarbay, native, bush 20, 21
Coconut: flesh, milk 36Coconut Gall 18Colony Wattle 29Crocodile 16Crow Fruit 27Cucumber 23Current: tree, bush 21Custard Finger 27Cycad 32,36
Dabugay 24Damper ‘numa’ 31Dead Finish 29Desert Acacia 29Djinpu 27Dodder Laurel 23Dogwood 29Dugong 16Durriaman 27Feral Water Buffalo 13Fern: byfield, zamia,bracken, bungwall 34, 35
Fig: sandpaper, wild,cluster 24
Fish 16Fringe Rush 30Galay 27Geebung 25Ginger:wild, green, native 20, 35Golden Grevillea 30, 31Grapes:native, wild 20Great Morinda Cheesefruit 25Guava 24Gundabluey 29Inland Pigweed 31, 36Insect Gall 18Ironwood 29Jaraminy 27Johnson Satin Ash 26Jurdal 23Kangaroo 13Kapok: tree 31, 33Kawai 27Kurrajong: northern,red-flowered 29, 32
Lawyer Vine 22Leichhardt Tree 25Lerp Scale 18Lillypilly: scrub cherry 20Lime 22Lizards:dragon, spiny chiton,goanna, goulds goanna 14
Lotus 30Magpie Goose 13
Mangrove Snail 15Mangrove Worm 15Manyiku 27Mauve Convolvulus 33Midjin 21Mistletoe 20Mongo 26Mud Crab 15, 16Mulga 29Munyan Leaves 33Mussel:mud, freshwater 15
Native Millet 30, 31New Zealand Spinach 33Normanton Box 30Nuts: bunya,yellow walnut,monkey, bush, tree,indian almond,Peanut tree,sandalwood,candle 27, 31, 32
Onion: wood,native,wild,bush 26, 35Orange 22Orchid: dainty bird,potato 24, 35
Oysters: black lip,common milky, rock 15Pacific Rosewood 33Palm: walking stick,nypa, cabbage tree,sand, fine-leafedfan 24, 33
Pandanus 25, 32Parakeelya 30, 32Passionfruit 25Patuta 31Pig Face 23, 32Plum: green, davidson,wongi, nonda, wild,burdekin, bush,billy goat, yellow 21, 22
Polynesian Arrowroot 35Possum: northernbrushtail 13
Potato: bush, grass,flat swamp 27, 33, 36Poverty Bush 33Prickly Moses 29Prickly Pear 25
Puff Balls 31Quandong:Blue 23, 26, 32
Ragah 24Rats Tail 30Rose Hips 26Rosella 24Rub-on-Breast 31Ruby Saltbush 24Saw Sedge 30Shellfish: marine,mud whelk 16
Shooting Coconut 32Silky Oak 33Silky Pear 27Small-Leafed
Water Gum 26Snail 18Snake: file,water python,red-bellied black 14
Spear Grass 33Spike Rush 35Stinging Tree:shiny leaf 23
Sugarbag 18Summer Grass 29Tamarind 23Tambor 30Tanjong Tree 25Turtle: northernsnake-neck, flatback,northern snapping,Hawksbill 14, 15
Umbrella Bush 29Vanilla Lily 34Wait-a-while 33Walleroo:Antilopine, common 13
Water Chestnut 24Water Lily 30, 31, 33Wild Flour 32Willow Butterbrush 31Witchetty Bush 29Witchetty Grub 18Woolybutt Grass 30, 31Yam: daisy, pencil,cheeky, long 34, 35, 36
Yulpin 36
Common Name Page Common Name Page Common Name Page Common Name Page
RENAL RESOURCE CENTRE37 Darling Point Road
Darling Point NSW 2027AUSTRALIA
Tel: +61 2 9362 3995Fax: +61 2 9362 4354Freecall: 1800 257 189
www.renalresource.com
AMB-033
Additional copies of this book are available from