business cycles - des moines area community college
TRANSCRIPT
Business Cycles
Business Cycle
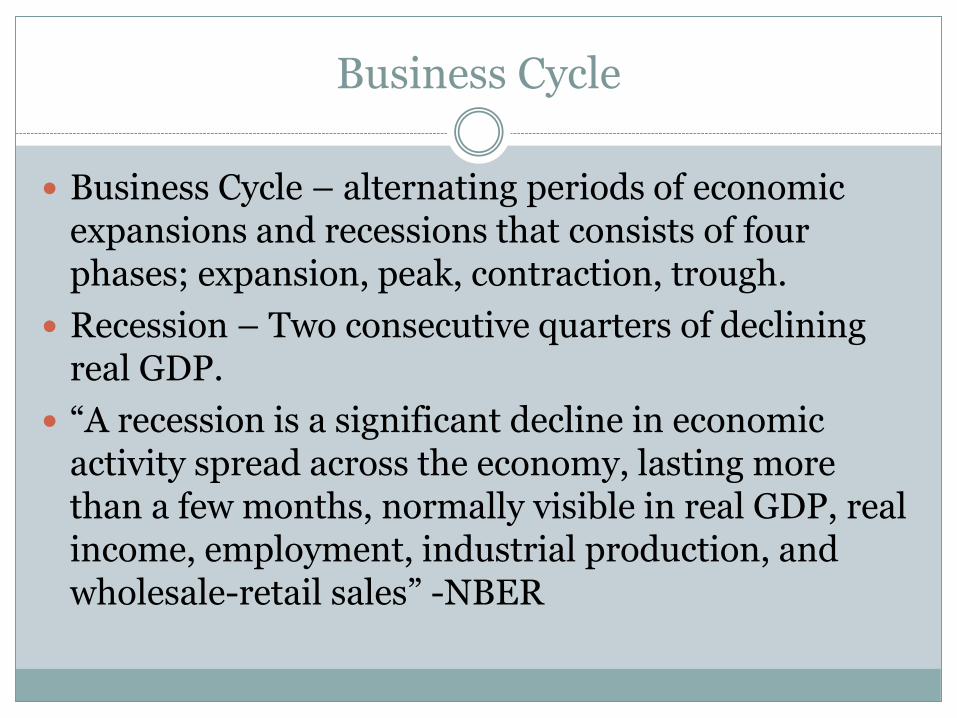
Business Cycle – alternating periods of economic expansions and recessions that consists of four phases; expansion, peak, contraction, trough.
Recession – Two consecutive quarters of declining real GDP.
“A recession is a significant decline in economic activity spread across the economy, lasting more than a few months, normally visible in real GDP, real income, employment, industrial production, and wholesale-retail sales” -NBER
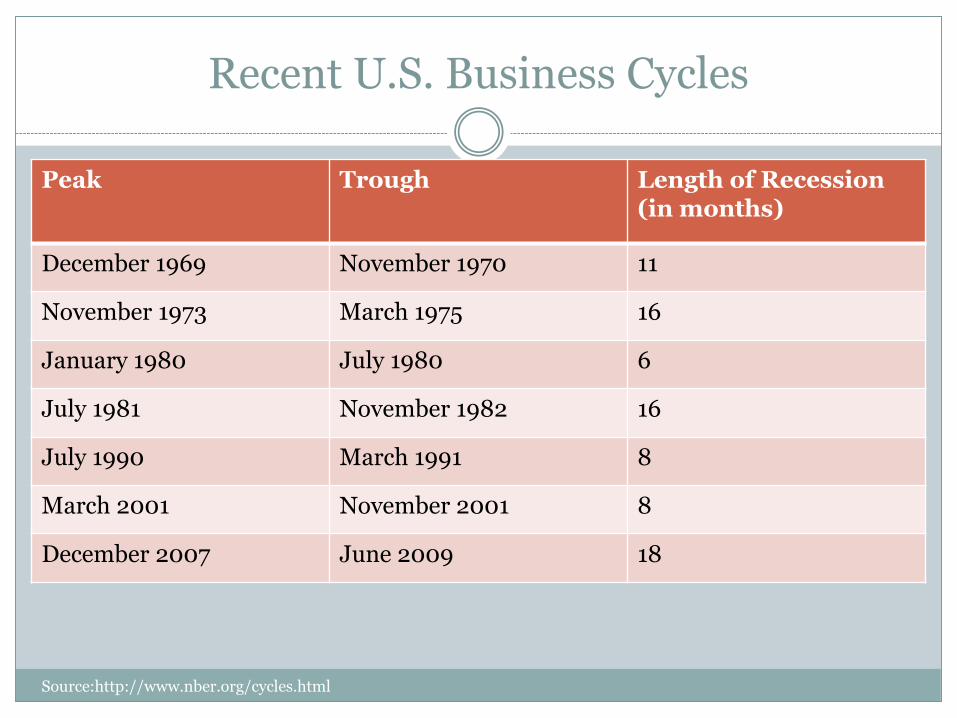
Recent U.S. Business Cycles
Source:http://www.nber.org/cycles.html
Peak Trough Length of Recession (in months)
December 1969 November 1970 11
November 1973 March 1975 16
January 1980 July 1980 6
July 1981 November 1982 16
July 1990 March 1991 8
March 2001 November 2001 8
December 2007 June 2009 18
What happens during a business cycle?
Each business cycle is different, but many share certain characteristics
As the economy nears the end of expansion, interest rates are usually rising and wages are rising faster than prices. As a results, the firm’s profits begin to fall.
Both households and firms have increased their debt as a result of borrowing to finance their spending and investment during the expansion.
What happens during a business cycle?
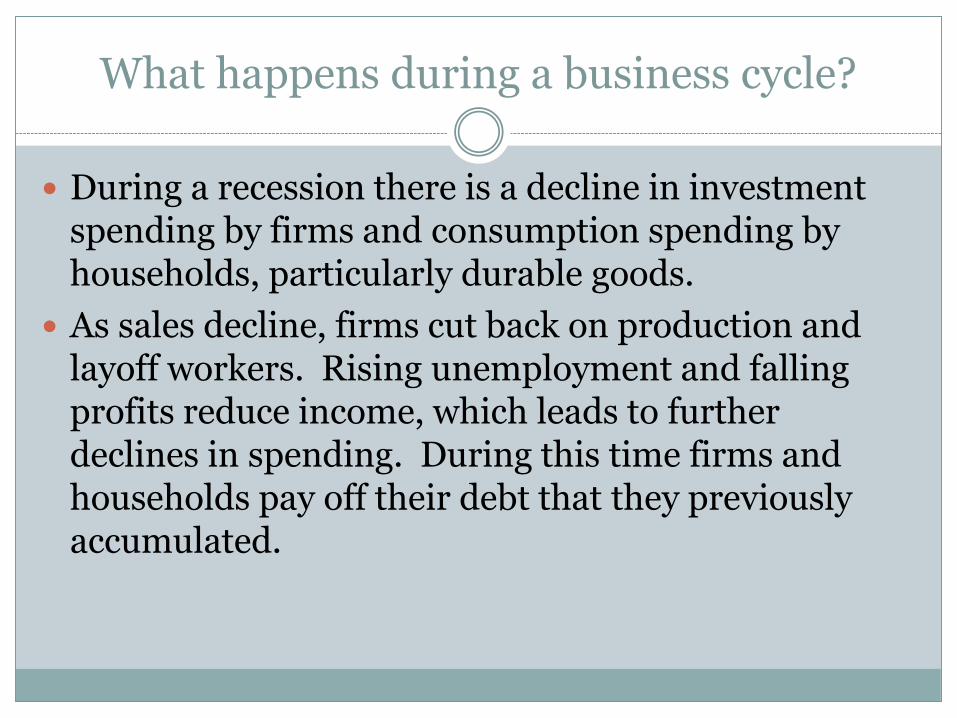
During a recession there is a decline in investment spending by firms and consumption spending by households, particularly durable goods.
As sales decline, firms cut back on production and layoff workers. Rising unemployment and falling profits reduce income, which leads to further declines in spending. During this time firms and households pay off their debt that they previously accumulated.
What happens during a business cycle?
As the recession comes to an end, households and firms start to spend more as they pay down their debt. Interest rates decline, which spur increases in spending and investment.
To Summarize
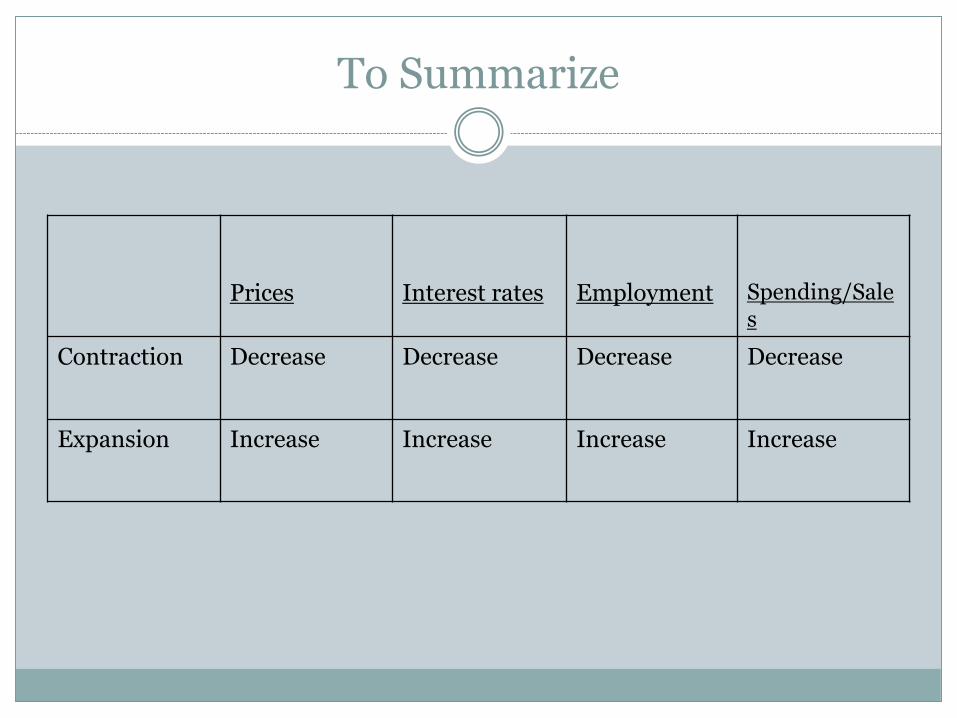
Prices Interest rates Employment Spending/Sales
Contraction Decrease Decrease Decrease Decrease
Expansion Increase Increase Increase Increase
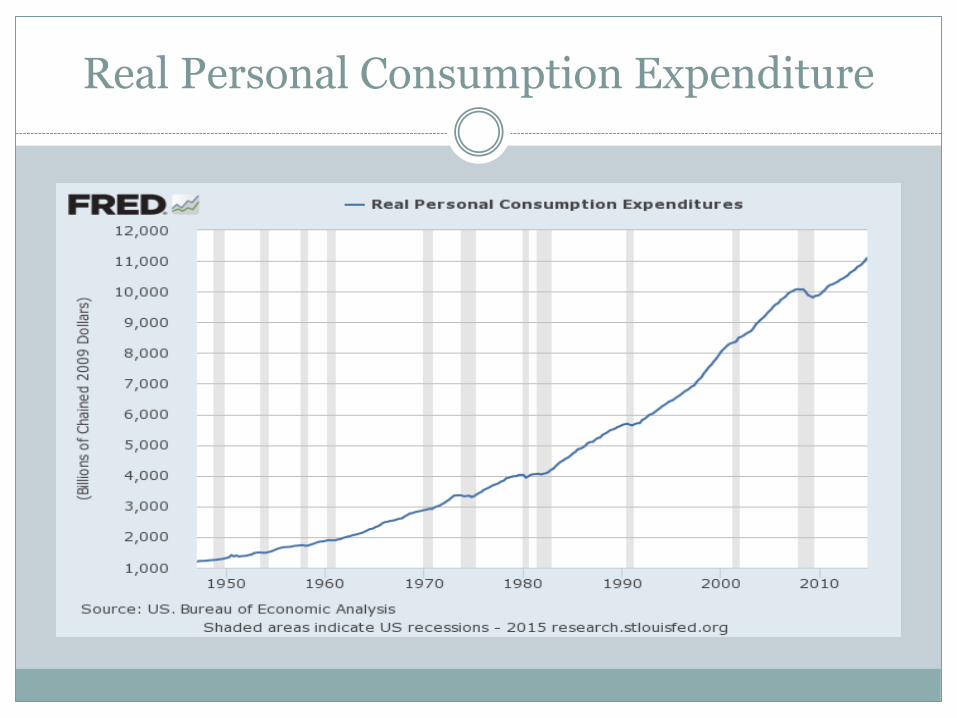
Real Personal Consumption Expenditure
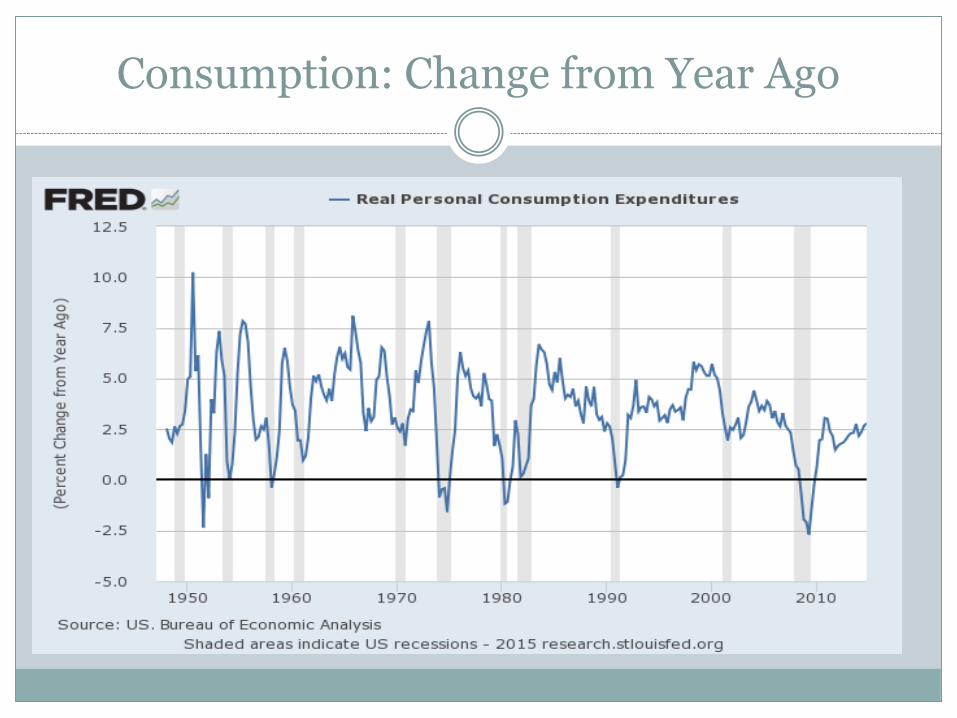
Consumption: Change from Year Ago
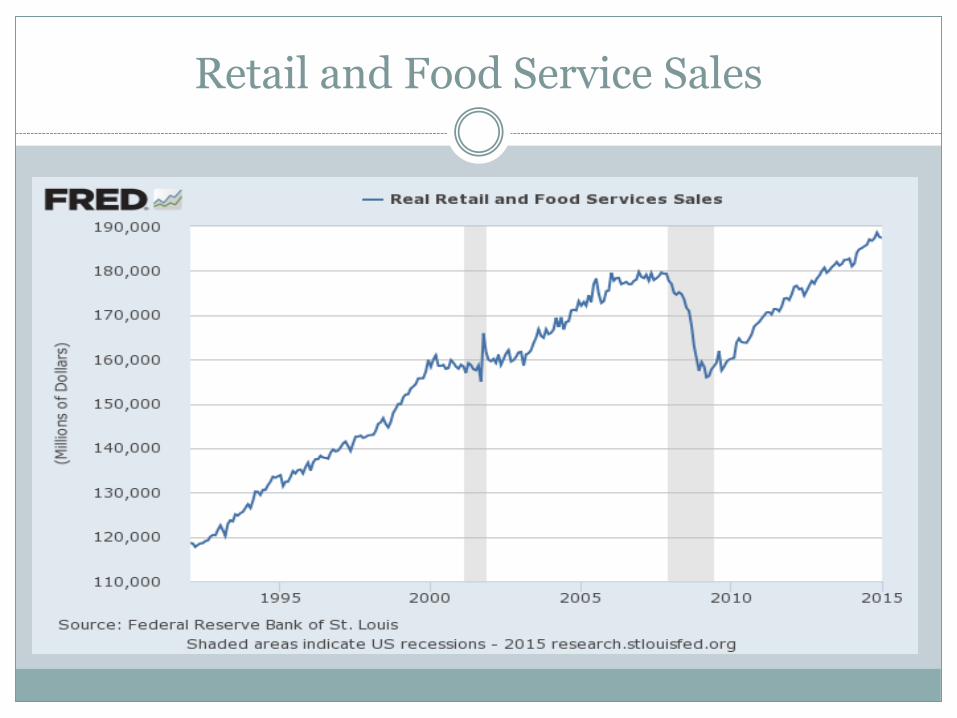
Retail and Food Service Sales
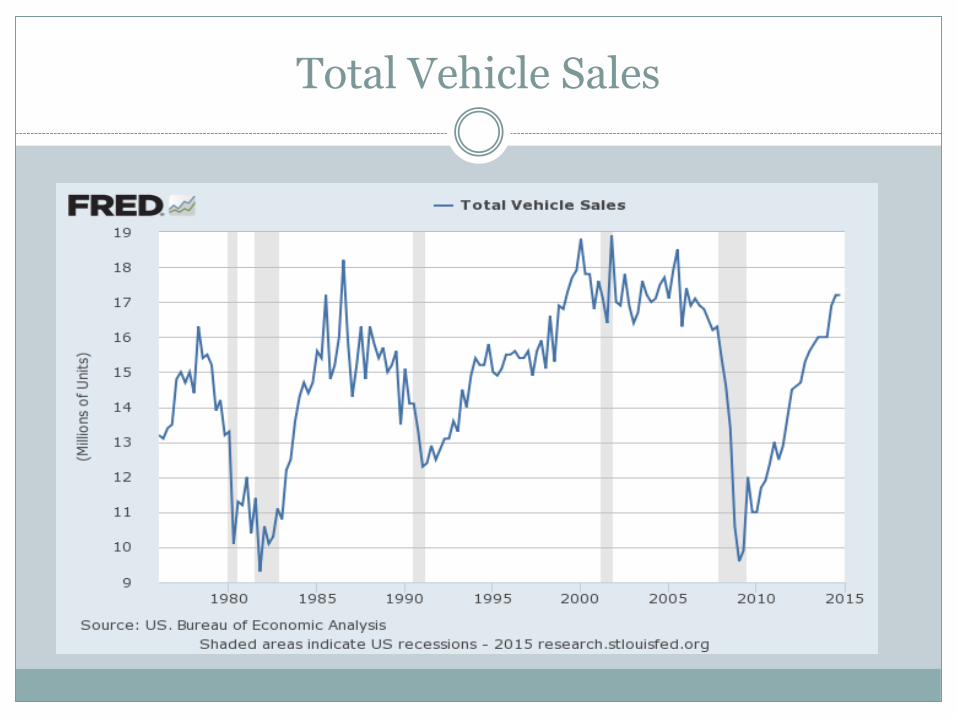
Total Vehicle Sales
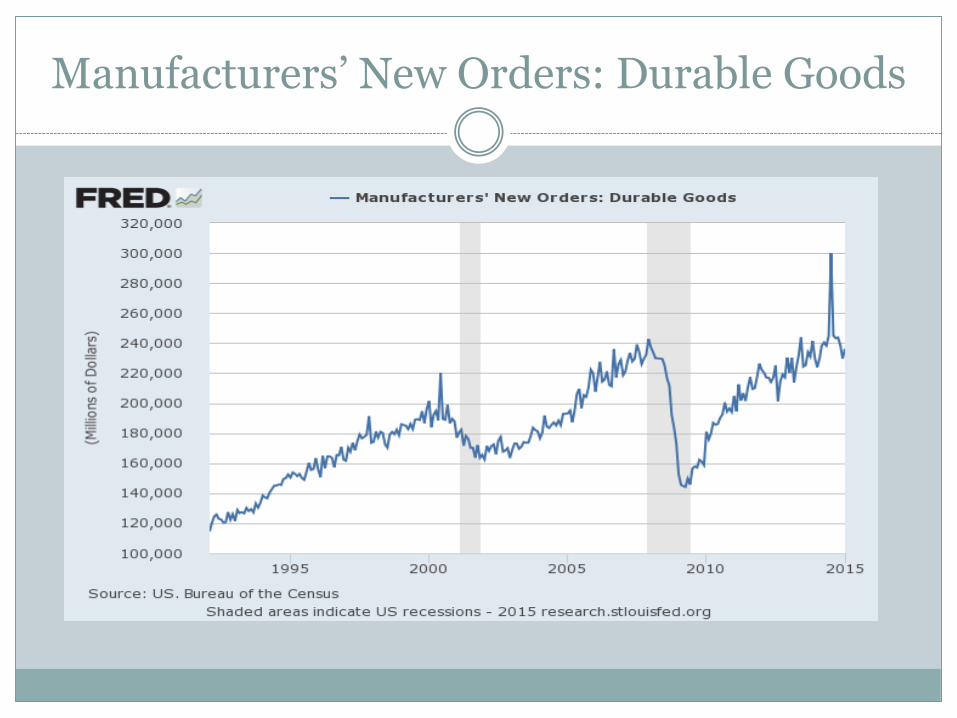
Manufacturers’ New Orders: Durable Goods
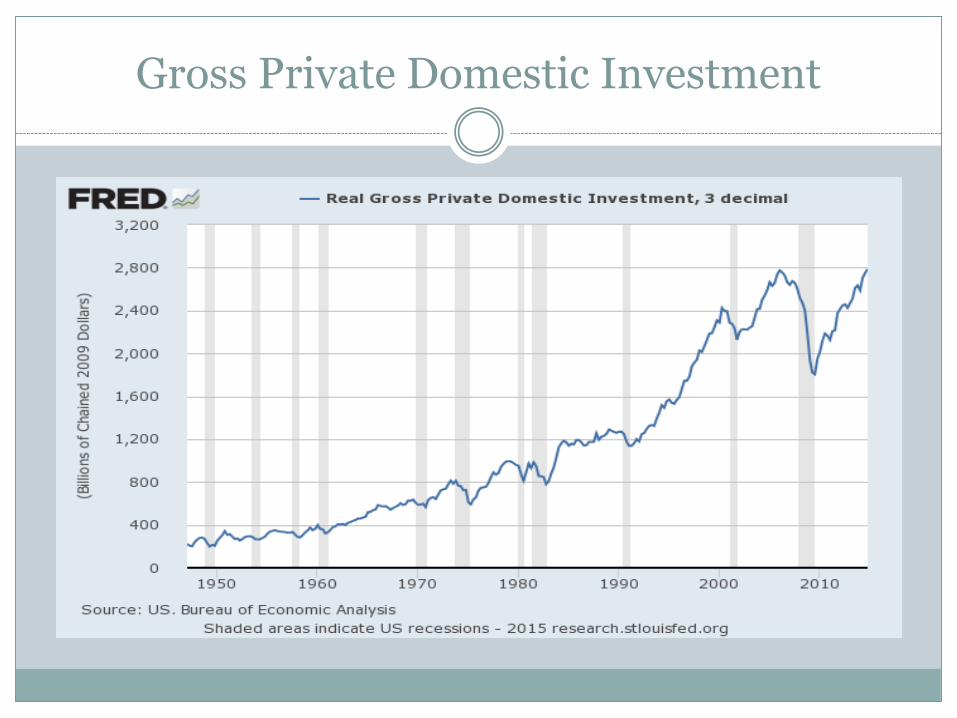
Gross Private Domestic Investment
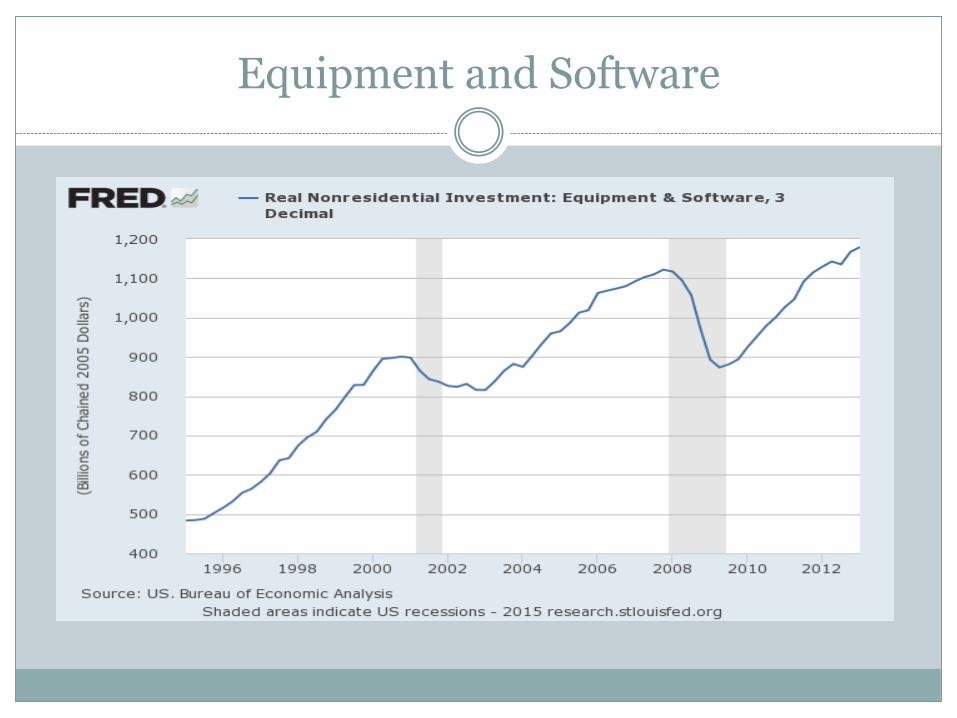
Equipment and Software
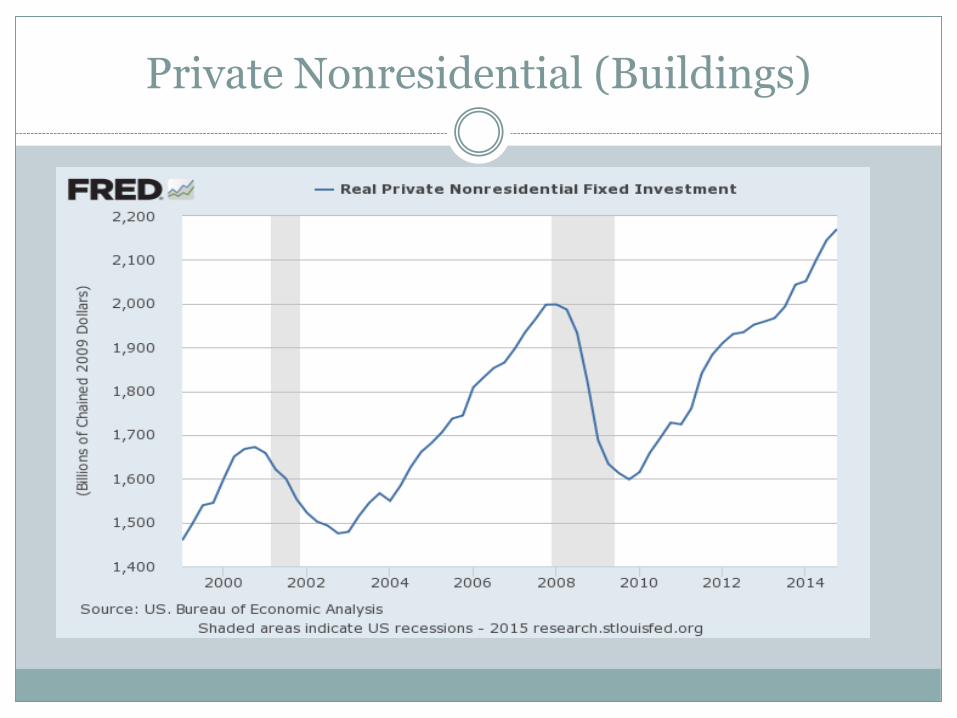
Private Nonresidential (Buildings)
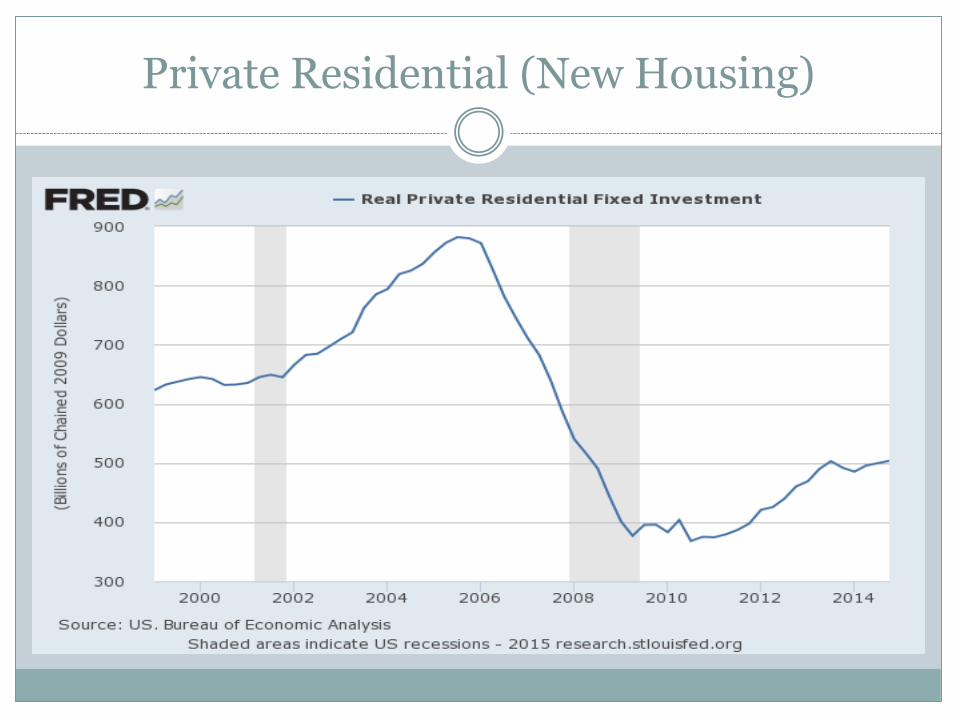
Private Residential (New Housing)
Inflation Rate and the Business Cycle
During expansions, the inflation rate typically increases and during contractions, the inflation rate typically decreases.
During expansions, spending is strong and business find it easier to raise their prices.
As spending declines during a recession, firms find it more difficult to sell their goods and are less likely to increase prices than otherwise
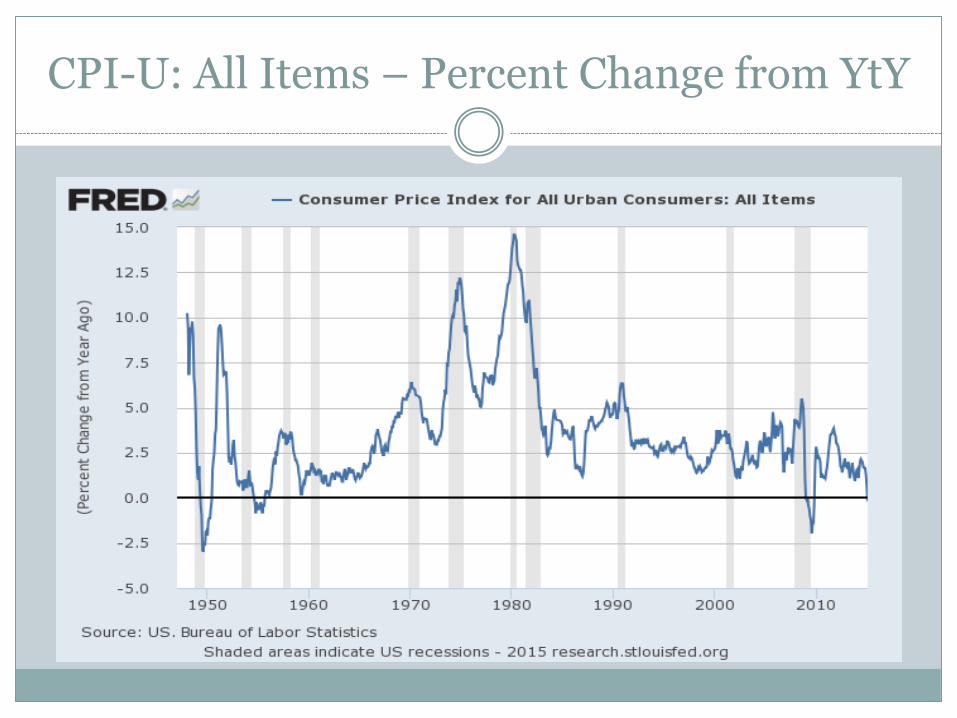
CPI-U: All Items – Percent Change from YtY
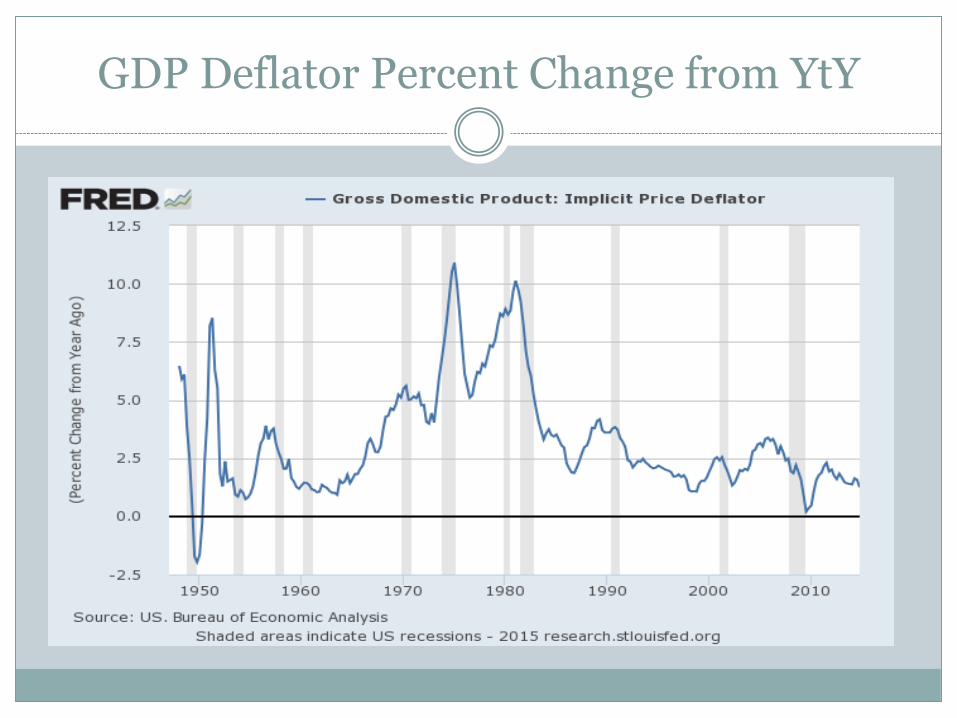
GDP Deflator Percent Change from YtY
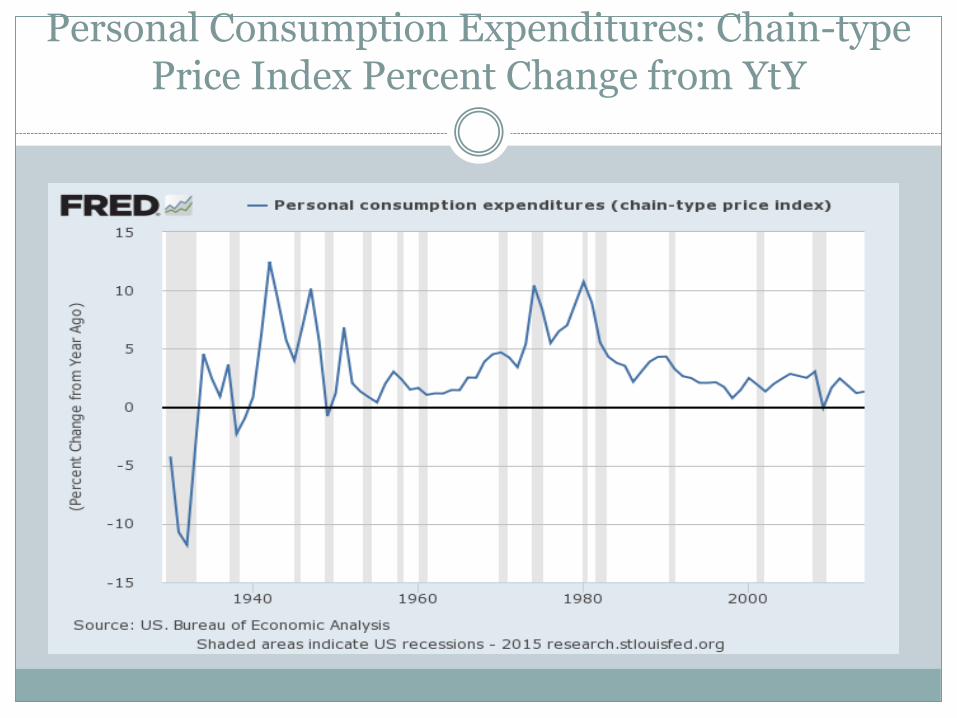
Personal Consumption Expenditures: Chain-type Price Index Percent Change from YtY
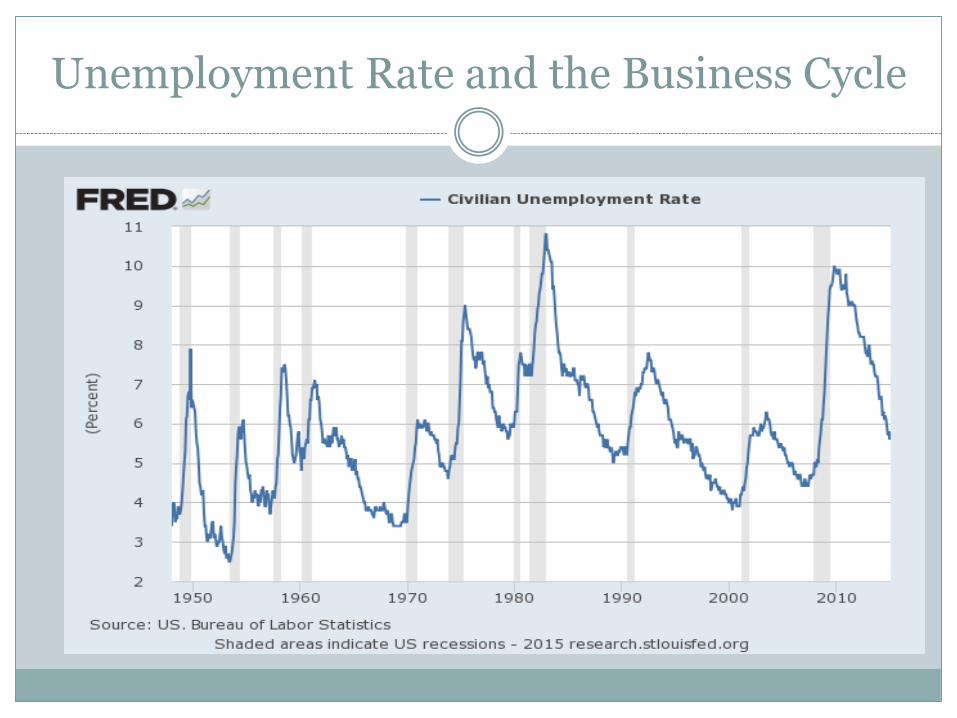
Unemployment Rate and the Business Cycle
As sales decline during a recession, firms lay workers off and as the economy picks up and spending increases, firms hire.
Unemployment is typically a lagging indicatorwhich means hiring and firing decisions happen after the economic event.
Firms usually layoff workers after we enter into a recession and don’t hire until after the economy picks back up.
Unemployment Rate and the Business Cycle
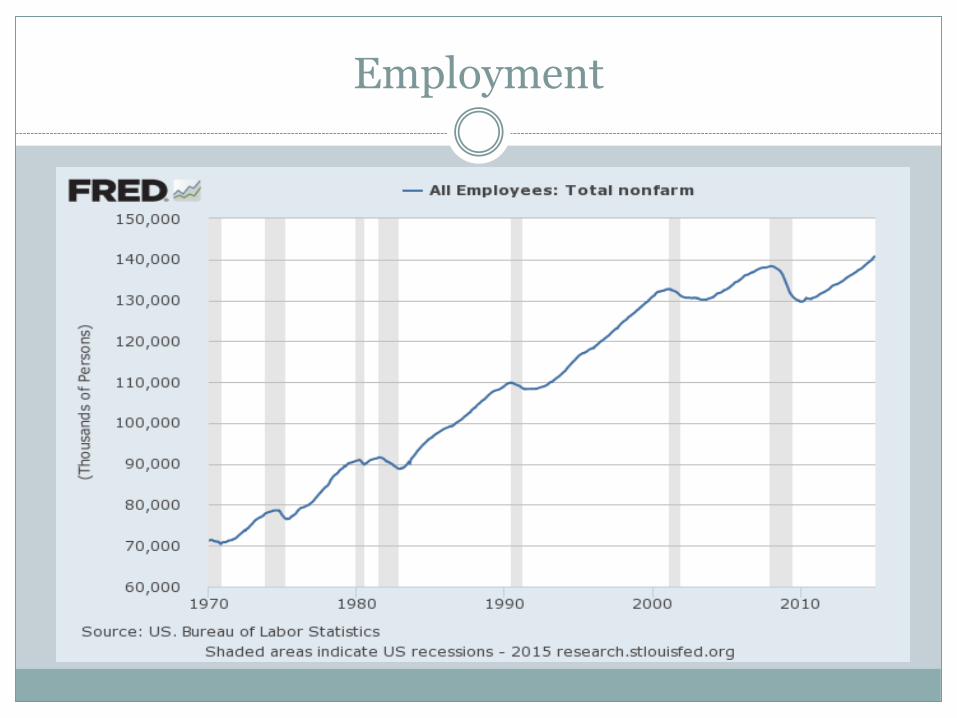
Employment
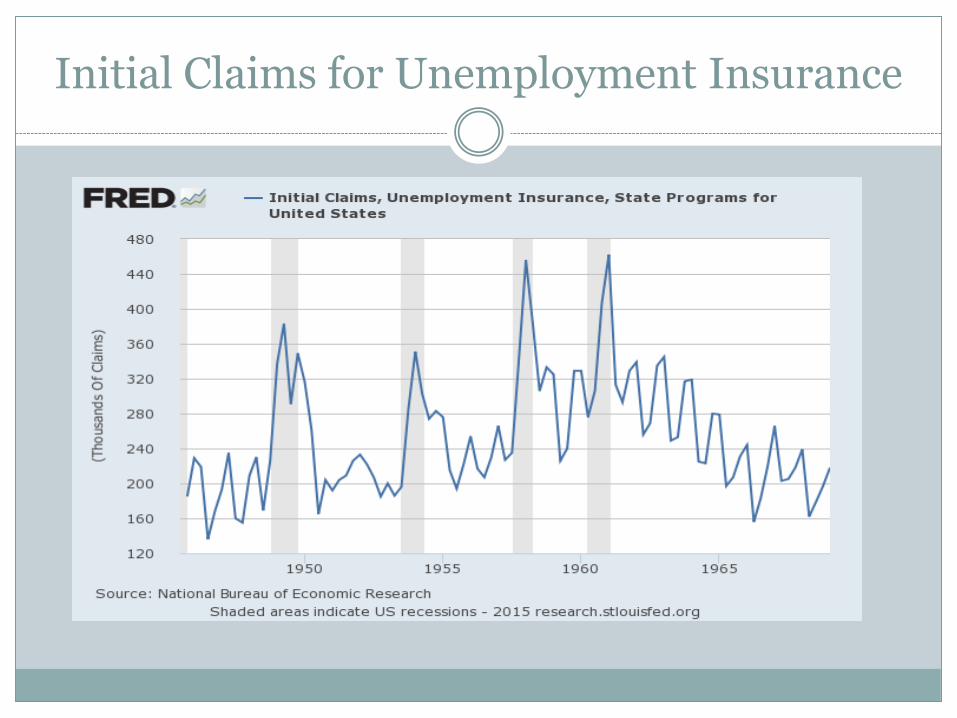
Initial Claims for Unemployment Insurance
Interest Rates and the Business Cycle
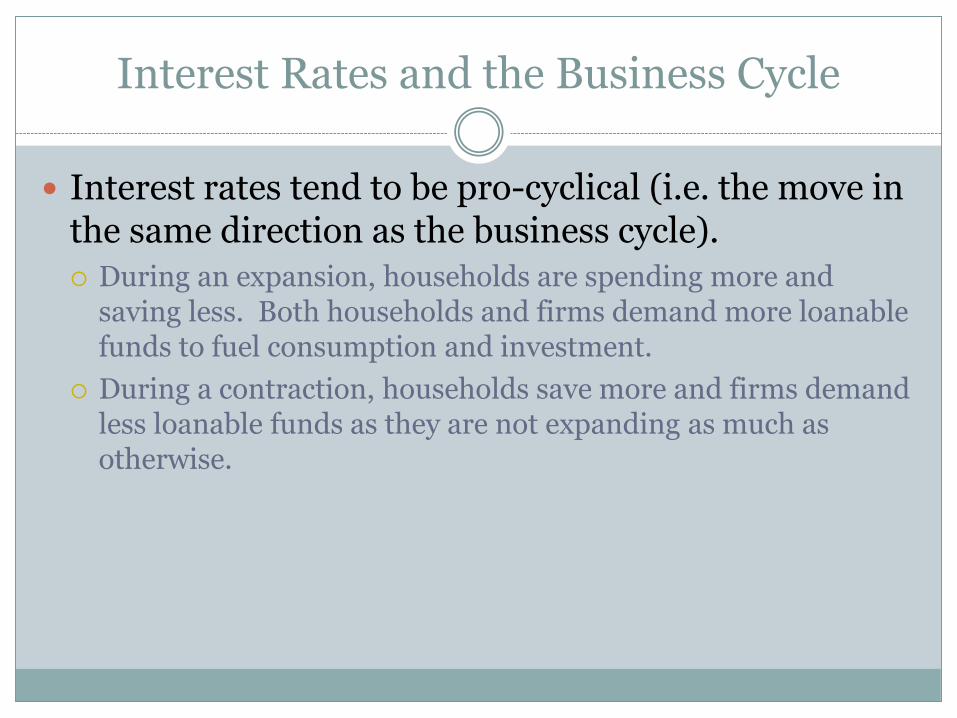
Interest rates tend to be pro-cyclical (i.e. the move in the same direction as the business cycle).
During an expansion, households are spending more and saving less. Both households and firms demand more loanable funds to fuel consumption and investment.
During a contraction, households save more and firms demand less loanable funds as they are not expanding as much as otherwise.
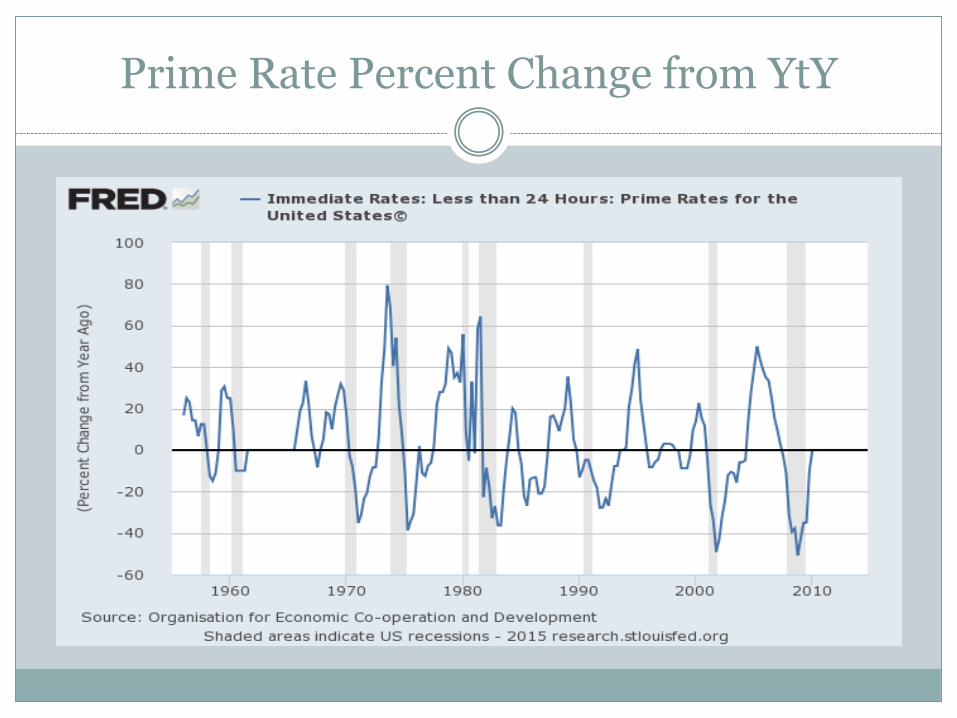
Prime Rate Percent Change from YtY
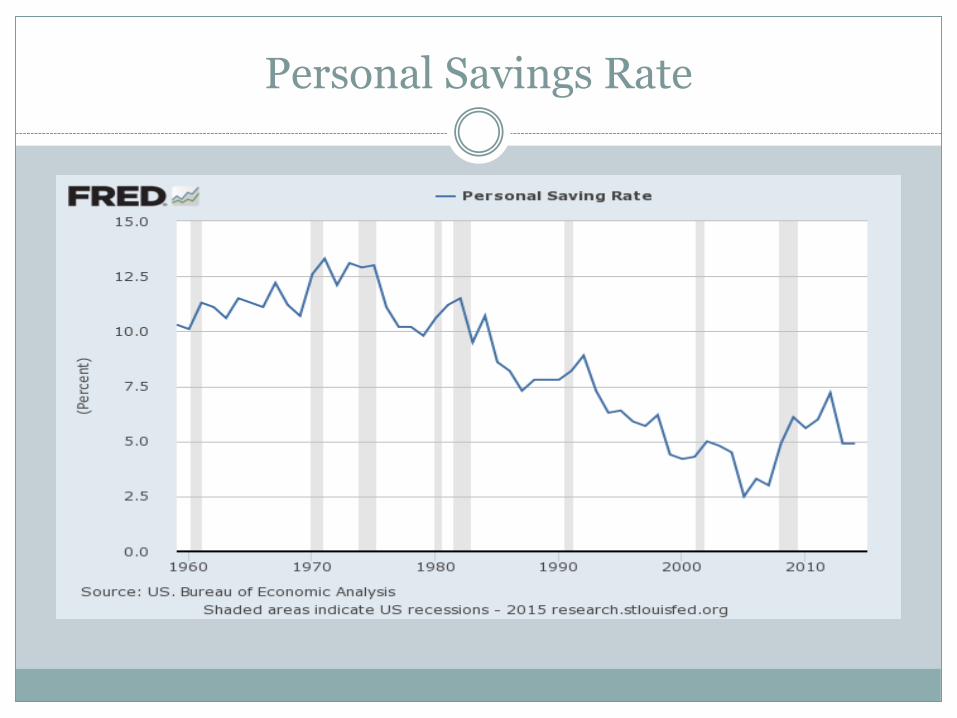
Personal Savings Rate
Leading and Lagging Indicators
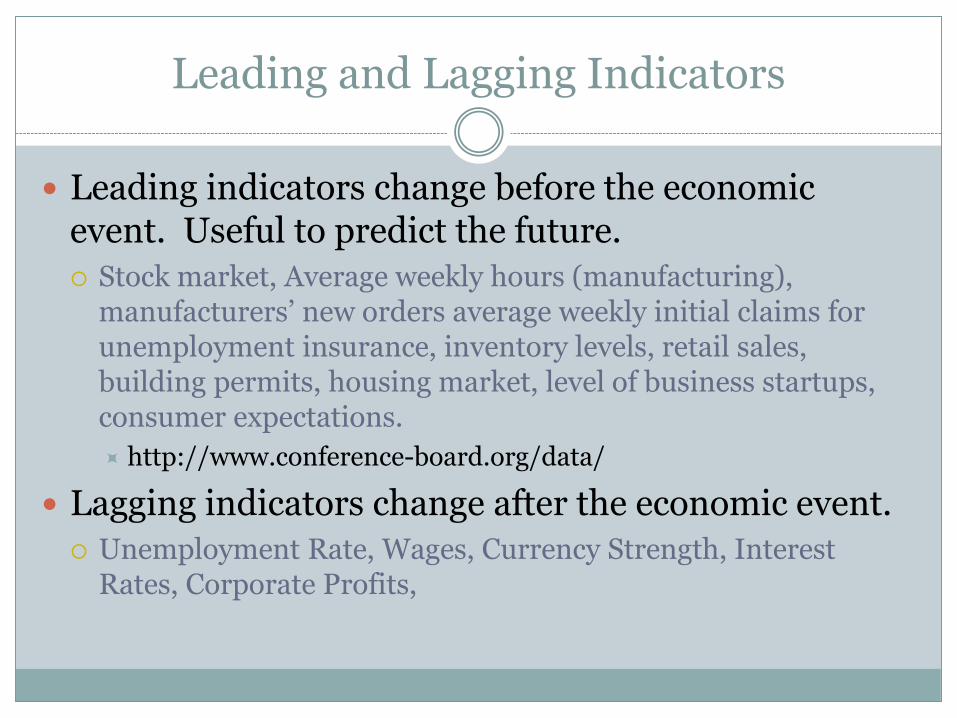
Leading indicators change before the economic event. Useful to predict the future.
Stock market, Average weekly hours (manufacturing), manufacturers’ new orders average weekly initial claims for unemployment insurance, inventory levels, retail sales, building permits, housing market, level of business startups, consumer expectations.
http://www.conference-board.org/data/
Lagging indicators change after the economic event.
Unemployment Rate, Wages, Currency Strength, Interest Rates, Corporate Profits,
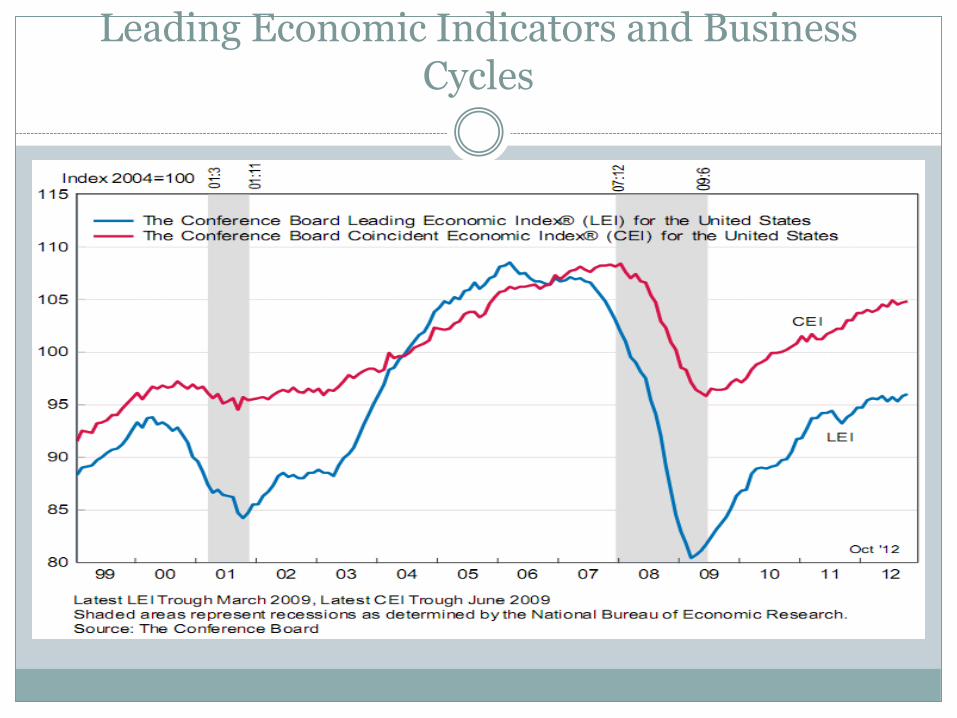
Leading Economic Indicators and Business Cycles

Business Cycles and Stability
From 1950 – 2007, the US economy experienced a period of relative economic stability, with shorter recessions, longer expansions, and less fluctuations.
This has lead to a significant improvement in economic well-being.
Causes of Relative Stability
Shift in economic composition towards services and away from manufactured goods. Manufactured goods, particularly durable goods are more susceptible to business cycles.
Establishment of unemployment insurance and other government transfer programs to provide funds to the unemployed. This helps stabilizes consumer spending.
Causes of Relative Stability
Increased stability of the financial system (at least compared to the Great Depression) which saw thousands of banks fail and a decline of more than 80% in stock prices.
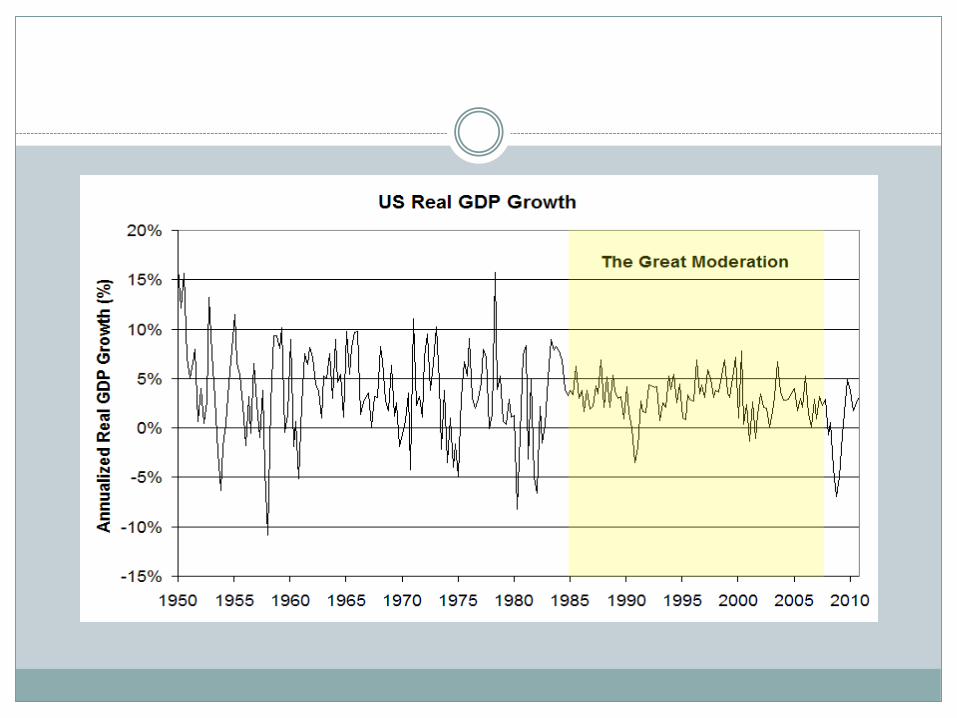
The Great Moderation
A period between the mid 1980’s and 2007 when the Business Cycle experienced even greater stability
What caused the Great Moderation?
1. Better Monetary Policy
2. Structural Changes
3. Good Luck
What caused the Great Moderation?
1. Better Monetary Policy – Output volatility and inflation volatility have a strong tendency to move together.
Monetary policy shifted more towards price stability during this time period and we have experienced mild and stable deflation, along with mild and stable growth.
What caused the Great Moderation?
2. Structural change suggest that changes in economic institutions, technology, business practices, or other structural features of the economy have improved the ability of the economy to absorb shocks.
Improved management of business inventories, shifting from manufacturing towards services, increased openness to trade, increase depth and sophistication of financial markets
What caused the Great Moderation?
3. Good Luck – Less exogenous shocks to the macro-economy, particularly oil shocks.
Oil shocks since the mid 80’s have been few and mild and nothing like the Arab oil embargo of 1973-74 or the Iranian Revolution 1979-80.
This is chalked up as “good luck”.
What caused the Great Moderation?: Another explanation
Prior to the Great Moderation period, economic gains largely accrued to workers at the middle to low end of the earnings spectrum. Wage growth led to consumer price inflation, which required a Federal Reserve intervention to tamp down.
But consumption was funded out of wages, and because wages are sticky, wringing out the inflation tended to produce a recession with a lot of unemployment.
What caused the Great Moderation?: Another explanation
Since the Great Moderation, more of the gains of economic growth have accrued to those at the top of the income ladder, who are heavy savers. These gains led not to consumer price inflation but to asset price inflation.
Meanwhile, workers at the middle to low end found themselves using debt to fund an increasing share of their consumption.
From the central banker's point of view, this has been a positive development, as borrowing is much more responsive to monetary policy than wages and prices. So you get a smoother business cycle characterised by asset bubbles.
Source: Rethinking the Great Moderation, The Economist, Oct 28th 2009
Additional Information
Plenty of charts and data
http://www.businessbookmall.com/economics_9_the_business_cycle.htm