transcript analysis of des moines area community college
TRANSCRIPT

TRANSCRIPT ANALYSIS OF DES MOINES AREA COMMUNITY
COLLEGE STUDENTS’ TRADITIONAL AND ONLINE COURSES
_______________
A Thesis
Presented to the
Faculty of
San Diego State University
_______________
In Partial Fulfillment
of the Requirements for the Degree
Master of Arts in Educational Leadership
with a Specialization in
Student Affairs Postsecondary Education
_______________
by
Crystal L. Dujowich
Summer 2010


iii
Copyright © 2010
by
Crystal L. Dujowich
All Rights Reserved

iv
DEDICATION
To my talented and dedicated committee whose advice and guidance was immeasurable.

v
This study promotes digging into the records and letting the transcripts tell the stories
-Hagedorn, L.S

vi
ABSTRACT OF THE THESIS
Transcript Analysis of Des Moines Area Community College Students’ Traditional and Online Courses
by Crystal L. Dujowich
Master of Arts in Educational Leadership with a Specialization in Student Affairs Postsecondary Education
San Diego State University, 2010
Consistent with their missions, community colleges have generally been open to adopting technologies that show promise of extending educational possibilities for students. In recent years, community colleges have added an array of online courses with the expectation that they would expand access to students who are limited by time, transportation, work, and/or family constraints. The purpose of this study is to analyze the success of online courses in comparison with traditional courses by analyzing the transcripts of students who have enrolled in both traditional and online courses. Specifically, in this study, student transcripts were analyzed from the Des Moines Area Community College (DMACC). Data was collected from the academic years of 2005 to 2009 and disaggregated by demographic and academic information. Findings indicate that significant differences in grade point average (GPA) and course completion ratio (CCR) exist between students’ performance in traditional and online courses. Specifically, students on average attain higher GPAs and CCRs in traditional courses when compared to their traditional courses. Furthermore, students’ demographic categories and course taking behaviors were positively correlated with higher rates of success in online courses.

vii
TABLE OF CONTENTS
PAGE
ABSTRACT ............................................................................................................................. vi
LIST OF TABLES ................................................................................................................... ix
ACKNOWLEDGEMENTS .......................................................................................................x
CHAPTER
1 INTRODUCTION .........................................................................................................1
Background ..............................................................................................................1
Statement of the Problem .........................................................................................2
Purpose of the Study ................................................................................................4
Theoretical Bases and Organization ........................................................................5
Limitations of the Study...........................................................................................7
Definition of Terms..................................................................................................7
2 REVIEW OF THE LITERATURE ...............................................................................9
Student Demographics ...........................................................................................10
Student Performance ..............................................................................................11
Student Perspectives ..............................................................................................12
Student Retention ...................................................................................................13
Transcript Analysis ................................................................................................14
Summary ................................................................................................................15
3 METHODOLOGY ......................................................................................................16
Design of the Investigation ....................................................................................16
Research Questions ................................................................................................16
Population ..............................................................................................................17
Treatment ...............................................................................................................17
Dependent Variables ..............................................................................................18
Independent Variables ...........................................................................................18
Course Mode ..........................................................................................................19
Data Analysis Procedures ......................................................................................19

viii
Limitations of the Study.........................................................................................19
4 RESULTS ....................................................................................................................21
Descriptive Analysis ..............................................................................................21
GPA Analysis.........................................................................................................23
Course Completion Ratios (CCR) Analysis ..........................................................26
Summary of Findings .............................................................................................31
5 SUMMARY, CONCLUSION, AND RECOMMENDATIONS .................................34
Statement of the Problem .......................................................................................34
Purpose of the Study ..............................................................................................34
Research Questions ................................................................................................36
Theoretical Bases and Organization ......................................................................36
Limitations of the Study.........................................................................................37
Methodology ..........................................................................................................38
Treatment ...............................................................................................................38
Dependent Variables ..............................................................................................38
Independent Variables ...........................................................................................39
Data Analysis Procedures ......................................................................................40
Discussion ..............................................................................................................40
Summary of Findings .............................................................................................46
Recommendations ..................................................................................................47
REFERENCES ........................................................................................................................50
APPENDIX
A CIP CODE FAMILIES ................................................................................................54
B HAGEDORN'S AGE MODEL ....................................................................................56

ix
LIST OF TABLES
PAGE
Table 1. Percentage of DMACC Students Who Enrolled in both Online and Traditional Courses ......................................................................................................21
Table 2. Frequency and Percentage of Age Group Distribution ..............................................22
Table 3. Frequency and Percentages of Age Groups Represented in Course Mode Model ...........................................................................................................................23
Table 4. Frequency and Percentage of DMACC Students Receiving Pell Grants by Course Mode ................................................................................................................23
Table 5. DMACC Students’ Mean GPA Scores in Traditional and Web Courses by Demographics ..............................................................................................................25
Table 6. DMACC Students’ Correlation and Paired Difference Statistics in GPA Scores of Traditional and Web Courses by Demographics .........................................26
Table 7. DMACC Students’ Correlation Coefficients of their Mean Traditional and Web GPA’s by CIP Code ............................................................................................27
Table 8. DMACC Students’ Correlation Coefficients of their Mean Traditional and Web GPA’s by Ethnicity .............................................................................................28
Table 9. Comparison of DMACC Students’ Mean Differences in GPA by Ethnicity ............28
Table 10. DMACC Students’ Mean Course Completion Ratios (CCR) in Traditional and Web Courses by Demographics ............................................................................29
Table 11. DMACC Students’ Correlation and Paired Difference Statistics of Course Completion Ratios (CCR) in Traditional and Web Courses by Demographics ..........30
Table 12. DMACC Students’ Correlation Coefficients of their Mean Traditional and Web Course Completion Ratios (CCR) by CIP Code .................................................31
Table 13. DMACC Students’ Correlation Coefficients of their Mean Traditional and Web Course Completion Ratios (CCR) by Ethnicity ..................................................32
Table 14. Comparison of DMACC Students’ Mean Differences in Course Completion Ratios (CCR) by Ethnicity ...........................................................................................32
Table 15. CIP Code Family Chart ............................................................................................55
Table 16. Hagedorn's Age Model Table ..................................................................................57

x
ACKNOWLEDGEMENTS
I would like to individually recognize the faculty who served on my committee:
Thank you, Dr. Marilee Bresciani, for serving as my chair and providing me with
your time, critical feedback, and guidance. Your insight and direction has polished my thesis
and shaped my experience.
Thank you, Dr. McFarlane, for your friendship and guidance throughout this
program. Your counsel has been sought in times of need and your support has fueled my
academic success.
Thank you, Dr. Ian Pumpian, for assisting me with this process and your time.
Thank you, Dr. Linda Serra Hagedorn, for without your instruction and personal
guidance this thesis would not have existed. Your esteemed expertise in this particular
subject matter was beyond expectations. On a personal note, I had a wonderful year under
your supervision and care in Iowa. You undoubtedly deserve every accolade that may come
your way.
I would also like to thank Des Moines Area Community College (DMACC) for their
cooperation. In particular, I would like to thank Dr. Joseph Dehart for his time, effort, and
assistance.
1
CHAPTER 1
INTRODUCTION
BACKGROUND
The history of online course offerings has been brief in comparison to traditional
course offerings. Since technology has recently permitted the development of online courses,
research on this area only spans thirty-five years (Scigliano, 2000). However, as a form of
distance education, online learning has evolved through the progression of three distinct
generations (Nipper,1989). Nipper (1989) was one of the first researchers to divide these
generations upon the basis of their “development of production, distribution and
communication technologies” (p. 63).
The first generation of distance education was predominantly comprised of
correspondence study (Nipper, 1989). While historians and scholars alike may make
arguments for earlier usages of distance education, this pedagogy was not widely used until
the onset of the Industrial Revolution in the nineteenth century (Sumner, 2000). The first
recorded correspondence course in shorthand was offered by Isaac Pitman in England in
1840 (Verduin & Clark, 1991). Correspondence courses were marked largely by the use of
the postal system to deliver printed materials to the student. This enabled many rural
populations, societies colonized by the British, and women to attain some form of education.
By the beginning of the twentieth century, audiences expanded for correspondence
and distance education courses. Elementary, secondary, postsecondary, and vocational
students had found practical use of the pedagogy (Willis, 1994). In fact, 48 institutions of
higher education were granting doctorates through the implementation of distance learning in
the early twentieth century (Portman, 1978). While growth was not rapid, the use of distance
education continued to steadily increase unchanged until the 1960’s.
The second generation of distance education instituted multi-media education
(Nipper, 1989). Educators utilized radio, recordings, television, and limited computer
technology in their pedagogy (Nipper, 1989). Additionally, it is important to note that these
technologies were used in conjunction with printed materials and did not replace or do away

2
with the use of printed media. Perhaps, one of the most significant advances during this time
of distance education was the application of two-way communication (Sumner, 2000).
Previously, distance education through correspondence remained a predominantly one-way
form of communication due to the lag in response time of the postal service (Sumner, 2000).
However, due to the increased support in technology and distance education, students had the
ability to more readily communicate with instructors (Sumner, 2000).
During the 1990’s, the third generation of computer-mediated distance education
experienced rapid growth in technology (Sumner, 2000). Now in the twenty-first century, the
computer remains the predominant and driving technological tool behind distance education
in what Nobel (1995) claims is the second Industrial Revolution. Computer technology has
opened access to a variety of pedagogical techniques including: internet research, chat rooms,
blogs, modular course-work, Webinars, and video conferencing to name a few. In particular,
online courses have seen unprecedented growth in higher education. In 2006, more than 96%
of the largest colleges and universities in the United States offered online courses with 3.1
million U.S. students enrolled in at least one online course during the fall 2005 term (Allen &
Seaman, 2006). Despite its rapid growth, little is known about student success in online
courses (Aragon & Johnson, 2008; Doherty, 2006).
STATEMENT OF THE PROBLEM
While Iowa’s public high school diploma attainment percentage is above the national
average, its college degree attainment falls below both the Midwest and National averages
(Iowa Department of Education, 2008). In the 2007-2008 academic year, 82.8% of all Iowa
postsecondary courses taken by public high school graduates were offered by community
colleges (Iowa Department of Education, 2008). Furthermore, the largest percentage of
public high school graduates reported intending to pursue education at a community college
(Iowa Department of Education, 2008). This percentage has increased since 1998 when
30.9% of public high school graduates were pursuing or intending to pursue higher education
at a community college to 39.2% in 2008 (Iowa Department of Education, 2008). Thus, the
majority of Iowa’s public school system graduates require access to community college
systems. Like many Midwestern states, Iowa has a large rural population. This population in

3
particular, has a higher demand for community colleges as compared to Iowa’s urban
population (Iowa Department of Education, 2008).
Consistent with their missions, community colleges have generally been open to
adopting technologies that show promise of extending educational opportunities for students.
In recent years, the growing number of online courses has provided students additional
access particularly, those students who are limited by time, transportation, work, disability
and/or family constraints. The purpose of community colleges is “to provide access to a
postsecondary credential for students who may not otherwise be able to attend college”
(O’Gara, Karp, & Hughes, 2009, p. 3). Thus, community colleges typically have higher
enrollments of disadvantaged students, students of color, and low-income students than their
four-year counter parts (O’Gara et al., 2009). Despite increased efforts in student success,
community college students continue to demonstrate below average achievement. Bailey,
Jenkins, and Leinbach (2005) reported that six years after their first enrollment, 47% of
community college students in their study had dropped out without earning a degree or
credential. More troubling, however, are the numbers indicating drop-out rates are 20%
higher in online courses than in traditional face-to-face courses (Aragon & Johnson, 2008;
Doherty, 2006).
This study analyzed the transcripts and college records of approximately 12,000
students who have enrolled in both online and traditional courses within the academic years
of 2005 to 2009 at Des Moines Area Community College (DMACC). This is a unique group,
as the sample only includes an individual if they have completed, in full, at least one online
course and one traditional course at DMACC. In this manner, students were used as their
own controls. The study used demographic information as recorded in student files as well as
transcript level data containing grades and course types. The specific research questions
were:
1. What are the demographic characteristics of students who enroll in both traditional and online courses? Do they differ in terms of gender, age, ethnicity, or financial aid?
2. Among students who take both online and traditional courses, how do students differ when considering the distribution of web to traditional courses? What factors are responsible for discriminating between students who are traditional dominant, web-balanced, and web-dominant?

4
3. Among students who take both online and traditional courses, how do course grade point averages (GPA’s) differ between traditional and online courses? Are there significant differences in GPA based upon student demographic or on course mode?
4. Among students who take both online and traditional courses, how do course completion rates differ between the two course types? Are there significant differences in course completion rates based upon student demographic or on course mode?
The null hypotheses tested for this study was that there are no significant differences
in a student’s ability to perform in an online course verses a traditional course.
PURPOSE OF THE STUDY
In 2006-2007 there were over 6 million students enrolled in community colleges in
the U.S. and 1,045 public community colleges (Provasnik & Planty, 2008). Additionally, in
2005-2006 over 1.5 million students enrolled in community colleges had taken at least one
online course (Allen & Seaman, 2006). In fact, with 3.1 million students enrolled in at least
one online course in the U.S., the majority of online students are enrolled in a community
college (Allen & Seaman, 2006). Thus, due to the overwhelming large percentage of drop-
out rates for online courses (Maxwell, 2003) and the rapidly increasing number of online
courses (Allen & Seaman, 2006), the literature strongly suggests a need to understand
enrollment patterns and characteristics of these students (Aragon & Johnson, 2008; Doherty,
2006; Maxwell, 2003). As Maxwell (2003) summarized, community colleges know little
about the populations who are enrolling in online courses. Failure to find effective ways of
delivering online courses at the community college level will ultimately result in low
retention rates. In states that have large rural populations like Iowa, successful retention in
online courses will be hugely beneficial to students who are at a disadvantage due to physical
access and transportation. Furthermore, Iowa has a particular need to focus on online course
success due to the large percentage of students who intend on attaining postsecondary
training at the community college level. This percentage has increased since 1998 when
30.9% of public high school graduates were pursuing or intending to pursue higher education
at a community college to 39.2% in 2008 (Iowa Department of Education, 2008). These
students now constitute Iowa’s largest population of postsecondary bound students.
Furthermore, the community colleges themselves, believe that the successful implementation
and offering of online courses will keep them accessible and competitive (Cox, 2005). Thus,

5
community colleges may be well advised to explore and better understand the students who
are taking online courses.
Some of the earlier studies of online courses success have examined demographic
background (Carr, 2000; Diaz 2002; Nesler, 1999; Parker, 1999). Yet in these studies, online
students were compared to traditional students. Similarly, several studies have already
compared completion and non-completion rates in online courses (Aragon & Johnson, 2008;
Bangurah, 2004; Doherty, 2006). However, in Bangurah’s (2004) and Doherty’s (2006)
studies, comparisons were made not by the individual student but by courses offered by the
same instructor in both traditional and online settings. Additionally, Aragon and Johnson
(2008) designed their study to compare completers and non-completers in only an online
setting. In their review of educational research, Tallent-Runnels et al. (2006) reported on 76
online course research articles. However, despite the numerous surveys, comparisons
between online and traditional courses, and GPA-analyses, none of the research articles
analyzed the transcript data of students who enrolled in both traditional and online courses
using students as their own controls. Thus, the research failed to ascertain if differences were
due to the student attributes that lead to online enrollment or if the differences were due to
course delivery options. Moreover, previous studies have overlooked the individual’s success
and differences in these two settings. This study analyzed the transcripts of students who
have enrolled in both online and traditional courses within the academic year of 2005 until
the fall of 2008. In doing so, the study provided demographic information in the form of
student files which were analyzed with students’ records of grade, course type, major, and
retention.
THEORETICAL BASES AND ORGANIZATION
The framework of this study is based on the work of three scholars. First, the work of
Carol Kozeracki provides a historical framework to the purpose of this study. Kozeracki
(1999) published the work of the Center for the Study of Community Colleges which,
examined distance education and provided insight to the method of transmission and
geographical concentration of these courses. At the time, online courses were not the most
common form of distance education. However, the overwhelming majority of distance
education courses offered at community colleges was concentrated in the central region of
6
the United States. In particular, Iowa was among the top three states offering opportunities
for distance education. In her work, Kozeracki reviewed literature which did not find any
differences in success in traditional verses distance education courses like Hammond (1997),
McHenry and Bozik (1997), and Russel (1999) but cited conflicting expert opinions on what
the impact of new digital technologies would have on distance education like Gladieux and
Swail (1999), Easterday (1997), and Monaghan (1995). Furthermore, Kozeracki’s work
concluded that online courses and distance education remained a small percentage of the
overall community college curriculum at less than two percent of the offerings but had
significantly different levels of activity and offerings than traditional four-year institutions.
Thus, due to the tremendous growth in online course offerings and the significant reputation
of Iowa’s distance education programs, comparing Kozeracki’s analysis with this study’s
findings will provide insight into how online courses have shifted or maintained the
paradigm of traditional and distance education.
Second, this study draws upon the foundation of transcript analysis as described by
Clifford Adelman. To date, Adelman remains the only scholar to analyze transcripts at a
national level (Adelman, 1999, 2004, 2006). Through his work in the U.S. Department of
Education, Adelman has laid the foundation for and supported the validity of predicting
grades, course completion, and student retention through transcript analysis. More
specifically, Adelman (2006) detailed that student academic momentum can be traced
through transcripts. In essence, academic momentum describes the student’s course of
movement through curriculum as forward, backward, static, or a combination of movements
during an academic term (Adelman, 2006).
Third, this study is guided by the expertise of Linda Serra Hagedorn, who has focused
much of her research specifically on the analysis of community college student transcripts.
The potency of transcript analysis is confirmed at the community college level by Hagedorn
and Kress (2008) when they stated “the only trace of the presence of some community
college students is found in their transcripts.” As Hagedorn and Kress (2008) further
explained, transcripts are the primary markers of student engagement for many community
college students. Unlike traditional students at 4-year institutions, community colleges
struggle to engage their students in campus life. Due to the many work, family, and financial
commitments of community college students, they tend to spend less time on campus. Thus,

7
transcript analysis provides an ideal opportunity to measure the success of such students. In
this study comparisons will be drawn from the transcript analysis of Hagedorn’s (2005b)
previous framework; utilizing student enrollment records and student demographic
information.
LIMITATIONS OF THE STUDY
The findings of this study do not seek to generalize to all community college students.
Instead, this study’s findings are limited to the community college students of DMACC who
have enrolled in at least one traditional and online course. Additionally due to the purpose
and location of DMACC, the sample was limited by its unique characteristics. In particular,
this study was limited by the breath of academic offerings at the community college level.
Whereas, one might see a larger amount of variation in academic majors, the overwhelming
majority of students in this sample were Liberal Arts students. Additionally, due to the
location of DMACC in the Midwest, there was a higher concentration of Caucasian students
in comparison to other ethnicities. Lastly, the sample size of this population of students was
relevant only for the academic years of 2005 to 2009.
DEFINITION OF TERMS
Classification of Instructional Program (CIP) Code – a taxonomy classification used
to identify postsecondary fields of study for the purpose of assessment, tracking, and
reporting.
Distance Education – is described as instruction which utilizes one or more
technologies to deliver course content to a student who is separated from the (Instructional
Technology Council, 2009).
Online Course – is a class which offerings are delivered 100% on the Internet
(Tallent-Runnels et.al, 2006).
Traditional Course – is term used to classify a class which is offered in a face-to-face
format (Tallent-Runnels et.al, 2006). In this situation student and teacher are most often in a
classroom setting.
Traditional-dominant – a term used to describe a student’s course-taking habits with
regard to online courses. A traditional-dominant student enrolls in predominantly traditional
classes and has an online course enrollment of 30% or less. Percentages are calculated from

8
the total number of online courses in his/her enrollment history and divided by the total
number of all courses in his/her enrollment history.
Transcript Analysis – is “the coding and use of enrollment files, college application
data, financial aid records, and other data that community colleges must routinely collect to
comply with state and federal reporting mandates” (Hagedorn & Kress, 2008, p.7). This
information is gathered and statistically evaluated to provide a more comprehensive
understanding of a student’s progress and academic story (Hagedorn, 2005b).
Web-balanced - a term used to describe a student’s course-taking habits with regard
to online courses. A web-balanced student enrolls in similar number of traditional classes and
online classes and has an online course enrollment of 40% to 60%. Percentages are
calculated from the total number of online courses in his/her enrollment history and divided
by the total number of all courses in his/her enrollment history.
Web-dominant - a term used to describe a student’s course-taking habits with regard
to online courses. A web-dominant student enrolls in predominantly online classes and has an
online course enrollment of 70% or more. Percentages are calculated from the total number
of online courses in his/her enrollment history and divided by the total number of all courses
in his/her enrollment history.

9
CHAPTER 2
REVIEW OF THE LITERATURE
Perhaps the most enduring and controversial question in distance education is, is there
a significant difference in success between traditional and distance education? (Russell,
2001). According to Russell (2001), this question has been posed as early as 1900 and has
been reworked throughout the evolution of distance education. Whereas early researchers
questioned whether student outcomes were “hurt” by distance education, later researchers
focused their studies on whether or not technology could improve student outcomes (Russell,
2001). Regardless of how the question was formed, Russell (2001) stated that in over 325
studies, spanning the early 1900s until recent times, no significant difference could be found
between distance and traditional courses that covered the same educational material.
However, Russell (2001) went further to explain that when course content was adapted to fit
the technology, a positive significant difference can be attained. Of equal importance to note,
is that Russell’s review contains literature that is not exclusive to online courses. As
previously mentioned online courses have a rather brief history in comparison to distance
education. Distance education can include a wide range of implementation methods including
online course, webinar forums, telephones, radio, video, and correspondence. Therefore, in
assessing the significant difference in success of online and traditional courses, Russell’s
literature review cannot be generalized to any one type of distance education.
The history of online course offerings, though brief, has grown rapidly. The
foundation of online courses has largely been rooted in distance education and as such, been
intertwined with other distance education technologies and media. Thus previous studies,
which focus on distance education, the umbrella term which incorporates a variety of
pedagogies, have varied on the definition of online, e-learning, and distance education.
Simply put, not all online courses are offered exclusively through the internet and not all e-
learning environments incorporate online courses. Furthermore, some online courses are
comprised of differing degrees of online offering. For example, some online courses require
50% participation online and 50% in class participation. While some colleges may refer to

10
this as a blended course offering, other schools have loosely defined any percentage of online
course offerings as an online course.
Thus while it is true that distance education can be delivered in various formats, the
rapid expansion and incorporation of online courses in college curriculum remains
unmatched. In fact, student enrollment in online courses continues to expand at growth rate
of 3% and online students now represent 17% of all postsecondary students (Allen &
Seaman, 2006). Thus, a distinct need for research focusing solely on online courses is
demonstrated. Therefore, the following analysis of literature carefully examines the relevant
literature with regard to who these students are and how student success and learning are
explored within online courses. Student learning and success were found to be measured in a
variety of ways and thus, will be reviewed comparatively by (a) student performance, (b)
student perspectives, and (c) student retention . However, first, the demographic
characteristics of online students shall be examined as referenced by the literature.
STUDENT DEMOGRAPHICS
The claim that “the demographic differences between online and traditional students
has been duly noted” (Diaz, 2002, p. 1) has mixed implications. For instance, while Gibson
and Graff (1992) and Thompson (1998) concluded that online students are generally older,
have a higher GPA, and have completed more credits than traditional students. There are
several unidentified assumptions. First, these demographic characteristics portray a trend
rather than a fixed number. Observing online education over time has indicated that students
are getting younger and demographic populations are shifting (Instructional Technology
Council, 2009). The Instructional Technology Council (2009) has reported that in 2008, 52%
of students were considered traditional age; whereas, only 46% of students were considered
traditional age in 2006. The second assumption is that methods of identifying online students
are universal. As mentioned earlier, what constitutes an online student from a traditional
student may vary from institution to institution or from course to course. Lastly, demographic
characteristics vary largely across the United States and should be taken into consideration
when applying theory to practice. For instance, Iowa’s minority population constitutes only
9.4% of the student population and was ranked the fifth lowest state in terms of diversity in
2007. Thus the number of students represented by any one ethnic category is likely to be very

11
different than population numbers from other states and vary highly from states outside of the
Midwest.
STUDENT PERFORMANCE
For the purpose of this review, student performance is defined by grade acquisition in
course work, GPA, or by other identified instruments to measure learning. While some
studies have collectively regarded these two measures along with student completion or
student retention, the volume and depth of research which has been done in student retention
alone, warrants its own analysis and will be discussed later.
Comparisons across student’s GPAs were conducted in Ridley and Husband’s (1998)
study. Course GPAs were analyzed and compared in both traditional and online settings.
They found that traditional students earned on average a higher GPA. However, this study
lacked variable control. By controlling for the instructor, student, course subject, or
instructional method, this study’s conclusions could have been strengthened.
In his dissertation, Bangurah (2004) compared students with passing grades in
traditional and online courses. Student’s grades were compared across courses where the
same instructor taught both online and traditional formats. Within this study, 3,601 students
participated and Bangurah (2004) found that in each course and context, mean GPAs were
highest among traditional students. He also noted females who were enrolled in web-based
courses outnumbered their male counterparts by nearly two-thirds. This ratio of female to
male students was not found within the traditional course setting.
The question of student performance has also been further reviewed along lines of
gender (Price, 2006; Yates, 2001;). Whereas, previously women were presumed to have an
online disadvantage due to access (Kirkup & von Prümmer, 1997) or family commitments
(Wolf, 1998), studies have shown that enrollment is greater among females in online courses
and females may in fact be more successful in the online setting (Price, 2006). In her study,
Price (2006) sought to uncover gender differences in female and male students who are
enrolled in online courses. In order to do so, she compared the same course in both a
traditional and online setting. From 2002 to 2004, 1,991 students participated in the study
from the Open University. Two questionnaires were utilized to demonstrate course
12
experience and academic engagement. From her study, Price (2006) was able to conclude
that women were more likely to out perform their male counterparts in online course settings.
While the use of surveys in conjunction with empirical data can often provide a more
complete picture, surveys as a sole means of predicting student success and learning has been
less than successful (Hall, 2008). Employing two different survey instruments, Hall (2008)
attempted to uncover which instrument would be the most accurate in determining online
student success. Two hundred and twenty-eight students participated in the study which
encompassed three regional community colleges in the midwest. These students were all
enrolled in at least one online course in the following areas: business, computer information
services, criminal justice, and early childhood development. Hall (2008) found that the class
categories were a better predictor of student success than either of the two survey
instruments. In fact, the surveys showed little than an 8% accuracy in predicting final grades
for these students.
STUDENT PERSPECTIVES
The analysis of online learning and success has also been observed through student
perceptions (Kelly, Ponton, & Rovai, 2007). Thus, students’ reactions, evaluations, and
assessments are taken into consideration. Such measures may provide insight into dependent
and independent variables for further research. For instance, Kelly et al. (2007) reported on
the differences of student evaluations of teaching (SET) for online and traditional courses.
They found this research to be important in revealing biases of SET towards online course
offerings. Kelly and colleagues found that instructors’ knowledge, experience, and perceived
competency were more important to traditional students; whereas, online students more
highly valued course material and course structure. Therefore, the role of the instructor and
method of course delivery has also been analyzed (Cragg, Dunning, & Ellis, 2008). In their
study, Cragg et al. (2008) were able to demonstrate more similarities in instructor style than
differences in online and traditional courses.
In an effort to compare student engagement among traditional and online students,
Robinson and Hullinger (2008) constructed a modified version of the National Survey of
Student Engagement (NSSE). This widely accepted instrument has been commonly used to
gauge student involvement and activity in academic settings. Findings were representative of

13
201 respondents; all participated in online courses, 85% were less than 25 years old, 84%
were White, and more than half were upper classmen. Benchmarks of engagement were
provided by the 2006 NSSE results of on-campus students. In both the senior and freshmen
respondents, their NSSE results were higher than traditional NSSE on-campus students. The
students’ NSSE scores were still considered modest; however, overall the online students’
scores showed that faculty-student interaction was no lower than traditional student
reporting.
STUDENT RETENTION
Expanding options in online courses and offerings have also brought about higher
attrition rates (Allen & Seaman, 2006; Carr, 2000; Diaz, 2000). According to Diaz (2002),
“Drop rates are among the characteristics that have routinely prompted distance education
studies,” (p.1), though Diaz (2002) warned that high levels of attrition do not necessarily
translate into academic non-success as some students simply attempt to enroll in more online
courses. In 2000, Diaz’s study indicated that of 231 students enrolled in general health
education, online students tended to be older and had completed more credit hours than
traditional students. Further analysis revealed that while drop rates were dramatically higher
in online courses, those online students who did complete course work received twice as
many “A’s” than did traditional students who received twice as many “D” and “F” marks.
While, Diaz’s study cannot be generalized to all online courses since he only examined one
course type, it is important to note that when calculating retention, completion and successful
completion (attaining a “C” or higher) may not be the same measurement.
Other studies have supported Diaz’s (2000) findings that successful online students
tend to be older (Doherty, 2006) and have completed more credit course hours (Aragon &
Johnson, 2008; Doherty, 2006). Such studies have further investigated the demographic
backgrounds of online students to find predicators of success. Demographic information was
collected from institutions on 10,466 students enrolled in online courses for Doherty’s (2006)
study. He found that by comparing unsuccessful students and successful students generated
unequal comparison group sizes. He used Spearman’s rank correlation coefficient to test for
correlations between success, age, and number of credits. A chi-square was performed to
compare gender and successful online students. Doherty found significant results that

14
positively correlated age, number of credits enrolled in the semester, and total credits
completed with success in online course. Conversely, there was no significant relationship
between gender and online course success.
However, some studies do show a significant and positive correlation between student
completion and gender (Aragon & Johnson, 2008; Nesler, 1999; Price, 2006). Recently,
Aragon and Johnson (2008) obtained the student records of 305 students enrolled in a rural
Midwestern community college. In their study, they analyzed the student demographic,
enrollment, academic readiness, and course completion data. Aragon and Johnson found no
significant difference among age, ethnicity, and financial aid eligibility between online
completers and non-completers. However, there were significant differences among gender,
hours enrolled, and GPA. Thus, aside from age and credit hours, the literature remains
conflicted on significant correlations between student demographics and success in online
courses.
TRANSCRIPT ANALYSIS
As described, the literature has heavily analyzed students’ learning, perspectives, and
success in online courses. Researchers have investigated these concepts by means of grades,
surveys, completion rates. Moreover, they have controlled for the type of discipline, the
instructor, demographic and enrollment histories and compared these characteristics among
online students to traditional students. However, they have not used the individual student as
a control measure. By examining the student’s own success in traditional and online settings,
this study proposes a new approach to online course studies through transcript analysis.
Transcript-analysis is arguably one of the most reliable forms to track and measure
student performance at the community college level (Hagedorn, 2005b). Adelman (1999)
utilized this type of analysis to generate a national longitudinal study of the college course
taking behaviors of the class of 1972 and 1982. The importance of this technique, while it is
not a new concept, has been revived by Clifford Adelman’s work. Furthermore, Adelman’s
work has utilized transcripts to determine student patterns as well as answer “how we are
doing in postsecondary education” (Adelman, 1999). As Adelman stated,
Transcripts are unobtrusive records. As such, they do not lie, they do not exaggerate, and they do not forget. They tell us what really happens, what courses

15
students really take, they credits and grades they really earn, the degrees they really finish and when those degrees are awarded. (Adelman, 1999, p. 10)
Transcript analysis is defined as “the coding and use of enrollment files, college
application data, financial aid records, and other data that community colleges must routinely
collect to comply with state and federal reporting mandates,” (Hagedorn & Kress, 2008, p.
7). Specifically, transcript analysis allows for researchers to track the history and progress of
postsecondary students. While this method of research remains relatively underutilized, it
provides an accurate account of students’ higher education progression. Furthermore,
transcript analysis is of particular importance in assessing inquires regarding community
college students. Due to the busy schedules and other commitments of many community
college students, time spent on campus and engagement in campus activities remains limited
and community college students are ideal candidates for transcript analysis (Hagedorn &
Kress, 2008).
SUMMARY
The literature discussed online students in terms of their demographic characteristics,
performance, perspectives, and retention. Since the definitions of what constitutes an online
course vary from institution to institution and since performance is measured in a variety of
ways, it is difficult to determine a clear and concise picture of what an online student is and if
and how they succeed. Transcript analysis was identified as a methodology that has not been
widely used in analyzing online student success and might be best suited for studies like this
one, involving community college students. Thus, the following chapter will provide a
detailed account of this methodology and its application within this study.

16
CHAPTER 3
METHODOLOGY
DESIGN OF THE INVESTIGATION
This chapter will provide a description of how the research was conducted including
the sample population, how data was attained, the research methodology, and a description of
the data analysis techniques. First, the research questions will be presented and a detailed
framework will follow with descriptions of the independent and dependent variables.
RESEARCH QUESTIONS
1. What are the demographic characteristics of students who enroll in both traditional and online courses? Do they differ in terms of gender, age, ethnicity, or financial aid?
2. Among students who take both online and traditional courses, how do students differ when considering the distribution of web to traditional courses? What factors are responsible for discriminating between students who are traditional dominant, web-balanced, and web-dominant?
3. Among students who take both online and traditional courses, how do course grade point averages (GPA’s) differ between traditional and online courses? Are there significant differences in GPA based upon student demographic or on course mode?
4. Among students who take both online and traditional courses, how do course completion rates differ between the two course types? Are there significant differences in course completion rates based upon student demographic or on course mode?
In Kozeracki’s (1999) work, she found that Iowa was one of the top three states in
online community college offerings. She concluded that there were no significant differences
in student achievement between online and traditional courses but hypothesized that this
could change over time as course possibilities grew. Since 1999, online student enrollments
have grown to over 12 million (Parsad & Lewis, 2008).
Thus, this study reevaluates the work started by Kozeracki (1999) in online and
distance education. While, the study will retain the null hypothesis that no significant
difference will be found between traditional and online course offerings in student
achievement, the study will utilize a systematically different approach. Specifically, this
study draws upon Adelman (1999, 2004, 2006), Hagedorn’s (2005b) and Hagedorn and

17
Kress (2008) work in transcript analysis to explore in-depth the differences of student
achievement through the analysis of grades and course completion rates.
POPULATION
A sample of students enrolled in both traditional and online courses was selected
from DMACC, the largest community college system in Iowa with over 18,000 students and
five campuses. Due to its size, various locations, and diverse course offerings, it provided an
appropriate environment to collect data.
Eleven thousand nine hundred and seventy students met the criteria of having
enrolled in both an online and traditional course during the time span of fall 2005 through fall
2008. Of this number, 7,696 were female, 4,253 were male, and 21 were unidentified; 10,196
were Caucasian, 446 were black, 299 were Hispanic, 419 were Asian, 53 were Native
American, and 53 were unidentified; 33.9% received Pell Grants; and 96.4% were Iowa
residents.
TREATMENT
Data was gathered through the assistance of the Office of Institutional Research at
DMACC in the form of existing student files. Due to the sensitive and confidential nature of
student files, The Office of Institutional Research at DMACC conducted the query for these
files. Students who had enrolled in at least one online and one traditional course during the
academic years spanning fall 2005 through fall 2008 were included in the sample. DMACC
released these files electronically once all student identification information had been
removed and was replaced by an anonymous identification (ID) number. Two files were
generated from the information present in the student files. The first was called an enrollment
file which included the anonymous student ID number, the campus in which the student was
enrolled, the academic year of the course, the semester, an indication of whether or not the
course had been dropped, the subject, the course number, the grade received, the number of
credits, and the type of course (online or traditional). This file used the course as the unit of
analysis. Thus there were multiple lines of data for each student. The second file was deemed
the demographic file and contained information on the student’s anonymous ID number, sex,
birth date, first term of enrollment, race, Pell Grant status, residency, major, and

18
classification of instructional program (CIP) Code. This file used the student as the unit of
analysis.
DEPENDENT VARIABLES
The dependent variables measured in this study were grades and course completion
ratios. These two dependent variables were selected due to their consistency throughout
previous literature as benchmarks of measuring students’ success in distance education. A
careful distinction between grades and course completion ratios being two separate measures
of success was made due to the unique manner in which many community college students
progress through their academic track. As Hagedorn’s (2005b) and Hagedorn and Kress
(2008) has described, community college students more frequently experience periods of
stop-out, transfer, and part-time enrollments.
Success in grade achievement was established through calculating the student’s GPA
and distinguished by the student obtaining a course grade of “C” or higher; whereas, success
in course completion ratios (CCR) was measured by dividing the number of courses
attempted into the number of courses completed with a passing grade. In both GPA and
CCR, student measures were calculated for traditional and web success separately. These
measures were relative for each individual student and determined based on the student’s
unique GPA and CCR. In other words, this method measures the student’s goals and goals
are stated by enrollment in a course. For example, a student who enrolls in ten courses has a
CCR of 100%, whereas, a student who completes two courses also has a CCR of 100% if
they have only enrolled in two courses.
INDEPENDENT VARIABLES
The demographic variables included for purpose of analysis were sex, age, race, Pell
grant status, and CIP code. Students’ sex was coded as 1 for Males and 2 for Females. Age
was calculated from birthdates and categorized into subgroups from Hagedorn’s age model
(Hagedorn, 2005a). Students age 17 through 21 were coded as 1, students age 22 through 30
were coded as 2, students age 31 through 45 were coded as 3, and students age 46 and over
were coded as 4. Race was coded as 1 for Caucasian, 2 for Black, 3 for Hispanic, 4 for Asian,
5 for Native American, and 6 for unknown or other. If student’s received Pell grants they
were coded as 1 and those did not receive Pell grants were coded as 0. CIP codes were
19
condensed into the major discipline of study by utilizing the first two digits provided rather
than the entire sequence. For instance a student with CIP code 190402 – Consumer
Economics would be categorized as CIP family 19 – Consumer and Human Sciences.
COURSE MODE
In order to account for the discrepancy that occurs among students who have taken
many courses online as opposed to those who have only taken a few or even one, this study
has developed a technique for categorizing students’ online course enrollment. In this
manner, students can be compared to other students who are most similar to them in course-
taking behaviors. The percent of online courses was calculated for each student. From this
percentage, three categories were developed: traditional-dominant, web-balanced, and web-
dominant. Traditional-dominant students were defined as those students whose online course
percentage was 30% or lower of their class taking percentage. Traditional-dominant students
were coded as 1. Web-balanced students had an online class percentage of 40 to 60% and
were coded as 2. Web-dominant students had an online class percentage of 70% or above and
were coded as 3.
DATA ANALYSIS PROCEDURES
Throughout the analysis of this study’s data, both descriptive and inferential statistics
techniques were utilized. All statistical analysis was performed on the Statistical Package for
the Social Sciences (SPSS) 17.0 and the level of significance established was p 0.05.
Initially, frequencies were viewed to create a better picture of the sample. Demographic and
course success variables were then selected based on the research questions to be
investigated further through paired sample T-tests and One-way analysis of variance
(ANOVA). Correlation coefficients were calculated to determine the strength of relationship
between variables and success in online courses.
LIMITATIONS OF THE STUDY
The findings of this study do not seek to generalize to all community college students.
Instead, this study’s findings are limited to the community college students of DMACC who
have enrolled in at least one traditional and online course. Additionally due to the purpose
and location of DMACC, the sample was limited by its unique characteristics. In particular,

20
this study was limited by the breath of academic offerings at the community college level.
Whereas, one might see a larger amount of variation in academic majors, the overwhelming
majority of students in this sample were Liberal Arts students. Additionally, due to the
location of DMACC in the Midwest, there was a higher concentration of Caucasian students
in comparison to other ethnicities. Lastly, the sample size of this population of students was
relevant only for the academic years of 2005 to 2009.

21
CHAPTER 4
RESULTS
Chapter four is subdivided by descriptive and inferential findings. The organization of
data in this manner provides a clear picture of the DMACC sample and subsequently
attempts to answer the research questions in consecutive order. Thus, student success is
analyzed by GPA first and CCR last.
DESCRIPTIVE ANALYSIS
Overall, the DMACC sample included 11,970 students of which 36% were male and
64% were female. The overwhelming majority of students were Caucasian (85%). Table 1
shows the percentages of students’ gender and ethnicity for this sample.
Table 1. Percentage of DMACC Students Who Enrolled in both Online and Traditional Courses
The students’ demographic information was further analyzed by financial aid status
and by age. The only information available to determine financial aid status gathered from
the students’ enrollment file was the receipt of a Pell Grant. In this sample, 4,061 students
were reported recipients of the Pell Grant (N=11970). Age groups were determined by
Hagedorn’s (2005a) age model that categorized college students into four subgroups. The
frequency distribution was highest among those students ages 22 through 30 inclusive as
reflected in Table 2 (N = 11953). Corresponding percentages are noted within parentheses.
Gender
Male (%) Female (%)
Asian 1.6 1.9
Black 1.5 2.2
Caucasian 29.2 56.0
Hispanic 0.9 1.5
22
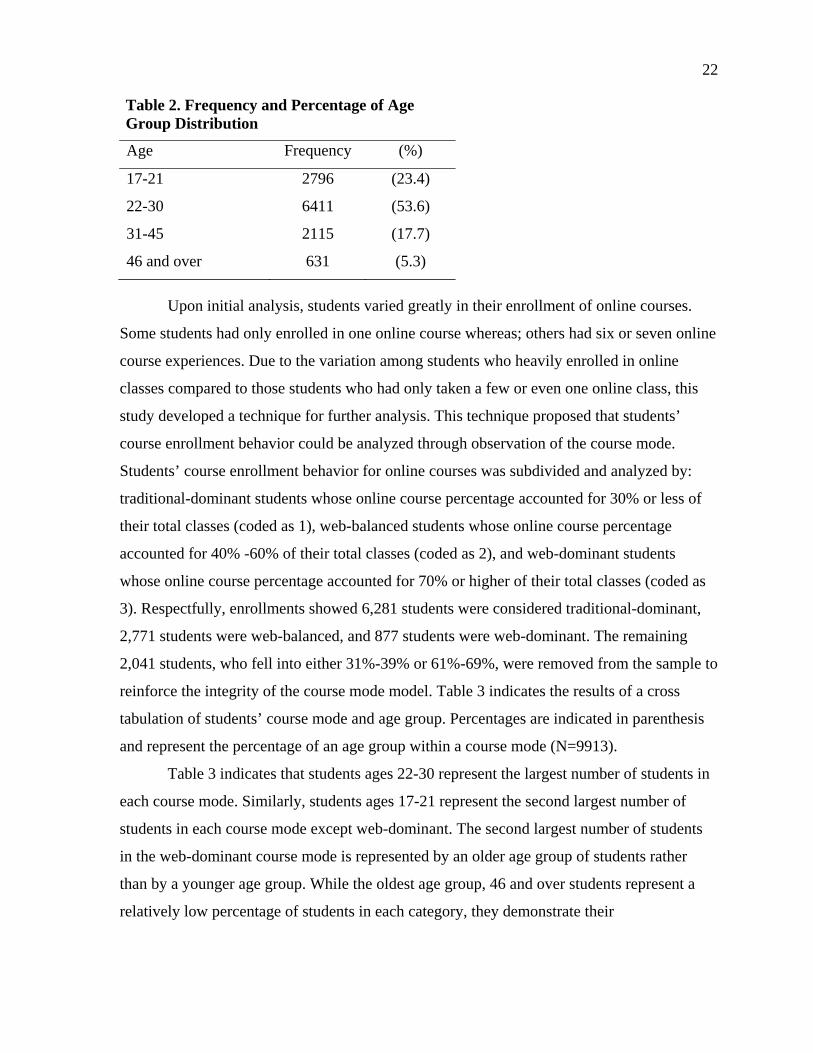
Table 2. Frequency and Percentage of Age Group Distribution
Upon initial analysis, students varied greatly in their enrollment of online courses.
Some students had only enrolled in one online course whereas; others had six or seven online
course experiences. Due to the variation among students who heavily enrolled in online
classes compared to those students who had only taken a few or even one online class, this
study developed a technique for further analysis. This technique proposed that students’
course enrollment behavior could be analyzed through observation of the course mode.
Students’ course enrollment behavior for online courses was subdivided and analyzed by:
traditional-dominant students whose online course percentage accounted for 30% or less of
their total classes (coded as 1), web-balanced students whose online course percentage
accounted for 40% -60% of their total classes (coded as 2), and web-dominant students
whose online course percentage accounted for 70% or higher of their total classes (coded as
3). Respectfully, enrollments showed 6,281 students were considered traditional-dominant,
2,771 students were web-balanced, and 877 students were web-dominant. The remaining
2,041 students, who fell into either 31%-39% or 61%-69%, were removed from the sample to
reinforce the integrity of the course mode model. Table 3 indicates the results of a cross
tabulation of students’ course mode and age group. Percentages are indicated in parenthesis
and represent the percentage of an age group within a course mode (N=9913).
Table 3 indicates that students ages 22-30 represent the largest number of students in
each course mode. Similarly, students ages 17-21 represent the second largest number of
students in each course mode except web-dominant. The second largest number of students
in the web-dominant course mode is represented by an older age group of students rather
than by a younger age group. While the oldest age group, 46 and over students represent a
relatively low percentage of students in each category, they demonstrate their
Age Frequency (%)
17-21 2796 (23.4)
22-30 6411 (53.6)
31-45 2115 (17.7)
46 and over 631 (5.3)

23
Table 3. Frequency and Percentages of Age Groups Represented in Course Mode Model
highest student population percentage in the web-dominant course mode. A Pearson Chi-
Square (N=9913) of this cross tabulation revealed a significant value of 160.57.
In order to determine the financial aid status of students within these respective
course modes, an additional cross tabulation was run and found to have significant results. As
Pell Grant status was the only indication of financial aid present on student enrollment files,
students’ Pell Grant status was crossed with their course mode and can be found in Table 4
(N=9929). Percentages are represented in parenthesis and students that received the grant
were coded as 1. As Table 4 indicates, the largest number of Pell Grant students is
represented by those in the “Traditional-Dominant” course mode (N=2260); however, the
largest population percentage composed of Pell Grant students is found in the “Web-
Dominant” course mode (42.8%).
Table 4. Frequency and Percentage of DMACC Students Receiving Pell Grants by Course Mode
GPA ANALYSIS
While the frequencies mentioned begin to provide a clearer picture of DMACC
students who enroll in both traditional and online courses, further statistical analysis was
used to deepen the understanding of which students succeeded in these courses. A paired
sample t-test was calculated on students’ GPA in both online and traditional courses.
Course Mode
Age Traditional-Dominant (%) Web-Balanced (%) Web-Dominant (%)
17-21 1657 (26.4) 615 (22.3) 110 (12.6)
22-30 3379 (53.9) 1475 (53.4) 463 (52.9)
31-45 909 (14.5) 535 (19.4) 239 (27.3)
46 and over 329 (5.2) 138 (5.0) 64 (7.3)
Course Mode
Pell Grant Traditional-Dominant (%) Web-Balanced (%) Web-Dominant (%)
0 4021 (64.0) 1996 (72.0) 502 (57.2)
1 2260 (36.0) 775 (28.0) 375 (42.8)

24
Table 5 illustrates the results of this t-test by demographics (N=10297). In general, females
performed better than males in both traditional and web courses. However, it was the age
group “46 and over” that displayed the highest mean web GPA and the “17-21” age group
that had the lowest mean web GPA. Regardless, all demographic categories garnered a
higher mean GPA in traditional courses than in web courses.
Table 6 (N=10297) displays the correlation coefficients and paired differences among
demographic categories. All demographic categories were determined to be significant and
demonstrated a moderate correlation. For the most part, the mean differences across
demographics are similar. However, the most variation occurs within Age Group.
Subsequently, this category contains the lowest mean difference of -.19 by students ages 46
and over and the highest mean difference of -.38 by students ages 17-21.
As previously stated, CIP codes were analyzed to demonstrate how students
performed within disciplines. For the purpose of this study, CIP codes were condensed from
six digits into the first two digits or CIP code family. The CIP code family represents the
discipline related field rather than the individual’s specific major which was represented by
the entire six digit sequence. By condensing the CIP codes, the researcher had a more concise
and manageable data set. A complete listing of these CIP code families can be found in
Appendix A. Table 7 displays the students’ mean GPAs by traditional and web based courses
and their correlation coefficients. As is indicated by the table, sample size varies highly from
CIP code 46 with a population of six to CIP code 24 with a population of 6,997.
Respectfully, the two largest populations of CIP codes are represented by 24 – Liberal Arts
and Sciences (N=6997) and 52 – Business, Marketing, Management and other Support
Services (N=1661). Such variances are reflective of the community college students’ majors
and the limited course offerings in particular majors as course levels advance. Comparisons
of web and traditional GPA across all CIP codes reveal students on average obtain a higher
mean GPA in traditional courses than web courses with one exception CIP code 16 – Foreign
Languages, Literature, and Linguistics. All CIP codes showed a modest correlation
significance except CIP 26 and 46, both which had very small samples.

25
Table 5. DMACC Students’ Mean GPA Scores in Traditional and Web Courses by Demographics
Table 8 illustrates the mean GPAs and correlation coefficients of students in both
traditional and web courses by ethnicity. It is important to note that Caucasian students
drastically outnumber other ethnicities. Specifically, the sample populations are as follows:
Caucasian N=8846, Black N=344, Hispanic N=239, and Asian N=359. As can be seen in
Table 8, all ethnicities demonstrate a higher mean GPA in traditional classes than in web
classes. Caucasian students attained the highest GPA in traditional classes (2.76) while Asian
students attained the highest web GPA (2.52) and showed the least amount of standard
deviation (SD=1.33). Modest correlation was demonstrated across all ethnicities.
Further analysis on was performed on students’ ethnicities. Comparisons between
ethnic groups can be seen in Table 9. The difference in traditional GPA was found to be
significant between all comparisons with black students, whom had the lowest mean GPA
Traditional GPA Web GPA
N Mean SD Mean SD
10297 2.74 1.05 2.42 1.36
Gender
Male 3536 2.60 1.08 2.25 1.40
Female 6747 2.81 1.03 2.50 1.34
Age Group
17-21 2412 2.58 1.06 2.20 1.39
22-30 5498 2.66 1.05 2.33 1.36
31-45 1827 3.00 1.01 2.75 1.26
46 and over 549 3.31 .85 3.12 1.19
Course Mode
Traditional-Dominant 5280 2.66 .95 2.32 1.42
Web-Balance 2446 2.81 1.14 2.55 1.30
Web-Dominant 761 2.91 1.23 2.55 1.14
Pell Grant
0 6840 2.82 1.05 2.53 1.36
1 3457 2.58 1.04 2.20 1.35

26
Table 6. DMACC Students’ Correlation and Paired Difference Statistics in GPA Scores of Traditional and Web Courses by Demographics
and thus highest degree of difference in GPA. Black students varied by about half a GPA
point less than Caucasian students (-.52). Conversely, all web GPAs were found to have a
significant mean difference with an exception between Asian and Caucasian students (mean
difference=.055).
COURSE COMPLETION RATIOS (CCR) ANALYSIS
Students’ course completion ratio (CCR) was also examined as a factor of success. In
Table 10 (N=11970), CCRs were examined across demographics of gender, age, course
mode, and Pell Grant status. In each of these demographic categories, students obtained
higher CCRs in traditional courses than they did in web courses. However, CCRs in web
based courses did fluctuate within demographic categories. Table 10 shows that females had
Paired Differences
N Correlation Mean SD t df
10297 .58* -.32 1.14 -28.58* 10296
Gender
Male 3536 .58* -.35 1.17 -17.72* 3535
Female 6747 .58* -.31 1.12 -22.40* 6746
Age Group
17-21 2412 .59* -.38 1.14 -16.56* 2411
22-30 5498 .56* -.33 1.16 -21.04* 5497
31-45 1827 .55* -.25 1.10 -9.76* 1826
46 and over 549 .57* -.19 .99 -4.42* 548
Course Mode
Traditional-Dominant 5280 .59* -.34 1.15 -21.67* 5279
Web-Balance 2446 .57* -.27 1.15 -11.49* 2445
Web-Dominant 761 .58* -.37 1.09 -9.23* 760
Pell Grant
0 6840 .59* -.29 1.12 -21.28* 6839
1 3457 .56* -.38 1.16 -19.34* 3456

27
Table 7. DMACC Students’ Correlation Coefficients of their Mean Traditional and Web GPA’s by CIP Code
a higher ratio of course completion than male students in both traditional and web courses.
Within age groups, higher CCRs were found to positively correlate with older student groups
across both traditional and web courses. However, there was one exception to the age group
CCRs; students ages 17-21 (M=.70) had a higher traditional CCR than students ages 22-30
(M=.69). Web-dominant students had the highest CCR in web courses (M=.65); although,
this was still lower than their traditional CCR (M=.69). Lastly, those students receiving Pell
Traditional GPA Web GPA
CIP Code N Mean SD Mean SD Correlation t df
01 89 2.74 .82 2.11 1.34 .50* -5.12* 88
10 26 2.62 1.14 1.73 1.37 .71* -4.59* 25
11 50 2.84 .90 2.18 1.32 .66* -4.69* 49
12 109 3.18 1.05 2.59 1.19 .52* -5.52* 108
14 7 2.05 1.56 1.84 1.86 .89* -.68* 6
15 34 2.61 1.03 1.94 1.35 .68* -3.93* 33
16 21 3.35 1.08 3.36 .95 .46* .02* 20
19 122 2.89 1.05 2.35 1.31 .59* -5.49* 121
22 128 3.03 1.03 2.62 1.38 .66* -4.50* 127
24 6997 2.70 1.07 2.42 1.37 .58* -20.57* 6996
26 7 2.93 .97 2.62 1.68 .70 -.67 6
31 43 2.39 1.10 1.86 1.50 .51* -2.62* 42
43 359 2.55 1.06 2.17 1.39 .61* -6.40* 358
44 155 2.81 1.00 2.33 1.41 .50* -4.77* 154
46 4 2.44 .52 2.23 1.55 .92 -.39 3
47 81 2.93 .84 2.51 1.35 .43* -3.05* 80
48 31 2.90 .74 2.48 1.38 .40* -1.83* 30
50 22 2.89 .86 2.24 1.40 .51* -2.51* 21
51 321 2.86 .89 2.8266 1.32 .49* -.53* 320
52 1661 2.83 1.02 2.41 1.34 .60* -15.47* 1660

28
Table 8. DMACC Students’ Correlation Coefficients of their Mean Traditional and Web GPA’s by Ethnicity
Table 9. Comparison of DMACC Students’ Mean Differences in GPA by Ethnicity
Traditional GPA Web GPA
Ethnicity N Mean SD Mean SD Correlation t df
Caucasian 8846 2.76 1.04 2.45 1.35 .58* -26.35* 8845
Black 344 2.24 1.14 1.84 1.44 .57* -6.08* 343
Hispanic 239 2.61 1.05 2.21 1.44 .50* -4.81* 238
Asian 359 2.69 1.05 2.52 1.33 .47* -2.68* 358
Traditional GPA Web GPA
Ethnicity Mean Diff. Std. Error Mean Diff. Std. Error
Caucasian
Black .52* .05 .64* .07
Hispanic .15 .06 .25* .09
Asian .07 .05 -.05 .07
Black
Caucasian -.52* .05 -.64* .07
Hispanic -.37* .08 -.39* .11
Asian -.45* .07 -.70* .10
Hispanic
Caucasian -.15 .06 -.25* .09
Black .37* .08 .39* .11
Asian .08 .08 -.30* .11
Asian
Caucasian -.07 .05 .05 .07
Black .45* .07 .70* .10
Hispanic .08 .08 .30* .11

29
Table 10. DMACC Students’ Mean Course Completion Ratios (CCR) in Traditional and Web Courses by Demographics
Grants (coded as 1) received lower CCRs than those students who did not receive Pell Grants
(coded as 0) in both traditional and web courses.
Table 11 illustrates the modes correlation coefficients and paired differences across
demographics. For the most part, the mean differences across demographics are similar.
However, the most variation occurs within Course Mode. Subsequently, this category
contains the lowest mean difference of .04 within Web-dominant students and the highest
mean difference of .16 within Traditional-dominant students.
Comparisons of web and traditional CCRs across CIP codes are displayed in Table
12. Students on average obtained a higher CCR in traditional courses than in web courses
across all CIP codes. Furthermore, CIP codes showed a modest correlation significance
except in CIP codes 16 (Foreign Languages), 26 (Biology), and 46 (Construction Trades).
Traditional CCR Web CCR
N Mean SD Mean SD
11970 .71 .33 .58 .43
Gender
Male 4253 .67 .35 .53 .45
Female 7696 .73 .32 .61 .42
Age Group
17-21 2796 .70 .34 .55 .45
22-30 6411 .69 .34 .57 .43
31-45 2115 .76 .32 .65 .40
46 and over 631 .81 .28 .71 .40
Course Mode
Traditional-Dominant 6281 .71 .29 .54 .46
Web-Balance 2771 .72 .37 .63 .41
Web-Dominant 877 .69 .42 .65 .33
Pell Grant
0 7909 .74 .33 .62 .44
1 4061 .66 .33 .52 .42

30
Table 11. DMACC Students’ Correlation and Paired Difference Statistics of Course Completion Ratios (CCR) in Traditional and Web Courses by Demographics
Students’ traditional course and web course mean CCR and correlation coefficients
are depicted in Table 13. All ethnicities performed better in their traditional CCR than in
their Web CCR. Asian students attained the highest web CCR (.61). The correlation
coefficients for all ethnic groups were found to be significant with moderate strength in
relationship.
Table 14 illustrates the further analysis of CCRs between ethnic groups. Black
students had the largest mean difference in CCR across ethnicities in both traditional and web
courses. The mean difference in black students’ CCR was significantly negative in all
traditional courses when compared to other ethnicities but was only significantly negative in
comparison to Caucasian and Asian students’ web CCRs. Hispanic students also had
significantly lower mean CCRs when compared to Caucasian and Asian students’ web CCR.
Paired Differences
N Correlation Mean SD t df
Gender
Male 4253 .50* .13 .41 21.46* 4252
Female 7696 .48* .12 .39 27.22* 7695
Age Group
17-21 2796 .51* .15 .40 19.88* 2795
22-30 6411 .50* .12 .40 24.92* 6410
31-45 2115 .45* .10 .39 12.40* 2144
46 and over 631 .41* .10 .38 6.92* 630
Course Mode
Traditional-Dominant 6281 .50* .16 .40 32.74* 6280
Web-Balance 2771 .51* .09 .39 11.56* 2770
Web-Dominant 877 .48* .04 .39 2.91* 876
Pell Grant
0 7909 .49* .12 .40 26.16* 7908
1 4061 .47* .14 .39 23.09* 4060

31
Table 12. DMACC Students’ Correlation Coefficients of their Mean Traditional and Web Course Completion Ratios (CCR) by CIP Code
SUMMARY OF FINDINGS
This study found that the majority of students were female (64%), Caucasian (85%),
and ages 22-30 (46%). While the majority of these students did not receive a Pell Grant, 34%
were recipients. Additionally, this study also looked at students’ course taking behaviors and
found that traditional-dominant students constituted the largest population of students.
However, older students demonstrated their highest population percentages in web- balanced
Traditional CCR Web CCR
CIP Code N Mean SD Mean SD Correlation t df
01 107 .70 .29 .49 .44 .46* 5.35* 106
10 28 .68 .36 .47 .46 .52* .27* 27
11 56 .74 .29 .56 .42 .64* 4.10* 55
12 116 .80 .29 .73 .38 .52* 2.11* 115
14 8 .56 .50 .46 .50 .73* .83 7
15 41 .70 .29 .48 .48 .56* 3.59* 40
16 28 .76 .40 .50 .33 .22 2.95* 27
19 138 .76 .31 .60 .43 .56* 5.21* 137
22 142 .72 .29 .62 .42 .51* 3.44* 141
24 8116 .70 .34 .59 .43 .50* 26.07* 8115
26 10 .73 .35 .50 .52 .38 1.44 9
31 50 .63 .32 .50 .44 .47* 2.32* 49
43 415 .65 .33 .55 .43 .50* 5.68* 414
44 176 .69 .32 .57 .42 .38* 3.81* 175
46 7 .60 .44 .43 .53 .63 1.03 6
47 89 .76 .27 .70 .41 .38* 1.48 88
48 39 .74 .28 .57 .47 .65* 2.90* 38
50 24 .77 .28 .52 .45 .47* 2.91* 23
51 412 .81 .25 .58 .44 .21* 10.55* 411
52 1934 .71 .33 .57 .42 .53* 16.30* 1933
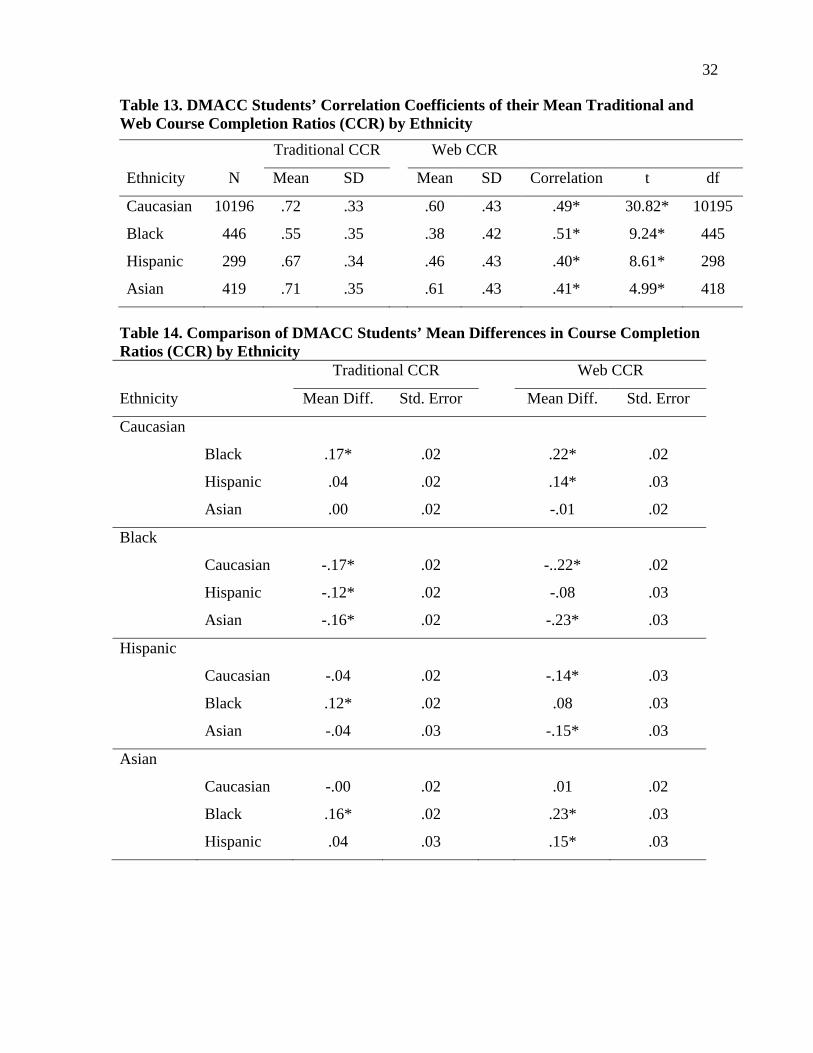
32
Table 13. DMACC Students’ Correlation Coefficients of their Mean Traditional and Web Course Completion Ratios (CCR) by Ethnicity
Table 14. Comparison of DMACC Students’ Mean Differences in Course Completion Ratios (CCR) by Ethnicity Traditional CCR Web CCR
Ethnicity Mean Diff. Std. Error Mean Diff. Std. Error
Caucasian
Black .17* .02 .22* .02
Hispanic .04 .02 .14* .03
Asian .00 .02 -.01 .02
Black
Caucasian -.17* .02 -..22* .02
Hispanic -.12* .02 -.08 .03
Asian -.16* .02 -.23* .03
Hispanic
Caucasian -.04 .02 -.14* .03
Black .12* .02 .08 .03
Asian -.04 .03 -.15* .03
Asian
Caucasian -.00 .02 .01 .02
Black .16* .02 .23* .03
Hispanic .04 .03 .15* .03
Traditional CCR Web CCR
Ethnicity N Mean SD Mean SD Correlation t df
Caucasian 10196 .72 .33 .60 .43 .49* 30.82* 10195
Black 446 .55 .35 .38 .42 .51* 9.24* 445
Hispanic 299 .67 .34 .46 .43 .40* 8.61* 298
Asian 419 .71 .35 .61 .43 .41* 4.99* 418

33
and web-dominant categories. In analyzing CIP Code families, it was discovered that over
half the students (6,997) were Liberal Arts majors.
Inferential statistics were used to analyze students’ demographic differences in
comparison to student success as measured by GPA and CCR. These findings revealed
modest correlations in gender, age, Pell Grant status, ethnicity, and course mode for both
GPA and CCR when traditional and online averages were calculated. Although all students
performed better in traditional courses than online courses (a) females outperformed males,
(b) older students outperformed younger students, (c) web-dominant students outperformed
traditional-dominant and web-balanced students, and (d) students who did not receive a Pell
Grant outperformed recipients in online settings obtain both a higher average GPA and CCR.
When ethnicity was considered, Caucasians performed the best in traditional courses but
Asian students outperformed all other ethnicities in online courses. Consequentially,
Hispanic and Black students had the lowest GPAs and CCRs. By analyzing the students’
academic majors, an instance where students performed better in an online setting than in a
traditional setting was indicated in CIP Code 16 (Foreign Languages). This was the only
category in the entire study where this occurred and was isolated to students’ GPA averages
and not CCR averages.
These findings indicate a clear difference in students’ online and traditional
performance as well as their performance when considered within demographic, academic, or
course mode categories. While there was a rather large amount of variance at times between
population size, this data was representative of the entire DMACC population who have
enrolled in both online and traditional courses. Therefore, as a population study, these
findings, while not generalizable to all higher education institutions, are an accurate depiction
of DMACC. Additionally, these findings may be helpful to Midwestern community colleges
similar to DMACC in size, course offerings, and student population. Further discussion and
the potential implications of these results will be continued in the conversation in the
following chapter.

34
CHAPTER 5
SUMMARY, CONCLUSION, AND
RECOMMENDATIONS
This final chapter restates the research problem and reviews the major methods used
in the study. The major sections of this chapter summarize the results and discuss their
implications for application and future research.
STATEMENT OF THE PROBLEM
While Iowa’s public high school diploma attainment percentage is above the national
average, its college degree attainment falls below both the Midwest and National averages
(Iowa Department of Education, 2008). Like many Midwestern states, Iowa has a large rural
population. This population, in particular, has an expressed demand for community colleges
as compared to Iowa’s urban population (Iowa Department of Education, 2008). Thus, in
investigating the lack of successful college degree attainment among Iowans, it is particularly
important to examine the community college system in Iowa.
Consistent with their missions, community colleges have generally been open to
adopting technologies that show promise of extending educational opportunities for students.
In recent years, the growing number of online courses has provided students additional
access particularly, those students who are limited by time, transportation, work, disability or
family constraints. However, the literature reveals that online courses have considerably
higher drop-out rates than traditional face-to-face courses (Aragon & Johnson, 2008;
Doherty, 2006). Thus, it is necessary to understand the trends in online community college
courses within Iowa.
PURPOSE OF THE STUDY
In 2006-2007 there were over 6 million students enrolled in community colleges in
the U.S. and 1,045 public community colleges (Provasnik & Planty, 2008). Additionally, in
2005-2006 over 1.5 million students enrolled in community colleges had taken at least one
online course (Allen & Seaman, 2006). In fact, with 3.1 million students enrolled in at least

35
one online course in the U.S., the majority of online students are enrolled in community
college (Allen & Seaman, 2006). Thus, due to the overwhelming large percentage of drop-
out rates for online courses (Maxwell, 2003) and the rapidly increasing number of online
courses (Allen & Seaman, 2006), the literature strongly suggests a need to understand
enrollment patterns and characteristics of these students (Aragon & Johnson, 2008; Doherty,
2006; Maxwell, 2003).
In states that have large rural populations like Iowa, successful retention in online
courses will be beneficial to students who are at a disadvantage due to physical access and
transportation. Furthermore, Iowa has a particular need to focus on online course success due
to the large percentage of students who intend on attaining postsecondary training at the
community college level. This percentage has increased since 1998 when 30.9% of public
high school graduates were pursuing or intending to pursue higher education at a community
college to 39.2% in 2008 (Iowa Department of Education, 2008). These students now
constitute Iowa’s largest population of postsecondary bound students. Furthermore, the
community colleges themselves, believe that the successful implementation and offering of
online courses will keep them accessible and competitive (Cox, 2005). Thus, community
colleges may be well advised to explore and better understand the students who are taking
online courses.
In reviewing the literature, studies on online courses have predominantly examined
demographic background (Nesler, 1999; Parker, 1999; Carr, 2000; Diaz 2002), course
completion (Bangurah, 2004; Doherty, 2006; Aragon & Johnson, 2008), and GPA analysis
(Ridley & Husband, 1998). However, all of the literature examined that comparisons were
drawn across types of courses, instructors, or types of students. None of the research
examined the student as the unit of analysis. Thus, the research failed to ascertain if
differences were due to the student attributes that lead to online enrollment or if the
differences were due to course delivery options. Previous studies have also overlooked the
individual’s success and differences in these two settings. Thus this study has analyzed the
transcripts of students who have enrolled in both online and traditional courses within the
academic years of 2005 until 2009. In doing so, the study has utilized demographic
information in the form of student files which contained students’ records of grade, course
type, major, and retention.

36
RESEARCH QUESTIONS
This study analyzed the transcripts and college records of approximately 12,000
students who have enrolled in both online and traditional courses within the academic years
of 2005 to 2009 at Des Moines Area Community College (DMACC). This is a unique group,
as the sample only included an individual if they have completed in full at least one online
course and one traditional course at DMACC. In this manner, students were used as their
own controls. The study utilized demographic information as recorded in student files as well
as transcript level data containing grades and course types. The specific research questions
were:
1. What are the demographic characteristics of students who enroll in both traditional and online courses? Do they differ in terms of gender, age, ethnicity, or financial aid?
2. Among students who take both online and traditional courses, how do students differ when considering the distribution of web to traditional courses? What factors are responsible for discriminating between students who are traditional dominant, web-balanced, and web-dominant?
3. Among students who take both online and traditional courses, how do course grade point averages (GPA’s) differ between traditional and online courses? Are there significant differences in GPA based upon student demographic or on course mode?
4. Among students who take both online and traditional courses, how do course completion rates differ between the two course types? Are there significant differences in course completion rates based upon student demographic or on course mode?
THEORETICAL BASES AND ORGANIZATION
The framework of this study is based on the work of three scholars. First, the work of
Carol Kozeracki provides a historical framework to the purpose of this study. Kozeracki
(1999) published the work of the Center for the Study of Community Colleges which,
examined distance education and provided insight to the method of transmission and
geographical concentration of these courses. At the time, online courses were not the most
common form of distance education. However, the overwhelming majority of distance
education courses offered at community colleges was concentrated in the central region of
the United States. In particular, Iowa was among the top three states offering opportunities
for distance education. Kozeracki’s work concluded that online courses and distance
education remained a small percentage of the overall community college curriculum at less
than two percent of the offerings but had significantly different levels of activity and

37
offerings than traditional four-year institutions. Thus, due to the tremendous growth in online
course offerings and the significant reputation of Iowa’s distance education programs,
comparing Kozeracki’s analysis with this study’s findings will provide insight into how
online courses have shifted or maintained the paradigm of traditional and distance education.
Second, this study draws upon the foundation of transcript analysis as described by
Clifford Adelman. To date, Adelman remains the only scholar to analyze transcripts at a
national level (Adelman, 1999, 2004, 2006). Through his work in the U.S. Department of
Education, Adelman has laid the foundation for and supported the validity of predicting
grades, course completion, and student retention through transcript analysis. More
specifically, Adelman (2006) detailed that student academic momentum can be traced
through transcripts. In essence, academic momentum describes the student’s course of
movement through curriculum as forward, backward, static, or a combination of movements
during an academic term (Adelman, 2006).
Third, this study is guided by the expertise of Linda Serra Hagedorn, who has focused
much of her research specifically on the analysis of community college student transcripts.
The potency of transcript analysis is confirmed at the community college level by Hagedorn
and Kress (2008) when they stated “the only trace of the presence of some community
college students is found in their transcripts.” As Hagedorn and Kress (2008) further
explained, transcripts are the primary markers of student engagement for many community
college students. Unlike traditional students at 4-year institutions, community colleges
struggle to engage their students in campus life. Due to the many work, family, and financial
commitments of community college students, they tend to spend less time on campus. Thus,
transcript analysis provides an ideal opportunity to measure the success of such students. In
this study comparisons will be drawn from the transcript analysis of Hagedorn’s (2005b)
previous framework; utilizing student enrollment records and student demographic
information.
LIMITATIONS OF THE STUDY
This study’s findings are limited by the unique population within its sample.
Specifically, since DMACC is a community college, there was a dearth of scope and breadth
in the students’ academic majors. In particular, the concentration of Liberal Arts studies was

38
higher than one might expect to find in a four-year institution. Additionally, due to
DMACC’s location in the Midwest, there were a particularly high number of Caucasian
students in comparison to other ethnicities. Moreover, the sample size of this population of
students is relevant only for the academic terms of spring 2005 through fall 2008. Thus, this
study could not be generalized to all community college students. Instead, this study’s
findings are limited to the community college students of DMACC who have enrolled in both
a traditional and online course.
METHODOLOGY
Transcript analysis of enrollment files was performed on a sample of students
enrolled in both traditional and online courses was selected from DMACC. Eleven thousand
nine hundred and seventy students met the criteria of having enrolled in both an online and
traditional course during the time span of fall 2005 through fall 2008.
TREATMENT
Data was gathered through the assistance of the Office of Institutional Research at
DMACC in the form of existing student files. Due to the sensitive and confidential nature of
student files, The Office of Institutional Research at DMACC conducted the query for these
files. DMACC released two files were generated and released from the information present in
the student files. The first was called an enrollment file which included the anonymous
student ID number, the campus in which the student was enrolled, the academic year of the
course, the semester, an indication of whether or not the course had been dropped, the
subject, the course number, the grade received, the number of credits, and the type of course
(online or traditional). This file used the course as the unit of analysis. Thus there were
multiple lines of data for each student. The second file was deemed the demographic file and
contained information on the student’s anonymous ID number, sex, birth date, first term of
enrollment, race, Pell Grant status, residency, major, and classification of instructional
program (CIP) Code. This file used the student as the unit of analysis.
DEPENDENT VARIABLES
Grades and course completion ratios were analyzed as the two dependent variables
due to their consistency throughout previous literature as benchmarks, measuring students’

39
success in distance education. Success in grade achievement was established through
calculating the student’s GPA and distinguished by the student obtaining a course grade of
“C” or higher; whereas, success in course completion ratios (CCR) was measured by dividing
the number of courses attempted into the number of courses completed with a passing grade.
In both GPA and CCR, student measures were calculated for traditional and web success
separately. This method provided the study with unique student goals based upon individual
student’s enrollment. Goals were stated by enrollment in a course and the degree of success
could be further analyzed by GPA.
INDEPENDENT VARIABLES
The demographic variables included for purpose of analysis were sex, age, race, Pell
grant status, and CIP code. Students’ sex was coded as 1 for Males and 2 for Females. Age
was calculated from birthdates and categorized into subgroups from Hagedorn’s age model
(Hagedorn, 2005a; See Appendix B). Students age 17 through 21 were coded as 1, students
age 22 through 30 were coded as 2, students age 31 through 45 were coded as 3, and students
age 46 and over were coded as 4. Race was coded as 1 for Caucasian, 2 for Black, 3 for
Hispanic, 4 for Asian, 5 for Native American, and 6 for unknown or other. If students
received Pell grants they were coded as 1 and those did not receive Pell grants were coded as
0. CIP codes were condensed into the major discipline of study by utilizing the first two
digits of the CIP code family (See Appendix A).
Course mode
In order to account for the discrepancy that occurs among students who have taken
many courses online as opposed to those who have only take a few or even one, this study
developed a technique for categorizing students’ online course enrollment. In this manner,
students can be compared to other students who are most similar to them in course-taking
behaviors. The percent of online courses was calculated for each student. From this
percentage, three categories were developed: traditional-dominant, web-balanced, and web-
dominant. Traditional-dominant students were defined as those students whose online course
percentage was 30 % or lower of their class taking percentage. Traditional-dominant students
were coded as 1. Web-balanced students had an online class percentage of 40 to 60 % and

40
were coded as 2. Web-dominant students had an online class percentage of 70 % or above
and were coded as 3.
DATA ANALYSIS PROCEDURES
Throughout the analysis of this study’s data, both descriptive and inferential statistics
techniques were utilized. All statistical analysis was performed on the Statistical Package for
the Social Sciences (SPSS) 17.0 and the level of significance established was p<0.05.
Initially, frequencies were viewed to create a better picture of the sample. Demographic and
course success variables were then selected based on our research questions to be
investigated further through paired sample T-tests and One-way analysis of variance
(ANOVA). Correlation coefficients were calculated to determine the strength of relationship
between variables and success in online courses.
DISCUSSION
Currently, there exists very little research that examines success in online courses by
community college students. Still fewer studies have simultaneously examined both GPA and
course completion factors defining success in online courses. In either case, those studies that
have examined such relationships did so by comparing courses or instructors and did not use
the student as the study’s control. In doing so, the literature reveals differences when either
the type of course or instructor is held as constant and the success of students are compared
against another group of students. By utilizing the student as the constant, the student’s
performance in a traditional setting is compared to their performance in an online setting.
This minimizes the differences in personal level, intellect, and achievement that can exist
from person to person. Moreover, the literature has underutilized transcript analysis, a
technique that this study employed to analyze the data and examine the research questions.
These research questions will guide the discussion of this study’s findings and provide a
context for comparison to the existing literature.
The first research question prompted analysis of descriptive statistics in order to
reveal information regarding students’ demographic information. What were the
demographic characteristics of students enrolled in both online and traditional courses and
how did they differ in terms of gender, age, ethnicity, and financial aid?

41
Consistent with Bangurah’s (2004) findings, nearly two-thirds of the students were
female. The overwhelming majority of students were Caucasian (85%). This large
discrepancy in ethnic diversity might be indicative of the location as Robinson and Hullinger
(2008) found a startling close resemblance in their Midwest study with 84% of online
students being Caucasian. Additionally, 4,061 (34%) of the students who enrolled in both
online and traditional courses received a Pell Grant. While the Pell Grant is not the only
means of denoting financial aid, it was the only indication within the constraints of students’
enrollment files. Therefore, it is not an inclusive measure of all students who may require
additionally financial assistance. It is likely that the financial aid need is greater than what is
expressed by Pell Grant recipients. Lastly, the ages of the students were sub-divided into four
categories drawing upon Hagedorn’s (2005a) age model. Analysis indicated that 53% of the
total sample was represented in ages 22-30 and the smallest minority was represented by
5.3% of students ages 46 and over.
These demographic markers reinforce the concept that online students are a moving
target (Instructional Technology Council, 2009). The growth and availability of online
classes has ultimately influenced access. Whereas, females were once considered at a
disadvantage due to access (Kirkup & von Prümmer, 1997), they clearly represent the
majority of online students. Moreover, where female students were thought to be limited by
family constraints (Wolf, 1998), online courses may be providing an important alternative.
Similarly, Pell Grant recipients represent a commonly perceived disadvantaged population
that has shown promising enrollment in this study. Public institutions on average have a Pell
Grant student enrollment of 19% (Heller, 2004). Thus this sample shows a rather large
proportion of Pell Grant recipients (34%) indicating that the options of online courses may be
increasingly more attractive to students with financial need and constraints. Lastly, this
sample shows with over half the DMACC population (11,970 students) enrolling in at least
one online course, that online courses are a popular alternative to some traditional courses.
Where some studies indicate that online students are older (Gibson & Graff, 1992;
Thompson, 1998; Doherty, 2006), the majority of students in this sample were ages 22-30
and students ages 17-21 categorized the second largest population. Thus, this study supports
the trends cited by the Instructional Technology Council (2009) that online students are
getting younger. It is likely that due to access, the growth of technology, and the prevalence

42
of online courses that the enrollment growth of students of who are limited by financial,
work, or family constraints will continue; however, the rate at which enrollment increases
may begin to plateau.
The second research question explored the distribution of online and traditional
courses and the differences among students within course mode categories. In order to better
understand the distribution of web and traditional courses, course modes were created to
identify those students who heavily enrolled in traditional courses, web courses, or who
evenly participated in both. In this manner, students can be compared to other students who
are most similar to them in course-taking behaviors. The percent of online courses was
calculated for each student. From this percentage, three categories were developed:
traditional-dominant, web-balanced, and web-dominant. Traditional-dominant students were
defined as those students whose online course percentage was 30% or lower of their class
taking percentage and were coded as 1. Web-balanced students had an online class
percentage of 40 to 60% and were coded as 2. Web-dominant students had an online class
percentage of 70% or above and were coded as 3.
Discrepancy within the literature suggested that inquiry to the difference in students’
age with regard to course mode would be insightful (Gibson & Graff, 1992; Instructional
Technology Council, 2009; Thompson, 1998). The data revealed that while students ages 22-
30 represent the largest number and percentage within each category, that students 31-45 and
students 46 and over demonstrated their highest category percentages within the web-
dominant category. So while Robinson and Hullinger (2008) found that 85% of all students
enrolled in online classes were less than 25 years old, this percentage may not accurately
reflect the motivation and willingness of older students to participate in online courses. It is
likely that younger students will have an overall greater presence by their sheer number in
any course mode category; however, in observing course mode populations, older students
have an increasingly greater presence in online courses.
Similarly, percentages of students who received Pell Grants within each course mode
provided more clarity to understanding course taking behaviors. Within all course modes,
those students who did not receive a Pell Grant were greater in number than those who did.
However, the category where Pell Grant receiving students received the highest total
percentage and had the small disparity compared to students who did not receive a Pell Grant

43
was within the web-dominant category with 42.8%. Again, since Pell Grant students are
disadvantaged due to financial constraints, online courses may provide an opportunity to
balance these financial constraints with work and family.
Ultimately, course mode sample populations may more accurately depict course
taking behavior. By categorizing students by their course mode, analysis can be conducted
revealing the likeness of certain groups of students to enroll more heavily in either traditional
or online courses. Consequentially, this information may be able to uncover the trends and
reveal those student groups who are most likely to succeed in a particular course setting.
In the third research question, differences in demographics and course mode were
called into question when students’ success was measured by GPA in online and traditional
courses. The GPAs of students who are currently enrolled in traditional and online courses
was compared. Across gender, age, course mode, Pell Grant status, and ethnicity a higher
mean GPA score was attained in traditional courses than in web courses. Additionally, the
correlation of each of demographic categories proved to have a significant relationship. This
finding is consistent with Bangurah’s (2004) study which found that among 3,601 students,
traditional GPAs were higher than students’ web-based courses. Comparisons within these
demographic categories confirmed that women did attain higher GPAs in web courses than
men indicating that scholarly arguments which expressed concern that women were not
performing as well as men in online settings may no longer be valid (Kirkup & von
Prümmer, 1997; Wolf, 1998). Instead, Price’s (2006) findings that women are more
successful in online settings than men were supported. Likewise, the positive correlation in
students’ age and GPA found in this study was also cited in the findings of Diaz (2000,
2002).
The only instance where a traditional GPA was not found to be higher than web GPA
was found within CIP code families. Interestingly, Hall (2008) found that the type of class a
student enrolled in was a better predictor of success in online class settings than traditional
survey methods. In this study, CIP code 16 - Foreign Languages, Literature, and Linguistics
showed a slightly higher mean web GPA by a .01 increase. Twenty-one students were
classified in CIP code 16 of a possible 10,295 students. The sample sizes within these CIP
codes varied greatly from six students in CIP code 46 to 6,997 students in CIP code 24.
Respectfully, the two largest populations of CIP codes are represented by 24 – Liberal Arts

44
and Sciences (N=6997) and 52 – Business, Marketing, Management and other Support
Services (N=1661). Since DMACC is a community college, the high concentration of liberal
arts and business students is not alarming. Instead, it would be expected that CIP code
populations would vary more widely at 4-year institutions and that specialized schools would
see a higher concentration among certain CIP code families. Thus, CIP code 16’s (Foreign
Languages) population is small in comparison to the other CIP code categories. However,
since the only instance where a web GPA was higher than a traditional GPA, Hall’s (2008)
study may have a more substantial claim that the type of academic program may be a better
determinate of student success particularly, in institutions where academic offerings vary
more widely.
When ethnicity was considered, again students despite classifications demonstrated a
higher mean GPA in traditional classes than in web classes. Caucasian students attained the
highest GPA in traditional classes (2.76) while Asian students attained the highest web GPA
(2.52) and showed the least amount of standard deviation (SD=1.33). Modest correlation was
demonstrated across all ethnicities. Further analysis using a one-way ANOVA and Tukey
analysis reveal significant differences between ethnic groups. Specifically, Black students
showed a significantly negative difference in web GPA than all other ethnicities and
Hispanic students showed a significantly negative difference in web GPA when compared to
Caucasian and Asian students. The struggle for minority students’ performance at the college
level has been well-documented (Nora & Cabrera, 1996). Drawing from the work of Nettles,
Theony, and Gosman (1986), it might be speculated that online courses do not provide as
strong of support system as do traditional classes. Yet minority student performance at a
largely White institution cannot be measured by GPA alone.
Thus the fourth research question asked, “Among students who take both online and
traditional courses, how do course completion rates differ between the two course types? Are
there significant differences in course completion rates based upon student demographic or
on course mode?” As Diaz (2002) stated attrition in online courses has been one of the main
influential factors that has prompted much of the research in online education. Since students
were used as their own controls, this study sought to compare the course taking behaviors in
conjunction with students’ demographic variables. Course completion ratios (CCRs) were
calculated from the percent of students’ online course enrollments and T-test were performed

45
with student’s demographic descriptors. Students obtained higher CCRs in traditional courses
than they did in web courses across gender, age, course mode, Pell Grant status, and
ethnicity.
However, CCRs in web based courses did fluctuate within demographic categories.
Consistent with the success marked within areas of GPA, females obtained higher CCRs than
male students in both traditional and web courses. While Doherty (2006) did not find gender
to be a determining factor to students online course completion success, this study found
gender to be a significant factor supporting the work of Aragon and Johnson (2008), Nesler
(1999), and Price (2006). However, whereas Aragon and Johnson (2008) did not find age to
be a significant in determining “completers” from “non-completers”, Doherty (2006) did.
Doherty’s findings that students’ age positively correlated to successful course completion
are aligned with this study that CCRs positively correlate with students’ age groups within
web courses. Subsequently, Aragon and Johnson also did not find that financial aid held
significance in student course completion variables. Yet, this study found that those students
receiving Pell Grants (coded as 1) received lower CCRs than those students who did not
receive Pell Grants (coded as 0) in both traditional and web courses. Since Aragon and
Johnson did conduct their study within the Midwest, regional differences would not likely
indicate the difference in findings. However, since financial aid was categorized by “eligible”
or “not eligible”, students did not necessarily have to be receiving financial aid in order to be
place in that specific category. Also, Aragon and Johnson’s study did not specify the type of
financial aid or amounts required. Thus, in this study by using a more stringent measure of
financial aid namely, the Pell Grant, it may be more indicative of the population of students
that requires and utilizes financial aid.
With regard to course mode, web-dominant students had the highest CCR in web
courses (M=.65); although, this was still lower than their traditional CCR (M=.69). Course
mode was also the dependant variable that displayed the highest amount of variance in mean
differences. This variable also contained the lowest mean difference of .04 within Web-
dominant students and the highest mean difference of .16 within Traditional-dominant
students. This suggests that students more consistently complete their online courses with the
more experience they have in online enrollment.

46
Despite Aragon and Johnson’s (2008) conclusion that ethnicity was not indicative of
course completion. This study revealed that all ethnicities fared significantly better in their
traditional CCR than in their Web CCR. Asian students attained the highest web CCR (.61)
and also showed the least amount of standard deviation (.43). The correlation coefficients for
all ethnic groups were found to be significant with moderate strength in relationship. Using a
one-way ANOVA, further analysis revealed significant differences between ethnic groups as
well. Black students had the largest mean difference in CCR across ethnicities in both
traditional and web courses. The mean difference in black students’ CCR was significantly
negative in comparison to Caucasian and Asian students’ web CCRs. Hispanic students also
had significantly lower mean CCRs when compared to Caucasian and Asian students’ web
CCR. As Nora and Cabrera (1996) accounted, numerous studies have examined why
minority students have higher rates of attrition and while there appears to be numerous
contributing factors at play, it is unclear why Asian students would excel in the online
environment. Nora and Cabrera (1996) and Muilenburg and Berge (2005) found that
perceptions could also affect student performance, thus Asian student success could be
related to the perception that Asian students are more apt in math, science, and technology
and thus more attuned to an online setting. Since social factors may also influence minority
student performance (Muilenburg & Berge, 2005) it is hard to ascertain if performance
differences are directly related to being Asian or if they are secondary to the perception of
Asian student performance.
SUMMARY OF FINDINGS
Ultimately this study looked at students’ who enroll in both online and traditional
courses. Thus although these students could not be classified as strictly “online” or
“traditional” students, the majority of these students were female, Caucasian, ages 22-30, and
enrolled in Liberal Arts studies. While the majority of these students did not receive a Pell
Grant, 34% were recipients. It is likely that these demographics can be largely attributed to
the institutional-type, the location of the institution, and convenience offered by online
courses. However, further exploration of student characteristics prompted the development of
course mode categories. Traditional-dominant students constituted the largest population of
students; although, older students demonstrated their highest population percentages in web-

47
balanced and web-dominant categories. Even within these categories, the comparably large
presence of Pell Grant recipients in the web-dominant course mode indicates that access to
technology may becoming easier for disadvantaged students.
This study found significant differences in students’ traditional and online course
performance when compared along lines of gender, age, course mode, Pell grant status, and
ethnicity. All students were more likely to perform better in online settings in terms of mean
GPA and CCR when compared across gender, age, course, mode, Pell grant status, and
ethnicity. In online courses, (a) females outperformed males, (b) older students outperformed
younger students, (c) web-dominant students outperformed traditional-dominant and web-
balanced students, and (d) students who did not receive a Pell Grant outperformed recipients
obtaining both a higher average GPA and CCR. In fact, course mode was positively
correlated with success in online classes, suggesting that it may be a useful indication of
student performance and course-taking behaviors. When ethnicity was considered, Caucasian
performed the best in traditional courses but Asian students outperformed all other ethnicities
in online courses. Consequentially, Hispanic and Black students had the lowest GPAs and
CCRs. There was one instance when students’ mean GPA was higher in an online setting
than in the traditional classroom and this occurred when students were divided by CIP code
families. Yet, in this instance the sample size was severely disproportionate to the total
population.
RECOMMENDATIONS
As over half of DMACC’s student population qualified as having enrolled in both
types of courses, it is probable that studies will see an increasing amount of students who
enroll in both online and traditional courses. Therefore, more studies should consider
exploring students who enroll in both course settings. Likewise, this study indicated that
course mode may predict success in class performance. This method would be especially
helpful in settings where the sheer number within the “majority” can overshadow the
performance of the “minority”. Thus, researchers and practitioners should further explore
students’ course modes in order to better understand student performance and course-taking
behavior. Specifically, it would be interesting to see how differences in ethnicity, age, and
gender are formed when course mode is considered. Additional research should also

48
investigate the extent to which CIP families or academic disciplines are factors in online
success. Ideally, such studies would be conducted at institutions where there are greater
sample populations of academic offerings. Differences in course taking behaviors might
provide further indicators of online success.
Lessons learned from this study would suggest that there are significant differences
between students’ performance in online and traditional courses. Students, in fact, do on
average perform better in traditional courses and there are significant differences in online
performance as measured by demographic characteristics. Therefore, the literature must be
re-evaluated in context specific settings since there is a high degree of conflict within the
literature; namely that demographic variables may constitute differences in traditional versus
online success when measure by GPA and CCR. Transcript analysis would seemingly
provide an excellent vehicle for such research particularly at the community college level
where students are often absent from other more conventionally types of research. However,
other types of research are needed to investigate the underlying reasons behind why certain
types of students are more likely to succeed than others in an online setting. Additionally,
since transcript analysis alone cannot account for differences in course delivery, it would also
be beneficial for future studies to incorporate research that can evaluate the differences by
instructor and/or support services for online students.
Although, students perform best in an online setting, this study displays the
importance of online course offerings. In particular, higher population percentages of
disadvantaged students like Pell Grant recipients are present in web-dominant classes
demonstrating the possibility that such course offerings are more attractive either because of
the financial or time constraints these students face. Thus, it would be recommended that
DMACC evaluate its online course offerings to ascertain if student success is mitigated in
comparison to traditional courses either due to differences in instructor, delivery, or support
services. Ideally, such research combined with existing literature may be able to inform best
practices for online courses and maximize student success in these courses.
Since this study is restricted to one Midwest community college, findings within this
study cannot be generalized. In fact, it is likely that the unique population of represented in
this study is limited to DMACC. Furthermore, other studies have shown that because online
course offerings differ greatly across institutions, it is hard to replicate results and/or draw

49
generalized findings (Allen & Seaman, 2006; Russell, 2001). However, this study does
provide evidence to suggest that similar institutions may have significant differences within
student performance in online and traditional courses and that course mode and academic
majors may provide further clarity in understanding online course-taking trends.

50
REFERENCES
Adelman, C. (1999). The new college course map and transcript file: Changes in course-taking and achievement, 1972-1993 (Report: ED434647). Washington, DC: US Department of Education.
Adelman, C. (2004). The empirical curriculum: Changes in postsecondary course-taking, 1972-2000. Washington, DC: US Department of Education.
Adelman, C. (2006). The toolbox revisited: Paths to degree completion from high school through college. Washington, DC: US Department of Education.
Allen, I. E., & Seaman, J. (2006). Making the grade: Online education in the United States. Needham, MA: The Sloan Consortium.
Aragon, S. R., & Johnson, E. S. (2008). Factors influencing completion and noncompletion of community college online courses. The American Journal of Distance Education, 22(3), 146-158.
Bailey, T., Jenkins, D., & Leinbach, T. (2005). Is student success labeled educational failure? Student goals and graduation rates in the accountability debate at community colleges. New York: Columbia University, Teachers College, Community College Research Center.
Bangurah, F. M. (2004). A study of completion and passing rates between traditional and web-based instruction at a two-year community college in northeast Tennessee Unpublished doctoral dissertation, East Tennessee State University, Johnson City, TN.
Carr, S. (2000). As distance education comes of age, the challenge is keeping the students. Chronicle of Higher Education, 46(23), A39-A41.
Cox, R. D. (2005). Online education as institutional myth: Rituals and realities at community colleges. Teachers College Record, 107(8), 1754-1787.
Cragg, C. E., Dunning, J. & Ellis J. (2008). Teacher and student behaviors in face-to-face and on-line courses: Dealing with complex concepts. Journal of Distance Education, 22(3), 115-128.
Diaz, D. P. (2000). Comparison of student characteristics, and evaluation of student success, in an online health education course Unpublished doctoral dissertation, Nova Southeastern University, Fort Lauderdale, FL.
Diaz, D. P. (2002). Online drop rate revisited. Technology Source Archives. Retrieved April 2, 2009, from http://technologysource.org/article/online_drop_rates_revisited/.
Doherty, W. (2006). An analysis of multiple factors affecting retention in web-based community college courses. Internet and Higher Education, 9(4), 245-255.
Easterday, N. (1997). Distance education and two-year colleges. Community College Journal of Research and Practice, 21(1), 23-36.

51
Gibson, C. C., & Graff, A. O. (1992). Impact of adults’ preferred learning styles and perception of barriers on completions of external baccalaureate degree programs. Journal of Distance Education, 7(1), 39-51.
Gladieux, L. E., & Swail, W. S. (1999). The virtual university and equal opportunity: issues of equity and access for the next generation. Washington, DC: College Board.
Hagedorn, L. S. & Kress, A. M. (2008). Using transcript in analyses: Directions and opportunities. New Directions for Community Colleges, 143, 7-17.
Hagedorn, L. S. (2005b). Transcript analyses as a tool to understand community college student academic behaviors. Journal of Applied Research in the Community College, 13(1), 45-57.
Hagedorn, L.S. (2005a). Square pegs adult students and their “fit” in postsecondary institutions. Change, 371, 22-29.
Hall, M. (2008). Predicting student performance in web-based distance education courses based on survey instruments measuring personality traits and technical skills. Online Journal of Distance Learning Administration, 6(3), 1-10.
Hammond, R. J. (1997, August). A comparison of the learning experiences of telecourse students in community and day sections. Paper presented at the Distance Learning Symposium, Utah Valley State College, Orem, Utah.
Heller, D. E. (2004). Pell Grant recipients in selective colleges and universities. In R. D. Kahlenberg (Ed.), America's untapped resource: Low-income students in highereducation (pp. 157-166). Washington, DC: Century Foundation Press.
Instructional Technology Council. (2009). 2008 distance education survey results: Tracking the impact of eLearning at community colleges. Washington, DC: Instructional Technology Council.
Iowa Department of Education. (2008). The annual condition of education report. Des Moines, IA: State of Iowa, Department of Education.
Kelly, H. F., Ponton, M. K., & Rovai, A. P. (2007). A comparison of student evaluations of teaching between online and face-to-face courses. Internet and Higher Education, 10(2), 89-101.
Kirkup, G. & von Prümmer, C. (1997) Distance education for European women: The treats and opportunities of new education forms and media. European Journal of Women’s Studies, 4(1), 39-62.
Kozeracki, C. (1999). Scratching the surface: Distance education in the community colleges. In G. Schuyler (Ed.), New Directions for Community Colleges (pp 89-99). San Francisco, CA: Jossey-Bass.
Maxwell, M. (2003). The challenge of teaching educational technology courses online. Retrieved April 2, 2009, from http://www.mtsu.edu/~itconf/proceed03/119.html/
McHenry, L., & Bozik, M. (1997). From a distance: Student voices from the interactive video classroom. Tech Trends, 42(6), 20-24.

52
Monaghan, P. (1995). Technology and the unions: Faculty labor leaders air hopes and concerns as colleges enter the electronic age. Chronicle of Higher Education, 41(22), A17.
Muilenburg, L. Y., & Berge, Z. L. (2005). Student barriers to online learning: A factor analytical study. Distance Education, 26(1), 29-48.
Nesler, M. S. (1999). Factors associated with retention in a distance-based liberal arts program. Retrieved April 2, 2009, from http://www.eric.ed.gov/PDFS/ED442440.pdf
Nettles, M. T., Thoeny, A. R., & Gosman, E. J. (1986). Comparative and predictive analyses of Black and White students’ college achievement and experiences. Journal of Higher Education, 57(3), 289-318.
Nipper, S. (1989) Third generation distance learning and computer conferencing. In R. Mason & A. Kaye (Eds.), Mindweave: Communication, computers and distance education (pp 56-74). Toronto, Canada: Pergamon Press.
Nobel, D. (1995) Progress without people: New technology, unemployment, and the message of resistance. Toronto, Canada: Between the Lines.
Nora, A., Cabrera, A. F. (1996). The role of perceptions of prejudice and discrimination on the adjustment of minority students to college. Journal of Higher Education, 67(2), 119-148.
O’Gara, L., Karp, M. M., Hughes, K. L. (2009). An exploratory study of student perspectives. Community College Review, 36(3), 195-218.
Parker, A. (1999). A study of variables that predict dropout from distance education. International Journal of Educational Technology, 1(2), 1-10.
Parsad, B. & Lewis, L. (2008). Distance education at degree-granting postsecondary institutions: 2006-07. Washington, DC: U.S. Department of Education, Institute of Education Sciences.
Portman, D. (1978). The universities and the public: A history of higher adult education in the united states. Chicago, IL: Nelson-Hall.
Price, L. (2006). Gender differences and similarities in online courses: Challenging stereotypical views of women. Journal of Computer Assisted Learning, 22(5), 349-359.
Provasnik, S., & Planty, M. (2008). Community colleges: Special supplement to the condition of education 2008. Washington, DC: U.S. Department of Education, Institute of Education Sciences.
Ridley, D. R., & Husband, J. E. (1998). Online education: A study of academic rigor and integrity. Journal of Instructional Psychology, 25(3), 184-188.
Robinson, C. & Hullinger, H. (2008). New benchmarks in higher education: Student engagement in online learning. Journal of Education for Business, 84(2), 101-109.
Russell, T. (1999). The no significant difference phenomenon. Chapel Hill, N.C: Office of Instructional Telecommunications, North Carolina State University.

53
Russell, T. (2001). The no significant difference phenomenon: A comparative research annotated bibliography on technology for distance education Montgomery, AL: International Distance Education Certification Center.
Scigliano, J. A. (2000). The internet and higher education special issue on the history of online learning. Internet and Higher Education, 3(1), 1-5.
Sumner, J. (2000). Serving the system: A critical history of distance education. Open Learning, 15(3), 267-285.
Tallent-Runnels, M. K., Thomas, J. A., Lan, W. Y., Cooper, S., Ahern, T. C., Shaw, S. M., et al. (2006). Teaching courses online: A review of the research. Review of Educational Research, 76(1), 93-135
Thompson, M. M. (1998). Distance learners in higher education. In C. Gibson (Ed.), Distance learners in higher education: Institutional responses for quality outcomes (pp. 9-24). Madison, WI: Atwood.
Verduin, J. & Clark, T. (1991). Distance education: The foundations of effective practice. San Francisco, CA: Jossey-Bass.
Willis, B. (Ed.). (1994). Distance education: Strategies and tools. Englewood Cliffs, NJ: Educational Technology.
Wolf, A. (1998). Exposing the great equalizer: Demythologizing internet equity. In B. Ebo, (Ed.), Race, class and gender on the Internet (pp. 15-32). Westport, CT: Praeger.
Yates, S. J. (2001). Gender, language and CMC for education. Learning and Instruction, 11(1), 21-34.
54
APPENDIX A
CIP CODE FAMILIES

55
Table 15. CIP Code Family Chart
CIP CODE Discipline(s)
01 Agriculture, Agriculture Operations, and Related Sciences
10 Communications Technologies/Technicians and Support Services
11 Computer and Information Sciences and Support Services
12 Personal and Culinary Services
14 Engineering
15 Engineering Technologies and Engineering-Related Fields
16 Foreign Languages, Literatures, and Linguistics
19 Family and Consumer Sciences/Human Sciences
22 Legal Professions and Studies
24 Liberal Arts and Sciences, General Studies and Humanities
26 Biology and Biomedical Sciences
31 Parks, Recreation, Leisure, and Fitness Studies
43
Homeland Security, Law Enforcement, Firefighting and Related
Services
44 Public Administration and Social Service Professions
46 Construction Trades
47 Mechanic and Repair Technologies/Technicians
48 Precision Production
50 Visual and Performing Arts
51 Health Professions and Related Programs
52 Business, Management, Marketing, and Related Support Services

56
APPENDIX B
HAGEDORN'S AGE MODEL

57
Table 16. Hagedorn's Age Model Table
Category Age in Years
Traditional Aged Students 17-21
Young Adults 22-30
Prime Timers 31-45
Last Chancers 46 and over