business plan analysis of a new venture for an online travel accomodation
TRANSCRIPT

BUSINESS PLAN ANALYSIS OF A NEW VENTURE FOR AN ONLINE
TRAVEL ACCOMODATION RESERVATION SERVICE
by
Bernadett Maxwell
PROJECT SUBMITTED IN PARTIAL FULFILLMENT OF
THE REQUIREMENTS FOR THE DEGREE OF
MASTER OF BUSINESS ADMINISTRATION
In the
Faculty
of
Business Administration
© Bernadett Maxwell, 2011
SIMON FRASER UNIVERSITY
Spring 2011
All rights reserved. However, in accordance with the Copyright Act of Canada, this work
may be reproduced, without authorization, under the conditions for Fair Dealing.
Therefore, limited reproduction of this work for the purposes of private study, research,
criticism, review and news reporting is likely to be in accordance with the law,
particularly if cited appropriately.
ii
Approval
Name: Bernadett Maxwell
Degree: Master of Business Administration
Title of Project: Business Plan Analysis of a New Venture for an Online
Travel Accommodation Reservation Service
Supervisory Committee:
___________________________________________
Mark Frein,
Adjunct Professor, Faculty of Business
___________________________________________
Colleen Collins
Associate Professor, Faculty of Business
Date Approved: ___________________________________________

iii
Abstract
This paper is business plan analysis for developing a niche online travel agency business. The
entity is in the very early stages of setup, and the initial service will provide online reservations
capabilities for accommodations and other services targeted to golf and ski activity based
travellers.
The paper examines the online travel agency industry, and performs a competitive analysis of the
main competitors in the industry, as well as the niche players looking to capture a similar market
niche. The paper also reviews market segmentation, and analyzes the behaviour and needs of the
target market to determine if the development of this service will be a viable business. Lastly the
paper examines the operational considerations of establishing the business to provide the services,
and to operate the business successfully.
Keywords: New business venture, business plan, online travel agency, OTA, travel reservation
service.

iv
Dedication
I dedicate this paper in loving memory of my father who saw great value in higher
education. He provided support and encouragement to make it through the laborious times and
provided inspiration to achieve my goals. One thing he always said was “you can never learn too
much, but you can most certainly learn to little”.
I also dedicate this paper to my children Chad and Lisa who have encouraged and
supported me throughout this program and to my mother whose prayers and wishes are always
with me.

v
Table of Contents
Approval .......................................................................................................................................... ii
Abstract .......................................................................................................................................... iii
Dedication ....................................................................................................................................... iv
Table of Contents ............................................................................................................................. v
List of Figures .............................................................................................................................. viii
List of Tables ................................................................................................................................... ix
Glossary ............................................................................................................................................ x
1: INTRODUCTION ...................................................................................................................... 1
1.1 Objective ................................................................................................................................. 1
1.2 Methodology of Analysis ........................................................................................................ 1
1.3 Business Concept .................................................................................................................... 2
1.3.1 Business Opportunity ................................................................................................. 2 1.3.2 Revenue Model .......................................................................................................... 3
2: INDUSTRY ANALYSIS ............................................................................................................ 4
2.1 Industry Background ............................................................................................................... 4
2.2 Industry Players ....................................................................................................................... 4
2.3 Industry Size and Profitability ................................................................................................. 6
2.4 Industry Value Chain .............................................................................................................. 7
2.5 Porter’s 5 Forces Analysis ..................................................................................................... 10
2.5.1 Industry Rivalry........................................................................................................ 11 2.5.2 Threat of New Entrants ............................................................................................ 11 2.5.3 Threat of Substitutes................................................................................................. 12 2.5.4 Supplier Power ......................................................................................................... 12 2.5.5 Buyer Power ............................................................................................................. 13 2.5.6 Complementors ........................................................................................................ 14 2.5.7 Impact of Technology .............................................................................................. 14 2.5.8 Government Regulations .......................................................................................... 14
2.6 Assessment of Industry Attractiveness .................................................................................. 15
2.7 Key Success Factors .............................................................................................................. 16
3: COMPETETIVE ANALYSIS ................................................................................................. 18
3.1 Competitors ........................................................................................................................... 18
3.1.1 Competitive Factors ................................................................................................. 19 3.1.2 Niche Market Competitors ....................................................................................... 21 3.1.3 Competitor Products Features and Content .............................................................. 22
4: MARKET ANALYSIS............................................................................................................. 25
4.1 Target Market and Segmentation .......................................................................................... 25

vi
4.2 Product Segmentation ........................................................................................................... 26
4.3 Customer Segmentation ........................................................................................................ 27
4.3.1 Customer Groups...................................................................................................... 28 4.3.2 Activity Interests Segmentation ............................................................................... 29 4.3.3 Demographics Segmentation .................................................................................... 30 4.3.4 Buyer Behaviour ...................................................................................................... 34 4.3.5 Market Size and Trends ............................................................................................ 34
4.4 Customer Needs .................................................................................................................... 35
4.5 Strategic Positioning ............................................................................................................. 35
4.5.1 Strategy .................................................................................................................... 36 4.5.2 Positioning Approach ............................................................................................... 36 4.5.3 Target Segment Characteristics ................................................................................ 37 4.5.4 Position ..................................................................................................................... 37
4.6 Market Entry ......................................................................................................................... 38
4.7 Marketing .............................................................................................................................. 39
4.7.1 Product ..................................................................................................................... 40 4.7.2 Price .......................................................................................................................... 41 4.7.3 Place ......................................................................................................................... 42 4.7.4 Promotion ................................................................................................................. 42 4.7.5 Marketing Strategy ................................................................................................... 43
5: OPERATIONAL PLAN .......................................................................................................... 45
5.1 Organizational Structure ....................................................................................................... 45
5.2 Management Team ................................................................................................................ 45
5.2.1 Advisory Board ........................................................................................................ 47
5.3 Human Resources .................................................................................................................. 47
5.3.1 Personnel Plan .......................................................................................................... 47
5.4 Development Plan ................................................................................................................. 48
5.5 Systems ................................................................................................................................. 48
5.6 Partnerships ........................................................................................................................... 50
5.7 Risks and Assumptions ......................................................................................................... 50
5.7.1 Risks ......................................................................................................................... 50 5.7.2 Assumptions ............................................................................................................. 50
6: FINANCIALS ........................................................................................................................... 51
6.1 Economics of the Business Model ........................................................................................ 51
6.1.1 Revenues .................................................................................................................. 51 6.1.2 Expenses ................................................................................................................... 52 6.1.3 Operating Leverage .................................................................................................. 52 6.1.4 Breakeven Chart and Calculation ............................................................................. 53
6.2 Financial Projections ............................................................................................................. 53
6.2.1 Summary of Financial Statements ............................................................................ 55
7: Conclusion ................................................................................................................................. 56
Appendices .................................................................................................................................... 57
Appendix A – Financial Projections ............................................................................................... 58
Annual Pro Forma 5 Year P&L ............................................................................................. 58

vii
Annual Pro Forma 5 Year Revenue Statement...................................................................... 58 Annual Pro Forma 5 Year Cash Flow Statement .................................................................. 59 Annual Pro Forma 5 Year Balance Sheet .............................................................................. 59 Detailed Pro Forma P & L – Year 1 ...................................................................................... 60 Detailed Pro Forma Revenue Statement – Year 1 ................................................................. 60 Detailed Pro Forma Cash Flow Statement – Year 1.............................................................. 60 Detailed Pro Forma Balance Sheet – Year 1 ......................................................................... 61 Detailed Pro Forma P & L – Year 2 ...................................................................................... 62 Detailed Pro Forma Revenue Statement – Year 2 ................................................................. 62 Detailed Pro Forma Cash Flow Statement – Year 2.............................................................. 63 Detailed Pro Forma Balance Sheet – Year 2 ......................................................................... 63
Reference List ............................................................................................................................... 64

viii
List of Figures
Figure 2.1 Online Travel Distribution Value Chain. ....................................................................... 8
Figure 2.2 Porter’s 5 Forces for Online Travel Reservation Services ........................................... 10
Figure 4.1 Activities of US travellers ............................................................................................ 29
Figure 4.2 Activities that motivate trips for US travellers ............................................................. 30

ix
List of Tables
Table 2.1 Current Global Distribution Systems ............................................................................. 5
Table 2.2 Online Travel Agents ..................................................................................................... 7
Table 3.1 Competitive Factors of Key Competitors ..................................................................... 20
Table 3.2 Golf and Ski Accommodation Distribution Competitors ............................................. 22
Table 3.3 Competitive Factors of Niche Market Competitors ..................................................... 24
Table 4.1 Accommodation Stayed At During Overnight Trips for Activity Related
Travel ........................................................................................................................... 27
Table 4.2 Demographic Profile of Golfers Relative to all U.S. Pleasure Travellers .................... 31
Table 4.3 Demographic Profile of Skiers or Snowboarders Relative to all U.S. Pleasure
Travellers ..................................................................................................................... 33
Table 5.1 Potential Online Reservation Software Systems .......................................................... 49
Table 6.1 Product Revenues ......................................................................................................... 52
Table 6.2 Breakeven Analysis ...................................................................................................... 53

x
Glossary
CRS. Computerized Reservation Systems refer to systems initially developed by the
airlines as their internal systems used to manage seat reservations.
GDS Global Distribution Systems are the electronic travel distribution networks that
evolved from airline CRS systems that provide the reservation technology and
infrastructure to enable travel bookings for multiple travel products and
suppliers.
GNE Global New Entrants refers to companies that emerged in the mid 2000s
offering travel distribution services in competition to the GDS companies using
newer technologies and open architecture designs, which could provide better
service to travel suppliers at a much lower cost. One example is ITA software.
GPS Global Positioning System is a system of satellites receivers and computers used
to determine the position on the earth’s surface.
Google Maps A mapping application developed by Google that utilizes GPS systems and
satellite images to provide maps of locations, directions between locations, and
images of the earth’s surface at a location.
Meta search
engine
A meta search engine is a tool used to search several search engines or
databases by sending requests to the various sources and aggregating the results
into a single list, or listing the results for each source.
OTA Online Travel Agencies are companies who provide travel planning information
and booking capabilities primarily online and have minimal call centre activity.
Some examples include: Expedia, Orbitz, Travelocity, Priceline.
TMC Travel Management Company is a travel agency for the business travel market,
which includes call centre and online sales and often also includes additional
travel management functions and reporting for companies.
Traditional
Travel
Agencies
Are companies that provide travel planning and reservation services for clients
primarily through a brick and mortar office location with call centre sales and
by directly accessing the GDS systems to make travel reservations for clients.
Travel
Suppliers
Travel suppliers include airlines, hotels, bed and breakfasts, cruise lines, car
rental companies and other travel related service providers.

1
1: INTRODUCTION
This paper provides a business plan analysis for a new online travel reservation agency.
The business is currently in the very early start-up stage and the business founders are performing
this research and analysis to evaluate the feasibility of moving ahead with the business. The goal
is to understand what business strategies need to be employed, and what financial and resource
commitments will be required to make this business a success.
1.1 Objective
The objective of this paper is to analyze the dynamics of the Online Travel Agency
(OTA) industry and determine the key success factors to compete effectively in this industry.
The paper will also outline a competitive analysis discussing the competitors, and competitive
factors that a new company will need to consider. In addition, the paper will provide a market
analysis to understand the target market and segmentation, and provide strategies for market
positioning and market entry. Further analysis will consider the operational requirements for a
new company to create a successful business considering the resources, management,
competencies and operational requirements of this type of business. The outcome of the analysis
will be a conclusion of whether the founders should move forward with executing this new
business plan.
1.2 Methodology of Analysis
Various market forces exist within the marketplace that can make an entire industry more
or less profitable. It is important to closely examine the forces at work in the Online Travel
Agency industry and understand the challenges for a new company in this industry. A framework
developed by Michael Porter provides a method to model the influence of five key forces on
industry profitability. Porter’s Five Forces model is used to perform the industry analysis on the
Online Travel Agency industry and to examine the competitive forces at work that will influence
this new business venture. The competitive forces to be explored comprises: industry rivalry –
the extent to which the value captured by an industry is lost through competition between firms,
threat of entry – the existence of or lack of barriers that impede new firms from entering a
2
profitable industry, threat of substitutes – the potential for substitute products or services to
impact an industry’s profitability, buyer power – the extent to which customers can influence the
pricing or services offered (as in the case of large buyer firms such as Walmart), and supplier
power – the extent to which suppliers can influence the pricing or services offered, (as in the case
of limited supply of input products available from only a few firms).
Competitive forces are considered -- evaluating strategic alternatives and determining
appropriate strategies for a new company to successfully enter this business and to capture market
share from existing competitors. The competitive analysis is based on a competitive analysis
framework also developed by Michael Porter. This framework analyzes four key aspects of a
competitor which includes: a competitors objectives, assumptions, strategy and capabilities.
Silk’s concepts on marketing process and strategy through which a company creates
value for its customers, form the basis of the market analysis. Following these concepts, the
marketing strategy components of identifying customer segments and demographics to select a
target market are explored. The analysis will further examine the strategic alternatives for
marketing services according to Lovelock’s services marketing framework, by defining the
strategic positioning of the service offering, as well as the market entry strategy, marketing plan,
and pricing strategies to achieve the desired positioning.
An operational plan for the company is outlined considering the company’s internal
capabilities and what can be developed to exploit the business opportunity that is crucial to the
company’s success. This includes a review of resources both human, managerial and financial
resources that will be required for the business to operate and grow effectively.
1.3 Business Concept
1.3.1 Business Opportunity
With the ever expanding use of the internet and online travel booking sites for vacation
planning, opportunities may exist for niche travel reservation offerings in the Online Travel
Agency industry. Golfandskivacations.com is a new start-up company looking to capitalize on
these opportunities by offering an online travel reservation service, specialized in golf and ski
vacation accommodation reservation services. The company plans to offer competitive rates for
hotel accommodation product distribution for many types of hotel properties, from small
independent hotels to five star luxury residences, located at the top golf and ski resort destinations
within North America.

3
Golf and Ski Vacations (GSV) intends to offer an efficient, informative, and user-friendly
website for leisure travellers to book reservations for their golf and ski holiday vacations.
Travellers will be able to easily make accommodation reservations, for a vast range of hotel
rooms, condos, and vacation home properties, located at or near golf and ski resorts in North
America, at very competitive rates. The service will also provide a more competitive distribution
channel for hotels and resorts to make their accommodation products available to a targeted
customer base. With the help of a strong customer service team, GSV will greatly simplify the
process of finding the most suitable accommodations for this more specialized traveller group,
while providing hotels and other accommodation suppliers with a more cost effective distribution
channel for their product.
1.3.2 Revenue Model
Revenue will be generated from multiple sources. Booking fees of 10% will be charged
for reservations made directly through the reservation service. As hotels distribution costs range
from 25% – 35% for distribution through Online Travel Agencies such as Expedia and Priceline,
GSV provides a no risk and much lower cost distribution option for accommodation suppliers.
Additional revenue will be generated from service fees and commissions on the sale of
related services by providing customers the ability to purchase lift tickets, book golf tee times,
and make reservations for equipment rentals, lessons, insurance and other complimentary
services.
Advertising revenues will also be generated from the website by selling advertising
packages to companies looking to market their products to the GSV client base on the website
portal. Different levels of advertising i.e. gold, silver, and bronze as well as individual
promotions, will be offered to advertisers including hoteliers that can directly setup up their
specific promotions on the website.
4
2: INDUSTRY ANALYSIS
2.1 Industry Background
The online travel distribution industry has evolved from the initial development of
computerised reservation systems (CRS) by the airlines to manage airline seat reservations, with
the first major system Sabre developed by American Airlines with the help of IBM in the early
1960’s, and followed shortly by United Airlines development of the Apollo system
(PhoCusWright, 2009). These CRS systems, initially intended for internal airline reservations,
were later deployed to travel agencies in the late 1970’s and early 1980’s allowing travel agents
to book and sell airline tickets directly. The systems were then further extended to allow
bookings for multiple airline companies, as well as for hotel properties, car rentals, cruises and
travel packages, and became known as global distribution systems (GDS). For many years, the
market for travel reservations was dominated by a few GDS systems, connecting hundreds of
thousands of travel agents and distributors with thousands of travel suppliers, providing a major
distribution outlet for travel providers and a primary booking mechanism for travel agents.
During the late 1990’s larger travel agencies began to use technology to improve service
to customers with improved coordination of requirements for air tickets, car rentals hotels and
other services. These companies also started to purchase larger blocks of seats and then sell them
to customers at lower prices. This began to fragment the market as customers became aware of
differences in pricing. At the same time, the internet opened up new opportunities for travel
distribution, and pure online travel agencies (OTA) were created with Microsoft initially funding
the creation of Expedia. Following close behind, Sabre started Travelocity.
2.2 Industry Players
To get an understanding of the players in this industry we will look at the different
strategic groups and rival firms that operate within it.
Consumers are the end customers who purchase the travel products, and they generally
consist of: individual leisure travel customers, individual business travel customers, and corporate
business travel customers who manage business travel for a corporation.
5
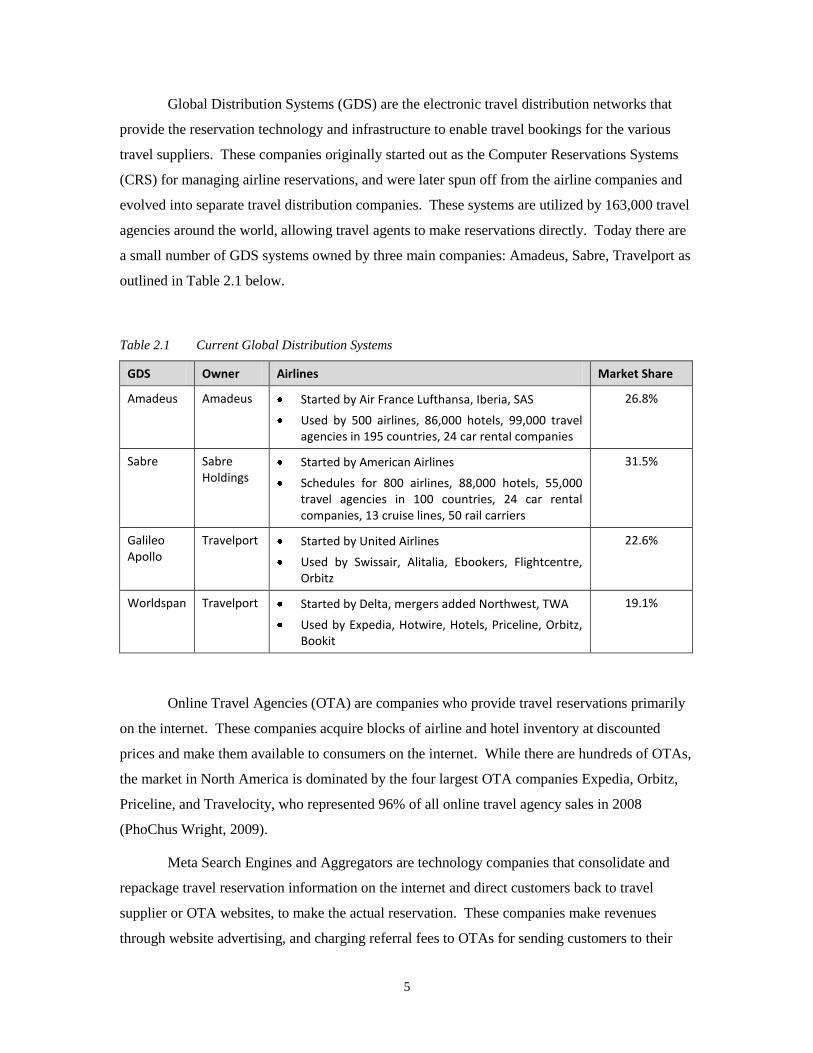
Global Distribution Systems (GDS) are the electronic travel distribution networks that
provide the reservation technology and infrastructure to enable travel bookings for the various
travel suppliers. These companies originally started out as the Computer Reservations Systems
(CRS) for managing airline reservations, and were later spun off from the airline companies and
evolved into separate travel distribution companies. These systems are utilized by 163,000 travel
agencies around the world, allowing travel agents to make reservations directly. Today there are
a small number of GDS systems owned by three main companies: Amadeus, Sabre, Travelport as
outlined in Table 2.1 below.
Table 2.1 Current Global Distribution Systems
GDS Owner Airlines Market Share
Amadeus Amadeus Started by Air France Lufthansa, Iberia, SAS
Used by 500 airlines, 86,000 hotels, 99,000 travel agencies in 195 countries, 24 car rental companies
26.8%
Sabre Sabre Holdings
Started by American Airlines
Schedules for 800 airlines, 88,000 hotels, 55,000 travel agencies in 100 countries, 24 car rental companies, 13 cruise lines, 50 rail carriers
31.5%
Galileo Apollo
Travelport Started by United Airlines
Used by Swissair, Alitalia, Ebookers, Flightcentre, Orbitz
22.6%
Worldspan Travelport Started by Delta, mergers added Northwest, TWA
Used by Expedia, Hotwire, Hotels, Priceline, Orbitz, Bookit
19.1%
Online Travel Agencies (OTA) are companies who provide travel reservations primarily
on the internet. These companies acquire blocks of airline and hotel inventory at discounted
prices and make them available to consumers on the internet. While there are hundreds of OTAs,
the market in North America is dominated by the four largest OTA companies Expedia, Orbitz,
Priceline, and Travelocity, who represented 96% of all online travel agency sales in 2008
(PhoChus Wright, 2009).
Meta Search Engines and Aggregators are technology companies that consolidate and
repackage travel reservation information on the internet and direct customers back to travel
supplier or OTA websites, to make the actual reservation. These companies make revenues
through website advertising, and charging referral fees to OTAs for sending customers to their

6
sites. Companies such as Kayak, Bing, Cheapflights, Dohop, Mobissimo, Momondo and
Skyscraper are some of the travel aggregators.
Hotel Distribution companies are closely tied to other travel distribution companies. The
Hotel Industry Switch Company THISCO was started in 1989 to develop a switch technology to
connect hotel reservation systems to the airlines global distribution systems. This company
today, Pegasus Solutions, provides distribution and related services for 86,000 hotel properties.
Traditional Travel Agencies are travel companies that have a physical brick and mortar
storefront or office based travel agency business. The agencies may focus on either leisure
travellers, corporate travellers or both.
Travel Management Companies (TMC) operate similar to traditional travel agencies and
include full travel management services and consulting for corporate travel customers. These
companies manage corporations travel accounts negotiating bulk rates for employee travel,
analyzing spending, and providing various expense reporting and information, as well as booking
travel.
Travel Suppliers include airlines, hotel companies, car rental companies, destination
service providers, cruise lines and other travel product and service companies.
Global New Entrants (GNE) are companies that emerged in the mid 2000’s and
developed travel distribution systems using new technologies and interfaces, offering travel
distribution at reduced costs to what the GDS’s could provide. These companies include ITA
Software and Farelogix.
2.3 Industry Size and Profitability
The size of the online travel reservation industry is substantial. The online sales of
leisure and business travel in the U.S. alone has increased from $6.5B in 1991 to more than $95B
in 2008 (PhoChus Wright, 2009), and more than nine out of ten U.S. travellers used the internet at
some point in the travel planning process (PhoChus Wright, 2009). Table 2.2 provides a financial
summary of top four OTA companies in the US today.

7
Table 2.2 Online Travel Agents
1Travelocity is a private company and full financial information is not available.
2European OTA information is outside the scope of this analysis but provided for reference, as these are the primary GDS
and associated OTAs in Europe.
2.4 Industry Value Chain
Travel suppliers pay for distribution of their travel products across various distribution
channels. The way the industry evolved, airlines traditionally paid fees to GDS companies for
bookings made through their systems by travel agents. As the GDSs expanded, similar booking
fees were charged to hotel, car rental and cruise suppliers. Online Travel Agencies began
purchasing bulk reservations at wholesale prices and reselling the reservations at higher prices to
their customers plus adding on commission fees. The OTAs would enter into arrangements with
airlines and hotels, to promote and favour their service on their websites. OTAs also use opaque
sites that provide only a portion of the information about the reservation until it has been booked,
so that customers cannot compare discount prices across various sites and GDSs, or against hotels
own supplier websites.
The diagram below represents the current value chain in the travel distribution industry.
OTA
Company
Owner Market
Share
Market Cap
Revenue 2009
Net Income
Op.
Margin
ROE ROA
Expedia Public company 43% $8.24B $2.955B $299M 22% 15.62% 6.65%
Priceline Public company 9% $18.23B $2.338B $489M 22.05% 50.74% 18.37%
Orbitz Travelport 26% $695M $738M -$337M 8.26% -3.58% 2.82%
Travelocity1 Sabre 22% $2.9B
Go Voyages **
European Capital €2.23B
Opodo ** Amadeus €1.3B

8
Figure 2.1 Online Travel Distribution Value Chain.
Online Travel Agents (OTAs)
Global New Entrants (GNEs):
ITA Software, Farelogix,
(Amadeus)
Opodo
Opodo.com
Global Distribution Systems (GDSs):
Amadeus, Sabre, Travelport includes Worldspan &Galileo
(Sabre)
Travelocity
Travelocity.com
Lastminute.com
Getthere.com
ExpediaExpedia.com
Hotels.com
Tripadvisor.com
Hotwire.com
Supplier
Websites and
Reservation Call
Centres
Supplier Portals
Travel Mgmt
Systems
Meta Search Engines:
Kayak.com, Bing,
Dohop, FareCompare,
Mobissimo, Momondo,
Skyscanner, Travelzoo
Airlines
Central Reservation Systems (CRSs) Hotel, Rental Car, Cruise, Rail, Tours, Other
Hotel Distribution:
Pegasus THISCO Switch
Traditional Travel
Agencies: Retail,
Corporate, TMC
Travel Suppliers
Business Travellers Leisure Travellers
Consumers
(Travelport)
OrbitzOrbitz.com
Cheaptickets.com
Ebookers.com
Priceline
Priceline.com
Supply
Inventory
Distribution
Sales
Market
GDS companies had significant market power being the primary source of distribution
directly linked to traditional travel agents, and were therefore able to capture a large portion of
the value in travel distribution throughout the 1980’s and 1990’s. In 2002 a United Airlines
spokesman commented that the airline had spent $300M on GDS booking fees that year, with
distribution costs representing the third largest expense of airline behind only labour and fuel.
And while airlines distribution costs had increased 350% in the past 20 years, the average
domestic revenue per customer had increased by only 14%. The GDS companies had an
oligopoly in travel distribution and with considerable market power, were able to extract large
rents, with margins of over 30%.
With the onset of the internet, customers became able to bypass both traditional travel
agents and GDS systems, to book directly with travel suppliers and the new online travel
agencies. The OTAs by providing better information to customers at a lower cost, threatened to
disintermediate the travel distribution system, allowing customers to bypass the usual distribution
channels of the GDS and associated travel agents. The GDSs reacted by positioning themselves
as technology providers for airline’s internet travel portals, and also, by establishing or acquiring
their own OTAs.

9
Today the travel distribution industry remains highly concentrated. With the recent
consolidation where Travelport acquired Galileo and Worldspan, there are now only 3 major
GDS companies. These three companies have a combined corporate revenue of over $9.5 billion
dollars, and employ more than 23,000 people, providing access to 550 airlines, 90,000 hotel
properties, 30,000 car rental locations and hundreds of major tour operators and cruise lines
(PhoChus Wright, 2010). In addition, each GDS company also now owns one or more OTAs and
has contracts with others. The GDSs have managed to vertically integrate again and recover their
market power. In the OTA space there is now also an oligopoly with four major companies that
control 96% of the market. Most of the OTAs today, are now owned by GDSs.
The largest online travel agencies continue to take market share from traditional travel
agencies, and are capturing an ever increasing piece of the value in travel distribution. OTAs
operating margins at over 22%, are again approaching the high rents enjoyed by the GDS
companies for many years. One main difference though is that this time, those profits are less at
the expense of the airline industry and moreso from the hotel industry.
Airlines fighting for survival have done a number of things to limit their distribution costs
including eliminating fees paid to travel agents, developing their own web distribution portals,
and encouraging customers to book directly. At one point several airlines partnered to develop
their own OTA - Orbitz, to compete with GDS and OTA companies (although Orbitz was later
sold to Travelport in 2006). As a result, the online travel agents today get a much smaller portion
of their revenue from airline distribution. Expedia for example, obtains only 15% of revenues
from airlines with over 60% of its revenues coming directly from hotels, even though hotel
bookings account for less than 30% of its gross booking volume (Starkov, 2009). Car rentals
provide 7% and cruises 2% of revenues, respectively.
Hotel’s distribution costs through OTAs are estimated between 25 – 35% as OTAs
negotiate commissions paid by hotels for bookings, and also obtain inventory at significant
discounts. The distribution costs for hotels to use OTA’s is 4000% - 6000% higher compared to
the $2-$4 cost of booking from their own website and allows the OTAs to capture a significant
portion of the travel distribution value from hotels (Starkov, 2009).
A consortium of hotels jointly developed Travelweb to compete with OTAs, and similar
to Orbitz it was later bought by Priceline. Although the hotel companies understand the benefits
of a joint reservation system, it appears they had similar problems to the airlines in defining the
rules for jointly managing this company.

10
2.5 Porter’s 5 Forces Analysis
One important model used to examine industry economics and industry attractiveness is
Michael Porter’s Five Force Framework. Porter described how to look at the impact of key
forces to determine how attractive an industry is and to consider: competitive rival sellers within
the industry, new entrants to the industry, substitute products, supplier power, and buyer power in
the industry. The weaker these forces, the greater the opportunities for a firm to achieve superior
performance. See diagram 2.2 below for a summary of how these five forces currently affect the
OTA industry.
Figure 2.2 Porter’s 5 Forces for Online Travel Reservation Services
Competitor
Rivalry
Expedia, Travelocity,
Orbitz, Priceline
Threat of New
Entrants
Substitutes
Bargaining
Power of
Suppliers
Airlines, Hotels,
Tour Cos.
Bargaining
Power of
BuyersCorporate Travel
Depts.
Travel Agencies and
TMC, individual
Consumers
(+) can book directly with travel suppliers
i.e. airlines, hotels, or with traditional agents
but less convenient and difficult to get same
level of consolidated information
Low
Online Travel Distribution
Porters 5 Forces Analysis
(+) travel agencies, corporate travel,
TMCs infrastructure tied to GDS, high
switching costs, low bargaining power
(-) individual consumers have market
power can switch to new OTAs or other
providers anytime
Low to High depending on segment
(+) suppliers anxious to move unsold
expiring product
(+) high switching costs to move from
GDS distribution
(-) GNEs now offer alternative to GDS
(o) airlines, hotel and rental companies
have own online distribution capabilities
(+) small hotels with limited infrastructure
for their own online distribution
(+) small tour operators
Low to Medium(only since GNEs)
(+) large systems infrastructure
investment required
(+) GDS who own OTAs control
access to supplier reservations
(-) GNEs new technology can
compete with GDSs
(-) new Apple ipod apps, Google
purchase ITA software
Medium
(+) A few large firms in the OTA market,
owned by established GDSs
(-) Period of change with internet, has
since leveled out
(+) Many small competitors offer search
but have no direct booking capabilities as
requires GDS infrastructure
Medium
Legend:
(+) good for OTAs
(-) bad for OTAs
(o) neutral

11
2.5.1 Industry Rivalry
The online travel distribution industry is very concentrated, and dominated by a few large
players that control 96% of the market. OTAs have evolved as the internet created change in
travel distribution. The industry has been quite rivalrous as competitors fought to gain or
maintain market share, and as travel suppliers continue to look for alternatives to lower their
costs. Expedia last year announced it was eliminating up front booking fees for customers in
order to compete with GDSs, whose fees are paid on the back end by suppliers. Today as the
OTAs are again controlled primarily by the GDSs, or closely tied to hotel distribution, it appears
that industry rivalry is starting to settle out with less competition based on price, suggesting that
industry rivalry is medium.
2.5.2 Threat of New Entrants
The size and scope of operations in both airline and hotel distribution make it difficult for
new competitors to enter. There are large upfront fixed costs needed to establish the systems and
technology infrastructure, that have grown over time as the market and industry developed. The
large OTAs have established supplier relationships with hotels, car rental companies and other
tour providers, and have significant advertising investments in their brands.
In around 2005 a number of new companies, referred to as Global New Entrants (GNE),
such as ITA Software, Farelogix and G2 Switchworks, emerged, offering new technology that
could connect directly to supplier reservations systems offering to reduce their travel distribution
costs by 75%. These developments created major competition for GDSs and OTAs. However
the GNEs have not gained significant market share as the airlines did not switch to these services
– possibly because of the high costs to switch systems and retrain employees – but merely used
their presence to negotiate 30-40% reductions in GDS fees (Simanindou et al, ND).
However, in July of last year, Google announced plans to purchase one of the GNEs --
ITA software. Google’s search technology combined with ITA’s software expertise could easily
develop new and better tools for travel search and comparison that could potentially bypass the
GDSs and OTAs. Also, GPS services such as Google maps, may further enhance the potential
product offerings
Apple has also been registering patents for travel related applications for the iPhone and
iPad. Perhaps Apple will be able to provide significant improvements in online travel booking
capabilities and make the GDSs and OTAs irrelevant as they did in the music industry. And then

12
there is also the potential for new entrants from social media such as Facebook. As travel
distribution has been a lucrative industry, new entrants will always be looking for potential
opportunities to enter the market even though the current barriers are high, and any new
developments will be a welcome change in an industry slow to evolve and upgrade their outdated
technologies. So given the potential for new entrants to the industry, this threat would be
considered to be medium.
2.5.3 Threat of Substitutes
Substitutes to online travel distribution through OTA and GDS distribution are the travel
suppliers own travel websites, reservation offices and call centres. In recent years the airlines and
hotels have begun encouraging users to book directly on their sites to eliminate the fees they pay
to the distributors. Airlines do not always reveal their full inventory and/or complete fees to
travel agents to force customers to go to their websites directly in order to get complete
information. As a result, the OTA sites are not always able to provide the full costs of services
that now may include extra charges for baggage and additional services. Hotels are following suit
using their loyalty programs to provide additional service, room upgrades and special rates not
available for product booked through the OTAs.
While these substitutes could pose a threat, the OTA provides a useful service to the end
customer in consolidating the myriad of fares and options of multiple travel suppliers. Although
customers could and do use the substitute services, in many cases they have to expend a great
deal of time and effort to look at all individual sites of travel suppliers to find the information
they are looking for. Another substitute of course is the traditional travel agent, which can be a
good option for the customer if their particular travel agent is very good, and/or has specific
knowledge about the traveller’s destination. However, because of the lack of convenience to the
end customer having to research information from various websites, and the individual service
nature of travel agent services, the threat of substitutes to OTAs distribution channels is
considered to be low.
2.5.4 Supplier Power
The OTAs rely very heavily on information provided from the three GDS companies and
hotel distributors, and changing involves high switching costs to modify systems and retrain staff
which is one of the reasons why the GDSs have now vertically integrated with the OTAs.

13
With the exception of a portion of Expedia’s suppliers (Priceline is partially vertically
integrated with some hotel distribution), the suppliers to OTAs are the GDS systems who control
the end product supply from the airlines, hotels and car rental agencies. These suppliers rely on
both traditional travel agents and online travel agents to distribute a large portion of their product.
With limited means of distributing their product and lots of competition in their own industries,
travel suppliers have limited power with the GDS/OTAs.
For many years airlines raised concerns about the excessive fees charged by the GDS
companies and only the development of GNEs mentioned earlier gave them some leverage to
reduce fees. A similar situation has since developed for hotel suppliers that use OTAs as their
distribution network. Hoteliers are now commenting on being bullied by Expedia during contract
renewal negotiations as OTAs have gained the same market power in hotel distribution as GDSs
had in airline distribution (Starkov, 2010). The low supplier power of travel providers was first
summarized in an article by Smith Travel Research in December 2003, which described how
revenue “leaked” from the hotel industry to third party websites in the form of abnormally high
merchant commissions of 25% and higher. Over the last several years the “leakage” from the
hotel industry to Expedia in the form of abnormally high merchant commissions has been
increasing every single year, and this leakage which exceeded $2 billion in 2007 will reach $2.3
billion dollars in 2009 (Starkov, 2010). As such, the supplier power is considered to be low, and
possibly medium, only since the GNEs created an alternative distribution channel for suppliers.
2.5.5 Buyer Power
There are multiple segments of buyers with the three main groups being: leisure travel
agencies, corporate travel groups, which includes agencies, corporate travel departments and
travel management companies, and finally individual customers. Travel agencies both traditional
and online, are tied to the GDSs, as are corporate travel departments and TMCs, in most cases.
With the advent of the GNEs there are now at least some alternatives however there are also
switching costs. So for travel agents and corporate travel or TMCs, their buyer power is
relatively low.
Individual travel customers are always on the look out for lower prices and because
switching costs from them are very low -- customers can easily migrate to a new website or
service provider that offers better information, better service or lower costs for travel – so for this
customer segment buyer power is high.
14
2.5.6 Complementors
A number of complementors for travel distribution are the various books, travel blogs and
travel information websites that provide information on destinations such as hotels, and tips and
tricks for getting the lowest fares. Also included in this category are the various meta search
engines that consolidate OTA and GDS information and present it in a better format for
customers. Many of these information sources have a significant influence on travel bookings in
the industry, and OTAs also control some of these complementor sites such as TripAdvisor,
which is owned by Expedia.
2.5.7 Impact of Technology
Technology is key to this industry, and the introduction of new technologies could have a
major disruptive impact. As the Global New Entrants ITA software and Farelogix showed, newer
technology that can provide the same service at a much lower cost can cause significant changes
in the industry. To combat the changing technology threat, the three main GDS companies have
started migrating to open architecture systems, and developing new functionality to be more
responsive to industry needs. However, this may not be enough. As mentioned earlier, Google
may introduce new or improved search technology that could make the GDSs and OTAs
irrelevant.
In addition, with the growth of smartphone use, the method and timing of bookings
especially for hotels may shift away from OTAs. Travellers are now starting to use airline and
hotel smart phone applications to make reservations directly. Ten percent of respondents in a
previous survey indicated they have used a web enabled smart phone to book a room as well as to
modify a hotel reservation, pay a hotel bill or check in and out. And according to PhoCusWright,
as stated at their recent event “Trends in Traveller Technology: Social Media and Mobile”, thirty-
five percent of mobile users intend to book travel on their phones in the upcoming year.
2.5.8 Government Regulations
Starting in the mid 1980’s GDSs were regulated by the US Department of Transportation
to ensure equal access to GDS services for non GDS owner airlines. In 2004 those rules were
eliminated, deregulating the industry as the internet increased pricing transparency and consumer
access to information. No new regulations govern this specific industry segment.

15
2.6 Assessment of Industry Attractiveness
The GDS industry, which has evolved into the GDS/OTA industry, has been extremely
lucrative affording much higher than average margins for industry players. This success has been
due to the: low bargaining power of suppliers, low to medium threat of substitutes, large barriers
to entry i.e. need for large systems infrastructure investments, and for the most part low
bargaining power of buyers who have been primarily the travel agents linked directly to the GDS
systems. Industry rivalry among competitors is medium as the existing GDS/OTAs have a strong
position and are more or less content with their current market share. In fact they will even
support each other in the greater rivalry that exists between OTAs and the travel suppliers, the
most contentious which has been with the airlines. For example in recent developments where
American Airlines(AA) pulled its product inventory from Orbitz in favour of its own direct
channel, Expedia supported Orbitz by also removing AA flights from the Expedia display.
For a new entrant today working with a specific target and niche, this industry could be
very attractive. By focusing only on a small segment of the much larger OTA industry, the new
entrant would not be considered a threat, and would not become a target of competition with the
big industry players. As the bargaining power of suppliers with OTAs is low, the suppliers are
looking for alternative and less costly distribution methods that could effectively be provided by a
new entrant. And while there are substitutes for online accommodation distribution, online
reservation services are being used more and more by consumers, who prefer the convenience to
plan and secure the services they seek.
Although the bargaining power of the end customer is high – they will book through
whatever service is most convenient and affordable to them. This actually creates a great
opportunity for a new entrant to enter the industry and provide a better or more focused service
that better fulfils the needs of the customer or a specific customer segment or market niche. In
addition, once loyal customers are established, there will also be several other opportunities for a
new entrant can provide better information or improved services to what the large OTAs have
traditionally provided.
While the barriers to entry for a new OTA have traditionally been very high requiring a
large system infrastructure, the development of GNE company systems and infrastructure, as well
as hotel management systems, has created an availability of potential systems that interface to the
large distribution networks, that can be utilized by a new entrant. And although the potential for
new players such as Google to enter the market and change the industry landscape and value

16
chain could have an impact on a new entrant’s ability to capture value in the industry, this could
also create significant opportunities for a new entrant to gain even greater market share.
So considering all the market forces at play, the industry appears to be quite attractive for
a new entrant. By selecting a specific market niche, a new entrant could establish a viable
business without requiring significant investment in systems and infrastructure.
2.7 Key Success Factors
The growth of the internet has given consumers numerous opportunities to locate and
compare numerous product offerings. However, for the accommodation reservation product, the
information available is often very broad and requires the user to spend a lot of time trying to
narrow down suitable options that meet their needs. Research from 2009 showed that two thirds
of all trips were already being booked online and that two thirds of the online bookers shopped
with OTAs but 70% booked directly from the supplier (Saitto et al, 2010). There is also a distinct
dissatisfaction of online shoppers, as two thirds of customers complained that online offerings
were not clear and comprehensive. In addition, twenty-three percent said they prefer a traditional
travel agency over online research, not because traditional agencies make the booking process
any simpler, but rather that the OTAs present the information poorly and present an unreasonable
volume of information to be processed by the person making the booking (Saitto et al, 2010).
The keys to success in this competitive industry will be providing a better service than is
currently offered by OTAs through the identification of niche markets and effective
implementation strategies. Along these lines, GSV needs to consider advertising, internet
marketing and direct marketing strategies aimed towards the right target markets, supported by
marketing strategies to secure major hotels suppliers, as well as additional accommodation types
from individual and niche suppliers. The key success factors in this industry will include the
following:
Up to date information and online reservation booking capabilities
As more and more consumers look for information online, the expectation is that an online
service has access to all available information rather than just a subset supported by their
systems.
Effective segmentation and targeting of golf and ski travellers within the larger travel
market

17
Travel distribution is a large and lucrative industry with powerful incumbent players. As the
large players cannot provide all things to all customers, opportunities exist to provide
exceptional service to specific market niches.
Successful positioning as the premiere golf and ski travel specialists
To be successful as a niche player it is important to establish a name and brand for the niche
service being provided and to be recognized at “the premiere” or dominant provider for that
niche area.
Differentiation of service capabilities and effective online marketing
As a relatively new company there will be a need to aggressively market the service and its
benefits to target customers, to make them aware of the services offered and the benefits to
them.
Solid and fruitful strategic alliances
Considering the nature of the service and the relative infancy of GSV on the market, it will be
of great importance to establish and maintain strategic alliances with the multiple
stakeholders, but specifically key hotel suppliers such as resort hotels and lodges.
By focusing on these key factors GSV will be able to develop effective strategies
supported by suitable marketing and operational plans to make this venture successful.

18
3: COMPETETIVE ANALYSIS
A competitive analysis is both a strategic and a marketing tool, which evaluates the
strengths and weaknesses of current and potential competitors. Competitors strengths and
weaknesses must be understood so a firm can seek differentiation possibilities (Silk, 2006).
Performing competitor analysis by considering the objectives, assumptions, strategies and
capabilities of the key competitors in the industry, and comparing the new business opportunity
against these competitors, will provide a strategic framework to develop an effective business
strategy. The key competitors will therefore be evaluated, to determine the strategic alternatives
for GSV to compete successfully in this industry.
3.1 Competitors
The primary competitors in the OTA industry in North America were previously
identified in industry analysis section. GSV will be competing with several players including:
traditional travel agencies, large OTAs like Expedia (and for the purpose of competitive analysis
Global New Entrants will be considered the same as OTAs), metasearch engines like Kayak, and
hotel supplier websites. There is also the potential for competition to arise from areas such as
social media and mobile applications, that are currently under development. Specifically for golf
and ski vacation accommodations, the resort areas centralized booking services is also a service
that will be in direct competition with GSV.
A new OTA entrant, providing accommodation reservations, will face significant
competition from existing industry players. However, since online hotel distribution has been
dominated by a few large GDS companies who have been slow to adapt to new technologies, or
improve their service, there are also many opportunities to provide information in a better format
and to improve the end customer experience. Capturing even a small portion of the large and
lucrative market of travel accommodation distribution, could be a very successful business.
To determine an effective strategy for GSV one will need to assess the key competitive
factors in the industry and evaluate the core competencies of the competitors. Determining areas
where customer’s needs are not being met, a new entrant may find ways to provide improved
services that meet the unmet needs of customers, at the same or a lower cost. By providing

19
additional value, the company will be able to attract and retain customers and capture a portion of
the market share.
3.1.1 Competitive Factors
In any industry, one of the criteria for success is the competitive factors on which
companies compete. What makes one company superior to another involves the buyer’s
willingness to pay for a product or service versus the costs and efficiency with which that service
can be provided (Ghemawat, 2010).
The competitive factors for resort accommodation distribution can be summarized as
follows:
1) Extensive distribution capabilities– Ability to reach a broad and diverse group of
customers located in various geographical locations
2) Customer focus – Ability to provide products and services designed for the specific
needs of customers
3) Breadth of service – Ability to provide information and reservations for a large
number of properties and several property types and configurations i.e. including
hotel, B&B, vacation rental, timeshare etc.
4) Depth of service – Ability to provide sufficient information on the accommodation
location, services and amenities
As GSV will focus only on golf and ski accommodation reservations, the competitive
analysis will consider these competitive factors within this specific niche. Table 3.1 below
provides a summary of these competitive factors as specifically related to golf and ski
accommodation distribution.
20
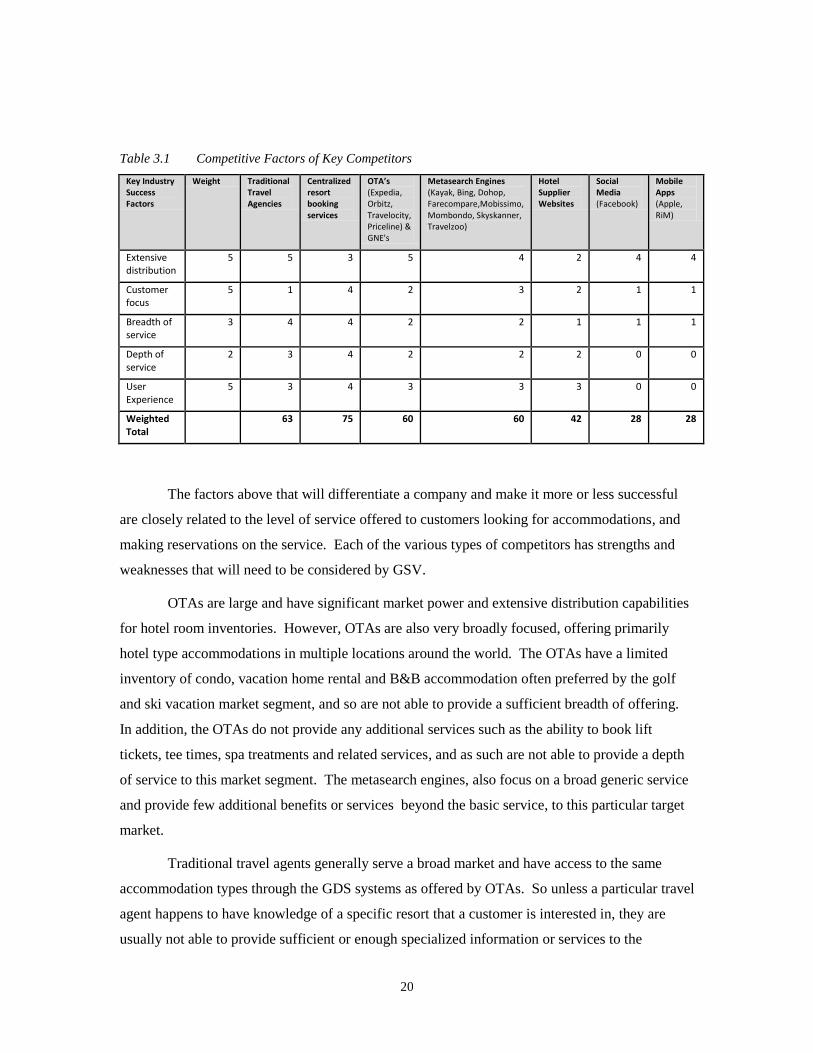
Table 3.1 Competitive Factors of Key Competitors
Key Industry Success Factors
Weight Traditional Travel Agencies
Centralized resort booking services
OTA’s (Expedia, Orbitz, Travelocity, Priceline) & GNE's
Metasearch Engines (Kayak, Bing, Dohop, Farecompare,Mobissimo, Mombondo, Skyskanner, Travelzoo)
Hotel Supplier Websites
Social Media (Facebook)
Mobile Apps (Apple, RiM)
Extensive distribution
5 5 3 5 4 2 4 4
Customer focus
5 1 4 2 3 2 1 1
Breadth of service
3 4 4 2 2 1 1 1
Depth of service
2 3 4 2 2 2 0 0
User Experience
5 3 4 3 3 3 0 0
Weighted Total
63 75 60 60 42 28 28
The factors above that will differentiate a company and make it more or less successful
are closely related to the level of service offered to customers looking for accommodations, and
making reservations on the service. Each of the various types of competitors has strengths and
weaknesses that will need to be considered by GSV.
OTAs are large and have significant market power and extensive distribution capabilities
for hotel room inventories. However, OTAs are also very broadly focused, offering primarily
hotel type accommodations in multiple locations around the world. The OTAs have a limited
inventory of condo, vacation home rental and B&B accommodation often preferred by the golf
and ski vacation market segment, and so are not able to provide a sufficient breadth of offering.
In addition, the OTAs do not provide any additional services such as the ability to book lift
tickets, tee times, spa treatments and related services, and as such are not able to provide a depth
of service to this market segment. The metasearch engines, also focus on a broad generic service
and provide few additional benefits or services beyond the basic service, to this particular target
market.
Traditional travel agents generally serve a broad market and have access to the same
accommodation types through the GDS systems as offered by OTAs. So unless a particular travel
agent happens to have knowledge of a specific resort that a customer is interested in, they are
usually not able to provide sufficient or enough specialized information or services to the
21
customer either. However, a number of traditional travel agents do attempt to cater to the specific
niche markets of golf and/or ski vacations, and the strengths and weaknesses of these specific
companies will need to be considered further by GSV.
Hotel specific websites generally provide information on only one property, and thus
have insufficient information for the customer to make a choice amongst the various property
types and properties types available at the resort, which may meet their specific requirements.
Social media applications and mobile hotel reservation applications could also become a
competitor to be considered, however this will yet take some time. These new competitors will
likely initially focus on the same broad market using the basic hotel accommodation information
available through GDSs and OTAs, as that is the data that is readily available. So having a
mobile application would likely provide minimal additional value for a little while yet.
Resort central reservation services are the one other competitor in addition to some
specific travel agencies that are narrowly focused on the same target market as GSV. The resort
central reservation services provide good customer service and good depth of service. The
central reservation services also provide a good breadth of service for their specific resort.
However, their breadth of service capability is usually very limited beyond a single resort
location.
3.1.2 Niche Market Competitors
The primary competitors in this niche area of online accommodation distribution for golf
and ski resorts were identified using several information sources. An internet search was
performed using both Google and Yahoo search engines for the phrases “golf vacations” , “golf
travel”, “golf holiday”, “golf accommodation” and “ski vacation”, “ski travel”, “ski holiday”,
“ski accommodation”. Ten companies were found. The companies were evaluated and
categorized based on the services available through their website(s). Some sites provide actual
online booking capabilities, while many others are simply a request for information and quotation
from a traditional travel agency service. A few websites provide marketing and advertising for
condo and vacation home short term rentals.
Table 3.2 provides a summary of the competitors currently offering some form of online
accommodation distribution in the niche area of golf and ski resort properties.

22
Table 3.2 Golf and Ski Accommodation Distribution Competitors
Competitor Competitor Type Websites
Golf Vacations Specialty travel agency golfvacations.com
International Golf vacations Information website usagolfvacations.net
Merit Travel Specialty travel agency
ultimateskivacations.ca utlimategolf.ca
International golf vacations Specialty travel agency internationalgolfvacations.com
Golf Zoo Specialty travel agency golfzoo.com
Ski.com Online Travel Agency ski.com
Leader Marketing Services Inc. Vacation rental listing service goski.ca
Ski Canada Resorts Specialty travel agency skicanada.com
The Lodging Company Travel agency skihills.com
Mountain accommodations Vacation rental listing service mountain accomodations.com
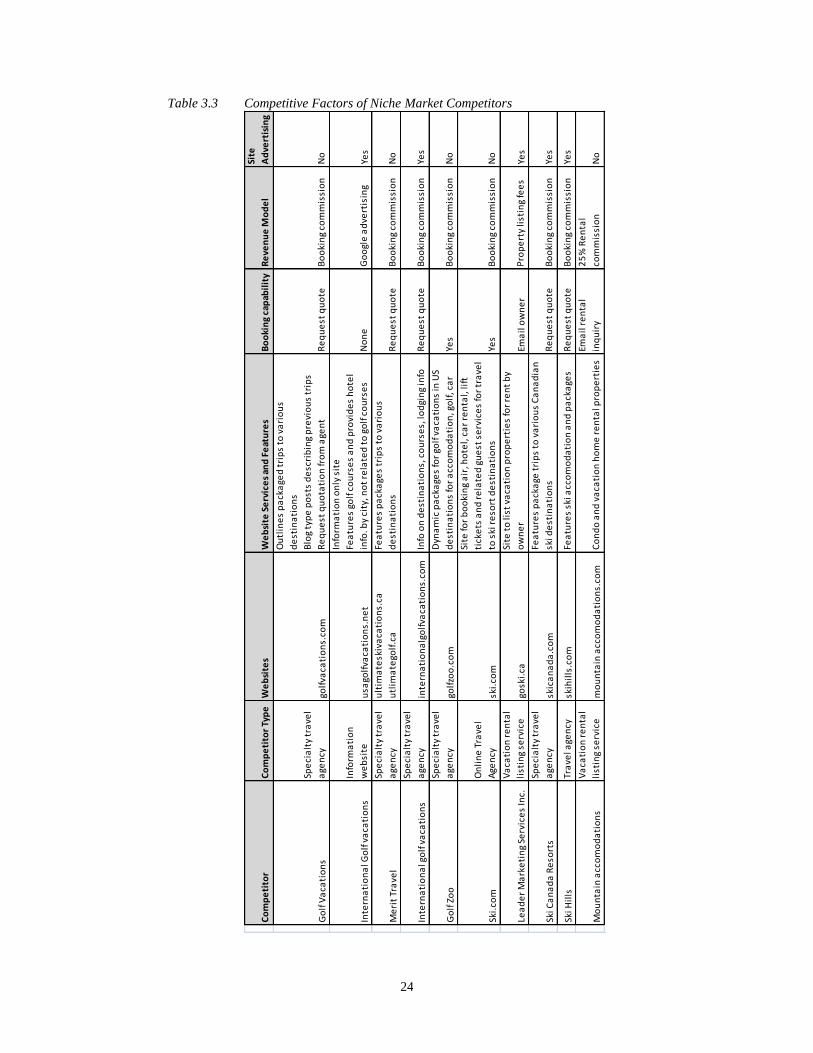
3.1.3 Competitor Products Features and Content
The internet has become a key information source for trip research, planning and
booking. Travel web sites must create a compelling offering and provide high value content in
order to attract and retain visitors. People visit travel websites at the various stages in the travel
life cycle, and for various purposes during each stage. First, there is a desire to learn and become
educated about potential destinations or areas for a vacation. At this stage, potential customers
are generally just looking for information on which ski or golf resorts they may like to visit. In
the next stage, there is a need for information that enables planning of a trip and the
accommodation availability information is crucial for this consumer. Once the customer has
obtained sufficient information, they often use the website to book their accommodation. On
completion of their trip, customers often also return to a site to provide information and feedback
on their experience for others.
23
Looking at the features of the niche competitor websites, the majority of the sites are
primarily information only sites, in most cases traditional travel agencies promoting packaged
trips. Two of the sites specialize in providing listings for condo and vacation home rental
accommodations. In all of these cases, there is no capability for online bookings of
accommodations at the resorts let alone any capability for online booking of any related services.
The exception to the traditional travel agency approach, are two websites:
www.golfzoo.com and www.ski.com. Both of these sites are setup as OTAs and provide full
online booking capabilities. Golfzoo.com allows you to select an area in the U.S., and also has a
few resorts listed in Jamaica, Dominican Republic, Bermuda and Canada. It provides brief
overview information of the golf courses in each area, area activities such as dining, lifestyle and
outdoor activities, weather, and maps. It allows you to book accommodations, and golf tee times
for various resorts in the area, as well as car rentals. Ski.com has information on numerous ski
resorts in the U.S. , Canada, Europe and South America. The site provides information on the
resorts and allows you to book, flights, accommodations, car rentals, ground transportation, lift
tickets, equipment rentals, ski lessons and travel insurance. Ski.com also has a luxury agent
assisted concierge service to facilitate other customer needs such as spa treatments, dining
reservations, personal chefs etc. These two websites appear to be the main competitors for what
GSV is looking to provide in terms of website functionality and services available to customers.
Table 3.3 lists the features and categories for each of the niche market competitors.
24
Table 3.3 Competitive Factors of Niche Market Competitors
Co
mp
eti
tor
Co
mp
eti
tor
Typ
eW
eb
site
sW
eb
site
Se
rvic
es
and
Fe
atu
res
Bo
oki
ng
cap
abil
ity
Re
ven
ue
Mo
de
l
Site
Ad
vert
isin
g
Go
lf V
aca
tio
ns
Spe
cia
lty
tra
vel
age
ncy
golf
vaca
tio
ns.
com
Ou
tlin
es
pa
cka
ged
tri
ps
to v
ari
ou
s
de
stin
ati
on
s
Blo
g ty
pe
po
sts
de
scri
bin
g p
revi
ou
s tr
ips
Re
qu
est
qu
ota
tio
n fr
om
age
nt
Re
qu
est
qu
ote
Bo
oki
ng
com
mis
sio
nN
o
Inte
rna
tio
na
l Go
lf v
aca
tio
ns
Info
rma
tio
n
we
bsi
teu
sago
lfva
cati
on
s.n
et
Info
rma
tio
n o
nly
sit
e
Fea
ture
s go
lf c
ou
rse
s a
nd
pro
vid
es
ho
tel
info
. by
city
, no
t re
late
d t
o g
olf
co
urs
es
No
ne
Go
ogl
e a
dve
rtis
ing
Yes
Me
rit
Tra
vel
Spe
cia
lty
tra
vel
age
ncy
ult
ima
tesk
iva
cati
on
s.ca
utl
ima
tego
lf.c
a
Fea
ture
s p
ack
age
s tr
ips
to v
ari
ou
s
de
stin
ati
on
sR
eq
ue
st q
uo
teB
oo
kin
g co
mm
issi
on
No
Inte
rna
tio
na
l go
lf v
aca
tio
ns
Spe
cia
lty
tra
vel
age
ncy
inte
rna
tio
na
lgo
lfva
cati
on
s.co
mIn
fo o
n d
est
ina
tio
ns,
co
urs
es,
lod
gin
g in
foR
eq
ue
st q
uo
teB
oo
kin
g co
mm
issi
on
Yes
Go
lf Z
oo
Spe
cia
lty
tra
vel
age
ncy
golf
zoo
.co
m
Dyn
am
ic p
ack
age
s fo
r go
lf v
aca
tio
ns
in U
S
de
stin
ati
on
s fo
r a
cco
mo
da
tio
n, g
olf
, ca
rYe
sB
oo
kin
g co
mm
issi
on
No
Ski.
com
On
lin
e T
rave
l
Age
ncy
ski.
com
Site
for
bo
oki
ng
air
, ho
tel,
ca
r re
nta
l, li
ft
tick
ets
an
d r
ela
ted
gu
est
se
rvic
es
for
tra
vel
to s
ki r
eso
rt d
est
ina
tio
ns
Yes
Bo
oki
ng
com
mis
sio
nN
o
Lea
de
r M
ark
eti
ng
Serv
ice
s In
c.
Va
cati
on
re
nta
l
list
ing
serv
ice
gosk
i.ca
Site
to
list
va
cati
on
pro
pe
rtie
s fo
r re
nt
by
ow
ne
rEm
ail
ow
ne
rP
rop
ert
y li
stin
g fe
es
Yes
Ski C
an
ad
a R
eso
rts
Spe
cia
lty
tra
vel
age
ncy
skic
an
ad
a.c
om
Fea
ture
s p
ack
age
tri
ps
to v
ari
ou
s C
an
ad
ian
ski d
est
ina
tio
ns
Re
qu
est
qu
ote
Bo
oki
ng
com
mis
sio
nYe
s
Ski H
ills
Tra
vel a
gen
cysk
ihil
ls.c
om
Fea
ture
s sk
i acc
om
od
ati
on
an
d p
ack
age
sR
eq
ue
st q
uo
teB
oo
kin
g co
mm
issi
on
Yes
Mo
un
tain
acc
om
od
ati
on
s
Va
cati
on
re
nta
l
list
ing
serv
ice
mo
un
tain
acc
om
od
ati
on
s.co
mC
on
do
an
d v
aca
tio
n h
om
e r
en
tal p
rop
ert
ies
Ema
il r
en
tal
inq
uir
y
25
% R
en
tal
com
mis
sio
nN
o

25
4: MARKET ANALYSIS
4.1 Target Market and Segmentation
Market segmentation is a process that groups people with similar needs, wants and
characteristics together. Segmentation can be based on any ties that connect individuals together
such as their age, common activities, the magazines they read, or the movies they watch. The
possibilities for segmentation are endless. Grouping individuals by some type of categorization
like this, provides a means to serve and communicate with these groups with greater precision.
Segmentation may also help to identify partnerships that promote networking, or to guide product
and services or research and development. Segmentation can create better marketing decisions
and promote more cost effective operations (Silk, 2006).
While market segmentation is important, there is also a larger debate about the approach
to segmentation and whether it should be based on “product push” versus “market pull”. In the
product push model, a product is designed and packaged in the hope that there will be a market
for it. Whereas the market pull approach, attempts to establish a niche market by identifying the
needs and wants of individuals within a market, and then to design a product to meet those needs.
It can be more effective to utilize the market pull approach, but at the same time it is important to
understand additional factors that may influence buyer behaviour. The understanding of each
approach becomes important in developing partnerships and offering services that fit with
customer desires and values.
Market segmentation can also be approached from two sides. On the supply side,
segmentation looks at how similar products can be grouped together, while the demand side looks
at the demographics and behavioural patterns of the target consumer group. Regardless of the
perspective from which the market segment is determined, the objective is consistent – grouping
customers with similar traits, product needs and other behavioural characteristics in order to reach
potential customers in the most cost effective manner. The levels of segmentation can be broad
such as all businesses that offer outdoor experiences, or very narrow, such as a segment of the
population in a specific geographical region, in a particular income bracket, of a specific gender,
who participate in a specific type of activity.

26
When developing a new accommodation reservation service, an approach that combines
both the market pull and a product push with value added features, is likely to be most effective.
This analysis will consider both aspects and review the target market by examining both the
product side to gain an understanding of the various golf and ski vacation products available, as
well as to review the demand side by exploring the demographics and buyer behaviour of the
customer.
4.2 Product Segmentation
Exploring the supply side of market segmentation, the products offered by the various
online hotel distribution competitors generally consist of hotel reservations for the right to occupy
a room at a specific hotel property location on a certain date and time. However, hotel room
reservations are often combined with other travel items to provide various products. Travel
providers utilize this product differentiation strategy to distinguish a product in one market
segment from competitor’s products, as well as their own products in other markets.
OTAs generally offer hotel reservations as well as bundles of travel products that can
include air, hotel and car rental packages, which can provide multiple travel products at a lower
cost than if they were purchased separately. Typically groups of products related to hotel
distribution would include : accommodation only booking ( ranging from budget and hostel
properties to high end luxury hotels), accommodation and tour booking at the resort (ranging
from basic to high end full feature concierge service) and full package booking services that
include all accommodation, tours and transportation to and from the destination.
The type of accommodation product may also need to be considered for this specific
niche market segment. The TAMS reports developed by Lang Research – U.S. and Canadian
Travel Activities and Motivations of Travellers, looked at the reasons for travel, and the
preferences of the travellers. As might be expected, people participating in activities such as
skiing or golfing while travelling, generally preferred accommodation located directly at the
activity or very near to it. While the location may be of number one importance, it is followed
closely by the type of accommodation and room configuration. This consumer segment has a
much greater desire for self-sufficient accommodations such as on resort fully self-contained
condos, rental apartments, and vacation rental homes. The length of stay at a resort for these
types of travellers averages 3-5 days, which is higher than for normal hotel accommodations, for
which the average stay is 1-2 days. Table 4.1 below shows the type of accommodation used by
activity based travellers.

27
Table 4.1 Accommodation Stayed At During Overnight Trips for Activity Related Travel
Accommodation
American Travellers (000s)
% of Total Travellers (176.4 million)
% Travellers for which the activity motivated the trip
Lakeside / Riverside Resort 21363 12.1% 4.4%
Ski Resort or Mountain Resort 15374 8.7% 3.6%
Seaside Resort 31380 17.8% 6.8%
Wilderness Lodge or Outpost 7218 4.1% 1.7%
Cooking School 1006 0.6% 0.2%
Wine Tasting School 755 0.4% 0.2%
Country Inn or Resort because of gourmet restaurant 3432 1.9% 0.6%
Health Spa 5411 3.1% 0.8%
Farm or Guest Ranch 3452 2.0% 0.6%
Houseboat 2477 1.4% 0.7%
Campground 39314 22.3% 3.7%
Source: TAMS Report Lang Research 2007
This data would suggest that there may be the potential to develop a niche
accommodation reservation service, that could offer a high return relative to their market size in
the area of ski resort or mountain vacations, as this specific product segment accounts for a
significant percentage of overall activity accommodation types. Although golf vacation
accommodation was not specifically categorized in the research, the unique accommodation
requirements of golfers are considered to be similar to skiers.
A few recommendations can be drawn with respect to defining a product type niche for
GSV. Market segmentation is crucial. No business can be all things to all people and those that
differentiate their markets will be in a much stronger position. Segmentation should not be based
purely on similar product attributes, and a market pull approach should be adopted, looking first
to understand the needs and desires of the individual market segments and then designing services
to meet those needs. There is no right or wrong way to segment the products or market but
segments or niche markets need to be both focused and targetable.
4.3 Customer Segmentation
The demand side of market segmentation considers the end customer to be served. For
GSV, the end customer is people planning an activity based vacation, who are looking to book
accommodation in a specific location near to a given resort. The more that is understood about

28
this end customer, the easier it will be to market the services to them. A focused customer group
that has strong ties can create a strong niche market, which makes it easier to provide information
to the customer. These people may read similar publications or visit similar locations on a
regular basis, for example, which can then be targeted for marketing campaigns.
Understanding demographics is imperative, to understanding product and service
segmentation, to foresee potential trends in the market place. Demographics looks at the
characteristics of the population considering things like: age, sex, education, family status,
ethnicity, religion, life stage etc. The analysis of this type of data is an excellent tool for the
development and marketing of a new product or service. According to David Foot, the
demographer who wrote the book Boom Bust and Echo, demographics accounts for “two thirds
of everything”, including things such as markets and demand for services, as well as many other
factors like social problems and political changes. When a large group of people are going
through a similar stage in life such as getting married, buying a first home, or having children for
example, the simple size of the market resulting from the demographic trends can create
significant success for a particular service or product. The subject of demographics also plays a
key-role in decision-making regarding demand for tourism products like accommodation
reservations and services for golf and ski vacations, and needs to be considered in the market
analysis.
Age is a very important part of demographics and the baby-boom generation (born
between 1947 and 1966) is of prime importance due to its size. This cohort is well educated with
above average income. The front end of this group is also approaching retirement age and will
therefore have the money and time to travel which often includes activity based vacations such as
golf and skiing. The “echo” generation (children of the boomers) are also creating peak demand
on certain products and services. Born between 1980 and 1995, the front end of this cohort is into
their thirties and taking part in independent adventure travel, with ski vacations being only one
area.
4.3.1 Customer Groups
Accommodation reservation distribution services, essentially has two distinct sets of
customers. One customer group is the service provider i.e. the hotels, lodges, condos, B&B’s and
vacation home properties that are providing their product for use. The second distinct customer
group is the end customer – the consumer who will stay in the accommodation unit during their
travel. GSV acts as an agent promoting the product of various service providers to the end
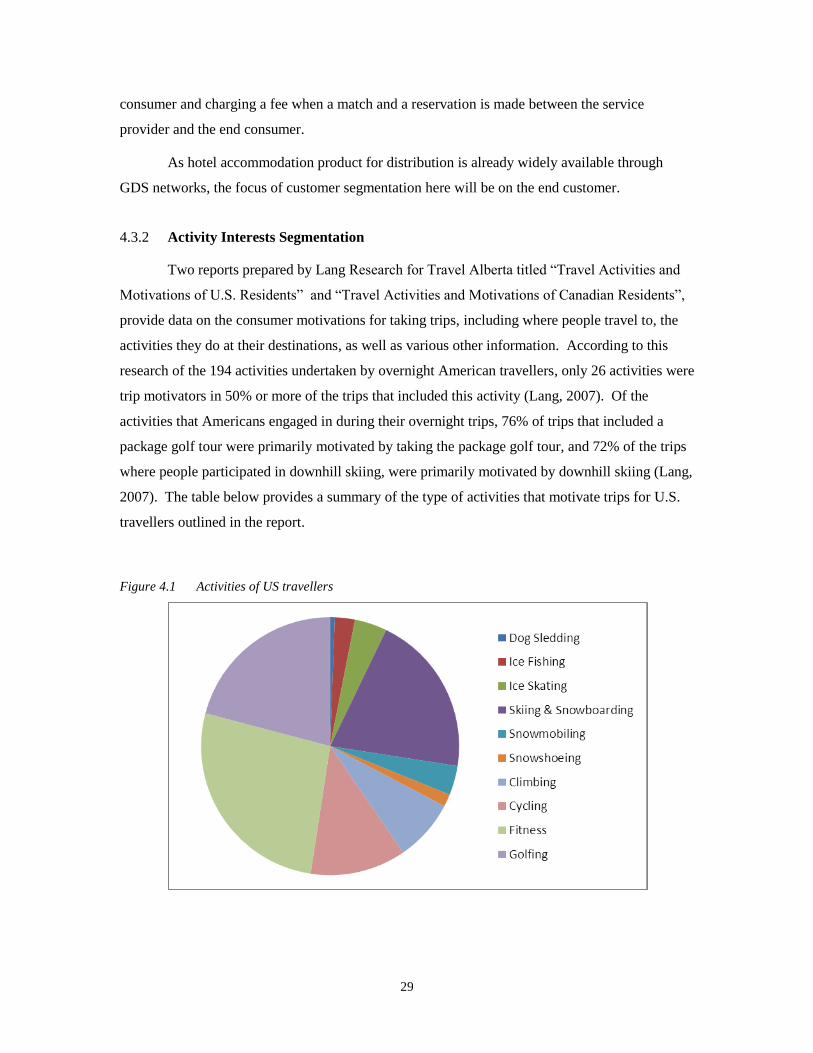
29
consumer and charging a fee when a match and a reservation is made between the service
provider and the end consumer.
As hotel accommodation product for distribution is already widely available through
GDS networks, the focus of customer segmentation here will be on the end customer.
4.3.2 Activity Interests Segmentation
Two reports prepared by Lang Research for Travel Alberta titled “Travel Activities and
Motivations of U.S. Residents” and “Travel Activities and Motivations of Canadian Residents”,
provide data on the consumer motivations for taking trips, including where people travel to, the
activities they do at their destinations, as well as various other information. According to this
research of the 194 activities undertaken by overnight American travellers, only 26 activities were
trip motivators in 50% or more of the trips that included this activity (Lang, 2007). Of the
activities that Americans engaged in during their overnight trips, 76% of trips that included a
package golf tour were primarily motivated by taking the package golf tour, and 72% of the trips
where people participated in downhill skiing, were primarily motivated by downhill skiing (Lang,
2007). The table below provides a summary of the type of activities that motivate trips for U.S.
travellers outlined in the report.
Figure 4.1 Activities of US travellers

30
The activities of skiing/snowboarding and golf alone account for 41% of all activities that
are done on trips, and these activities themselves are also the key motivation for taking the trips in
the first place, in approximately 41% of those cases (Lang, 2007).
Figure 4.2 Activities that motivate trips for US travellers
4.3.3 Demographics Segmentation
Two additional reports compiled in 2007 by Lang Research for various Canadian tourism
boards provide insight into the demographics of the consumer segment interested specifically in
golf and ski destination accommodations. The first report titled “Golfing While on Trips” shows
that in the previous two years, 8.2% (18,189,169) of adult Americans played golf while on an out-
of-town, overnight trip of one or more nights. Of those who golfed, 33.4% (6,067,369) reported
that golfing was the main reason for taking at least one trip. (Lang, 2007). Those who golfed
while on a trip tend to be more affluent than the average U.S. pleasure traveller and have higher
household incomes and university education (Lang, 2007). They are more likely to be male,
married, with the majority between the ages of 55 to 64 (Lang, 2007). They are also active in
other types of activities and especially winter sports such as downhill skiing, and they are also
more interested than non golfers in professional sporting events (Lang, 2007). They prefer luxury
accommodations, fine dining and spas, and are more likely than the average U.S. Pleasure
Traveller to have participated in wine, beer and food tastings while on a trip (Lang, 2007). Table

31
4.2 below provides more details of the demographics of golfers who travel to participate in that
activity.
Table 4.2 Demographic Profile of Golfers Relative to all U.S. Pleasure Travellers
Golfers
Non-Golfers1
Pleasure Travellers Index2
Attribute Size of Market 18,189,169 152,321,072 170,510,241 100
Gender Male 66.8% 46.3% 48.5% 138
Female 33.2% 53.7% 51.5% 64
Age of Respondent 18 to 24 8.5% 11.1% 10.8% 78
25 to 34 19.5% 21.1% 21.0% 93
35 to 44 17.8% 17.2% 17.3% 103
45 to 54 22.6% 20.9% 21.0% 107
55 to 64 19.0% 15.0% 15.5% 123
65 Plus 12.7% 14.6% 14.4% 88
Average Age 46.2 45.4 45.4 N/A
Marital Status Not married 22.9% 31.5% 30.5% 75
Married 77.1% 68.5% 69.5% 111
Parental Status No children under 18 20.6% 69.9% 70.0% 101
Children under 18 29.4% 30.1% 30.0% 98
Education High school or less 10.5% 21.7% 20.5% 51
Trade, Technical, Community College 15.7% 22.0% 21.4% 73
University Degree 49.1% 40.1% 41.1% 120
Post Graduate Degree 24.7% 16.2% 17.1% 145
Household Income Under $20,000 2.7% 8.7% 8.1% 34
$20,000 to $39,999 7.9% 17.2% 16.2% 49
$40,000 to $59,999 13.7% 17.0% 16.7% 82
$60,000 to $79,999 15.6% 14.6% 14.7% 107
$80,000 to $99,999 14.4% 11.2% 11.6% 124
$100,000 to $149,999 21.4% 13.5% 14.4% 149
$150,000 or more 13.6% 5.8% 6.7% 204
Not stated 10.7% 11.8% 11.7% 91
Average Household Income $97,381 $71,512 $74,303 N/A 1.The “Non-Golfers” are defined as individuals who took at least one out-of-town, pleasure trip of one or more nights in the last two years but did not play golf on any trip. The number of Golfers and Non-Golfers equals the number of Pleasure
Travellers. 2. The “Index” is calculated by dividing the percent for Golfers in each group by the percent of Pleasure Travellers in each group. The Index indicates the extent to which golfers are over or under-represented relative to the average Pleasure
Traveller. An index of 100 means the percent participating in the activity is the same as that of the average U.S. Pleasure
Traveller. Index values over 100 indicate that those participating in the activity are over-represented relative to the average U.S. Pleasure Traveller. Index values less than 100 indicate that those participating in the activity are under-
represented relative to the average U.S. Pleasure Traveller.

32
A second report titled “Downhill Skiing and Snowboarding While on Trips” shows that
in the previous two years 6.2% (13,702,969) of adult Americans went downhill skiing or
snowboarding while on an out-of-town, overnight trip of one or more nights (Lang, 2007). 71.1%
(9,745,079) of the skiers and snowboarders indicated that the activity was the main reason for
taking at least one trip (Lang, 2007). Downhill skiers and snowboarders tend to be younger (18
to 34), single and male (Lang, 2007). They are more affluent than the average U.S. pleasure
traveller, with higher household incomes and higher levels of education, and are more likely to
live in large urban centres with populations of two or more million people (Lang, 2007). They
were more likely than the average U.S. Pleasure Traveller to have participated in physically
challenging activities or extreme sports including both summer and winter activities, and they
were more likely to attend sporting events, theatre and comedy clubs, rock concerts, and wine
beer and food tastings (Lang, 2007). Table 4.3 below provides more details of the Skiing and
Snowboarding While on Trips survey.

33
Table 4.3 Demographic Profile of Skiers or Snowboarders Relative to all U.S. Pleasure Travellers
Downhill Skiers /
Snowboarders
Non Downhill Skiers /
Snowboarders1 Pleasure
Travellers Index2
Attribute Size of Market 13,702,969 156,807,272 170,510,241 100
Gender Male 58.4% 47.7% 48.5% 120
Female 41.6% 52.3% 51.5% 81
Age of Respondent 18 to 24 22.4% 9.8% 10.8% 207
25 to 34 29.8% 20.2% 21.0% 142
35 to 44 18.8% 17.1% 17.3% 109
45 to 54 18.7% 21.2% 21.0% 89
55 to 64 7.5% 16.2% 15.5% 48
65 Plus 2.8% 15.4% 14.4% 20
Average Age 36.4 46.2 45.4 N/A
Marital Status Not married 37.8% 29.9% 30.5% 124
Married 62.2% 70.1% 69.5% 90
Parental Status No children under 18 66.5% 70.3% 70.0% 95
Children under 18 33.5% 29.7% 30.0% 112
Education High school or less 9.8% 21.4% 20.5% 48
Trade, Technical, Community College 14.5% 22.0% 21.4% 68
University Degree 51.6% 40.1% 41.1% 126
Post Graduate Degree 24.1% 16.5% 17.1% 141
Household Income Under $20,000 4.9% 8.4% 8.1% 61
$20,000 to $39,999 9.2% 16.9% 16.2% 56
$40,000 to $59,999 11.8% 17.1% 16.7% 71
$60,000 to $79,999 13.2% 14.8% 14.7% 90
$80,000 to $99,999 13.0% 11.5% 11.6% 112
$100,000 to $149,999 20.2% 13.8% 14.4% 141
$150,000 or more 15.7% 5.9% 6.7% 236
Not stated 12.0% 11.7% 11.7% 103
Average Household Income $98,886 $72,163 $74,303 N/A
1.The “Non-Downhill Skiers/Snowboarders” are defined as individuals who took at least one out-of-town, pleasure trip of one or more nights in the last two years but did not go downhill skiing or snowboarding on any trip. The number of
Downhill Skiers/Snowboarders and Downhill Skiers/Snowboarders equals the number of Pleasure Travellers. 2. The “Index” is calculated by dividing the percent for Downhill Skiers/Snowboarders in each group by the percent of Pleasure Travellers in each group. The Index indicates the extent to which Downhill Skiers/Snowboarders are over or
under-represented relative to the average Pleasure Traveller. An index of 100 means the percent participating in the
activity is the same as that of the average U.S. Pleasure Traveller. Index values over 100 indicate that those participating in the activity are over-represented relative to the average U.S. Pleasure Traveller. Index values less than 100 indicate
that those participating in the activity are under-represented relative to the average U.S. Pleasure Traveller.

34
The demographic shifts taking place seem to favour golf and ski destination vacations as
they cover two large groups of consumers. The baby boomers are playing more golf and taking
more golf related vacations as they get older. The echo generation (children of the boomers) are
also now taking both ski and golf vacations on their own as they have become accustomed to
taking these types of trips with their parents while growing up. The recent travel motivations
survey undertaken for Canadian and US travellers (Lang Research 2007) supports this, showing
that golfing and skiing are the largest segments of activity based travel. These activity motivated
trips generally have somewhat unique and specific accommodation and other service
requirements from travellers, that could be serviced well by a niche reservation service that is
complemented by the related activities and services that these cohorts seek.
4.3.4 Buyer Behaviour
The internet has taken a very prominent role with consumers performing research
planning, and booking hotel reservations and other travel. As this relates to accommodation
reservations, 63% of adult Americans were personally involved in planning all of their overnight,
out-of-town pleasure or vacation trips, and of those involved with the planning, 76% of them used
the internet as one of their trip planning tools (Lang, 2007).
In planning overnight pleasure trips, Americans are more likely to use hotel or travel
websites rather than government related websites (Lang, 2007). Approximately 55% of travellers
who planned their overnight pleasure trips relied on their past experiences and 45% relied on
advice of friends or relatives, and less than a quarter of travellers (19%) relied on a travel agent,
and approximately of quarter of them used advertising (from newspapers, tv, or mail
publications) as a source of information (Lang, 2007). Research shows that clients booking by
themselves on the web purchase 47% more profitable optional extra services, and that 61% make
their reservations outside office hours if they are able. The majority of travel bookings are
created on a Sunday afternoon.
4.3.5 Market Size and Trends
As indicated by the Lang Research reports, golf and ski activity travellers represent
18.7% of the total U.S. pleasure travellers for a total market size of up to 31 million potential
customers. Despite the economic difficulties in the travel industry caused by the recent economic
downturn, skiers and snowboarders are still travelling in strong numbers. According to the
National Ski Areas Association (NSAA) report, the skier and rider visits for the 2009/2010

35
season were the second best ever, only 1.2% below the all time record of 60.5 million visits
achieved in the more prosperous times in 2007/2008 season. In fact it may be partly related to the
economic situation that has many travellers looking for vacation closer to home during the
downturn. This fits well with a ski and golf vacations niche, as large numbers of Americans and
Canadians live within a one-day drive of top ski and golf resorts. In any event, it appears that
golfers and skiers continue to travel to resorts both in times of economic prosperity and in times
of economic hardship, possibly because this segment of the population is also more highly
educated and earns a higher income than the average U.S. traveller.
4.4 Customer Needs
Both customer groups – the end consumer and the accommodation suppliers are looking
to get the best product and service at the lowest cost.
Hotels have increased their use of OTAs since the global economic crisis with the
expectation that business will have to be bought with low pricing. However, the hotels are also
concerned about their loss of margins from relying too heavily on OTAs which have consistently
demanded higher and higher fees for distribution of hotel products. More and more hotels are
looking for new distribution channels by which they can distribute their product more efficiently
and cost effectively. GSV needs to position its service a filling this need for accommodation
suppliers.
The end consumer has also become frustrated with the lack of useful information and
services available to plan and book accommodations. And specifically for activity based
vacations such as golfing and skiing vacations, the list of unsuitable properties presented can
waste significant time in planning a trip. GSV has an opportunity to sort and filter the vast
information available and to make it more meaningful and targeted to the specific target market’s
requirements.
4.5 Strategic Positioning
According to Porter (1996) strategy is the creation of a unique and valuable position
involving a different sets of activities based on three different objectives:
serving few needs of many customers
serving broad needs of few customers

36
serving broad needs of many customers in a narrow market
Strategic positioning attempts to achieve a competitive advantage by performing different
activities from competitors, or performing similar activities in different ways to outperform others
in the industry. The strategic position determines where a company believes it can compete
successfully within the specific competitive environment, with the goal being to position the
product or service so as to maximize the benefits to the company.
4.5.1 Strategy
Porter(1980) also outlined three generic strategies for how to outperform other firms in
an industry. These strategies are: overall cost leadership, differentiation, and focus. The cost
leadership strategy requires a company to provide the product or service to the customer at a
lower cost than competitors through effective cost control processes, overhead control and
efficiency. The differentiation strategy requires the company to offer the product or service in a
way that makes the product or service to be considered unique in the marketplace. The focus
strategy requires the company to target a specific segment of the market while the competitor
targets the broad market.
By focusing on golf and ski travel, GSV has already selected a focus or niche marketing
strategy. This is a good strategy that can be most effective for a smaller firm to compete with
larger competitors. Where a niche can sell specialized or high end products it compensates for
serving only a small fraction of the market by capturing a much higher percentage of the specific
market that it focuses on. However, GSV should purse a combination of the focus and
differentiation strategies. By focusing specifically on golf and ski resort accommodations the
company will be better able to serve the needs of this specific market niche much better than the
OTAs and travel agencies that service a broad range of customers. However, as there are already
a few competitors within the golf and ski travel niche, GSV will need to further differentiate their
service offering to create a unique selling proposition for this service in the marketplace.
4.5.2 Positioning Approach
Positioning is the process of creating an image or identity in the minds of the customer.
According to Lovelock (2001), positioning requires developing and communicating key product
attributes rather than just a brand or advertising images. Positioning guides the marketing
strategy and helps consumers to understand the unique benefits that a product or service provides.

37
Applying the positioning process to a niche market accommodation distribution service,
it is important to understand the market to ascertain which product attributes determine
accommodation choice. Then from a strengths and weaknesses assessment of competitors, a
decision can be made, regarding which market segments to target and which products to offer.
Lovelock suggests segmenting the market first, and then matching the service to the needs of
those segments. This approach implies that the key to successful positioning is to match the
benefits provided by the service with benefits sought by a target market looking for suitable
services to meet their needs. To effectively position the service offerings, GSV must determine
which of the target markets’ important needs it is able to service better than its competitors.
4.5.3 Target Segment Characteristics
The research on golf and ski travellers shows that the target market for GSV is more
likely to be male, with a university or post graduate degree, and an average annual income of
close to $100,000 dollars. On the skier side, the target market is generally from 18 to 34 years
old, single, and lives in a large urban centre. On the golf side, the target market is generally from
45 to 64 years old and married. However both groups often participate in both golfing and skiing,
both segments are more active than the average pleasure traveller, and they both enjoy sporting
events and wine, beer and food tastings.
4.5.4 Position
Looking at the various competitors and the factors that the OTAs and other niche
competitors compete on, there is an opportunity for GSV to differentiate by providing online
reservation services for accommodations and related services. As the one competitor
www.ski.com is already well established in the ski niche, it may be worthwhile for GSV to
concentrate more on the golf niche initially, as the competitors in that area are not as well
established and do not yet provide the additional services that would be a differentiator and create
value for the target market segment.
Beyond the basic accommodation reservation service, there should be value added
capabilities providing the ability to book additional services such as ground transportation,
tickets, equipment rentals, and insurance as well as concierge type services to compliment the
basic accommodation reservation offering. This would include the ability to schedule tee times, a
golf cart, and lessons with the golf pro at a golf club, or to purchase lift tickets, schedule
equipment rentals, ski lessons, and babysitting. In addition, the ability to make dinner

38
reservations, spa reservations, and to book special events that may coincide with the trip such as
sporting events or wine and food tastings at or near the resort destination.
GSV will need to create a separate image in the industry that speaks to its unique market.
It should do this by focusing first on delivering high quality and luxury hotel, condo, vacation
home and bed and breakfast accommodation to meet the requirements of the target market
segment for golf and ski travel accommodations. It should position itself as “the ultimate
authority” on high quality and well rounded golf and ski vacation services, at the best available
price. This type of position will promote the idea of GSV being the provider of the overall travel
experience that this upscale market is seeking.
The opportunity for GSV lies in finding good value for high end and luxury
accommodation and related services to fulfil the desires of this specialized market segment.
4.6 Market Entry
Strategies for entering a market depend on the market environment as well as the
positioning and product portfolio of the existing players. An effective strategy will generally
require either lower pricing, improved product or service, new geographic markets, or new
distribution channels.
Offering a product or service at a reduced price can provide a means to penetrate an
existing market. By offering a lower price, a market latecomer can attract new customers who
would not have otherwise purchased the product or service, which in effect expands the total
market. A lower price strategy can also cause an incumbent’s current customers to switch.
However, this strategy is likely to result in reduced margins for the new entrant compared with
other players in the market, unless the new entrant’s cost is relatively cheaper.
Improving a product or service offering or focusing on a niche market can provide
another effective entry strategy. Companies can compete by being innovative in the marketplace.
The innovation may be radical or incremental such as simply enhancing an existing product or
service. The enhanced product can compete directly with existing products, or it can be
positioned to attract a smaller segment of the existing market. An improved product or service
can sometimes also attract new customers that are not the current target for the existing product or
service.
Targeting new geographic markets for existing products, developing new channels of
distribution to access new markets, or achieving better penetration of existing ones, can also be

39
effective strategies. A later entrant can also segment the market, focusing on a particular target
and by providing appropriate value, can extract additional rents. Later entrants can also position
themselves as variety enhancers, rather than as replacements or substitutes for the pioneers.
Different markets require different strategies. A key source of differentiation for new
entrants when there are high barriers to entry are creative marketing, innovative advertising, new
service packages and superior customer service. Considering the various market entry strategies
GSV should consider a three pronged approach. Staying with the market niche of golf and ski
accommodation reservations it should differentiate itself in the mind of the end customer as
providing an enhanced service offering for the needs of its target market such as concierge
services. In addition, it should pursue a low price strategy with accommodation product
suppliers. In order to compete with the large and powerful OTAs, GSV will need to provide a
compelling reason for the suppliers to list their products with them. A low cost approach will
provide a good market entry strategy as hotel suppliers are concerned with the high cost of
distribution with OTAs and are looking for more cost effective alternatives.
4.7 Marketing
Successful marketing requires the design of a marketing mix with the right combination
of products or services, offered at the right price, in the right place, and then promoted in such a
way that makes it easy and rewarding for an individual to change his or her behaviour to purchase
the product or service. The customer pays a price in exchange for receiving a set of benefits.
Various pricing tactics are used to make the desired behaviour appear to have fewer costs and
more benefits, while also making the undesired behaviour seem to have less benefits and greater
cost.
There is a current debate in marketing literature whether marketing practices have been
too product focused and need to be adjusted for differences in behaviour when the economic
exchange is based on the provision of a service rather than a product. The area of services
marketing was founded on the assumption that marketing services is uniquely different from
marketing products (Lovelock & Gummesson, 2004). The five areas of difference between
products and services are:
1. Ownership: Services are not owned and stored like a product but rather
something that is used or hired for a period of time.
2. Intangibility: Services are an intangible experience, there is nothing that can be
held or touched.

40
3. Inseparability: Services cannot be separated from service providers as the acts of
providing the service essentially is the product.
4. Perish ability: Services last for a specific time and cannot be stored like products.
5. Heterogenity: It is difficult to make each service experience the same, as each
will have slight variations depending on the individual service provider.
The unique characteristics of services that create marketing challenges are further
magnified with an online accommodation reservation service as both the reservation service itself
and the end service, being the use of a room or facility are both intangible .
A core element of the marketing strategy therefore needs to be that of differentiation from
competitors. In terms of marketing, GSV needs to ensure that its name and service offering are
marketed on an extensive basis so that customers are aware of its existence, as well as the
additional benefits provided for them by using the service.
4.7.1 Product
GSV plans to offer an efficient, informative, and user friendly website for leisure
travellers to plan and book their golf or ski holidays. The site will provide an online
accommodation catalogue and booking system for accommodation providers such as hotels,
condos, B&Bs, apartment and vacation home rentals, located at golf and ski resorts in North
America.
The service will provide general information on the various resorts and provide online
booking capabilities for associated services such as ground transportation, golf tee times, lift
tickets, equipment rentals, lessons, and insurance. The service will also provide information on
various activities and sporting events in the area and allow bookings for dining reservations, spa
treatments, and local events that may occur during the time of stay. The website will also have a
community feature that is connected with Facebook for various discussions such as the best hole,
or best run etc.
Unlike other OTAs or on-line booking sites GSV has a specialized product – activity
based golf and ski accommodation reservations and related services. The design and content of
the website will need to be developed to reach that specific niche with all content prepared from
the end customer’s point of view. This will enable every customer to find the information they
need to plan their ideal golf and/or ski vacation much more easily that available from other
sources. The website intends to provide good information as well as a pleasurable adventure.

41
4.7.2 Price
In successful marketing strategies the consumer trades a price or incurs a cost in
exchange for receiving some benefit – the core product or service. Costs can be monetary or non-
monetary. Nonmonetary costs may include time, embarrassment, effort , lifestyle etc.
Considering that price can be a barrier to engage in an exchange that will provide the benefits of a
service, the exchange needs to be weighted so that the benefits (core product or service) that
people receive is greater than what it costs them to receive those benefits, and the benefit must
also be greater than the alternative(Levitt, 1991).
In this case, the end customer doesn’t pay for the service directly as the cost is born by
the supplier as their cost of distribution. But although there may be no financial cost for the end
customer to search endlessly for the right type of accommodation for an activity trip, there is
certainly an opportunity cost of time.
For the accommodation service provider customer group however, there is a real cost of
distribution and GSV needs to price itself very competitively in relation to the dictates of the
market. By offering a new and focused distribution service for accommodation providers at low
cost, and minimal risk to the supplier, GSV should be able to make significant market inroads.
As such, the distribution service for accommodation provider will be priced as a very simple
commission based model of 10% commission with payment only received on successful
bookings. There will be no registration fee or fixed monthly fees charged. The suppliers will
also not be required to commit specific allotments of inventory and the supplier has full control to
choose which periods to provide product for, as well as the associated pricing of their product.
The supplier will also have the capability to define and establish special promotional rates for its
products for any given period, through the GSV site.
With this pricing approach GSV will be very competitively priced in relation to the OTA
and travel agents who use the GDS systems and their associated distribution costs. Considering
the stage of the venture and the services being offered, a low cost distributor market penetration
pricing strategy will ensure that potential customers and suppliers are not frightened away by
price until the service becomes more established. This will dictate that costs need to be prudently
kept down to ensure financial success and the revenue structure needs to match the cost structure
to ensure that the services incurred can be provided at a profit.
42
4.7.3 Place
Place is generally considered where and when the target market will perform the desired
behaviour such as purchase the product or service. For an online reservation service such as
GSV, the main place where the service will be provided is on the internet. As seen in several
studies the use of the internet to book travel has grown in leaps and bounds over the past ten years
and it still continues to grow albeit at a more modest pace.
The placement strategy for an OTA to provide their services on the internet works well
for accommodation suppliers as it makes their products more accessible and increases
opportunities for customers to make bookings which is of great benefit to them. As the internet is
widely available, any new internet distribution channel creates additional places where
transactions can be performed. Once GSV is fully operational, a future consideration may be the
development of a mobile app to provide similar reservation services via mobile phones.
4.7.4 Promotion
Promotional activity is a part of selling a product or service. It generally includes
advertising and related efforts to increase awareness of the service. GSV intends to promote its
business by informing potential customers about the company and the benefits of its services as
well as by providing useful information to the target golf and ski enthusiast customers.
Information will be provided to each of the customer segments through:
Print Advertising: Placed in golf and ski magazines and various target market specific publications
Trade shows: Hotel industry and golf and ski industry trade shows
Personal Selling: Used to promote the company’s services to hotel supplier customers making them aware of the benefits and this low cost and low risk distribution option
Direct Marketing: This will be used to secure key accommodation properties and specific resort services
Internet marketing is a very necessary function for an online reservation service and will
be key to the success of GSV. Internet marketing is performed using several online promotion
tactics including:
Public Relations such as press releases, message boards
Search engines and directories
Pay per click advertising
Direct email
Electronic newsletters and ezines

43
Customer incentives, coupons and rewards
Users of the Internet that are less proficient at searching for product information rely
more on brands. Promoting the benefits of GSV’s service and how it meets their needs will
reduce the risk for customers and create brand loyalty. Therefore, GSV will need to promote its
services while creating a positive and reliable brand name. Branding reinforces loyalty, and also
conveys useful product information that tends to make markets more efficient.
4.7.5 Marketing Strategy
Being a new company on the market GSV will need to focus on specific services with
specific types of clients to get established and gain the necessary experience in the marketplace.
As the niche area for skiing already has a strong competitor, it may be better for GSV to focus its
efforts first on the golf activity traveller segment, as it appears that this particular area has no
clear market leader. The initial aim should be to instill awareness and confidence in the services
offered by GSV and then to expand and offer complementary services over time as experience is
gained.
To establish itself as the premiere provider of golf and ski activity travel services, GSV
should adopt the following strategies:
Establish GSV reputation as a differentiated specialty provider of golf and ski
vacations. This will be accomplished through a diverse marketing
communications programme directed at GSV target market, utilizing various
media as well as the establishment of strategic allies.
Provide unparalleled service to travellers, to gain repeat business and build trust.
This will include superior service in all phases of the transaction including timely
follow through.
Aggressively promote supporting services and activities such as fine dining,
wine tastings, and sporting events with the target market to create an position of
offering exquisite services.
The strategy should be to grow the business by nurturing clients, differentiating the
service offerings of competitors such as the OTAs who provide services to a broad range of
clients.
Alliances and collaboration should be pursued with hotels and other accommodation
providers utilizing the low cost distribution strategy to gain market penetration.

44

45
5: OPERATIONAL PLAN
For an organization to operate successfully it requires a number of resources such as
financial capital, human resources capital, and management and organizational strengths to
perform its functions in an efficient and cost effective manner in order for the company to be
successful. In the case of a new start-up company such as GSV, the operational plan will provide
insight into what competencies the company needs to develop and what measures will need to be
taken, in order to make the company capable of effectively executing the proposed strategy.
5.1 Organizational Structure
To establish itself as an OTA company specializing in golf and ski reservations, GSV
will require senior managers to grow and manage the business, technology staff to develop and
maintain the online services and reservations systems, accommodation reservation business
experts to research and market the service offerings, and client service agents to assist end
customers. A start-up web-based service company like this could initially be managed by one to
two senior managers such as the working owners/partners. The Chief Executive Officer (CEO)
role could take on the functions of sales and business development and financial oversight, and
the Chief Operating Officer (COO) role could be responsible for operations and systems
development. The company should utilize a functional organization structure whereby people
can focus on their prime area of expertise.
As the company grows there will need to be more structure to manage new employees
and ensure they are assigned to a supervisor for guidance and support. Once the company is at a
full staff count, the functional organization structure will need to be reviewed to ensure that
sufficient cross team communication structures or processes are established.
5.2 Management Team
With a new start-up company, the management team can initially be very small and be
expanded as sales and revenues become realized. The two founders of GSV are passionate about
the services that they will promote and offer on the market. Founder B has been successfully
running a small consulting company for over 20 years providing management consulting,

46
strategic planning, project management and systems implementation services to medium and
large size companies. Founder B also has significant experience in running a small business as
well as the business and development and sales activities required to generate revenue for a
consulting firm. Founder G has significant technology experience having worked as a software
developer and architect for over 20 years. Founder G currently works as the Director of
Engineering for a large software technology company managing technical software consultants
around the world.
Founder B will initially take on the role of CEO responsible to carry out the strategic
plans and policies of the company leading both business development and sales. This will
involve securing hotel accommodation suppliers and establishing related travel partnership
agreements, which support the strategic plans and policies for the company to grow successfully.
In addition, founder B will fill the role of CFO which will entail financial management and
transaction oversight for the company’s funds. The role ensures that sufficient funds are
available for ongoing operations and expansion, and that outstanding debts are being paid, excess
funds are being invested and managed effectively, and providing reporting to summarize the
financial condition of the company. In addition, this role forecasts future cash flow needs for
expansion and growth to support the strategic plans and policies of the company.
Founder G will initially take on the roles of COO and CTO. As being up to date with
technology will be the key success in this industry this role needs to be filled by someone who is
tech savy and can find ways to provide the reservation services effectively and efficiently to
customers using technology in the most productive way. The CTO role will be responsible to
identify, select and implement technological solutions that meet the needs of GSV, providing
effective service to the customers while controlling costs, by selecting the appropriate technology
as required. The role of COO will be responsible to develop and execute an operational plan that
meets the strategic direction of the company and that meets the expectations of the customers.
The role will oversee day to day operations of the company and ensure that effective systems and
processes are in place to meet the needs of the business.
While a small management team may be sufficient in the early stages of the start-up, the
company will need to closely monitor its growth and development and review its management
capabilities and needs on a regular basis. The company needs to prepare to build and recruit the
required talent to grow the business. It may be important to acquire resources in multiple ways
such as licensing or joint venturing for example (Capron & Mitchell 2010).

47
5.2.1 Advisory Board
The management team currently has two advisors. The first advisor is a serial
entrepreneur who has established three successful companies that have either been taken public or
were bought by large software companies in Silicon Valley. The second advisor has extensive
financial management experience having worked as a CFO taking a small start-up company from
its initial IPO through several mergers and acquisitions, through to its eventual sale at 40 times
the initial IPO offering. Both of these advisors will provide valuable insights to seek investor
funding.
5.3 Human Resources
Creating and staffing a company requires human resources, which are an essential
component in the delivery of the total service. Key resources for GSV will be the technology
staff required to develop and maintain the website and online reservations systems, and interfaces
to related booking systems, to establish the reservation service offerings for the company, and to
promote the service offerings with online marketing campaigns.
Once the reservation software is selected and the website development is completed for
reservation requests to be accepted, customer service agents will also be required. While the
majority of reservations are expected to be done online, within minimal assistance from customer
service agents, it will be important to have people available to provide good customer service and
more importantly to learn more about what the customers are looking for and what additional
services can be offered. By encouraging all employees to handle customers well, and by having
enthusiastic, capable and empowered people interacting with customers, GSV will be able to
build the competitive advantage and able to comprehensively meet the customers' needs. To
provide good service GSV will be need to evaluate jobs and remuneration packages against
market benchmarks for the agreed set of tasks for employees to ensure that they are competitive.
Effective recruiting, motivation and discipline procedures will also need to be developed as the
staff count grows beyond the small start-up employee group.
5.3.1 Personnel Plan
The company will start with a small staff component of both technology and customer
service support, supplemented by call centre support, and led by the management team. As the
business grows, the staff count will increase to meet the needs of additional customers. Good
staff compensation levels will help ensure higher employee retention as well as to maintain the

48
desired level of customer service and efficiency for the organization. A suitable compensation
plan, that includes salary, health care, profit sharing and three weeks of vacation each year, will
be developed.
5.4 Development Plan
The only channel for delivery of the GSV service will be via the website. GSV will
intentionally not deliver service through a bricks and mortar establishment, as the intent of the
business is to provide an online travel reservation service rather than a traditional travel agency
business.
The value chain in this business involves delivery of reservation services directly from an
accommodation supplier to a GSV client. GSV is the channel that connects clients to
accommodation providers, and as such, earns a commission, on a per transaction basis.
Key activities required to establish GSV, will be the selection of a suitable online
reservation system and the development of a website that will provide the service distribution
channel.
5.5 Systems
Planning and designing systems and processes for a new business involves the
arrangement of management and staff, and their roles, functions and business administration
requirements. It also needs to take into account business facilities and equipment, inventory
management as well as policies and procedures for other business functions.
Because the ability to perform online reservations to many hotel properties is tied into
GDS companies, it will be beneficial and necessary for GSV to utilize an established online
reservation system that provides access to GDS hotel information and bookings. This will ensure
access to a large number of hotel reservation product suppliers at a standard commission rate.
This base inventory can then be supplemented by specific property listing agreements established
over time, with additional accommodation providers in each of the resort areas, or for
personalized or improved services for each accommodation property according to their needs.
The unique and value added product of onsite condominiums, vacation homes and apartments in
demand by the target market, as well as additional resort specific services will further enhance the
product offering selection.
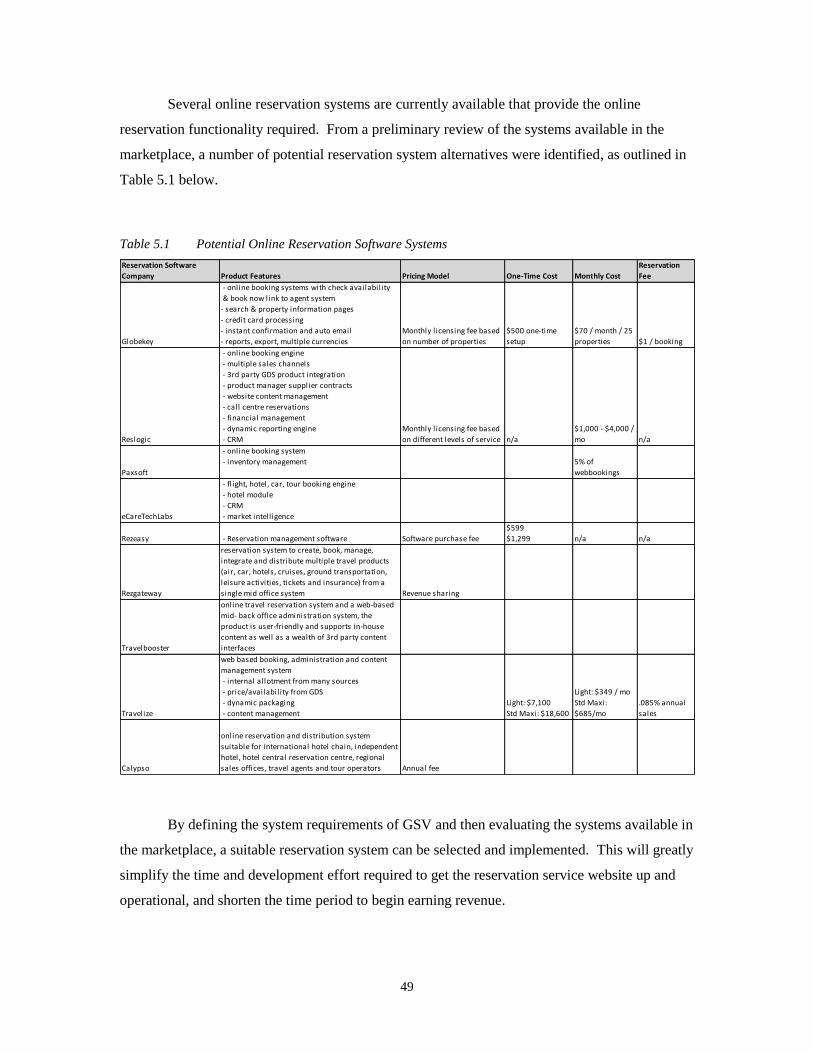
49
Several online reservation systems are currently available that provide the online
reservation functionality required. From a preliminary review of the systems available in the
marketplace, a number of potential reservation system alternatives were identified, as outlined in
Table 5.1 below.
Table 5.1 Potential Online Reservation Software Systems
Reservation Software
Company Product Features Pricing Model One-Time Cost Monthly Cost
Reservation
Fee
Globekey
- online booking systems with check availability
& book now link to agent system
- search & property information pages
- credit card processing
- instant confirmation and auto email
- reports, export, multiple currencies
Monthly l icensing fee based
on number of properties
$500 one-time
setup
$70 / month / 25
properties $1 / booking
Reslogic
- online booking engine
- multiple sales channels
- 3rd party GDS product integration
- product manager supplier contracts
- website content management
- call centre reservations
- financial management
- dynamic reporting engine
- CRM
Monthly l icensing fee based
on different levels of service n/a
$1,000 - $4,000 /
mo n/a
Paxsoft
- online booking system
- inventory management 5% of
webbookings
eCareTechLabs
- fl ight, hotel, car, tour booking engine
- hotel module
- CRM
- market intell igence
Rezeasy - Reservation management software Software purchase fee
$599
$1,299 n/a n/a
Rezgateway
reservation system to create, book, manage,
integrate and distribute multiple travel products
(air, car, hotels, cruises, ground transportation,
leisure activities, tickets and insurance) from a
single mid office system Revenue sharing
Travelbooster
online travel reservation system and a web-based
mid- back office administration system, the
product is user-friendly and supports in-house
content as well as a wealth of 3rd party content
interfaces
Travelize
web based booking, administration and content
management system
- internal allotment from many sources
- price/availability from GDS
- dynamic packaging
- content management
Light: $7,100
Std Maxi: $18,600
Light: $349 / mo
Std Maxi:
$685/mo
.085% annual
sales
Calypso
online reservation and distribution system
suitable for international hotel chain, independent
hotel, hotel central reservation centre, regional
sales offices, travel agents and tour operators Annual fee
By defining the system requirements of GSV and then evaluating the systems available in
the marketplace, a suitable reservation system can be selected and implemented. This will greatly
simplify the time and development effort required to get the reservation service website up and
operational, and shorten the time period to begin earning revenue.

50
5.6 Partnerships
Partnerships are arrangements where business entities work together to promote their
common interests. There are often cases where complimentary products or services can be
provided to the same group of customers. Establishing partnerships with accommodation
providers in the various golf and ski destinations will be a key differentiator for GSV. By
providing an effective channel for accommodation suppliers to distribute their product without
having to pay the high fees of online distribution from other OTAs, will be a significant cost
savings to providers and a key differentiator for GSV.
5.7 Risks and Assumptions
5.7.1 Risks
A key risk to GSV business operations will be securing accommodation supplier partners
seeking alternative distribution methods for their product. GSV will need to provide a better
service at a lower cost in order to attract suppliers who are willing to work directly with GSV to
promote their product, and provide additional benefits specifically for GSV clients. While the
business could still operate the same as any other OTA providing general accommodation
reservations for various products available through GDS systems, the differentiation and
competitive advantage will come from supplier specific offerings for the golf and ski activity
traveller’s needs.
The other key risks are potential changes in technology and / or changes within the
industry structure itself. With Google purchasing ITA software, there is the potential for a big
transformation to occur in how the industry operates and the value chain could change
significantly in the next few years. Additionally the increased use of mobile phones may further
change the shape of the industry. GSV will need to keep abreast of new players and changes and
adapt the business model as new challenges or opportunities arise.
5.7.2 Assumptions
The largest assumption that GSV is making is that golf and ski activity based vacations
will continue to grow based on the demographics of the population. If for any reason the
popularity of these activities was to decline then the GSV business model may become less
viable.

51
6: FINANCIALS
6.1 Economics of the Business Model
GSV is a provider of services. As such, it carries no inventories and incurs little in the
way of cost of goods sold. Its revenues are derived from three main sources being: commissions
paid for reservation bookings, sale of related resort products and ancillary services, and website
advertising revenues.
The monthly operational costs are as could be expected of a business of this nature and
besides an initial capital outlay for the purchase of reservation software and the development of a
website, the corner stone of its business, it will incur nominal on-going capital costs.
6.1.1 Revenues
GSV will offer online reservation services delivered through its website. A commission
fee of 10% of the booking value is secured when a reservation is made. Bookings for additional
related services such as lift tickets, tee times, equipment rentals, lessons, and insurance are also
offered on a cost plus or commission basis which generates additional revenue. In addition,
further revenue will be generated by offering a small amount of advertising on the site. The
monetized services fall into three categories outlined below.
Booking commissions are expected to generate 60% of GSV’s revenues through
percentage of booking fees extracted from suppliers for GSV to distribute their travel
accommodation product. From the supplier’s point of view, the fees paid to GSV is part of their
cost of distribution. A much lower cost paid to GSV improves the supplier’s average daily
rate(ADR) for a room which is a key metric in the hotel industry.
Other reservation service revenues are expected to generate 30% of GSV’s total
revenues. GSV will work with the resorts to gain access to schedule the various resort services
directly through GSV at a reduced rate for which GSV also receives a fee. GSV will provide the
convenience of one stop shopping for customers to secure all of their requirements when planning
their vacation accommodation. The customer also receives a benefit by paying a lesser fee than
by waiting to book onsite at the resort.

52
Advertising revenues are expected to generate up to 10% of GSV’s total revenues (with
potential to grow). The GSV website will provide excellent advertising space to outside
companies and will charge a flat fee on a monthly basis for the use of their site in this manner. A
marketing plan offering different levels of advertising will provide various options for advertisers
although the net result will be a monthly fee paid to GSV.
GSV is primarily a service, and as such, it will not maintain any inventories as a
component of its product delivery. Furthermore, as a service provider, as opposed to a
manufacturer or retailer of tangible goods, its COGS are a relatively small aspect of its selling
prices. COGS relate to direct labour and direct overhead charges and comprise about 10% of
selling prices translating to per unit contribution margins of $54 to $900 on a product-by-product
basis.
Table 6.1 Product Revenues
Product Type Revenue per Transaction
Cost of Goods Sold
Contribution Margin Gross Margin
Accommodation Reservation Commission
$60 $6 $54 90%
Related Services $60 $6 $54 90%
Advertising $1,000 $100 $900 90%
6.1.2 Expenses
In the process of establishing the company, GSV will incur a number of expenses.
Capital expenditures will be required to acquire the necessary reservation system software and to
develop a suitable website and systems to service online accommodation reservation clients.
Fixed and variable operational expenses will be incurred on a monthly basis to operate the
business. The fixed expenses consist of advertising, office expenses, salaries, systems expenses
and general expenses such as insurance, bank fees and allowance for bad debts. The variable
expenses relate primarily to reservation system fees based on sales and some direct sales and
marketing expenses.
6.1.3 Operating Leverage
GSV’s cost structure is predominately fixed, resulting in what will appear to be a venture
with higher risks. However, GSV is not expecting to incur any large debt obligations. Rather the
majority of its fixed costs are tied to operational costs which can be easily terminated with
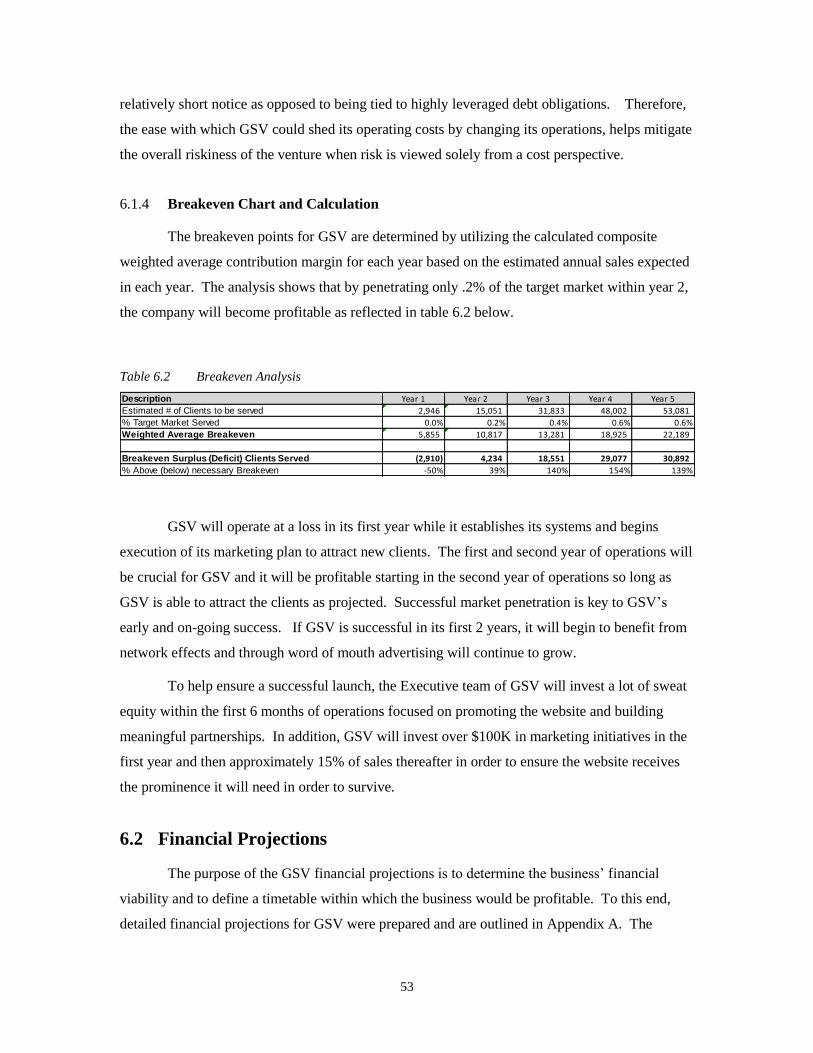
53
relatively short notice as opposed to being tied to highly leveraged debt obligations. Therefore,
the ease with which GSV could shed its operating costs by changing its operations, helps mitigate
the overall riskiness of the venture when risk is viewed solely from a cost perspective.
6.1.4 Breakeven Chart and Calculation
The breakeven points for GSV are determined by utilizing the calculated composite
weighted average contribution margin for each year based on the estimated annual sales expected
in each year. The analysis shows that by penetrating only .2% of the target market within year 2,
the company will become profitable as reflected in table 6.2 below.
Table 6.2 Breakeven Analysis
Description Year 1 Year 2 Year 3 Year 4 Year 5
Estimated # of Clients to be served 2,946 15,051 31,833 48,002 53,081
% Target Market Served 0.0% 0.2% 0.4% 0.6% 0.6%
Weighted Average Breakeven 5,855 10,817 13,281 18,925 22,189
Breakeven Surplus (Deficit) Clients Served (2,910) 4,234 18,551 29,077 30,892
% Above (below) necessary Breakeven -50% 39% 140% 154% 139%
GSV will operate at a loss in its first year while it establishes its systems and begins
execution of its marketing plan to attract new clients. The first and second year of operations will
be crucial for GSV and it will be profitable starting in the second year of operations so long as
GSV is able to attract the clients as projected. Successful market penetration is key to GSV’s
early and on-going success. If GSV is successful in its first 2 years, it will begin to benefit from
network effects and through word of mouth advertising will continue to grow.
To help ensure a successful launch, the Executive team of GSV will invest a lot of sweat
equity within the first 6 months of operations focused on promoting the website and building
meaningful partnerships. In addition, GSV will invest over $100K in marketing initiatives in the
first year and then approximately 15% of sales thereafter in order to ensure the website receives
the prominence it will need in order to survive.
6.2 Financial Projections
The purpose of the GSV financial projections is to determine the business’ financial
viability and to define a timetable within which the business would be profitable. To this end,
detailed financial projections for GSV were prepared and are outlined in Appendix A. The

54
statements include annual pro forma financial for the first five years of operations, as well as
detail monthly pro forma financial statements for the first two years of operations.
A number of assumptions were made in preparing these financial statements. The GSV
market is assumed to be equal to the demographic size outlined for golf and ski enthusiasts in the
U.S., based on the Lang Research outlined earlier in Tables 4.2 and 4.3. It is assumed that each
of these potential customers takes .5 trips per year as the numbers given were based on trips taken
within the previous two years. The average trip is designated as a 4 night stay at a total of $600
assuming an average hotel cost of $150 / night, also based on information from Lang Research
discussed previously in section 4, on market analysis.
The initial $200,000 inflow of cash is expected to come from a business loan or other
funding raised to start the business, which will finance the first 12 months of operations as well as
the initial purchase of reservation software and development of the website. Cash will be
received through operational proceeds and is expected to grow significantly by the fourth and
fifth years of operations.
The capital assets of the business reflect only the cost to purchase the reservation
software and build the company website and supporting systems. This up front development
work is expected to be completed by the 7th month of operations and the initial development cost
is estimated to be $60,000. However, depending on the reservation system selected the initial cost
could be slightly higher and on-going systems costs slightly lower or vice versa. As shown in
table 5.1, the various online reservation software systems available on the market have different
pricing models, some with a higher up front purchase cost and lower monthly cost and some with
a lower up front cost and higher monthly costs. Once the systems and website are operational,
they will be depreciated on a straight-line basis over a 10 year time period.
Revenue generation is not expected to begin until the 7th month of the 1
st year of
operations when a .02% market penetration is expected after an initial product launch and
advertising blitz. From that point forward, the projection is for a .01% growth per month into the
2nd
year of operation and increasing in the second year as the service starts to receive some initial
recognition.
GSV’s biggest challenge will be to secure the funding required to sustain the business
through its first year of operations.

55
6.2.1 Summary of Financial Statements
The projections for GSV are quite favourable assuming that the company is able to
capture even a small portion of its target market. With a very conservative .18% market
penetration rate projected in its second year of operations, the company would be profitable in
that year with a net income of over $460K. If the business continued with a very moderate
growth rate to achieve a .5% market penetration by the end of the 3rd
year of operations, the
business would produce a net income of $2.8M in its third year. As these penetration rates are
very conservative, a good marketing strategy and execution, coupled with effective cost control
management, has the potential to generate significantly higher income than these projections.
The key to the business success will be in gaining recognition as “the” online golf and ski travel
destination specialist.
The projections outlined in the financial plan provide both an indication of GSV’s
expected performance as well as a barometer against which success can be measured. These
monthly projections should be monitored by the executive team on a monthly basis, to assess
actual performance against targeted projections. Significant variances can then be analyzed to
determine the underlying cause(s), and to provide the management team with the means to adjust
go-forward operations in order to mitigate newly assessed risks or incorporate newly assessed
opportunities. If cost overruns are detected, GSV may need to scale back on its marketing efforts
and possibly reduce the salaries paid to the management team, to counteract the situation.

56
7: Conclusion
The OTA industry has been dominated by a few major players who have been able to
extract higher than average rents from travel suppliers due to their favourable market position.
However, opportunities exist for new entrants in this industry to target a specific market niche as
the niche areas are not considered a threat by the large industry players.
The target market for GSV can be categorized by two customer groups, the first group
being the travel accommodation supplier, and the second group being the end customer. By
providing a better service to the end customer looking for travel accommodation services, and
also by focusing on a specific market niche, a new entrant such as GSV can provide a viable
distribution alternative for travel suppliers who are looking for alternative distribution methods at
a lower cost.
Within the golf and ski activity travel market, there are very few true OTA competitors.
Most companies are merely traditional travel agencies that specialize in golf and ski trip planning,
rather than offering an online travel reservation service that can handle a large volume of
customers at any given time. Given the size of the target market and the services those customers
are seeking, GSV could successfully position itself as the online golf and ski reservation
specialist. With effective positioning along with a good marketing plan and a market penetration
entry strategy, GSV could capture a significant share of this niche market.
Given the size of the market niche, capturing only a small portion of the target market
would result in a profitable business for GSV in less than two years of operation. From an initial
investment of $200K the company would be able to purchase and develop the required systems
and processes and execute a marketing plan to begin to capture market share. By effectively
monitoring costs and managing business growth, the company could generate an annual profit of
over $5M per year within five years. To operate successfully the company will require an
effective management team, human resources, financial resources as well as automated systems
and processes, and the risks of the venture need to be considered and mitigated.

57
Appendices

58
Appendix A – Financial Projections
Annual Pro Forma 5 Year P&L
Proforma P&L Year 1 Year 2 Year 3 Year 4 Year 5
Revenues:
8%
Total Revenue 176,736$ 1,528,664$ 4,913,130.39$ 7,738,180$ 8,937,598$
Cost of Sales 7,628 73,825 249,744$ 393,346$ 454,315$
Gross Margin 169,108$ 1,454,839$ 4,663,387$ 7,344,834$ 8,483,283$
Expenses:
Advertising and Promotion 105,000 229,300 835,232 1,547,636 2,055,648
Bad Debt 846 7,274 23,317 36,724 42,416
Bank Charges 5,100 12,000 12,240 12,485 12,734
Depreciation 3,500 6,000 6,000 6,000 6,000
Donations - 20,718 233,169 367,242 424,164
Insurance 5,833 10,000 10,200 15,000 16,500
Professional / Legal Fees 44,000 54,000 55,080 56,182 57,305
Travel 45,000 42,000 24,000 24,480 24,970
Rent 30,000 60,000 61,200 62,424 63,672
Salaries - Management 24,000 180,000 183,600 187,272 191,017
Salaries - IT 40,000 126,667 141,867 150,379 159,401
Staff Salaries 20,000 103,333 115,733 129,621 145,176
Call Centre 20,000 103,333 115,733 129,621 145,176
Internet, Telecommunications, Phones 4,000 8,000 8,160 8,323 8,490
Reservation Systems 6,000 24,000 24,480 24,970 25,469
Utilities 4,000 8,000 8,160 8,323 8,490 -$ -$
357,279$ 994,625$ 1,858,172$ 2,766,682$ 3,386,629$
-$
Net Income (188,171)$ 460,214$ 2,805,215$ 4,578,152$ 5,096,654$
Annual Pro Forma 5 Year Revenue Statement
Proforma Revenue Statements Year 1 Year 2 Year 3 Year 4 Year 5
Revenues:
Potential Accomodation Reservation Market 7,973,035 8,052,765 8,133,292 8,133,292 8,133,292
% Market Penetration 0.02% 0.18% 0.51% 0.77% 0.85%
Estimated Clients 1,860 14,350 41,769 62,654 68,920
Accomodation Reservation Fee 30$ 61$ 64$ 67$ 71$
Sub-total Accomodation Reservation 111,622$ 878,233$ 2,684,103$ 4,227,462$ 4,882,719$
Less: Cost of Sales 1,116$ 8,782$ 26,841$ 42,275$ 48,827$
Commission - Accomodation Reservations 110,506$ 869,451$ 2,657,262$ 4,185,187$ 4,833,891$
54%
Potential Related Services Market 7,973,035 8,052,765 8,133,292 8,133,292 8,133,292
% Market Penetration 0.01% 0.12% 0.34% 0.51% 0.56%
Estimated Clients 1,085 9,567 27,846 41,769 45,946
Relates Services Fee/Markup 30$ 61$ 64$ 67$ 71$
Sub-total Related Services 65,113$ 585,489$ 1,789,402$ 2,818,308$ 3,255,146$
Less: Cost of Sales 6,511$ 58,549$ 178,940$ 281,831$ 325,515$
Fee / Markup - Related Services Revenues 58,602$ 526,940$ 1,610,462$ 2,536,477$ 2,929,631$
33%
Potential Advertising Market 120,000 120,000 120,000 120,000 120,000
% Market Penetration 0.00% 0.05% 0.34% 0.51% 0.56%
Estimated Clients - 64 410 616 677
Average Advertising Fee 500$ 1,020$ 1,071$ 1,125$ 1,181$
Sub-total Advertising -$ 64,942$ 439,626$ 692,410$ 799,734$
Less: Cost of Sales - 6,494 43,963 69,241 79,973
Advertising Revenues -$ 58,448$ 395,663$ 623,169$ 719,761$
8%
Total Revenue 176,736$ 1,528,664$ 4,913,130.39$ 7,738,180$ 8,937,598$
Cost of Sales 7,628 73,825 249,744$ 393,346$ 454,315$
Gross Margin 169,108$ 1,454,839$ 4,663,387$ 7,344,834$ 8,483,283$

59
Annual Pro Forma 5 Year Cash Flow Statement
Statement of Cash Flows Year 1 Year 2 Year 3 Year 4 Year 5
Opening Cash Balance -$ 76,461$ 486,862$ 3,160,778$ 7,634,306$
Cash Inflows
Receivables Current Month/Year 33,822 290,968 932,677 1,468,967 1,696,657
Receivables Prior Month/Year 94,720 1,050,367 3,573,888 5,697,104 6,710,730
Loan incoming 300,000 - - - -
- -
428,541$ 1,341,335$ 4,506,565$ 7,166,071$ 8,407,387$
Cash Outflows
Payables Current Month/Year 35,378 98,862 185,217 276,068 338,063
Payables Prior Month/Year 256,703 832,071 1,647,431 2,416,475 2,996,070
Web Development 60,000 - - - -
Loan repayments - - - -
- -
352,081$ 930,933$ 1,832,649$ 2,692,543$ 3,334,133$
Net Cash Flows 76,461$ 410,401$ 2,673,916$ 4,473,527$ 5,073,254$
Closing Cash Balance 76,461$ 486,862$ 3,160,778$ 7,634,306$ 12,707,559$
Annual Pro Forma 5 Year Balance Sheet
Proforma Balance Sheet Year 1 Year 2 Year 3 Year 4 Year 5
Balance Sheet
Assets
Cash and term deposits $76,461 $486,862 $3,160,778 $7,634,306 $12,707,559
Accounts receivable $40,567 $154,071 $310,892 $489,656 $565,552
Current Assets $117,027 $640,933 $3,471,671 $8,123,961 $13,273,111
Capital Assets $60,000 $60,000 $60,000 $60,000 $60,000
Acc Depreciation ($3,500) ($9,500) ($15,500) ($21,500) ($27,500)
Capital Assets, net $56,500 $50,500 $44,500 $38,500 $32,500
Total Assets $173,527 $691,433 $3,516,171 $8,162,461 $13,305,611
Liabilities and Equity
Accounts payable and accruals $61,698 $119,390 $138,913 $207,051 $253,547
Current Liabilities $61,698 $119,390 $138,913 $207,051 $253,547
Financing Requirements $300,000 $300,000 $300,000 $300,000 $300,000
Long term Liabilities $300,000 $300,000 $300,000 $300,000 $300,000
Total Liabilities $361,698 $419,390 $438,913 $507,051 $553,547
Equity
Retained surplus (deficit) ($188,171) $272,043 $3,077,258 $7,655,410 $12,752,064
Total Liabilities and Equity $173,527 $691,433 $3,516,171 $8,162,461 $13,305,611

60
Detailed Pro Forma P & L – Year 1
Proforma P&L Mth 1 Mth 2 Mth 3 Mth 4 Mth 5 Mth 6 Mth 7 Mth 8 Mth 9 Mth 10 Mth 11 Mth 12
Revenues:
Total Revenue -$ -$ -$ -$ -$ -$ 11,959.55$ 17,939.33$ 23,919.10$ 29,898.88$ 39,865.17$ 53,153.56$
Cost of Sales -$ -$ -$ -$ -$ -$ 478$ 718$ 957$ 1,196$ 1,834$ 2,445$
Gross Margin -$ -$ -$ -$ -$ -$ 11,481$ 17,222$ 22,962$ 28,703$ 38,031$ 50,708$
Expenses:
Advertising and Promotion - - - - - 15,000 15,000 15,000 15,000 15,000 15,000 15,000
Bad Debt - - - - - - 57 86 115 144 190 254
Bank Charges - - - 500 500 500 500 500 500 500 800 800
Depreciation - - - - - 500 500 500 500 500 500 500
Donations - - - - - - - - - - - -
Insurance - - - - - 833 833 833 833 833 833 833
Professional / Legal Fees 2,000 2,000 2,000 2,000 2,000 2,000 2,000 2,000 2,000 2,000 2,000 22,000
Travel - - - 5,000 5,000 5,000 5,000 5,000 5,000 5,000 5,000 5,000
Rent - - - - - - 5,000 5,000 5,000 5,000 5,000 5,000
Salaries - Management - - - - - 4,000 4,000 4,000 4,000 4,000 4,000
Salaries - IT - - - - - - 6,667 6,667 6,667 6,667 6,667 6,667
Staff Salaries - - - - - - 3,333 3,333 3,333 3,333 3,333 3,333
Call Centre - - - - - - 3,333 3,333 3,333 3,333 3,333 3,333
Internet, Telecommunications, Phones - - - - - - 667 667 667 667 667 667
Reservation Systems - - - - - - 1,000 1,000 1,000 1,000 1,000 1,000
Utilities - - - - - - 667 667 667 667 667 667
2,000$ 2,000$ 2,000$ 7,500$ 7,500$ 23,833$ 48,557$ 48,586$ 48,615$ 48,644$ 48,990$ 69,054$
Net Income (2,000) (2,000) (2,000) (7,500) (7,500) (23,833) (37,076) (31,364) (25,652) (19,941) (10,959) (18,345)
Detailed Pro Forma Revenue Statement – Year 1
Proforma Revenue Statements Mth 1 Mth 2 Mth 3 Mth 4 Mth 5 Mth 6 Mth 7 Mth 8 Mth 9 Mth 10 Mth 11 Mth 12
Revenues:
Potential Accomodation Reservation Market 664,420 664,420 664,420 664,420 664,420 664,420 664,420 664,420 664,420 664,420 664,420 664,420
% Market Penetration 0.00% 0.00% 0.00% 0.00% 0.00% 0.00% 0.02% 0.03% 0.04% 0.05% 0.06% 0.08%
Estimated Clients - - - - - - 133 199 266 332 399 532
Accomodation Reservation Fee - -$ -$ -$ -$ -$ 60$ 60$ 60$ 60$ 60$ 60$
Sub-total Accomodation Reservation -$ -$ -$ -$ -$ -$ 7,973$ 11,960$ 15,946$ 19,933$ 23,919$ 31,892$
Less: Cost of Sales -$ -$ -$ -$ -$ -$ 80$ 120$ 159$ 199$ 239$ 319$
Commission - Accomodation Reservations -$ -$ -$ -$ -$ -$ 7,893$ 11,840$ 15,787$ 19,733$ 23,680$ 31,573$
Potential Related Services Market 664,420 664,420 664,420 664,420 664,420 664,420 664,420 664,420 664,420 664,420 664,420 664,420
% Market Penetration 0.00% 0.00% 0.00% 0.00% 0.00% 0.00% 0.01% 0.02% 0.02% 0.03% 0.04% 0.05%
Estimated Clients - - - - - - 66 100 133 166 266 354
Relates Services Fee/Markup - -$ -$ -$ -$ -$ 60$ 60$ 60$ 60$ 60$ 60$
Sub-total Related Services -$ -$ -$ -$ -$ -$ 3,987$ 5,980$ 7,973$ 9,966$ 15,946$ 21,261$
Less: Cost of Sales -$ -$ -$ -$ -$ -$ 399$ 598$ 797$ 997$ 1,595$ 2,126$
Fee / Markup - Related Services Revenues -$ -$ -$ -$ -$ -$ 3,588$ 5,382$ 7,176$ 8,970$ 14,351$ 19,135$
Potential Advertising Market 10,000 10,000 10,000 10,000 10,000 10,000 10,000 10,000 10,000 10,000 10,000 10,000
% Market Penetration 0.00% 0.00% 0.00% 0.00% 0.00% 0.00% 0.00% 0.00% 0.00% 0.00% 0.00% 0.00%
Estimated Clients - - - - - - - - - - - -
Average Advertising Fee - -$ -$ -$ -$ -$ 1,000$ 1,000$ 1,000$ 1,000$ 1,000$ 1,000$
Sub-total Advertising -$ -$ -$ -$ -$ -$ -$ -$ -$ -$ -$ -$
Less: Cost of Sales - - - - - - - - - - - -
Advertising Revenues -$ -$ -$ -$ -$ -$ -$ -$ -$ -$ -$ -$
Total Revenue -$ -$ -$ -$ -$ -$ 11,959.55$ 17,939.33$ 23,919.10$ 29,898.88$ 39,865.17$ 53,153.56$
Cost of Sales -$ -$ -$ -$ -$ -$ 478$ 718$ 957$ 1,196$ 1,834$ 2,445$
Gross Margin -$ -$ -$ -$ -$ -$ 11,481$ 17,222$ 22,962$ 28,703$ 38,031$ 50,708$
Detailed Pro Forma Cash Flow Statement – Year 1
Statement of Cash Flows Mth 1 Mth 2 Mth 3 Mth 4 Mth 5 Mth 6 Mth 7 Mth 8 Mth 9 Mth 10 Mth 11 Mth 12
Opening Cash Balance -$ 299,800$ 287,800$ 265,800$ 243,250$ 225,750$ 216,667$ 193,157$ 157,726$ 128,007$ 104,000$ 86,390$
Cash Inflows
Receivables Current Month/Year -$ -$ -$ -$ -$ -$ 2,296$ 3,444$ 4,592$ 5,741$ 7,606$ 10,142$
Receivables Prior Month/Year -$ -$ -$ -$ -$ -$ -$ 9,185$ 13,777$ 18,370$ 22,962$ 30,425$
Loan incoming 300,000$ -$ -$ -$ -$ -$ -$ -$ -$ -$ -$ -$
300,000$ -$ -$ -$ -$ -$ 2,296$ 12,629$ 18,370$ 24,110$ 30,569$ 40,567$
Cash Outflows
Payables Current Month/Year 200$ 200$ 200$ 750$ 750$ 2,333$ 4,806$ 4,809$ 4,811$ 4,814$ 4,849$ 6,855$
Payables Prior Month/Year -$ 1,800$ 1,800$ 1,800$ 6,750$ 6,750$ 21,000$ 43,252$ 43,277$ 43,303$ 43,329$ 43,641$
Web Development 10,000$ 20,000$ 20,000$ 10,000$ -$ -$ -$ -$ -$ -$ -$
Loan repayments -$ -$ -$ -$ -$ -$ -$ -$ -$ -$ -$ -$
200$ 12,000$ 22,000$ 22,550$ 17,500$ 9,083$ 25,806$ 48,060$ 48,089$ 48,118$ 48,178$ 50,496$
Net Cash Flows 299,800$ (12,000)$ (22,000)$ (22,550)$ (17,500)$ (9,083)$ (23,510)$ (35,431)$ (29,719)$ (24,007)$ (17,610)$ (9,930)$
Closing Cash Balance 299,800$ 287,800$ 265,800$ 243,250$ 225,750$ 216,667$ 193,157$ 157,726$ 128,007$ 104,000$ 86,390$ 76,461$
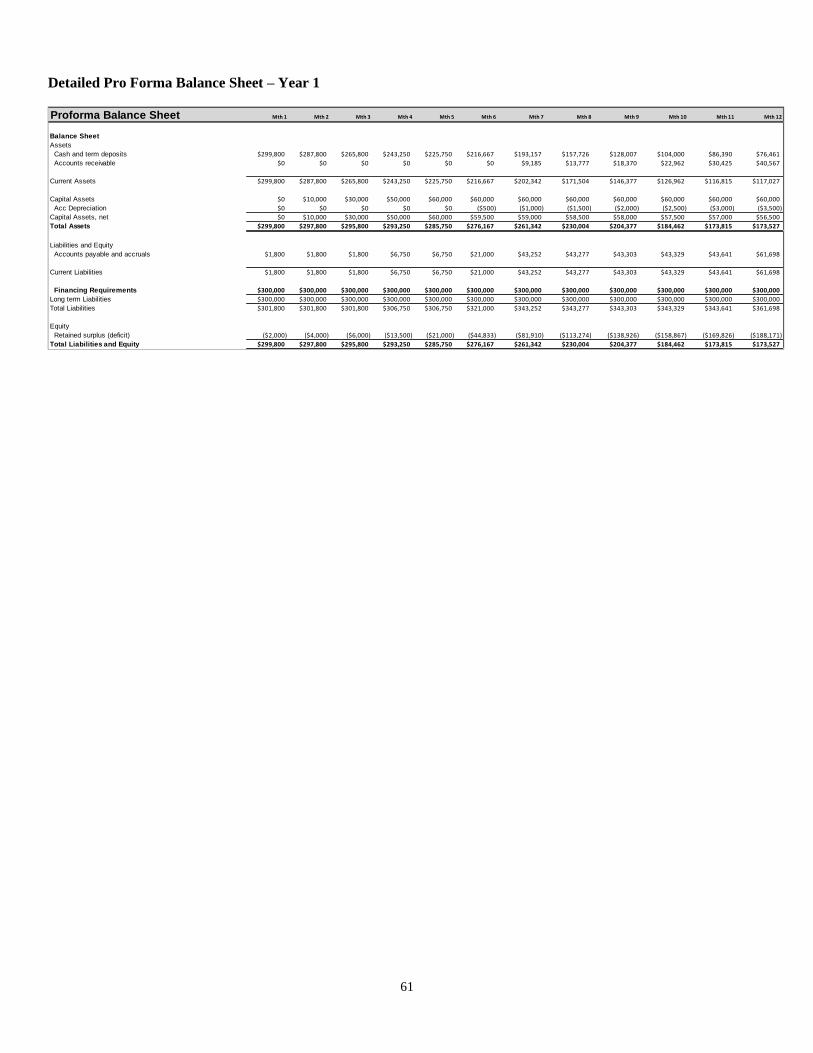
61
Detailed Pro Forma Balance Sheet – Year 1
Proforma Balance Sheet Mth 1 Mth 2 Mth 3 Mth 4 Mth 5 Mth 6 Mth 7 Mth 8 Mth 9 Mth 10 Mth 11 Mth 12
Balance Sheet
Assets
Cash and term deposits $299,800 $287,800 $265,800 $243,250 $225,750 $216,667 $193,157 $157,726 $128,007 $104,000 $86,390 $76,461
Accounts receivable $0 $0 $0 $0 $0 $0 $9,185 $13,777 $18,370 $22,962 $30,425 $40,567
Current Assets $299,800 $287,800 $265,800 $243,250 $225,750 $216,667 $202,342 $171,504 $146,377 $126,962 $116,815 $117,027
Capital Assets $0 $10,000 $30,000 $50,000 $60,000 $60,000 $60,000 $60,000 $60,000 $60,000 $60,000 $60,000
Acc Depreciation $0 $0 $0 $0 $0 ($500) ($1,000) ($1,500) ($2,000) ($2,500) ($3,000) ($3,500)
Capital Assets, net $0 $10,000 $30,000 $50,000 $60,000 $59,500 $59,000 $58,500 $58,000 $57,500 $57,000 $56,500
Total Assets $299,800 $297,800 $295,800 $293,250 $285,750 $276,167 $261,342 $230,004 $204,377 $184,462 $173,815 $173,527
Liabilities and Equity
Accounts payable and accruals $1,800 $1,800 $1,800 $6,750 $6,750 $21,000 $43,252 $43,277 $43,303 $43,329 $43,641 $61,698
Current Liabilities $1,800 $1,800 $1,800 $6,750 $6,750 $21,000 $43,252 $43,277 $43,303 $43,329 $43,641 $61,698
Financing Requirements $300,000 $300,000 $300,000 $300,000 $300,000 $300,000 $300,000 $300,000 $300,000 $300,000 $300,000 $300,000
Long term Liabilities $300,000 $300,000 $300,000 $300,000 $300,000 $300,000 $300,000 $300,000 $300,000 $300,000 $300,000 $300,000
Total Liabilities $301,800 $301,800 $301,800 $306,750 $306,750 $321,000 $343,252 $343,277 $343,303 $343,329 $343,641 $361,698
Equity
Retained surplus (deficit) ($2,000) ($4,000) ($6,000) ($13,500) ($21,000) ($44,833) ($81,910) ($113,274) ($138,926) ($158,867) ($169,826) ($188,171)
Total Liabilities and Equity $299,800 $297,800 $295,800 $293,250 $285,750 $276,167 $261,342 $230,004 $204,377 $184,462 $173,815 $173,527

62
Detailed Pro Forma P & L – Year 2
Proforma P&L Mth 1 Mth 2 Mth 3 Mth 4 Mth 5 Mth 6 Mth 7 Mth 8 Mth 9 Mth 10 Mth 11 Mth 12
Revenues:
Total Revenue 72,528.50$ 79,577.35$ 87,320.89$ 95,828.07$ 105,174.72$ 115,444.22$ 126,728.29$ 139,127.73$ 152,753.46$ 167,727.40$ 184,183.67$ 202,269.75$
Cost of Sales 3,557$ 3,892$ 4,260$ 4,663$ 5,106$ 5,592$ 6,125$ 6,710$ 7,352$ 8,057$ 8,831$ 9,681$
Gross Margin 68,972$ 75,685$ 83,061$ 91,165$ 100,069$ 109,853$ 120,604$ 132,418$ 145,401$ 159,670$ 175,352$ 192,589$
Expenses:
Advertising and Promotion 10,879 11,937 13,098 14,374 15,776 17,317 19,009 20,869 22,913 25,159 27,628 30,340
Bad Debt 345 378 415 456 500 549 603 662 727 798 877 963
Bank Charges 1,000 1,000 1,000 1,000 1,000 1,000 1,000 1,000 1,000 1,000 1,000 1,000
Depreciation 500 500 500 500 500 500 500 500 500 500 500 500
Donations 2,197 2,412 2,648 2,908 3,193 3,507 3,852
Insurance 833 833 833 833 833 833 833 833 833 833 833 833
Professional / Legal Fees 2,000 2,000 2,000 2,000 2,000 2,000 2,000 2,000 2,000 2,000 2,000 32,000
Travel 5,000 5,000 5,000 5,000 5,000 5,000 2,000 2,000 2,000 2,000 2,000 2,000
Rent 5,000 5,000 5,000 5,000 5,000 5,000 5,000 5,000 5,000 5,000 5,000 5,000
Salaries - Management 10,000 10,000 10,000 10,000 10,000 10,000 20,000 20,000 20,000 20,000 20,000 20,000
Salaries - IT 6,667 6,667 6,667 6,667 6,667 13,333 13,333 13,333 13,333 13,333 13,333 13,333
Staff Salaries 6,667 6,667 6,667 6,667 6,667 10,000 10,000 10,000 10,000 10,000 10,000 10,000
Call Centre 6,667 6,667 6,667 6,667 6,667 10,000 10,000 10,000 10,000 10,000 10,000 10,000
Internet, Telecommunications, Phones 667 667 667 667 667 667 667 667 667 667 667 667
Reservation Systems 2,000 2,000 2,000 2,000 2,000 2,000 2,000 2,000 2,000 2,000 2,000 2,000
Utilities 667 667 667 667 667 667 667 667 667 667 667 667
58,891$ 59,982$ 61,180$ 62,497$ 63,943$ 81,063$ 90,024$ 92,180$ 94,548$ 97,151$ 100,011$ 133,155$
Net Income 10,081$ 15,704$ 21,881$ 28,668$ 36,126$ 28,790$ 30,579$ 40,238$ 50,853$ 62,519$ 75,341$ 59,433$
Detailed Pro Forma Revenue Statement – Year 2
Proforma Revenue Statements Mth 1 Mth 2 Mth 3 Mth 4 Mth 5 Mth 6 Mth 7 Mth 8 Mth 9 Mth 10 Mth 11 Mth 12
Revenues:
Potential Accomodation Reservation Market 671,064 671,064 671,064 671,064 671,064 671,064 671,064 671,064 671,064 671,064 671,064 671,064
% Market Penetration 0.10% 0.11% 0.12% 0.13% 0.15% 0.16% 0.18% 0.19% 0.21% 0.24% 0.26% 0.29%
Estimated Clients 671 738 812 893 983 1,081 1,189 1,308 1,438 1,582 1,741 1,915
Accomodation Reservation Fee 61$ 61$ 61$ 61$ 61$ 61$ 61$ 61$ 61$ 61$ 61$ 61$
Sub-total Accomodation Reservation 41,069$ 45,176$ 49,694$ 54,663$ 60,129$ 66,142$ 72,756$ 80,032$ 88,035$ 96,839$ 106,523$ 117,175$
Less: Cost of Sales 411$ 452$ 497$ 547$ 601$ 661$ 728$ 800$ 880$ 968$ 1,065$ 1,172$
Commission - Accomodation Reservations 40,658$ 44,724$ 49,197$ 54,116$ 59,528$ 65,481$ 72,029$ 79,232$ 87,155$ 95,870$ 105,457$ 116,003$
Potential Related Services Market 671,064 671,064 671,064 671,064 671,064 671,064 671,064 671,064 671,064 671,064 671,064 671,064
% Market Penetration 0.07% 0.07% 0.08% 0.09% 0.10% 0.11% 0.12% 0.13% 0.14% 0.16% 0.17% 0.19%
Estimated Clients 447 492 541 595 655 721 793 872 959 1,055 1,160 1,276
Relates Services Fee/Markup 61$ 61$ 61$ 61$ 61$ 61$ 61$ 61$ 61$ 61$ 61$ 61$
Sub-total Related Services 27,379$ 30,117$ 33,129$ 36,442$ 40,086$ 44,095$ 48,504$ 53,355$ 58,690$ 64,559$ 71,015$ 78,117$
Less: Cost of Sales 2,738$ 3,012$ 3,313$ 3,644$ 4,009$ 4,409$ 4,850$ 5,335$ 5,869$ 6,456$ 7,102$ 7,812$
Fee / Markup - Related Services Revenues 24,641$ 27,106$ 29,816$ 32,798$ 36,078$ 39,685$ 43,654$ 48,019$ 52,821$ 58,103$ 63,914$ 70,305$
Potential Advertising Market 10,000 10,000 10,000 10,000 10,000 10,000 10,000 10,000 10,000 10,000 10,000 10,000
% Market Penetration 0.04% 0.04% 0.04% 0.05% 0.05% 0.05% 0.05% 0.06% 0.06% 0.06% 0.07% 0.07%
Estimated Clients 4 4 4 5 5 5 5 6 6 6 7 7
Average Advertising Fee 1,020$ 1,020$ 1,020$ 1,020$ 1,020$ 1,020$ 1,020$ 1,020$ 1,020$ 1,020$ 1,020$ 1,020$
Sub-total Advertising 4,080$ 4,284$ 4,498$ 4,723$ 4,959$ 5,207$ 5,468$ 5,741$ 6,028$ 6,329$ 6,646$ 6,978$
Less: Cost of Sales 408 428 450 472 496 521 547 574 603 633 665 698
Advertising Revenues 3,672$ 3,856$ 4,048$ 4,251$ 4,463$ 4,687$ 4,921$ 5,167$ 5,425$ 5,696$ 5,981$ 6,280$
Total Revenue 72,528.50$ 79,577.35$ 87,320.89$ 95,828.07$ 105,174.72$ 115,444.22$ 126,728.29$ 139,127.73$ 152,753.46$ 167,727.40$ 184,183.67$ 202,269.75$
Cost of Sales 3,557$ 3,892$ 4,260$ 4,663$ 5,106$ 5,592$ 6,125$ 6,710$ 7,352$ 8,057$ 8,831$ 9,681$
Gross Margin 68,972$ 75,685$ 83,061$ 91,165$ 100,069$ 109,853$ 120,604$ 132,418$ 145,401$ 159,670$ 175,352$ 192,589$

63
Detailed Pro Forma Cash Flow Statement – Year 2
Statement of Cash Flows Mth 1 Mth 2 Mth 3 Mth 4 Mth 5 Mth 6 Mth 7 Mth 8 Mth 9 Mth 10 Mth 11 Mth 12
Opening Cash Balance 76,461$ 63,284$ 75,099$ 92,658$ 116,528$ 147,333$ 184,203$ 214,747$ 247,973$ 291,072$ 345,018$ 410,888$
Cash Inflows
Receivables Current Month/Year 13,794 15,137 16,612 18,233 20,014 21,971 24,121 26,484 29,080 31,934 35,070 38,518
Receivables Prior Month/Year 40,567 55,177 60,548 66,449 72,932 80,055 87,882 96,483 105,934 116,321 127,736 140,282
Loan incoming - - - - - - - - - - - -
54,361$ 70,315$ 77,161$ 84,682$ 92,946$ 102,026$ 112,003$ 122,966$ 135,015$ 148,255$ 162,807$ 178,800$
Cash Outflows
Payables Current Month/Year 5,839 5,948 6,068 6,200 6,344 8,056 8,952 9,168 9,405 9,665 9,951 13,266
Payables Prior Month/Year 61,698 52,552 53,534 54,612 55,797 57,099 72,507 80,572 82,512 84,643 86,986 89,560
Web Development - - - - - - - - - - - -
Loan repayments - - - - - - - - - - -
67,537$ 58,500$ 59,602$ 60,812$ 62,141$ 65,155$ 81,459$ 89,740$ 91,916$ 94,308$ 96,937$ 102,826$
Net Cash Flows (13,176)$ 11,815$ 17,559$ 23,870$ 30,804$ 36,870$ 30,544$ 33,227$ 43,098$ 53,947$ 65,870$ 75,974$
Closing Cash Balance 63,284$ 75,099$ 92,658$ 116,528$ 147,333$ 184,203$ 214,747$ 247,973$ 291,072$ 345,018$ 410,888$ 486,862$
Detailed Pro Forma Balance Sheet – Year 2
Proforma Balance Sheet Mth 1 Mth 2 Mth 3 Mth 4 Mth 5 Mth 6 Mth 7 Mth 8 Mth 9 Mth 10 Mth 11 Mth 12
Balance Sheet
Assets
Cash and term deposits $63,284 $75,099 $92,658 $116,528 $147,333 $184,203 $214,747 $247,973 $291,072 $345,018 $410,888 $486,862
Accounts receivable $55,177 $60,548 $66,449 $72,932 $80,055 $87,882 $96,483 $105,934 $116,321 $127,736 $140,282 $154,071
Current Assets $118,462 $135,648 $159,107 $189,460 $227,388 $272,085 $311,230 $353,908 $407,393 $472,754 $551,170 $640,933
Capital Assets $60,000 $60,000 $60,000 $60,000 $60,000 $60,000 $60,000 $60,000 $60,000 $60,000 $60,000 $60,000
Acc Depreciation ($4,000) ($4,500) ($5,000) ($5,500) ($6,000) ($6,500) ($7,000) ($7,500) ($8,000) ($8,500) ($9,000) ($9,500)
Capital Assets, net $56,000 $55,500 $55,000 $54,500 $54,000 $53,500 $53,000 $52,500 $52,000 $51,500 $51,000 $50,500
Total Assets $174,462 $191,148 $214,107 $243,960 $281,388 $325,585 $364,230 $406,408 $459,393 $524,254 $602,170 $691,433
Liabilities and Equity
Accounts payable and accruals $52,552 $53,534 $54,612 $55,797 $57,099 $72,507 $80,572 $82,512 $84,643 $86,986 $89,560 $119,390
Current Liabilities $52,552 $53,534 $54,612 $55,797 $57,099 $72,507 $80,572 $82,512 $84,643 $86,986 $89,560 $119,390
Financing Requirements $300,000 $300,000 $300,000 $300,000 $300,000 $300,000 $300,000 $300,000 $300,000 $300,000 $300,000 $300,000
Long term Liabilities $300,000 $300,000 $300,000 $300,000 $300,000 $300,000 $300,000 $300,000 $300,000 $300,000 $300,000 $300,000
Total Liabilities $352,552 $353,534 $354,612 $355,797 $357,099 $372,507 $380,572 $382,512 $384,643 $386,986 $389,560 $419,390
Equity
Retained surplus (deficit) ($178,090) ($162,386) ($140,505) ($111,837) ($75,711) ($46,921) ($16,342) $23,896 $74,749 $137,269 $212,610 $272,043
Total Liabilities and Equity $174,462 $191,148 $214,107 $243,960 $281,388 $325,585 $364,230 $406,408 $459,393 $524,254 $602,170 $691,433
64
Reference List
Chan, K. , Mauborgne, R. (1999), Creating New Market Space, Harvard Business Review
Chan, K., Mauborgne, R. (2000), Knowing a Winning Business Idea When You See One, Harvard Business Review
Charan, R. (2007), Know How The 8 Skills That Separate People Who Perform From Those Who Don’t. USA Crown Publishing Group
Capron, L. , Mitchell, W. (2010), Finding the Right Path, Harvard Business Review
Destination Analysts Inc. (2010), The State of the American Traveller, Vol 10, July 2010
Foot, D. (1999), Boom Bust and Echo 2000, Stoddart
Fuller, J. (2009), Lodging Industry Outlook: Supply Dynamics Amid the Recession, PhoCusWright Inc.
Ghemawat, P. Strategy and the Business Landscape, Prentice Hall
Gupta, R., (2010) The World of Travel Planning and Buying Continues to Evolve, HospitalityNet, Retrieved 2010, October 24 from www.hospitalitynet.org
Hoffman, C. (2009), The Role and Value of Global Distribution Systems in Travel Distribution, PhoCusWright Inc.
Hospitality Net Article (2010) Why Hotels Should Not Attack Any Expedias Or TripAdvisors, Retrieved 2010, Oct 17 from www.hospitalitynet.org
KPMG (2004), Global Hotel Distribution Survey, KPMG International
Kracht, J., Wang, Y. (2010), Examining the tourism distribution channel: evolution and transformation, International Journal of Contemporary Hospitality Management Retrieved 2010, Oct 17 from http://www.hospitality.ucf.edu/faculty/raywang/documents/HFT7715/Technology%20strategy/Ex
aming%20the%20Tourism%20Distribution%20Channel.pdf
Lang Research (2007), TAMS Travel Activities and Motivations of Canadian Residents, Research Report prepared for Alberta Tourism, Parks, Recreation and Culture, March 2007
Lang Research (2007): TAMS Travel Activities and Motivations of U.S. Residents, Research Report prepared for Alberta Tourism, Parks, Recreation and Culture Research Report January 2007
65
Lang Research: TAMS 2006 U.S Activity Profile: Downhill Skiing and Snowboarding while on Trips
Lang Research: TAMS 2006 U.S Activity Profile: Golfing while on Trips
Levitt, T. (1991), Levitt on Marketing, Harvard Business School Press
Library of Congress Business Reference Services (n.d.) Travel Agents / Tour Operators, Retrieved 2010, October 18 from http://www.loc.gov/rr/business/BERA/issue11/agents.html
Lovelock, C. (2001), Services Marketing, Prentice Hall
Lovelock, C., Gummesson, E. (2004), Whither Services Marketing?: In Search of a New Paradigm and Fresh Perspectives, Journal of Service Research Retrieved 2010, March 6 from http://jsr.sagepub.com/content/7/1/20.full.pdf+html
Mamaghani, F. (2009), Impact of E-commerce on Travel and Tourism: An Historical Analysis, International Journal of Management, Retrieved 2010, October 17 from http://www.allbusiness.com/marketing-advertising/marketing-advertising/13534820-1.html
Meer, D. (2006), Rediscovering Market Segmentation, Harvard Business Review
Nelson G., Kauffman R., King, B. (2008), How Has Electronic Travel Distribution Been Transformed: A Test of the Theory of Newly Vulnerable Markets, Retrieved 2010, October 25 from http://graziadio.pepperdine.edu/faculty/ngranados/granadospaper4.pdf
Offutt, B. (2010), Analysis of Multisource Leisure-Oriented Distribution Platforms, PhoCusWright Inc.
PhoCusWright Research (2010), Technology and Independent Distribution in the European Travel Industry
Porter, M.E. (2001), Strategy and the Internet, Harvard Business Review
Porter, M.E. (1996), What Is Strategy?, Harvard Business Review
Quinby, D. Merten, R. (2009), The Role and Value of the Global Distribution Systems in Travel Distribution, PhoChus Wright Whitepaper, Retrieved 2010, October 25 from http://www.interactivetravel.org/IndustryBackground/Attachments/GDS_Profile_Whitepaper.pdf
Saitto, S. Womack, B. Mullaney, T. (2010), Google Said to Be in Talks to Buy Travel Company ITA (Update1), Bloomberg Businessweek, Retrieved 2011, February 15 from http://www.businessweek.com/news/2010-04-21/google-said-to-be-in-talks-to-buy-travel-company-ita-update1-.html

66
Sismanidou, A., Palacious, M., Tafur, J. (n.d.) The failure of Global Distribution Systems New Entrants (GNEs) to offer a true alternative to traditional GDSs: myth, reality and opportunity, Retrieved 2010, October 25 from http://oa.upm.es/3591/1/INVE_MEM_2008_55995.pdf
Ritesh, G. (2010) The World of Travel Planning and Buying Continues to Evolve, HospitalityNet Retrieved 2010, October 17 from www.hospitalitynet.org
Silk, A.J., What is Marketing, Harvard Business School Press
Starkov, M., (2010) Deja Vu: The Billion Dollar “Leakage” Continues to Drain the Hospitality Industry, HospitalityNet, Retrieved 2010, October 17 from www.hospitalitynet.org
Starkov,M. (2009 ) Growing Tension between hoteliers and OTAs, Retrieved 2010, October 17 from http://www.hotelmarketing.com/index.php/content/article/growing_tension_between_hoteliers_and_otas/
Starkov, M., Mechoso S. (2010) Smart Hotelier’s Guide to 2011 Internet Marketing Budget Planning, HospitalityNet , Retrieved 2010, Oct 17 from www.hospitalitynet.org
Starkov, M. (2010) The Prisoner’s Dilemma, the Stockholm Syndrome, or a Case of Both?, HeBS Internet Marketing Blog , Retrieved 2010, October 24 from www.hospitalityebusiness.com/blog
Starkov, M. (2010) The Good and (Very) Bad News in the Online Distribution Channel, HeBS Internet Marketing Blog, Retrieved 2010, October 31 from www.hospitalityebusiness.com/blog
Strauss, M. (2010) Value Creation in Travel Distribution, PASS IT Consulting Dipl.
Wikipedia (n.d.) Retrieved 2010, October 25 from http://en.wikipedia.org/wiki/Computer_reservations_system
Yahoo Finance, Company Financial Information, Retrieved 2010, October 31 from www.yahoo.com