business systems - creating & maintaining order - jennifer lemcke, weed man usa
TRANSCRIPT

1
SYSTEMSGETTING BACK TO BASICS
THE BUSINESS
DEFINING YOUR BUSINESS
Where are you in the business cycle?
Infancy Stage
Adolescent Stage
Mature Business
THE BUSINESS
INFANCY STAGE
You are in the growth stage of thebusiness. Most companies that findthemselves in this stage are owneroperated and the owner is wearing allthe hats in the company!

2
THE BUSINESS
ADOLESCENT STAGE
You are still in the growth stage of thebusiness but the owner identifies the needfor help. Often occurs during crisis. Tomove beyond this stage you need to makesure you get the right people and developthe right environment for continued growth.
THE BUSINESS
MATURE BUSINESS
The third phase of a business cycle.Not all companies arrive at this stage,but the great ones that do have anowner that has vision, culture, benchstrength and passion.
THE BUSINESSHOW DO YOU TRANSITIONS FROM
INFANCY STAGE TO ADOLESCENT STAGE?
• Create Solid Business Plans• Build Procedural Type Systems• Develop Training Programs• Develop Measurement Tools• Create a Culture of Accountability• Develop Good Bench Strength• Manage Your Biggest Asset – Your People!• Lead With Passion!

3
SYSTEMS
SYSTEMIZING YOUR BUSINESS HAS THEPOWER TO DRAMATICALLY TRANSFORMANY BUSINESS FROM A CONDITION OFCHAOS TO A CONDITION OF ORDER.
WHY DO SOME PEOPLE FIGHT IT!
4
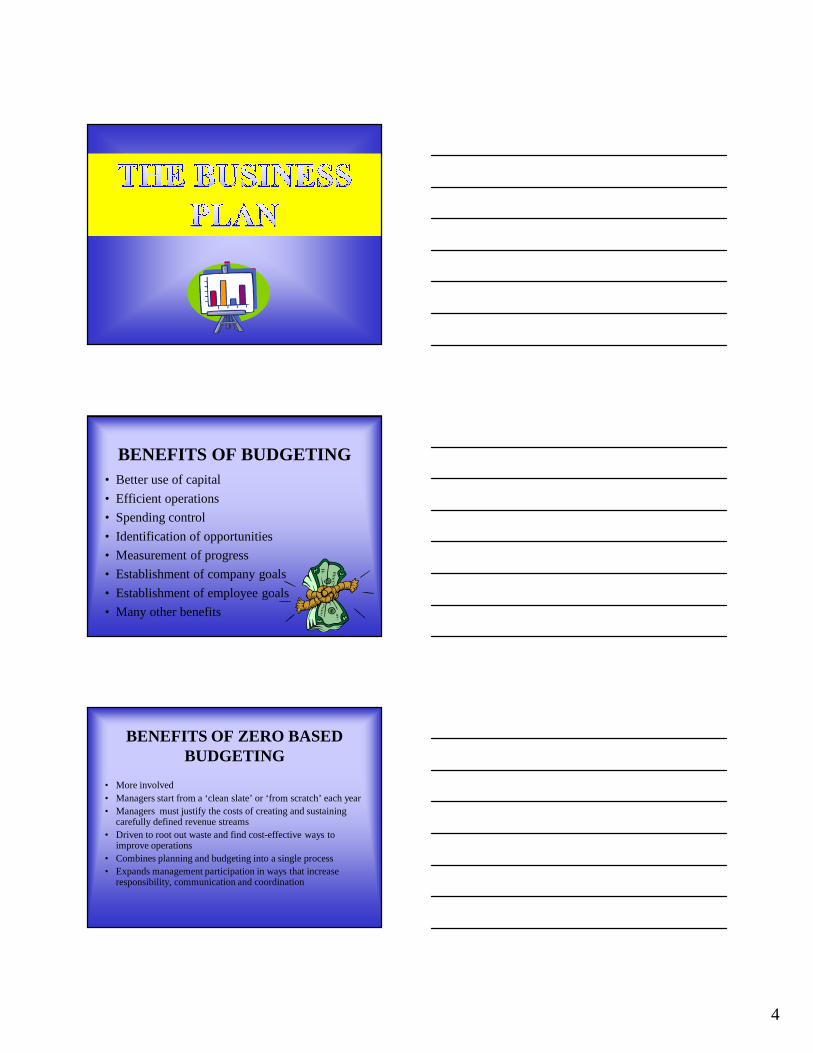
BENEFITS OF BUDGETING
• Better use of capital
• Efficient operations
• Spending control
• Identification of opportunities
• Measurement of progress
• Establishment of company goals
• Establishment of employee goals
• Many other benefits
BENEFITS OF ZERO BASEDBUDGETING
• More involved
• Managers start from a ‘clean slate’ or ‘from scratch’ each year
• Managers must justify the costs of creating and sustainingcarefully defined revenue streams
• Driven to root out waste and find cost-effective ways toimprove operations
• Combines planning and budgeting into a single process
• Expands management participation in ways that increaseresponsibility, communication and coordination
5
SAMPLE BUDGET
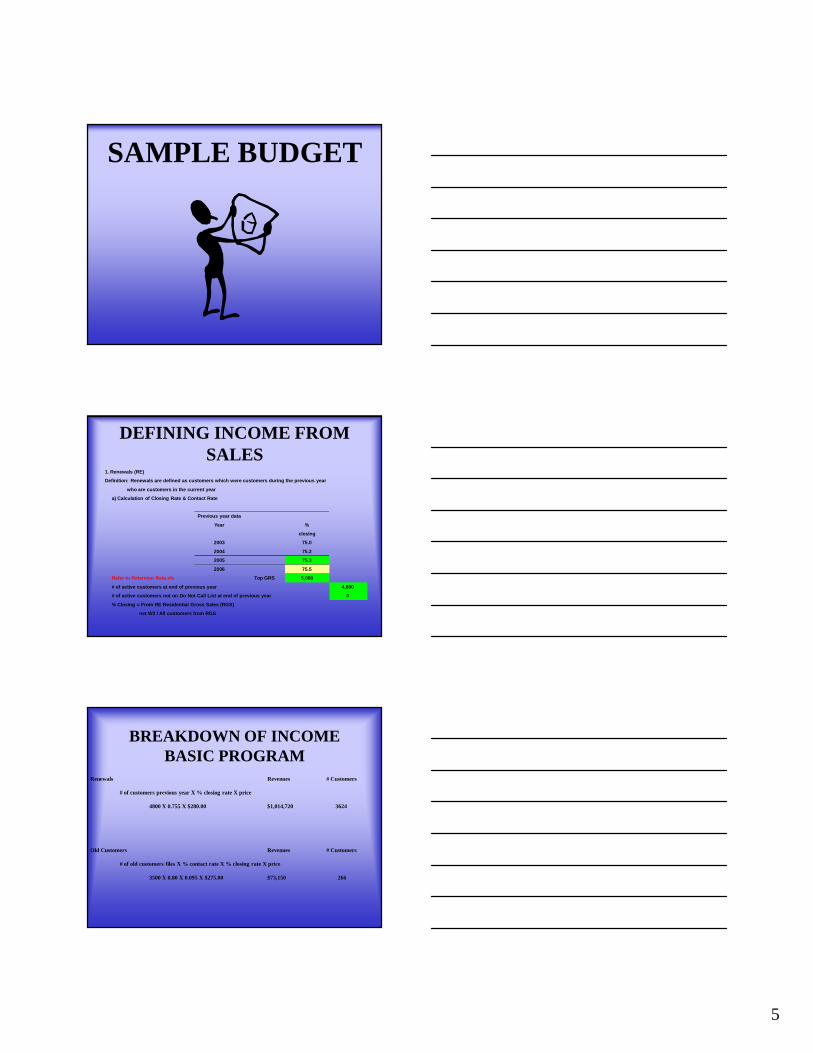
DEFINING INCOME FROMSALES
1. Renewals (RE)
Definition: Renewals are defined as customers which were customers during the previous year
who are customers in the current year
a) Calculation of Closing Rate & Contact Rate
Previous year data
Year %
closing
2003 75.0
2004 75.2
2005 75.3
2006 75.5
Refer to Retention Rate.xls Top GRS 5,000
# of active customers at end of previous year 4,800
# of active customers not on Do Not Call List at end of previous year 0
% Closing = From RE Residential Gross Sales (RGS)
net W2 / All customers from RGS
BREAKDOWN OF INCOMEBASIC PROGRAM
Renewals Revenues # Customers
# of customers previous year X % closing rate X price
4800 X 0.755 X $280.00 $1,014,720 3624
Old Customers Revenues # Customers
# of old customers files X % contact rate X % closing rate X price
3500 X 0.80 X 0.095 X $275.00 $73,150 266
6
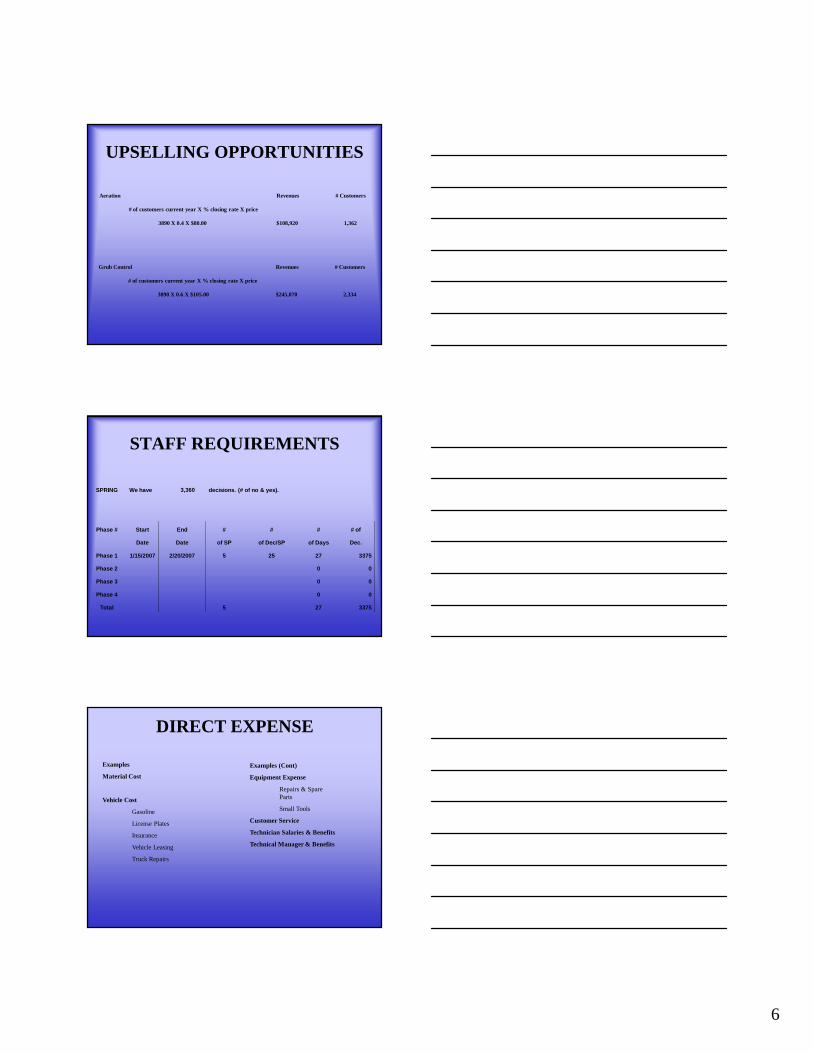
UPSELLING OPPORTUNITIES
Aeration Revenues # Customers
# of customers current year X % closing rate X price
3890 X 0.4 X $80.00 $108,920 1,362
Grub Control Revenues # Customers
# of customers current year X % closing rate X price
3890 X 0.6 X $105.00 $245,070 2,334
STAFF REQUIREMENTS
SPRING We have 3,360 decisions. (# of no & yes).
Phase # Start End # # # # of
Date Date of SP of Dec/SP of Days Dec.
Phase 1 1/15/2007 2/20/2007 5 25 27 3375
Phase 2 0 0
Phase 3 0 0
Phase 4 0 0
Total 5 27 3375
DIRECT EXPENSE
Examples
Material Cost
Vehicle Cost
Gasoline
License Plates
Insurance
Vehicle Leasing
Truck Repairs
Examples (Cont)
Equipment Expense
Repairs & SpareParts
Small Tools
Customer Service
Technician Salaries & Benefits
Technical Manager & Benefits

7
ADMINISTRATIVE EXPENSEExamples
Office supplies
Envelopes
Postage
Computer Paper
Ink Cartridge
Computer
Invoices
Office Maintenance
Office Equipment
Rentals
Repairs
Examples (Cont)
Office Rent
Rent
Utilities
Business Tax
Garbage & Others
Business Permits
Telephone
Installation
Monthly cost
Office Staff Salaries & Benefits
General Manager Salary & Benefits
SELLING EXPENSE
Examples
Promotion & Advertising
Radio & Television
Fact Sheets
Lawn Flags
Door Hangers
Yellow Pages
Promotional Gifts
Examples (Cont)
Direct Marketing
Salaries
Rent
Telephone
Sales Manager
BUSINESS PLANNINGDESCRIPTION TOTAL NOV DEC JAN FEB MAR
CASH INFLOW
COL. OF REC. PR. YR. 58,238 23,087 9,734 5,183 8,317 3,970
COL. OF REC. & PREPAIDS CUR. YR. 707,989 20,000 10,000 5,633 23,723 76,709
COL. OF PREPAIDS NEXT YR. 156,571
SERVICE CHARGES 8,317 700 700 1,138 220 826
INTEREST ON DEPOSIT - - - - - -
BANK LOAN - -
ADVANCE FROM PARENT (115,000) - - (40,000) -
TOTAL CASH INFLOW 816,115 43,787 20,434 (28,046) 32,260 81,505
CASH OUTFLOW
-
PMT OF LONG TERM DEBT 10,920 910 910 910 910 910
DIRECT EXPENSES 367,375 1,986 1,986 1,986 13,392 13,464
ADMINISTRATIVE EXPENSES 234,472 14,672 16,001 20,631 17,251 28,198
SELLING EXPENSES 149,750 3,167 2,140 5,458 13,899 26,569
FINANCIAL EXPENSES 3,096 258 258 258 258 258
CASH FLOWPROJECTIONS
8
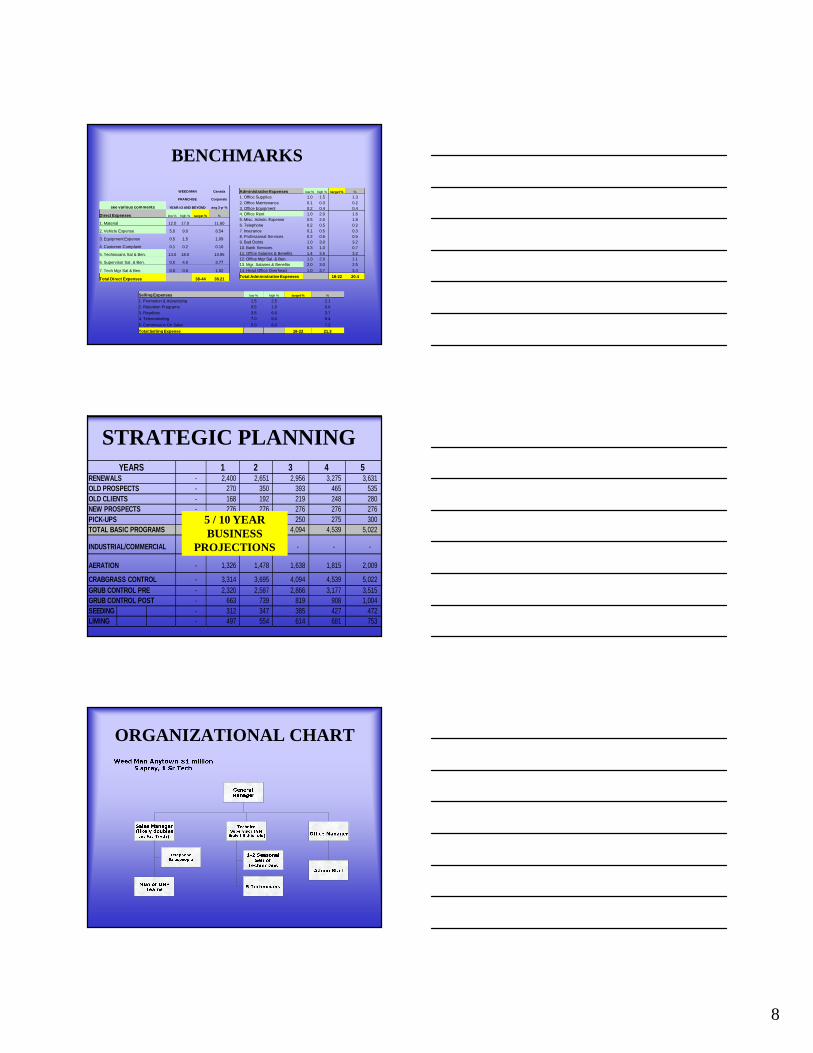
BENCHMARKS
WEED MAN Canada
FRANCHISE Corporate
see various comments YEAR #3 AND BEYOND avg 3 yr %
Direct Expenses low % high % target % %
1. Material 12.0 17.0 11.60
2. Vehicle Expense 5.0 9.0 8.54
3. Equipment Expense 0.5 1.5 1.09
4. Customer Complaint 0.1 0.2 0.10
5. Technicians Sal & Ben. 14.0 18.0 13.95
6. Supervisor Sal. & Ben. 0.0 4.0 3.77
7. Tech Mgr Sal & Ben. 0.0 0.0 1.92
Total Direct Expenses 38-44 38.21
AdministrativeExpenses low % high % target % %
1. Office Supplies 1.0 1.5 1.3
2. Office Maintenance 0.1 0.3 0.2
3. Office Equipment 0.2 0.4 0.4
4. Office Rent 1.0 2.0 1.6
5. Misc. Admin. Expense 0.5 2.0 1.8
6. Telephone 0.2 0.5 0.2
7. Insurance 0.1 0.5 0.3
8. Professional Services 0.2 0.6 0.5
9. Bad Debts 1.0 3.0 3.2
10. Bank Services 0.3 1.0 0.7
11. Office Salaries & Benefits 1.4 3.5 3.2
12. Office Mgr Sal. & Ben. 1.0 2.0 1.1
13. Mgr. Salaries & Benefits 2.0 3.0 2.5
14. Head Office Overhead 1.0 3.7 3.4
Total AdministrativeExpenses 18-22 20.4
Selling Expenses low % high % target % %
1. Promotion & Advertising 1.5 2.5 2.1
2. Retention Programs 0.5 1.0 0.0
3. Royalties 3.5 6.0 3.7
4. Telemarketing 7.0 9.0 8.4
5. Commission On Sales 5.0 8.0 7.2
Total Selling Expense 18-22 21.3
STRATEGIC PLANNINGYEARS 1 2 3 4 5
RENEWALS - 2,400 2,651 2,956 3,275 3,631
OLD PROSPECTS - 270 350 393 465 535
OLD CLIENTS - 168 192 219 248 280
NEW PROSPECTS - 276 276 276 276 276
PICK-UPS - 200 225 250 275 300
TOTAL BASIC PROGRAMS 3,000 3,314 3,695 4,094 4,539 5,022
INDUSTRIAL/COMMERCIAL - - - - - -
AERATION - 1,326 1,478 1,638 1,815 2,009
CRABGRASS CONTROL - 3,314 3,695 4,094 4,539 5,022
GRUB CONTROL PRE - 2,320 2,587 2,866 3,177 3,515
GRUB CONTROL POST - 663 739 819 908 1,004
SEEDING - 312 347 385 427 472
LIMING - 497 554 614 681 753
5 / 10 YEARBUSINESS
PROJECTIONS
ORGANIZATIONAL CHART
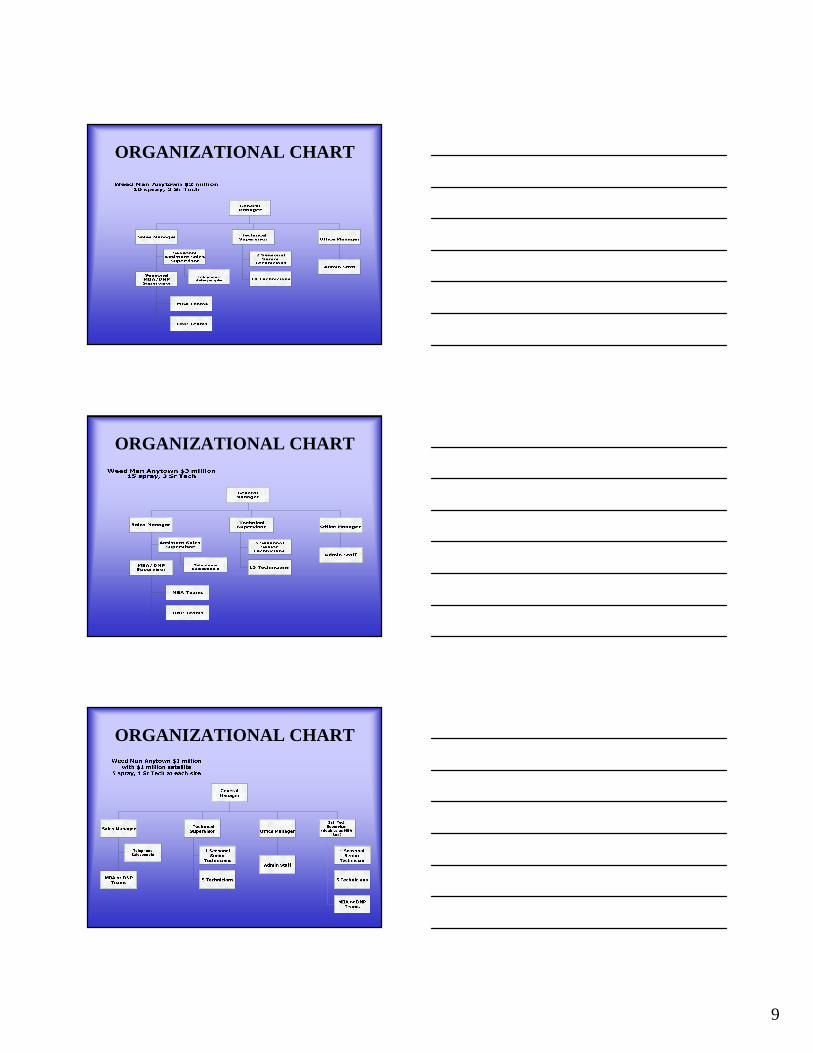
9
ORGANIZATIONAL CHART
ORGANIZATIONAL CHART
ORGANIZATIONAL CHART

10
BUSINESS PLANNING
WHO SHOULD BE INVOLVED?
HOW LONG SHOULD IT TAKE?
WHERE SHOULD IT BE DONE?
HOW DO YOU EXECUTE THEBUSINESS PLAN!
11
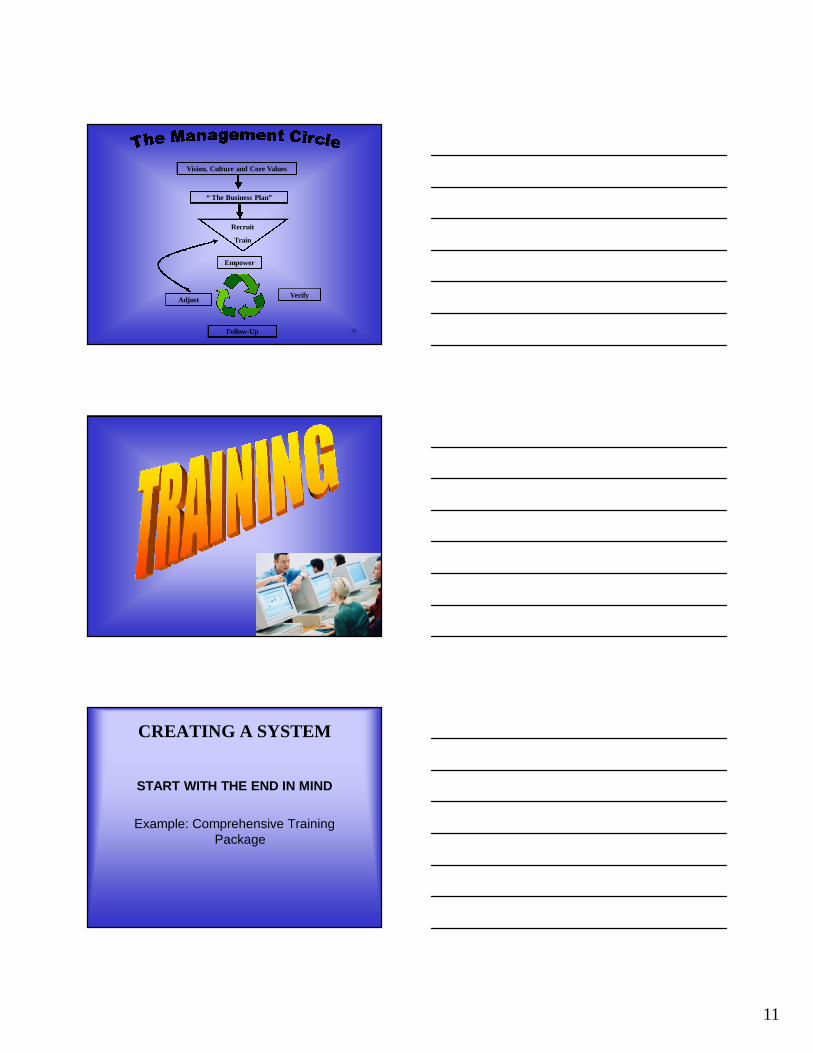
Vision, Culture and Core Values
“ The Business Plan”
Recruit
Train
Empower
Verify
Follow-Up
Adjust
31
CREATING A SYSTEM
START WITH THE END IN MIND
Example: Comprehensive TrainingPackage

12
CREATING A SYSTEM
Training Tools
Power Point Presentation
Manuals
Props (ie. Spreader)
Product Sample
Checklist for in field training
Videos
Outside Vendors
CREATING A SYSTEM
Training Content
Customer Service
Technical
Company Policies
Expectations/Benchmarks
Define Measurement Tools
Set Expectations for Follow Up
SALES POWER-POINT PRESENTATION
ATTI TUDES FOR SUCCESSTHE MAI N TYPES OF
CUSTOMERS
1)1) THE THINKERTHE THINKER
THE PRESENTATION
OBJECTI ONS
Why customersraiseobjections:
1. They donot like thesalesperson
2. They donot trust thesalesperson
3. They donot like theproduct
4. They do not want to be pressured into buyingand want to believe that they make all thebuying decisions and are in total control of thesituation
CLOSING THE SALE
THINGSTO REMEMBER WHENTHINGSTO REMEMBER WHENCLOSINGCLOSING
1) BE REALISITIC1) BE REALISITIC
2) CLOSE WITH CONFIDENCE2) CLOSE WITH CONFIDENCE
3) EMOTIONSWILL MAKE OR BREAK3) EMOTIONSWILL MAKE OR BREAKTHE SALETHE SALE
4) DON’T PAY ATTENTION TO THE4) DON’T PAY ATTENTION TO THEFIRST “NO”FIRST “NO”
5) COMPLETE PAPERWORK PROPERLY5) COMPLETE PAPERWORK PROPERLY
SALES MANAGERSEXPECTATIONS
ON TIMEON TIME
ATTENDANCEATTENDANCE
RESPECTRESPECTCUSTOM ERCUSTOM ER
IMPROVE INIMPROVE INSALESSALESTECHNI QUESANDTECHNI QUESANDKNOWLEDGEKNOWLEDGE
NOT DEGRADENOT DEGRADECOMPETITIONCOMPETITION
NO SCRIBBLINGNO SCRIBBLINGON TABLESON TABLES
PAY BASED ONPAY BASED ONSALARY SCALESALARY SCALE
RESPECT YOURESPECT YOU
CONTINUEDCONTINUEDCOACHING ANDCOACHING ANDSUPPORTSUPPORT
TRAINING SUPPORT SYSTEMS

13
CREATING A SYSTEM
START WITH THE END IN MIND
Example: Completed and BalancedFinancials by the 6th of every month
CREATING A SYSTEM
START WITH THE END IN MIND
Defined what you need
– Create chart of accounts that is inline withyour budget
– Chose accounting software that allowsbudget comparisons
– Create specific reporting capabilities
– Train employees on expectations
– Measure and follow up on expectations

14
ACCOUNTING
MEASURING
PROFIT & LOSSSTATEMENT WITHBUDGET OVERVIEW
FOLLOW UP
15
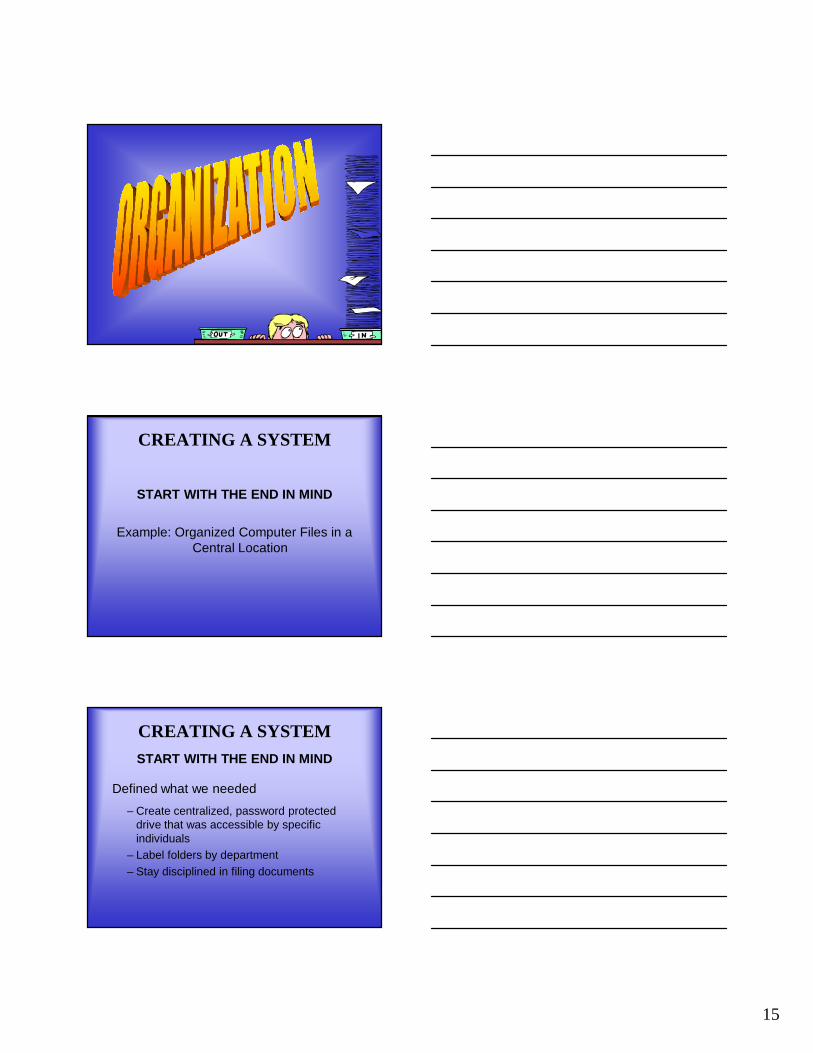
CREATING A SYSTEM
START WITH THE END IN MIND
Example: Organized Computer Files in aCentral Location
CREATING A SYSTEM
START WITH THE END IN MIND
Defined what we needed
– Create centralized, password protecteddrive that was accessible by specificindividuals
– Label folders by department
– Stay disciplined in filing documents

16
ADMINISTRATION
COMPUTER
My Documents
“Name of Company” Documents
Administration
Marketing
Technical
ADMINISTRATION
Drawer #1Accounts Payable
Drawer #2General Information
Drawer #3Employee Information
Hanging Folder - Administration
Manila Folder – Interviews
Manila Folder - Job Description
Manila Folder - Blank Evaluations
Hanging Folder - Marketing
Manila Folder - Salesperson Interviews
Manila Folder - Telemarketing Interviews
Manila Folder - Pay Rates
Hanging Folder - Technical
Manila Folder – Interviews
Manila Folder - Pay Rates
Hanging Folder – IRS
Manila Folder - General Information
Manila Folder - Blank W2
Manila Folder - Blank I9
Manila Folder - "Year" W3
Manila Folder - "Year" W4
Hanging Folder - Department of Labor
Manila Folder - General Information
Hanging Folder - Worker's Compensation
Manila Folder - General Information
Manila Folder – Rates
Manila Folder - Blank Forms
ADMINISTRATION
17
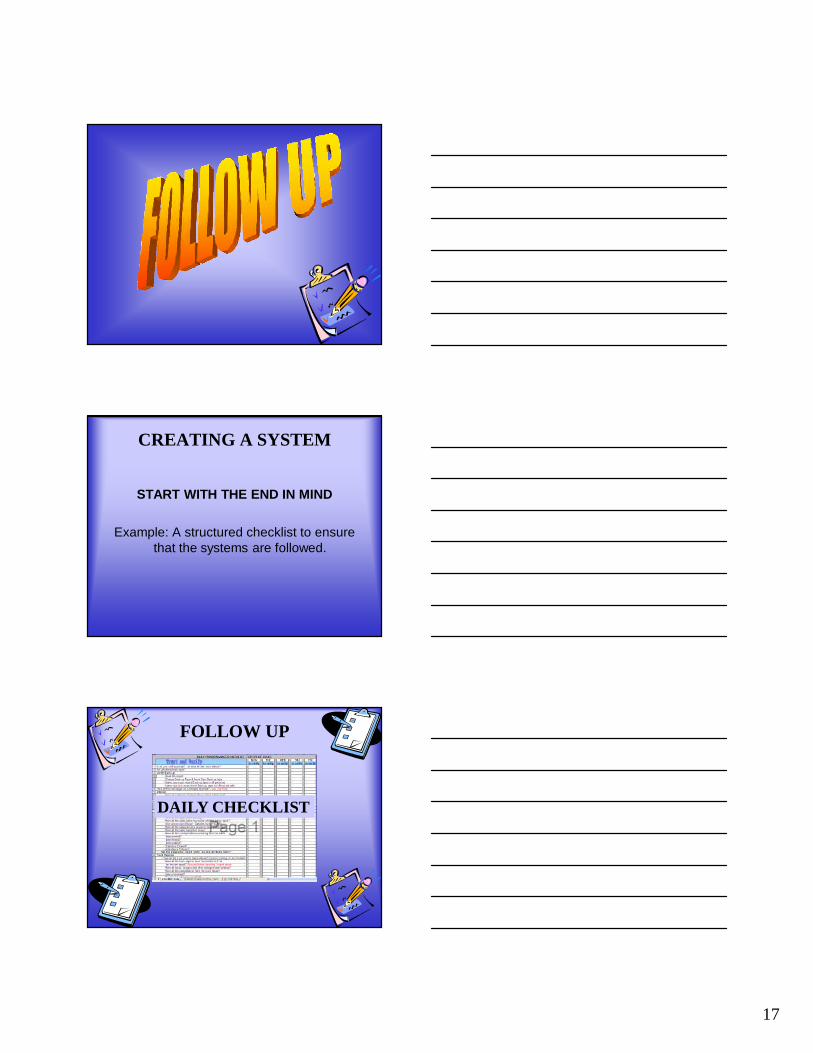
CREATING A SYSTEM
START WITH THE END IN MIND
Example: A structured checklist to ensurethat the systems are followed.
FOLLOW UP
DAILY CHECKLIST

18
FOLLOW UP
MONTHLY & YEARLYCHECKLIST
CREATING A SYSTEM
START WITH THE END IN MIND
Example: Measuring Customer Serviceand rewarding for achieving our goal.
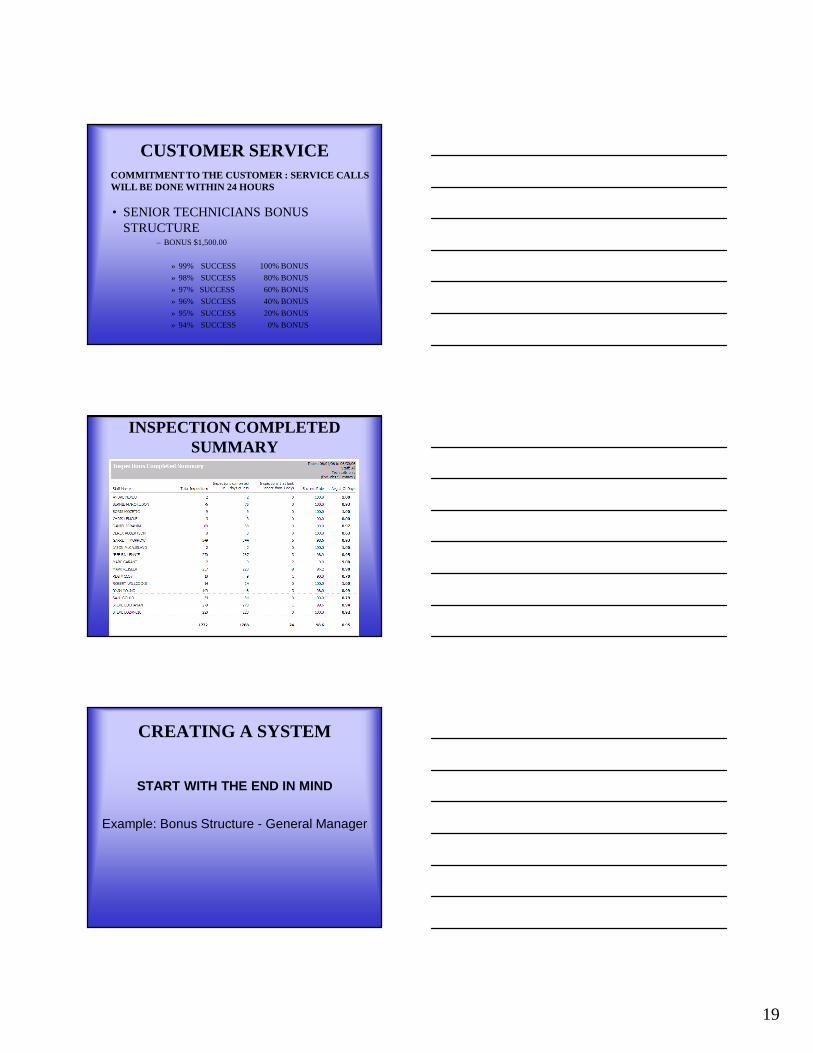
19
CUSTOMER SERVICE
• SENIOR TECHNICIANS BONUSSTRUCTURE
– BONUS $1,500.00
» 99% SUCCESS 100% BONUS
» 98% SUCCESS 80% BONUS
» 97% SUCCESS 60% BONUS
» 96% SUCCESS 40% BONUS
» 95% SUCCESS 20% BONUS
» 94% SUCCESS 0% BONUS
COMMITMENT TO THE CUSTOMER : SERVICE CALLSWILL BE DONE WITHIN 24 HOURS
INSPECTION COMPLETEDSUMMARY
CREATING A SYSTEM
START WITH THE END IN MIND
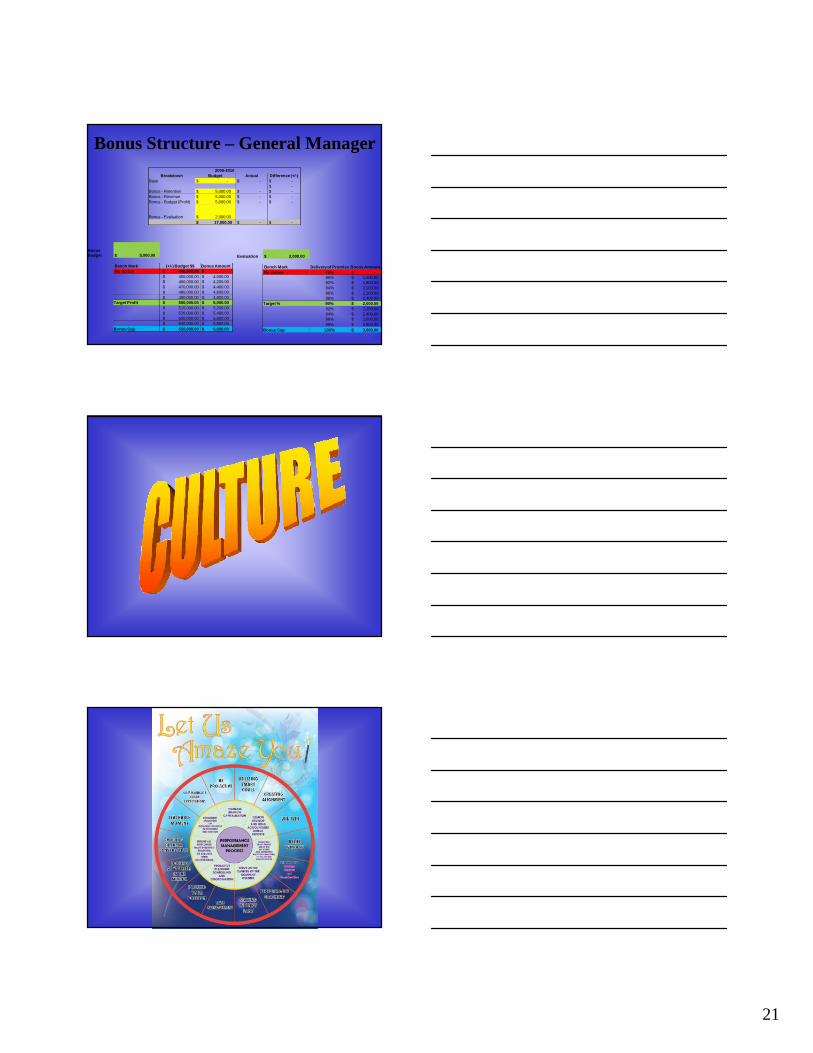
Example: Bonus Structure - General Manager

20
Bonus Structure – General Manager
• Currently many people rely on evaluations
Bonus Structure – General Manager
• Review Strategic Direction of Company
– Customer Service Oriented
– Growth
– Efficient Operations
– Cost Control
– Employee Personal Growth
Bonus Structure – General Manager2009-2010
Breakdown Budget Actual Difference (+/-)
Base $ - $ - $ -
$ -
Bonus - Retention $ 5,000.00 $ - $ -Bonus - Revenue $ 5,000.00 $ - $ -
Bonus - Budget (Profit) $ 5,000.00 $ - $ -
Bonus - Evaluation $ 2,000.00
$ 17,000.00 $ - $ -
BonusRetention $ 5,000.00
Bench Mark % Retention Bonus Amount
No Bonus 69% $ -70% $ 4,000.00
71% $ 4,200.00
72% $ 4,400.00
73% $ 4,600.0074% $ 4,800.00
Target % 75% $ 5,000.00
76% $ 5,200.0077% $ 5,400.00
78% $ 5,600.00
79% $ 5,800.00
Bonus Cap 80% $ 6,000.00
BonusRevenue $ 5,000.00
Bench Mark Budget $$ Bonus AmountNo Bonus $ 4,400,000.00 $ -
$ 4,500,000.00 $ 4,000.00
$ 4,600,000.00 $ 4,200.00
$ 4,700,000.00 $ 4,400.00$ 4,800,000.00 $ 4,600.00
$ 4,900,000.00 $ 4,800.00
Target Revenue $ 5,000,000.00 $ 5,000.00
$ 5,100,000.00 $ 5,200.00$ 5,200,000.00 $ 5,400.00
$ 5,300,000.00 $ 5,600.00
$ 5,400,000.00 $ 5,800.00
Bonus Cap $ 5,500,000.00 $ 6,000.00
Click HereFor
Spreadsheet
21
Bonus Structure – General Manager
2009-2010
Breakdown Budget Actual Difference (+/-)
Base $ - $ - $ -
$ -Bonus - Retention $ 5,000.00 $ - $ -
Bonus - Revenue $ 5,000.00 $ - $ -
Bonus - Budget (Profit) $ 5,000.00 $ - $ -
Bonus - Evaluation $ 2,000.00
$ 17,000.00 $ - $ -
BonusBudget $ 5,000.00
Bench Mark (+/-) Budget $$ Bonus Amount
No Bonus $ 440,000.00 $ -
$ 450,000.00 $ 4,000.00$ 460,000.00 $ 4,200.00
$ 470,000.00 $ 4,400.00
$ 480,000.00 $ 4,600.00
$ 490,000.00 $ 4,800.00Target Profit $ 500,000.00 $ 5,000.00
$ 510,000.00 $ 5,200.00
$ 520,000.00 $ 5,400.00
$ 530,000.00 $ 5,600.00$ 540,000.00 $ 5,800.00
Bonus Cap $ 550,000.00 $ 6,000.00
Evaluation $ 2,000.00
Bench Mark Deliveryof Promise Bonus Amount
No Bonus 79% $ -
80% $ 1,600.0082% $ 1,800.00
84% $ 2,000.00
86% $ 2,200.0088% $ 2,400.00
Target % 90% $ 2,000.00
92% $ 2,200.00
94% $ 2,400.0096% $ 2,600.00
98% $ 2,800.00
Bonus Cap 100% $ 3,000.00