business travel report: methodology august 2020
TRANSCRIPT

Climate Conscious Travel Business Travel Report: Methodology
August 2020

Page 2 of 8
Description of the paper This paper describes the methodology for the University’s Business Travel Report (BTR), developed by the
Department of Social Responsibility and Sustainability to report on business travel emissions at the University
of Edinburgh.
Background Climate change is one of most significant global challenges of the century. In the last few years alone,
devastating events such as global famine, mass Arctic ice melt, coral reef bleaching, the Australian wildfires
and UK flooding have been linked to anthropological climate change. When considering climate change, flying
is one of the most carbon-intensive single actions an individual can take. Globally, aviation emitted a total of
915 million tonnes of CO2 in 2019, accounting for an estimated 2% of global carbon emissions (Air Transport
Action Group, 2019).
The University of Edinburgh’s Zero by 2040 Climate Strategy (released in 2016) sets out the objective of
achieving net zero carbon emissions by 2040. This whole-institution approach focuses on removing emissions
from Scope 1, 2, and 3 sources. Progress has been made in reducing emissions from Scope 1 and 2 through a
range of actions including in the development and redevelopment of University buildings; investing in electric
vehicles for our fleet; and initiating energy reduction behaviour change campaigns. Emissions from Business
Travel are included within the boundary of Scope 3 emissions.
At present, Business Travel accounts for roughly 15% of the University’s current carbon emissions. As other
emissions sources are reduced, it is estimated that the proportion of emissions from Business Travel will
increase to 20-25% of the University’s total emissions by 2025. Substantial progress has been made on our
land-based travel but emissions from aviation continue to rise.
The Department of Social Responsibility and Sustainability (SRS) have been working to address University
Business Travel since the launch of Zero by 2040 Climate Strategy. The first stage in this project was to better
understand out business travel patterns. As such, our travel data was more deeply analysed. Initially this was
undertaken by manual processing journeys using Excel datasheets. When considering the University processed
roughly 85,000 journeys in the 2015-16 academic year, this took a considerable amount of time to complete.
In addition, due to the nature of the data, the majority of time was focused on correcting input errors such as
spelling mistake, in order to better process the data.
As such, SRS developed a bespoke business travel reporting (BTR) tool. This tool is described in more detail
below. The main aim of this tool was to automate the manual process of data input and error correction. In
doing so, this process allowed more time for analysis of the data to be completed, improved data accuracy for
reporting University carbon emissions, whilst also providing greater detail of carbon emission from travel to
Schools and Departments across the University.
Scope Business travel at the University is defined as any travel paid for by the University, in line with the Greenhouse
Gas Protocol (GhG). Items included in scope are noted in Table 1.
Page 3 of 8
Included in Scope 3 business travel carbon emissions
Excluded from scope 3 business travel carbon emissions
All travel paid for by the University, including for:
Conferences or other events
Field trips & research
Meetings
Visitors to the University e.g. to conduct lectures or for PhD defences.
Staff and student commuting
Any travel paid for by external organisations (excluding research funding via grants)
Any additional factors associated with travel e.g. hotels, sustenance
Table 1. Overview of inclusion criteria for Scope 3 carbon emissions at the University
Methodology This section outlines the methodology of the BTR tool developed by SRS. In line with Greenhouse Gas Protocol,
the aim of the tool is to calculate the journey distance. Once a journey distance is calculated, this can be
multiplied by the standard emission factors provided by the Department for Environment, Food and Rural
Affairs (DEFRA). DEFRA conversion factors are updated annually. The BTR takes this into account by allowing
users to update these as the factors are published. Annual DEFRA conversion dataset can be found via the
DEFRA website.
Where distance isn’t available, the BTR tool reverts to using spend data. It is acknowledged that this is a less
accurate measure for carbon emissions than distance, and so is used as a last resort within the tool. Further
details of the data processing is provided below.
This paper does not provide full technical details of the BTR tool. These can be requested directly from the
Department of Social Responsibility and Sustainability (contact details are provided at the end of the report).
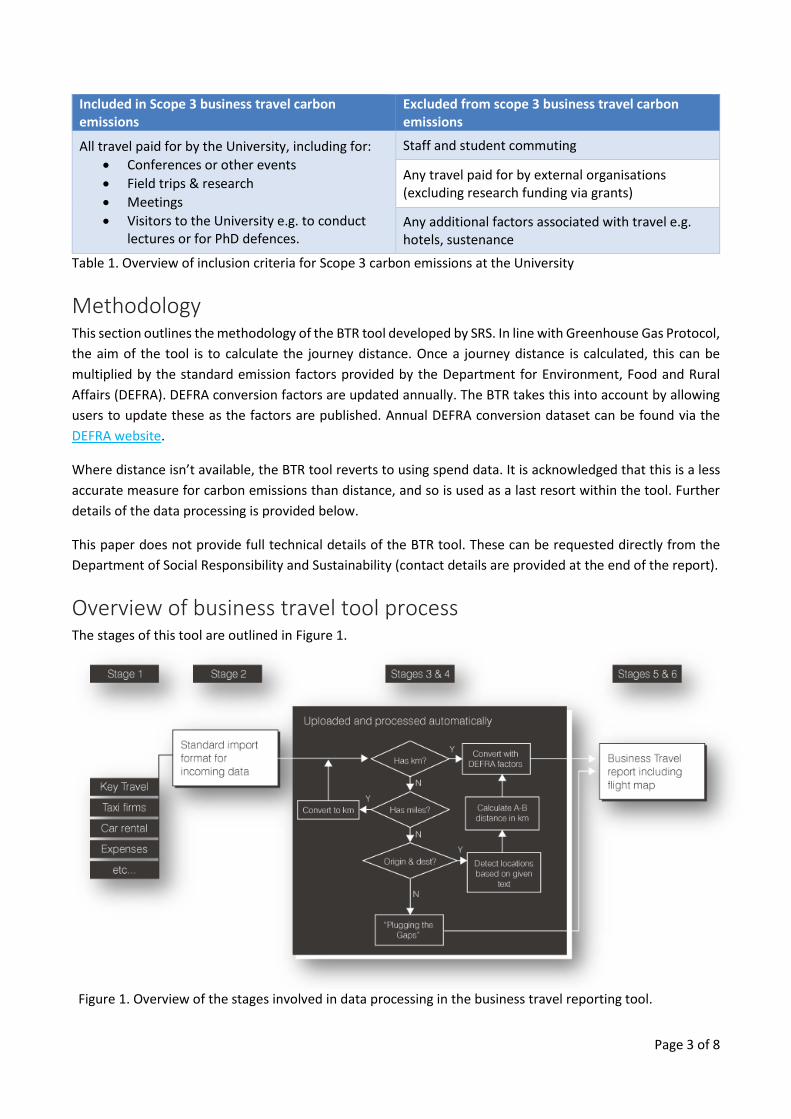
Overview of business travel tool process The stages of this tool are outlined in Figure 1.
Figure 1. Overview of the stages involved in data processing in the business travel reporting tool.

Page 4 of 8
Stage 1: Data collection Data is collected directly from travel suppliers (e.g. Key Travel, Hunters Coaches, Central Taxis) and the
University digital expenses system. Each supplier is contacted directly to provide their data. Due to the range
of travel suppliers procured by the University, the data is particularly varied. For example, some suppliers
provide accurate distances for each journey, while others provide origin and destination locations. The
minimum data requirement provided is mode of transport and journey cost.
Stage 2: Data standardisation Once data is received, project staff set the data into a standardised excel sheet for importing. During this stage
data is examined to minimise errors that may occur if the data is not formatted correctly.
Stage 3: Data import Once the data has been cleaned and standardised, it is imported directly into the system using an online
platform. The import speed is limited to processing 5000 journeys per minute. Once imported, project staff
are able to check on the process of the import using a dedicated portal.
Stage 4: Data processing This is the first fully automated stage in the business travel report. As noted above, the tool aims to calculate
carbon emissions using distance. In order to achieve this it completes the following steps:
1. If a journey has distance in Kilometres (KM), the distance is multiplied by the relevant DEFRA
conversion factor, and no further processing takes place
2. If a journey includes distance in miles, the processor calculates the equivalent distance in KM, and
step 1 is undertaken.
3. Where no distance is provided (in KM or miles), the tool looks to establish the origin and destination.
Where origin and destination are provided, the tool then:
o For road or rail journeys: Initiates a Google Maps search (based on mode of transport for these
journeys) between these two points, to establish distance
o For air journeys: Uses the Haversine distance formula to establish distance between the longitude &
latitude of the origin and destination1
Should origin or location be provided, but no known location found, the tool then proceeds to “spell
check” the text given, checking a number of options before selecting the most likely for travellers at the
University of Edinburgh. For example, common spell checks occurred on the location Edinburgh, with
variations including EDI, Edin, Edinburg etc. In addition, the tool is designed to designate central Edinburgh
as the location when text such as “home” is used (e.g. “taxi from home to Easter Bush campus”).
4. Where distance cannot be calculated using the above method, the final stage undertaken by the
journey processor is called “plugging the gaps”. This stage follows the cost based approach provided
by the Greenhouse Gas Protocol, in which average costs for the mode of transport are used to
establish a distance. For the average costs, the tool uses the average for that mode of transport for
the year in question.
1 Kettle, S. (2017). Distance on a sphere: The Haversine Formula [Online]. Available at: https://community.esri.com/groups/coordinate-reference-systems/blog/2017/10/05/haversine-formula Accessed on: 06 August, 2020

Page 5 of 8
Example of plugging the gaps methodology
Should there be a taxi journey for £20 in 2018-19, with no other information provided, the BTR system will use the average cost per KM for taxi journeys for the 2018-19 year (e.g. 0.5km travelled per £1) , and multiply the cost per KM with the spend for that journey. In this instance the system would calculate the £20 taxi journey to have travelled 10km (£20x 0.5km).
Within this stage the following journey criteria are accounted for:
Class of travel. With carbon factors for different classes – economy, premium economy, business class,
or first class - being used appropriately
Flight type. With relevant carbon factors for flight type - domestic, short haul, long haul, or
international flights – are used appropriately
Radiative forcing. Applicable for air journeys only. Radiative Forcing is the additional warming effect
due to the release of emissions high in the atmosphere2
Number of passengers. Should more than one traveller be linked to the journey in question
One-way or return journey. This is dependent on the supplier and mode of transport. For example,
all journeys from our main travel management company are assumed to be single, while all air and
rail journeys gathered via the University’s internal expenses system are assumed to be return (unless
stated otherwise)
Flight Type Description
Domestic Flights where the origin and destination are within the UK
Short Haul Flights where origin is within the UK and destination is outside the UK, and the journey distance is less than 3700km (one way)
Long Haul Flights where origin is within the UK and destination is outside the UK, and the journey distance is equal to, or more than, 3700km (one way)
International Flights where neither the origin or the destination are within the UK
Table 2. Description of flight types as per the Department for Environment, Food & Rural Affairs
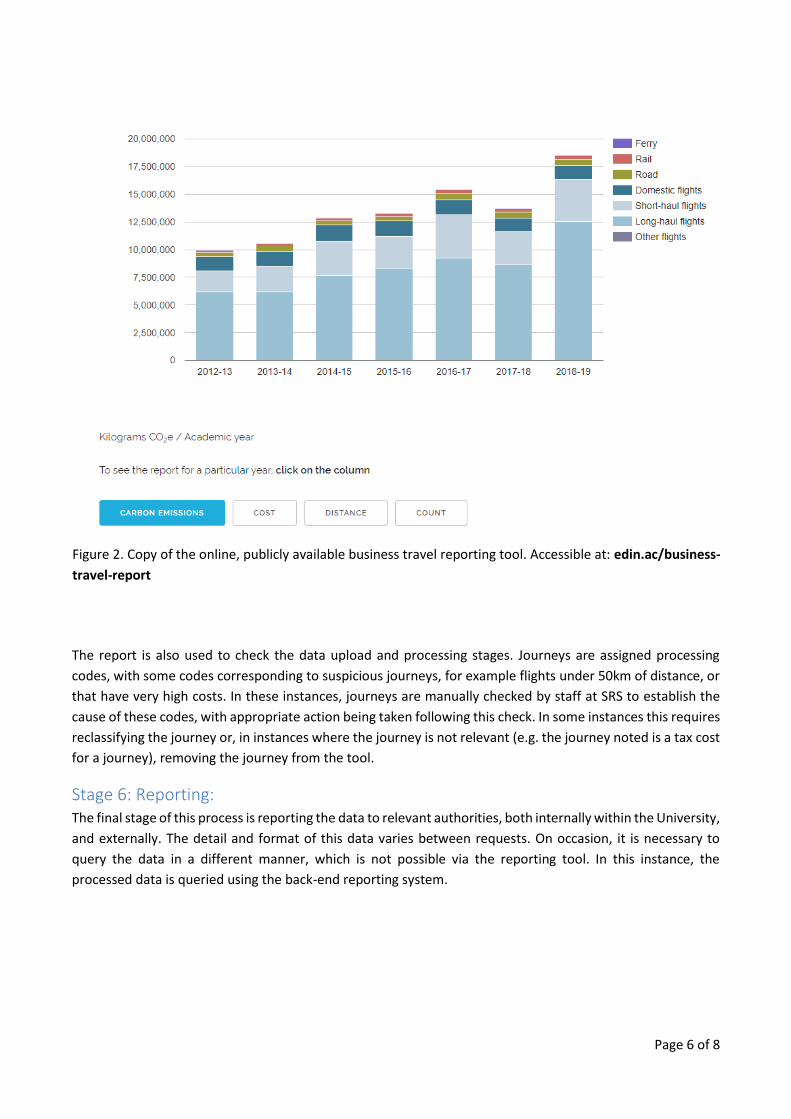
Stage 5: Analysis and checking Once journeys have been processed by the reporting tool, they are displayed on an interactive website
(available at: edin.ac/business-travel-report) (Figure 2). This report is publicly available, with data being
provided to school / department level. The decision not to publish more granular data was taken in order to
avoid unfair treatment of individuals based on their travel behaviours. The online report provides a range of
data including carbon emissions, cost, number of journeys, and distance travelled. In addition, there is
additional granularity by including a flight “heat map”, which improves understanding of travel undertaken at
the University.
2 Henderson, S.C., Wickrama, U.K., (1999). Aircraft emissions: current inventories and future scenarios. In: Penner, J.E., Lister, D.H., Griggs, D.J., Dokken, D.J., McFarland, M. (Eds.), Aviation and the Global Atmosphere. A Special Report of IPCC Working Groups I and III. Cambridge University Press, Cambridge, pp. 291-331.
Page 6 of 8
The report is also used to check the data upload and processing stages. Journeys are assigned processing
codes, with some codes corresponding to suspicious journeys, for example flights under 50km of distance, or
that have very high costs. In these instances, journeys are manually checked by staff at SRS to establish the
cause of these codes, with appropriate action being taken following this check. In some instances this requires
reclassifying the journey or, in instances where the journey is not relevant (e.g. the journey noted is a tax cost
for a journey), removing the journey from the tool.
Stage 6: Reporting: The final stage of this process is reporting the data to relevant authorities, both internally within the University,
and externally. The detail and format of this data varies between requests. On occasion, it is necessary to
query the data in a different manner, which is not possible via the reporting tool. In this instance, the
processed data is queried using the back-end reporting system.
Figure 2. Copy of the online, publicly available business travel reporting tool. Accessible at: edin.ac/business-
travel-report

Page 7 of 8
Challenges / issues Although the development of the business travel reporting tool has been positive in terms of reducing staff
time to process the data, as well as increasing overall accuracy, there have been a number of challenges too.
These are outlined in this section
Quality of data provided The data provided by providers continues to vary. Within this, it is unclear whether the data provided is
accurate, and in some instances the spend data does not match up with reports generated by the University
Finance department. In part this is attributed to variations in coding across different University departments
and suppliers. This may become more apparent as a wider range of data is collected within scope of this
reporting tool, which could lead to a broader quality of data still. However, further work is required to better
understand these differences.
In addition, the time required for cleaning the data prior to upload, as well as the time for analysing and
reporting the data post-processing is still significant. This has been reduced from an estimated 8-weeks work
to 2-weeks work. Such resource costs remain a factor for consideration when building or using such a tool.
Additional Costs As the reporting tool queries the Google Maps API, there are costs associated with processing the data which
were not there previously. As these costs are set externally (by google in this instance), it is not possible to
estimate these costs for future years. It may be that, should these costs become too high, that the system is
redesigned to omit this step. Caution must be taken with this as there is potential for this to reduce the
accuracy of the tool overall.
Coding Errors The tool was developed within a relatively short period of time and as such, the programme coding is not
perfect. This became apparent in the 2018-19 dataset where the distance for a significant number of journeys
had been multiplied incorrectly. Once established, this error was rectified and the data rerun. However, it
should be noted that other errors may become apparent in the processor in future data imports.
Improvements The main improvements put forward for future development include:
Accessibility of the system for other institutions Following discussions with a number of other institutions, it has become apparent that the BTR tool is unique
within the higher education sector. As such, it would be beneficial to both the University of Edinburgh, and
the wider sector, to adapt the tool for use at other institutions. Unfortunately this is a significant undertaking,
and would require additional resource to implement successfully.
Individual level data / reporting Since the release of the BTR, engagement with the data has been broadly positive. Allowing schools and
departments to dig into their own data has opened up discussions across the University. In order to take these
Page 8 of 8
discussions further, it has been suggested that the report be adapted for individuals to access their own travel
data. This would increase understanding of travel by the individuals themselves, and would support positive
behaviour change on this challenging topic. The privacy and safety of individuals would need to be carefully
controlled should such a level of granularity become available, as there is potential for such granularity to be
used negatively against travellers without full information.
Increased data checking As noted above, errors have come to light within the reporting process coding. As such, the processing module
should be thoroughly checked with increased safeguards in place to avoid future errors.
Further Details This report has been compiled by the University of Edinburgh’s Department of Social Responsibility and
Sustainability (SRS). For further details, or to request alternative formats, please contact the Department on
the details below.
Further details of the Climate Conscious Travel project can be found at edin.ac/business-travel
Department of Social Responsibility and Sustainability
The Boilerhouse
High School Yards
Edinburgh
EH1 1LT
www.ed.ac.uk/sustainability
+44 (0) 131 651 3000