bvca private equity and venture capital report on ... ria 2015.pdf · bvca private equity and...
TRANSCRIPT

BVCA Private Equity and Venture Capital Report on Investment Activity 2015Autumn 2016
ConsumerServices
1,191
Financials
981Industrials
852
Technology
726
ConsumerGoods
617
HealthCare
268
AmountInvested
(£m)

Contents
Summary 3
Data Tables 4
Appendix Methodology and Definitions 14

BVCA Private Equity and Venture Capital Report on Investment Activity 2015 3
Summary
Summary
Against a backdrop of global economic and political uncertainty, 2015 marked another strong year for the UK’s private equity and venture capital industry. Building on the steady levels of investment activity witnessed in 2014, the industry continued to grow, with global investment by BVCA members increasing to almost £17bn from £13.4bn the previous year. Meanwhile, the fundraising climate continued to demonstrate investors’ confidence in the asset class, with the total amount of funds raised growing to just under £12bn from £10.8bn in 2014.
After a significant period of decline in the years following the 2008 financial crisis, investment levels have been growing steadily, increasing by nearly £7bn since 2013 across all geographies surveyed. In 2015, domestic investment grew to just under £6bn from £4.7bn the previous year. Global investment also saw significant growth, with US investment increasing from £1.6bn to over £2.4bn in 2015, European investment growing from £6.4bn to £7.6bn and investment into the rest of the world increasing from £606m to £937m.
A noteworthy trend has been the strength of fundraising, increasing to nearly £12bn in 2015. While pension funds continue to represent the most significant source of funding – raising £1.9bn and representing 16% of total funding – funds raised from corporate investors and banks in 2015 both increased sevenfold. Geographically, all European regions surveyed saw substantial increases in the amount of funds raised, with Asia and the Middle East also experiencing significant surges. This demonstrates not only the ability of private equity to drive inward investment, but also the UK’s capacity to remain an attractive investment destination in the face of macroeconomic uncertainty.
The trend towards increased VC fundraising continued, growing from £288m in 2014 to £515m this year. Both Small and Large MBOs saw substantial drops in fundraising levels from £1.1bn and £4.2bn to £567m and £2.8bn, respectively, while Middle MBOs continued to dominate, growing to £8bn from £5.2bn the previous year.
The market for exits was marginally down on 2014’s record £21.6bn divested, dropping to just over £17bn. The top exit methods continued to be trade sales and sale of quoted equity post-flotation, growing from £4.4bn last year to £5.1bn and from £4.2bn to £4.7bn, respectively. Recent volatility in global equity markets has made IPOs a less desirable option, as was evidenced in this year’s report, with the amount divested dropping from another record £2.7bn in 2014 to £1.2bn.
While London and the South East continue to dominate the investment landscape with £3.3bn invested, the report illustrates a greater regional balance in investment across the UK, driven largely by increases in Yorkshire & The Humber where investment nearly doubled to £770m. The East of England and East Midlands also experienced significant growth, increasing from £48m to £366m and £249m to £359m, respectively.
In terms of investment by industry sector, 2015 saw an increase in investment in consumer services, growing from £906m to £1.2bn, and in industrials, growing from £535m to £852m. While investment in software and computer services grew from £470m to £693m, there was a marginal drop in high-tech investment, decreasing from £1.2bn in 2014 to £930m this year.
While 2015 marked a strong year for the industry overall, 2016 will not be without its challenges. Brexit has cast a cloud across the entire industry as both the UK and EU examine the different scenarios for trade agreements, access to EU funding, regulation of financial services and the free movement of labour. Despite the uncertainties that lie ahead, private equity and venture capital is a long-term asset class, and as demonstrated by the low levels of default over the financial crisis, has proven its ability to successfully weather periods of economic instability.
Nastasja Vojvodic, Research Manager

Data Tables1
Table 1. Global Investment Activity of BVCA Members
2015 2014 2013 2012 2011 2010 2009 2008 2007 2006 2005 2004 2003
Number of eligible BVCA members 137 137 159 166 183 194 193 208 214 192 179 168 164
% of survey respondents 93 96 96 96 97 97 100 99 100 100 100 100 100
Total amount invested (£m) 16,919 13,363 10,127 12,288 18,610 20,447 12,629 20,025 31,634 21,853 11,676 9,679 6,357
Number of companies financed 965 891 857 1,009 1,048 1,073 976 1,672 1,680 1,630 1,535 1,566 1,493
Table 2a. Investment by Country
Country Number of companies % of companies Amount invested (£m) % of amount invested
2015 2014 2013 2015 2014 2013 2015 2014 2013 2015 2014 2013
UK 795 728 710 82 82 83 5,990 4,720 4,109 35 35 41
US 57 43 35 6 5 4 2,408 1,634 1,673 14 12 17
Europe 99 104 103 10 12 12 7,584 6,404 4,053 45 48 40
Rest of World 14 16 9 1 2 1 937 606 291 6 5 3
Total 965 891 857 100 100 100 16,919 13,363 10,127 100 100 100
Table 2b. 2015 Quarterly Investment by Country
Country Number of companies % of companies Amount invested (£m) % of amount invested
Q1 Q2 Q3 Q4 Total Q1 Q2 Q3 Q4 Total Q1 Q2 Q3 Q4 Total Q1 Q2 Q3 Q4 Total
UK 237 200 168 190 795 30 25 21 24 100 2,104 1,129 1,021 1,735 5,990 35 19 17 29 100
US 17 13 12 15 57 30 23 21 26 100 673 386 397 952 2,408 28 16 16 40 100
Europe 25 25 29 20 99 25 25 29 20 100 1,516 1,107 2,895 2,066 7,584 20 15 38 27 100
Rest of World 3 6 2 3 14 21 43 14 21 100 68 497 285 88 937 7 53 30 9 100
Total 282 244 211 228 965 29 25 22 24 100 4,361 3,119 4,598 4,841 16,919 26 18 27 29 100
1. All figures in this report have been rounded to the nearest integer. For this reason individual figures may not sum to totals.
4 BVCA Private Equity and Venture Capital Report on Investment Activity 2015
Data tables

Table 3. Overseas Investment by Financing Stage
Financing Stage Number of companies % of companies Amount invested (£m) % of amount invested
2015 2014 2013 2015 2014 2013 2015 2014 2013 2015 2014 2013
Seed 0 87
0 55
0 111
0 --
Start-up22
313
259
31
-
Early Stage 22 29 13 20 32 23 - -
Later stage VC 22 16 23 13 10 16 45 50 110 - 1 2
Total Venture Capital 44 49 58 26 29 39 104 85 144 1 1 2
Expansion/Growth Capital 34 2729
20 1620
989 386374
9 46
Bridge Financing 2 5 1 3 2 3 - -
Total Expansion 36 32 29 21 19 20 990 389 374 9 5 6
Replacement Capital 0 3
11
0 2
7
0 22
1,022
0 -
17Secondary Buyout21
1012
62,078
1,39819
16
PIPE 0 0 0 0
Refinancing Bank Debt 2 0 0 1 0 0 81 0 0 1 0 0
Total Replacement Capital 23 13 11 13 8 7 2,159 1,420 1,022 20 16 17
Management buyout (MBO)54
50 3231
30 226,491
4,839 3,71859
56 62
Management buy-in (MBI) 3 0 2 0 310 0 4 0
Total MBO/MBI 54 52 32 31 31 22 6,491 5,149 3,718 59 60 62
Public to Private2
32 1
21 436
878448 4
107
Rescue/Turnaround 2 1 3 -
Other 13 17 16 8 10 11 749 718 312 7 8 5
Total Other Late Stage 15 22 18 9 13 12 1,185 1,600 760 11 19 13
Total 170 163 147 100 100 100 10,929 8,643 6,018 100 100 100
1. The number of companies in some financing stage categories and their subtotals add up to more than the total number of companies invested in. This is due to some companies receiving more than one investment within the year at different financing stages. Please refer to the appendix for further information.
2. – indicates a value greater than 0 but less than 0.53. Some financing stages have been amalgamated where there are instances of single deals, in order to preserve confidentiality.
Table 4. UK Investment by Financing Stage
Financing Stage Number of companies % of companies Amount invested (£m) % of amount invested
2015 2014 2013 2015 2014 2013 2015 2014 2013 2015 2014 2013
Seed 19 24 23 2 3 3 16 6 5 - - -
Start-up 76 63 79 9 8 11 83 22 56 1 - 1
Early Stage 179 171 213 22 23 28 126 80 81 2 2 2
Later stage VC 59 62 60 7 8 8 119 185 156 2 4 4
Total Venture Capital 322 315 356 40 42 48 344 293 298 6 6 7
Expansion/Growth Capital 312 228 219 38 31 29 993 850 683 17 18 17
Bridge Financing 5 7 7 1 1 1 2 15 2 - - -
Total Expansion 315 234 222 39 31 30 995 865 685 17 18 17
Replacement Capital 11 21 24 1 3 3 32 105 119 1 2 3
Secondary Buyout26
14 213
2 31,775
192 92730
4 23
PIPE 0 0 0 0 0 0 0 0
Refinancing Bank Debt 0 5 5 0 1 1 0 8 18 0 - -
Total Replacement Capital 37 40 50 5 5 7 1,807 305 1,064 30 6 26
Management buyout (MBO) 66 97 75 8 13 10 2,033 2,863 1,679 34 61 41
Management buy-in (MBI) 3 9 7 - 1 1 35 117 161 1 2 4
Total MBO/MBI 69 106 82 8 14 11 2,068 2,980 1,840 35 63 45
Public to Private 214
0 -2
0 201164
0 33
0
Rescue/Turnaround 33 13 4 2 374 95 6 2
Other 35 39 25 4 5 3 201 112 128 3 2 3
Total Other Late Stage 70 52 38 9 7 5 777 276 223 13 6 5
Total 795 728 710 100 100 100 5,990 4,720 4,109 100 100 100
1. The number of companies in some financing stage categories and their subtotals add up to more than the total number of companies invested in. This is due to some companies receiving more than one investment within the year at different financing stages. Please refer to the appendix for further information.
2. – indicates a value greater than 0 but less than 0.53. Some financing stages have been amalgamated where there are instances of single deals, in order to preserve confidentiality.
BVCA Private Equity and Venture Capital Report on Investment Activity 2015 5
Data tables
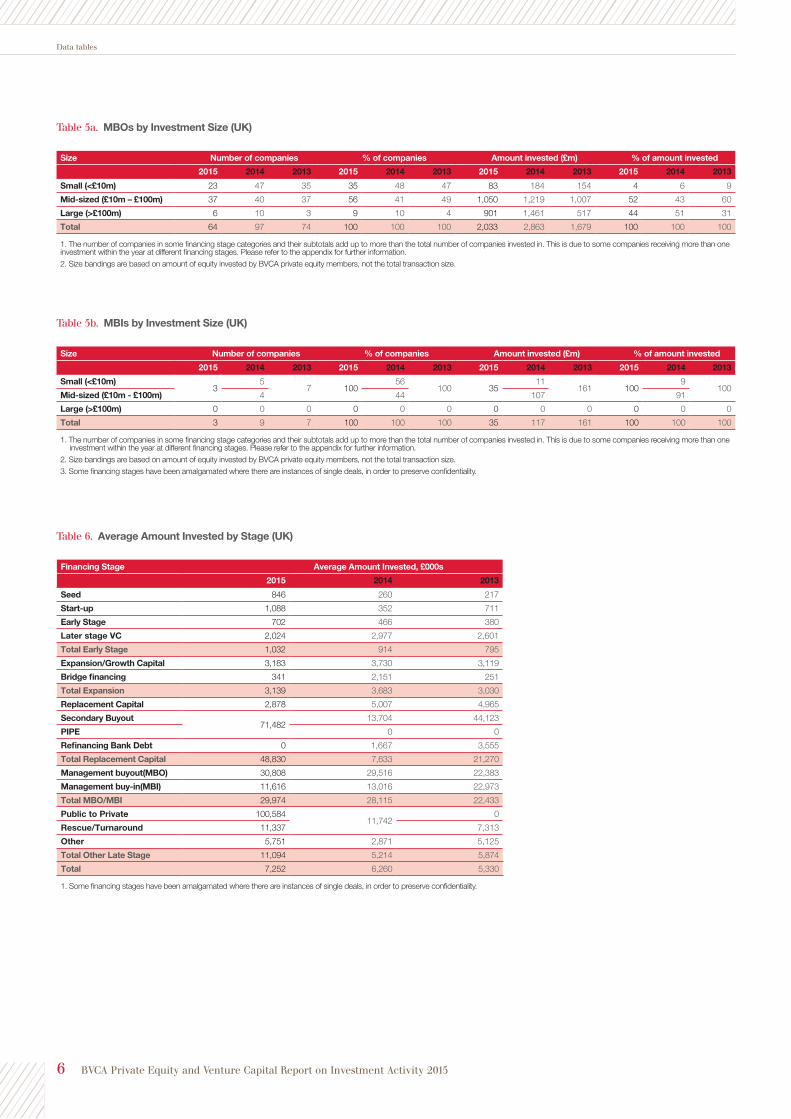
Table 5a. MBOs by Investment Size (UK)
Size Number of companies % of companies Amount invested (£m) % of amount invested
2015 2014 2013 2015 2014 2013 2015 2014 2013 2015 2014 2013
Small (<£10m) 23 47 35 35 48 47 83 184 154 4 6 9
Mid-sized (£10m – £100m) 37 40 37 56 41 49 1,050 1,219 1,007 52 43 60
Large (>£100m) 6 10 3 9 10 4 901 1,461 517 44 51 31
Total 64 97 74 100 100 100 2,033 2,863 1,679 100 100 100
1. The number of companies in some financing stage categories and their subtotals add up to more than the total number of companies invested in. This is due to some companies receiving more than one investment within the year at different financing stages. Please refer to the appendix for further information.2. Size bandings are based on amount of equity invested by BVCA private equity members, not the total transaction size.
Table 5b. MBIs by Investment Size (UK)
Size Number of companies % of companies Amount invested (£m) % of amount invested
2015 2014 2013 2015 2014 2013 2015 2014 2013 2015 2014 2013
Small (<£10m)3
57 100
56100 35
11161 100
9100
Mid-sized (£10m - £100m) 4 44 107 91
Large (>£100m) 0 0 0 0 0 0 0 0 0 0 0 0
Total 3 9 7 100 100 100 35 117 161 100 100 100
1. The number of companies in some financing stage categories and their subtotals add up to more than the total number of companies invested in. This is due to some companies receiving more than one investment within the year at different financing stages. Please refer to the appendix for further information.
2. Size bandings are based on amount of equity invested by BVCA private equity members, not the total transaction size.3. Some financing stages have been amalgamated where there are instances of single deals, in order to preserve confidentiality.
Table 6. Average Amount Invested by Stage (UK)
Financing Stage Average Amount Invested, £000s
2015 2014 2013
Seed 846 260 217
Start-up 1,088 352 711
Early Stage 702 466 380
Later stage VC 2,024 2,977 2,601
Total Early Stage 1,032 914 795
Expansion/Growth Capital 3,183 3,730 3,119
Bridge financing 341 2,151 251
Total Expansion 3,139 3,683 3,030
Replacement Capital 2,878 5,007 4,965
Secondary Buyout71,482
13,704 44,123
PIPE 0 0
Refinancing Bank Debt 0 1,667 3,555
Total Replacement Capital 48,830 7,633 21,270
Management buyout(MBO) 30,808 29,516 22,383
Management buy-in(MBI) 11,616 13,016 22,973
Total MBO/MBI 29,974 28,115 22,433
Public to Private 100,58411,742
0
Rescue/Turnaround 11,337 7,313
Other 5,751 2,871 5,125
Total Other Late Stage 11,094 5,214 5,874
Total 7,252 6,260 5,330
1. Some financing stages have been amalgamated where there are instances of single deals, in order to preserve confidentiality.
6 BVCA Private Equity and Venture Capital Report on Investment Activity 2015
Data tables

Table 7. Investment by Industry Sector (UK)
Industry Sector Number of companies % of companies Amount invested % of amount invested
2015 2014 2013 2015 2014 2013 2015 2014 2013 2015 2014 2013
Basic Materials - Chemicals 8 7 8 1 1 1 16 5 11 - - -
Basic Materials - Forestry & Paper
3
0 0
-
0 0
-
0 0
-
0 0
Basic Materials - Industrial Metals & Mining 0 3 0-
01
0-
Basic Materials - Mining 0 0 0 0
Total Basic Materials 11 7 11 1 1 2 16 5 12 - - -
Consumer Goods - Beverages 3 5 2 - 1 - 2 81 26 - 2 1
Consumer Goods - Food Producers 9 7 11 1 1 2 94 17 107 2 - 3
Consumer Goods - Household Goods & Home Construction 16 16 11 2 2 2 168 74 50 3 2 1
Consumer Goods - Automobiles & Parts 9 13 8 1 2 1 20 91 77 - 2 2
Consumer Goods - Leisure Goods 23 15 8 3 2 1 246 96 33 4 2 1
Consumer Goods - Personal Goods 17 22 21 2 3 3 87 281 167 1 6 4
Consumer Goods - Tobacco 0 0 0 0 0 0 0 0 0 0 0 0
Total Consumer Goods 77 78 61 10 11 9 617 640 460 10 14 11
Consumer Services - Food & Drug Retailers 13 7 7 2 1 1 332 19 74 6 - 2
Consumer Services - General Retailers 15 23 18 2 3 3 194 203 55 3 4 1
Consumer Services - Media 18 12 29 2 2 4 167 327 245 3 7 6
Consumer Services - Travel & Leisure 29 29 31 4 4 4 497 357 377 8 8 9
Total Consumer Services 75 71 85 9 10 12 1,191 906 751 20 19 18
Financials - Financial Services 28 26 25 4 4 4 525 966 244 9 20 6
Financials - Banks 0 0 0 0 0 0 0 0 0 0 0 0
Financials - Life Insurance 2 0 0 - 0 0 112 0 0 2 0 0
Financials - Non-Life Insurance 89
9 11
1 17669
57 31
1
Financials - Equity Investment Instruments 0 0 0 0 0 0 0 0
Financials - Non-equity Investment Instruments 0 0 0 0 0 0 0 0 0 0 0 0
Financials - Real Estate Investment Trusts 0 0 0 0 0 0 0 0 0 0 0 0
Financials - Real Estate Investment & Services 17 11 11 2 2 2 168 36 38 3 1 1
Total Financials 55 46 45 7 6 6 981 1,070 338 16 23 8
Health Care - Equipment & Services 56 76 77 7 10 11 181 370 441 3 8 11
Health Care - Pharmaceuticals & Biotechnology 64 58 58 8 8 8 88 72 219 1 2 5
Total Health Care 120 134 135 15 18 19 268 442 660 4 9 16
Industrials - Aerospace & Defense 6 6 8 1 1 1 103 8 116 2 - 3
Industrials - Construction & Materials 15 7 13 2 1 2 300 45 84 5 1 2
Industrials - Electronic & Electrical Equipment 20 25 20 3 3 3 38 27 39 1 1 1
Industrials - Engineering 10 11 11 1 2 2 39 66 58 1 1 1
Industrials - General Industrials 16 19 19 2 3 3 14 81 245 - 2 6
Industrials - Support Services 48 43 57 6 6 8 280 271 301 5 6 7
Industrials - Transportation 6 7 3 1 1 - 78 37 15 1 1 -
Total Industrials 121 118 131 15 16 18 852 535 858 14 11 21
Oil & Gas - Alternative Energy 11 7 14 1 1 2 8 8 48 - - 1
Oil & Gas - Oil & Gas Producers 0 2 2 0 - - 0 11 6 0 - -
Oil & Gas - Oil Equipment, Services & Distribution 12 20 15 2 3 2 40 172 95 1 4 2
Total Oil & Gas 23 29 31 3 4 4 48 190 149 1 4 4
Technology - Hardware & Equipment 19 24 25 2 3 4 32 101 47 1 2 1
Technology - Software & Computer Services 189 155 160 24 21 23 693 470 692 12 10 17
Total Technology 208 179 185 26 25 26 726 572 739 12 12 18
Telecommunications - Fixed Line 3 5 2 - 1 - 14 18 - - - -
Telecommunications - Mobile 11 7 9 1 1 1 36 11 8 1 - -
Total Telecommunications 14 12 11 2 2 2 50 29 8 1 1 -
Utilities - Electricity 6 3 5 1 - 1 62 3 23 1 - 1
Utilities - Gas, Water & Multiutilities 2 4 3 - 1 - 1 34 6 - 1 -
Total Utilities 8 7 8 1 1 1 64 37 28 1 1 1
Other 83 47 7 10 6 1 1,177 292 104 20 6 3
Total 795 728 710 100 100 100 5,990 4,720 4,109 100 100 100
1. – indicates a value greater than 0 but less than 0.52. The Industry Classification Benchmark (ICB) has been used to classify individual company investments by industry and subsector.3. Some sectors have been amalgamated where there are instances of single deals, in order to preserve confidentiality.
BVCA Private Equity and Venture Capital Report on Investment Activity 2015 7
Data tables

Table 8. Technology Investment (UK)
Industry Sector Number of companies % of companies Amount invested (£m) % of amount invested
2015 2014 2013 2015 2014 2013 2015 2014 2013 2015 2014 2013
Mobile Telecommunications 66 8
22 2
44 7
-- 1
Fixed Line Telecommunications 0 0 0 0
Computer:
Computer Hardware 4 2 2 1 1 1 1 1 - - - -
Internet 22 29 31 6 8 9 17 42 331 2 3 39
Semiconductors 4 9 11 1 2 3 2 3 4 - - -
Software 112 88 80 32 24 23 504 312 61 54 26 7
Other Electronics 12 19 15 3 5 4 3 16 6 - 1 1
Biotechnology 23 33 31 6 9 9 12 23 20 1 2 2
Medical:
Medical Equipment 13 24 18 4 7 5 10 12 7 1 1 1
Pharmaceuticals 28 16 15 8 4 4 67 38 61 7 3 7
Health Care 17 17 17 5 5 5 47 44 17 5 4 2
Other 113 123 114 32 34 33 265 712 326 28 59 39
Total 354 366 342 100 100 100 930 1,207 841 100 100 100
1. – indicates a value greater than 0 but less than 0.52. Technology classification is included in the appendix (p 14)
Table 9. 2015 Technology Investment by Stage (UK)
Industry sector Number of companies Amount invested (£m)
Early Stage Expansion
Replacement Capital MBO/MBI Other Total
Early Stage Expansion
Replacement Capital MBO/MBI Other Total
Mobile Telecommunications 4 3 0 0 0 6 1 3 0 0 0 4
Fixed Line Telecommunications 0 0 0 0 0 0 0 0 0 0 0 0
Computer:
Computer Hardware 32
0 01 26
-4
0 0- 17
Internet 20 0 0 13 0 0
Semiconductors 4 0 0 0 0 4 2 0 0 0 0 2
Software 71 34 2 5 2 112 66 93 274 71 1 504
Other Electronics 10 31
0 035
1 2-
0 016
Biotechnology 17 8 0 2 8 5 0 -
Medical:
Medical Equipment 10 3 0 0 0 13 8 2 0 0 0 10
Pharmaceuticals 23 41 1 3 45
23 1136 33 1 114
Health Care 12 3 8 2
Other 73 30 3 5 6 113 35 35 21 147 27 265
Total 247 90 7 11 14 354 165 156 332 251 28 932
1. The number of companies in some financing stage categories and their subtotals add up to more than the total number of companies invested in. This is due to some companies receiving more than one investment within the year at different financing stages. Please refer to the appendix for further information.
2. – indicates a value greater than 0 but less than 0.53. Technology classification is included in the appendix (p 14)
8 BVCA Private Equity and Venture Capital Report on Investment Activity 2015
Data tables

Table 10. Investment in ‘Cleantech’ Companies by Stage (UK)
Financing Stage Number of companies % of companies Amount invested (£m) % of amount invested
2015 2014 2013 2015 2014 2013 2015 2014 2013 2015 2014 2013
Venture 52 60 60 55 54 64 34 31 36 11 5 23
Expansion33
25 2535
22 2786
25 5027
4 32
Replacement Capital 2 3 2 3 6 32 1 21
MBO/MBI 4 17 2 4 15 2 82 556 31 26 89 20
Other 6 8 4 6 7 4 114 5 7 36 1 4
Total 93 112 85 100 100 100 316 624 156 100 100 100
1. The number of companies in some financing stage categories and their subtotals add up to more than the total number of companies invested in. This is due to some companies receiving more than one investment within the year at different financing stages. Please refer to the appendix for further information.
2. Some financing stages have been amalgamated where there are instances of single deals, in order to preserve confidentiality.3. Cleantech is defined in the appendix (p 14)
Table 11. Investment by Region (UK)
Region Number of companies % of companies Amount invested (£m) % of amount invested
2015 2014 2013 2015 2014 2013 2015 2014 2013 2015 2014 2013
London 208 173 169 26 24 24 2,459 2,145 1,580 41 45 38
South East 114 114 83 14 16 12 812 578 452 14 12 11
South East & London 322 287 252 41 39 35 3,272 2,723 2,032 55 58 49
South West 47 50 46 6 7 6 259 233 371 4 5 9
East of England 36 29 35 5 4 5 366 48 176 6 1 4
West Midlands 66 57 63 8 8 9 288 336 133 5 7 3
East Midlands 26 23 40 3 3 6 359 249 443 6 5 11
Yorkshire & The Humber 47 53 39 6 7 5 770 397 361 13 8 9
North West 91 75 83 11 10 12 424 448 319 7 10 8
North East 27 30 61 3 4 9 38 12 97 1 - 2
Scotland 72 61 44 9 8 6 138 206 116 2 4 3
Wales 40 47 29 5 6 4 55 51 51 1 1 1
Northern Ireland 21 16 18 3 2 3 20 16 10 - - -
Total 795 728 710 100 100 100 5,990 4,720 4,109 100 100 100
1. – indicates a value greater than 0 but less than 0.5
Table 12. Investment activity by region compared to total number of VAT registered local units
Region Number of VAT registered
local unitsNumber of private equity
backed companiesCompanies invested in per 1,000 of total
VAT registered local units
2015 2014 2013 2015 2014 2013 2015 2014 2013
London 505,140 461,025 432,095 208 173 169 0.41 0.38 0.39
South East 438,890 413,525 400,665 114 114 83 0.26 0.28 0.21
South East & London 944,030 874,550 832,760 322 287 252 0.34 0.33 0.30
South West 261,735 247,965 241,550 47 50 46 0.18 0.20 0.19
East of England 282,455 266,275 256,130 36 29 35 0.13 0.11 0.14
West Midlands 228,555 215,680 209,800 66 57 63 0.29 0.26 0.30
East Midlands 194,270 181,115 175,025 26 23 40 0.13 0.13 0.23
Yorkshire & The Humber 208,790 192,605 187,530 47 53 39 0.23 0.28 0.21
North West 285,460 265,975 256,180 91 75 83 0.32 0.28 0.32
North East 84,530 78,205 75,370 27 30 61 0.32 0.38 0.81
Scotland 214,835 203,755 198,280 72 61 44 0.34 0.30 0.22
Wales 120,825 113,215 110,500 40 47 29 0.33 0.42 0.26
Northern Ireland 82,075 81,900 82,365 21 16 18 0.26 0.20 0.22
Total 2,907,560 2,721,240 2,625,490 795 728 710 0.27 0.27 0.27
Source for 2011/12/13/14/15: ‘UK Business: Activity, Size and Location - [2011/2012/2013/2014/2015]’ (http://www.ons.gov.uk)
BVCA Private Equity and Venture Capital Report on Investment Activity 2015 9
Data tables

Table 13. Investment Stage Analysis by Region (UK) – Number of Companies
Region Venture capital Expansion Replacement capital MBO/MBI Other stage
Number % Number % Number % Number % Number %2015 2014 2013 2015 2014 2013 2015 2014 2013 2015 2014 2013 2015 2014 2013 2015 2014 2013 2015 2014 2013 2015 2014 2013 2015 2014 2013 2015 2014 2013
London 98 64 80 29 20 21 62 56 57 20 24 25 8 10 17 22 25 34 20 36 20 29 34 24 27 11 9 39 21 24
South East 50 42 41 15 13 11 51 50 31 16 21 14 7 8 3 19 20 6 10 18 9 14 17 11 6 5 7 9 9 18
South East & London 148 106 121 44 33 32 113 106 88 36 45 39 15 18 20 41 45 40 30 54 29 43 51 35 33 16 16 47 30 42
South West 7 11 11 2 3 3 31 27 22 10 11 10 24 6
510 12
36
7 47
9 5 5 3 7 9 8
East of England 19 22 22 6 7 6 8 7 13 3 3 6 5 14 2 4 3 5 3 2 2 4 4 5
West Midlands 24 27 41 7 8 11 28 20 18 9 9 8 3 2 4 8 5 8 7 6 4 10 6 5 7 46
10 816
East Midlands 4 9 13 1 3 3 7 6 11 2 3 57
2 519
5 10 5 5 10 7 5 12 7 2 10 4
Yorkshire & The Humber 15 25 20 5 8 5 17 12 16 5 5 7 5 3 13 6 9 9 4 13 8 5 7 5 2 10 9 5
North West 32 28 44 10 9 12 42 26 18 13 11 8 5 69
14 1518
78
15 108
18 7 8 4 10 15 11
North East 13 24 37 4 8 10 14 5 16 4 2 7 0 0 0 0 0 7 0 9 0 0 0 0 0 0
Scotland 27 24 30 8 8 8 44 19 15 14 8 7 0 2 3 0 5 6 2 10 0 3 9 0 0 6
5
0 11
13Wales 23 31 22 7 10 6 137
5 43
2 01
0 03
04 7 2 6 7 2 1
51
9
Northern Ireland 21 13 14 6 4 4 0 4 0 2 0 0 0 0 0 0
Total 333 320 375 100 100 100 317 235 226 100 100 100 37 40 50 100 100 100 69 106 82 100 100 100 70 53 38 100 100 100
1. The number of companies in some financing stage categories and their subtotals add up to more than the total number of companies invested in. This is due to some companies receiving more than one investment within the year at different financing stages. Please refer to the appendix for further information.
2. – indicates a value greater than 0 but less than 0.53. Some regions have been amalgamated where there are instances of single deals, in order to preserve confidentiality.
Table 14. Investment Stage Analysis by Region – Amount invested (UK)
RegionVenture capital Expansion Replacement capital MBO/MBI Other stage
Amount (£m) % Amount (£m) % Amount (£m) % Amount (£m) % Amount (£m) %2015 2014 2013 2015 2014 2013 2015 2014 2013 2015 2014 2013 2015 2014 2013 2015 2014 2013 2015 2014 2013 2015 2014 2013 2015 2014 2013 2015 2014 2013
London 219 71 100 64 24 34 332 308 254 33 36 37 687 44 400 38 14 38 769 1,670 768 37 56 42 452 53 88 58 19 40
South East 46 22 14 13 8 5 146 219 124 15 25 18 330 34 94 18 11 9 224 288 163 11 10 9 66 15 16 8 5 7
South East & London 265 93 114 77 32 38 478 527 377 48 61 55 1,016 78 494 56 25 46 993 1,958 931 48 66 51 518 68 104 67 25 47
South West 8 23 4 2 8 1 76 50 43 8 6 6 497 13
32 1
121150
268 65
15 5 19 3 1 7 1
East of England 16 14 25 5 5 8 20 10 22 2 1 3 277 15 43 126 2 7 11 7 3 1 3 1
West Midlands 10 5 16 3 2 5 91 58 41 9 7 6 1 29 28 - 9 3 155 226 44 7 8 2 31 1818
4 68
East Midlands 1 4 10 - 2 3 14 10 21 1 1 3373
10 22921
3 22 56 223 180 3 7 10 57 2 7 1
Yorkshire & The Humber 6 70 4 2 24 1 31 27 31 3 3 5 58 174 19 16 513 97 89 25 3 5 78 144 64 10 52 29
North West 11 9 94 3 3 31 148 105 61 15 12 9 90 11684
5 388
99210
110 57
6 76 9 22 10 3 10
North East 5 7 7 1 2 2 33 5 7 3 1 1 0 0 0 0 0 71 0 4 0 0 0 0 0 0
Scotland 11 53 15 3 18 5 96 57 55 10 7 8 0 7 41 0 2 4 32 85 0 2 3 0 0 4
8
0 2
4Wales 9 12 7 3 4 2 716
24 12
4 0-
0 0-
057 31 19 3 1 1 -
6-
2
Northern Ireland 3 2 4 1 1 1 0 3 0 - 0 0 0 0 0 0
Total 344 293 298 100 100 100 995 865 685 100 100 100 1,807 305 1,064 100 100 100 2,068 2,980 1,840 100 100 100 777 276 223 100 100 100
1. – indicates a value greater than 0 but less than 0.5
10 BVCA Private Equity and Venture Capital Report on Investment Activity 2015
Data tables

Table 15. 2015 Industry Sector Analysis by Region (UK) – Number of Companies
Region Oil & gas, basic materials
& industrials
Consumer goods
Health care & consumer
services
Telecoms, utilities
& financials
Technology Other
Number % Number % Number % Number % Number % Number %
London 20 13 17 22 48 25 26 34 72 35 25 30
South East 29 19 10 13 38 19 12 16 20 10 5 6
South East & London 49 32 27 35 86 44 38 49 92 44 30 36
South West 5 3 6 8 14 7 7 9 9 4 6 7
East of England 10 6 3 4 13 7 2 3 6 3 2 2
West Midlands 14 9 14 18 14 7 4 5 17 8 3 4
East Midlands 9 6 0 0 5 3 4 5 4 2 4 5
Yorkshire and The Humber 12 8 3 4 12 6 6 8 10 5 4 5
North West 18 12 15 19 24 12 9 1212 6
14 17
North East 5 3 3 4 5 3 2 3 11 13
Scotland 25 16 3 4 6 3 3 4 27 13 8 10
Wales 6 43 4
13 7 2 3 17 81 1
Northern Ireland 2 1 3 2 0 0 14 7
Total 155 100 77 100 195 100 77 100 208 100 83 100
1. Some regions have been amalgamated where there are instances of single deals, in order to preserve confidentiality.
Table 16. 2015 Industry Sector Analysis by Region (UK) – Amount Invested
Region Oil & gas, basic materials & industrials
Consumer goods
Health care & consumer
services
Telecoms, utilities & financials
Technology Other
Amount (£m) %
Amount (£m) %
Amount (£m) %
Amount (£m) %
Amount (£m) %
Amount (£m) %
London 97 11 162 26 478 33 345 31 430 59 948 81
South East 186 20 107 17 79 5 290 26 38 5 113 10
South East & London 282 31 269 44 557 38 634 58 468 65 1,061 90
South West 7 1 23 4 72 5 129 12 17 2 12 1
East of England 53 6 119 19 179 12 4 - 6 1 6 1
West Midlands 32 4 49 8 100 7 52 5 14 2 41 4
East Midlands 181 20 0 0 40 3 85 8 35 5 19 2
Yorkshire and The Humber 212 23 24 4 353 24 115 11 62 9 2 -
North West 52 6 122 20 101 7 57 587 12
5 -
North East 4 - 1 - 4 - 1 - 28 2
Scotland 85 9 9 1 13 1 14 1 15 2 3 -
Wales 8 10 0
40 3 3 - 4 10 0
Northern Ireland - - 1 - 0 0 19 3
Total 916 100 617 100 1,459 100 1,095 100 726 100 1,177 100
1. – indicates a value greater than 0 but less than 0.5
BVCA Private Equity and Venture Capital Report on Investment Activity 2015 11
Data tables

12 BVCA Private Equity and Venture Capital Report on Investment Activity 2015
Data tables
Table 17. UK Investment by type of PE organisation
Type of private equity organisation Amount invested (£m) % of amount invested
2015 2014 2013 2015 2014 2013
Organisations which manage third-party funds (Independents) 4,262 2,730 2,421 71 58 59
Organisations which invest own or parent company money (Captives) 367 506 459 6 11 11
Organisations which do both (Semi-captives) 1,361 1,484 1,229 23 31 30
Total 5,990 4,720 4,109 100 100 100
Table 18. Funds Raised by Source
Type of source Amount raised (£m) % of amount raised
2015 2014 2013 2015 2014 2013
Pension Funds UK 687 305 137 6 3 1
Overseas 1,222 2,373 2,805 10 22 25
Total 1,909 2,677 2,943 16 25 26
Insurance Companies UK 199 54 56 2 - -
Overseas 819 464 1,092 7 4 10
Total 1,018 518 1,148 9 5 10
Corporate Investors UK 373 84 252 3 1 2
Overseas 708 69 240 6 1 2
Total 1,081 154 492 9 1 4
Banks UK 15 0 0 - 0 0
Overseas 775 106 101 7 1 1
Total 790 106 101 7 1 1
Family Offices UK 113 147 94 1 1 1
Overseas 409 739 368 3 7 3
Total 521 886 462 4 8 4
Funds of Funds UK 297 280 300 2 3 3
Overseas 883 1,288 1,157 7 12 10
Total 1,180 1,568 1,458 10 14 13
Government Agencies UK 92 8 25 1 - -
Overseas 194 143 25 2 1 -
Total 286 151 50 2 1 -
Academic Institutions UK 23 77 0 - 1 0
Overseas 49 685 65 - 6 1
Total 73 761 65 1 7 1
Private Individuals UK 315 270 183 3 2 2
Overseas 923 444 309 8 4 3
Total 1,238 714 492 10 7 4
Capital Markets UK 17 1 123 - - 1
Overseas 0 0 27 0 0 -
Total 17 1 150 - - 1
Sovereign Wealth Funds UK 18 0 0 - 0 0
Overseas 956 1,000 1,890 8 9 17
Total 974 1,000 1,890 8 9 17
Others UK 466 48 1,032 4 - 9
Overseas 2,359 2,238 917 20 21 8
Total 2,825 2,286 1,949 24 21 17
Total UK 2,614 1,273 2,201 22 12 20
Total Overseas 9,297 9,549 8,997 78 88 80
Grand Total 11,911 10,822 11,198 100 100 100
1. – indicates a value greater than 0 but less than 0.52. UK includes Bermuda, Cayman Islands, Channel Islands and British Virgin Islands

Table 19. Funds Raised by Country
Country Amount raised (£m) % of amount raised
2015 2014 2013 2015 2014 2013
UK 2,614 1,273 2,201 22 12 20
France 435 116 80 4 1 1
Germany 474 266 522 4 2 5
Ireland 239 0 44 2 0 -
Netherlands 735 616 427 6 6 4
Sweden 344 110 171 3 1 2
Switzerland 705 510 445 6 5 4
Rest of Europe 882 510 422 7 5 4
United States 1,970 5,420 4,314 17 50 38
Canada 203 349 541 2 3 5
Australia 196 97 265 2 1 2
China 238 61 467 2 1 4
Japan 369 125 114 3 1 1
Middle East 1,610 698 386 14 6 3
Africa 0 59 48 0 1 -
Other 897 612 764 8 6 7
Total 11,912 10,822 11,211 100 100 100
1. UK includes Bermuda, Cayman Islands, Channel Islands and British Virgin Islands2. – indicates a value greater than 0 but less than 0.5
Table 20. Funds Raised by Investment Focus
Focus Amount raised (£m) % of amount raised
2015 2014 2013 2015 2014 2013
Large MBO 2,799 4,181 6,555 24 39 58
Middle MBO 8,030 5,204 4,235 67 48 38
Small MBO 567 1,149 162 5 11 1
VC 515 288 259 4 3 2
Generalist 0 0 0 0 0 0
Total 11,912 10,822 11,211 100 100 100
1. – indicates a value greater than 0 but less than 0.5
Table 21. 2015 Divestments
Type of divestment Amount divested Number of divestments Number of companies
£m % Number % Number %
Divestment on Flotation (IPO) 1,157 7 27 3 21 3
Repayment of Preference Shares/Loans 970 6 265 25 145 22
Sale of quoted equity post flotation 4,735 28 122 12 71 11
Sale to another Private Equity firm 2,109 12 109 10 86 13
Sale to Financial Institution 816 5 95 9 42 6
Sale to Management (Buy-back) 256 1 64 6 48 7
Trade Sale 5,104 30 226 22 162 24
Write Offs 503 3 64 6 41 6
Others 1,451 8 71 7 51 8
Total 17,102 100 1,043 100 667 100
BVCA Private Equity and Venture Capital Report on Investment Activity 2015 13
Data tables

Appendix Methodology and DefinitionsIn early 2016, BVCA’s Benchmark data collection system collected data on investments made by BVCA private equity and venture capital members during the calendar year 2015. A 93% response rate was achieved, which included virtually every major private equity and venture capital firm in the UK. In order to ensure only qualifying investments were included in the analysis certain criteria were applied to the data received and are outlined below:
Overseas InvestmentsThe BVCA survey includes all investments ‘made’ or ‘advised by’ the BVCA full member firm, ‘regardless of whether the investing fund is UK or overseas-based’. This means that the figures relate to investments undertaken by BVCA full member firms based in the UK, and also to those undertaken through an overseas office where the UK office was the lead adviser, regardless of where the investment fund was domiciled. As a result, more cross-border investments have been included in the BVCA data which therefore reflect more accurately the activity of BVCA full members, particularly those that invest through pan-European or global funds.
Industry SectorsThe Industry Classification Benchmark (ICB) is used throughout this report to classify individual company investments by industry and subsector.
Financing StagesThe number of companies in some financing stage categories and their subtotals add up to more than the total number of companies invested in. This is due to some companies receiving more than one investment within the year at different financing stages. For example, if a company receives a round of start-up finance and then further rounds of expansion finance later in the same year, that company will be counted once in each of the start-up and expansion categories (therefore appearing to be counted twice), but only counted as one investment in the overall total. This only affects ‘number of companies’ not ‘amounts invested’.
Technology ClassificationThere is as yet no universally accepted definition of a ‘technology’ company. For the purposes of this report, investments defined by BVCA member firms as ‘high-tech’ are included in tables 8 and 9.
Cleantech ClassificationCleantech represents a diverse range of products, services and processes which are intended to provide superior performance at lower costs, while greatly reducing or eliminating negative ecological impact, at the same time as improving the productive and responsible use of natural resources. For the purposes of this report, investments defined by BVCA member firms as ‘cleantech’ are included in table 10.
Foreign Currency ConversionWhere BVCA collected investment information in foreign currencies, the amounts were converted into Sterling using the annual average exchange rates for 2012, calculated from figures supplied by the Bank of England.
Private Equity DefinitionsThe term private equity is generally used in Europe to cover the industry as a whole, including both buyouts and venture capital. Venture capital is a subcategory covering the start-up to expansion stages of investment.
Private equity describes equity investments in unquoted companies, often accompanied by the provision of loans and other capital bearing an equity-type risk.
14 BVCA Private Equity and Venture Capital Report on Investment Activity 2015
Appendix: Methodology and Definitions

Types of Private Equity Firms
The definitions below need to be interpreted with caution. In recent years, several larger private equity firms that historically invested funds from a single in-house source have begun to raise and manage external sources.
Independents: These can either be firms, funds or investment trusts, either publicly listed or private, which raise their capital from external sources.
Captives: These organisations invest their own money, and/or manage or invest funds on behalf of a parent organisation. In the latter case, the private equity firm would be a wholly owned subsidiary or division of the parent, usually a financial institution.
Semi-captives: These organisations invest funds on behalf of a parent company, or their own funds, in addition to investing funds raised within the last five years from external sources.
Stages of Investment
Seed: Financing that allows a business concept to be developed, perhaps involving the production of a business plan, prototypes and additional research, prior to bringing a product to market and commencing large-scale manufacturing.
Start-up: Financing provided to companies for use in product development and initial marketing. Companies may be in the process of being setup or may have been in business for a short time, but have not yet sold their product commercially.
Other early stage: Financing provided to companies that have completed the product development stage and require further funds to initiate commercial manufacturing and sales. They may not yet be generating profits.
Late stage venture: Financing provided to companies that have reached a fairly stable growth rate; that is, not growing as fast as the rates attained in the early stage. These companies may or may not be profitable, but are more likely to be than in previous stages of development.
Expansion: Sometimes known as ‘development’ or ‘growth’ capital, provided for the growth and expansion of an operating company which is trading profitably. Capital may be used to finance increased production capacity, market or product development, and/or to provide additional working capital.
Bridge financing: Financing made available to a company in the period of transition from being privately owned to being publicly quoted.
Replacement capital: Minority stake purchase from another private equity investment organisation or from another shareholder or shareholders.
Refinancing bank debt: Funds provided to enable a company to repay existing bank debt.
PIPE: Private investment in public companies (minority stake only).
Rescue/Turnaround: Financing made available to existing businesses which have experienced trading difficulties, with a view to re-establishing prosperity.
Management buyout (MBO): Funds provided to enable current operating management and investors to acquire an existing product line or business. Institutional buyouts (IBOs), leveraged buyouts (LBOs) and other types of similar financing are included under MBOs for the purposes of this report.
Management buy-in (MBI): Funds provided to enable an external manager or group of managers to buy into a company.
Public to private: Purchase of quoted shares with the purpose of de-listing the company.
Secondary buyout: Purchase of a company from another private equity investment organisation.
BVCA Private Equity and Venture Capital Report on Investment Activity 2015 15
Appendix: Methodology and Definitions

Fundraising
The following apply to the fundraising section:
1. Funds managed by UK private equity firms for both UK and overseas investment are included.
2. Funds managed by the overseas headquarters of international private equity firms (which have UK-based offices that are BVCA members) are excluded.
UK Regions
The standard Government Office Region (GORs) classification is used throughout this report to classify the location of individual company investments. The composition of GORs is listed below.
North EastClevelandDurhamNorthumberlandTyne and Wear
East MidlandsDerbyshireLeicestershireLincolnshireNorthamptonshireNottinghamshire
South EastBerkshireBuckinghamshireEast SussexHampshireIsle of WightKentOxfordshireSurreyWest Sussex
North WestCumbriaCheshireGreater ManchesterLancashireMerseyside
West MidlandsHereford and WorcesterShropshireStaffordshireWarwickshireWest Midlands
London
Yorkshire and The HumberHumbersideNorth YorkshireSouth YorkshireWest Yorkshire
East of EnglandCambridgeshireNorfolkSuffolkBedfordshireEssexHertfordshire
South WestAvonCornwallDevonDorsetGloucestershireSomersetWiltshire
16 BVCA Private Equity and Venture Capital Report on Investment Activity 2015
Appendix: Methodology and Definitions

Industry classifications
Economic Group Sectors Subsectors
Oil and Gas Oil and gas, Oil and gas producers Oil equipment, services and distribution Alternative energy
Exploration and production, integrated oil and gas. Oil equipment, and services pipelines. Renewable energy equipment, alternative fuels.
Basic Materials Chemicals Forestry and paper Industrial metals and mining Mining Commodity and speciality chemicals. Forestry, paper. Aluminium, non-ferrous metals, iron and steel. Coal, diamonds and gemstones, general mining, gold mining, platinum and precious metals.
Industrials Construction and materials Aerospace and defence General industrials Electronic and electrical equipment Industrial engineering Industrial transportationSupport services
Building materials and fixtures, heavy construction. Aerospace, defence. Containers and packaging, diversified industrials. Electrical components and equipment, electronic equipment. Commercial vehicles and trucks, industrial machinery.Delivery services, marine transportation, railroads, transportation services, trucking.Business support services, business training and employment agencies, financial administration, industrial suppliers, waste and disposal services.
Economic Group Sectors Subsectors
Consumer goods Automobiles and partsBeveragesFood producersHousehold goodsLeisure goodsPersonal goodsTobacco
Automobiles, auto parts, tyres.Brewers, distillers and vintners, soft drinks.Farming and fishing, food products.Durable household products, non-durable household products, furnishings, home construction.Consumer electronics, recreational products, toys.Clothing and accessories, footwear, personal products.Tobacco.
Basic materials ChemicalsForestry and paperIndustrial metalsMining
Commodity and specialty chemicals.Forestry, paper.Aluminium, non-ferrous metals, steel.Coal, diamonds and gemstones, general mining, gold mining, platinum and precious metals.
Healthcare Healthcare equipment and servicesPharmaceuticals and biotechnology
Health care providers, medical equipment, medical supplies.Biotechnology, pharmaceuticals.
Consumer Services Food and drug retailers General retailers Media Travel and leisure
Drug retailers, food retailers and wholesalers.Apparel retailers, broadline retailers, home improvement retailers, specialised consumer services, specialty retailers.Broadcasting and entertainment, media agencies, publishing.Airlines, gambling, hotels, recreational services, restaurants and bars, travel and tourism.
Economic Group Sectors Subsectors
Telecommunications Fixed-line telecommunications Mobile telecommunications
Fixed-line telecommunications.Mobile telecommunications.
Utilities Electricity Gas, water and multi-utilities
Electricity.Gas distribution, multiutilities, water.
Financials BanksNon-life insuranceLife insuranceReal estateGeneral financialEquity investment instrumentsNon-equity investment instruments
Banks.Full line insurance, insurance brokers, property and casualty insurance, reinsurance.Life insurance.Real estate holding and development, real estate investment trusts.Asset managers, consumer finance, specialty finance, investment services, mortgage finance.Equity investment instruments.Non-equity investment instruments.
Technology Software and computer servicesTechnology hardware and equipment
Computer services, internet, software. Computer hardware, electronic office equipment, semiconductors, telecommunications equipment.
Disclaimer
The data provided has been collected from different sources. BVCA has taken steps to ensure the reliability of the information presented. However, BVCA cannot guarantee the ultimate accuracy of the data and therefore BVCA does not accept responsibility for any decision made or action taken based on the information provided.
BVCA Private Equity and Venture Capital Report on Investment Activity 2015 17
Appendix: Methodology and Definitions

For further information contact the BVCA
British Private Equity & Venture Capital Association
5th Floor East, Chancery House, 53-64 Chancery Lane, London WC2A 1QS T +44 (0)20 7492 0400 [email protected] www.bvca.co.uk