by for teachers and students thanks for checking us out ... · lesson 30: interpreting scatter...
TRANSCRIPT

800-858-7339 • www.tcmpub.com
Sample Pages from
Created by Teachers for Teachers and Students
Thanks for checking us out. Please call us at 800-858-7339 with questions or feedback, or to order this product. You can also order this product online at www.tcmpub.com.
For correlations to State Standards, please visit www.teachercreatedmaterials.com/correlations.
Can’t wait for lessons and activities for your classroom? Download them now at tcm-today.com.
Instant Delivery, Download Today!

Teacher’s Guide
Level 8
Level 8
© Teacher Created Materials 21200—Focused Mathematics Intervention Level 8—Teacher’s Guide
Table of Contents WelcomeProgram Welcome . . . . . . . . . . . . . . . . . . . . . . . 4
ResearchResearch on Mathematics Intervention . . . . . . . . 6 The Need for Intervention . . . . . . . . . . . . . . . . 7 Response to Intervention in Mathematics . . . . 8 Components of Effective Mathematics
Interventions . . . . . . . . . . . . . . . . . . . . . . 10 High-Yield Strategies for Increasing
Student Achievement . . . . . . . . . . . . . . . 12 Using Technology to Improve
Mathematical Learning . . . . . . . . . . . . . . 13 Using Games to Motivate Struggling
Math Learners . . . . . . . . . . . . . . . . . . . . . 14 Assessment . . . . . . . . . . . . . . . . . . . . . . . . . . . 15
Best PracticesComponents of Effective Mathematics
Intervention Programs . . . . . . . . . . . . . . . . . . 17
Differentiation . . . . . . . . . . . . . . . . . . . . . . . . . . . 19 Differentiating by Specific Needs . . . . . . . . . 19
Developing Academic Vocabulary . . . . . . . . . . . . 21 Academic Vocabulary . . . . . . . . . . . . . . . . . . . 21
Developing Math Skills Using Concrete Models . . . . . . . . . . . . . . . . . . . . . . 22
Developing Mathematical Problem-Solving Skills . . . . . . . . . . . . . . . . . . 24
Why We Teach Problem Solving . . . . . . . . . . 24 Making Connections . . . . . . . . . . . . . . . . . . . . 24 A Problem-Solving Framework . . . . . . . . . . . 25
Math in the Real World . . . . . . . . . . . . . . . . . . . . 28
Developing Math Fluency Skills . . . . . . . . . . . . . 29
How to Use This ProductKit Components . . . . . . . . . . . . . . . . . . . . . . . . . . 31
Getting Started . . . . . . . . . . . . . . . . . . . . . . . . . . . 32
Teaching a Lesson . . . . . . . . . . . . . . . . . . . . . . . . 33
Using the Math Fluency Games . . . . . . . . . . . . . 35 How to Organize and Manage Games . . . . . . 35
Playing the Math Fluency Game Sets . . . . . . . . . 36
Playing the Digital Math Fluency Games . . . . . . 39
Using the Technology Options . . . . . . . . . . . . . . . 40
Planning for InterventionPacing Plans . . . . . . . . . . . . . . . . . . . . . . . . . . . . . 41
Correlations . . . . . . . . . . . . . . . . . . . . . . . . . . . . . 45
Introduction to Correlations . . . . . . . . . . . . . 45 Standards Correlations . . . . . . . . . . . . . . . . . . 46Series Scope and Sequence . . . . . . . . . . . . . . . . . 49
Lessons Lesson 1: Repeating Decimals . . . . . . . . . . . . 61 Lesson 2: Approximating Irrational
Numbers . . . . . . . . . . . . . . . . . . . . . . . . . . 69 Lesson 3: Multiplication and Division
with Exponents . . . . . . . . . . . . . . . . . . . . 77 Lesson 4: Solving Equations with Squares
and Square Roots . . . . . . . . . . . . . . . . . . . 85 Lesson 5: Solving Cubic Equations . . . . . . . . 93 Lesson 6: Scientific Notation . . . . . . . . . . . . 101 Lesson 7: Computing with Scientific
Notation . . . . . . . . . . . . . . . . . . . . . . . . . 109 Lesson 8: Slope and Unit Rate . . . . . . . . . . . 117 Lesson 9: Number of Solutions . . . . . . . . . . 125 Lesson 10: Solving Linear Equations . . . . . . 133 Lesson 11: Systems of Equations . . . . . . . . . 141 Lesson 12: Using Systems of Equations . . . 149 Lesson 13: Definition of Function . . . . . . . . 157 Lesson 14: Comparing Rates of Change . . . 165 Lesson 15: Linear/Nonlinear . . . . . . . . . . . . 173 Lesson 16: Writing Linear Functions . . . . . 181 Lesson 17: Modeling with
Linear Functions . . . . . . . . . . . . . . . . . . 189 Lesson 18: Increasing and Decreasing
Functions . . . . . . . . . . . . . . . . . . . . . . . . 197 Lesson 19: Rigid Transformations . . . . . . . . 205 Lesson 20: Congruent Figures . . . . . . . . . . . 213 Lesson 21: Transformations
with Dilations . . . . . . . . . . . . . . . . . . . . . 221 Lesson 22: Similarity . . . . . . . . . . . . . . . . . . . 229 Lesson 23: Angles, Parallel Lines,
and Triangles . . . . . . . . . . . . . . . . . . . . . 237 Lesson 24: Angles and Similar Triangles . . . 245 Lesson 25: Determining Right Triangles . . . 253 Lesson 26: Using the
Pythagorean Theorem . . . . . . . . . . . . . . 261 Lesson 27: Distance Between Two Points . . 269 Lesson 28: Volume of Cylinders,
Cones, and Spheres . . . . . . . . . . . . . . . . 277 Lesson 29: Association in Scatter Plots . . . . 285 Lesson 30: Interpreting Scatter Plots
with Linear Associations . . . . . . . . . . . . 293
AppendicesAppendix A: References Cited . . . . . . . . . . . . . 301
Appendix B: Teacher Glossary . . . . . . . . . . . . . . 304
Appendix C: Digital Resources Charts . . . . . . . 312
3
© Teacher Created Materials 21200—Focused Mathematics Intervention Level 8—Teacher’s Guide
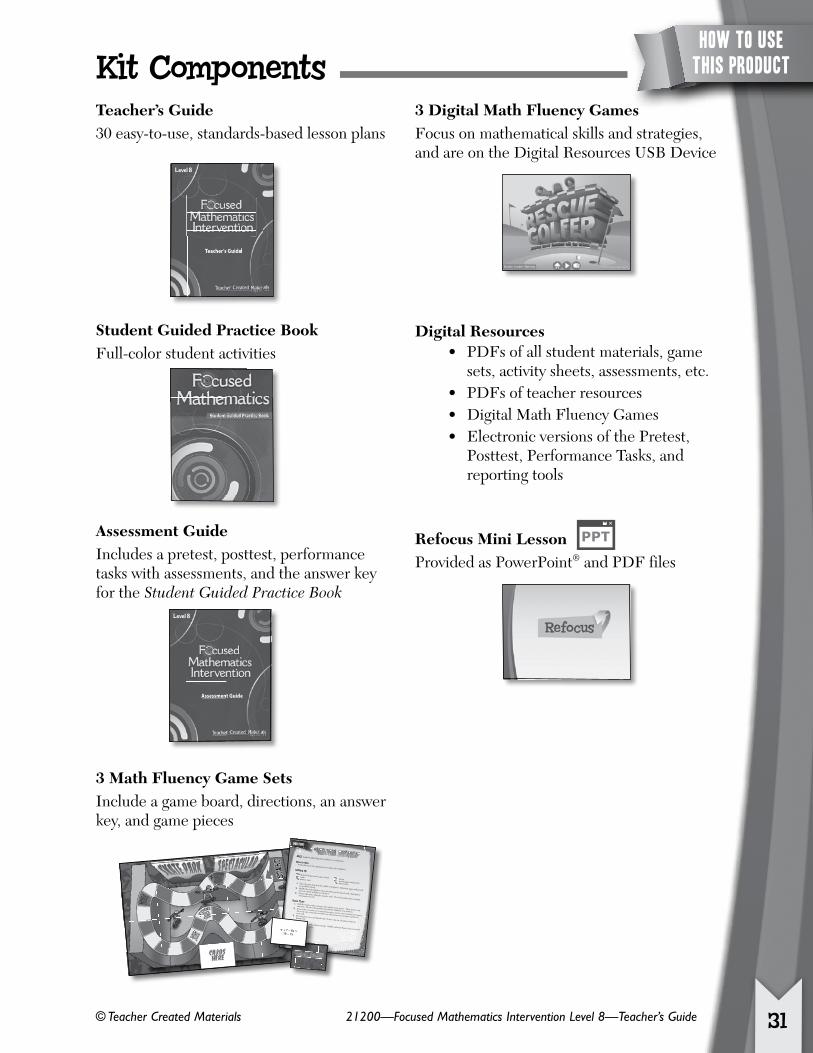
Teacher’s Guide30 easy-to-use, standards-based lesson plans
Student Guided Practice BookFull-color student activities
Assessment GuideIncludes a pretest, posttest, performance tasks with assessments, and the answer key for the Student Guided Practice Book
3 Math Fluency Game SetsInclude a game board, directions, an answer key, and game pieces
directions
23084 (i10221)—Focused Mathematics—Skate Park Spectacular Game Set
© Teacher Created Materials
Skill: Single-Variable Equations (infinite or no solutions)How to WinFind solutions to the equations as you ride to the finish line!Setting Up
Skate Park Spectacular game board cards number cube
pawns scratch paper and pencils Answer Key1. Place the game board in the middle of all players. Distribute paper and pencils
for problem solving.2. Shuffle the cards and place them facedown on the game board. Each player
chooses a pawn and places it on Start.3. Players take turns rolling the number cube. The lowest roller starts, and play
continues to the left.
Game Time1. Roll the number cube and move forward that many spaces. Then, draw a card
and solve. Decide if the problem has infinite solutions or no solution.
2. If you solve correctly, move forward one space. If not, move backward one space.
For every turn, remember to follow any instructions on your space and/or on
your card. 3. The first player to reach Finish wins! If time runs out, the player closest to
Finish wins.
Note: Separate used cards as you play. Shuffle and reuse them if you run out of
cards during the game.
© Te
ache
r Cr
eate
d M
ater
ials
2308
4 (i1
0194
)—Fo
cuse
d M
athe
mat
ics—
Skat
e Pa
rk S
pect
acul
ar G
ame
Card
s
i10194
i10194
i10194
i10194
i10194
i10194
i10194
i10194
i10194
23084 (i10194)—Focused M
athematics—
Skate Park Spectacular Gam
e Cards ©
Teacher Created Materials
3
6
9
2
5
8
1
4
7
-1 2(36a – 6) = 3 4(4 – 24a) 11 + 3x – 7 =
6x + 5 – 3x
4(x – 5) + 2x = 6x – 20
-6x + 3 + 2x = -4x + 7
-x + 7 – 6x = 19 – 7x
3x + 17 – x = 2x – 6
8x – (-1) = x + 7x + 1
6x + 5 – 2x = 4 + 4x + 1
-12x + 3 = -4x + 3 – 8x
3 Digital Math Fluency GamesFocus on mathematical skills and strategies, and are on the Digital Resources USB Device
Digital Resources • PDFs of all student materials, game
sets, activity sheets, assessments, etc . • PDFs of teacher resources • Digital Math Fluency Games • Electronic versions of the Pretest,
Posttest, Performance Tasks, and reporting tools
Refocus Mini Lesson PPT
Provided as PowerPoint® and PDF files
Assessment Guide
Level 8
Level 8
Teacher’s Guide
Level 8
Level 8
Level 8
RESEARCH
31
HOW TO USE THIS PRODUCTKit Components

© Teacher Created Materials 21200—Focused Mathematics Intervention Level 8—Teacher’s Guide
Teacher’s Guide
Each 8-page lesson is organized in a consistent format for ease of use . Teachers may choose to complete some or all of the lesson activities to best meet the needs of their students . Lesson materials can be utilized flexibly in a variety of settings . For example, modeling with a small group, using printed materials with a document camera, or using PDF materials on a digital platform, such as an interactive whiteboard . Each lesson includes:
• an overview page with key information for planning • key mathematics content standards covered • key mathematical practices and processes addressed • an overview providing teacher background or
student misconceptions
• a Warm-Up activity to build students’ recall of important mathematical concepts
• a whole-class Language and Vocabulary activity • time markers to indicate the approximate time for instruction
• a whole-class section focusing on the key concept/skill being taught
• use of the gradual release of responsibility model in the Whole-Group lesson section
• differentiation strategies to support and extend learning with the Refocus lesson and Extend Learning activity
• math fluency games that motivate students to develop and reinforce mastery of basic skills
• a Math in the Real World concept task activity
21200—Focused Mathematics Intervention Level 8—Teacher’s Guide
© Teacher Created Materials
Lesson
8Slope and Unit Rate (cont.)
Whole-Group Lesson (cont.) 1. Refer students to the Grocery Shopping activity sheet (Student Guided Practice Book,
page 56). Provide the sentence frames from Step 5 of the We Do section to help
students explain their reasoning.
2. Have students share their graphs and reasoning. If students have difficulty explaining
their reasoning, remind them to use the sentence frames and vocabulary terms. For
example, have students explain the proportional relationship that the graph shows.
Closing the Whole-Group Lesson
Revisit the focus question for the lesson: How can you use the unit rate to express the slope
of the graph of a proportional relationship? Ask students to consider how the concept of
slope in a linear equation is similar to or different from a unit rate. Make sure students
understand that the variables in an equation have no definite meaning unless they are
defined in a problem situation.Progress Monitoring min.
1. Have students complete the Quick Check activity sheet (Student Guided Practice
Book, page 57) to gauge student progress toward mastery of the Learning Objectives.
2. Based on the results of the Quick Check activity sheet and your observations during
the lesson, identify students who may benefit from additional instruction in the
Learning Objectives. These students will be placed into a small group for reteaching.
See instructions on the following page.
1. 1. 1. 1.
You Do
122© Teacher Created Materials 21200—Focused Mathematics Intervention Level 8—Teacher’s Guide
Lesson
8Slope and Unit Rate (cont.)
Whole-Group Lesson (cont.)
4. Tell students that the graph has a slope of 31 , which shows the constant increase of
3 miles per minute. Ask students how many miles the car has gone after 2 minutes. (6 miles) Remind students that 6 miles per 2 minutes has a unit rate of 3 miles per minute.
5. To help students explain their reasoning, provide students with the following sentence frames:
• The _____ is also the _____ of the graph. • The graph shows a proportional relationship between _____ and _____. • The slope of the graph is _____. • The unit rate is _____. 6. Ask students to complete the activity sheet. When they finish, ask them to compare
their answers and explanations with other students.
4. 4. 4. 4. We Do(cont.)
Language Support Continue to stress that the unit rate is the same as the slope of the graph. Remind students that the graphs they will create show a relationship between two variables.
121
© Teacher Created Materials 21200—Focused Mathematics Intervention Level 8—Teacher’s Guide
Lesson
8Learning ObjectivesExpressions and Equations • Graph proportional relationships, interpreting the unit rate as the slope of the graph. Compare two different proportional relationships represented in different ways. For example, compare a distance-time graph to a distance-time equation to determine which of two moving objects has greater speed.
Mathematical Practices and Processes • Reason abstractly and quantitatively. • Construct viable arguments and critique the reasoning of others. • Model with mathematics.
Progress MonitoringThe Student Guided Practice Book pages below can be used
to formally and informally assess student understanding of
the concepts.
Slope and Unit Rate
Materials • Student Guided Practice Book (pages 55–61) • Math Fluency Game Sets • Digital Math Fluency Games
• index cards
Student MisconceptionsStudents often do not realize that the slope of a graph is a physical representation of how something changes in relationship to something else in a given situation. This is the same as the unit rate or the rate of change. By using equations to construct graphs and tables and find slopes and unit rates, students will begin to understand how these multiple representations describe proportional relationships.
© Teacher Created Materials 21209—Focused Mathematics—Student Guided Practice Book
Name: _____________________________________________________________________ Date: _________________________
Miles per Minute Directions: Use the linear equation for the situation to sketch a graph. Then, identify the slope of the line and the unit rate it represents.
1 The equation describing the motion of a race car is given by y = 3x, where x is the number of minutes and y is the number of miles. x y y
x
Slope:
______________________________
Unit Rate:
______________________________
Explain how the unit rate could be determined from the graph of the line if you did not know the equation.
_____________________________________________________________________________ _____________________________________________________________________________
2 The equation describing the motion of a bicycle is y = 13 x, where x is the number of minutes and y is the number of miles.
x y y
x
Slope:
______________________________
Unit Rate:
______________________________
Explain how the unit rate could be determined from the graph of the line if you did not know the equation.
_____________________________________________________________________________ _____________________________________________________________________________
Lesson
8
55
Quick CheckDirections: Choose the correct answer to the question. Directions: Choose the statement that correctly matches
the situation. 1 What is the slope of the
equation y = 15 x? A 5
B 15 C -5 D - 1
5
2 Jamal’s goal for the basketball season could be described
by the equation y = 32x, where x stands for the number of
games and y stands for the total points scored.
A The slope of the equation is 132.
B The unit rate would be 32 points per game.
C The unit rate would be 32 games per point.
D The slope of the equation is - 132 .
Directions: Solve. 3 Evie has kept track of the amount in
her savings account since she opened it.
She described her account with the equation
y = 150x, where x equals the number of years
and y equals the total amount of money in
the account. A. Graph the proportional relationship. xy
B. What is the unit rate for the situation?
Explain how you determined the number and the words that describe
the unit rate.
y
x
_____________________________________________________________________________
_____________________________________________________________________________
_____________________________________________________________________________
© Teacher Created Materials
21209—Focused Mathematics—Student Guided Practice Book
Name: _____________________________________________________________________ Date: _________________________Lesson
8
57
Grocery Shopping Directions: Use the linear equation for the situation to sketch a graph. Then, identify the slope of the
line and the unit rate it represents. 1 The equation describing the purchase of cans of soup is y = 1
4 x, where x is the number of cans of
soup and y is the number of dollars.x y y
x
Slope:
______________________________Unit Rate:
______________________________ Explain how the unit rate could be determined from the graph of the line if you did
not know the equation. _____________________________________________________________________________
_____________________________________________________________________________ 2 The equation describing the purchase of watermelons is y = 4x, where x is the number of
watermelons and y is the number of dollars.x y y
x
Slope:
______________________________Unit Rate:
______________________________ Explain how the unit rate could be determined from the graph of the line if you did
not know the equation. _____________________________________________________________________________
_____________________________________________________________________________21209—Focused Mathematics—Student Guided Practice Book
© Teacher Created Materials
Name: _____________________________________________________________________ Date: _________________________
Lesson
8
56
RefocusDirections: Graph the proportional relationship. Find the slope and unit rate for each situation.
1 Jose is traveling around the city. His trip can be described by the equation y = 40x, where x represents the number of hours and y represents the number of miles traveled.
A. Graph the proportional relationship.
x y
B. What is the slope of the line?
___________________________________
C. What is the unit rate for the situation?
___________________________________
y
x
2 Tanya is shopping for new school clothes. Her shopping trip can be described using the equation y = 25x, where x represents the number of shirts purchased and y represents the total number of dollars spent.
A. Graph the proportional relationship.
x y
B. What is the slope of the line?
___________________________________
C. What is the unit rate for the situation?
___________________________________
y
x
21209—Focused Mathematics—Student Guided Practice Book © Teacher Created Materials
Name: _____________________________________________________________________ Date: _________________________Lesson
8
58
x
Tanya is shopping for new school clothes. Her shopping trip can be described using the equation represents the total number of
x
© Teacher Created Materials
_________________________ Independent PracticeDirections: Write a situation that might be described by each equation. Then, graph the proportional relationship. Define the variables and give the unit rate for the problem. 1 y = 20x
_________________________ _________________________ _________________________ _________________________ _________________________ _________________________
x yy
x
2 y = 0.20x
_________________________ _________________________ _________________________ _________________________ _________________________ _________________________
x yy
x
3 y = 15 x
_________________________ _________________________ _________________________ _________________________ _________________________ _________________________
x yy
x
© Teacher Created Materials 21209—Focused Mathematics—Student Guided Practice Book
Name: _____________________________________________________________________ Date: _________________________Lesson
8
59
21209—Focused Mathematics—Student Guided Practice Book
Lesson
59
Lesson
59
Mini Bikes Saul and Roman are riding mini bikes at a constant speed. Saul’s speed can be described using the
equation y = 15x, where x represents the number of hours and y represents the number of miles.
Roman’s speed can be described with the graph below. Use the slope to explain who is going faster.
60
50
40
30
20
10
0 1 2 3 4 5Number of Hours
Num
ber
of M
iles
Saul and Roman are riding mini bikes at a constant speed. Saul’s speed can be described using the
Real World
Math in the
Solution
Look Back and Explain
Make a Plan
Unpack the Problem
21209—Focused Mathematics—Student Guided Practice Book
© Teacher Created Materials
Name: _____________________________________________________________________ Date: _________________________
Lesson
8
60
Saul and Roman are riding mini bikes at a constant speed. Saul’s speed can be described using the represents the number of miles.
Roman’s speed can be described with the graph below. Use the slope to explain who is going faster.
© Teacher Created Materials
Reflection
1 Explain how unit rate and slope represent proportional relationships.
__________________________________________________________________________________
__________________________________________________________________________________
__________________________________________________________________________________
__________________________________________________________________________________
__________________________________________________________________________________
__________________________________________________________________________________
__________________________________________________________________________________
__________________________________________________________________________________
__________________________________________________________________________________
__________________________________________________________________________________
2 Would you rather use a table, an equation, or a graph to determine unit rate?
Explain your preference.
__________________________________________________________________________________
__________________________________________________________________________________
__________________________________________________________________________________
__________________________________________________________________________________
__________________________________________________________________________________
__________________________________________________________________________________
__________________________________________________________________________________
__________________________________________________________________________________
__________________________________________________________________________________
__________________________________________________________________________________
© Teacher Created Materials
21209—Focused Mathematics—Student Guided Practice Book
Name: _____________________________________________________________________ Date: _________________________
Lesson
8
61
117
Slope and Unit Rate (cont.)
Warm-Up min.
1. Before class, prepare index cards with the following scenarios: 12 gallons of gas costs
$49.80; 7 sandwiches costs $41.65; 25 pencils costs $7.00; 4 adult admission tickets to an
amusement park costs $66.00. Distribute cards to students and have them find the cost
of one of the items on their card. For example, if 12 gallons of gas costs $49.80, how
much does one gallon cost?
2. Have a student from each scenario explain how they found the unit rate and show their
work on the board.
Language and Vocabulary min.
1. Write the following vocabulary words on the board:
unit rate proportional relationship slope
rate of change slope-intercept form
2. Remind students that the Warm-Up involved finding unit rates, a ratio of two
measurements in which the second term is one. Tell them that a rate shows a
proportional relationship, a relationship where one variable directly affects the other.
For example, as the number of tickets purchased for an amusement park increases, the
amount of money increases at the same rate.
3. Say, “In this lesson, you will learn about the slope of a graph, which is also known as
the unit rate or rate of change. We will be graphing proportional relationships and
identifying the slope (unit rate).”
4. Tell students that equations that show proportional relationships are in slope-intercept
form which is written as y = mx + b, in which m is the slope and b is the y-intercept.
Warm-Up Before class, prepare index cards with the following scenarios: 12 gallons of gas costs
$49.80; 7 sandwiches costs $41.65; 25 pencils costs $7.00; 4 adult admission tickets to an
amusement park costs $66.00. Distribute cards to students and have them find the cost
of one of the items on their card. For example, if 12 gallons of gas costs $49.80, how
much does one gallon cost?
Have a student from each scenario explain how they found the unit rate and show their
work on the board.
Language and Vocabulary
Write the following vocabulary words on the board:
unit rate proportional relationship slope
Remind students that the Warm-Up involved finding
measurements in which the second term is one. Tell them that a rate shows a
proportional relationship
For example, as the number of tickets purchased for an amusement park increases, the
amount of money increases at the same rate.
Say, “In this lesson, you will learn about the
the unit rate or
identifying the slope (unit rate).”
Tell students that equations that show proportional relationships are in
form which is written as
Warm-Up 1.
2.
Language and Vocabulary
1.
2.
3.
4. form
21200—Focused Mathematics Intervention Level 8—Teacher’s Guide © Teacher Created Materials
Lesson
8
118
21200—Focused Mathematics Intervention Level 8—Teacher’s Guide © Teacher Created Materials
Lesson
8 Slope and Unit Rate (cont.)Whole-Group Lesson (cont.) 1. Refer students to the Miles per Minute activity sheet (Student Guided Practice Book,
page 55). Say, “Let’s look at another situation involving a proportional relationship.
First, we will look at the situation: The equation describing the motion of a race car is
given by y = 3x, where x is the number of minutes and y is the number of miles.”
2. Tell students that in this situation, the slope represents how fast the car goes.
Have students help create a table to determine coordinate points to graph the
proportional relationship.
Number of Minutes (x) Number of Miles (y)00132639
3. Draw a pair of axes. Ask four students to come up and plot the coordinate points on
the graph. Label the x-axis Minutes and the y-axis Miles. The graph should look like
the following:
11
10
9
8
7
6
5
4
3
2
1
0 1 2 3 4 5 6 7 8 9 10
y
xMinutes
Mile
s
1. 1. 1. 1. 1. We Do
y = 3x
120
© Teacher Created Materials 21200—Focused Mathematics Intervention Level 8—Teacher’s Guide
Lesson
8Slope and Unit Rate (cont.)
Whole-Group Lesson min.
Focus 1. The following lesson will address this focus question:
How can you use the unit rate to express the slope of the graph of a proportional
relationship?
2. You may wish to write the focus question on the board and read it aloud to students.
Explain that you will revisit the focus question at the end of the lesson.
1. Say, “Today, we are going to use real-world situations to look at proportional
relationships. Let’s look at an example: Ashley is selling pies to earn money for college.
For every pie she sells, she earns $2.00. Graph the relationship of pies and money
earned. Ask students to help you complete the table of values and graph the line.
Discuss why the x-axis should be labeled as Number of pies and the y-axis as Dollars
(dependent versus independent variables).
y = 2x
8
7
6
5
4
3
2
1
Number of Pies
Dol
lars
1 2 3 4
x y
0 0
1 2
2 4
3 6
4 8•
•
•
•
•
2. Ask students how much she earns from selling one pie. ($2.00) Tell students that the
cost of one pie is the unit rate. Show students where they can find the unit rate on the
graph, and remind them that it is called the slope of the graph.
3. Say, “Both the table and graph show the proportional relationship of pies and money
earned.” Show students how to read the graph. For example, tell students that
from the graph, we can see that selling three pies earns her $6.00. Point out where
these values are found on the table. Ask a student how much she earns from two
pies. ($4.00)
4. Show students that you can rewrite 63 as 2
1 . Tell students that every point on the line
will have a unit rate of 2. Ask students to identify another point on the line and find
the unit rate. Students should see that the slope of the line is 21 .
1. 1. 1. 1. I Do
119
21200—Focused Mathematics Intervention Level 8—Teacher’s Guide © Teacher Created Materials
Lesson
8 Slope and Unit Rate (cont.)
Math in the Real World min. 1. Refer students to the Math in the Real World: Mini Bikes task (Student Guided Practice Book, page 60). Have a student read the task aloud. Tell students to explain or summarize the task to their partner. Have a few students share their summaries. 2. Ask students to think about what information they will need to solve the task and what the task is asking them to do. Then, have them share with a partner. Ask a few students to share aloud. Students should identify that Saul and Roman are riding mini bikes at a constant speed. Saul’s speed can be described using the equation y = 15x, where x represents the number of hours and y represents the number of miles. Roman’s speed can be described using a graph. We need to find out who is traveling faster. Have students work in groups of two or three to complete the task.
3. As students are working, circulate and ask focusing, assessing, and advancing questions: • How do you recognize the slope from the equation? • How do you recognize the slope from the graph? • How do you know who is going faster?
Sentence Frames for Explaining Reasoning • Saul/Roman is going faster because _____. • The slope of the graph is _____. • The slope of the equation is _____. 4. Observe how students are solving the task and choose a few groups who solved the task in different ways to share their solutions and reasoning. For example, have students who graphed the equation and compared it to Roman’s graph share first. Then, have students who identified the slope by looking at the graph and compared it to Saul’s equation present next. Make sure students explain their reasoning as they are sharing their solutions. 5. As groups are sharing their solution paths, reasoning, and strategies, ask questions: • How can you explain the unit rates using the slope?
• Which method of displaying the rate makes the most sense to you? Why?
Lesson Reflection min. Have students reflect on their learning by answering the two questions about slope and unit rate on the Reflection activity sheet (Student Guided Practice Book, page 61).
124
© Teacher Created Materials 21200—Focused Mathematics Intervention Level 8—Teacher’s Guide
Lesson
8
Extend Learning
Show students the equation y = -3x. Ask students what they think a negative unit
rate means if x were a number of football plays and y were a number of yards. Tell
students that the negative would indicate that the yards were lost. Then, have students
complete the Lesson 8 Extend Learning Task (filename: extendtask8.pdf).
Slope and Unit Rate (cont.)
Differentiated Instruction min.
Gather students for reteaching. The remaining students will complete the Independent
Practice activity sheet (Student Guided Practice Book, page 59) to reinforce their learning
and then play the Math Fluency Games.
Refocus PPT
Revisit the focus question for the lesson: How can you use the unit rate to express the slope
of the graph of a proportional relationship? Say, “Let’s look at another example: Sarai is
reading a book for English class. She has decided to read 6 pages per day until the book is
finished.” Draw an x- and y-axis, labeling the x-axis Days and the y-axis Number of Pages.
Ask students to determine the unit rate. (6 pages per day) Show students how to graph 6
pages for day one. Ask students how many pages she will have read after two days.
(12 pages) Show students how to graph 12 pages for day two. Ask students how many
pages she will have read after three days. (18 pages) Have a student plot the point on the
graph that shows 18 pages in three days.
Finally, support students as they complete Question 1 on the Refocus activity sheet
(Student Guided Practice Book, page 58), and then have them solve Question 2
independently.
Digital Math Fluency Games
Math Fluency Game Sets
CARDSHERECARDSHERECARDSHERECARDSHERESPACES
GO BACKSPACES
GO BACK
SPACES
MOVE AHEAD
SPACES
MOVE AHEAD
SPACES
GO BACK
SPACES
GO BACK
STUCK!STUCK!
LOSE YOUR
NEXT TURNLOSE YOUR
NEXT TURN
STUCK!STUCK!
LOSE YOUR
NEXT TURNLOSE YOUR
NEXT TURN
STUCK!STUCK!
LOSE YOUR
NEXT TURNLOSE YOUR
NEXT TURN
HEREHEREHERECARDSCARDSHERE
SPACES
GO BACK
Math Fluency Games
123
RESEARCH
33
HOW TO USE THIS PRODUCTTeaching a Lesson
21200—Focused Mathematics Intervention Level 8—Teacher’s Guide © Teacher Created Materials
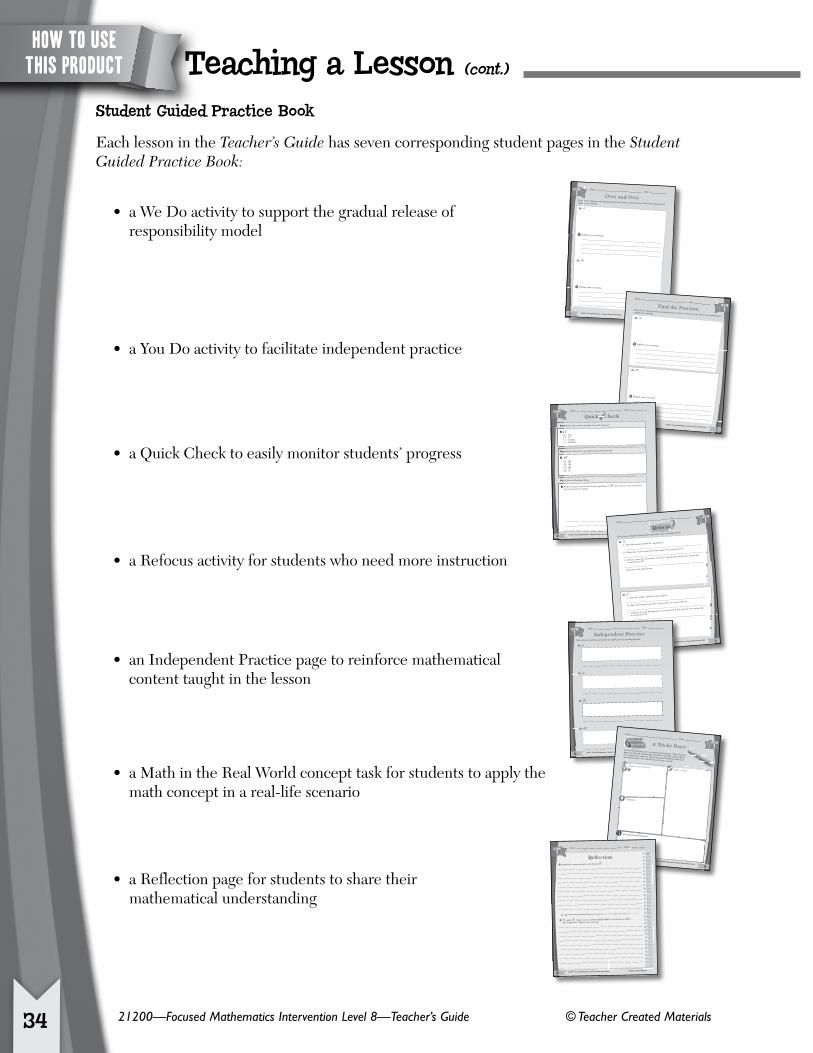
Student Guided Practice Book
Each lesson in the Teacher’s Guide has seven corresponding student pages in the Student Guided Practice Book:
• a We Do activity to support the gradual release of responsibility model
• a You Do activity to facilitate independent practice
• a Quick Check to easily monitor students’ progress
• a Refocus activity for students who need more instruction
• an Independent Practice page to reinforce mathematical content taught in the lesson
• a Math in the Real World concept task for students to apply the math concept in a real-life scenario
• a Reflection page for students to share their mathematical understanding
Name: _________________________________________________ Date: _________________Over and Over
Directions: Express each repeating decimal as a fraction in lowest terms. Show your equations and explain your reasoning.
1 0.3
Explain your reasoning.
_____________________________________________________________________________ _____________________________________________________________________________ _____________________________________________________________________________ _____________________________________________________________________________
2 0.76
Explain your reasoning.
_____________________________________________________________________________ _____________________________________________________________________________ _____________________________________________________________________________ _____________________________________________________________________________
21209—Focused Mathematics—Student Guided Practice Book © Teacher Created Materials
Name: _____________________________________________________________________ Date: _________________________Lesson
1
6
Name: _________________________________________________ Date: _________________Find the Fraction Directions: Express each repeating decimal as a fraction in lowest terms. Show your equations and
explain your reasoning.
1 0.6
Explain your reasoning. _____________________________________________________________________________ _____________________________________________________________________________ _____________________________________________________________________________ _____________________________________________________________________________
2 0.72
Explain your reasoning. _____________________________________________________________________________ _____________________________________________________________________________ _____________________________________________________________________________ _____________________________________________________________________________
© Teacher Created Materials 21209—Focused Mathematics—Student Guided Practice Book
Name: _____________________________________________________________________ Date: _________________________Lesson
1
7
Name: _________________________________________________ Date: _________________
Quick Check
Directions: Choose the equivalent form of the decimal.
1 0.56 A 0.56 B 5.6 C 0.56666… D 0.565656…
Directions: Choose the equivalent fraction of the decimal.
2 0.53
A 53100
B 5399
C 54101
D 12
Directions: Solve the problem.
3 Find the fraction in lowest terms that is equivalent to 0.84. Show all your work, and explain
how you found your solution.
_____________________________________________________________________________
_____________________________________________________________________________
_____________________________________________________________________________
Directions:
1 0. A B C D
Directions:
2 0.
A B C D
Directions:
3
21209—Focused Mathematics—Student Guided Practice Book © Teacher Created Materials
Name: _____________________________________________________________________ Date: _________________________Lesson
1
8
Name: _________________________________________________ Date: _________________
Refocus
Directions: Find the fraction that is equivalent to the repeating decimal.
1 0.2
A. Write the number without the repeating bar.
_____________________________________________________________________________
B. What is the fraction equivalent of the number you wrote in Part A?
_____________________________________________________________________________
C. Subtract 1 from the denominator you wrote in Part B and write the new fraction that
is equivalent to 0.2.
_____________________________________________________________________________
Check your work using division.
2 0.8
A. Write the number without the repeating bar.
_____________________________________________________________________________
B. What is the fraction equivalent of the number you wrote in Part A?
_____________________________________________________________________________
C. Subtract 1 from the denominator you wrote in Part B, and write the new fraction that
is equivalent to 0.8.
_____________________________________________________________________________
Check your work using division.
© Teacher Created Materials 21209—Focused Mathematics—Student Guided Practice Book
Name: ______________________________________________________
_______________ Date: _________________________ Lesson
1
9
Name: _________________________________________________ Date: _________________
Independent PracticeDirections: Find the fraction that is equivalent to the repeating decimal.
1 0.7
_____________________________________________________________________________
2 0.4
_____________________________________________________________________________
3 0.35
_____________________________________________________________________________
4 0.18
_____________________________________________________________________________
21209—Focused Mathematics—Student Guided Practice Book © Teacher Created Materials
Name: _____________________________________________________________________ Date: _________________________Lesson
1
10
Name: _________________________________________________ Date: _________________
Solution
Look Back and Explain
Make a Plan
Unpack the Problem
Real World
Math in the
A Tricky Party Louis and Elena had a party to celebrate their birthdays. They decided to have some fun with their friends and told them that they could each have 0.1 of a submarine sandwich. How many pieces should their friends cut the sandwich into so they will each have the same amount?
A Tricky Party Louis and Elena had a party to celebrate their birthdays. They decided to have some fun with their friends and told them that they could each have
© Teacher Created Materials 21209—Focused Mathematics—Student Guided Practice Book
Name: _____________________________________________________________________ Date: _________________________Lesson
1
11
Name: _________________________________________________ Date: _________________
Reflection 1 Explain the connection between 0.46 and 0.46.
__________________________________________________________________________________
__________________________________________________________________________________
__________________________________________________________________________________
__________________________________________________________________________________
__________________________________________________________________________________
__________________________________________________________________________________
__________________________________________________________________________________
__________________________________________________________________________________
__________________________________________________________________________________
__________________________________________________________________________________
2 511 equals 0.45. Suppose you needed to find 5
11 of $90.00. Could you use 0.45 in
the computation? Explain your reasoning.
__________________________________________________________________________________
__________________________________________________________________________________
__________________________________________________________________________________
__________________________________________________________________________________
__________________________________________________________________________________
__________________________________________________________________________________
__________________________________________________________________________________
__________________________________________________________________________________
__________________________________________________________________________________
21209—Focused Mathematics—Student Guided Practice Book © Teacher Created Materials
Name: _____________________________________________________________________ Date: _________________________Lesson
1
12
RESEARCH
34
HOW TO USE THIS PRODUCT Teaching a Lesson (cont.)

© Teacher Created Materials 21200—Focused Mathematics Intervention Level 8—Teacher’s Guide
When planning the pacing of a curriculum program, analyze student data to determine standards on which to focus . Once a pacing plan is selected or created based on known needs of the students and/or the results of the Pretest, teachers can focus on the lessons that correlate with the items for which students did not demonstrate mastery . The Pretest is designed to determine which concepts students have already mastered and which concepts need to be mastered . Teachers can use this information to choose which lessons to cover and which lessons to skip . Even after making these data-driven decisions, teachers may still have to accelerate or decelerate the curriculum in order to meet the needs of the students in their classes . The following are a few easy ways to change the pace of the curriculum within a whole-class setting .
Ways to Accelerate the Curriculum:
• Certain mathematical concepts may come more easily to some students . If this is the case, allow less time for the practice and application of those skills and move on to the next lesson in the program .
• Skip those lessons or concepts for which students have demonstrated mastery on the Pretest .
• Reduce the number of activities that students complete in the Student Guided Practice Book.
Ways to Decelerate the Curriculum:
• If the concepts in a particular lesson are very challenging to the students, allow more time for each component of the lesson: modeling, guided practice, independent practice, and application games and activities .
• Use more pair or group activities to allow students to learn from one another while reinforcing their understanding of the concepts .
• Review Quick Check pages with students and have them resolve incorrect items .
The following pacing plans show three options for using this complete kit . Teachers should customize these pacing plans according to their students’ needs .
Option Instructional Time Frequency Material Notes
Option 1 6 weeks (2 hours/day) Daily 30 lessons All lessons covered
Option 2 4 weeks (2 hours/day) Daily 20 lessons 20 key lessons covered
Option 3 24 weeks (60 min ./day) Twice a week 24 lessons 24 key lessons covered
Note: To further adapt the program to instructional time frames, it is highly recommended that teachers give the Pretest (Assessment Guide, pages 19–30) to determine which standards students have not mastered . Teachers can then use the Pretest Item Analysis to analyze their students’ results and select lessons to target .
41
planning for interventionPacing Plans

© Teacher Created Materials 21200—Focused Mathematics Intervention Level 8—Teacher’s Guide
Lesson
13Definition of Function
Materials • Student Guided Practice
Book (pages 90–96)
• Math Fluency Game Sets
• Digital Math Fluency Games
• sticky notes
• chart paper
• markers
• grid paper
Student MisconceptionsStudents often believe that any equation in two variables is a function . Sometimes students generalize the vertical line test to a “horizontal line” test, mistakenly believing that the graph of a function cannot be crossed more than once by a horizontal line . It is crucial that students understand that a relation that has no repeated x-coordinates is a function . Then, by investigating graphs of equations that are functions and equations that are not functions, students can see that having a relation that has no repeated x-coordinates will pass the vertical line test .
Learning ObjectivesFunctions
• Understand that a function is a rule that assigns to each input exactly one output . The graph of a function is the set of ordered pairs consisting of an input and the corresponding output .
Mathematical Practices and Processes
• Reason abstractly and quantitatively .
• Construct viable arguments and critique the reasoning of others .
• Attend to precision .
• Look for and make use of structure .
Progress MonitoringThe Student Guided Practice Book pages below can be used to formally and informally assess student understanding of the concepts .
Name: _________________________________________________ Date: _________________
21209—Focused Mathematics—Student Guided Practice Book © Teacher Created Materials
Name: ______________________________________________________
_______________ Date: _________________________
Yes or No?
Directions: Determine whether each table, set of ordered pairs, or graph represents a function.
Explain your reasoning.
1 A. x y
1 3
5 11
7 17
B. {(3, 8), (5, 8), (7, 8)} C. y
x
Is it a function?
NoYes
Is it a function?
NoYes
Explain your reasoning.
Is it a function?
NoYes
_____________________________________________________________________________
_____________________________________________________________________________
_____________________________________________________________________________
2 A. x y
-1 1
-4 16
-1 4
B. {(-3, 4), (-5, 6), (-7, 8)} C. y
x
Is it a function?
NoYes
Is it a function?
NoYes
Explain your reasoning.
Is it a function?
NoYes
_____________________________________________________________________________
_____________________________________________________________________________
_____________________________________________________________________________
Lesson
13
90
Name: _________________________________________________ Date: _________________Quick CheckDirections: Select all correct answers.
1 Which relation is not a function? A {(5, 1), (-2, 7), (3, 7)}B x y
-3 92 23 9
C y
x
D All of these are functions.
2 Which relation is a function? A {(5, 1), (-5, 7), (5, -7)}B x y
-3 92 4
-3 -9C y
x
D None of these are functions.Directions: Solve the problem.
3 Make a table that represents a function, write a set of ordered pairs that represents a function, and sketch a graph that does not represent a function. Explain your answers.
y
x
________________________________________________________________________________ ________________________________________________________________________________21209—Focused Mathematics—Student Guided Practice Book
© Teacher Created Materials
Name: _____________________________________________________________________ Date: _________________________
Lesson
13
92
Name: _________________________________________________ Date: _________________
© Teacher Created Materials 21209—Focused Mathematics—Student Guided Practice Book
Name: _____________________________________________________________________ Date: _________________________
Function? Directions: Determine whether each table, set of ordered pairs, or graph represents a function. Explain your reasoning.
1 A. x y
1 3
1 11
17 17
B. {(3, 2), (5, -2), (-6, 2)} C. y
x
Is it a function?
NoYes
Is it a function?
NoYes
Explain your reasoning.
Is it a function?
NoYes
_____________________________________________________________________________
_____________________________________________________________________________
_____________________________________________________________________________
2 A. x y
-3 4
1 4
3 4
B. {(5, 9), (-5, 9), (-6, 8)} C. y
x
Is it a function?
NoYes
Is it a function?
NoYes
Explain your reasoning.
Is it a function?
NoYes
_____________________________________________________________________________
_____________________________________________________________________________
_____________________________________________________________________________
Lesson
13
91
Name: ____________________________________
_____________ Date: _________________
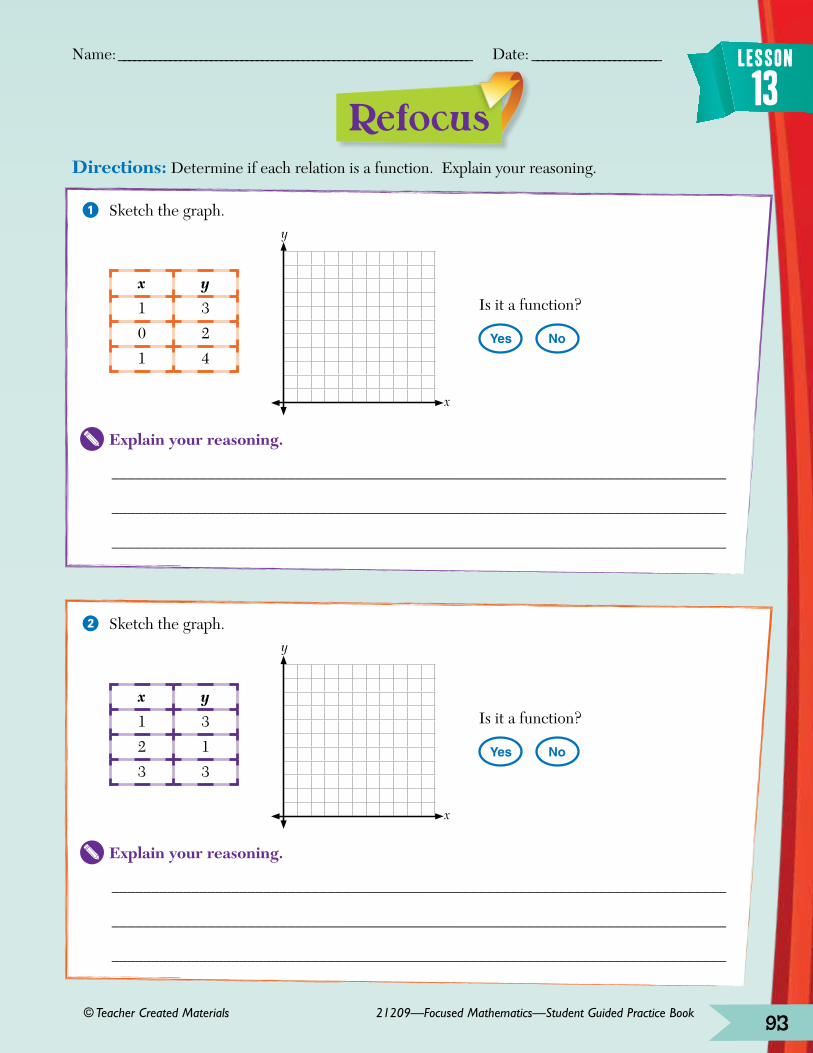
Refocus
Directions: Determine if each relation is a function. Explain your reasoning.
1 Sketch the graph.
x y
1 3
0 2
1 4
y
x
Is it a function?
NoYes
Explain your reasoning.
_____________________________________________________________________________
_____________________________________________________________________________
_____________________________________________________________________________
2 Sketch the graph.
x y
1 3
2 1
3 3
y
x
Is it a function?
NoYes
Explain your reasoning.
_____________________________________________________________________________
_____________________________________________________________________________
_____________________________________________________________________________
© Teacher Created Materials 21209—Focused Mathematics—Student Guided Practice Book
Name: ____________________________________
_________________________________
Date: _________________________ Lesson
13
93
Name: _________________________________________________ Date: _________________
21209—Focused Mathematics—Student Guided Practice Book © Teacher Created Materials
Name: _____________________________________________________________________
Date: _________________________
Independent Practice
Directions: Determine if each relation is a function. Explain your reasoning.
1 x y
-3 -1
1 3
6 9
Explain your reasoning.
_____________________________________________________________________________
_____________________________________________________________________________
_____________________________________________________________________________
2 (4, 3), (4, 6), (-4, -3)
Explain your reasoning.
_____________________________________________________________________________
_____________________________________________________________________________
_____________________________________________________________________________
3
Z
Explain your reasoning.
_____________________________________________________________________________
_____________________________________________________________________________
_____________________________________________________________________________
Lesson
13
94
Name: _________________________________________________ Date: _________________
Solution
Look Back and Explain
Make a PlanUnpack the Problem
Real WorldMath in the
Functional Alphabet Jarod and Jennie are drawing the capital letters of the alphabet on coordinate planes. Jarod told Jennie that only about 40% of the letters are functions. Do you agree with Jarod? Explain your reasoning.
© Teacher Created Materials 21209—Focused Mathematics—Student Guided Practice Book
Name: _____________________________________________________________________ Date: _________________________Lesson
13
95
Name: _________________________________________________ Date: _________________Reflection 1 Explain how you can determine whether a relation is a function.
__________________________________________________________________________________
__________________________________________________________________________________
__________________________________________________________________________________
__________________________________________________________________________________
__________________________________________________________________________________
__________________________________________________________________________________
__________________________________________________________________________________
__________________________________________________________________________________
__________________________________________________________________________________
__________________________________________________________________________________
2 Do you think it is possible to find a rule for a table that would not define a function?
Explain your reasoning.__________________________________________________________________________________
__________________________________________________________________________________
__________________________________________________________________________________
__________________________________________________________________________________
__________________________________________________________________________________
__________________________________________________________________________________
__________________________________________________________________________________
__________________________________________________________________________________
__________________________________________________________________________________
__________________________________________________________________________________
21209—Focused Mathematics—Student Guided Practice Book
© Teacher Created Materials
Name: _____________________________________________________________________ Date: _________________________
Lesson
13
96
157

Definition of Function (cont.)
Warm-Up min.
1 . Before class, prepare six posters: three with the charts below and three with the graphs of the ordered pairs on the chart . Label the tables A, B, C and the graphs D, E, F . Do not label charts and graphs in the same order .
x y x y x y-2 3 2 4 4 -20 1 0 0 1 11 -1 1 2 4 2
2 . Put students in groups of three or four . Give each group three sticky notes . Ask each group to match the table with its graph and write the letters on a sticky note .
3 . When students have finished, ask a student to explain the group’s answer . Continue with two more students . If students disagree on choices, ask a student with a different answer to explain . Have the class discuss the correct answer .
Language and Vocabulary min. 1 . Write the following vocabulary words on the board:
x-coordinate y-coordinate input output function vertical line test
2 . Tell students that the input is the x-coordinate and the output is the y-coordinate . Ask students to identify the inputs and outputs from the Warm-Up tables .
3 . Ask students to write the ordered pairs for one of the tables . Tell them that today they are going to look at special relations called functions . A function has no repeated x-coordinates . Ask students to identify the tables from the Warm-Up that are functions . Ask why the third table does not represent a function .
4 . Have students compare the graphs and see what the repeated x-coordinate does to the graph . They should see that two of the points lie on a vertical line . Explain that a function will never contain points that lie on a vertical line—this is called the vertical line test . Have students explain why the first two tables pass the vertical line test .
21200—Focused Mathematics Intervention Level 8—Teacher’s Guide © Teacher Created Materials
Lesson
13
158

© Teacher Created Materials 21200—Focused Mathematics Intervention Level 8—Teacher’s Guide
Lesson
13Definition of Function (cont.)
Whole-Group Lesson min.
Focus 1 . The following lesson will address this focus question:
How can you determine if a relation is a function by looking at its graph, a set of ordered pairs, or a table of its values?
2 . You may wish to write the focus question on the board and read it aloud to students . Explain that you will revisit the focus question at the end of the lesson .
1 . Say, “Today, we are going to use tables and graphs to investigate functions . Let’s look at an example .” Write a table on the board with input 2, 7, 9, and output 4, 9, 11 . Label the input column x and the output column y . Ask students if the ordered pairs on the table represent a function . They should see that there are no repeated input (x) values, so the relation is a function . Have a student graph the relation on a grid on the board . Ask the class to explain how the graph demonstrates that the relation is a function .
2 . Show students the ordered pairs (1, 1) (9, -3), (9, 3) . Ask students if the ordered pairs represent a function . They should see that there are repeated input (x) values, so the relation is not a function . Ask the class to predict how the graph will demonstrate that the relation is not a function . (There will be two points on the same vertical line.) Ask a student to graph the points .
3 . Show students a table with input 2, 3, 4, 5 and output 4, 1, 1, 3 . Ask students if the ordered pairs represent a function . Students may disagree, so ask a student to graph the points . When the points are graphed, ask if the graph passes the vertical line test . (Yes.) Point out that the repeated y-coordinates cause two points to lie on a horizontal line . The horizontal line does not indicate whether or not the relation is a function .
4 . Show students a circle on a grid . Ask them to explain why it is or is not a function . Ask them to describe the repetitions they would find in the input column of the table . Draw a sideways S on a grid . Ask them to explain why it is or is not a function . Ask them to describe the repetitions they would find in the input column of the table .
I Do
159

21200—Focused Mathematics Intervention Level 8—Teacher’s Guide © Teacher Created Materials
Lesson
13 Definition of Function (cont.)
Whole-Group Lesson (cont.)
1 . Refer students to the Yes or No? activity sheet (Student Guided Practice Book, page 90) . Say, “Let’s look at more examples of relations . Look at the table in the first problem . What should you look at to determine if the relation shown in the table is a function?” Students should say that they need to look at the first column, the x-coordinates . Ask students how the input determines whether or not the relation is a function . Students should notice that there are no repeated numbers in the x column, so the relation is a function . Ask students to change one number on the table so it is not a function . Students should suggest that a number in the x column should be changed so that it is the same as one of the other numbers in the column . Ask students if the table would still represent a function if you changed the 11 in the y column to a 3 . Students should recognize that repeated numbers in the y column do not determine whether or not a relation is a function .
2 . Now, look at the set of ordered pairs . Say, “What do you look at to determine if the relation is a function?” Students should respond that you look at the x-coordinates . Ask if the relation is a function . (Yes.) They should recognize that there are no repeated x-coordinates .
3 . Ask students to look at the graph . Ask how they can determine if it is a function . If necessary remind students of the vertical line test . Ask if they can draw a vertical line that crosses the graph more than once . (No.) Have students discuss why this is the same as having repeated x-coordinates. Students should recognize that all points on a vertical line have the same x-coordinate .
We Do
160
© Teacher Created Materials 21200—Focused Mathematics Intervention Level 8—Teacher’s Guide
Lesson
13Definition of Function (cont.)
Whole-Group Lesson (cont.)
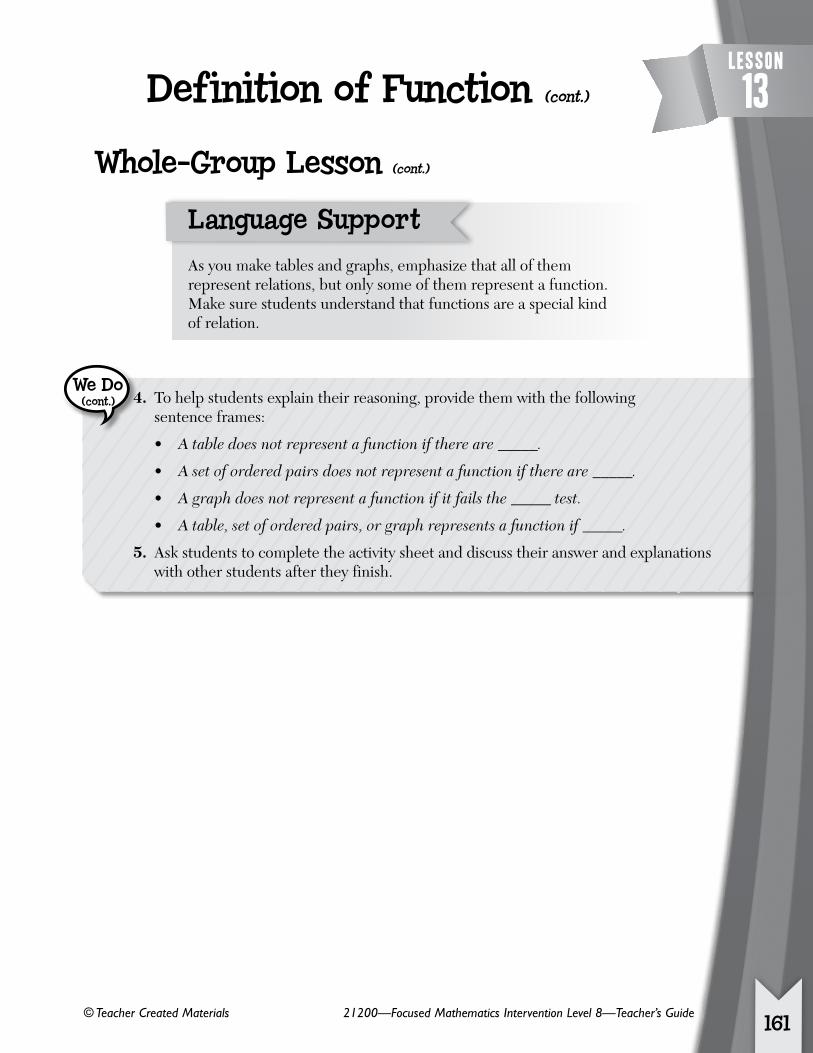
4 . To help students explain their reasoning, provide them with the following sentence frames:
• A table does not represent a function if there are _____.
• A set of ordered pairs does not represent a function if there are _____.
• A graph does not represent a function if it fails the _____ test.
• A table, set of ordered pairs, or graph represents a function if _____.
5 . Ask students to complete the activity sheet and discuss their answer and explanations with other students after they finish .
We Do(cont.)
Language Support
As you make tables and graphs, emphasize that all of them represent relations, but only some of them represent a function . Make sure students understand that functions are a special kind of relation .
161
21200—Focused Mathematics Intervention Level 8—Teacher’s Guide © Teacher Created Materials
Lesson
13 Definition of Function (cont.)
Whole-Group Lesson (cont.)
1 . Refer students to the Function? activity sheet (Student Guided Practice Book, page 91) . Provide the sentence frames from Step 4 of the We Do section to help students explain their reasoning .
2 . Have students share their answers and reasoning . If students have difficulty explaining their reasoning, remind them to use the sentence frames and vocabulary words . For example, have students explain why a relation is not a function .
Closing the Whole-Group LessonRevisit the focus question for the lesson: How can you determine if a relation is a function by looking at its graph, a set of ordered pairs, or a table of its values? Ask students to discuss how using the vertical line test on a graph and looking for repeated x-coordinates in a set of ordered pairs or in the first column of a table are all checking the same thing . Students should recognize that repeated numbers in the first column of a table or the first coordinate in an ordered pair would be graphed as points on a vertical line .
Progress Monitoring min. 1 . Have students complete the Quick Check activity sheet (Student Guided Practice
Book, page 92) to gauge student progress toward mastery of the Learning Objectives .
2 . Based on the results of the Quick Check activity sheet and your observations during the lesson, identify students who may benefit from additional instruction in the Learning Objectives . These students will be placed into a small group for reteaching . See instructions on the following page .
You Do
162
© Teacher Created Materials 21200—Focused Mathematics Intervention Level 8—Teacher’s Guide
Lesson
13
Extend LearningAsk students to choose a rule to make a table, such as y = 3x . Make a table with three or four values for x. Ask them how to use the table to determine whether the rule defines a function . Have students complete the Lesson 13 Extend Learning Task (filename: extendtask13 .pdf) .
Differentiated Instruction min. Gather students for reteaching . The remaining students will complete the Independent Practice activity sheet (Student Guided Practice Book, page 94) to reinforce their learning and then play the Math Fluency Games .
Refocus PPT
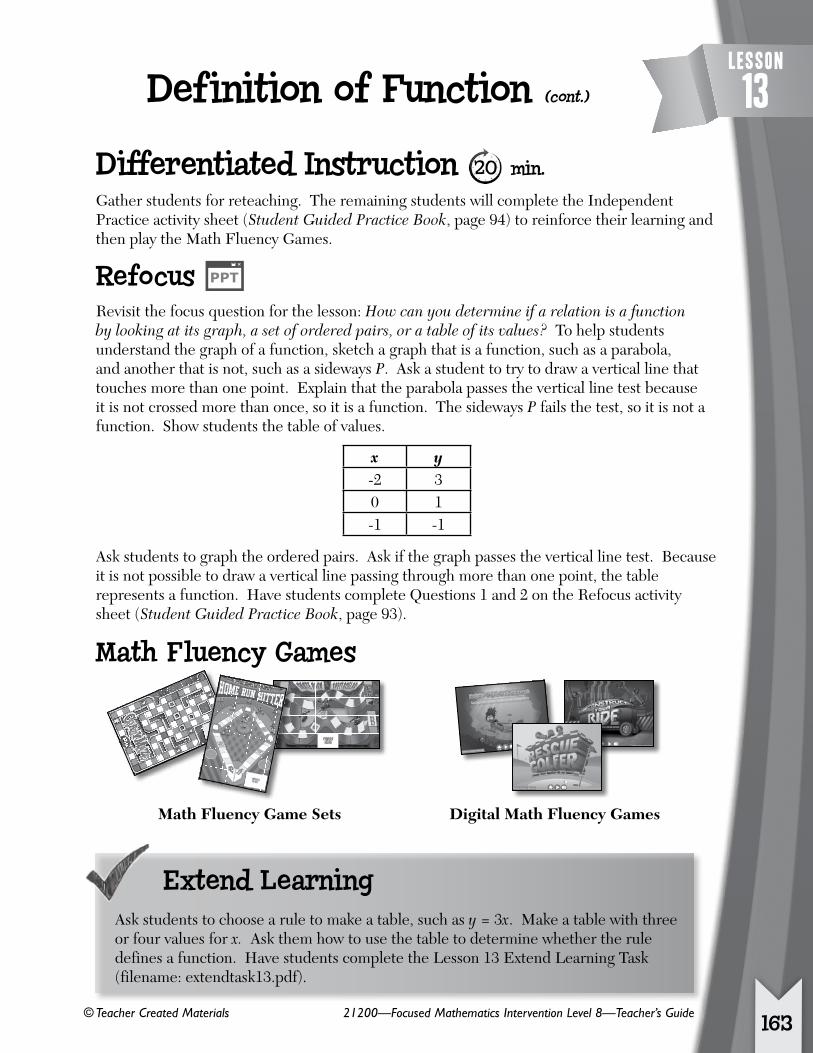
Revisit the focus question for the lesson: How can you determine if a relation is a function by looking at its graph, a set of ordered pairs, or a table of its values? To help students understand the graph of a function, sketch a graph that is a function, such as a parabola, and another that is not, such as a sideways P . Ask a student to try to draw a vertical line that touches more than one point . Explain that the parabola passes the vertical line test because it is not crossed more than once, so it is a function . The sideways P fails the test, so it is not a function . Show students the table of values .
x y-2 30 1-1 -1
Ask students to graph the ordered pairs . Ask if the graph passes the vertical line test . Because it is not possible to draw a vertical line passing through more than one point, the table represents a function . Have students complete Questions 1 and 2 on the Refocus activity sheet (Student Guided Practice Book, page 93) .
Definition of Function (cont.)
Digital Math Fluency GamesMath Fluency Game Sets
CARDSHERECARDSHERECARDSHERECARDSHERE
SPACES
GO BACK
HEREHEREHEREHEREHEREHEREHEREHEREHERECARDSCARDSCARDSCARDSCARDSCARDSCARDSCARDSCARDSCARDSCARDSCARDSCARDSCARDSCARDSCARDSCARDSCARDSCARDSCARDSCARDSCARDSCARDSCARDSCARDSCARDSCARDSCARDSCARDSCARDSCARDSCARDSCARDSCARDSCARDSCARDSCARDSCARDSCARDSCARDSCARDSCARDSCARDSCARDSCARDSCARDSCARDSCARDSCARDSCARDSCARDSCARDSCARDSCARDSCARDSCARDSCARDSCARDSCARDSCARDSCARDSCARDSCARDSCARDSCARDSCARDSCARDSCARDSCARDSCARDSCARDSCARDSCARDSCARDSCARDSCARDSCARDSCARDSCARDSCARDSCARDSCARDSCARDSCARDSCARDSCARDSCARDSCARDSCARDSCARDSCARDSCARDSCARDSCARDSCARDSCARDSCARDSCARDSCARDSCARDSCARDSCARDSCARDSCARDSCARDSCARDSCARDSCARDSCARDSCARDSCARDSCARDSCARDSCARDSCARDSCARDSCARDSCARDSCARDSCARDSCARDSCARDSCARDSCARDSCARDSCARDSCARDSCARDSCARDSCARDSCARDSCARDSCARDSCARDSCARDSCARDSCARDSCARDSCARDSCARDSCARDSCARDSCARDSCARDSCARDSCARDSCARDSCARDSCARDSCARDSCARDSCARDSCARDSCARDSCARDSCARDSCARDSCARDSCARDSCARDSCARDSCARDSCARDSCARDSCARDSCARDSCARDSCARDSCARDSCARDSCARDSCARDSCARDSCARDSCARDSCARDSCARDSCARDSCARDSCARDSCARDSCARDSCARDSCARDSCARDSCARDSCARDSCARDSCARDSCARDSCARDSCARDSCARDSCARDSCARDSCARDSCARDSCARDSCARDSCARDSCARDSCARDSCARDSCARDSCARDSCARDSCARDSCARDSCARDSCARDSCARDSCARDSCARDSCARDSCARDSCARDSCARDSCARDSCARDSHEREHEREHEREHEREHEREHEREHEREHEREHEREHEREHEREHEREHEREHEREHEREHEREHEREHEREHEREHEREHEREHEREHEREHEREHEREHEREHEREHEREHEREHEREHEREHEREHEREHEREHEREHEREHEREHEREHEREHEREHEREHEREHEREHEREHEREHEREHEREHEREHEREHEREHEREHEREHEREHEREHEREHEREHEREHEREHEREHEREHEREHEREHEREHEREHEREHEREHEREHEREHEREHEREHEREHEREHEREHEREHEREHEREHEREHEREHEREHEREHEREHEREHEREHEREHEREHEREHEREHEREHEREHEREHEREHEREHEREHEREHEREHEREHEREHEREHEREHEREHEREHEREHEREHEREHEREHEREHEREHEREHEREHEREHEREHEREHEREHEREHEREHEREHEREHEREHEREHEREHEREHEREHEREHEREHEREHEREHEREHEREHEREHEREHEREHEREHEREHEREHEREHEREHEREHEREHEREHEREHEREHEREHEREHEREHEREHEREHEREHEREHEREHEREHEREHEREHEREHEREHEREHEREHEREHEREHEREHEREHEREHEREHEREHEREHEREHEREHEREHEREHEREHEREHEREHEREHEREHEREHERE
SPACES
GO BACK
SPACES
MOVE AHEAD
SPACES
MOVE AHEAD
SPACES
GO BACK
SPACES
GO BACK
STUCK!STUCK!
LOSE YOUR
NEXT TURNLOSE YOUR
NEXT TURN
STUCK!STUCK!
LOSE YOUR
NEXT TURNLOSE YOUR
NEXT TURN
STUCK!STUCK!
LOSE YOUR
NEXT TURNLOSE YOUR
NEXT TURN
Math Fluency Games
163
21200—Focused Mathematics Intervention Level 8—Teacher’s Guide © Teacher Created Materials
Lesson
13 Definition of Function (cont.)
Math in the Real World min. 1 . Refer students to the Math in the Real World: Functional Alphabet task (Student Guided
Practice Book, page 95) . Have a student read the task aloud . Tell students to explain or summarize the task to their partner . Have a few students share their summaries .
2 . Ask students to think about what information they will need to solve the task and what the task is asking them to do . Then, have them share with a partner . Ask a few students to share aloud . Students should identify that Jarod and Jennie are drawing capital letters of the alphabet on coordinate planes . They need to find out if approximately 40% of the letters are functions . Have students work in groups of two or three to complete the task .
3 . As students are working, circulate and ask focusing, assessing, and advancing questions:
• Is it sufficient to use the vertical line test with just one vertical line?
• How can you tell if the letter passes the vertical line test?
• How can you determine how many letters 10% would be?
Sentence Frames for Explaining Reasoning • I agree/disagree with Jarod because _____.
• The letter _____ is a function because _____.
• The letter _____ is not a function because _____.
4 . Observe how students are solving the task and choose a few groups who solved the task in different ways to share their solutions and reasoning . There may be some disagreements about certain letters, so make sure to allow time for discussion . Make sure students explain their reasoning as they are sharing their solutions .
5 . As groups are sharing their solution paths, reasoning, and strategies, ask questions:
• How can you explain what _____ said in a different way?
• Do you agree or disagree with the reasoning? Why?
• Which solution makes the most sense to you? Why?
Lesson Reflection min. Have students reflect on their learning by answering the two questions about functions on the Reflection activity sheet (Student Guided Practice Book, page 96) .
164
Level 8

Name: _________________________________________________ Date: _________________
21209—Focused Mathematics—Student Guided Practice Book © Teacher Created Materials
Name: _____________________________________________________________________ Date: _________________________
Yes or No? Directions: Determine whether each table, set of ordered pairs, or graph represents a function. Explain your reasoning.
1 A. x y
1 3
5 11
7 17
B. {(3, 8), (5, 8), (7, 8)} C. y
x
Is it a function?
NoYes
Is it a function?
NoYes
Explain your reasoning.
Is it a function?
NoYes
_____________________________________________________________________________
_____________________________________________________________________________
_____________________________________________________________________________
2 A. x y
-1 1
-4 16
-1 4
B. {(-3, 4), (-5, 6), (-7, 8)} C. y
x
Is it a function?
NoYes
Is it a function?
NoYes
Explain your reasoning.
Is it a function?
NoYes
_____________________________________________________________________________
_____________________________________________________________________________
_____________________________________________________________________________
Lesson
13
90

Name: _________________________________________________ Date: _________________
© Teacher Created Materials 21209—Focused Mathematics—Student Guided Practice Book
Name: _____________________________________________________________________ Date: _________________________
Function? Directions: Determine whether each table, set of ordered pairs, or graph represents a function. Explain your reasoning.
1 A. x y
1 3
1 11
17 17
B. {(3, 2), (5, -2), (-6, 2)} C. y
x
Is it a function?
NoYes
Is it a function?
NoYes
Explain your reasoning.
Is it a function?
NoYes
_____________________________________________________________________________
_____________________________________________________________________________
_____________________________________________________________________________
2 A. x y
-3 4
1 4
3 4
B. {(5, 9), (-5, 9), (-6, 8)} C. y
x
Is it a function?
NoYes
Is it a function?
NoYes
Explain your reasoning.
Is it a function?
NoYes
_____________________________________________________________________________
_____________________________________________________________________________
_____________________________________________________________________________
Lesson
13
91

Name: _________________________________________________ Date: _________________
Quick Check
Directions: Select all correct answers.
1 Which relation is not a function? A {(5, 1), (-2, 7), (3, 7)}
B x y
-3 92 23 9
C y
x
D All of these are functions.
2 Which relation is a function? A {(5, 1), (-5, 7), (5, -7)}
B x y
-3 92 4-3 -9
C y
x
D None of these are functions.
Directions: Solve the problem.
3 Make a table that represents a function, write a set of ordered pairs that represents a function, and sketch a graph that does not represent a function. Explain your answers.
y
x
________________________________________________________________________________
________________________________________________________________________________
21209—Focused Mathematics—Student Guided Practice Book © Teacher Created Materials
Name: _____________________________________________________________________ Date: _________________________Lesson
13
92
Name: _________________________________________________ Date: _________________
RefocusDirections: Determine if each relation is a function. Explain your reasoning.
1 Sketch the graph.
x y
1 3
0 2
1 4
y
x
Is it a function?
NoYes
Explain your reasoning.
_____________________________________________________________________________
_____________________________________________________________________________
_____________________________________________________________________________
2 Sketch the graph.
x y
1 3
2 1
3 3
y
x
Is it a function?
NoYes
Explain your reasoning.
_____________________________________________________________________________
_____________________________________________________________________________
_____________________________________________________________________________
© Teacher Created Materials 21209—Focused Mathematics—Student Guided Practice Book
Name: _____________________________________________________________________ Date: _________________________ Lesson
13
93

Name: _________________________________________________ Date: _________________
21209—Focused Mathematics—Student Guided Practice Book © Teacher Created Materials
Name: _____________________________________________________________________ Date: _________________________
Independent PracticeDirections: Determine if each relation is a function. Explain your reasoning.
1 x y
-3 -1
1 3
6 9
Explain your reasoning.
_____________________________________________________________________________
_____________________________________________________________________________
_____________________________________________________________________________
2 (4, 3), (4, 6), (-4, -3)
Explain your reasoning.
_____________________________________________________________________________
_____________________________________________________________________________
_____________________________________________________________________________
3
Z
Explain your reasoning.
_____________________________________________________________________________
_____________________________________________________________________________
_____________________________________________________________________________
Lesson
13
94

Name: _________________________________________________ Date: _________________
Solution
Look Back and Explain
Make a PlanUnpack the Problem
Real WorldMath in the
Functional Alphabet
Jarod and Jennie are drawing the capital letters of the alphabet on coordinate planes. Jarod told Jennie that only about 40% of the letters are functions. Do you agree with Jarod? Explain your reasoning.
© Teacher Created Materials 21209—Focused Mathematics—Student Guided Practice Book
Name: _____________________________________________________________________ Date: _________________________ Lesson
13
95

Name: _________________________________________________ Date: _________________
Reflection 1 Explain how you can determine whether a relation is a function.
__________________________________________________________________________________
__________________________________________________________________________________
__________________________________________________________________________________
__________________________________________________________________________________
__________________________________________________________________________________
__________________________________________________________________________________
__________________________________________________________________________________
__________________________________________________________________________________
__________________________________________________________________________________
__________________________________________________________________________________
2 Do you think it is possible to find a rule for a table that would not define a function? Explain your reasoning.
__________________________________________________________________________________
__________________________________________________________________________________
__________________________________________________________________________________
__________________________________________________________________________________
__________________________________________________________________________________
__________________________________________________________________________________
__________________________________________________________________________________
__________________________________________________________________________________
__________________________________________________________________________________
__________________________________________________________________________________
21209—Focused Mathematics—Student Guided Practice Book © Teacher Created Materials
Name: _____________________________________________________________________ Date: _________________________Lesson
13
96

Assessment Guide
Level 8
Level 8

© Teacher Created Materials 22206—Focused Mathematics—Assessment Guide
Table of ContentsResearch . . . . . . . . . . . . . . . . . . . . . . . . . . . . . . . . . . . . . . . . . . . . . . . . . . . . . . . . . . . . . . . . . . . . . 4
Research on Assessment . . . . . . . . . . . . . . . . . . . . . . . . . . . . . . . . . . . . . . . . . . . . . . . . . . . . . . . . . 4
Why Assessment Is Important . . . . . . . . . . . . . . . . . . . . . . . . . . . . . . . . . . . . . . . . . . . . . . . . . . 4
Understanding Math Content and Practice for Assessment . . . . . . . . . . . . . . . . . . . . . . . . . . 4
Types of Assessment . . . . . . . . . . . . . . . . . . . . . . . . . . . . . . . . . . . . . . . . . . . . . . . . . . . . . . . . . . 5
Using the Assessment Options . . . . . . . . . . . . . . . . . . . . . . . . . . . . . . . . . . . . . . . . . . . . . . . . . . 7
Pretest and Posttest . . . . . . . . . . . . . . . . . . . . . . . . . . . . . . . . . . . . . . . . . . . . . . . . . . . . . . . . . . . . . 7
Pretest and Posttest Item Analysis . . . . . . . . . . . . . . . . . . . . . . . . . . . . . . . . . . . . . . . . . . . . . . 8
Using the Electronic Assessments . . . . . . . . . . . . . . . . . . . . . . . . . . . . . . . . . . . . . . . . . . . . . . . . . . 9
Teacher Interface . . . . . . . . . . . . . . . . . . . . . . . . . . . . . . . . . . . . . . . . . . . . . . . . . . . . . . . . . . . 10
Reporting Options . . . . . . . . . . . . . . . . . . . . . . . . . . . . . . . . . . . . . . . . . . . . . . . . . . . . . . . . . . 11
Types of Assessments . . . . . . . . . . . . . . . . . . . . . . . . . . . . . . . . . . . . . . . . . . . . . . . . . . . . . . . . . . . 12
Performance Tasks . . . . . . . . . . . . . . . . . . . . . . . . . . . . . . . . . . . . . . . . . . . . . . . . . . . . . . . . . . . . . 13
How to Use the Performance Tasks . . . . . . . . . . . . . . . . . . . . . . . . . . . . . . . . . . . . . . . . . . . . 13
Pretest . . . . . . . . . . . . . . . . . . . . . . . . . . . . . . . . . . . . . . . . . . . . . . . . . . . . . . . . . . . . . . . . . . . . . . 19
Posttest . . . . . . . . . . . . . . . . . . . . . . . . . . . . . . . . . . . . . . . . . . . . . . . . . . . . . . . . . . . . . . . . . . . . . 31
Performance Tasks . . . . . . . . . . . . . . . . . . . . . . . . . . . . . . . . . . . . . . . . . . . . . . . . . . . . . . . . . . . 43
Appendix A: References Cited . . . . . . . . . . . . . . . . . . . . . . . . . . . . . . . . . . . . . . . . . . . . . . . . . 60
Appendix B: Answer Keys . . . . . . . . . . . . . . . . . . . . . . . . . . . . . . . . . . . . . . . . . . . . . . . . . . . . . 61
Pretest Answer Key . . . . . . . . . . . . . . . . . . . . . . . . . . . . . . . . . . . . . . . . . . . . . . . . . . . . . . . . . 61
Posttest Answer Key . . . . . . . . . . . . . . . . . . . . . . . . . . . . . . . . . . . . . . . . . . . . . . . . . . . . . . . . 62
Performance Task Rubrics and Answer Keys . . . . . . . . . . . . . . . . . . . . . . . . . . . . . . . . . . . . . 63
Student Guided Practice Book Answer Key . . . . . . . . . . . . . . . . . . . . . . . . . . . . . . . . . . . . . . 73
Appendix C: Assessment Resources Chart . . . . . . . . . . . . . . . . . . . . . . . . . . . . . . . . . . . . . . 100
3

Name: _____________________________________ Date:___________________
© Teacher Created Materials 22206—Focused Mathematics—Assessment Guide Go On
Pretest
1. Don wants to change 0 .7777… into a fraction . What is the equivalent fraction?
A 47
B 57
C 79
D 711
3. Which statement is an incorrect comparison of √5 and √6 ?
A√6 is about 0 .8 larger than √5 .
BThe difference between √5 and √6 is about 0 .2 .
CThe square root of 6 is greater than the square root of 5 .
D√5 and √6 are between the whole numbers 2 and 3 .
2. Which fraction is not a repeating decimal?
A 16
B 19
C 56
D 78
4. Simplify: (62)3
A6 B30
C7,776
D46,656
19

© Teacher Created Materials 22206—Focused Mathematics—Assessment Guide
Part AMrs . Clark has posted questions for her 8th grade math class about rational and irrational
numbers . Tony and Annie are answering the first set of questions .
1. Annie said that √49 and √3 are rational numbers . Is she correct? Explain your thinking .
________________________________________________________________________
________________________________________________________________________
________________________________________________________________________
________________________________________________________________________
________________________________________________________________________
________________________________________________________________________
________________________________________________________________________
2. Tony stated that √2 is an irrational number .
A Locate √2 on the number line .
B How do you know where to place √2 on the number line? Is √2 irrational?
________________________________________________________________________
________________________________________________________________________
________________________________________________________________________
________________________________________________________________________
________________________________________________________________________
________________________________________________________________________
________________________________________________________________________
Name: _____________________________________ Date:___________________
Performance Task 1:Finding Rational Answers
43