by maj theodore a. wilson › dtic › tr › fulltext › u2 › 1013061.pdfpreventive medicine and...
TRANSCRIPT

EVALUATING THE EFFECT OF HOLDING TIME AND STORAGE TEMPERATURE ON
THE CHEMICAL STABILITY OF DRINKING WATER SAMPLES COLLECTED FROM
MILITARY FORWARD DEPLOYED ENVIRONMENTS
by
MAJ Theodore A. Wilson
Thesis submitted to the Faculty of the Preventive Medicine and Biometrics Graduate Program Uniformed Services University of the Health Sciences
In partial fulfillment of the requirements for the degree of Master of Science in Public Health 2013
1

UNIFORMED SERVICES UNIVERSITY, SCHOOL OF MEDICINE GRADUATE PROGRAMS
Graduate Education Office (A 1045), 4301 Jones Bridge Road, Bethesda, MD 20814
FINAL EXAMINATION/PRIVATE DEFENSE FOR THE DEGREE OF MASTER OF SCIENCE IN PUBLIC HEALTH
IN THE PREVENTIVE MEDICINE AND BIOMETRICS GRADUATE PROGRAM
Name of Student: MAJ Theodore Wil son
Date of Examination: April 30, 2013
Time: !000
Place: AFRRI 3176
DECISION OF EXAMINATION COMMfTTEE MEMBERS:
(>~bner ------ P:SS FAIL
DEPARTMENT OF PREVENTIVE MEDICINE AND BIOMETRICS Committee Chairperson
~&.~ K Dr. Christopher A. Gellasch DEPARTMENT OF PREVENTIVE MEDICINE AND BIOMETRICS
=~ationts~~ ~ ---::: - .x
CDR Mich e s Jr. . DEPARTMENT OF PREVENTIVE MEDICINE AND BIOMETRICS Committee Member
A~, BCEE L Water Supply Management-US Army Public Health Command Committee Member
El ea nor S. M etca lf, Ph .D. , Associate Dean /I www.usu hs. m il/graded II gra [email protected] u
Toll Free: 800-772-1747 II Commercial: 301-295-3913 I 9474 II DSN : 295-9474 II Fa x: 301-295-6772
ACKNOWLEDGMENTS
I would like to personally thank those individuals who made this research project a
reality. I would like to thank Dr. Steve Richard, P.E., BCEE and Mr. Art Lundquist, P.E., BCEE
of US Army Public Health Command - Army Institute of Public Health for their belief and trust
in me to complete this research. I would also like to thank them for funding this research. Thank
you both for your support.
Thank you to LTC Alex Stubner, PhD.; LTC Christopher Gellasch, PhD.; CDR
Michael Stevens, PhD.; and Art Lundquist for being on my committee. Thanks to you I am a
much better public health professional.
Thank you to Dr. Chuck Stoner and the staff at the Army Institute of Public Health
Laboratory for your support in preparing and analyzing the water samples. To Dr. Stoner, you
were a wealth of knowledge and helped me to keep everything scientifically sound. To the lab
staff, thank you for the analysis and data mining support you provided during the course of my
research.
I would also like to thank Dr. Cara Olsen, Dr. Roger Gibson, CDR Jennifer Rous, MAJ
Joe Hout, and LCDR Theodore Juarez for your willingness to share and provide guidance on
everything from statistics, proposal structure, and hypothesis development.
Thank you to the Deployment Environmental Surveillance Program staff for providing
me with materials to complete my research, assistance with data mining, and for helping me to
understand the entire OEH process from sample collection to uploading of the analysis results in
to the data repository.
Last but certainly not least I would like to thank my MSPH classmates, MAJ Jason
Krantz, MAJ Erin Johnson-Kanapathy, LT Mark Otto, CAPT Monica Bradley, and CAPT
Korami Dembele. You all were there to relieve the frustration and ensure I enjoyed my time in
graduate school.
3

DEDICATION
The past two years have come and gone and soon we will be on to our next assignment.
A lot has happened over the course of these past two years and we have all grown together. Each
of you has sacrificed so much to see me further my military career and I could not be more
thankful. This accomplishment is not my accomplishment alone, it is our accomplishment. Each
of you has played a vital role in us arriving at this point. It is because of the strength of character
each of you possesses; we have achieved our goal and share in the success. To my wife who
continues to sacrifice her professional career to ensure my success, words cannot express the
gratitude and love I have for you because of what you do for me and our family. Thank you for
being so supportive of my late nights and last minute trips to Aberdeen Proving Ground. To my
children, thank you blessing my life with so much joy and happiness. This degree is an
accomplishment I am so proud to share with each of you.
Love,
Theodore A. Wilson
4

Copyright Statement
The author hereby certifies that the use of any copyrighted material in the thesis manuscript
entitled: Evaluating the Effect of Holding Time and Storage Temperature on the Chemical
Stability of Drinking Water Samples Collected from Military Forward Deployed Environments
is appropriately acknowledged and, beyond brief excerpts, is with the permission of the
copyright owner.
[Signature] 7?.-J£ __ Theodore A. Wilson
5

ABSTRACT
EVALUATING THE EFFECT OF HOLDING TIME AND STORAGE TEMPERATURE ON THE CHEMICAL STABILITY OF DRINKING WATER SAMPLES COLLECTED FROM MILITARY FORWARD DEPLOYED ENVIRONMENTS:
Theodore A. Wilson, MSPH, 2013
Thesis directed by: LTC Christopher A. Gellasch, Ph.D., Assistant Professor, Preventive
Medicine and Biometrics
The US Army Public Health Command-Army Institute of Public Health uses
Environmental Protection Agency (EPA) approved drinking water methods, or in-house
developed and validated screening methods, when analyzing water samples from forward
deployed environments. Each method specifies pre-analytical Maximum Holding Times (MHT)
and storage temperatures for samples. The analytes in this study have MHTs as low as seven
days and as high as 180 days and all require a storage temperature of 4 °C. It is very challenging
for US military forces to meet these guidelines when shipping samples from remote locations to
the US for laboratory analyses. This study investigated the chemical stability of treated water
samples when exceeding the EPA MHT and storage temperature. The compounds studied
included select volatile and semi-volatile organic compounds (VOC and SVOC), Endothall,
Diquat, Paraquat, and Cyanide. Three metals (Antimony, Arsenic, and Mercury) were analyzed
to confirm the EPA recommendation. Contaminant-spiked water samples were stored at 4 °C,
6

25°C, and 39°C and analyzed at pre-determined intervals over 42 days to assess chemical
degradation.
The data from this study indicated that the MHT for the herbicides and some of the select
VOCs and SVOC are stable beyond the current MHTs at each temperature. Chemical stability
varied for individual compounds when exceeding either the MHT, storage temperature, or both.
The metals were all stable throughout the duration of the study. The Cyanide stability was
inconclusive due to matrix interferences. This research may lead to changes in military policy
and be used as a foundational study for other temperature effects, such as a temperature profile,
on stability.
7

TABLE OF CONTENTS
LIST OF TABLES .................................................................................................................. 10
LIST OF FIGURES ...................................................................... .......................................... 11
Chapter 1 - Introduction ..................................................................................................... 1
Background ..................................................................................................................... 1 Military Health Relevance .......................................................................................... ..... 8 Historical Information ................................. .. ............................... ................................. 10 Research Objectives ...................................................................................................... 13
Chapter 2 - Literature Review .......................................................................................... 15
Introduction ... .. ............................................................................................................. 15 Stability Studies - Endothall.. ........................................................................................ 17 Stability Studies - Diquat I Paraquat ...... ...................................................................... 18 Stability Studies -Volatile Organic Compounds ......................... ........................... ....... 20 Stability Study - Semi-Volatile Organic Compounds .................................................... 22 Stability Studies - Cyanide ............................................................................................. 24 Literature Review Summary .................... .. .... .. .............................................................. 25
Chapter 3 - Materials and Methods ................................................................................. 26
Materials .. ...... .. ............................................... .............................................................. 26 Methods .......................................................... .... .......................................................... 29
Chapter 4 - Results and Discussion ................................................................................... 35
Introduction ............................................. ........... .......................................................... 35 Endothall .............. ................. .. ...................................................................................... 37 Diquat/Paraquat ............................................................................................................ 39 Metals ...................................... ........................................................................... .......... 41 voc ................................................................................................................................ 43 svoc .............................................................................................................................. 49 Cyanide .......................................................................................................................... 50 Cyanide Preservative Study .......................................................................................... 52 Summary ....................................................................................................................... 53
Chapter 5 - Conclusion ...... .. .............................................................................................. 55
Significance .................... .. .. ............................. .......... ................. ........................ ........... 57 Future Research ............................................................................................................ 58 Limitations ..... .............................................................................................................. .. 59
REFERENCES ........................................................................ .. ............................................ 61
Appendix A - Graphs with Best-Fit Curves .............. .......................................................... 64
Herbicides ............. .......................................................................................... .............. 64 Metals ....................... .. .................................................................................................. 67 Volatile Organic Compounds ........................................................................................ 70
8

Semi-Volatile Organic Compounds ................. ... ........................................................... 80 Cyanide ............................ .... ...... .. ..... .. .... .. .. .... .. ................. ...................... ...................... 85
Appendix B - Analyte Graphing Data and Mean Percent Recovery ................................. 88
Graphing Data ............................................................................................................... 88
Herbicides ..................................................................................................................... 88 Metals ............................................. ............. ... ... ............................................................ 89 Volatile Organic Compounds ............. ... ..... ................................................................... 90 Semi-Volatile Organic Compounds ............................................................................. . 92 Cyanide ......................................................................................................................... 92
9

LIST OF TABLES
Table 1: EPA MHT, Storage Temperature, and method of analysis for selected constituents ................................................................................................................ 4
Table 2: Target concentration, preservative, and sample analysis points for all analytes used in this study ........................................................................................ 27
Table 3: The Study and EPA MHTs for analytes presented in the study; green, SMHT >EPA MHT; red, SMHT <EPA MHT; white, inconclusive ............................... 37
Table Bl: Data used to create stability graphs ................................................................ 88 Table B2: Endothall mean percent recovery concentration study data .... ........................ 88 Table B3: Diquat I Paraquat mean percent recovery concentration study data ............... 89
Table B4: Metals mean percent recovery concentration study data ............ .................... 89
Table BS: VOC Solvent mean percent recovery concentration study data ...................... 90 Table B6: VOC THM mean percent recovery concentration study data ......................... 91 Table B7: VOC Benzene and Toluene mean percent recovery concentration study
data ............................................................................................................................ 91 Table B8: SVOC mean percent recovery concentration study data ................................. 92 Table B9: Cyanide mean percent recovery concentration study data .............................. 92
10

LIST OF FIGURES
Figure 1: Receipt temperature of treated drinking water samples from OEF, 21 Jan - 28 Dec 2011 .................................................................................................. 5
Figure 2: Depiction of the sample analysis timeline based on 2011 study data ............... 7 Figure 3: Currently used treated drinking water kit .......................................................... 8 Figure 4: Water sampling kit temperature distribution of the 2011 data set
received by AIPH ....................................................................................................... 11 Figure 5: Water sample distribution of the 2011 data set prior to DESP review ............ 12 Figure 6: Water sample distribution of the 2011 data set after DESP review ................. 12 Figure 7: Graph of Endothall stability results over 28 day study period ......................... 38 Figure 8: Graph of Diquat stability results over 42 day study period .............................. 40 Figure 9: Graph of Antimony stability results over 42 day study period ......................... 42 Figure 10: Graph of Bromoform stability results over 42 day study period .................... 44 Figure 11: Graph of Chloroform stability results over 42 day study period .................... 45 Figure 12: Graph of Benzene stability results over 42 day study period ......................... 46 Figure 13: Graph of 1,1,1-Trichloroethane stability results over 42 day study
period . ....................................................................................................................... 47 Figure 14: Graph of Di-n-butylphthalate stability results over 42 day study
period ........................................................................................................................ 49 Figure 15: Graph of CN in DI water stability results over 31 day study period ............... 52 Figure 16: Bar graph of CN in DI water from preservative study ..................................... 53
11

Chapter 1 - Introduction
BACKGROUND
Sustaining the fighting strength of US forces continues to be of the utmost
importance to US military leaders. Maintaining the health of the fighting forces can
provide a strategic advantage in combat. In every US conflict the prevention of disease
and non-battle injuries (DNBI) has been a challenge. In the early 1900's influenza
prevention was a major concern; good personal hygiene was implemented to prevent the
spread of the disease (6). DNBI prevention continues to be a challenge as US forces
deploy to areas of operation that have endemic diseases. But the world has become more
industrialized and new health threats have emerged from toxic industrial chemicals and
materials. Since 1991 the US military has deployed Service Members in various overseas
contingency operations from armed combat to peacekeeping missions. During each of
these operations, US Service Members have been at risk from environmental health
threats. To manage these threats, the Joint Chiefs of Staff (JCS) developed a Force
Health Protection (FHP) strategy to protect the health of Service Members while
deployed. Occupational and Environmental Health (OEH) surveillance is one aspect of
supporting the FHP strategy (16). OEH Surveillance supports the FHP strategy through
environmental monitoring by identifying and documenting OEH hazards, providing risk
assessments and making recommendations to mitigate those risks, and conducting
research to continuously improve protective and preventive measures (16).
Overseas contingency operations represent a particular challenge for the
Department of Defense (DoD) when analyzing OEH samples. Samples collected in
1

overseas theaters of operation are shipped to a DoD analytical lab in either the United
States or Europe. The US Army Public Health Command (USAPHC), Army Institute of
Public Health (AIPH) laboratory, located in Aberdeen Proving Ground, MD, is the
primary lab that routinely receives water samples from deployed preventive medicine
personnel in overseas contingency operations and analyzes the samples to determine if
they contain harmful chemicals of health concern. The type and concentration level of
harmful chemicals are identified from sample results then documented as potential OEH
exposures to Service Members.
The US Environmental Protection Agency (EPA) has established Maximum
Holding Times (MHT) and storage temperatures for environmental samples and
published these guidelines in the Code of Federal Regulations Title 40 Part 141 (40 CFR
141) (8). Many analytes, such as volatile organic compounds (VOC) are temperature
sensitive and are more volatile than other analytes. According to the American Society
for Testing and Materials (ASTM) D4841-88 (2), The Maximum Holding Time (MHT)
is defined as the maximum period of time a properly preserved sample can be stored
before the degradation of the constituent of interest or change in sample matrix occurs
that the systematic error exceeds the 99% confidence interval (not to exceed 15%) of the
test calculated around the mean concentration found at zero time. The EPA methods
provide the standards that need to be met for each individual method of analysis and the
ASTM provides a method to estimate the MHT.
The EPA provides methods of analysis specific for each chemical or class of
chemicals and each method is recognized as the 'gold standard' guideline for water
sample acceptability. The AIPH uses a modified version of some of the EPA methods to
2

meet unique military operations as they relate to OEH sampling and handling conducted
by US military deployed personnel. The modifications are made to address a lower
collection volume or to reduce the time for analysis. While unique military operations
may prevent sample collectors from meeting established EPA requirements for sample
handling as outlined in each method of analysis, USAPHC's modified methods are
intended to be equivalent to the standard methods thus ensuring quality sample collection
and analysis.
Previous work in Afghanistan by Gellasch and Calix (12) underscored the difficulty in
shipping environmental samples with short hold times and low temperature storage
requirements from remote operational locations to a military analytical laboratory within
the recommended EPA Maximum Holding Time (MHT) and storage temperature
guidelines. Table 1 lists the holding times and temperature storage requirements for the
analytes being studied in this research. It has been historically difficult to meet these
guidelines for samples collected at Forward Operating Bases (FOB). These samples must
be transported to an air base in theater before shipment to the analytical lab. The shortest
hold time is immediate for pH, which is often analyzed in the field. The hold time for
other analytes range from 48 hours to 180 days.
In addition to the challenge of meeting the EPA MHT's and storage temperature
requirements, there has been concern over the ability to detect cyanide (CN) in drinking
water samples due to the many interfering constituents associated with CN analysis.
Carbonates, aldehydes, and oxidants such as chlorine are known interferences for CN
recovery from water, according to the OIAl 677 method of analysis (3). US military
forces primarily use chlorine for drinking water disinfection due to its low cost, ease of
3

use, availability, and residual disinfection. Other common interferences are sulfides,
glucose and other sugars, fatty acids, thiocyanate, and other sulfur containing compounds
(4). OIA 1677 suggests using ascorbic acid to reduce the chlorine in samples known or
suspected to contain chlorine, however, USAPHC uses sodium hydroxide (NaOH) as the
preservative in CN collection vials based on ASTM D7365 which states samples must be
analyzed within 24 hours to avoid CN degradation when using ascorbic acid (3).
Analyte EPA MHT (Days) EPA Storage Method of Analysis Temp (0 C)
Endothall 7 4 EPA 548.1
Diquat I Paraquat 7 4 DLS 519 (LC/MS) voe 14 4 EPA 524.2 svoc 14 4 EPA 525.2 Modified Cyanide 14 4 OIA 1677 Mercury 28 Not Specified EPA 200.8 Antimony &
180 Not Specified EPA 200.8
Arsenic *DLS - Directorate Laboratory Sciences; OIA - 01 Analytical
Table 1: EPA MHT, Storage Temperature, and method of analysis for selected constituents.
The primary method of deployment environmental sample cold chain
management is accomplished by using pre-frozen gel packs. Summer temperatures in
deployed areas such as Iraq and Afghanistan often reach temperatures above 45°C and
are a challenge to overcome as the pre-frozen gel packs used for shipping samples are
often not sufficient to maintain the 4 °C temperature requirement for storage and shipment
for the duration of the shipment interval from point of collection to the analytical
laboratory. During the summer months the receipt temperatures are the highest. The
4

most recent data set available for this study contained 224 treated water sampling kits
from various locations in Afghanistan that were involved in Operation Enduring Freedom
(OEF) and received between 21 January 2011 and 28 December 2011 , hereafter to be
referred to as the 2011 data set. Figure 1 illustrates the receipt temperature of drinking
water sampling kits from the 2011 data set received at AIPH.
r---------·---------··------.. - -·----·-----·----··----
2011 Sample Receipt Data 40 ~--
I 35 I •
• • •• •• • • + ~Cll 30 !' . ..... .
I B l5 -1----- -------~·~·~-~·~~•·-++• ..... •- ---+------------~ ......... ... Cll ••• a. • •• • E • + {E. 10 +---------- - -........... - -... ......... ~~...-.......... --------Q. • • • ~ . . . Cll • • ... •
I a: 15 ------+-______._. -------·---·---.. Cll ......... ii + • E * + l'O + • ~10 -1-------,'-----~----
• •
• • • • • + • • • • •• • • + • •
·--- --·-------•
t ... . . 5 ------·---·--+---·-··-·---·---·-··-·---- --·-·----------·-----·----+c-----·---·-----
1 • •• • •
0 i-·------r-·----------·-r--·-·-, ------,--------r-···-----:-~--------·
Nov-10 Jan-11 Feb-11 Apr-11 Jun-11 Jul-11 Sep-11 Nov-11 Dec-11 Feb-12
J _______________________ ~at~-----------------------J
Figure 1: Receipt temperature of treated drinking water samples from OEF, 21 Jan - 28 Dec 2011.
Additionally, sample transportation from the point of collection in the Middle
East or Central Asia to the US involves great distances. Pre-frozen gel packs are often not
sufficient to prevent samples from exceeding the recommended storage temperature as
5
'

shipping delays may range from 1 day to several weeks (12). The USAPHC states that
21 pounds of pre-frozen gel packs can keep samples in an extra-large insulated container
at 3-4°C for 120 hours (5 days) provided the container is cooled to 4° C prior to packing
and shipping (34). The use of 21 pounds of pre-frozen gel packs in a sample shipping
container is highly unlikely because using that amount would only allow one kit per
cooler instead of the typical 3 - 4 kits per cooler. Typically 5 - 6 pounds of pre-frozen
gel packs are received per cooler. Thus, if the samples remain in theater or in-transit for
periods exceeding a few days, the samples will begin to assume the ambient temperature
of their particular location.
As mentioned above, USAPHC has modified some of the EPA methods of
analysis for specific analytes based on unique military requirements and challenges. The
laboratory technician receiving the samples at AIPH provides the sample receipt
conditions to USAPHC Deployment Environmental Surveillance Program (DESP)
personnel who then determine if the sample will be accepted or rejected. The ideal
situation would be to have all samples received at the lab within the recommended EPA
MHT and storage temperature. Figure 2 has a depiction of a timeline for collection and
receipt of OEH samples based on averages from the 2011 data set.
6

Sample Collection
Sample Shipped to
Lab
Arrives at the lab
Analyzed & Reported
_t ~ ( DayO .t--tc-----f Day7 j,_ ___
1 __ __,( Da•t ll Fl Day 16 Day 17
Sample Storage in Theater
In Transit DESP Decision
Figure 2: Depiction of the sample analysis timeline based on 2011 study data.
When samples are rejected, the decision is based on the receipt conditions for
each individual sample vial outlined in the method of analysis and not the entire kit (see
Figure 3), although the entire kit can be rejected.
7

e ®e. <!AA .. ~ @ .. ~.·. Gvoc @voe ··.•. . lli'!a . Dup ~ . A
G t§(f)88©9
~Blank-Do
l(Q Not Open I'<!\ Fill Bottle \£/ Do Not Overfill
1.AddAcid Q 2. Fill, Reverse Meniscus
(f) Fill to Neck of Bottle e F"ill 213 full
Figure 3: Currently used treated drinking water kit.
MILITARY HEALTH RELEVANCE
US Service Members continue to be deployed to various locations around the
world and their health will continue to be at risk from OEH exposures. OEH exposures
could be from the climate, noise, chemical and biological warfare agents, infectious
diseases, physical hazards, and contaminated air, water, and soil. These exposures could
be either man-made (accidental or intentional) or naturally occurring/regionally-specific
(33). Drinking water is just one source of OEH exposure. Due to the receipt and analysis
of some drinking water samples outside of EPA-recommended MHT and storage
8

temperature guidelines, the current recovery concentrations may not be an accurate
reflection of the concentration at the time of collection.
OEH samples are collected, stored/packaged, and then sent to a USAPHC
analytical laboratory for analysis. Once the sample analysis is complete, the results are
input into the Defense Occupational and Environmental Health Readiness System
(DOEHRS) where DESP personnel compare them to the Military Exposure Guidelines
(MEGs). The MEGs are exposure frequency and severity-based air, water, and soil
exposure limits used to evaluate the significance of a potential OEH exposure and to
assess the level of health risk to deployed Service Members. However, given the
potential for time delays and temperature fluctuations, if sampled compounds are
temperature and/or time sensitive, the subsequent analysis may result in a lower mass
yield due to chemical degradation or volatilized losses from the water. The subsequent
health risk assessment and characterization of the hazard level may be inaccurate, which
could underestimate the health risk to the deployed Service Member.
Findings from this study may lead to the development of new techniques and
procedures to increase the confidence in deployment data, such as identifying a need to
improve cold chain management techniques and shipping and handling guidelines. There
could be changes made to the current process of DESP determining the acceptance or
rejection of samples for analysis. Recommendations could also lead to a change in
military doctrine by deploying military analytical laboratory capabilities closer to the
point of collection and the development of better onsite water analysis capabilities.
9

HISTORICAL INFORMATION
After Operation Desert Storm in 1991, many Service Members and veterans
experienced various health issues that may have resulted from potential OEH exposures
(15). Force Health Protection and OEH surveillance were re-evaluated by the DoD after
Operation Desert Storm/Shield (16). There were 17,142 OEH samples collected and
analyzed during military operations between 1991 and 2005 (20). During this time, only
834 of these samples collected and analyzed were treated water samples. From 2006-
2011, there 1,578 treated water kits received from Operations Iraqi and Enduring
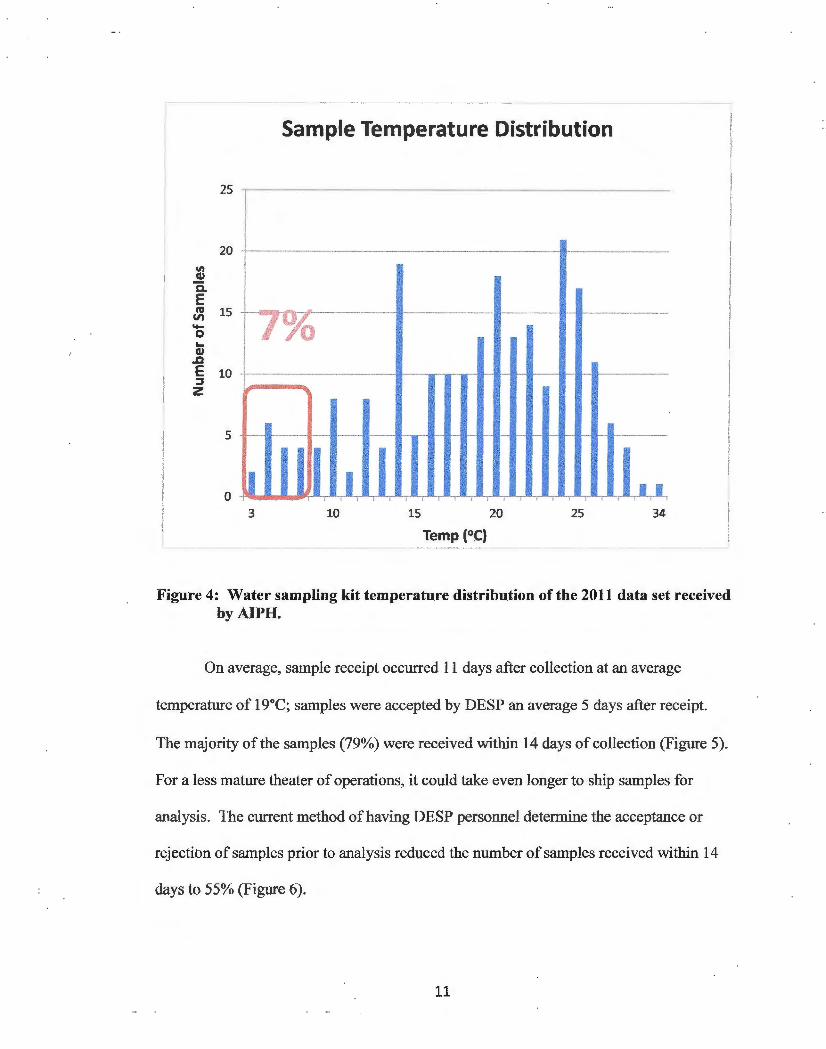
Freedom. The 2011 data set represents 224 documented sampling kits received over the
course of an 11 month period. The 2011 period was a time consisting of the highest troop
levels in Afghanistan and was just prior to the significant reduction in forces. Each of the
224 kits contained 23 treated water sampling vials to be analyzed as part of the
Occupational and Environmental Health (OEH) Surveillance Program. Of the sampling
kits received, only 16 of the 224 sampling kits (7%) were received at the recommended
storage temperature of 4 °C +/- 2 °C (Figure 4). The 16 kits received within the
recommended temperature guidelines appear to be due to the samples being collected and
shipped during the winter months. The temperature of the other 208 water kits ranged
from 9 °C to 34 °C. Figure 4 shows the number of kits for each temperature.
10
Sample Temperature Distribution
25 r--·
20
Ill cu 1i E RI 15 II) -0 73 '-cu
..D E 10 :J z ...,
5
~ 1 _l__l ' 0
3 10 15 20 25 34
Temp (l2C}
Figure 4: Water sampling kit temperature distribution of the 2011 data set received by AIPH.
On average, sample receipt occurred 11 days after collection at an average
temperature of 19°C; samples were accepted by DESP an average 5 days after receipt.
The majority of the samples (79%) were received within 14 days of collection (Figure 5).
For a less mature theater of operations, it could take even longer to ship samples for
analysis. The current method of having DESP personnel determine the acceptance or
rejectibn of samples prior to analysis reduced the number of samples received within 14
days to 55% (Figure 6).
11

.. QI a.
100
~ 60 "' 0 #
40
20
0
Sample Distribution - Collection to Receipt
--·or--9'}o
7 14 21 28 42 49 56 63 70
Days After Collection
Figure 5: Water sample distribution of the 2011 data set prior to DESP review.
120
100
80 .. ., a. E 60 .. "' 0 #
40
20
0
-
Sample Distribution - Collection to Acceptance
55%
42 49 56
Days After Collection
70
Figure 6: Water sample distribution of the 2011 data set after DESP review.
12

RESEARCH OBJECTIVES
This study will investigate the effects of exceeding the EPA maximum hold time,
storage temperature, and the combined effect of exceeding both on samples from treated
water sampling kits. The specific aims of the study are as follows:
1. Analyze contaminant-spiked water samples from a tap water matrix to
measure the effect of exceeding the EPA-recommended MHT for the analytes
of interest.
2. Analyze contaminant-spiked water samples from a tap water matrix to
measure the effect of exceeding the EPA-recommended temperature of 4 °C
for the analytes of interest.
3. Investigate the combined effects of exceeding both the EPA recommended
MHT and recommended temperature of 4°C for the analytes of interest.
4. Conduct a preservation study for Cyanide using chlorinated tap water and de
ionized water comparing samples with no preservative, ascorbic acid only,
and ascorbic acid and sodium hydroxide to determine the best preservative to
be used for CN sample collection for analysis.
The constituents evaluated in this study include Endothall, Diquat/Paraquat,
Volatile Organic Compounds (VOC), Semi Volatile Organic Compounds (SVOC),
Cyanide, and three metals (Antimony, Arsenic, and Mercury). These analytes were
selected based on their human health significance and on their relatively short EPA
recommended hold times, except for metals. Due the logistical challenge to have
samples transported and analyzed from overseas contingency operations, it is very
difficult to meet the EPA guidelines. All compounds selected for this study, with the
13

exception of metals and cyanide, have MHTs below the average receipt time for the 224
water sampling kits from the 2011 data set, which represented the most recent data
available at the beginning of the study.
14

Chapter 2 - Literature Review
INTRODUCTION
The USAPHC, formerly the US Army Center for Health Promotion and
Preventive Medicine (USACHPPM), is the Department of Defense's (DoD) Executive
Agent for medical surveillance databases and data analysis for deployments. In July of
1996, USACHPPM established Deployment Environmental Surveillance Program
(DESP) to fill the role for USACHPPM as the lead organization for Occupational and
Environmental Health surveillance. The work conducted by DESP was important in
addressing DoD concerns for the potential of US forces to be exposed to environmental
hazards such as intentional and/or accidental releases of chemical warfare agents and
toxic industrial chemicals (TIC) (16). As a result of the establishment of this program,
the Environmental Surveillance Methoc;l Development project was created to develop
deployable environmental sampling methodologies to support contingency operations.
This project used commercial-off-the-shelf (COTS) technologies to modify the previous
potable water sampling kits which were designed for garrison use by reducing the volume
to make it suitable for contingency operations (16). The currently used kit (Figure 3)
consists of reduced volume field expedient sampling vials, specifically designed to
accommodate military logistical requirements by minimizing volume and weight (31 ).
Reducing the volume has been determined not to hinder the analysis capability, due to the
sensitivity of the analytical methods used. In addition to TI Cs, the kits are designed to
detect chemical treatment byproducts and radioactive material.
The US Environmental Protection Agency (EPA) provides guidance within its
methods of analysis on the maximum time a sample can be held prior to
15

extraction/analysis and the maximum storage temperature for that sample. The EPA
guidelines for MHT and storage temperature are not consistent with past or present
research on stability studies for VOCs (23; 27). Brian Schumacher, Ph.D., EPA
Supervisory Physical Scientist commented, "While holding times may appear adequate to
protect sample integrity and provide sufficient time for laboratory analysis, relevant data
is sparse on individually defined holdings times and, thus, some of the holding times
appear to be arbitrary and/or politically driven" (27). One example would be the EPA
MHT of 14 days for VOCs stored at 4°C; past studies have shown select VOCs are stable
up to 56 days when samples are preserved and stored at 4°C and 25°C (22; 23). OEH
samples from overseas contingency operations are routinely out of compliance with the
EPA guidelines for hold time and temperature. There are no previous stability studies of
select analytes held and stored in conditions specific to those of samples received from
overseas contingency operations.
The remainder of this literature review will present previous research on stability
studies for selected analytes with short MHTs (Table 1 ). Stability studies for metals are
not discussed here due to their persistence in aqueous solutions and long MHT beyond
the timeframe of this study. The stability of the selected analytes is important when
comparing the analytical results to the Military Exposure Guidelines (MEGs) to
determine the level of health risk to US forces. The current MEGs are based on existing
peer-reviewed exposure guidelines and toxicological estimates (i.e., existing health
criteria) published by reputable public health and scientific organizations such as the
EPA, National Academy of Science' s National Research Council (NAS-NRC), and the
Agency for Toxic Substances and Disease Registry (ATSDR) (33). Most of the MEGs
16

are set at a negligible severity level and analytical results from environmental samples
may be below a specified MEG. When evaluated as part of the overall risk assessment,
the risk assessment may suggest the Service Members are not at risk of exposure.
However, due to degradation of the analyte or other losses which may occur if time- and
temperature-based guidelines are not adhered to, the true concentration level of the
respective analyte may have actually led to an exposure above a specified MEG and a
potential for increased health risk.
STABILITY STUDIES - ENDOTHALL
Endothall is an active contact herbicide that prohibits protein synthesis once it has
been taken up by plants (32). Endothall has low solubility in water; its primary use is to
control submersed weeds. The very low octanol-water partition coefficient ofEndothall
suggests it is not expected to bioaccumulate or adsorb to suspended solids or sediment.
Research has shown a wide range of degradation rates for Endothall, suggesting a number
of environmental conditions can significantly impact its degradation rate. For example,
the degradation rates of Endothall vary with treatment concentration levels and type of
water matrix. In field studies conducted by R.C. Hiltibran (17), it was determined that
Endothall degraded to non-detectable levels in 1 - 4 days at initial concentrations of 0.3
ppm - 10 ppm at 25cc. In a similar study by Sikka and Rice (28), Endothall degraded
from pond water at 21 cc - 24cc to non-detectable levels over a 36 day period at an initial
concentration of 2.0 ppm. In aquaria, at 24cc ±1 cc, at concentrations of 1.0 ppm and 5.0
ppm, Endothall was found to dissipate at a slower rate in clean water matrices (tap water)
than in natural water matrices (lake water) containing mud, plant material, and fish (17).
The sensitivity ofEndothall to temperature has primarily been studied in soils; however,
17

little has been done on the temperature effects of Endothall degradation in water. One
research effort of note demonstrated that Endothall concentrations are higher in aquatic
waters during August within thermoclines and the Endothall concentrations are closer to
the initial concentration when samples are taken above the thermocline. Concentrations
below the thermocline were consistently lower than initial concentration (37).
Endothall is highly susceptible to microbial action. The primary fate process for
Endothall in aquatic systems is biodegradation and biotransformation (30). Conditions
that affect microbial action have been shown to greatly influence the degradation of
Endothall in aquatic systems. Endothall persisted for 30 days when microbial
degradation of Endothall was extremely slow due to weedkill in an Endothall treated lake
impoundment that had considerably low dissolved oxygen concentrations (29). Once the
oxygenation of the lake was restored, rapid degradation continued.
Endothall has been shown to persist in aquatic environments when conditions are
optimal, despite its rapid degradation by microorganisms. Conditions affecting the
degradation rate of Endothall in aquatic environments appear to be dissolved oxygen
content, sediment type, and turbidity (30). Military treated drinking water samples are
cleaner than the natural bodies of water where these studies were conducted. This study
will use a less complex water matrix to determine the stability of Endothall.
ST ABILITY STUDIES - DIQUAT /PARAQUAT
Diquat is a non-selective dipyridyl contact herbicide. Dipyridyl or bipyridine is a
crystalline nitrogenous base obtained by the reduction of pyridine. It is part of a family
of bipyridines of which 4,4' -bipyridine is a member; 4,4' -bipyridine is the precursor for
Paraquat. It is used by various industries and government agencies for control of floating
18

and submersed weeds. Research has shown Diquat is susceptible to microbial
degradation, photochemical degradation and sorption by sediment (30). Research into
the stability or persistence of Diquat has centered on its fate in natural aquatic systems
where its degradation is rapid (10; 14; 18; 30; 36). Diquat was non-detect 22 days after
treatment with an initial concentration of 1.5 ppm in a simulated lake impoundment at
25°C. Diquat persisted for four days after treatment with initial concentrations of 0.62
ppm (10), and displayed rapid degradation approaching zero concentration 30-33 hours
after treatment with initial concentration of 1 ppm in pond water at l 9°C (21 ). After 12
days of treatment with an initial concentration of2.5 ppm in pond water at temperatures
ranging from 25.5°C- 30°C and 6.7°C - 12.2°C, only trace amounts ofDiquat were
detectable (14; 36). In a comparison of seasonal persistence, Hiltibran et al. (18) found
that when the water was clearer in the Spring, persistence was approximately seven days
greater than in the Fall when the water was more turbid. Diquat readily binds to plant
materials; its effectiveness is greatly reduced by muddy or turbid water (9; 32). The
degradation rate of Diquat in aquatic systems is heavily influenced by the amount and
availability of sorbent material like sediment, aquatic plants, and suspended particulate
matter in the aquatic system (10; 14; 18; 30; 36). The persistence ofDiquat varied from
study to study and this can be attributed to different characteristics of the aquatic system
and treatment concentrations along with the varying environmental conditions.
As with Diquat, Paraquat is also a non-selective dipyridyl contact herbicide. The
persistence of Paraquat in water is largely determined by the concentration of the
herbicide and the complexity of the water matrix. In ponds with comparable water
quality except for turbidity, the persistence of Paraquat presented with different results.
19

Paraquat persisted for 23 days in pond water at 28 °C that had lower turbidity of less than
25 Jackson Candle units compared to six days in pond water at 8°C where the turbidity
averaged 42 Jackson Candle units (14). Paraquat persistence was not affected by water
temperature. In growth pools containing 1.0 ppm, 2.0 ppm, and 3.0 ppm Paraquat
concentrations, the concentration levels of Paraquat after 12 days were between 0.8 ppm
and 0.3 ppm with water temperatures at 25°C-27.8°C (36). Paraquat is slightly more
persistent than Diquat under similar environmental conditions (10). At an initial
concentration of2.5 ppm for Diquat and 2.1 ppm for Paraquat applied to the same pond,
Diquat was non-detect after 30 days while Paraquat was non-detect after 38 days (14).
As with Endothall, military drinking water samples are clearer and should be free of
sediment, microbes, plants, and other materials that would degrade Diquat and Paraquat.
The stability in this study may be affected by other constituents not currently known to
degrade either of the contact herbicides.
ST ABILITY STUDIES - VOLATILE ORGANIC COMPOUNDS
Volatile organic compounds (VOCs) are organic compounds with high vapor
pressure at 25°C, defined as possessing vapor pressures greater than 10-4 mm Hg at
standard temperature and pressure. The research on the long-term stability ofVOCs in
water is limited. There is uncertainty surrounding the quality of results from VOCs held
beyond the 14 day MHT for trace concentrations because there is little information on the
stability ofVOCs at low concentrations. Research efforts conducted by Maskarinec et
al. , (23) and Love, et al., (22) investigated the validity of the recommended EPA MHT
for voes of 14 days to determine ifthe pre-analytical hold times could be extended.
20

Maskarinec et al., (23) conducted foundational research on the stability ofVOCs
in environmental water samples. Their study used initial concentrations of 50 µg/L and
500 µg/L while investigating preserved and unpreserved samples of 17 different voes in
distilled water, groundwater, and surface water. In the study, the ASTM D4841 method
to determine MHT was compared to the method employed by Environmental Science
Engineering, Inc. (ESE). At the higher concentration studied, the ASTM method resulted
in increased MHTs in greater than 70% of unpreserved samples, while both methods
produced similar increases in MHTs at the lower concentration (23). The authors noted
the higher concentration (500 µg/L) yielded more instances of longer MHT than the
lower concentration (50 µg/L), but found them not to be statistically significant. At
25°C, 88-94% of the unpreserved samples showed stability of at least 19 days for the
ASTM method and 76-88% of at least 16 days using the ESE method. However, the
results appeared to be matrix and concentration dependent. Based on the study results,
when the samples are preserved with Hel and held at 4°e , the data show preserved voe
samples of the 17 voes studied could be held at least 56 days prior to analysis (23).
Love, et al.,(22) conducted research on the long-term stability of 87 voes in
environmental water samples using a much lower trace concentration (0.5 µg/L) than
Maskarinec et al. , in an attempt to be more representative of what is found in the
majority of the environmental samples received by the US Geological Survey National
Water-Quality Laboratory. The study used surface water and groundwater stored at 4°e,
preserved with Hel, and a target initial concentration of 0.5 µg/L. At the initial target
concentration, approximately 90% of the voes studied showed stability beyond the 14
21

day EPA MHT and approximately 80% displayed stability that ranged from 3 7-56 days;
while 93% appeared to be unaffected by the matrix (22).
There is no widely accepted standard on how to collect water samples for VOC
analysis in regards to the method to fill the collection vial. Different environmental
companies, organizations, and professionals have put forth different methods supplying
their own justification without citing any specific study to validate their reasoning (25).
The rate at which the sample collection vial is filled with the water sample and the pour
technique (top-pour, side-pour, and bottom-fill) during sample collection has been shown
to affect the recovery concentration ofVOCs. The top-pour technique placed the
discharge tube about 1 inch above the vial opening and allowed the water sample to
vertically fall into the vial (25). The side-pour technique allowed the water sample to
smoothly flow down the inside wall of the vial by placing the tubing just inside the vial
opening and tilting the vial at a 30 - 45 degree angle (25). The bottom-fill technique
placed the tubing near the inside bottom of the vial and the vial was filled with the tube
slightly below the surface of the water. The tube was slowly removed as the vial filled by
lowering the vial (25). It has been demonstrated in controlled laboratory experiments that
the best method is to fill the vial from the bottom with a tube submerged in the sample; it
yielded a 6 - 14% greater recovery compared to the side pour and top pour methods. In
regards to fill rate, a fast fill rate yielded a higher recovery (6 - 15%) than the slower fill
rate (25).
STABILITY STUDY - SEMI-VOLATILE ORGANIC COMPOUNDS
Semi-volatile organic compounds (SVOCs) are organic compounds with
relatively moderate vapor pressure, defined as possessing vapor pressures between 10-4
22

mm Hg and 10-11 mm Hg at standard temperature and pressure. Two of the classes of
SVOCs tested by the Army Institute of Public Health (AIPH) laboratory as part of the
drinking water sampling kits are Polycyclic Aromatic Hydrocarbons (P AH) and
Phthalates. Research conducted by Gallott et al., (11) used the method from ASTM 4841
to calculate the MHT. The study was conducted over a 41 day period investigating the
stability of 12 PAHs and found nine of the 12 PAHs were stable and remained within
tolerable range variations (TR) for the duration of the study period when held preserved
in a saline water matrix. Only three P AHs were outside tolerable range variations; of
these three, two were stable up to 22 days, and one for 30 days.
There were no stability studies for phthalates found in the literature. The majority
of the research found on phthalates was related to chemical leaching from plastics and the
risks phthalates pose to humans. Phthalates are endocrine disrupting chemicals; they are
used as solvents and in plastics manufacturing. Plastics containing phthalates are often
used in applications involving building materials, clothing, cosmetics, perfumes, food
packaging, toys, and vinyl products; they are also found in medical devices, blood
transfusion bags, and IV bags (7). Some of the products used by the US military contain
phthalates. During Operation Enduring Freedom there was concern that bottled water
stored in direct sunlight would release harmful chemicals such as phthalates from the
plastics into the water; Greifenstein et al. (13) conducted a 28 day study to determine the
amount of SVOC phthalates that liberate or migrate from Polyethylene Terephthalate
(PET) containers and found four phthalates present on Day 0, Diethylphthalate,
Butylbenzylphthalate, Di(2-ethylhexyl)phthalate, Di-n-butylphthalate. They found low
(near Method Detection Limit - MDL) concentrations ofDiethylphthalate on Day 7 at
23

23.5°C and 60°C and Butylbenzylphthalate nearly twice the MDL on Day 7 at 48.8°C
were detected during the study. Also, concentrations ofDi(2-ethylhexyl)phthalate were
0.14 µg/L - 1.30 µg/L and concentrations ofDi-n-butylphthalate were 0.16 µg/L - 0.30
µg/L. They concluded the phthalate migration was from the plastic tubing, pipes, and
gaskets, not the bottles (13). Although Greifenstein et al. did not conduct a stability
study; their research demonstrates that SVOC phthalates can be detected at elevated
temperatures.
ST ABILITY STUDIES - CYANIDE
Free cyanide exists as cyanide anion and hydrogen cyanide in a gaseous or
aqueous state. Hydrogen cyanide (HCN) is soluble in water and the solubility decreases
as the temperature of the media increases (19). Paulson (26) conducted stability studies
of cyanide at 2°C and 21 °C over a one hour period collecting data at 10 minute intervals.
The study was conducted in twice distilled water; no preservative was mentioned in the
research. The results showed a 48.8% degradation of cyanide at 2°C compared to 63.3%
at 21°C. Cyanide (CN) ions in water hydrolyze to produce hydrogen cyanide which has a
vapor pressure of 732 mm Hg at 25°C compared to 5 mm Hg at 25°C for bromoform
(VOC), 1.0 x 10⁻⁷ mm Hg at 25°C for di(2-Ethylhexyl phthalate) (SVOC), and 0 mm Hg
at 25°C for antimony (metal). Comparing this to the average received temperature of
l 9°C for water samples from overseas contingency operations, HCN is expected to
volatilize from the samples proportional to temperature as it would from any sample at
19°C. Based on thi s, the CN recoveries from overseas contingency operations may not
accurately represent the true concentration when samples are received above the method
storage temperature and MHT guides.
24

LITERATURE REVIEW SUMMARY
Based on this literature review, it is suggested that the studied voes and SVOes
(P AH) MHT could be extended using the definition of stability as applied by ASTM
D4841. VOes have also been shown to be stable beyond the MHT when preserved with
Hel at 4 °e and at 25°e. The water matrix appears to be the major difference between the
studies from the literature review and the research conducted for this study. The water
matrices for the voes and SVOes could be as complex as or more complex than the tap
water used for this study. Using a less complex water matrix would suggest equal or
greater stability compared to the literature review. Previous studies have shown the
persistence of Endothall, Diquat, and Paraquat samples is matrix dependent; these
herbicides were not shown to be sensitive (in the various matrices studied) to the
temperatures and durations studied. The studies used in this literature review used
natural bodies of waters which are for more complex water matrices than the use of tap
water in this research. In regards to CN stability, any sampling for CN analysis would
need to account for the many interfering compounds to obtain the most accurate results.
25

Chapter 3 - Materials and Methods
MATERIALS
For all time and temperature based experiments in this study, water samples were
prepared using tap water from the AIPH laboratory at Aberdeen Proving Ground, MD.
The cyanide study was modified to use de-ionized (DI) water and untreated private well
water because of non-detection of the CN ion possibly caused by interfering constituents
in the tap water. A tap water matrix was used because it is considered treated and the
drinking water samples received from overseas contingency operations are also treated,
with the full understanding that the tap water from the AIPH laboratory may have
substantially different properties than treated groundwater from a foreign country. These
differences may impact the degradation of analytes in this study. The only
characterization done on the tap water was for free available chlorine, which was
measured at 0.8 ppm. Commercially pre-cleaned and preserved 40 ml amber glass
sampling vials (Scientific Specialties Services, Inc. and Scientific Products, LLC -
Diquat/Paraquat only) with an open top septum cap identical to the vials from the treated
water deployment sampling kit were used to collect and prepare the water samples for
analysis, except for metals. Commercially pre-cleaned and preserved 125 ml amber glass
bottles (Scientific Specialties Services, Inc.) with open top septum cap were used for
metals sample collection. Each vial/bottle contained commercially pre-loaded
preservatives; the vials were purchased with the desired amount of preservative in each
vial (Table 2).
26

Analyte Target Cone Preservatives Sample Analysis (µg/L) Points (Days)
2S mg Ascorbic Acid; voe 40 pH<2 w/ 1:1 HCI {3 0, 8, 14, 28, 42
drops)
svoc 1.2S 3 mg Sodium Sulfite;
0, 8, 14, 28, 42 pH<2 1:1 HCI (3 drops)
Endothall 500 4 mg Sodium Thiosulfate 0, 8, 14, 28
Diquat I 4 mg Sodium Thiosulfate;
Paraquat so pH<2 w/1:1 H2S04 (2 0, 3, 8, 14, 28
drops)
Cyanide so pH>12 w/ lON NaOH (4 0, 7, 14, 21, 30
drops)
Mercury s pH<2 w/ 1:1 HN03 (8 0, 28, 42
drops) Antimony and so pH<2 w/ 1:1 HN03 (8
0, 28, 42 Arsenic drops)
Table 2: Target concentration, preservative, and sample analysis points for all analytes used in this study.
The study water samples were prepared by spiking a known amount of analyte
into a predetermined water volume to reach the target analyte concentration. The
vials/bottles were filled using a 500 ml beaker. The side pour technique was used at
about a 250 ml/min flow rate. After filling, all samples except for voes and SVOes
were capped for storage. The pH for the voe and SVOe samples was adjusted below 2
with the appropriate amount of acid then capped for storage (Table 2).
Three temperature conditions (4°e , 25°e, and 39°e) were used to model possible
receipt temperatures for samples from overseas contingency operations. The 4 °e
temperature was selected because it is the storage temperature stated in each method of
analysis except for metals which have no temperature storage requirement. The 25°e and
39°e temperature was selected to represent temperatures that samples could be exposed
to during shipment in the summer months. Although the actual temperature profile data
27

during shipment was not available, summer temperatures in Afghanistan during
Operation Enduring Freedom (OEF) could be as high as 41°C depending on location and
summer temperatures in Iraq during Operation Iraqi Freedom (OIF) could be as high as
44°C (24). The samples were stored in either a refrigerator or incubator at the
Uniformed Services University of the Health Sciences (USUHS) Division of
Occupational and Environmental Health Sciences (OEHS) water lab. The refrigerator
(General Electric) temperature was at 4°C. The temperature varied from 2-5 °C, as noted
from observed temperature readings taken two to three times per week. The incubator
temperatures were set at 25°C (Fisher Scientific) and 39°C (Precision - THELCO
Laboratory Oven) and with a variation of+/- 2°C, theses temperatures were also
observed two to three times per week. Temperatures were held constant over time while
real world samples may initially be stored at 4 °C, but would likely experience
temperature changes from ambient temperatures once the pre-frozen gel packs begin to
thaw.
Storage times (Analysis points- See Table 2) were developed to bracket the
recommended EPA MHT (except for Arsenic and Antimony), encompass the average
receipt date, and extend at least 14 days beyond the MHT to study degradation over
specified time intervals. The analysis points in Table 2 had to be shifted for a few
samples due to conflicts with federal holidays. The study was not extended past 42 days
because a review of the 2011 data set showed only two drinking water kits were received
beyond 42 days so it was proposed these kits may have been lost, mislabeled, or delayed
in customs. The EPA MHT, storage temperature, and method of analysis for each
analyte are presented in Table 1.
28

Sample analyses were conducted at the AIPH Laboratory at Aberdeen Proving
Ground, MD or sent to a contract laboratory. As stated previously, AIPH uses modified
EPA methods of analysis to meet the unique military logistical requirements involved
with OEH sample collection. There were major modifications to the SVOC and
Diquat/Paraquat methods, minor modifications to cyanide and Endothall, and no
modifications were made for VOCs and metals. In all cases the laboratories were ISO
17025 accredited through the National Environmental Laboratory Accreditation
Conference and American Association for Laboratory Accreditation.
METHODS
In applying the method outlined in ASTM D4841 , equation (1) was used to
determine the appropriate number of analysis replicates (n) to be used for each analyte at
the various analysis points. The example below is then determination for Toluene. The
method recommends 10 initial replicates be used to determine the number of analysis
replicates. For this study, three initial replicates were used. The use of only three initial
replicates affected the standard deviation used to calculate the relative standard deviation.
The standard deviation is more sensitive to large differences in values when a small
sample set is used. A large standard deviation leads to a large RSD and n value
determination. The purpose of the research was not to determine a new MHT for each
analyte rather it was to determine the chemical stability of each analyte as they exceeded
the EPA MHT and recommended storage temperature. Therefore, three replicates were
used because three samples were sufficient to determine if the stability was affected by
time or temperature when conducting the research.
29

where:
n number of analysis replicates required, t Student's T test based on number of samples, RSD Relative Standard Deviation, %, and D Maximum variation from mean concentration to be tolerated, 15%.
Example:
Toluene Day 0 recovery concentrations (µg/L): 40, 39, 38
n t
RSD = D
3 9.925 2.56 (determined from Day 0 recovery concentrations) 15
If the calculated n value is a decimal, then round up to the next whole number.
(1)
Applying statistical determinations from Gerald Van Belle' s Statistical Rules of
Thumb to determine sample size, a sample size of three per condition is sufficient to
detect degradation of25% ifthe coefficient of variation (CV) is 10%, assuming 80%
power and 5% 2-sided significance level (35). Three replicate spiked water samples were
prepared for each analyte and analyzed at each analysis point outlined in Table 2. There
were a few n value calculations that were higher than the three replicates used in this
study. As stated previously, three replicates were sufficient to determine if non-
compliance with the time and temperature guidelines for the water samples reduced the
stability of the analytes.
30

As part of quality control, trip blanks were also prepared and analyzed with each
analysis point. Matrix spikes (MS), matrix spike duplicates (MSD), laboratory control
spikes (LCS), and laboratory control spike duplicates (LCSD) were also prepared for
each batch of samples submitted for analysis. Each of these quality control measures had
recoveries within the acceptable recovery limits, thus, the instruments and lab technicians
were performing to standard.
To measure the effect of exceeding time, temperature, and time and temperature
combined, the method outlined in ASTM D4841 was applied to develop graphs for
comparison and evaluation. This method allows the chemical stability to be measured in
number of days it takes the mean recovery concentration to fall below the lower limit of a
99% confidence interval from a two-sided T-Test which is referred to as the tolerable
range variation. The measured effect is referred to as the MHT or SMHT. In applying
the ASTM D4841 method, the mean concentration for each analysis point per condition
was calculated for each analyte. Using the 99% confidence interval of a two-sided T test
(t = 9.925), the lower limit of the tolerable range (TR) was also calculated using the
equation (2) to determine the tolerable range variation (TRV). The lower limit of the TR
is calculated by subtracting the TR V from the Day 0 mean concentration.
where:
ts TRV = ± ..fii_
TRV Tolerable range variation t Student' s T test based on number of samples s Standard deviation n Number of replicate samples.
31
(2)

Example:
Toluene Day 0 recovery concentrations (µg/L): 40, 39, 38
TRV t =
-5.73 (Lower Limit) 9.925
s n =
1 (determined from Day 0 recovery concentrations) 3
(9.925)(1) TRV = - -../3 = -5.73
To calculate the lower limit of the TR, subtract the TRVfrom the mean of the Day 0
recovery concentration:
Day 0 mean 39 TRV -5.73 TR = 33.27
TR = 39 - 5.73 = 33.27
After calculating the TR it was normalized to the Day 0 concentration and used to create
the graphs, percentages are presented in the graphs.
33.27 / 39 = 0.853 or 85.3%
The recovery concentrations were normalized to the Day 0 recovery
concentrations producing a recovery percentage and mean recovery percentage. A graph
of the mean recovery percentage versus time was plotted for each analyte. A best fit
curve was drawn and overlaid with the tolerable range to determine the difference, if any,
between the respective analyte results from the varying analysis points examined and the
results from samples analyzed within acceptable EPA guidelines. At the point where the
32

best fit curve intersects the TR, a vertical line was drawn perpendicular to the x-axis to
determine the SMHT.
The CN study was modified due to non-detection of the CN ion in the spiked
water samples using the tap water matrix and NaOH only as the preservative. Untreated
well water and DI water were used in place of tap water due to the non-detections. The
CN samples were prepared as prescribed above. An additional preservative study was
also conducted using different CN preservatives. Method OIA 1677 suggests using
ascorbic acid as a preservative and NaOH to maintain pH however AIPH currently uses
NaOH only. The preservative study was designed to use tap water for the water matrix
with three preservative conditions (no preservative, ascorbic acid only, and ascorbic acid
with NaOH); each sample was held at 4 °C. The samples were prepared as prescribed
above except for the samples that were preserved with ascorbic acid. These samples had
the ascorbic acid added to the spiked water solution then the appropriate vials were filled.
The samples with no preservative and ascorbic acid only used commercially pre-cleaned
40 ml glass sampling vials with p_o preservatives added.
To determine the effects of exceeding the time requirement each analyte was
evaluated at analysis points beyond the EPA MHT at the 4°C temperature condition. If
the analyte was determined to have a SMHT greater than the EPA MHT, then it may
possibly be chemically stable beyond the EPA MHT. To determine the effects of
exceeding the recommended temperature, the 4 °C graph was visually compared to the
25°C and 39°C graphs. If the analyte had a SMHT greater than or equal to the EPA
MHT, then it may be chemically stable at the storage temperature used during the study
for that particular analyte. To determine the combined effect of exceeding the EPA MHT
33

and recommended temperature was the most challenging because there was no straight
forward comparison to be made so each analyte was evaluated at each elevated
temperature at analysis points beyond the EPA MHT. If analyte had a SMHT greater
than the EPA MHT, then it may possibly be chemically stable beyond the EPA MHT and
at temperatures used during the study for that particular analyte.
34

Chapter 4 - Results and Discussion
INTRODUCTION
ASTM D4841 was used to determine the chemical stability of analytes using the
maximum holding time by plotting recovery concentrations vs. time (2). The method
involves drawing a best-fit curve based on the mean recovery concentrations from each
analysis point (2). A horizontal line representing the lower interval of the 99%
confidence interval (Tolerable Range) is then drawn on the same graph. At the point
where the best-fit curve intersects the Tolerable Range (TR), a straight line is drawn from
the point of intersection perpendicular to the x-axis to determine the MHT. Instead of
using mean recovery concentrations, mean recovery percentages were used to develop
graphs to determine the chemical stability. This method was applied to the data from this
study to determine the Study MHT (SMHT). The best-fit curve was usually not a smooth
curved line; it was often a 2nd or 3rd degree polynomial that produced a coefficient of
determination (R2) closest to 1. The degree of polynomial was increased to get closest to
one without equaling one. Using 2nd and 3rd polynomials made it difficult to directly
determine the stability of the analyte due to the non-uniform nature of the best-fit line. In
these instances a range for the SMHT was given based on the most recent data point
above the TR and the 1st data point below the TR.
Then value determinations are listed in Table Bl for each analyte. Some of the
analytes had higher n value determinations than was used in the study to determine the
TRV which was used to calculate the TR. The analytes with the highest RSD values also
have the highest n values. The highest n values were for Endothall, Cyanide, and
35

SVOCs; they ranged from 10 - 69. Arsenic, Bromoform, and Dibrom9chloromethane
had n values that ranged from 4- 5. The remaining analytes had n values equal to or
lower than three. By using only three initial samples, the RSD was sensitive to large
internal differences between the three replicate samples which increased the RSD and n
values. Endothall was the highest at 69. Based on the n value determined from the initial
three replicate samples, 69 samples of Endothall would need to be analyzed at each
analysis point to determine a new MHT. Since the purpose of this study was determine
chemical stability beyond the EPA MHT and recommended storage temperature, the 69
samples were not necessary. However, using the calculated number of samples would
have increased the confidence in the results of the study for those analytes with n value
determinations above three.
The remainder of this chapter will present the findings from this study. The
results of the modified ASTM D4841 analysis are presented in Table 3, which provides
the Study MHT to compare with EPA guidelines. Appendix A contains graphs with the
best-fit curves for all analytes used in this study. Appendix B contains the mean recovery
percentage for each analyte at each analysis point and temperature condition.
36

Study Maximum Holding EPA Analyte Category Times (SMHT) MHT
4°C 25°C 39°C 4°C CN - Well Ion 42 42 21- 28 14 CN-DI Ion 42 42 7 - 14 14
Endothall Herbicide 28 28 28 7 Diquat Herbicide 42 28- 42 28- 42 7 Paraquat Herbicide 42 42 42 7
Mercury Metals 42 42 42 28 Arsenic Metals 42 42 42 180 Antimony Metals 42 42 42 180
1, 1, I -Trichloroethane voe - Solvent 42 <8 <8 14 Chlorornetbane voe - Solvent 42 <8 <8 14
Tetrachloroethene (PCE) voe - Solvent <8 <8 <8 14
Trichloroehtene (TCE) voe - Solvent 42 <8 <8 14
Benzene VOC - Solvent 28- 42 <8 <8 14
Toluene VOC - Solvent 42 8 - 14 <8 14
Bromofurm VOC - THM <5 <5 <5 14
Bromodichloromethane VOC-THM <5 <5 <5 14
Chloroform VOC - THM 42 Inc Inc 14
Dibromochlorornethane VOC - THM <5 <5 <5 14
Butylbenzylphthalate SVOC - Phthalate 42 42 42 14
Di(2-ethylhexyl)phthalate SVOC - Phthalate 42 42 42 14
Diethylphthalate SVOC - Phthalate 42 42 42 14
Dimethylphthalate SVOC - Phthalate 42 42 42 14
Di-n-butylphthalate SVOC - Phthalate 42 42 42 14
Table 3: The Study and EPA MHTs for analytes presented in the study; green, SMHT >EPA MHT; red, SMHT <EPA MHT; white, inconclusive.
ENDOTHALL
The results from the 28 day Endothall stability study are presented in Table 3 and
Graphs 1 - 2 in Appendix A. When calculating the TR for Endothall, the standard
deviation was large which caused the TR V to be high (see Table Bl). The high TRVIed
to a low TR for stability determination. At the recommended temperature of 4 °C,
37

Endothall had consistent degradation until day 28 where the mean recovery percentage
was greater than Day 14 (see Figure 7).
Endothall 120% ..,-·--··-----·--------·-·· .. --·--·-------------.. ··--.. --------------
100%~ '>;:·. --:-., ·.
f 80% "--0
~~ -• 4C ';_ --- ---. -- --- --- -- R2 = 0.954
;;; 60% -\----------· .. ------------------------- ' i) a R, =0.7115 Ii 25C :
' u ! ' "' a:
c
"' ~ 40%
R2 = 0.4425
; 20% _L _________ .. _. __________ .. _ _______________ ·--------·
0 5 10 15
Time (Days}
20 25 30
Figure 7: Graph of Endothall stability results over 28 day study period.
' 39(
- TR
I J
Exceeding the EPA MHT alone did not appear to hinder the stability of Endothall.
The mean recovery percentage never dropped below the TR. In a review of the quality
control (QC) results for Day 14, the two QC samples were lower than Day 0 and Day 8
QC results by 10 - 40%. Base on EPA Method 548.1, potential major interferences are
dissolved calcium, sulfate, and magnesium. These ions are the only known ions to
demonstrate the ability to interfere with Endothall recover when using this method.
Also, based on EPA Method 548.1 the most probable interferences are organic acids and
phenols retained by the Gas Chromatograph (GC) column which may explain the
38

variation in results if the GC column was replace due to maintenance between analysis
points. The SMHT was determined to be 28 days compared to the EPA MHT of seven
days. At the elevated temperature conditions, the results were similar with consistent
degradation until day 28 possibly for the same reasons as stated above. The SMHT at
each elevated temperature was determined to be 28 days. Reviewing the data points from
Day 8 and beyond at each temperature condition, the degradation never fell below the
tolerable range limit. The results show Endothall SMHT is 28 days across each
temperature condition which is beyond the EPA MHT. The effects of Time, temperature,
nor the combination of the two did not appear to be a factor in the degradation of
Endothall. Endothall stability is greatly influenced by the constituents within the water
matrix. The stability of Endothall suggests the tap water matrix was absent the known
degradation components of Endothall; microbes, sediment, organic plant material, etc.
DIQUAT/P ARAQUAT
The data from the 42 day Diquat I Paraquat study is presented in Table 3 and in
Appendix A Graphs 3 - 4 for Diquat and Graphs 5 - 6 for Paraquat. At the EPA
recommended temperature and reviewing the effect of time on the analytes, the mean
recovery percentage of Diquat never falls below the TR, but equals the TR at Day 28 then
rises on Day 42 (see Figure 8). The SMHT for Diquat at 4°C was determined to be 42
days.
39

-------. Diquat
120% -c-1 ---------------------- - - -
100% ~ - - - - - -r. - ~::::+~-~~·-. ····-... .;;-! __ ;;.-- ,
y~ / .•. t 80% r-- --..---------------·-----------------·-------~::_~::-::~:-:>_,_:_"~~---------(11
~ (II 0..
~ R2 = 0.9866 + 4 C 60% -+---------(II
> 3 R2 = 0.5874 • 25 C (II rx: I R2 = 0.975 .& 39 C
fii I ~ 40% +------··--·---------------------·--·---·-------- - TR
20% -. ----
0% -+------ ------.--0 5 10 15 20 25 30 35 40 45
Time (Days}
Figure 8: Graph of Diquat stability results over 42 day study period.
Paraquat has no individual or mean data points that fall below the TR, however,
the mean recovery percentage increases from Day 28 to Day 42. Paraquat was
determined to have a SMHT of 42 days at 4°C. At the elevated temperatures both again
show increasing recovery between Days 28 and 42. However, on Days 3 and 28 the
mean recovery percentage for Diquat falls below the TR. The Day 3 mean recovery
percentage has one data point well below the TR and heavily influences the mean. The
other data points on Day 3 are above the TR. On Day 28 there are two individual data
points below the TR. The SMHT ofDiquat at 25°C and 39°C was determined to be
greater than 14 days but less than 28 days. Paraquat has no individual data points or
mean data points that fall below the TR at either elevated temperature. The stability of
Paraquat appears to be at least 42 days. The effect of time and temperature does not
40

appear to increase the degradation for either analyte. The recovery ofDiquat and
Paraquat was consistent across each temperature condition. The chemical stability of
Diquat appeared to be at least 42 days at 4°C and greater than 14 days but less than 28
days at the elevated temperature conditions while the stability of Paraquat appeared to be
at least 42 days at each temperature condition. The graphs for Diquat and Paraquat were
visibly evaluated. Time, temperature, and the combination of time and temperature did
not appear to reduce their chemical stability; their mean recovery percentages never fell
below the TR before the seven day EPA guideline. As with Endothall, the stability of
Diquat and Paraquat are greatly influenced by the constituents within the water matrix.
The stability of Diquat and Paraquat suggests the tap water matrix was absent the known
degradation components of Diquat and Paraquat; microbes, sediment, organic plant
material, etc.
METALS
The metals data is presented in Table 3 and Graphs 7 - 12 in Appendix A.
Reviewing the data for Mercury and Antimony, the mean recovery percentage was higher
at Day 28 than at Days 0 and 42 across all three temperature conditions. There were no
individual data points below the TR at either analysis point or temperature condition (see
Figure 9).
41

QI
120% ------;
Metals - Anitmony -----------------------
100% ~-----------~~-~-------B---------------~ .....,.., __ _
I
E so% _,_ _____ _ c: QI
~ QI CL
~ QI > 0 v QI er:
60% R'=l + 4C
R' = 1 • 25 C
R' = 1 A. 39 C c:
i 40% -' ----------:?
-·--·-- -------
20% ~----------------------------------------------------
0% - ·------r-----,-------~--
0 5 10 15 20 25 30 35 40
Time (Days}
45
Figure 9: Graph of Antimony stability results over 42 day study period.
- TR i
Across all three temperature conditions, the mean recovery percentage for Arsenic
deceased from Day 0 to Day 28, but increased from Day 28 to Day 42. There were no
individual data points below the TR at either analysis point or temperature condition. The
three metals studied appeared to be consistently stable throughout the 42 day study and
showed no sensitivity to time or temperature. Arsenic and Antimony have EPA MHTs of
180 days. Day 42 percentages remained at or near Day 0 percentages; this indicated a
high amount of recovery. This study was not sufficient to determine the effect of
exceeding the EPA MHT for Antimony or Arsenic. Mercury has an EPA MHT of 28
days; based on the EPA MHT guidelines, degradation could occur after 28 days.
However, Mercury showed no degradation at 42 days. At Day 42, the recovery
percentage for Mercury remained near Day 0 percentages at all three temperature
42

conditions for a SMHT of 42 days. There stability of the metals suggests there were no
known degradation components for metals within the tap water matrix.
voe The AIPH lab tested for 61 VOCs from various VOC categories. There were
seven in common with Maskarinec, et al. , (23) and eight in common with Love, et al.,
(22). The study ofVOCs was conducted over a 42 day period and the results of 10 of the
61 VOCs are presented in Table 3 and Graphs 13 - 32 in Appendix A. The 10 VOCs
presented are Trihalomethanes (THM) and Solvents. According to the USGS, THMs and
solvents are the most frequent VOCs found in aquifers (38). The THMs presented are
Chloroform, Dibromochloromethane, Bromoform, and Bromodichloromethane. Results
from THM analysis show that Bromoform (Figure 10) had very similar degradation
patterns as Dibromochloromethane and Bromodichloromethane.
43

Bromoform 120% ---------·-----------
100% K---------·---··------·-------,~.
80% ...:::::i:'i;:::::::::::::::::::::::::::::::::::::::::::::::::::::::::::::::::::::::::::::::::::::::::::::::::::::::::::::::::::::::::::~-
fil, '. \\ ~ ! ... C I
~ ~ \ \ /f 60% ..,____..,~_ ,~- ---W";'o .9407 • 4 ' C
~ ~. \
~ 40% ~--~~\--.. a: I ·, \ c: l •• \
~ \ '-.... . 20% -·------'-~· ~-'',..._.._ ____ _
" \.. ~ ~- -;_.: .::.::. -~.:: .. :: .~- --.:::>"-+ " \ ... _, • . .ai ---...,...C--~-------:~·.:.·.:f ·,
'•' _· .. > 2· 5 30 35 40 10 "·:. ::1:5. - - - ~~>
R2 = 0.9707 • 25 ' C ·
R2 = 0.9612 ~ 39 °C --·-·-·-----·--------·----------- TR
0%
0 5 45
I -20% j_----------···----------------·-··--··----·--···----·-·--·--·-·---·-·--
Time (Daysi
Figure 10: Graph of Bromoform stability results over 42 day study period.
Bromoform and the other THMs displayed exponential degradation patterns and
had SMHTs of< 5 days at all three temperature conditions. The higher temperatures had
SMHTs < 3 days. On Day 28 at 25 °C Bromoform had several non-detection results
which proved difficult to determine any type of stability. The non-detection results were
replaced with the method detection limit of 0.30 µg/L to determine the stability of
Bromoform. The SMHT was determined to be consistent with Dibromochloromethane
and Bromodichloromethane. The rapid degradation of the brominated THMs may be due
hydrolysis. Bromine is larger atom than chlorine and less electronegative which may led
to the rapid degradation.
Reviewing the effect time had on the stability of Chloroform; at the recommended
temperature Chloroform had mean recovery percentages all above the TR (see Figure 11).
44

There were only three individual data points at the TR, these occurred on Days 14 and 42.
The SMHT was determined to be 42 days at 4°C. At the elevated temperature conditions
the degradation is inconsistent. At 25°C the mean recovery percentage increases between
Days 14 and 28 and continues to rise at Day 42. The Day 8 and 14 mean recovery data
points are below the TR. At 39°C there is an initial reduction in mean recovery
percentage from Day 0 to Day 8, but after Day 8 there is a consistent increase in mean
recovery concentration through Day 42. The Day 8 and 14 mean recovery data points are
below the TR. Based on the results of this study, the SMHT is not able to be determined
for the elevated temperatures for Chloroform as the stability was inconsistent.
Chloroform
120%
100% G:-;:=- • • ---- -----------· 1 ._, ___ " - - -- • ··a · --·------,-·::..· ·· .. =-t
---- --f:r:-._: __ --.: _~ __ :_ -~ ~- -~- _:. ::. _ :. _--.: .. -_ : __ : .- ---- -· · ... H so% ..J..--------c
I ~ 41 I
a. R 2 = 0 .3428 • 4 C J
~ 60% -+------------------------------------------------------------ ' > R' = 0 9998 II 25 c I 8 - I ti R' = 0_9095 " 39 C I ~ - IB ~ 40%
20%
0% -+-----,--------,-- ···---.-----.-----, -~--,----·---. 0 5 10 15 20 25 30 35 40 45
Time {Days)
Figure 11: Graph of Chloroform stability results over 42 day study period.
45

Benzene and Toluene both showed consistent degradation at 4°C. Benzene was
less stable with mean recovery concentration at the TR for Days 14 and 28. On Days 14
and 28 there was one individual data point below the TR compared to Day 42 that had all
three individual data points at or below the TR (see Figure 12).
Benzene 120% -, ---··----··--·---·----- --------------------·---
QI
:i,o 80% ;: QI u a; 0.. I
~ 60% +-----------·-> 0 u Cl cc
_ ....
R2 = 0.8425 + 4 C ---· ----------·---
R2 = 0.9554 • 25 C j R2 = 0.8461 ... 39 c I
~ ~TR ~ 40% 1--------- ------·---------·-·--·-----
20% .:_
0% ~--------~--~·
0 5 10 15 20 25 30 35 40 45
Time(Days)
Figure 12: Graph of Benzene stability results over 42 day study period.
Toluene had mean recovery percentages above the TR throughout the study. It
appears that exceeding time guideline alone did not hinder the stability of either analyte.
At 4 °C, the SMHT for Benzene was determined to be greater than 28 days but less than
42 days and the SMHT for Toluene was determined to be at least 42 days. Benzene and
Toluene also showed consistent degradation at the elevated temperatures until Day 42 at
25°C where the mean recovery percentage rises above the TR for each analyte. At 39°C
46

the mean recovery percentage remains below the TR throughout the study. Exceeding the
recommended temperature alone reduces the SMHT for Benzene to less than seven days
and Toluene to greater than seven days but less than 14 days when at 25°C. At 39°C,
both SMHTs were determined to be less than seven days. The reduction in stability as
the temperature increased for Benzene and Toluene may be linked to its volatility.
The SMHTs for the solvents decreased as the temperatures increased. At 4 °C,
1, 1, I-Trichloroethane, Chloromethane and TCE all displayed similar degradation patterns
(see Figure 13).
120%
!
~ 80%> +-c ., <> .,
1,1,1-Trichloroethane
• • •
' ·:-:-:----. ----- ---- --· --- -- --- ----· - -------· -- -~--~-··
0..
~ 60% -;-----R' = 0.2724 • 4 ' C I
> 0 <> ., a:: c:
"' ~ 40%
20%
---------------~
R' = 0.9936 • 25 ' C
R' = 0.9482 A 39 ' C
---------------------=-=---=-=----=-~-er----- TR
0% __:__------.---------------------r-·-----r-------,---------, - --------r--------0 5 10 15 20 25 30 35 40 45
Time(Days)
Figure 13: Graph of 1,1,1-Trichloroethane stability results over 42 day study period.
47

Each analyte had mean recovery percentages above the TR and did not appear to
be effected when exceeding the MHT alone. The mean recovery percentage for PCE at
Days 14, 28, and 42 were all below the TR. The SMHT for 1,1,1-Trichloroethane,
Chloromethane and TCE was determined to be at least 42 days and the SMHT for PCE
was determined to be at least eight days. Exceeding the EPA MHT alone did not appear
to inhibit the stability of I, I, I-Trichloroethane, Chloromethane and TCE . At the
elevated temperature conditions all mean recovery percentages were below the TR for
each analyte except for I,I,I-Trichloroethane and Chloromethane at 25°C. The SMHT
for 1, 1, I-Trichloroethane, Chloromethane, PCE, and TCE is less than eight days when
exceeding the recommended temperature alone and the combination of time and
temperature together. The chemical stability of 1, 1, I-Trichloroethane, Chloromethane,
TCE, Benzene, Toluene, and Chloroform does not appear to be hindered by time alone;
each of the analytes had SMHTs above the 14 day guideline. The chemical stability of
all THMs and solvents do appear to be hindered by temperature alone and the
combination of time and temperature. Each analyte had SMHTs below the I 4 day
guideline.
The chemical stability of the VOCs appears to be greatly affected by temperature.
VOCs have a high vapor pressure which causes them to rapidly volatilize. The
evaporation rate increases as the increase in temperature increases the vapor pressure. At
elevated temperatures the recovery percentage ofVOC analyte would decrease
proportional to the increase in temperature.
48

svoc
The AIPH lab tests for 24 Semi-Volatile Organic Compounds, five phthalates are
presented in Table 3 and Graphs 33 - 42 in Appendix A. During OIF and OEF the
primary means for drinking water was bottled water. There continues to be concerns
about phthalates migrating from water bottles into the water itself (13). Each of the
phthalates had mean recovery percentages above the TR at each of the three temperature
conditions. The phthalates as a group showed consistent stability, Figure 14 shows the
stability of Di-n-butylphthalate. Di-n-butylphthalate had a high RSD which resulted in a
TR less than 60%. The 80% recovery is significant and may represent degradation, but it
is unsure since the Day 0 RSD is high and reduced the confidence.
QI
I N c:
~ QI
Cl..
~ QI > 0 <.> QI a: c:
"' ' QI
~
Di-n-butylphthalate 120% ,--·-------·----------------·--·----··----
100% ~--------------""".:.:--.
80% T ~~~::=_~ cc··.~.~: _.., _ ! - . !
60% ·.,-·----_____ R2 = 0.8226 • 4 C
0.8674 • 25 c R2 = 0.9674 • 39 C '
- TR 40% -, -·----------------------------
20% ---·------
0% -----------0 5 10 15 20 25 30 35 40 45
Time (Days)
---··--------------------------
Figure 14: Graph of Di-n-butylphthalate stability results over 42 day study period.
49

The SMHT for each phthalate was determined to be 42 days at each temperature
condition. Exceeding the EPA MHT did not appear to inhibit the stability of the
phthalates. At 4°C each phthalate had a SMHT of 42 days. Each of the elevated
temperatures was below the boiling point for each of the phthalates; the SMHT remained
at 42 days. The combined effect of exceeding the EPA MHT and recommended
temperature did not produce any degradation below the TR for either phthalate studied.
Volatilization is not a dominate fate process for SVOCs due to their low Henry's Law
constant and vapor pressure.
CYANIDE
The Cyanide (CN) stability study was conducted over a 31 day period, the results
are presented in Table 3 and Graphs 43 -46 in Appendix A. The first iteration of the CN
study used sodium hydroxide (NaOH) as a preservative and tap water as the matrix. All
samples had non-detect results on Day 0, which made it impossible to determine the
SMHT or the temperature effects on CN stability in drinking water. The lab tap water
contained 0.8 ppm of free available chlorine, a known interfering constituent based on the
OIA 1677 method of analysis. It is believed that the non-detects are from chlorine
interferences in the tap water (5). Chlorinated tap water would not be a good choice for
future research without first analyzing the tap water to determine the presence of
interfering constituents. Any research using tap water should plan to address the
interfering constituents.
Due to the non-detects from the lab tap water, it was decided to expand this
portion of the study using de-ionized (DI) water and untreated water from a private
50

household well while continuing to use NaOH as the preservative to control for the
possible chlorine confounder. The chemical stability for CN in untreated well water
remained above the TR at each analysis point for 4 °C and 25°C. At 39°C the mean
recovery percentage remained above the TR until Day 28. The chemical stability dropped
below the TR between Days 21 and 28. The chemical stability for CN in DI water at 4°C
and 25°C was similar to that of CN in well water at the same temperatures. At 39°C the
mean recovery percentage fell below the TR between Days 7 and 14. Exceeding the
EPA MHT alone did not produce any degradation below the TR for CN in either water
matrix at 4 °C; all mean recovery percentages were above the TR.
Exceeding the recommended temperature did not produce degradation below the
TR at 25°C for either water matrix; all mean recovery percentages were above the TRs.
At 39°C in DI water the mean recovery percentage fell below the TR at Day 14 with day
seven above the TR (see Figure 15). At 39°C in well water the Day 28 mean recovery
percentage was below the TR with one data point being a possible outlier. The SMHT for
CN in both matrices at 4°C and 25°C was determined to be 42 days. The SMHT for CN
in DI water was greater than seven days but less than 14 days, for CN in well water the
SMHT was greater than 21 days but less than 28 days.
51

---------·-----------------------···---; CN DI Water
120% .----------------------·------
'°0% ~=. . ~-------. ~ 80% t---~~~~~--:-7"",~--~--~~--=-:~ - · _:_:_:_~~_:_:-~:_: =-:.:_.,-;~------··--I C: I .. , ' a I ~
Q:; Cl.
~ 60% ~-----------------------R_2 -_-o_.9972 • 4 ·c , 8 ,• R2 = o.9656 • 25 · c 1
~ i R2 = 0.9997 A 39 °C I
I ~ 40% j_ _____________ A __ · ·~-. --------·-·:- · - TR
20% -r----
0% ~--·
0 5 10 15 20 25 30 35
Time (Daysi i
-·---------------------··-··---_________________ ;
Figure 15: Graph of CN in DI water stability results over 31 day study period.
CYANIDE PRESERVATIVE STUDY
The AIPH lab uses NaOH as the preferred preservative for CN based on ASTM
D7365; however, the OIA 1677 method of analysis states that NaOH is best suited for pH
control (5) and ascorbic acid should be used as the preservative when chlorine is
suspected (3). Due to the non-detect results from the tap water matrix, a preservative
study was conducted to compare the recovery using NaOH and Ascorbic acid as
preservatives at 4°C to control for chlorine, Appendix A, Graphs 47 and 48. The
preservative study used DI water and tap water with three preservative conditions; no
preservative, ascorbic acid only, and ascorbic acid with NaOH. The results of the
preservative study showed that ascorbic acid may not be a sufficient preservative when
samples can' t be analyzed within 24 hours per ASTM D7365. When comparing the CN
52
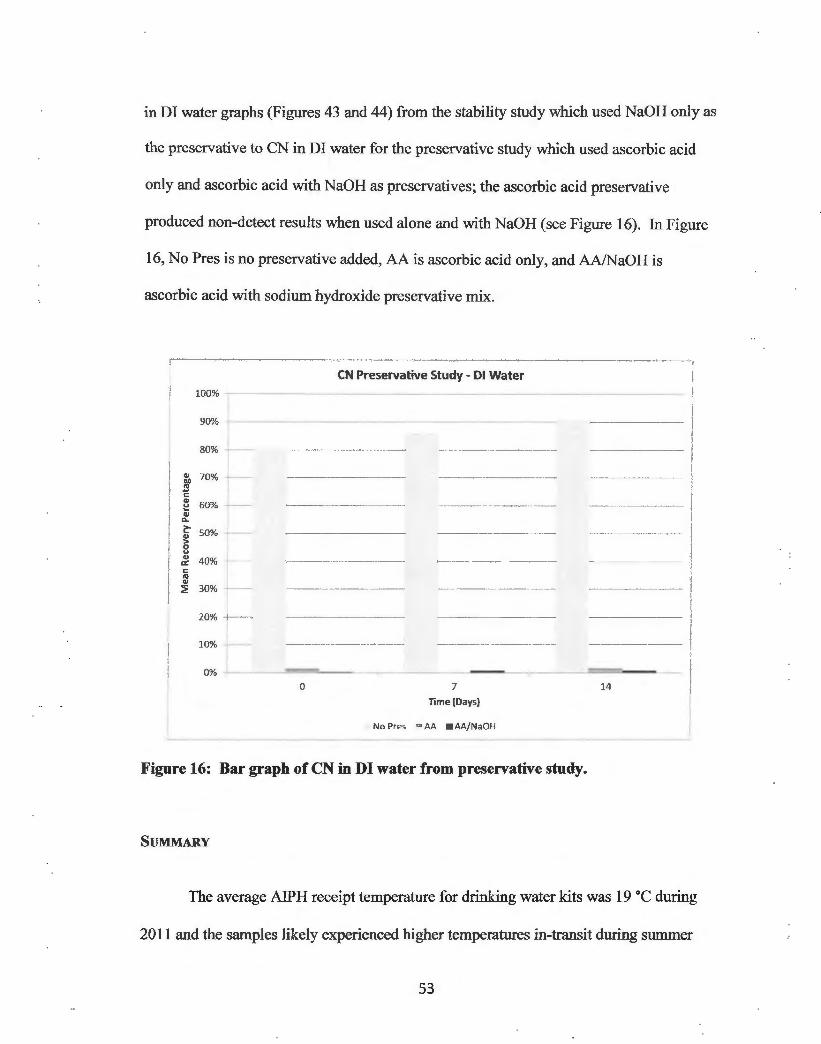
in DI water graphs (Figures 43 and 44) from the stability study which used NaOH only as
the preservative to CN in DI water for the preservative study which used ascorbic acid
only and ascorbic acid with NaOH as preservatives; the ascorbic acid preservative
produced non-detect results when used alone and with NaOH (see Figure 16). In Figure
16, No Pres is no preservative added, AA is ascorbic acid only, and AA/NaOH is
ascorbic acid with sodium hydroxide preservative mix.
CN Preservative Study - DI Water
100% '
! 90% _,__ __ ·-------·-·-·-·---------- ----·------·-
\ 80% +---
§lo 70% ~1-5
~ 60% l-;;; 0. > ~ 0
I V
"' a: <:
50% ----
I 40% +---·
~ i ~ 30% +-·
20% --
10% -. --
1 0% .L.---~======--
0 7
Time (Days)
No Pres ;;; AA • AA/NaOH
Figure 16: Bar graph of CN in DI water from preservative study.
SUMMARY
14
The average AIPH receipt temperature for drinking water kits was 19 °C during
2011 and the samples likely experienced higher temperatures in-transit during summer
53
months. This study demonstrated that several analyst remained chemically stable
beyond the EPA MHT as evidenced by the SMHT being greater that the EPA MHT.
Matrix effects will need to be addressed to account for some interference with the
analytes. The longest the chemical stability could be determined based on this study is a
hold time equal to the duration of the analyte study period. There is not enough data to
be predictive beyond this point. This study also went a step further to investigate the
temperature influence on these analytes in addition to exceeding the EPA MHTs. In
some cases it was difficult to apply the ASTM D4841 method of determining the MHT
due to inconsistent degradation and some mean recovery percentages increasing after
previous recoveries were lower. The fluctuation in mean recovery percentage may be
attributed to the difference in QC for each day of analysis, as in the case for Endothall
where the QC results varied by 10 - 40%. In the cases where it was difficult to apply the
ASTM method, a range of possible stability was provided. The findings show
temperature does have a major influence on some analytes and may influence others.
54

Chapter 5 - Conclusion
The intent of this study was to determine the effect exceeding the EPA MHT and
storage temperature had on drinking water samples from forward deployed units by
evaluating the stability of different analytes at elevated temperatures at and beyond the
EPA MHT. The findings are summarized below addressing the specific aims used to
answer the hypothesis.
1. Analyze contaminant-spiked water samples from a tap water matrix to
measure the effect of exceeding the EPA-recommended MHT for the analytes
of interest.
From this study there were 23 analytes evaluated in this study, 19of23 (83%) of
the analytes held at 4°C were chemically stable at or beyond the EPA MHT. The four
analytes not chemically stable were Tetrachloroethene, Bromoform,
Bromodichloromethane, and Dibromochloromethane. The lack of stability for
Tetrachloroethene may be due to it being heavier than water and the amount that does not
volatize sinks in the water away from water surface (1). However, the most likely cause
for the instability ofTetrachloroethene, Bromoform, Bromodichloromethane, and
Dibromochloromethane may be due to volalitization and an unknown constituent in the
tap water. There were four Trihalomethanes evaluated; Bromoform,
Bromodichloromethane, Dibromochloromethane, and Chloroform. Chloroform was the
only Trihalomethane chemically stable at and beyond the EPA MHT when stored at 4 °C;
its chemical stability appeared to be at least 42 days compared to less than 5 days for the
other three at 4 °C. Exceeding the time guidance had little effect on the chemical stability
of the remaining selected analytes despite using a tap water matrix.
55

2. Analyze contaminant-spiked water samples from a tap water matrix to
measure the effect of exceeding the EPA-recommended temperature of 4 °C
for the analytes of interest.
There were 13 of23 (56%) analytes stable at their EPA MHT when held at 25 °e.
The unstable analytes were VOe-THMs and VOe - Solvents. At 39 °e, 12 of23 (52%)
analytes were stable at or beyond the EPA MHT. The unstable analytes were voe -
THMs, VOe - Solvents, and eN in DI water (see Table 3). Exceeding the EPA storage
temperature had a greater effect on the stability of the voes whose stability decreased as
the temperature increased. Based on the high vapor pressure ofVOCs, temperature is
expected to have a greater effect on the chemical stability of the analytes. It is important
to properly manage the temperature of samples when stored and while in-transit when
sampling for voes. The current method of cold chain management is inadequate to
maintain samples at 4 °e, but may be able to maintain samples at 25°e. Reviewing the
224 sample receipt data, 90% of the sampling kits were received at 25°C or less. This
does not account for the possible in-transit temperature profile which may have exposed
sampling kits to higher temperatures for an extended period of time.
3. Investigate the combined effects of exceeding the EPA recommended MHT
and shipping temperature.
When samples were held beyond their MHT and at elevated temperatures 13 of
23 (56%) analytes appeared to be stable at 25°e, 12 of23 (52%) analytes appeared to be
stable at 39 °C. Outside of metals whose EPA MHT is 28 days for Mercury and 180 days
for Antimony and Arsenic, the most stable were the herbicides and phthalates.
Chloroform appeared to be the most stable of the VOCs. Visually evaluating the graphs,
56
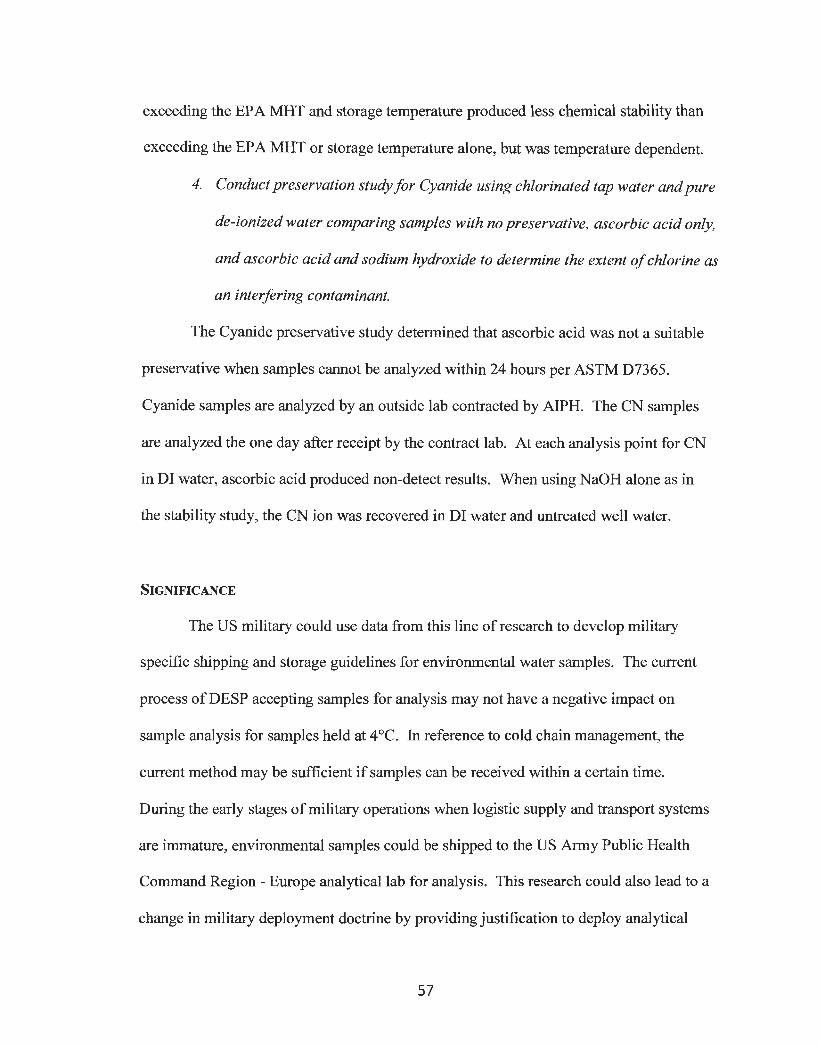
exceeding the EPA MHT and storage temperature produced less chemical stability than
exceeding the EPA MHT or storage temperature alone, but was temperature dependent.
4. Conduct preservation study for Cyanide using chlorinated tap water and pure
de-ionized water comparing samples with no preservative, ascorbic acid only,
and ascorbic acid and sodium hydroxide to determine the extent of chlorine as
an interfering contaminant.
The Cyanide preservative study determined that ascorbic acid was not a suitable
preservative when samples cannot be analyzed within 24 hours per ASTM D7365.
Cyanide samples are analyzed by an outside lab contracted by AIPH. The CN samples
are analyzed the one day after receipt by the contract lab. At each analysis point for CN
in DI water, ascorbic acid produced non-detect results. When using NaOH alone as in
the stability study, the CN ion was recovered in DI water and untreated well water.
SIGNIFICANCE
The US military could use data from this line of research to develop military
specific shipping and storage guidelines for environmental water samples. The current
process ofDESP accepting samples for analysis may not have a negative impact on
sample analysis for samples held at 4°C. In reference to cold chain management, the
current method may be sufficient if samples can be received within a certain time.
During the early stages of military operations when logistic supply and transport systems
are immature, environmental samples could be shipped to the US Army Public Health
Command Region - Europe analytical lab for analysis. This research could also lead to a
change in military deployment doctrine by providing justification to deploy analytical
57

capabilities closer to the point of collection to reduce the time and distance samples will
need to travel for analyses. It would also reduce the requirement for cold chain
management of environmental samples.
The results of the line of research could also add to the work previously
conducted by adding valuable temperature effects for single storage temperatures and for
varying temperature profiles. Other environmental labs could use this data to develop
shipping and storage guidelines for their labs. The EPA could use the results to one day
modify their guidelines as well.
FUTURE RESEARCH
The research presented here is a first attempt to characterize the impact of
exceeding EPA-recommended guidelines for holding times and maximum storage
temperatures on water samples collected in military forward deployed settings. The data
will likely provide a solid foundation for USAPHC to use and build upon in developing
standards and guidelines for environmental water samples collected in overseas
contingency operations. Future research along this line is listed below:
1. As samples are transported from the point of collection to the environmental
lab over long distances, they may be subjected to a wide range of temperatures
during travel. The effect of this temperature profile on the recovery
concentration is unknown. To further this preliminary research, it is
recommended that future research is conducted to determine the effect a
temperature profile will have on environmental water samples. By using
temperature data loggers that can record temperatures at a set interval over a
period of weeks, a temperature profile could be developed to study the effect
58

that varying temperatures would have on the recovery concentration and
stability.
2. Studying the sample collection technique to determine the optimum vial fill
rate and fill technique (side pour, top pour, or bottom fill) could provide
useful information to improve the quality of recovery concentration of
samples collected in the field.
3. Using the receipt conditions and concentrations to determine the actual
contaminant concentration level at the point of collection based on a known
degradation rate would allow for determination of the actual water
contaminant concentration levels at austere base locations.
LIMITATIONS
This research evaluated the effect on chemical stability when the EPA MHT and
storage temperature for water samples in a complex water matrix were exceeded. While
useful information was derived from this study, there were limitations. The major
limitation was the use of ASTM D4841, which is matrix specific. This study used AIPH
lab tap water which would have a different characteristic from other water sources. At
best, correlations may be made based on similar water matrices. This leads into the next
limitation of not characterizing the tap water. It was difficult to discuss unexpected
results from possible interfering constituents. Some methods provided a list of known
chemical interferences and procedures to mitigate their effects. Not taking steps to
mitigate known interferences could lead to false conclusions. Another significant
limitation was the lack of enough data analysis points. It was difficult to develop best-fit
curves to use in determining the MHT because there were only a few data points to draw
59

from and the degradation patterns were not consistent. Also the curves used in the study
were 2"d or 3rd degree polynomials which made it difficult to determine chemical
stability. Using statistical methods to determine if individual data points were outliers
was also challenging because the sample size at a specific analysis point was too small.
The confidence of the best-fit curves was reduced by using three initial replicate samples
as opposed to the 10 recommended by ASTM D484 l .
60

REFERENCES
1. Agency for Toxic Substances and Disease Registry. 1997. Toxicological Profile for Trichloroethylene. Department Health and Human Services-Public Health Service,
2. American Society for Testing Materials. I988 (2008). Standard Practice for Estimation of Holding Time for Water Samples Containing Organic and Inorganic Constituents D484 I-88.
3. American Society for Testing Materials. 2009. Standard Practice for Sampling, Preservation and Mitigating Interferences in Water Samples for Analysis of Cyanide D7365 - 09a.
4. American Society for Testing Materials. 2009. Standard Test Methods for Cyanides in Water D2036-09.
5. Capital Controls. 2002. Elimination of Cyanide Compounds with Chlorine. Severn Trent Purification Inc,
6. Craig S. 20IO. History of Public Health. Bethesda: Uniformed Services University of the Health Sciences
7. Environmental Protection Agency. 2007. Phthalates. U.S. EPA Toxicity and Exposure Assessment for Children's Health,
8. Environmental Protection Agency. 20I3 . Code of Federal Regulations 40 CFR Part I41.
9. Food and Agriculture Organization of the United Nations. 2008. Specifications and Evaluations for Agricultural Pesticides. Food and Agricultural Organization of the United Nations,
10. Frank P, Comes R. I967. Herbicidal Residues in Pond Water and Hydrosoil. Weeds:2 l 0 - 3
11. Gallotta FDC, Louren90 RA, Araujo LFMd. 2010. Evaluation of Holding Time for Polycyclic Aromatic Hydrocarbon (P AH) Analysis in Saline Water Samples. Environmental Forensics I I :309-I 4
12. Gellasch CA, Calix LC. 2007. Preventive Medicine Support in Afghanistan During Operation Enduring Freedom VI. Army Medical Department Journal April - June:56-64
13. Greifenstein M, White DW, Stubner A, Hout J, Whelton AJ. 2013. Impact of temperature and storage duration on the chemical and odor quality of military
61

packaged water in polyethylene terephthalate bottles. Science of The Total Environment 456-457:376-83
14. Grzenda AR, Nicholson HP, Cox WS. 1966. Persistence of four herbicides in pond water. Journal (American Water Works Association):326-32
15. Heller JM. 2009. The Periodic Occupational and Environmental Monitoring Summary (POEMS)-History, Intent, and Relationship to Individual Exposures and Health Outcomes. US Army Public Health Command
16. Heller JM, Resta JJ. 2001. Occupational and Environmental Health Surveillance. US. Army Medical Department Journal October - December:36 - 43
17. Hiltibran RC. 1962. Duration of Toxicity ofEndothall in Water. Weeds 10:17-9
18. Hiltibran RC, Underwood DL, Fickle JS. 1972. Fate ofDiquat in the Aquatic Environment, University of Illinois
19. International Cyanide Management Institute. October 29 2012. Cyanide Chemistry. http://www.cyanidecode.org/cyanide_chemistry.php
20. Kirkpatrick JS, Moser C, Hutchens BE. 2006. Deployment Occupational and Environmental Health Surveillance: Enhancing the Warfighter's Force Health Protection and Readiness. Army Medical Department Journal April - June 2006:50-4
21. Langeland KA, Warner JP. 1986. Persistence of Diquat, Endothall, and Fluridone in Ponds. Journal of Aquatic Plant Management 24:43-6
22. Love JT, Delzer GC, Abner SR, Zogorski JS. 1999. Study Design and Analytical Results Used to Evaluate Stability of Volatile Organic Compounds in Water Matrices. U.S. Department of the Interior, U.S. Geological Survey
23. Maskarinec MP, Johnson LH, Holladay SK, Moody RL, Bayne CK, Jenkins RA. 1990. Stability of volatile organic compounds in environmental water samples during transport and storage. Environmental Science & Technology 24:1665-70
24. National Center for Medical Intelligence. March 8 2013. Environmental Health Risk Assessment. https://www.intelink.gov/ncmi/country.php?country:::;:IRQ
25. Parker L, Britt S. 2012. The Effect of Bottle Fill Rate and Pour Technique on the Recovery of Volatile Organics. Groundwater Monitoring & Remediation 32:78-86
26. Paulson TL. 2008. The Fate of Cyanide Ion in Aquatic Environment. Rutgers University, Camden
62

27. Schumacher B. August 24 2012. Sample Holding Time Re-Evaluation. http://www.epa.gov I esd/ cmb/tasks/holding.htm
28. Sikka HC, Rice CP. 1973. Persistence of endothall in aquatic environment as determined by gas-liquid chromatography. Journal of Agricultural and Food Chemistry 21 :842-6
29. Simsiman GV, Chesters G. 1975. Persistence of endothall in the aquatic environment. Water Air Soil Pollut4:399-413
30. Simsiman GV, Daniel TC, Chesters G. 1976. Diquate and Endothall: Their fates in the Environment. Residue Reviews:131 -74
31. United States Army, United States Navy, United States Air Force. 2010. Sanitary control and serveillance of field water supplies. In TB MED 577/NAVMED P-5010-10/AFMAN 48-138_/P: Departments of the Army Navy Air Force,
32. US Army Corps of Engineers. 1988. Aquatic Plant Identification and Herbicide Use Guide. Vicksburg, MS: Department of the Army,
33. US Army Public Health Command. 2010. Environmental Health Risk Assessment and Chemical Exposure Guidelines for Deployed Military Personnel. In Technical Guide 230: US Army Public Health Command,
34. US Army Public Health Command. 2012. Army Institute of Publuc Health Laboratory Sciences Customer Service Manual. US Army Public Health Command,
35. Van Belle G. 2011. Statistical rules of thumb. Wiley-Interscience
36. Yeo R. 1967. Dissipation of diquat and paraquat, and effects on aquatic weeds and fish. Weeds:42-6
37. Yeo RR. 1970. Dissipation ofEndothall and Effects on Aquatic Weeds and Fish. Weed Science:282-4
38. Zogorski JSC, Janet M.; Ivahnenko, Tamara; Lapham, Wayne W.; Moran, Michael J.; Rowe, Barbara L.; Squillace, Paul J.; Toccalino, Patricia L. 2006. Volatile Organic Compounds in the Nation's Ground Water and Drinking-Water Supply Wells
63

Appendix A - Graphs with Best-Fit Curves
HERBICIDES
Endothall
Graph #1
Graph #2
Endothall
120% ry--·--- ----·-------·-·--------·-·----------.. ·--------·-----------------------·--.. ·---- ------·-·----··--·-
60%
!·--------------------------.---·-------------- ---·-·-··-----------·--
R2 = 0.954 • 4 C I
c i R' =0 .7115 • 25( I
~ 40% 1------- -- .. ---·---·-----· ·----------·-------------·----------------· - TR
1
i 20% ·r-------··- --···---~---------------------------·--- ·--·---------···-· ---------------·-----------------·-----·-------------
0% ~--------------------------------·--------,--·--------·-·---.-------· ------------------··--
0 5 10 15
Time(Days)
Endothall
20 25 30
120% .. ------·----------·--·-------·--.. ------·---------·-·------
i ~---------------
! "'~:.,< ....... ~~· 1 . .............. •.
~ 80% l---------~--~~-_:_:_ : _____ 2-~~-~-~--~~-=----.::_·- --·-·--·--7------~ I ~-·-----.. ---------~ ) -------- ------~ j ---~~ ~ 60% _L_ ________________ ,, _____ ____ .. ___ _________ ,, ________ ------·-·-------
100%
og! : u
1!_. R' = 0.954 • 4C
iJ. R2 :::: 0.4425 .1. 39 C c: ~ 40% +--------------·--------------2 I
20% -+ ------ ----------------- --! t )
0% -~------····----·-.--··-----------------·---···-,--------------------- ···-----------------·---~
0 5 10 15
Time (Daysi
64
20 25 30
- TR

Diquat
Graph #3
Graph #4
Oiquat
120%
100%~=-.:.::·-.,~ ...
Cll ~ 80% c fl (i; 0..
I · ..
• ••
~ 60% j----·-·---------·-·--·-·-------------------------~ I R2 = 0.9866 0 0 Cll a: c "' ~ 40% ------·
R' = 0.5874
20% . -· -·-·- - --·-·--- --··--- ·······-- -··· ······--·- ---·
0% -----0 5 10 15 20 25 30 35 40 45
Time (Days}
Oiquat
120% -.-------------·---------·
100% .e -;.- --- -Q -~-
QJ N so% r--------------- ·-··----·------·--··----------·----" "' ~ 8'.
• 4(
• 25(
- TR
~ 60% +-:> 0 0 Cll a: c
"'
R' = 0 .9866 • 4 C
R2 = 0.975 A 39(
- TR ~ 40%
20% ~
0% .,---
0 10 15 20 25 30 35 40 45
Time(Days}
65

Paraquat
Graph #5
Graph #6
_. --. .,, ::s.
1.20
1.00 ~-··- · - I · o-,-=;;
-; 0.80 --- --·----------··· .2 e c ..
Paraquat
g 0.60 -----·----· ------------------------·-------u ~ .. > 0 v ~ 0.40 c .. "' ~
0.20 -·- - -- ----
0 .00 -------------·
0 5 10 15 20 25 30
Time(Days)
Paraquat
35
R2= 0.9952 • 4C
R' = 0.9678 • 25 C
- TR
40 45
120% -------··---·---------------------------------
"' !/o°80% ----c "' v <; Q.
~ 60% ----------· > 0 v <II 0::
c .. R'=0.9952 • 4 C
R2 = 0.8987 _.. 39 C
- TR ~ 40% ------------------·-------·---------·-
20% ~-· -
0% --~----------· 0 5 10 15 20 25 30 35 40 45
Time(Days)
66

METALS
Graph #7
Graph #8
Metals - Anitmony 120%
-------- ----·· · ·------- --- ---····-- --· ---- - --~:~~- --~-- -- -=-=~-2'~-
~ 80% ~-------------------·-----------------------------<: "' v ;;; 0.
~ 60% > 0 v
"' "" " "'
·----------------!<'--- 1 • 4 c
R2 = 1 • 25(
- TR ~ 40% ..;...__ ________________________________________ _
20%
0%
0 5 10 15 20 25 Time (Days}
Metals - Anitmony
120% ---------·-----
., ::!' 80% --- ·---- -- -c "' ~ ~ i:" 60% -------- ---- -------- ------
~ v ., "" " "' ~ 40% ---
20%
0% ---------
0 10 15 20 25 Time (Days}
67
30 35
30 35
40
40
45
·- ·-----R' = 1 • 4 c R' = 1 J.. 39 C
- TR
45

Graph #9
Graph #10
Metals - Arsenic 120% ·-------··-· ····---------------------------- ·-· --·-···---·- -·---- ------------
100% M-=--:-:o-.. ---. - ----- ---
., %" 80% .:. .... c; ~ Qi a.
~ 60% ·t---
" 0 v <ll
"' c
"' ~ 40% _: ______ _
===== *==- - -- - --,-.A )----11--- -- · ·
-------- ----·------·-- -···-··• --R2 = 0.9615 + 4 C
R2 = 1 111 25 C
- TR
20% . .L-------·--------------------~-----------------·--------···---------------------
0%
0 10 15 20 25 30 35 40 45
Time(Days)
Metals - Arsenic
120% ·-----------------------------------------···-·--·------·--·-····--·-··-------
~ 80% c; ~ "' Q.
c:~ 8 "' "' c "'
60% r----- -
~ 40%
---= =-- 4t==•
· - ·Ac -
- - ---···oL ____ _ - 1 ..
R'=0.9615 + 4 C
R' = 1 A. 39C
- TR
20% -~---·-·--------------------·--··-------------···-----
0% 0 10 15 20 25 30 35 40 45
Time(Dayst ______ J
68

Graph #11
Graph #12
120%
100% ~---------- ------
~ 80% ~ c
~ ., "-~ 60%
§ ., 0: c "' ~ 40%
20%
0%
120%
0 5 10 15
Metals - Mercury
· ···· ·· -· --- ----:::_u_
--------- --
20 25 30 35 40
Time(Daysl
Metals - Mercury
- - - .til- - -
R2 = 1 + 4 c R' = 1 • 25C
- TR
45
100% ,,,_~~===============~====-==-=:::..:=:t- ..--., E so% c
~ ., "-(!-<II > 8 ., 0: c "'
60% -
~ 40% -
20% ----------------- -·--------------·
0% -----
0 10 15 20 25 30 35
Time(Days)
69
40
" ff' = l . 4(
R2 = 1 _. 39 C
- TR
45

VOLATILE ORGANIC COMPOUNDS
Graph #13
Graph #14
1,1, I-Trichloroethane
120% ·---------------------------------·--------
"' ~ 80% .. c "' u Q; a.
~ 60% ·!l! 8 "' a:: c .,, ~ 40% - ------ -
20%
0%
0 5
• • ·· ·······-····· -··············
10 15 20 25
Time (Days)
•
-··
30 35 40
- 1F -= CT.2724 • 4 ' C
R2 = 0.9936 • 25 "C
- TR
45
1, 1, 1-Trichloroethane
120%
"' E so% ---
" ~ Cll a.
~ 60% -> 8 "' a:: c .. ~ 40% ·- --
20%
0% ~----.---~.---~·-------0 5 10 15 20 25
nme(Days)
70
30
- - -R.C~Odc724 • 4 °C
R2 = 0.9482 J. 39 "(
- TR
··--,.....----·-y---------
35 40 45

Graph #15
Graph #16
Chloromethane
1.20
I
i -• . "· · ·- - -- · - - · ....• ... ··
.. i:!' 0.80 c .. u
8! ~ 0.60 > 0 u .. 0:: c
"'
-L--------------- --·
-------- -------------~-~335 . 4 ·c R'=0.9817 • 25 ' C
- TR
~ 0.40 ....:...--··--·--·---~--------------------·-----------
..
0.20
0.00 ~
0 5
120% -------
10
ill' 80% - -c
~--·
~ .. Q.
!':: 60% ,.... - ·--- --- -· ~ 0 u .. 0:: c "' ~ 40%
20% -------
0%
0 5 10
15
•
,,.
15
20 25 30 35 40 45
Time(Days}
Chloromethane
-..--- 7_
20 25 30 35 40 45
Time (Days)
71

Graph #17
Graph #18
Tetrachloroethene (PCE)
120%
100% ~~ -----
~ 80% ----·--.-c .• ~ ··------ -,· ..... QI ,,_
. .. > ~ 60% -------------------------> 0 u QI cc c .. ~ 40% ~--·-----
20% -
0%
0 5 10 15 20 25 30
Time (Days)
Tetrachloroethene (PCE)
-· ------~R~=~0'"".9712 + 4 ·c
R' = 0.9921 • 25 •c - TR
35 40 45
120% -------·----------·--
100% ,-~
"' "" 80% e c
"' e "' CL
1:- 60% , .. QI > 0 u QI cc c "' QI 40% :!E
20%
0%
0 5 10
•
15 20 25 30
Time (Days)
12
R' = 0.9712
R2 = 0.9172
35 40 45
• 4·c " 39 "(
- TR

Graph #19
Graph #20
Trichloroethene (TCE) 120% -----
100% ~:::::;:::.:___:---- ~ ----
·· .. ~~--::.~~~~~-----'L_ __
.. · ----I 80% -------~--.-_-___ -__ --_-__ -__ -_-__ -__ -___ -_---~-------- ----~'-'----~ .. Cl.
~ QJ > 0 u .. a: c ..
60% --------------- ____ __._,R' = 0.8681 • 4 ·c
R' = 0.9659 • 25 •c - TR
~ 40% -----------------------------------------
.. "" ~ c ~ .. Cl.
~ .. > g .. a: c .. .. ~
20% ~---- ------·-·------------
0% -------------------------------0 5 10 15 20 25 30 35 40 45
Time (Days)
Trichloroethene (TCE) 120% -
80%
- J. - - -
60% R' = 0.9211 -· -·
40%
20%
0% ...,..---.-----;-
0 5 10 15 20 25 30 35 40 45
Time (Days)
73
• 4 ' (
A 39 °(
- TR

Graph #21
Graph #22
c
"' "' 2
120%
100% .--
\ •.\
20% - .
0% 0 5
• 10 _15
Bromoform
•'
-·-----_.·:::. 20 .. .--is 30 35 40
R2 = 0.9407 + 4 °C
.. 45
• 2s ·c - TR
-20% -------------- ------------------Time (Days)
Bromoform
120% ·---·--- - - -----·---------------·--------·--·-
"' :g>
100% !!:-- -
80%
\ \ \
~~\ - ----
!: fl ;;; 60%
____ \,__ __ Q.
~
"' >
~ 40% -.--
"" c
"' "' 2 20%
0% ~
0
\ \
•
" 5 10 . .15
- . 25 30
-20% ~------·-------.. -------- ---nme (Days)
74
35 40
R2 = 0.9407 + 4 •c R' = 0.9612 A 39 ·c
- TR
• 45

Graph #23
Graph #24
Cll
Bromodichloromethane
120% - --------------- -------------------------------------------
100% · --- ----- -~\
' \
2 80% \
'-\ c
Cll ~ 8'.
\\,_" -, R' = 0.9615
~ 60% ~
------~---------------------------------------- • 4 ·c 0 v Cll 0:: c ..
-, • '--._"-. + R' = 0.99 8 25 •c
~-=========---~ 40% --- -------------.
• 20% ----- ---- -~~------- ----·~:-:-:::~·~-- _..::.:::· ..... .-.-• 0% -----r-·---·-,------·.....----·-------.. ---,------,----r-----,
o 5 10 15 20 25 30 35 40 45
Time (Days)
Bromodichloromethane
120% ------------------- ----- ------ --- ------ --- --------
100% - -----\
~ 80% --- -- '\----
c " Cll "'
~ '· Q. '"
R' = 0.9615
- TR
~ 60% ...!. --·---- -~--~ 8 Cll a: c .. . -,, __ ~---------------
• 4 •c
R2 = 0.9466 A. 39 •c - TR
~ 40% --- --~.---- --
20%
0% ------·---··----.----··,.--------------- ---------·--------, -----....,--------·;
o 5 10 15 20 25 30 35 40 45
Time (Days)
75

Graph #25
Graph #26
Chloroform
120% -----·-·---------·--·--··-------------·------------------·
100% ~=- --·--- --~-
QI
~ 80% c ~ QI Q.
-- .---- ---w-- -----::-::-~-- =---·
• -.
~ 60% -----------------··-----·---·-·-------·-------~=-0 .3428 • 4 c " 0 u QI 0:: c:
"' ~ 40% -
20% -- - ··---
0% -. ------·--,-----
0 5 10 15 20 25 30
Time (Days)
Chloroform
35 40
R' = 0.9998 • 25 C
- TR
45
120% -----------------------------------
100% ~===-===:::=t __________ ~----------··----------·---------------·------·
- - -~=-t
" N so% c:
~ QI
"-~ 60% --> g QI 0:: c:
"' ~ 40% -.-······· - -·-·
20%
0% ----
0 10
- "'- -
15 20 25
Time (Days)
76
30 35 40
- R,-= 0.3428 • 4 C
R' = 0.9095 ,. 39 C
- TR
45

Graph #27
Graph #28
.. co "' c ..
120%
100% '
80%
~ 60% Q.
~ .. ~ v .. "'
40% ---~.--~ c ~ . ........ ,'-. ..
Dibromochloromethane
R' = 0.9486
R2 = 0.9763
~ ,, ------20 % - . ----. ~~___:--=--;,,---· ___ ._ ... ~~~--~-
., "" ~ c ..
• 0 5 10
-20%
120%
100% ,------ ·-· - ---···.
\ \
80%
~ 60% ~---i\ Q.
~ OJ
8 ., "' <:
40% -
\ ~~
. .--- ii • 'IS ____ ).O------ 25 30 35 40 45
Time (Days)
Dibromochloromethane
R2 = 0.9486
R2 = 0.9595
• "' ., ~
20%
··'-..,
___ . _'·~- . ~ - -. ..
0% "--------
6 5 10 is ·· - · io 25 30 35 40 45
-20% Time(Days)
77
• 4·c • 2s ·c
- TR
• 4 •c
• 39 ·c
- TR
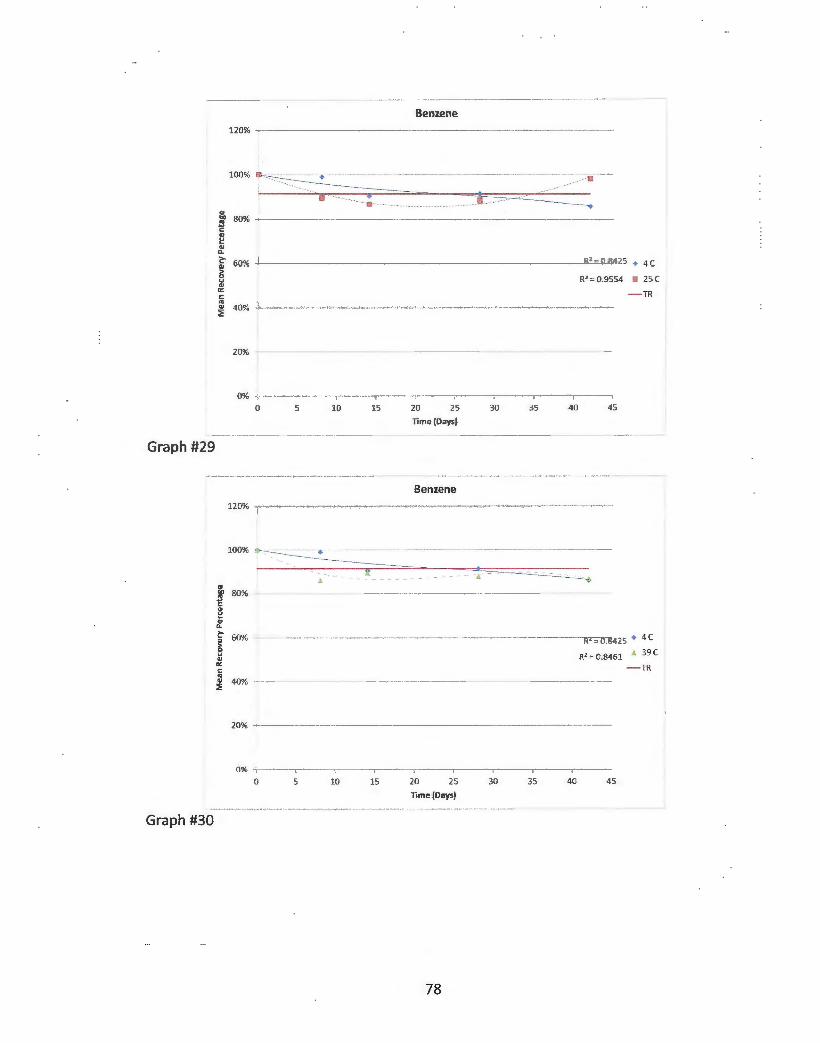
Graph #29
Graph #30
120%
~ 80% ---· ~ ---------c: QI
~ QI a..
~ 60% > 8 QI a: c:
"' ~ 40% -------··
20% ---
Benzene
a
______ .. ___ .. -·· ·
___________ _.,._, ==-U....&425 • 4 c
R' = 0.9554 • 25 C
- TR
0% ------------------------.-------0 5 10 15 20 25 30 35 40 45
Time (Daysi
Benzene
120% - ---------- ---- ··--------------------
100%~
____ ==; QI
~ 80% -c .. ~ ~
~ 60% --> 8 QI a: c:
"' ~ 40% -
20% --------------------
0% --
0 10 15 20 25
Time (Daysi
78
30 35
----fV=-o:"S425 • 4 c
R2 = 0.8461 '° 39 C - TR
40 45

Graph #31
Graph #32
120%
100%
<ll N so% c <ll ~ QI C>.
~ 60% §! 0 .... "' ex: c "' "' ~
Toluene
• 4C
R2 = 0.9396 • 25 C - TR
20% .............. . - .. --.-------.. ··-·------.. ·- ·-...... ,_,,, __ ,,_,,,, ____ ... ····--·--------------"-- ------
0%
0
"' )ll' 80% -'-c ~ cf ~ 60%
~ .... .. 0:: c "' ~ 40%
10 15 20 25 30
Time(Daysl
Toluene
35 40 45
• 4C R2 = 0.7903
R' = 0.8576 '° 39 C - TR
20% ---------------·-.. ----·---------------· - ------ _, _________ ,, ______ ,, __ , __ ., ___ .. ___ ,, __
0% 0 5 10 15 20 25 30 35 40 45
Time (Daysi
79

SEMI-VOLATILE ORGANIC COMPOUNDS
Graph #33
Graph #34
Di-n-butylphthalate
100% ~----------------------------------------
QI
~ 80% --c fl Q; ll-> ~ 0 u QI 0:: c ..
60% -
~ 40% - - ---- -
-----R' = {J.8226 + 4 C
R' = 0.8674 8 25 C - TR
20% ----------------------------------
0% -
0 10 15 20 25 Time (Days)
30 35 40 45
Di-n-butylphthalate 120% ---------- ------
100% ~----
'
"' ~ 80% ~-c QI
~ QI ll-> Q; 60% ---
---------------
--- R'= 0:8226 • 4 C > 8 QI 0::
--------------------------R-2= 0.9674 J. 39(
c - TR .. ~ 40% -- - --
20% -
0% 0 5 10 15 20 25 30 35 40 45
Time(Days)
80

Graph #35
Graph #36
120%
QJ .& 80% ---------c QJ
~ QJ
"-
~ 60% > 0 v .. rr: c .. ~ 40% ------
Dimethylphthalate
---------,,-z--=07774 + 4 c
R2 = 0.9011 8 25 C - TR
20% - ... -··--·- --- ·----··· -···-·- ---- - ·--
0% -----
0
120%
g:, 80% .. ~ c ~ QJ
"-~ .. > 8 ii! 1ij
60% •·
~ 40%
5
20% -------·
10 15 20 25 30
Time(Days}
Dimethylphthalate
35 40 45
--R'""·0:'1774 • 4C
R' = 0 .9984 " 39 C
- TR
------~-·--·----------·
0% ---------------------------0 10 15 20 25 30 35 40 45
Time(Dayst
81

Diethylphthalate 120% --- - - ----- -------· --- - - -----
- ~-- . .- --- · ··--- ·- ·---...... . .. / ----------~·-~- -~-
100% ~---·--+--
.. ll;" 80% -c , e ~ ~ 60% > 8 .. a: c "' ~ 40% --
20% --
0%
0
Graph #37
5
120% -------
· -----·----
10 15 20 25 30
Time (Days)
Diethylphthalate
•
35 40
--·R2 = 0.9619 + 4 C
R' = 0.9984 8 25 C
- TR
45
···---·------::-=--A--
.. ll;" 80% ---- - -- . --------··· c .. ~ ..
0..
~ 60% - ------------------> 0
• O .. a: c "' ~ 40% ----
20% -----.
0% ----------~-----------
0 5 15 20 25 30
Time(Days)
Graph #38
82
35 40
R2 = 0.9619 • 4C
R' = 0.48 .II 39 C
- TR
45

Graph #39
Graph #40
. ~utylbenzylphthalate 120% -----·---- •.•
• • 100% ··-· - ---·- - -- .-. _- _ · ····-··· ·· ·-.... -------------~--...
- . - -- ------ ·· • .& 80% -------· ·----- ------· c "' ... g; ~ 60% ------~ ... "' a:: c
~ 40% :!E
20% -
0%
0
120% --- --
5 10
..
---~~· -
15 25 20
Time(Daysj
li1
-~-~~ylbenzylphthalate
•
30 35
• 4 ( -iv-;;-o-:ro69
40
• 25( Rz = 0.4597
- TR
45
~---------·---100% !!:. - - ~-~---------·-=-- -=----::-_ · . ··.. -------~
• ~ 80% -~ c "' ~ "' 0.
~ 60% > 3 "' a:: c
~ 40% 2
20%
-· -+-----
0% -~ ----- --
0 10 15 25 20
nme(Oaysj
83
30 35 40
.R,=-i:no69 • 4 c
R' = 0.9086 1 .. 39 C
- TR
45

Graph #41
Graph #42
200%
180% • 160%
Di(2-ethylhexyl)phthalate
• R' = 0.9404 / , <11 140%
~ ...,;...--------··------·;::7"~"'""'r.-•-:-:·:=::: . . . . __ ___ ... ------------------;;:;T:---·-~---
21 120% Qj a.
~ 100% ••r-· ---=== > 0 ... OJ a: 80% c "' <11
2: 60%
•
. • ,/;:><C __ ·-.. ·. ________ ___::::::::=-. . ..
R2 = 0.2955
40% ----··----------------------
20%
0% 0 5 15 20 25 30 35 40
nme(Days}
Di(2-ethylhexyl)phthalate
180% ------------------------
160% ~· ----- - ------ ... - -···· ---------------- ------·· !'
-· -- __ ,(,/~ -
45
_/ R' = 09404 ' -
140% ---- - -- ------· - - - -
., / l'o° 120% - - -- - ---7'
~ ...~,,.----~ 100% ;:;,- - -===-- - - -. - - - - - ~-
~-------~~ - - . > Qj > 8 80% ., a: c "'
• -------------------------·-·------------~~;:'"------
R' = 0.7915 . ._
~ 60% .
40%
20%
0% ----··------------,------,-·----------------------~--------..,.-------
0 5 10 15 20 25 30 35 40 45
Time (Days}
84
• 4C
• 25(
- TR
• 4C
.. 39 (
- TR

CYANIDE
Graph #43
120%
t 80%
<II ~ <II 0.
CNDI Water
+------------+-----..
- - I& · ----·---------- :.:~--.-.m:~c~•--~---rir~-·-: __ :__ ____________________ ;_:__:~ ..• - --------··--
•5
~ <II
8 <II
60% --·------- ---·----· --·------··--------------------------------R-.-;11:9972 • 4 ' C
R2 = 0.9997 5 25 ' C
"' c: "' ~ 40% ·-------·--·----------···- -------- ··---------·-------------- ------·--··- -----·-·--
20% " .. -------------------- .. ---·------ --···
0% -;-----------·-----~--------------.·--------,---··-------.,- ------ -----·------~
120%
.. ~ 80% <: ~ If.
0 s 10 15 20 25 30 35
Time (Days)
CNDI Water
- TR
~ 60% --- -- - -~
.. .. . --- - --- - -- --- ---- ifi;::o:96S6 • 4 'C 0 u QJ
"' c: "' ~ 40% _, __
A R' = 0.9997 ;. 39 ' C
- TR
- - ·-- ---------- .. ---- ·~·-·
20% ------------·- ---------------·----·---·------- ·-·· - - ----------------
0 5 10 15 20 25 30 35
Time (Days)
Graph #44
85

120%
100% ti<::;;
.. E so% c QI
~ QI Q.
~ .. 60% -:> 0 u QI a: c "' ~ 40%
20%
0% 0
CNWell
•
5 10 15 20
lime (Days)
..
25 30
R'-,,-0:9138 • 4 C
R' = 0.9807 • 25 C
- TR
35
120%
- CNWell --·---····-. -· ·- - ·------ ----- ····- -- - ·· --
100%~
20% -
0%
0 5
•
10 15 20
lime (Days)
86
.
25
--
:."'--- _ .R: = 0.9138 • 4C
30
R' = 0.966 .t. 39 C
- TR
35

Graph #47
Graph #48
CN Preservative Study - Tap Water
5% --------·
4% -----·-·····-·-------·----·-------·-------·---------------
4% - ---
.. N3% ----c: .. ~ :. 3% ~ QI > 82% ----.. a: c: ~ 2% --:2:
1% ....---
1% -- ---
0% ---
-------------·-----
--------------------
----------------
0
Time (Days}
No Pres B AA •AAJNaOH
CN Preservative Study - DI Water
100% --------------
90%
80%
QI 70% .. "' c QI
~ 60% QI 0.
~ 50% "' > 0 v QI
40% a: c: "' "' :2: 30%
20%
10%
0%
-'"--··
--
---
--
~--
0 7
Time (Days}
NoPres '!;; AA •AA/NaOH
87
14
14

Appendix B - Analyte Graphing Data and Mean Percent Recovery
GRAPHING D ATA
Analyte Class
Endothall Herbicide
Diquat Herbicide Paraquat Herbicide
Antimony Metals
Arsenic Metals
Mercury Metals
BromodichJorom::thane VOe - lHM
DibromochJorom::thane VOe-lHM
Brornofurm VOC - lHM
ChJorofurm VOC - lHM
Benzene voe - Solvent
Toluene voe - Solvent
1, 1, 1-TrichJoroethane voe - Solvent
Tetrachloroethene {PCE} VOC - Solvent
TrichJoroethene {TCE} voe - Solvent Chlororrethane VOC - Solvent
Di-n-butylphthalate SVOC - Phtbalate
Butylberrz.ylphthalate SVOC - Phtbalate
Dethylphthalate SVOe - Phtbalate
Dimethylphtbalate SVOC - Phtbalate
D(2-ethylhexyQphthalate SVOC - Phtbalate Cyanide - DI Water Ion
Cyanide - Well Water Ion
Number of Replicates (n) = 3 D = 15% Tolerable Range Variation (TRV)
1R 1RVn =3 Cak:ulated n Standard
Deviafun (s)
142.15 357.85 69 62.45
41.36 3.31 1 0.577 39.36 3.31 1 0.577
41.27 5.73 2 1
41.91 8.75 4 1.53 4.4 0.33 1 0.058
39.02 3.31 1 0.577
37.58 8.75 5 1.53
30.72 6.62 5 1.15
37.02 3.31 l 0.577
35.02 3.31 I 0.577
33.27 5.73 3 l 36.36 3.31 I 0.577
38.02 3.31 1 0.577
33.27 5.73 3 I 36.02 3.31 I 0.577
0.73 0.57 26 0.1
0.43 0.66 49 0.11 5
0.9 0.33 10 0.058
0.74 0.33 13 0.058
0.83 0.41 15 0.071 36.43 17.80 15 3.1 I
32.99 17.57 17 3.07
Student's T (t) = 9.925 Tolerable Recovery Limit (TR) (µg/L) Relative Standard Deviation (RSD)
Table Bl: Data used to create stability graphs.
HERBICIDES
Endothall
Days 0 8 14 28
Endothall 4C 100% 81% 64% 80%
Endothall 25 c 100% 88% 53% 85%
Endothall 39C 100% 101% 68% 93%
Table B2: Endothall mean percent recovery concentration study data.
88
RSD
12.49
1.29
1.35
2.13
3.01 1.22
1.36
3.3
3.09
1.43
1.51
2.56
1.46
1.4
2.56
1.47
7.69
10.58
4.68
5.41
5.73 5.73
6.06

Diquat I Paraquat
Days
0 3 8 14 28 42 Diaquat 4C 100% 100% 101% 99% 93% 106%
Diaquat 25C 100% 79% 100% 96% 90% 107%
D~uat 39C 100% 100% 102% 101% 93% 113%
Paraquat 4C 100% 102% 102% 102% 102% 110%
Paraquat 25C 100% 102% 102% 99% 102% 106%
Paraquat 39C 100% 101% 105% 102% 101% 109%
Table B3: Diquat I Paraquat mean percent recovery concentration study data
METALS
Days
0 28 42
Metals - Antimony 4C 100% 110% 100%
Metals - Antimony 25C 100% 105% 101%
Metals - Antimony 39C 100% 105% 101%
Metals - Arsenic 4C 100% 100% 101%
Metals - Arsenic 25 c 100% 94% 99%
Metals - Arsenic 39C 100% 94% 98%
Metals - Mercury 4C 100% 105% 102% Metals - Mercury 25 c 100% 108% 103%
Metals - Mercury 39C 100% 111% 100%
Table B4: Metals mean percent recovery concentration study data
89

VOLATILE ORGANIC COMPOUNDS
VOC - Solvents
Days
0 8 14 29 42 1, l, I-Trichloroethane 4C 100% 102% 94% 102% 97%
1, 1, I-Trichloroethane 25 c 100% 85% 83% 88% 93% 1, 1, I-Trichloroethane 39C 100% 70% 66% 51% 39%
Chloromethane 4C 100% 103% 97% 103% 98% Chloromethane 25 c 100% 87% 86% 89% 95% Chloromethane 39C 100% 78% 73% 60% 49%
Tetrachloroethene [PCE] 4C 100% 92% 85% 85% 81% Tetrachloroethene [PCE] 25 c 100% 75% 70% 69% 77%
Tetrachloroethene [PCE] 39C 100% 67% 72% 57% 54%
Trichloroethene [TCE] 4C 100% 97% 89% 91% 86% Trichloroethene [TCE] 25 c 100% 83% 76% 75% 85% Trichloroethene [TCE] 39C 100% 75% 79% 68% 65%
Table BS: VOC Solvent mean percent recovery concentration study data
90

VOC -Trihalomethanes
Days
0 8 14 29 42 Bromoform 4C 100% 21% 26% 12% 9% Bromoform 25 c 100% 5% 2% 0% 3% Bro mo form 39C 100% 5% 5% 3% 5%
Chloroform 4C 100% 102% 93% 98% 95% Chloroform 25 c 100% 89% 87% 93% 98% Chloroform 39C 100% 89% 91% 93% 93%
Dibromochloromethane 4C 100% 29% 32% 17% 13%
Dibromochloromethane 25 c 100% 9% 4% 2% 5%
Dibromochloromethane 39C 100% 9% 10% 5% 8%
Bromodichloromethane 4C 100% 54% 54% 39% 35%
Bromodichloromethane 25 c 100% 27% 16% 13% 19%
Bromodichloromethane 39C 100% 28% 31% 22% 25%
Table B6: voe THM mean percent recovery concentration study data
VOC - Benzene and Toluene
D~ 0 8 14 29 42
Benzene 4C 100% 99% 90% 91% 86%
Benzene 25 c 100% 90% 87% 89% 98%
Benzene 39C 100% 86% 90% 88% 87%
Toluene 4C 100% 100% 92% 93% 89%
Toluene 25 c 100% 87% 83% 83% 89%
Toluene 39C 100% 81% 86% 78% 76%
Table B7: voe Benzene and Toluene mean percent recovery concentration study data
91

SEMI-VOLATILE ORGANIC COMPOUNDS
SVOC - Phthalates
Dl!Y_s
Q 8 14 28 42 Butylbenzy!E_hthalate 4C 100% 80% 114% 87% 87% Buty lbe_!I?Y lphthalate 25C 100% 90% 105% 83% 103% Butylbenzy!P_htbalate 39C 100% 108% 92% 80% 77%
Di(2-eth_ylhe~rl)pbthalate 4C 100% 89% 104% 97% 156% Di(2-ethylhexyl)phthalate 25C 100% 81% 184% 116% 97%
Di(2-et~lhexyl}E_hthalate 39C 100% 96% 113% 91% 75%
Diet~hthalate 4C 100% 86% 86% 85% 84%
Diet~hthalate 25C 100% 92% 92% 81% 92%
Diethy!P._hthalate 39C 100% 89% 81% 80% 82%
Dimet~hthalate 4C 100% 87% 91% 88% 90%
Dimet~hthalate 25C 100% 93% 94% 87% 94%
Dimethl'.!E_hthalate 39C 100% 93% 90% 87% 85%
Di-n-bu_!Y}Qhthalate 4C 100% 79% 85% 87% 87% Di-n-bll!Y!P_hthalate 25C 100% 85% 87% 82% 87%
Di-n-butylphthalate 39C 100% 85% 85% 79% 76%
Table BS: SVOC mean percent recovery concentration study data
CYANIDE
Days
0 7 14 21 31 CN - Well 4C 100% 92% 88% 91% 93% CN - Well 25 c 100% 93% 96% 93% 82%
CN - Well 39C 100% 78% 81% 70% 61%
CN-DI 4C 100% 90% 90% 91% 87% CN-DI 25 c 100% 80% 79% 84% 76% CN-DI 39C 100% 79% 42% 33% 55%
Table B9: Cyanide mean percent recovery concentration study data
92