c copyright 2012 by samantha j. low-choy, justine murray ...eprints.qut.edu.au/85671/1/low choy et...
TRANSCRIPT

This is the author’s version of a work that was submitted/accepted for pub-lication in the following source:
Low-Choy, Samantha, Murray, Justine, & van Klinken, Rieks(2012)Uncertain species distribution: From interpolation to extrapolation.Milestone Report provided to RIRDC, Brisbane, Australia.
This file was downloaded from: https://eprints.qut.edu.au/85671/
c© Copyright 2012 by Samantha J. Low-Choy, Justine Murray andRieks van Klinken
All rights reserved. This book or any portion thereofmay not be reproduced or used in any manner whatsoeverwithout the express written permission of the authorsexcept for the use of brief quotations in a book review.
License: Creative Commons: Attribution-Noncommercial 4.0
Notice: Changes introduced as a result of publishing processes such ascopy-editing and formatting may not be reflected in this document. For adefinitive version of this work, please refer to the published source:

Uncertain Species Distributions: from
interpolation to extrapolation
Samantha Low-Choy⇤† Justine Murray‡
Rieks van Klinken§
13 May 2012
1 Introduction
Habitat models are developed for a multitude of purposes. Key among theseare mapping species distribution, as mandated inputs to many conservatione↵orts, such as species listing, species management plans, and recovery plans[27]. Few studies have been aimed at “resolving crucial conservation issues, orexploring macroecological and evolutionary concepts and theory [81]. Emerg-ing uses are prioritizing e↵orts to map risk of potential incursions Of invasivespecies [79], to better target management [e.g. 51].
These purposes can also be viewed as predicting the future (predictingresponses of climate change, predicting ranges of invasive species), under-standing the present (understanding the mechanisms underlying geographicranges, interpolating the range from sparse data, identifying suitable sitesfor conservation, clarifying systematic relationships), or backcasting the past[36].
The construction of SDMs comprises two major steps: (1) modelling habi-tat requirements, based on a training dataset; and (2) then using the habitatmodel to predict and map potential distribution of the species. The habitat
⇤Cooperative Research Centre for National Plant Biosecurity, Australia†Mathematical Sciences, Queensland University of Technology, Australia‡Healthy Country Flagship Programme, CSIRO§Sustainable Ecology, CSIRO
1

model determines an underlying species-environment relationship, which re-lates species response (typically presence/absence or abundance) to varioushabitat factors, using data recorded at sites within training data. This modelis then applied to predict species response to the environment as specified bythe prediction data.
In Guisan and Zimmermann [27], SDMs are considered to exemplify Pat-tern rather than Process based models. Hence when used to map species dis-tribution, the purpose of SDMs can be viewed as interpolation, since speciesresponse is measured at a few sites in the study region, and the aim is to in-terpolate species response at intermediate sites. Increasingly, however, SDMsare also being used to also extrapolate species-environment relationships be-yond the limits of the study region as represented by the training data. Inplant biosecurity, potential distribution of an exotic pest in a new countryhas been extrapolated from the known habitat requirements in another coun-try [e.g. 79]. When assessing the impact of climate change on habitat of aspecies, future potential habitat is extrapolated from the current habitat un-der various climate change scenarios [10]. However this extrapolation can beproblematic. Some studies have demonstrated that habitat models may varyeven among adjacent regions [53, and references therein]. Where extrapola-tion is not only over space but also over time (e.g. for climate change), thenresearchers have advocated more dynamic SDMs that account for dispersalfrom current to future habitat [26].
Regardless of whether SDMs are to be used for interpolation or extrapo-lation, the debate over how to implement SDMs focusses on evaluating thequality of the SDM, both ecologically and mathematically. As shown inTable 1, These sources of uncertainty can be summarized in a way that isgeneric across many applications, with some tailoring to SDMs:
1. model inputs, including representativeness, coverage and measurementerror;
2. and in particular the appropriateness of the training dataset with re-spect to the prediction dataset;
3. the relevance of model outputs to the context;
4. process-based uncertainty, derived from the qualitative or ecologicalmodel(s) underlying the SDM(s),
2

Figure 1: Sources of uncertainty in modelling
5. the quantitative approach to implementing the ecological model, In-cluding
6. parametric uncertainty in the model, as well as
7. reporting the model’s predictive performance, and more broadly
8. communicating uncertainty in model predictions, including attributinguncertainty to various sources of error (e.g. spatial)
This framework of uncertainty shares some elements identified as relevantto risk maps Venette et al. [75], namely inputs, process-based uncertainty andparametric uncertainty. For deterministic habitat models, process based un-certainty and parameter based uncertainty have been readily identified ascore components [80]. A review of error and uncertainty in SDMs [7] identi-fied two main errors of concern: “deficiencies in the data and “deficiencies inecological realism. These loosely align with model inputs, since they identifyrepresentativeness in terms of sampling biases, coverage in terms of samplesize, and measurement error in terms of lack of absences as well as errorsin variables. They raise the issue of missing covariates, which is related toboth the variable subset selected as well as adequate ecological model. Spa-tial correlation is the main focus, in terms of quantitative method and itslink to the underlying ecological model. A recent review of SDMs identifiedfour important sources of uncertainty: measurement error (biological or spa-tial), the quantitative modelling issues, and inherent spatial and temporalvariability of species distribution [25]. In addition they highlight the needfor attributing uncertainty to its various sources, which can then be bettermanaged. In this paper, we use this taxonomy of uncertainty to review howuncertainty has been addressed when constructing SDMs.
It is important to ensure that the framework includes useful tools pre-viously employed to address uncertainty in habitat modelling (Section 2).Together with existing frameworks for addressing uncertainty more gen-erally when modelling, these existing tools help inform development of abroader framework for addressing uncertainty, specifically when buildinghabitat models (Section 3). As discussed earlier we focus on extrapolationrather than interpolation, where the emphasis on predictive performance is
3

diluted by the concerns for robustness and ecological relevance. We are cog-nisant of the dangers of excessively propagating uncertainty. Thus, althoughthe framework provides a smorgasbord of approaches, it is intended that theexact menu selected for a particular application, is small in size and targetsthe most important sources of uncertainty. We conclude with some guidanceon a strategic approach to identifying these important sources of uncertainty(Section 4). Whilst various aspects of uncertainty in SDMs have previouslybeen addressed, either as the main aim of a study or as a necessary elementof constructing SDMs, this is the first paper to provide a more holistic view.
2 Basic tools for Assessing Uncertainty in Habi-
tat Models
Some basic tools for assessing uncertainty are quite popular, due to theirsimplicity and flexibility, being adaptable to use with most types of quanti-tative methods. Most of these are highly relevant when SDMs are primarilyused for interpolation, but find some application when SDMs are intendedfor extrapolation.
2.1 Predictive performance indicators
A few tools for addressing uncertainty are ubiquitous throughout the SDMliterature:
• Goodness of fit (GOF) statistics;
• Validation by assessing predictive performance; and
• Robustness.
These three elements are used to address a number of sources of uncertainty.
2.1.1 Goodness-of-fit
In the habitat modelling context, a single goodness-of-fit (GOF) statistic istypically used to:
1. reflect how well the model fits the training data, although it is acknowl-edged that overfitting to the training data can a↵ect generality of themodel;
4

2. for variable subset selection (often referred to as model selection) throughuse of GOF statistics such as AIC or BIC, often referred to as information-theoretic approaches [12].
3. assess sensitivity of the model (especially for Bayesian networks).
Implicitly, GOF statistics can only be implemented where ‘gold standard’measurements of species response are available. A well-known deficiency issusceptibility to outliers, and could arise due to limited understanding of therepresentativeness of data, and relevance of both qualitative and quantitativemodels. As promoted within the statistical modelling context, to achieve awell-rounded evaluation of a quantitative model [30], GOF statistics oughtto be complemented by a raft of diagnostics designed to assess the quality ofthe quantitative model. These include:
parameter uncertainty reflecting the accuracy of the input parameters,including measurement error where parameters are estimated via ex-perimentation or expert uncertainty where parameters are assessed byexperts;
mathematical form including distribution of errors in statistical models;
model structure a↵ecting representation of the ecological model, espe-cially linearity and/or hierarchy of relationships;
parsimony of the model to balance the need for model accuracy againstmodel complexity;
sensitivity of model outputs to model parameters; and
adequacy of modelling assumptions.
For quantitative models, we highlight that model parsimony and sensitivitymay be addressed simultaneously via
variable subset selection to identify the set of (sensitive) input parame-ters that lead to the most parsimonious model
5

2.1.2 Predictive performance: calibration and discrimination
A second dominant tool for addressing uncertainty in SDMs is predictive per-formance. Its popularity stems from its flexibility, since it permits compar-ison of models implemented using vastly di↵erent quantitative approaches.Common indicators of predictive performance are sensitivity and specificity(or equivalently true and false positive rates), and their summary using thekappa statistic or AUC (area under the curve) for Receiver-Operating Curves(ROC) [31]. These statistics therefore measure the discrimination ability ofthe model. However, it should be noted that data-mining approaches shouldout-perform most other modelling techniques, when this assessment reliesheavily on predictive performance indicators. This is because the internalfitting algorithms of most data-mining approaches seek to optimize predic-tive performance in some way. Thus it is not surprising that comparisonstudies which rely heavily on predictive performance find that data-miningmethods (such as MaxEnt, boosted and bagged trees, self-organizing maps,neural networks) perform best [e.g. 19, 59].
These predictive performance indicators are applied for validation [30],either:
2. Internal validation through resampling methods such as cross-validation,bootstrapping and jack-knifing; or
3. External validation by assessing performance on either a sub-sampleof the original training dataset (which is really a high order cross-validation) or a separate test dataset.
Whilst internal validation methods are common, particularly cross-validation,they are typically applied under the assumptions that both the original andresampled datasets are “balanced”, both in terms of the outputs (e.g. pres-ences and absences), and representation of the input space (e.g. environ-mental strata). Similarly, the externality of test dataset is typically assessedthrough its spatial proximity to the training dataset, and may be supple-mented by an landscape ecological description of the di↵erences between thetwo.
However measures of discrimination ability, such as AUC and ROC di-agnostics, need to be complemented by measures of the calibration abilityof the model [60]. A calibration curve shows the prevalence of presencesand absences against predicted probability of presence (which may be logit-transformed) Reineking and Schroder [64]. Its slope measures the degree
6

of overfitting to the training data, and its slope reflects bias. These errortrade-o↵ curves have been used to choose the appropriate threshold of thepredicted probability of presence, using the intersection between the twocurves for presence and absence [54].
Mathematically it is important to note that as the threshold for the prob-ability of presence is varied, the false positive and false negative rates willvary in opposition to each other [22]. Rather than abdicating from the choiceof acceptable values for these error rates (under ROC for example), it is im-portant to consider a trade-o↵ between these two errors. False positives (highpredicted probability of presence when truly absent) may lead to failure toprotect the species when reserves end up not containing the species. Falsenegatives (low predicted probability of presence when truly present) maylead to missing high quality sites. One approach is to minimize one error oranother [39]. However unconstrained minimization of one error could lead tounacceptable levels of the other type of error. In practice it is rare that thesetwo errors are equally costly. Hence this may be accounted for, in classifica-tion trees or discriminant analysis, by specifying misclassification costs (asa loss function) to reweight the fitting criteria [52, 34]. Furthermore investi-gating these error rates can reveal systematic patterns, either geographic orecological (in terms of the explanatory variables) [29].
2.1.3 Robustness
Thirdly, SDMs are often assessed in terms of model robustness. This is abroad requirement that concerns: the appropriateness of extrapolating fromthe training to the prediction data, as well as the quality of the underlyingecological and quantitative models. It is often assessed via investigation of:
1. Generality of the species-environment relationships, through compari-son across regions.
2. Generality of the modelling technique, through its repeated applicationacross many species.
These approaches are well suited to assessing SDMs for interpolation. Theserobustness concerns are particularly e�cient to assess for applications requir-ing heavy investment into as spatial datasets derived from GIS products.
Several studies have investigated the second type of generality acrossspecies. Evidence shows that habitat models that capture the functional
7

traits of species accurately perform better Hanspach et al. [28]. Regionaldi↵erences (in a species habitat requirements and/or in sampling e↵ort) arealso evident [29].
2.2 Comparisons underlying predictive performance
Any summary statistic of performance needs to be understood in context[36], particularly in terms of the comparison underlying the calculation of thesummary statistic. These comparisons fall along a spectrum from internal toexternal validation [30]:
• Internal validation via resampling examines the variability arising from“jittering the original data. It was first proposed to replace hard-to-calculate classical variance of statistical estimators (referring to vari-ability of the data under fixed hypotheses). Predictive performance iscalculated on each resampled dataset, typically summarized in termsof its average and standard error.
– Cross-validation provides a small number of resampled datasets(say ten) by withholding a di↵erent percentage of the data (here10%) each time. It is commonly applied in CART.
– Bootstrapping draws a large number of resamples (say 1000) withreplacement from the original data. This is less common in ecol-ogy.
– Jack-knifing, or leave-one-out, resamples the data by leaving oneitem out at a time. This is also less common.
• Dividing the data into two portions, one for training and one for testing,can be viewed as a two-way cross-validation.
• External validation tests performance against data from a di↵erent con-text, going beyond an assessment of data-variability, instead permittingassessment of generalizability.
• Meta-analysis seeks to contrast and combine findings across a numberof separate studies. One benefit of “meta-analystic thinking” is that itencourages an emphasis on confidence intervals [66], avoiding the po-tential confusions arising from hypothesis testing [65, 35, 56]. Externalvalidation can therefore be viewed as a two-study meta-analysis.
8

Hence the form of comparison underlying assessment of predictive per-formance is determined by the way that test datasets are constructed.
It is common to utilize nonparametric univariate analysis of variance tocompare performance Statistics, for example across quantitative methodsand/or species [e.g. 67]. This focuses on a null hypothesis of no di↵erencesacross quantitative method and species. More generally (in psychology, busi-ness and medicine), the reporting of estimates together with confidence in-tervals have instead been promoted, to overcome some of the well-knowndrawbacks of null hypothesis testing [65, 35, 56, 24].
2.3 Robustness
It is less common to assess model robustness in terms of:
3 Generality of the species-environment relationships, across the under-lying factors defining these relationships, such as gradients in climatechange; and
This is particularly important when assessing SDMs for extrapolation, for in-stance under climate change. It is possible that climate change may merelyredistribute the environmental niches, which are reflected in current (train-ing) data. However it is more likely climate change may create at least afew new constellations of climate/environment that are not reflected in cur-rent data. This makes it more di�cult to rely heavily on empirical meansof assessing model performance against measurements, as required when as-sessing the model’s predictive performance. It creates a greater emphasison understanding process (and the underlying ecological model), to ensuremodel robustness.
In addition to parameter uncertainty and other measures of uncertaintyin the quantitative model, we can therefore add a few measures of uncertaintyin the qualitative (ecological) model:
Model comparison of di↵erent quantitative modelling approaches;
Model averaging across a range of quantitative modelling approaches;
Model bagging , which is similar to model averaging but uses the samemodel fit to resampled datasets
9

In/Directness of model parameters , and their accurate reflection ofthe corresponding components (modules) of the ecological model [17,27].
These methods aim to assess comparability and representativeness of exter-nal validation datasets used to assess predictive performance; and ensuregenerality across underlying factors (i.e. across environmental rather thangeographic space).
Araujo and New [4] tabulate statistical modelling approaches that incor-porate model aggregation (ensembles) into their algorithm: artificial neuralnetworks and GARP; bagging trees, and random forests; boosted additivetrees; and maximum entropy. These authors note that “ better individualforecasts will yield a better combined forecast. One approach that has beenproven successful but may pose challenges to implementation in practise isto identify outcomes that are not supported by any model [4].
Another form of robustness concerns how species distribution accountsfor the interactions and competition among species:
4 Generality from individual species to species assemblages.
This issue can be addressed somewhat by selecting quantitative approachesthat emphasize the modelling of species assemblages. For example, self-organizing maps have been used to determine clusters of species, within theirgeographic context [59]. Alternatively other species may be included as vari-ables [5].
3 Targeted tools for assessing uncertainty
Other tools for addressing uncertainty in habitat models are more specificallytargeted, compared to the basic tools discussed above. Indeed some tools areclosely aligned with the use of specific quantitative methods. The types ofquantitative approach also defines an element of modelling uncertainty.
3.1 Uncertainty about the Appropriate QuantitativeModel
Briefly there are a multitude of quantitative modelling approaches available.These can be arranged on a spectrum from purely expert-informed to purely
10

data-informed models, so that expert-informed Bayesian models fall in themiddle, whilst expert-defined priors and the data-centric “likelihood” ap-proaches to statistical inference fall at the two extremes [42]. These twoextremes highlight the divide between the Process and Conceptual models,at the more expert-informed end of the spectrum, and the Empirical modelsat the data-driven end, when considered within the modelling taxonomy ofMerritt et al. [48]. This division also highlights the degree of fidelity to theecological (process) model in contrast to the (empirical) evidence. SimilarlyGuisan and Zimmermann [27] propose a classification system based on pre-vious work [38, 68]: mechanistic (fundamental/physiological process-based),empirical (phenomenological, ecological statistical) and analytical (mathe-matical theoretical). They identified trade-o↵s in each class between reality(best for empirical and mechanistic), generality (analytical and mechanistic)and precision (analytical/empirical).
In habitat modelling, data-driven approaches are currently popular [19],with the most favoured algorithms including MaxEnt [20, 61, 51], boostedregression trees [30] and self-organizing maps [79]. In contrast to regressionand classification trees where the probability of presence is related to theexplanatory variables, MaxEnt models a function of the probability of pres-ence for a group of sites (called a feature) which share the same values of(discrete) explanatory variables [62].
Self-organizing maps (SOM) are a data-mining method of clustering theobservations in environmental space as well as geographical space. Thus sim-ilar to MaxEnt, SOM is particularly well suited to analysis of large datasets.Other more standard data mining algorithms include neural networks suchas GARP.
In many cases, due to the inaccuracies in relevant empirical data, expert-driven methods are often Promoted as more credible. Multiple Criteria De-cision Anlysis (MCDA) is highly popular, since it intuitively constructs ahabitat suitability score [41]. Alternatively, instead of focussing on captur-ing expert knowledge on the reasons underlying species distribution, it canbe more appropriate to capture their spatial knowledge, by asking them tosimply delineate species distribution [41]. Expert-defined models have alsoaddressed the dynamic nature of variability in habitatation, for example usingcellular automata models, where simple rules determine habitat suitabilitydepending on the attributes at the location as well as whether surroundinglocations are currently inhabited or not. Such expert-defined models mayalso be used to define the prior model that can be updated using empirical
11

data within the Bayesian statistical paradigm.Some statistical models permit a stronger link to statistical ecological
theory, as advocated by Austin [5]. Most of these were early contendersfor habitat modelling approaches, but have since been superceded by thedata mining approaches, which have better predictive performance. Gen-eralized linear models (GLMs) provide a regression framework that allowsfor non-normal sampling variation, as required when responses are binary(for presence/absence) or counts (for abundance). GLMs provide a score, ofexactly the same nature as MCDA, where the contribution of each explana-tory variable is weighted by a coe�cient. Typically in practice, most GLMsare implemented based on some simple assumptions, which need not applyto the situation at hand. Published studies do not often take advantage ofextensions of GLMs:
Interactions reflect the way in which some explanatory variables may mod-ify the e↵ect of another. Many studies solely incorporate the main ef-fects of each habitat factor, thereby assuming all factors are essentiallyindependent. The complexity and diversity of habitat profiles makes itdi�cult to measure and interpret interactions between habitat factors,unless the study is carefully designed [5, 52, 63].
Designing covariate space provides a framework for analyzing and inter-preting coe�cients based on an understanding of covariate space (pro-jecting geographic space onto the various habitat predictors).
Hierarchical models allow the GLM to be extended to account for com-plex ecological, spatial or temporal scales, correlation or aggregationthat a↵ects the hierarchy of relationships between variables, specifiedas fixed e↵ects and random e↵ects within a GLM.
Non-linear e↵ects permit relaxation of the standard assumption that eachhabitat factor makes a linear contribution to species response (e.g. thelog odds of presence increases by a specific quantum for each increase inthe habitat factor). Non-linear regression permits curve-linear e↵ects(such as proposed by Austin [5]). Generalized Additive Models (GAMs)provide a means of flexibly determining a curve-linear e↵ect, where theshape is unknown a priori.
Naughty Noughts occur when absence data is diluted and exerts undue
12

influence on the model [6]. Various approaches for modelling excesszeros have been promoted for addressing them [46].
Variable selection can be used to select the set of explanatory variablesthat have best performance. Some of the more popular methods includeselection of expert-specified set of variables, use of univariate methodsto select the best predictors, and stepwise regression [e.g. 63]. In theBayesian setting, it is possible to extend the basic model to include anadditional set of latent variables that govern whether each is includedor not in the model [15].
Classification And Regression Trees (CART) form another popular model-based approach, where species response is related to explanatory variablesvia a sequence of binary decisions. CART have been compared to GLMs [e.g.50]. However these comparisons need to be interpreted with care, since thestandard CART algorithm incorporates variable selection, making any com-parison to GLMS (without variable selection) a little unfair. In its standardform CART arrives at a single decision tree, which can provide a strong linkto ecological theory [16]. Their predictive performance has been improvedby a variety of extensions, essentially by providing many trees, and there-fore lose interpretability and fidelity to any single ecological model. Theseextensions include bagging and boosting [13].
Where intensive data collection has resulted in high spatial and temporalresolution, then more complex models can be used, which include locallyvarying spatial components, or spatio-temporal components [33].
3.1.1 Uncertainty in data or in plausibility of hypotheses?
Finally, it is possible to implement some of these models under the Bayesianstatistical paradigm. This shifts inference from a classical focus, on hypothe-sis testing and confidence intervals which consider the variability of the dataunder a null hypothesis, to a learning focus, on the plausible range of hy-potheses based on the data [21, 43]. Bayesian versions of statistical modelsexist: GLMs [54], CART [58], GAMs [14] and zero-inflated regression [46].When expert informed prior models are utilized, di↵erent options exist forcapturing and incorporating this information into a Bayesian model [47].For example, for regression over 8 di↵erent methods are available [41]. It isless straightforward and less computationally feasible to implement Bayesianversions of the data-mining algorithms.
13
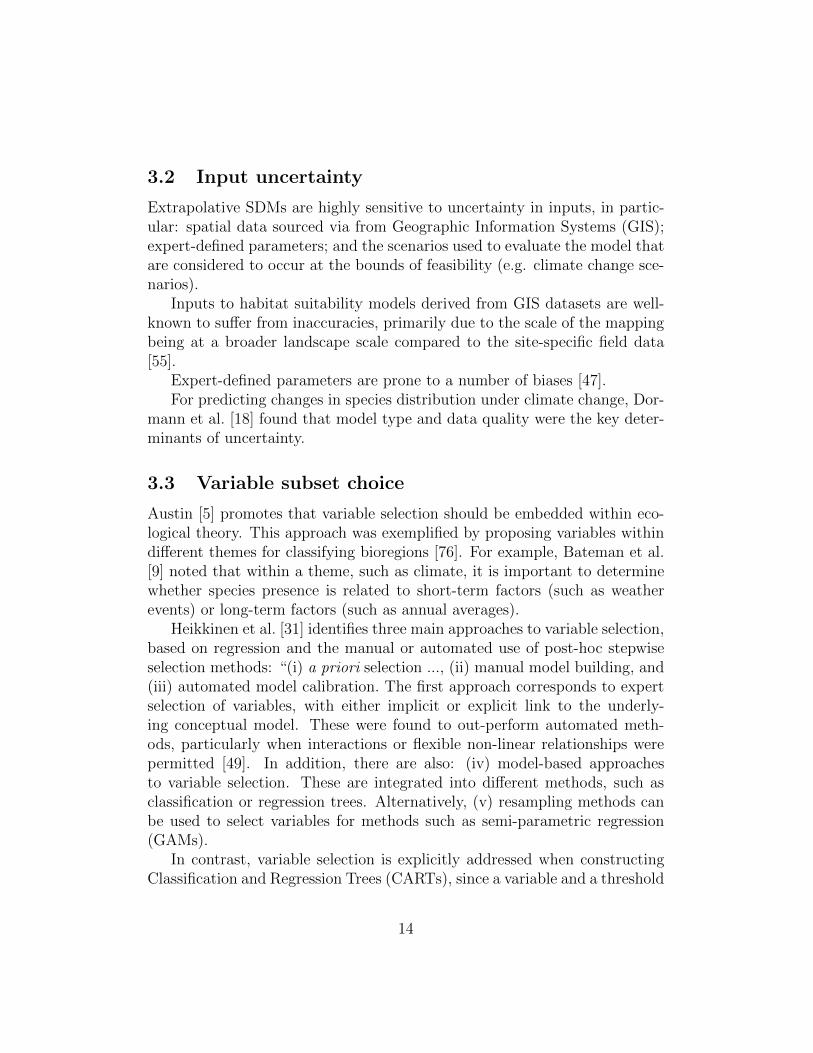
3.2 Input uncertainty
Extrapolative SDMs are highly sensitive to uncertainty in inputs, in partic-ular: spatial data sourced via from Geographic Information Systems (GIS);expert-defined parameters; and the scenarios used to evaluate the model thatare considered to occur at the bounds of feasibility (e.g. climate change sce-narios).
Inputs to habitat suitability models derived from GIS datasets are well-known to su↵er from inaccuracies, primarily due to the scale of the mappingbeing at a broader landscape scale compared to the site-specific field data[55].
Expert-defined parameters are prone to a number of biases [47].For predicting changes in species distribution under climate change, Dor-
mann et al. [18] found that model type and data quality were the key deter-minants of uncertainty.
3.3 Variable subset choice
Austin [5] promotes that variable selection should be embedded within eco-logical theory. This approach was exemplified by proposing variables withindi↵erent themes for classifying bioregions [76]. For example, Bateman et al.[9] noted that within a theme, such as climate, it is important to determinewhether species presence is related to short-term factors (such as weatherevents) or long-term factors (such as annual averages).
Heikkinen et al. [31] identifies three main approaches to variable selection,based on regression and the manual or automated use of post-hoc stepwiseselection methods: “(i) a priori selection ..., (ii) manual model building, and(iii) automated model calibration. The first approach corresponds to expertselection of variables, with either implicit or explicit link to the underly-ing conceptual model. These were found to out-perform automated meth-ods, particularly when interactions or flexible non-linear relationships werepermitted [49]. In addition, there are also: (iv) model-based approachesto variable selection. These are integrated into di↵erent methods, such asclassification or regression trees. Alternatively, (v) resampling methods canbe used to select variables for methods such as semi-parametric regression(GAMs).
In contrast, variable selection is explicitly addressed when constructingClassification and Regression Trees (CARTs), since a variable and a threshold
14
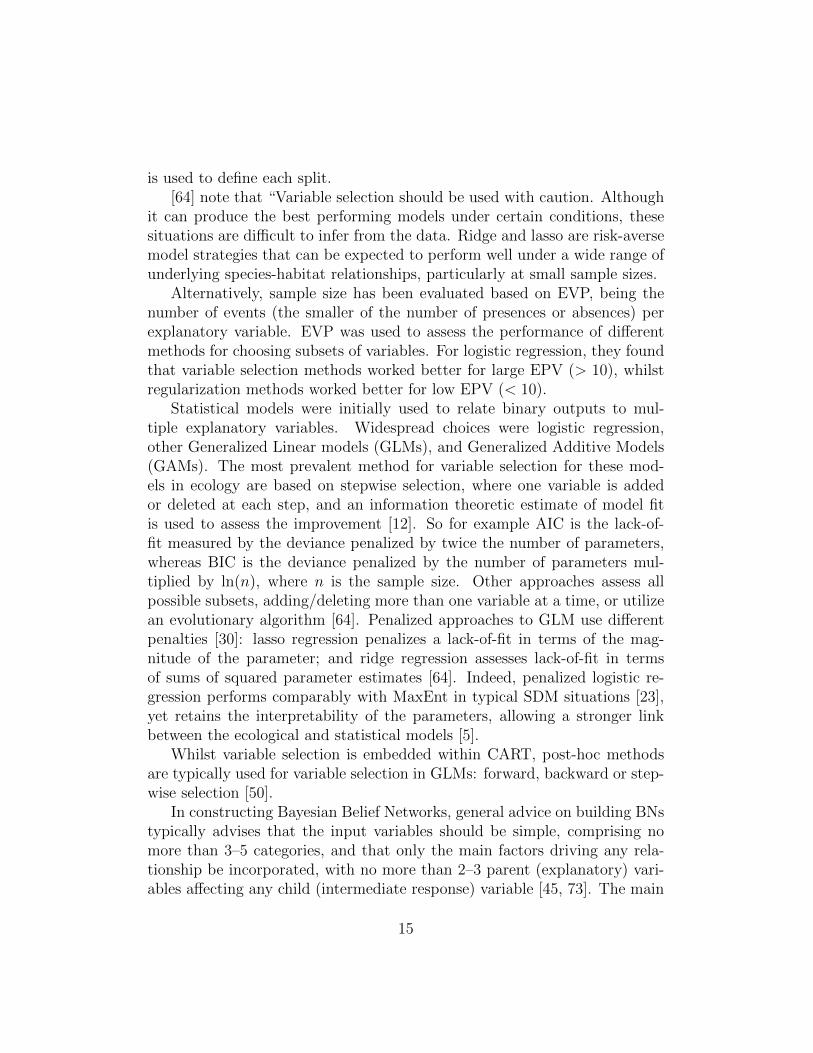
is used to define each split.[64] note that “Variable selection should be used with caution. Although
it can produce the best performing models under certain conditions, thesesituations are di�cult to infer from the data. Ridge and lasso are risk-aversemodel strategies that can be expected to perform well under a wide range ofunderlying species-habitat relationships, particularly at small sample sizes.
Alternatively, sample size has been evaluated based on EVP, being thenumber of events (the smaller of the number of presences or absences) perexplanatory variable. EVP was used to assess the performance of di↵erentmethods for choosing subsets of variables. For logistic regression, they foundthat variable selection methods worked better for large EPV (> 10), whilstregularization methods worked better for low EPV (< 10).
Statistical models were initially used to relate binary outputs to mul-tiple explanatory variables. Widespread choices were logistic regression,other Generalized Linear models (GLMs), and Generalized Additive Models(GAMs). The most prevalent method for variable selection for these mod-els in ecology are based on stepwise selection, where one variable is addedor deleted at each step, and an information theoretic estimate of model fitis used to assess the improvement [12]. So for example AIC is the lack-of-fit measured by the deviance penalized by twice the number of parameters,whereas BIC is the deviance penalized by the number of parameters mul-tiplied by ln(n), where n is the sample size. Other approaches assess allpossible subsets, adding/deleting more than one variable at a time, or utilizean evolutionary algorithm [64]. Penalized approaches to GLM use di↵erentpenalties [30]: lasso regression penalizes a lack-of-fit in terms of the mag-nitude of the parameter; and ridge regression assesses lack-of-fit in termsof sums of squared parameter estimates [64]. Indeed, penalized logistic re-gression performs comparably with MaxEnt in typical SDM situations [23],yet retains the interpretability of the parameters, allowing a stronger linkbetween the ecological and statistical models [5].
Whilst variable selection is embedded within CART, post-hoc methodsare typically used for variable selection in GLMs: forward, backward or step-wise selection [50].
In constructing Bayesian Belief Networks, general advice on building BNstypically advises that the input variables should be simple, comprising nomore than 3–5 categories, and that only the main factors driving any rela-tionship be incorporated, with no more than 2–3 parent (explanatory) vari-ables a↵ecting any child (intermediate response) variable [45, 73]. The main
15

reason for such a constraint is to ensure that experts may easily estimate allentries in the resulting Conditional Probability Tables (CPT), which definethe conditional probability of the child given all combinations of the par-ents. Some methods are emerging for avoiding specification of all entries inthe CPT, such as the CPT Tool, which uses a linear regression to extrap-olate most entries from a few entries, and the Point-of-Truth [POT, 8] andElicitator tool [41], which both use generalized linear (regression) models toperform this extrapolation. Elicitator allows each entry to be specified withvarying uncertainty.
3.4 Data selection
The sampling strategy governing which presence and absence records areincluded in the datasets crucially a↵ect the statistical analysis. Four keyconcerns are:
• Sample size
• Measurement accuracy
– Zeros
– Detectability
• Adequacy reflects how well the chosen indicators reflect the drivers ofthe species-environment relationships in terms of whether a direct orindirect measure is used [27].
• Representativeness, in terms of how well the data represents the region.
• Scale
In the Ecological-Statistical-Data modelling framework of Austin [5] thisis highlighted as an important component of the Data model for developingspecies-environment relationships. From a statistical perspective, represen-tativeness is addressed through design of: data collection for observational(survey) data accounting for sources of observational error [52], if necessaryaccounting for repeated observations [44]; or compilation of data warehouserecords, accounting for varying survey methods and quality [63].
16

It is important to explore the full range of habitat factors (or gradients)[31], since otherwise incomplete views of the response can be obtained. How-ever it is important to be clear about how this translates into a marginalunivariate view of each habitat factor as well as the joint multivariate viewof the potential combinations of habitat factors. For instance, it may be thatan extreme value of one habitat factor only co-occurs with extremes in otherfactors, so that some portions of permissible covariate space are empty.
3.5 Parametric uncertainty
According to Zaehle et al. [80], three types of parametric uncertainty arisein the context of deterministic modelling:
• measurement error, including whether distal indicators are used;
• how well aligned the scales of the measure are to the model; and
• complexity of semi-parametric models;
3.5.1 Sample size
The quality of statistical estimates depends heavily on sample size. Whilsttheoretical results and computing code are widely available for sample sizedetermination in extremely simple models, they are di�cult to locate for thestatistical models typically applied to mapping species distribution [althoughsee 66]. One way to characterize the habitat-space sampled is to calculate therange of each explanatory variable [78]. Simulation studies [78] have demon-strated that predictive performance (measured via AUC) of a wide rangeof SDM modelling approaches was greatly improved for a sample size of 100compared to smaller samples of size 30 or 10 which di↵ered significantly fromthe larger dataset, based on Bonferroni-adjusted t-tests with arc-sine trans-formation. They concluded that “ No algorithm predicted consistently wellwith small sample size (n < 30) and this should encourage highly conserva-tive use of predictions based on small sample size and restrict their use toexploratory modelling. Similarly Hernandez et al. [32] found that sample sizewas pivotal in calibrating models (based on AUC and kappa) for all quan-titative methods and also in quantities closely related to decision-making,such as the area predicted present, and the median prediction probability of
17

success. They also found that the quality of SDMs began to asymptote forsample sizes of 100–150.
The ability to discriminate between presences and absences, using AUCfor instance, is also a↵ected by the number and extent of pseudo-absencesincluded into the model-building process [71]. These authors noted thatWisz and Guisan [77] showed that random sub-sampling of pseudo-absenceswas preferred to a two-step process amounting to redefining an appropriateenvelope for selecting pseudo-absences.
3.5.2 Zeros
The choice of how to select absences for inclusion in model building is typi-cally more challenging than presences. This is primarily due to the influenceof naughty noughts, where some zeros are less relevant than others becausethey occur beyond the envelope of the species [6]. Their inclusion can leadthe model to discriminate between inside and outside the envelope, ratherthan discriminating habitat preferences within the envelope. The dangerof naughty noughts is elevated when true observations of absence are un-available, requiring the use of inferred absence, also called “pseudo-absences.Two-step approaches that constrain choice of pseudo-absences, such as us-ing ENFA (environmental niche factor analysis) or bioclimatic envelopes(BIOCLIM), have been shown to be inferior to random selection of pseudo-absences [77]. A di↵erent type of two-step approach has been used to accountfor zero inflation, namely hurdle models or mixture models [46].
3.5.3 Detectability
In SDMs, the biases arising through imperfect detection can be addressedby introducing additional modelling e↵ort to model the latent variable foroccupancy, that underlies detection which is implicitly conditional on detec-tion [2]. Some standard approaches rely on repeated sampling [44]. Othermethods apply a cascading series of detection methods. One approach min-imizes the chance of false negatives, such as a sequence of site inspectionremotely via binoculars, site-inspection of scats, and helicopter inspection[52]. Another approach commonly applied with exotic pest species minimizesthe chance of false positives, through a sequence of confirmation, startingwith community or industry, escalating to biosecurity extension o�cers oragronomists/veterinarians, and finally reaching the o�cial confirmation by
18

an expert diagnostician [40].
3.5.4 Representativeness
Representativeness, particularly of data warehouses such as museum records,can be biased in at least four di↵erent ways: geographic, environmental, tem-poral and species [69]. This can be due to accessibility and availability, andthe idiosynchratic focus of individual collectors who contribute to museums[57]. One study confirmed that geographic bias, coinciding with major di↵er-ences in sampling e↵ort, had significant impact on the performance (calibra-tion) of models built using MaxEnt, controlling for regularization and modelcomplexity [3].
Representation of environmental space is often characterized in a uni-variate way, by considering the range of each variable. This is the basis oftechniques that model environmental niche, such as BIOCLIM, which cal-culates bounds that contain most values of each variable from the observeddata.
One way of characterizing representativeness is the number of events pervariable (EPV), defined as the number of presences or absences (whicheveris smaller) per explanatory variable [70, 64].
When fitting a regression model (either a GLM or GAM), the moststraightforward interpretations of the coe�cients of explanatory variablesarise when the data can be viewed as a random sample from a hypercube (orenvelope) formed by these univariate ranges. It requires carefully designeddata collection to centre observations within their envelope [5]. However inmany situations the factors governing habitat suitability are arranged in anatural hierarchy leading to a truncated hypercube. These hierarchies canbe somewhat revealed when multi-resolution models such as trees (CART)or Bayesian networks are used to build SDMs.
For species distribution modelling, one di�culty in characterizing envi-ronmental space is that it does not form a convex hypercube, instead forminga hypercube with many ‘holes reflecting combinations of variables that sim-ply do not co-exist in reality. Indeed examining the sampling frame can helptarget data collection and analysis. This approach is useful when extractingdata from a large heterogeneous data warehouse, comprising data from adiverse range of sources, both incidental and purposive sampling.
In particular, stratified sampling based on a sampling frame can helpreduce the number of potential combinations of variables that need be con-
19
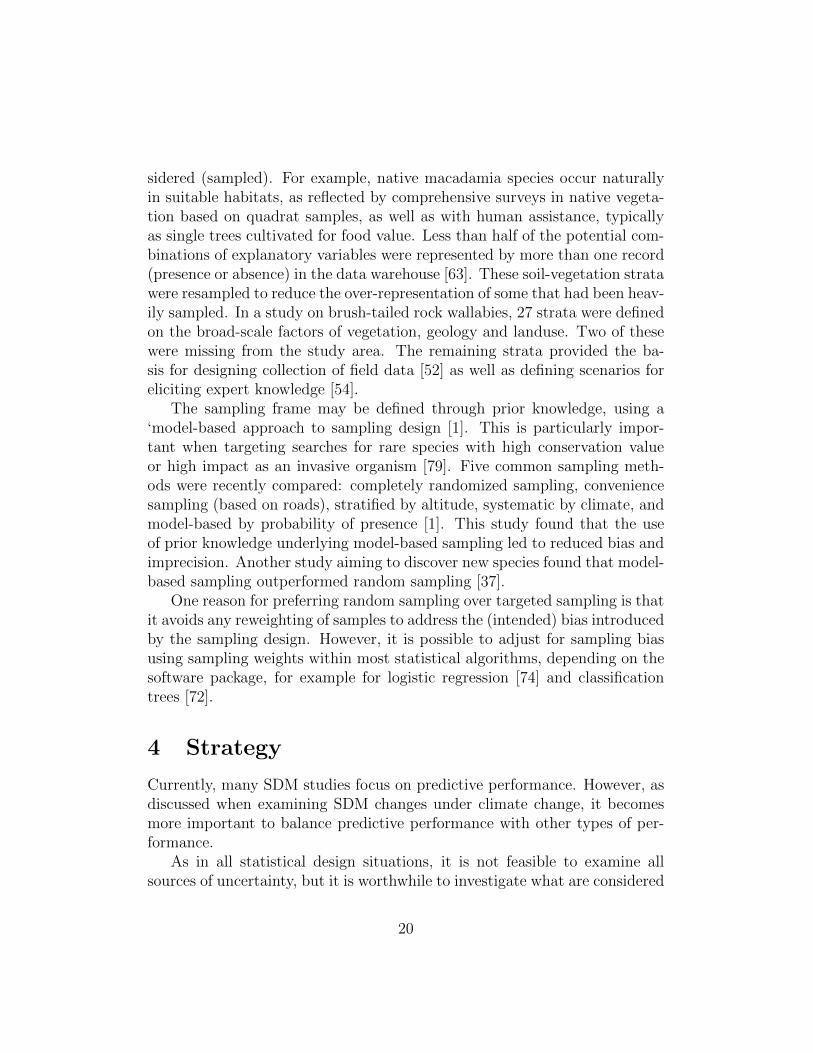
sidered (sampled). For example, native macadamia species occur naturallyin suitable habitats, as reflected by comprehensive surveys in native vegeta-tion based on quadrat samples, as well as with human assistance, typicallyas single trees cultivated for food value. Less than half of the potential com-binations of explanatory variables were represented by more than one record(presence or absence) in the data warehouse [63]. These soil-vegetation stratawere resampled to reduce the over-representation of some that had been heav-ily sampled. In a study on brush-tailed rock wallabies, 27 strata were definedon the broad-scale factors of vegetation, geology and landuse. Two of thesewere missing from the study area. The remaining strata provided the ba-sis for designing collection of field data [52] as well as defining scenarios foreliciting expert knowledge [54].
The sampling frame may be defined through prior knowledge, using a‘model-based approach to sampling design [1]. This is particularly impor-tant when targeting searches for rare species with high conservation valueor high impact as an invasive organism [79]. Five common sampling meth-ods were recently compared: completely randomized sampling, conveniencesampling (based on roads), stratified by altitude, systematic by climate, andmodel-based by probability of presence [1]. This study found that the useof prior knowledge underlying model-based sampling led to reduced bias andimprecision. Another study aiming to discover new species found that model-based sampling outperformed random sampling [37].
One reason for preferring random sampling over targeted sampling is thatit avoids any reweighting of samples to address the (intended) bias introducedby the sampling design. However, it is possible to adjust for sampling biasusing sampling weights within most statistical algorithms, depending on thesoftware package, for example for logistic regression [74] and classificationtrees [72].
4 Strategy
Currently, many SDM studies focus on predictive performance. However, asdiscussed when examining SDM changes under climate change, it becomesmore important to balance predictive performance with other types of per-formance.
As in all statistical design situations, it is not feasible to examine allsources of uncertainty, but it is worthwhile to investigate what are considered
20

to be the major sources of uncertainty. An initial modelling risk analysis maybe able to define the main sources of uncertainty.
As a useful starting point, we propose that where possible, at least onesource of uncertainty be examined from each of the main components of theuncertainty framework: input uncertainty, output uncertainty, quantitativemodel, conceptual model, variable subset selection, and parametric uncer-tainty.
Let us consider an example. Suppose that a Bayesian Belief network(BBN) is to be constructed to model species distribution of an invasivespecies. We may identify a major source of uncertainty under each head-ing.
1. An important form of input uncertainty is accuracy and appropriatescale of spatial data. In practice, however, this can be di�cult tomanage in the short term. Hence it may be more fruitful to focus onrepresentativeness of the dataset in relation to the predicted habitatprofile under core climate change scenarios.
2. Output uncertainty can be visualized either in habitat-space by ex-amining how the graphical model changes, or in geographic space bymapping changes in areas with high predicted probability of presence.
3. The impact of the quantitative model may be useful to examine if thehierarchical model has been elicited from experts. For instance, of in-terest is whether di↵erent forms of quantitative model (such as regres-sion or classification trees) can retrieve similar types of relationships,at least for some portions of the model.
4. Uncertainty in the conceptual model can be assessed through consulta-tion with a number of experts, across a diverse range of backgrounds.
5. A classical approach to examining the importance of variables in BBNsorders variables by their contribution to the entropy of the model. How-ever this tends to emphasize how closely a variable is located to theoutcome node. An alternative approach would examine the connected-ness of variables to other variables in the model, and their role in theconceptual model.
6. Parametric uncertainty can be assessed by comparing BBN estimates ofmarignal and conditional probabilities with those obtained by fitting
21
models to empirical data, whilst acknowledging that empirical datais likely to be less comprehensive than necessary to provide accurateestimates alone. Consider using a Bayesian framework to combine es-timates from both sources.
5 Conclusion
In conclusion, this review has brought together di↵erent strands of researchon the role of uncertainty in SDM modelling, particularly important for ex-trapolation under changes in climate change. We acknowledge the currentfocus on predictive performance, which is crucial for interpolating SDMs, buthighlight that they can be usefully supplemented by other measures of modelperformance for extrapolating SDMs [11].By organizing elements of uncer-tainty under key components, we lay the groundwork for feasibly assessinguncertainty in practice.
Acknowledgements
We gratefully acknowledge funding by the Rural Industries Research & De-velopment Cooperation (RIRDC). The first author would also like to ac-knowledge support from Cooperative Research Centre for National PlantBiosecurity (CRCNPB) under project CRC90143. We would like to thankKristen Williams and Mike Austin for useful background discussion of somekey concepts about species distribution modelling.
References
[1] Albert, C. H., N. G. Yoccoz, T. C. E. Jr, C. H. Graham, N. E. Zimmer-mann, and W. Thuiller (2010). Sampling in ecology and evolution bridgingthe gap between theory and practice. Ecography 33, 1028–1037.
[2] Altwegg, R., M. Wheeler, and B. Erni (2008). Climate and the rangedynamics of species with imperfect detection. Biol. Lett. 4, 581–584.
[3] Anderson, R. P. (2011). Species-specific tuning increases robustness tosampling bias in models of species distributions: An implementation withmaxent. Ecological modelling 222 (15), 2796–.
22

[4] Araujo, M. B. and M. New. Ensemble forecasting of species distributions.TRENDS in Ecology and Evolution 22 (1), 42–47.
[5] Austin, M. P. (2002). Spatial prediction of species distribution: an inter-face between ecological theory and statistical modelling. Ecological Mod-elling 157, 101–118.
[6] Austin, M. P. and J. A. Meyers (1996). Current approaches to modellingthe environmental niche of eucalypts: implication for management of forestbiodiversity. Forest Ecology and Management 85, 95–106.
[7] Barry, S. and J. Elith (2006). Error and uncertainty in habitat models.Journal of Applied Ecology 43 (3), 413–423.
[8] Barry, S. and X. Lin (2010, November). Point of truth calibration:Putting science into scoring systems. Technical Report EP10378, Aus-tralian Centre of Excellence for Risk Analysis (ACERA).
[9] Bateman, B. L., J. van der Wal, and C. N. Johnson (2012). Nice weatherfor bettongs: using weather events, not climate means, in species distribu-tion models. Ecography 35, 306–314.
[10] Beaumont, L. J., L. Hughes, and A. J. Pitman (2008). Why is the choiceof future climate scenarios for species distribution modelling important?Ecology Letters 11, 1135–1146.
[11] Briggs, A. H., B. J. O’Brien, and G. Blackhouse (2002). Thinking outsidethe box: Recent advances in the analysis and presentation of uncertaintyin cost-e↵ectiveness studies. Annu. Rev. Public Health 23, 377–401.
[12] Burnham, K. P. and D. R. Anderson (2002). Model Selection and Multi-Model Inference: A Practical Information-Theoretic Approach (2nd ed.).Springer:New York.
[13] Chen, X., M.-H. Wang, and H. P. Zhang (2011). The use of classificationtrees for bioinformatics. WIREs Data Mining and Knowledge Discovery 1,55–63.
[14] Cli↵ord, S., S. Low-Choy, and K. Mengersen ((in press)). Bayesiansplines. In C. Alston, K. Mengersen, and A. N. Pettitt (Eds.), Case Studiesin Bayesian Statistical Modelling and Analysis. John Wiley & Sons, Inc:London.
23

[15] Congdon, P. (2006). Bayesian statistical modelling.
[16] De’ath, G. and K. E. Fabricius (2000). Classification and regressiontrees: A powerful yet simple technique for ecological data analysis. Ecol-ogy 81 (11), 3178–3192.
[17] Dormann, C. F., O. Purschke, J. R. G. Marquez, S. Lautenbach, andB. Schroder (2008). Components of uncertainty in species distributionanalysis: A case study of the great grey shrike. 89 (12), 3371–3386.
[18] Dormann, C. F., O. Schweiger, P. Arens, I. Augenstein, S. Aviron,D. Bailey, J. Baudry, R. Billeter, R. Bugter, R. Bukacek, F. Burel,M. Cerny, R. D. Cock, G. D. Blust, R. DeFilippi, T. Diekotter, J. Dirk-sen, W. Durka, P. J. Edwards, M. Frenzel, R. Hamersky, F. Hendrickx,F. Herzog, S. Klotz, B. Koolstra, A. Lausch, D. L. Coeur, J. Liira, J. P.Maelfait, P. Opdam, M. Roubalova, A. Schermann-Legionnet, N. Scher-mann, T. Schmidt, M. J. M. Smulders, M. Speelmans, P. Simova, J. Ver-boom, W. van Wingerden, and M. Zobel (2008). Prediction uncertainty ofenvironmental change e↵ects on temperate European biodiversity. EcologyLetters 11, 235–244.
[19] Elith, J., C. H. Graham, R. P. Anderson, M. Dudik, S. Ferrier,A. Guisan, R. J. Hijmans, F. Huettmann, J. R. Leathwick, A. Lehmann,J. Li, L. G. Lohmann, B. A. Loiselle, G. Manion, C. Moritz, M. Nakamura,Y. Nakazawa, J. M. Overton, A. T. Peterson, S. J. Phillips, K. Richard-son, R. Scachetti-Pereira, R. E. Schapire, J. Soberon, S. Williams, M. S.Wisz, and N. E. Zimmermann (2006). Novel methods improve predictionof species distributions from occurrence data. Ecography 29, 129–151.
[20] Elith, J. and J. R. Leathwick (2009). Species distribution models: Eco-logical explanation and prediction across space and time. Annu. Rev. Ecol.Evol. Syst. 40, 67797.
[21] Ellison, Aaron, M. (2004). Bayesian inference in ecology. Ecology Let-ters 7 (6), 509–520.
[22] Fielding, A. and J. F. Bell (1997). A review of methods for the as-sessment of prediction errors in conservation presence/ absence models.Environmental Conservation 24, 38–49.
24

[23] Gaston, A. and J. I. Garcia-Vinas (2011). Modelling species distributionswith penalised logistic regressions: A comparison with maximum entropymodels. Ecological Modelling 222, 2037–2041.
[24] Gotelli, N. J. and W. Ulrich (2012). Statistical challenges in null modelanalysis. Oikos 121, 171–180.
[25] Guisan, A., A. Lehmann, S. Ferrier, M. Austin, J. M. C. Overton, R. As-pinall, and T. Hastie (2006). Guest editorial: Making better biogeographi-cal predictions of species’ distributions. Journal of Applied Ecology 43 (3),386–392.
[26] Guisan, A. and W. Thuiller (2005). Predicting species distribution:o↵ering more than simple habitat models. Ecology Letters 8, 9931009.
[27] Guisan, A. and N. E. Zimmermann (2000). Predictive habitat distribu-tion models in ecology. Ecological Modelling 135, 147–186.
[28] Hanspach, J., I. Kuhn, S. Pompe, and S. Klotz (2010). Predictive per-formance of plant species distribution models depends on species traits.Perspectives in Plant Ecology, Evolution and Systematics 12, 219–225.
[29] Hanspach, J., I. Kuhn, O. Schweiger, S. Pompe, and S. Klotz (2011).Geographical patterns in prediction errors of species distribution models.Global Ecology and Biogeography 20, 779–788.
[30] Hastie, T., R. Tibshirani, and J. Friedman (2002). The Ele-ments of Statistical Learning: Data Mining, Inference, and Prediction(Second Edition, Fifth reprinting ed.). Springer-Verlag. Availableonline at http://www.stanford.edu/
~
hastie/local.ftp/Springer/
ESLII_print5.pdf, accessed 3 April 2012.
[31] Heikkinen, R. K., M. Luoto, M. B. Araujo, R. Virkkala, W. Thuiller,and M. T. Sykes (2006). Methods and uncertainties in bioclimatic envelopemodelling under climate change. Progress in Physical Geography 30 (6),751–777.
[32] Hernandez, P. A., C. H. Graham, L. L. Master, and D. L. Albert (2006).The e↵ect of sample size and species characteristics on performance ofdi↵erent species distribution modeling methods. Ecography 29, 773–785.
25

[33] HOTHORN, T., J. MULLER, B. SCHRODER, T. KNEIB, andR. BRANDL (2011). Decomposing environmental, spatial, and spatiotem-poral components of species distributions. Ecological Monographs 81 (2),329–347.
[34] Hu, W., R. A. O’Leary, K. Mengersen, and S. Low-Choy (accepted 28July 2011). Bayesian classification and regression trees for predicting in-cidence of cryptosporidiosis. PLoS ONE .
[35] Hubbard, R. and J. S. Armstrong (2006). Why we don’t really knowwhat statistical significance means: Implications for educators. Journal ofMarketing Education 28 (2), 114–120.
[36] Jeschke, J. M. and D. L. Strayer (2008). Usefulness of bioclimatic mod-els for studying climate change and invasive species. Ann. N.Y. Acad.Sci. 1134, 1–24.
[37] Le Lay, G., R. Engler, E. Franc, and A. Guisan (2010). Prospectivesampling based on model ensembles improves the detection of rare species.Ecography 33, 1015–1027.
[38] Levins, R. (1966). The strategy of model building in population biology.Am. Sci. 54, 421–431.
[39] Loiselle, B. A., C. A. Howell, C. H. Graham, J. M. Goerck, T. Brooks,K. G. Smith, and P. H. Williams. Avoiding pitfalls of using species dis-tribution models in conservation planning. Conservation Biology 17 (6),1591–1600.
[40] Low-Choy, S., N. Hammond, L. Penrose, C. Anderson, and S. Tay-lor (2011, Dec). Dispersal in a hurry: Bayesian learning from surveil-lance to establish area freedom from plant pests with early dispersal. InF. Chan, D. Marinova, and R. Anderssen (Eds.), MODSIM2011, 19th In-ternational Congress on Modelling and Simulation, pp. 2521–2527. Mod-elling and Simulation Society of Aust. and NZ. Available online atwww.mssanz.org.au/modsim2011/E16/low_choy.pdf.
[41] Low-Choy, S., A. James, J. Murray, and K. Mengersen ((to appearNovember 2011)). Elicitator: a user-friendly, interactive tool to supportthe elicitation of expert knowledge. In A. H. Perera, C. A. Drew, and
26
C. J. Johnson (Eds.), Expert Knowledge and Its Applications in LandscapeEcology, Chapter 3. Springer, NY.
[42] Low Choy, S., J. Murray, A. James, and K. Mengersen (2010). Indirectelicitation from ecological experts: from methods and software to habi-tat modelling and rock-wallabies. In A. O’Hagan and M. West (Eds.),Handbook of Applied Bayesian Analysis. Oxford University Press, Oxford,UK.
[43] Low Choy, S., R. O’Leary, and K. Mengersen (2009). Elicitation bydesign for ecology: using expert opinion to inform priors for Bayesianstatistical models. Ecology 90, 265–277.
[44] Mackenzie, D. I. (2006). Modeling the probability of resource use: Thee↵ect of, and dealing with, detecting a species imperfectly. Journal ofWildlife Management 70 (2), 367–374.
[45] Marcot, B., J. D. Steventon, G. D. Sutherland, and R. K. McCann(2006). Guidelines for developing and updating bayesian belief networksapplied to ecological modeling and conservation. Canadian Journal ofForest Research 36, 3063–3074.
[46] Martin, T., B. A. Wintle, J. R. Rhodes, P. M. Kuhnert, S. A. Field,S. J. Low-Choy, A. J. Tyre, and H. P. Possingham (2005). Zero toleranceecology: improving ecological inference by modelling the sources of zeroobservations. Ecology Letters 8, 1235–1246.
[47] Martin, T. G., M. A. Burgman, F. Fidler, P. M. Kuhnert, S. Low-Choy,M. McBride, and K. Mengersen (2012). Eliciting expert knowledge inconservation science. Conservation Biology 26 (1), 29–38.
[48] Merritt, W., R. Letcher, and A. Jakeman (2003). A review of erosionand sediment transport models. Environmental Modelling and Software 18,761–799.
[49] Meynard, C. N. and J. F. Quinn (2007). Predicting species distribu-tions:a critical comparison of the most common statistical models usingartificial species. Journal of Biogeography 34, 1455–1469.
27

[50] Miller, J. and J. Franklin (2002). Modeling the distribution of fourvegetation alliances using generalized linear models and classification treeswith spatial dependence. Ecological Modelling 157, 227–247.
[51] Mukherjee, A., M. C. Christman, W. A. Overholt, and J. P. Cuda (2011).Prioritizing areas in the native range of hygrophila for surveys to collectbiological control agents. Biological Control 56, 254–262.
[52] Murray, J., S. Low Choy, A. Goldizen, and P. Possingham (2008). Theimportance of ecological scale for wildlife conservation in naturally frag-mented environments: A case study of the brush-tailed rock-wallaby (pet-rogale penicillata). Biological Conservation 141, 7–22.
[53] Murray, J., S. Low-Choy, C. McAlpine, H. Possingham, and A. Goldizen(2011). Evaluating model transferability for a threatened species to ad-jacent areas: implications for rock-wallaby conservation. Austral Ecology ,(to appear).
[54] Murray, J. V., A. W. Goldizen, R. A. O’Leary, C. A. McAlpine, H. Poss-ingham, and S. Low Choy (2009). How useful is expert opinion for predict-ing the distribution of a species within and beyond the region of expertise?A case study using brush-tailed rock-wallabies petrogale penicillata. Jour-nal of Applied Ecology 46, 842–851.
[55] Murray, J. V., K. Stokes, and R. D. van Klinken ((in press)). Predictingmultiple e↵ects of climate change on future plant invasions. Global ChangeBiology 0, 000–000.
[56] Nakagawa, S. and I. C. Cuthill (2007). E↵ect size, confidence intervaland statistical significance: a practical guide for biologists. Biol. Rev. 82,591–605.
[57] Newbold, T. (2010). Applications and limitations of museum data forconservation and ecology, with particular attention to species distributionmodels. Progress in Physical Geography 34 (1), 3–22.
[58] O’Leary, R., W. B. Hu, S. Low-Choy, and K. Mengersen (in press).Bayesian classification and regression trees. In A. C., K. Mengersen, andA. N. Pettitt (Eds.), Case Studies in Bayesian Statistical Modelling andAnalysis.
28

[59] Paini, D. R., S. P. Worner, D. C. Cook, P. J. D. Barro, and M. B.Thomas (2010). Using a self-organizing map to predict invasive species:sensitivity to data errors and a comparison with expert opinion. Journalof Applied Ecology 47, 290–298.
[60] Pearce, J. and S. Ferrier (2000). Evaluating the predictive performanceof habitat models developed using logistic regression. Ecological Mod-elling 133, 225–245.
[61] Phillips, S. J., R. P. Anderson, and R. E. Schapire (2006). Maximumentropy modeling of species geographic distributions. Ecological Mod-elling 190, 231–259.
[62] Phillips, S. J. and M. Dudik (2008). Modeling of species distributionswith maxent: new extensions and a comprehensive evaluation. Ecogra-phy 31, 161–175.
[63] Powell, M., A. Accad, M. P. Austin, S. Low Choy, K. J. Williams, andA. Shapcott (2010). Predicting loss and fragmentation of habitat of thevulnerable subtropical rainforest tree macadamia integrifolia with modelsdeveloped from compiled ecological data. Biological Conservation 143,1385–1396.
[64] Reineking, B. and B. Schroder (2006). Constrain to perform: Regular-ization of habitat models. Ecological modelling 193 (3), 675–.
[65] Schmidt, F. L. (1996). Statistical significance testing and cumulativeknowledge in psychology: Implications for training of researchers. Psycho-logical Methods 1 (2), 115–129.
[66] Seavy, N. E., S. Quader, J. D. Alexander, and C. J. Ralph (2005). Gen-eralized linear models and point count data: Statistical considerations forthe design and analysis of monitoring studies. Technical Report PSW-GTR-191, USDA Forest Service.
[67] Segurado, P. and M. B. Araujo. An evaluation of methods for modellingspecies distributions. Journal of Biogeography 31, 1555–1568.
[68] Sharpe, P. J. A. (1990). Forest modeling approaches: compromises be-tween generality and precision. In R. Dixon, R. S. Meldahl, G. Ruark,
29

and W. Warren (Eds.), Process Modeling of Forest Growth Responses toEnvironmental Stress, pp. 180–190. Timber Press, Portland, OR.
[69] Soberon, J. M., J. Llorente, and L. Onate (2000). The use of specimen-label databases for conservation purposes: an example using mexican pa-pilionid and pierid butterflies. Biodiversity and Conservation 9, 1441–66.
[70] Steyerberg, E. W., M. J. C. Eijkemans, F. E. Harrell, and J. D. F.Habbema (2001). Prognostic modeling with logistic regression analysis: insearch of a sensible strategy in small data sets. Med. Decis. Making 21,45–56.
[71] Stokland, J. N., R. Halvorsen, and B. Stoa (2011). Species distributionmodellinge↵ect of design and sample size of pseudo-absence observations.Ecological Modelling 222, 1800–1809.
[72] Therneau, T. M. and E. J. Atkinson (1997). An introduction to recursivepartitioning using the RPART routines. Technical Report 61, Mayo Clinic,Section of Statistics. Available online at http://mayoresearch.mayo.
edu/mayo/research/biostat/upload/61.pdf. Last accessed 30 April2012.
[73] Uusitalo, L. (2007). Advantages and challenges of bayesian networks inenvironmental modelling. Ecological Modelling 203, 312–318.
[74] Venables, W. N. and B. D. Ripley (2002). Modern applied statisticswith s.
[75] Venette, R. C., D. J. Kriticos, R. D. Magarey, F. H. Koch, R. H. A.Baker, S. P. Worner, N. N. G. Raboteaux, D. W. McKenney, E. J. Dobes-berger, D. Yemshanov, P. J. D. Barro, W. D. Hutchison, G. Fowler, T. M.Kalaris, and J. Pedlar (2010). Pest risk maps for invasive alien species: Aroadmap for improvement. BioScience 60 (5), 349–362.
[76] Williams, K., S. Low-Choy, W. Rochester, and C. Alston (to appear,November 2011). Using Bayesian mixture models that combine expertknowledge and GIS data to define ecoregions. In A. H. Perera, C. A.Drew, and C. J. Johnson (Eds.), Expert Knowledge and Its Application inLandscape Ecology, Chapter 12. Springer, NY.
30

[77] Wisz, M. S. and A. Guisan (2009). Do pseudo-absence selection strate-gies influence species distribution models and their predictions? aninformation-theoretic approach based on simulated data. BMC Ecol-ogy 9 (8).
[78] Wisz, M. S., R. J. Hijmans, J. Li, A. T. Peterson, C. H. Graham,A. Guisan, and N. Predicting Species Distributions Working Group (2008).E↵ects of sample size on the performance of species distribution models.Diversity and Distributions 14, 763–773.
[79] Worner, S. P. and M. Gevrey (2006). Modelling global insect pestspecies assemblages to determine risk of invasion. Journal of Applied Ecol-ogy 43 (5), 858–867.
[80] Zaehle, S., S. Sitch, B. Smith, and F. Hatteman (2005). E↵ects ofparameter uncertainties on the modeling of terrestrial biosphere dynamics.Global Biogeochemical Cycles 19 (GB3020).
[81] Zimmermann, N. E., T. C. E. Jr., C. H. Graham, P. B. Pearman, andJ.-C. Svenning (2010). New trends in species distribution modelling. Ecog-raphy 33, 985–989.
31