c nservation c nnection - department of water … · a i n r o f i l a c n i e s u y g r e n e w....
TRANSCRIPT

PRODUCED BY:
and
through a grant fromThe State of California Department of Water Resources
2004
CURRICULUM DEVELOPMENT BY: Educational Development Specialists
GRAPHICS BY: Design Perspective
ILLUSTRATION BY: Olimb Graphics
A C U R R I C U L U M
A N A L Y Z I N G W A T E R & E N E R G Y U S E
A T H O M E A N D A T S C H O O L
C NSERVATION C NNECTION
WATER & ENERGY USE IN CALIFORNIA
Central BasinMunicipal Water District
West BasinMunicipal Water District
T E A C H E R
Learning Objectives
1. Identify basic facts about the sources supplying water in California—surface water and groundwater.
2. Identify the various uses of water throughout California in the agricultural, environmental, and urban sectors.
3. Identify the problems of water supply meeting water demand, including:
- money - the environment - population
4. Identify ways of stretching our water supply, including:
- recycling - desalination - new water-efficient technologies - conservation practices
5. Identify basic facts about the sources supplying energy in California, including:
- fossil fuels - hydropower - nuclear power - biomass - geothermal - wind - solar
6. Identify the various uses of energy throughout California in the transportation, industry, business, and residential sectors.
7. Identify the problems of energy supply meeting energy demand, including:
- supply - the environment - money - population
8. Identify ways of supplying energy in the future, including:
- new energy-efficient technologies - renewable sources - fuel cells - conservation practices
9. Assess water and energy usage by surveying: - personal habits - home use and efficiency - school use and efficiency
10. Identify, plan, and implement measures to save water and energy at home and at school.
C NSERVATION C NNECTION
WATER & ENERGY USE IN CALIFORNIA
We turn on the tap and water flows out. We turn on a lamp and light fills the room. We depend on water and energy. We need water and energy to live in this world. But where do we get the water and energy that we use? And will we always have enough to meet our needs?
Conservation Connection answers those questions, showing the connections between California, our water and energy supply, and us. But providing information is only part of Conservation Connection. The goal of the curriculum is to get students actively involved—in their homes and at school—in conserving water and energy.
Within the program, students have the opportunity to: - survey their families ̓water and energy use - survey water and energy use at their school.
After gathering data, analyzing their findings, and reviewing recommendations, students make, implement, and monitor plans to decrease water and energy use. By participating in this action-based curriculum, students will learn to look criti-cally at important environmental issues and take responsibility for finding solutions.
i

Lesson FormatEach lesson is formatted as follows:
Lesson Overview: Briefly summarizes the activities that students will be doing.Vocabulary: Lists words that are important and that may be unfamiliar to students.Materials and Preparation: Specifies the materials needed in the lesson (e.g., worksheets, demonstration equipment) and describes what needs to be done prior to teaching the lesson (e.g., copy worksheet, set up demonstration).Approximate Time Requirement: Gives the esti-mated amount of time needed to conduct all of the activities within the lesson.Procedures: Provides detailed steps for conducting the activities, including discussion questions and sug-gested answers.Extensions: Suggests other activities to extend the learning, including conducting experiments, providing more practice, addressing other content standards, and expanding the concepts into the community.
MaterialsThe following materials are included to teach the lessons: • Teacher Guide • Student Booklet (16 pages) • Transparency Masters - How Much Water Does It Use? - How Much Energy Does It Use? • Worksheet Masters - Personal Water & Energy Use (2 pages) - Energy Source Comparison - Summary of Ways to Save Water & Energy at
Home (2 pages) - Personal Water & Energy Conservation Plan - Family Water & Energy Conservation Plan - School Water & Energy Conservation Plan - Assessment (2 pages) • Survey Masters - Home Water & Energy Survey (4 pages) - School Water & Energy Survey (4 pages) • Recommendation Masters - Ways to Save Water & Energy at Home (5 pages) - Ways to Save Water & Energy at School (5 pages)
Any other materials needed to conduct demonstrations or other activities in the lessons are common items, for example, poster paper, water, gallon containers. All neces-sary materials and preparation are listed at the beginning of each lesson.
Instructional StrategiesEach section in the student booklet begins with Think About It... questions, in which students are challenged to explore the answers before they are presented with the information in Learn About It....
The Home Water & Energy Survey is assigned in Lesson 1, giving students time with their families to complete it by Lesson 6 when the surveys are analyzed, as well as get-ting students personally involved in their use of water and energy while they are learning about the topic. The School Water and Energy Survey, which is presented in Lesson 7, can also be conducted while students are learning about the supply and demand of water and energy in California. The school survey or a community survey could also be used as a culminating activity.
CorrelationsThe activities within these lessons can be used to support many of the California State Content Standards. A chart in the appendix shows lesson correlations with standards in Science, Language Arts, and Math for grades 6 through 8.
AssessmentA cognitive assessment of the objectives listed previously is included in the appendix. If students read, discuss, and practice the information contained in the student booklet, the test can be used to assess their comprehension.
Portfolios containing students ̓worksheets, surveys, and conservation plans can also be used to assess students, especially in relation to implementing and monitoring their plans. Portfolios can become an integral aspect of the instructional process. And if less focus is placed on the cognitive information and more on the applied learning, the portfolio assessment would be most appropriate.
ii

C O N T E N T SC NSERVATION C NNECTION
WATER & ENERGY USE IN CALIFORNIA
S❂ L E S S O N 1 : W A T E R , E N E R G Y , & Y O U . . . . . . . . . . 1 I. Introduce the program II. Learn About Water, Energy, & You III. Track Personal Water and Energy Use IV. Introduce the Home Water & Energy Survey
Extension Activities
S L E S S O N 2 : W A T E R S U P P L Y & D E M A N D . . . . . . . . . . 4 I. Think About Water Sources II. Learn About Water Sources III. Think About Water Use IV. Learn About Water Use V. Continue Tracking Water Use
Extension Activities
S L E S S O N 3 : W A T E R & T H E F U T U R E . . . . . . . . . . . . . 7 I. Think About Water & the Future II. Learn About Recycling III. Learn About Desalination IV. Learn About Conservation V. Calculate Personal Water Use
Extension Activities
❂ L E S S O N 4 : E N E R G Y S U P P L Y & D E M A N D . . . . . . . . . 1 1 I. Think About Energy Sources II. Prepare Student Presentations III. Think About Energy Use IV. Learn About Energy Use V. Conduct Presentations VI. Compare Energy Sources
Extension Activities
❂ L E S S O N 5 : E N E R G Y & T H E F U T U R E . . . . . . . . . . . . 1 5 I. Think About Energy & the Future II. Learn About Energy & the Future III. Calculate Personal Energy Use
Extension Activities
PAGE
iii

C O N T E N T SC NSERVATION C NNECTION
WATER & ENERGY USE IN CALIFORNIA
S❂ L E S S O N 6 : H O M E W A T E R & E N E R G Y S U R V E Y . . . . . 1 8 I. Analyze Completed Home Water Surveys II. Make Personal Conservation Plans III. Make Family Conservation Plans IV. Evaluate Conservation Plans V. Calculate Savings in Water and Energy
Extension Activities
S❂ L E S S O N 7 : S C H O O L W A T E R & E N E R G Y S U R V E Y . . . 2 1 I. Conduct School Water & Energy Survey II. Analyze School Water & Energy Survey III. Develop a School Water & Energy Conservation Plan IV. Monitor and Evaluate School Conservation Plan
Extension Activities
S❂ A P P E N D I C E S Masters Worksheets and Information Sheets . . . . . . . . . . . . . . . . . . . . . . . . . . . . . 25
• Personal Water & Energy Use (2 pages) • How Much Water Does It Use? • Energy Source Comparison • How Much Energy Does It Use? • Summary of Ways to Save Water & Energy at Home (2 pages) • Personal Water & Energy Conservation Plan • Family Water & Energy Conservation Plan • School Water & Energy Conservation Plan • Assessment (2 pages)
Surveys and Recommendations . . . . . . . . . . . . . . . . . . . . . . . . . . . . . . . . 38
• Home Water & Energy Survey (4 pages) • Ways to Save Water & Energy at Home (5 pages) • School Water & Energy Survey (4 pages) • Ways to Save Water & Energy at School (5 pages)
Correlations to California State Content Standards . . . . . . . . . . . . . . . . . . . . . . 57Resources . . . . . . . . . . . . . . . . . . . . . . . . . . . . . . . . . . . . . . . . . . . . . . . . . . . . . . . . . . . . 58
PAGE
iv

L E S S O N 1 : W A T E R , E N E R G Y , & Y O US❂ Lesson Overview Students will: • be introduced to the importance of water and
energy and compare their use to use in the past • keep track of personal water and energy use • begin the Home Water & Energy Survey
S❂ Vocabulary • condensation • nonrenewable • renewable • evaporation • precipitation • transpiration
S❂ Materials and Preparation • Conservation Connection student booklets • Personal Water & Energy Use worksheet (2 pages) - copy for each student (back-to-back,
if possible) • Home Water & Energy Survey (4 pages)
- copy for each student (as a 4-page foldover on ledger-size paper, if possible)
S❂ Approximate Time Requirement • 1 class period
S❂ Procedures
I. Introduce the program
A. Distribute a copy of the student booklet, Conser-vation Connection, to each student and explain that the class is going to be learning about the use of water and energy, especially in California. Allow students a few moments to look through the book.
B. Ask students to turn to page 2. Read aloud and have students discuss the questions under Think About It.... In the discussion of each question, allow students to share their ideas, but be sure to point out the following:1. What would a day be like without water or
energy?There would be no day as we know it without water and energy; we need the radiant heat and light from the sun; we need water to drink. Without water and energy, we could not live.
2. How have you personally used water and energy today?Some personal uses may not be so obvious, such as reading clocks, drinking milk that was kept cold in the refrigerator, talking on the phone, and flushing toilets.
3. How do you think your use of water and energy compares to peopleʼs use 100 years ago?A hundred years ago, people did not have such easy access to water and energy, and they did not have so many products that use water and energy. Edison did not invent the light bulb until 1879, and the first electric power station wasn t̓ built until 1882; the electric vacuum cleaner and washing machine were invented in 1907; the Model T automobile was put into production in 1913; only about 60% of farms had flowing indoor water by 1936.)
4. Is there enough water and energy to last forever?We do expect the sun to continue to shine and rain to continue to fall; thus, we expect there to always be water and energy. However, will we always have enough clean water and enough energy when and where it is needed for everyone?
C. Have students work in groups to list all the uses they can think of for water and for energy. Remind students that water and energy are used in places other than in the home, for example, to fight fires, grow food, manufacture paper. Ask each group to read their lists—water use and energy use. Point out that along with their direct uses, they are responsible for many “indirect” uses of water and energy in industry and agriculture.
C O N N E C T I O N : W a t e r, E n e r g y, & Y o u
Think About It...�� What would a day be like without water or energy?�� How have you personally used water and energy today?�� How do you think your use of water and energy compares
to people’s use 100 years ago?�� Is there enough water and energy to last forever?
Learn About It...
We need water and energy.
Water makes up about 65% of our bodies; we cannot live more than about a weekwithout drinking water. And we needwater to grow our food and makeproducts that we use every day.
Energy is essential to life; we couldnot exist without the heat, light, andfood that are created by the energythe sun provides. And, of course, weuse energy in so many other ways,from cooking our food to running our cars.
We use a lot of water and energyevery day. Is there a never ending supply? Well, yes...and no.
Water does fall from the sky, but it isnot “new” water, just recycled water.The amount of water on Earth neverincreases or decreases. We have afixed supply.
Heated by the sun, water on theground in oceans, lakes, rivers,streams, and other areas evaporates;water vapor is also released fromplants through transpiration. All thiswater vapor rises into the air, cools,and condenses into tiny droplets that gather andform clouds or fog. Finally, when the clouds meetcool air over land, precipitation in the form of rain,hail, sleet, or snow is triggered, and water returns tothe land or sea. Thus, the water you use is the same
water used by dinosaurs, early Native Americans,pilgrims, and your great grandparents.
Energy—which produces heat, light,or motion—comes from manysources, such as:� fossil fuels (oil, natural gas, coal)
� the sun
� the wind
Some of our energy sources arerenewable; they can keep on provid-ing energy. For example, we expectthe sun to keep shining and the windto keep blowing. However, the energysources that we depend on the most—oil, natural gas, and coal—are non-renewable. There is only a limitedsupply of these fossil fuels in theearth. Once they’re gone, they’re gone forever.
Our supply of water and energy meetsour needs most of the time. But, intimes of drought and during periodsof high energy demand, we don’thave enough water and energy. Andthe demand for water and energy isgrowing—every day—while our sup-ply is decreasing as the population
grows and as we find more ways to use these pre-cious resources.
So how can we be sure we have enough for thefuture?
WE NEED WATER AND ENERGY
2
C NSERVATIONC NNECTION
WATER & ENERGY USE IN CALIFORNIA
C NSERVATION C NNECTION
WATER & ENERGY USE IN CALIFORNIA
1
L E S S O N 1 : W A T E R , E N E R G Y , & Y O UII. Learn About Water, Energy, & You
A. Have students read the text under Learn About It... on page 2. Then use the questions below to briefly discuss what they read. Alternatively, write the questions on the chalkboard, divide students into groups, and have each group answer the questions using the information on page 2 in their booklets.1. What is the water cycle?
Water circulates constantly. Water that evaporates from the ground or that is released from plants through transpiration rises into the air as water vapor. In the air, it cools and condenses and eventually falls to the earth as precipitation (rain, snow, sleet, hail), where it again evaporates and rises into the air.
2. Can we increase our supply of water?No. We have a fixed supply of water. Varying amounts of water are available in different places and at different times depending on geography and weather, but only a limited amount of water exists on Earth.
3. How can you tell when energy is being used?Energy is being used any time there is heat, light, or motion.
4. Whatʼs the difference between renewable and nonrenewable energy sources?Renewable energy sources never get used up; they are constantly resupplied by natural pro-cesses. For example, sun, wind, wood, and water are all renewable energy sources. Nonrenewable sources have only a limited amount. For example, once weʼve used up all the fossil fuels (oil, natural gas, coal), there will never be any more.
5. Why do we need to be concerned about our supply of water and energy?As our population grows and as we find more and more ways to use energy and water, we are using more water and energy all the time. In times of drought, our supply of water is sometimes not enough for everyone. And during periods of high energy demand, such as on hot summer days, we sometimes can t̓ produce enough energy.
III. Track Personal Water and Energy Use
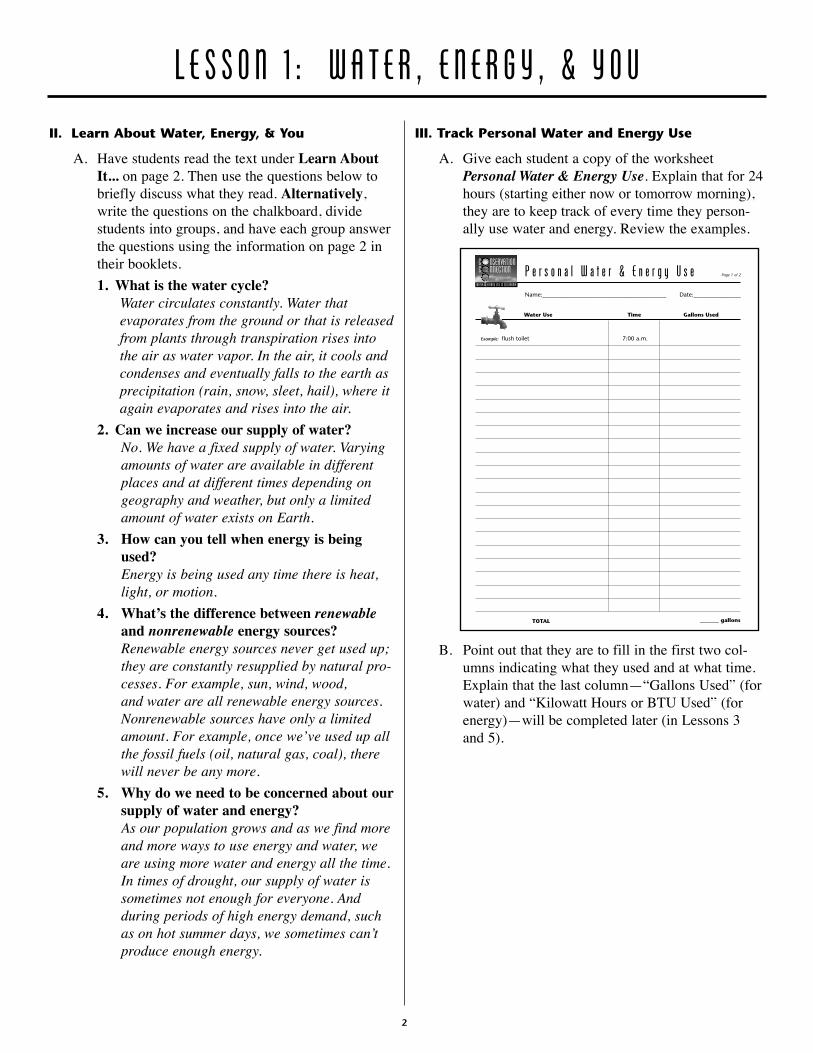
A. Give each student a copy of the worksheet Personal Water & Energy Use. Explain that for 24 hours (starting either now or tomorrow morning), they are to keep track of every time they person-ally use water and energy. Review the examples.
B. Point out that they are to fill in the first two col-umns indicating what they used and at what time. Explain that the last column—“Gallons Used” (for water) and “Kilowatt Hours or BTU Used” (for energy)—will be completed later (in Lessons 3 and 5).
P e r s o n a l W a t e r & E n e r g y U s eName:__________________________________________ Date:________________
Water Use Time Gallons Used
Example: flush toilet 7:00 a.m.
_______ gallonsTOTAL
C NSERVATIONC NNECTION
WATER & ENERGY USE IN CALIFORNIA
Page 1 of 2
2
IV. Introduce the Home Water & Energy Survey
A. Ask students if they think any water or energy is wasted in their homes.
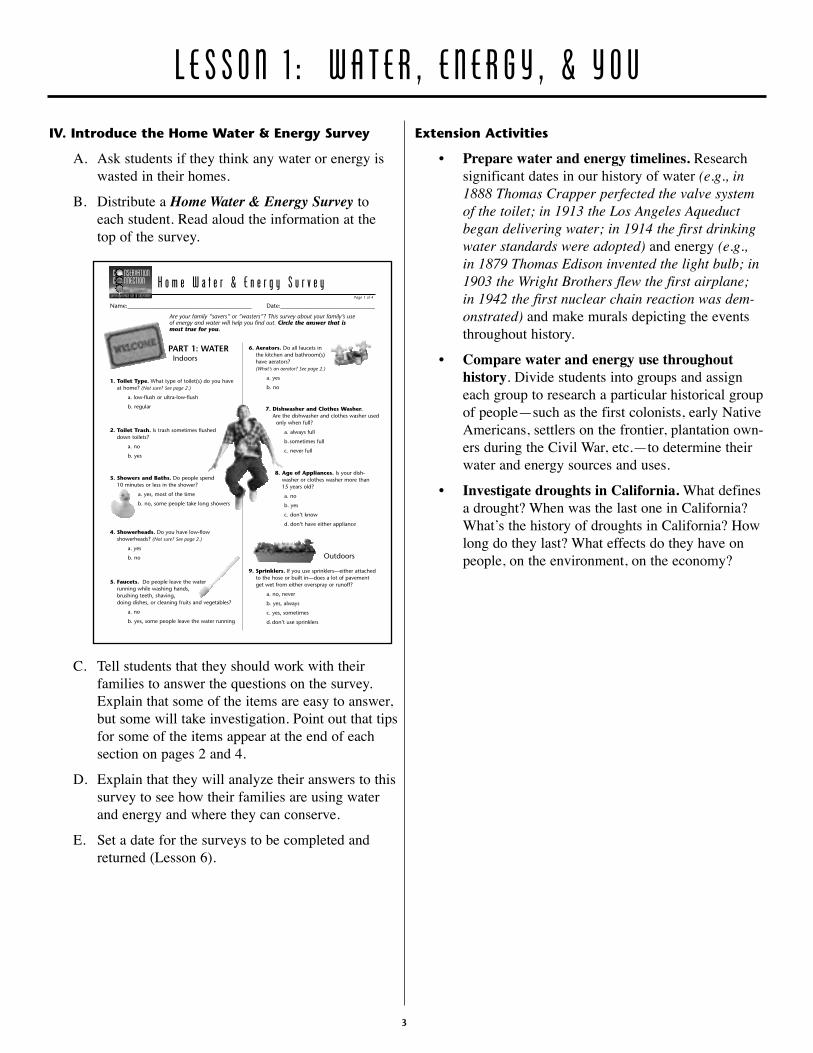
B. Distribute a Home Water & Energy Survey to each student. Read aloud the information at the top of the survey.
C. Tell students that they should work with their families to answer the questions on the survey. Explain that some of the items are easy to answer, but some will take investigation. Point out that tips for some of the items appear at the end of each section on pages 2 and 4.
D. Explain that they will analyze their answers to this survey to see how their families are using water and energy and where they can conserve.
E. Set a date for the surveys to be completed and returned (Lesson 6).
Extension Activities
• Prepare water and energy timelines. Research significant dates in our history of water (e.g., in 1888 Thomas Crapper perfected the valve system of the toilet; in 1913 the Los Angeles Aqueduct began delivering water; in 1914 the first drinking water standards were adopted) and energy (e.g., in 1879 Thomas Edison invented the light bulb; in 1903 the Wright Brothers flew the first airplane; in 1942 the first nuclear chain reaction was dem-onstrated) and make murals depicting the events throughout history.
• Compare water and energy use throughout history. Divide students into groups and assign each group to research a particular historical group of people—such as the first colonists, early Native Americans, settlers on the frontier, plantation own-ers during the Civil War, etc.—to determine their water and energy sources and uses.
• Investigate droughts in California. What defines a drought? When was the last one in California? Whatʼs the history of droughts in California? How long do they last? What effects do they have on people, on the environment, on the economy?
H o m e W a t e r & E n e r g y S u r v e y
PART 1: WATERIndoors
1. Toilet Type. What type of toilet(s) do you have at home? (Not sure? See page 2.)
a. low-flush or ultra-low-flush
b. regular
2. Toilet Trash. Is trash sometimes flushed down toilets?
a. no
b. yes
3. Showers and Baths. Do people spend 10 minutes or less in the shower?
a. yes, most of the time
b. no, some people take long showers
4. Showerheads. Do you have low-flow showerheads? (Not sure? See page 2.)
a. yes
b. no
5. Faucets. Do people leave the water running while washing hands,brushing teeth, shaving, doing dishes, or cleaning fruits and vegetables?
a. no
b. yes, some people leave the water running
Are your family “savers” or “wasters”? This survey about your family’s useof energy and water will help you find out. Circle the answer that ismost true for you.
6. Aerators. Do all faucets in the kitchen and bathroom(s) have aerators? (What’s an aerator? See page 2.)
a. yes
b. no
7. Dishwasher and Clothes Washer. Are the dishwasher and clothes washer used
only when full?
a. always full
b. sometimes full
c. never full
8. Age of Appliances. Is your dish-washer or clothes washer more than 15 years old?
a. no
b. yes
c. don’t know
d. don’t have either appliance
Outdoors
9. Sprinklers. If you use sprinklers—either attached to the hose or built in—does a lot of pavement get wet from either overspray or runoff?
a. no, never
b. yes, always
c. yes, sometimes
d.don’t use sprinklers
Name:__________________________________________ Date:________________________________
Page 1 of 4
C NSERVATIONC NNECTION
WATER & ENERGY USE IN CALIFORNIA
L E S S O N 1 : W A T E R , E N E R G Y , & Y O U
3
L E S S O N 2 : W A T E R S U P P L Y & D E M A N DSLesson Overview Students will: • learn about surface water and groundwater • determine how water is used in California
(agriculture, environment, urban) • discuss the problem of water supply meeting
water demand
SVocabulary • aqueduct • overdraft • aquifer • reservoir • groundwater • surface water
SMaterials and Preparation • Conservation Connection student booklets • Topographical wall map of California
SApproximate Time Requirement • 1 class period
SProcedures
I. Think About Water Sources
A. Have students open their student booklets to page 3, CONNECTION: Water Sources & California.
B. Read aloud and discuss the questions under Think About It....
II. Learn About Water Sources
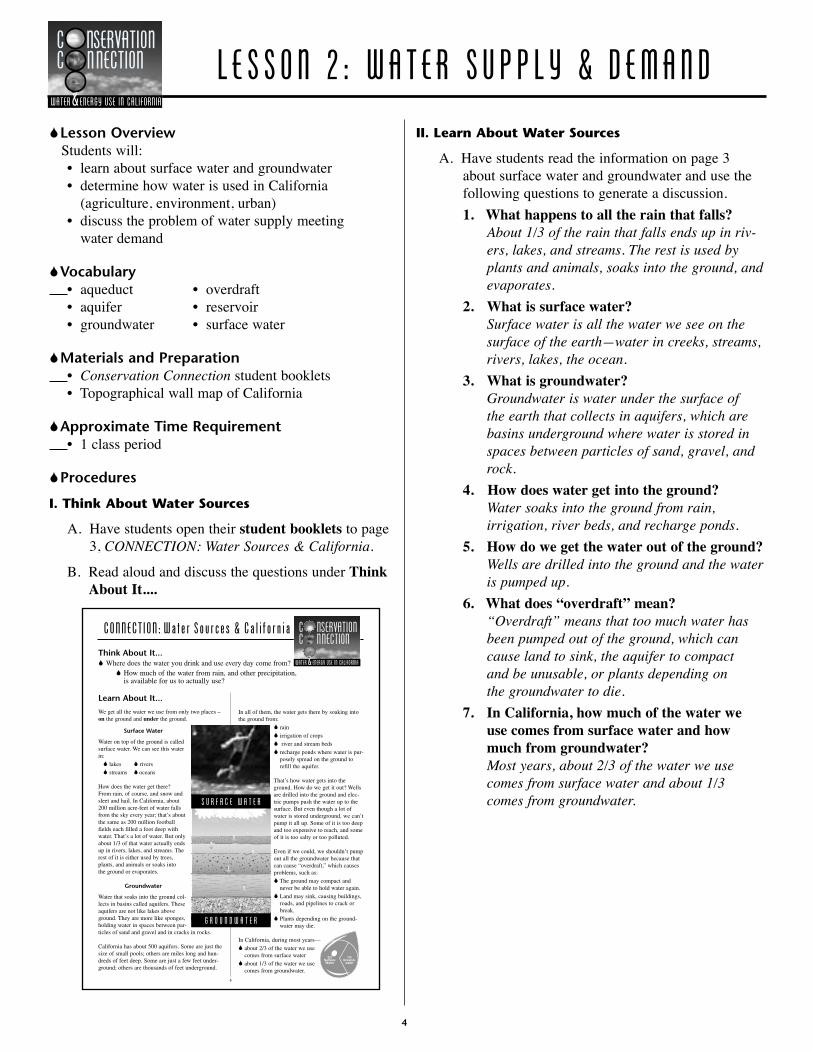
A. Have students read the information on page 3 about surface water and groundwater and use the following questions to generate a discussion.1. What happens to all the rain that falls?
About 1/3 of the rain that falls ends up in riv-ers, lakes, and streams. The rest is used by plants and animals, soaks into the ground, and evaporates.
2. What is surface water?Surface water is all the water we see on the surface of the earth—water in creeks, streams, rivers, lakes, the ocean.
3. What is groundwater?Groundwater is water under the surface of the earth that collects in aquifers, which are basins underground where water is stored in spaces between particles of sand, gravel, and rock.
4. How does water get into the ground?Water soaks into the ground from rain, irrigation, river beds, and recharge ponds.
5. How do we get the water out of the ground?Wells are drilled into the ground and the water is pumped up.
6. What does “overdraft” mean?“Overdraft” means that too much water has been pumped out of the ground, which can cause land to sink, the aquifer to compact and be unusable, or plants depending on the groundwater to die.
7. In California, how much of the water we use comes from surface water and how much from groundwater?Most years, about 2/3 of the water we use comes from surface water and about 1/3 comes from groundwater.
CONNECTION: Wa te r Sou rces & Ca l i f o rn i a
Think About It...� Where does the water you drink and use every day come from?
� How much of the water from rain, and other precipitation,is available for us to actually use?
Learn About It...
We get all the water we use from only two places –on the ground and under the ground.
Surface Water
Water on top of the ground is calledsurface water. We can see this waterin:
� lakes � rivers
� streams � oceans
How does the water get there? From rain, of course, and snow andsleet and hail. In California, about200 million acre-feet of water falls from the sky every year; that’s aboutthe same as 200 million footballfields each filled a foot deep with water. That’s a lot of water. But onlyabout 1/3 of that water actually endsup in rivers, lakes, and streams. Therest of it is either used by trees,plants, and animals or soaks into the ground or evaporates.
Groundwater
Water that soaks into the ground col-lects in basins called aquifers. Theseaquifers are not like lakes aboveground. They are more like sponges,holding water in spaces between par-ticles of sand and gravel and in cracks in rocks.
California has about 500 aquifers. Some are just thesize of small pools; others are miles long and hun-dreds of feet deep. Some are just a few feet under-ground; others are thousands of feet underground.
In all of them, the water gets there by soaking intothe ground from:
� rain
� irrigation of crops
� river and stream beds
� recharge ponds where water is pur-posely spread on the ground torefill the aquifer.
That’s how water gets into theground. How do we get it out? Wellsare drilled into the ground and elec-tric pumps push the water up to thesurface. But even though a lot ofwater is stored underground, we can’tpump it all up. Some of it is too deepand too expensive to reach, and someof it is too salty or too polluted.
Even if we could, we shouldn’t pumpout all the groundwater because thatcan cause “overdraft,” which causesproblems, such as:
� The ground may compact andnever be able to hold water again.
� Land may sink, causing buildings,roads, and pipelines to crack orbreak.
� Plants depending on the ground-water may die.
In California, during most years—
� about 2/3 of the water we use comes from surface water
� about 1/3 of the water we use comes from groundwater.
S U R F A C E W A T E R
G R O U N D W A T E R
3
C NSERVATIONC NNECTION
WATER & ENERGY USE IN CALIFORNIA
C NSERVATION C NNECTION
WATER & ENERGY USE IN CALIFORNIA
4
L E S S O N 2 : W A T E R S U P P L Y & D E M A N DIII. Think About Water Use
A. Have students turn to page 4 in their student booklets.
B. Read aloud and discuss the questions under Think About It....
IV. Learn About Water Use
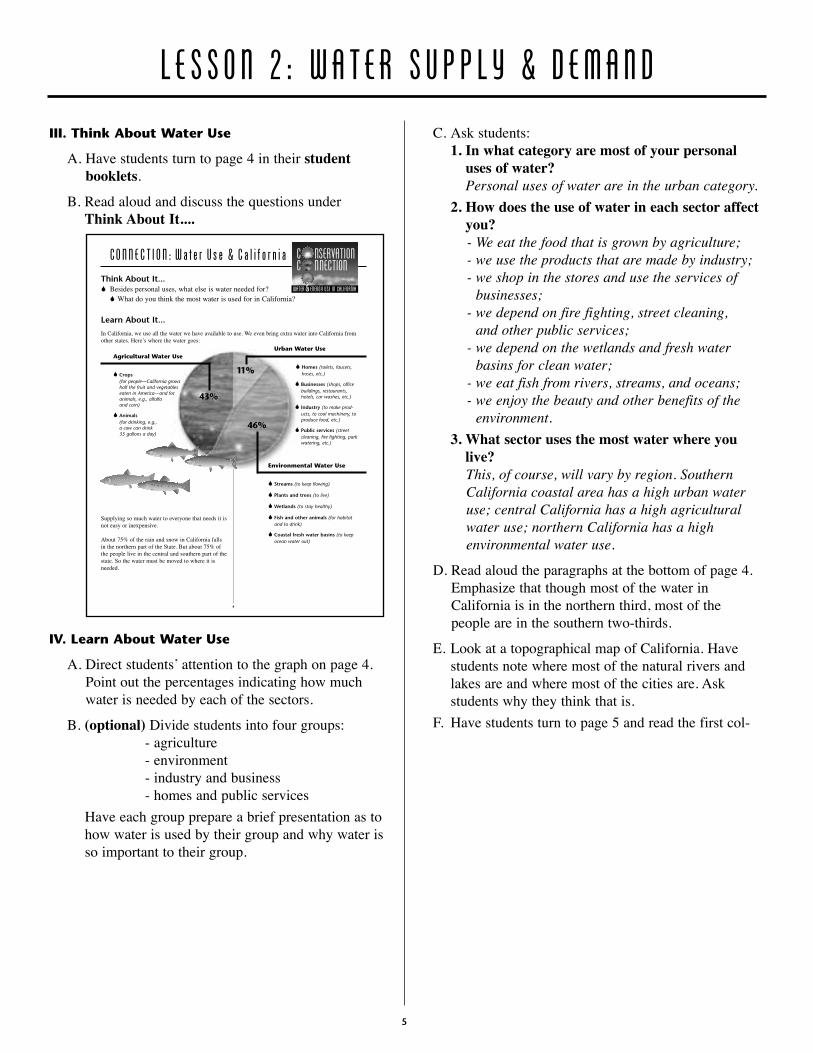
A. Direct students ̓attention to the graph on page 4. Point out the percentages indicating how much water is needed by each of the sectors.
B. (optional) Divide students into four groups: - agriculture - environment - industry and business - homes and public services Have each group prepare a brief presentation as to how water is used by their group and why water is so important to their group.
C. Ask students: 1. In what category are most of your personal
uses of water? Personal uses of water are in the urban category. 2. How does the use of water in each sector affect
you? - We eat the food that is grown by agriculture; - we use the products that are made by industry; - we shop in the stores and use the services of
businesses; - we depend on fire fighting, street cleaning,
and other public services; - we depend on the wetlands and fresh water
basins for clean water; - we eat fish from rivers, streams, and oceans; - we enjoy the beauty and other benefits of the
environment. 3. What sector uses the most water where you
live? This, of course, will vary by region. Southern
California coastal area has a high urban water use; central California has a high agricultural water use; northern California has a high environmental water use.
D. Read aloud the paragraphs at the bottom of page 4. Emphasize that though most of the water in California is in the northern third, most of the people are in the southern two-thirds.
E. Look at a topographical map of California. Have students note where most of the natural rivers and lakes are and where most of the cities are. Ask students why they think that is.
F. Have students turn to page 5 and read the first col-
Learn About It...
In California, we use all the water we have available to use. We even bring extra water into California fromother states. Here’s where the water goes:
CO N N E C T I O N : W a t e r U s e & C a l i f o r n i aThink About It...� Besides personal uses, what else is water needed for? � What do you think the most water is used for in California?
Agricultural Water Use
� Crops(for people—California grows half the fruit and vegetables eaten in America—and for animals, e.g., alfalfa and corn)
� Animals(for drinking, e.g., a cow can drink 35 gallons a day)
Urban Water Use
� Homes (toilets, faucets,hoses, etc.)
� Businesses (shops, officebuildings, restaurants,hotels, car washes, etc.)
� Industry (to make prod-ucts, to cool machinery, toproduce food, etc.)
� Public services (streetcleaning, fire fighting, parkwatering, etc.)
Supplying so much water to everyone that needs it isnot easy or inexpensive.
About 75% of the rain and snow in California fallsin the northern part of the State. But about 75% ofthe people live in the central and southern part of thestate. So the water must be moved to where it isneeded.
Environmental Water Use
� Streams (to keep flowing)
� Plants and trees (to live)
� Wetlands (to stay healthy)
� Fish and other animals (for habitat and to drink)
� Coastal fresh water basins (to keep ocean water out)
43%
11%
46%
4
C NSERVATIONC NNECTION
WATER & ENERGY USE IN CALIFORNIA
5

umn about the aqueducts and reservoirs that have been built to distribute water to people in California. Have students determine approximately where their city is on the map. Ask if they know the source of water for their city.
G. Pose the question stated in their booklets: “So whatʼs the problem?” Discuss, as shown on page 5, the three water supply problems facing California—money, the environment, and population.
H. Have students speculate on the question at the bottom of the page—“Where will we get more water?”
V. Continue Tracking Water Use
A. Remind students that they should be keeping track of all the water and energy that they are using today.
B. Check students ̓Personal Water & Energy Use worksheets to be sure they are being filled in and answer any questions students may have.
Extension Activities
• Research your cityʼs water supply and water uses. Find out, either through Internet research or by calling your water agency, information about the supply and demand of water in your area.
• Make pictographs showing the various uses of water in each sector. Locate pictures, or draw them, showing many different uses of water in agriculture, industry, business, homes, cities, the environment.
• Begin a water issues file. Look through news-papers, magazines, and the Internet for articles about water supply in California. Discuss the articles, especially if there are conflicting viewpoints.
• Demonstrate groundwater and surface water. Gather the following materials: large glass jar or small aquarium, aquarium gravel, watering can, water, meat baster. Fill the jar or aquarium with gravel, building the ground up slightly higher on one side than the other. Sprinkle water from the water-ing can into the jar or aquarium to simulate rain. Saturate the ground but do not pour so much that water shows above ground. To simulate the drill-ing of a well, use the meat baster to pump up some groundwater. Sprinkle more water into the jar or aquarium until a “lake” forms at the low ground end. Experiment with “raining” more and “pumping” more to demonstrate the interaction between ground-water and surface water.
L E S S O N 2 : W A T E R S U P P L Y & D E M A N D
CO N N E C T I O N : W a t e r U s e & C a l i f o r n i a
So, what’s the problem?
� First, money.It is very expensive to build and maintain aque-ducts and reservoirs. Water must be pumpedalong the way and lifted over huge mountains.Great amounts of electricity are used, whichcosts a lot of money.
� Second, the environment.Taking water out of rivers and streams can havenegative impacts on the plants and animals thatdepend on them and on the people that enjoythem. Water companies try to affect the environ-ment as little as possible. But even so, largeamounts of land are taken up by aqueducts,pumping plants, dams, and reservoirs. And whendams are built to form reservoirs, land is flood-ed, which obviously affects the people, animals,and plants that live there.
� Third, population.With more people being born and more peoplemoving into California, more water is neededevery year, not just for personal uses but also tobuild more houses, to grow more food, to makemore products, and to generate more electricity.
So where will we get more water?
Continued....
Aqueducts—channels, pipelines, and tunnels—carrywater across land and over or through mountains.The system of aqueducts in California moves morewater farther than anywhere else in the world.All along the aqueducts are reservoirs that are usedto store the water until it is needed. These reservoirsmight be large storage tanks or lakes formed bydams.
This system of aqueducts and reservoirs allows us to live throughout California. And there are other benefits. Reservoirs are often used for recreation—
like fishing, swimming,boating, and waterskiing. Also, reservoirsand the dams thatcreate them can
provide flood control by holdingback water and canprovide electricity by releasing water to turn turbine-
generators.
Tehama-ColusaCanal
MokelumneAqueduct
Hetch HetchyAqueduct
Delta-Mendota Canal
Friant-Kern CanalCalifornia
Aqueduct
Los AngelesAqueduct
Colorado RiverAqueduct
5
C NSERVATIONC NNECTION
WATER & ENERGY USE IN CALIFORNIA
6

SLesson Overview Students will: • learn about ways to stretch our supply of water—
recycling, desalination, conservation • analyze their personal water use
SVocabulary • conservation • desalination • reclaimed water • recycled water • technology
SMaterials and Preparation • Conservation Connection student booklets • Personal Water & Energy Use worksheets filled
in by students • How Much Water Does It Use? information sheet
- make a transparency • materials for recycling demonstration
- two clear gallon containers - a measuring cup - water (175 ounces, about 1 1/2 gallons)
• materials for desalination demonstration - teakettle - 2 teacups - hot plate - oven mitt
- cup of salt water (enough salt added to water to taste the salt)
- straws
SApproximate Time Requirement • 1 to 2 class periods
SProcedures
I. Think About Water & the Future
A. Have students open their student booklets to page 6, CONNECTION: Water & the Future.
B. Read aloud and discuss the questions under Think About It....
II. Learn About Recycling
A. Have students read the first paragraph on page 6 under Learn About It....
B. Display a clear gallon container and tell students that this container is going to represent the supply of water for homes in their community for a year. Have students fill and mark the container (with tape or marker) as follows:
- add 5 oz., mark the level, and label: DRINKING & COOKING - 5%
- add 5 oz., mark the level, and label: FAUCETS - 5%- add 12 oz., mark the level, and label: LAUNDRY - 12%- add 18 oz., mark the level, and label: BATHING - 18%- add 22 oz., mark the level, and label: TOILETS - 22%- add 38 oz., mark the level, and label: OUTDOOR USES - 38%
Explain that the percentages indicate the approxi-mate amounts needed by homes in California for each particular use.
C O N N E C T I O N : W a t e r & t h e F u t u r e
Think About It...� If there’s only a fixed supply of water, how can we get more?� Do you waste any water?
Learn About It...
We can’t manufacture water. The surface water andgroundwater that we have are all that we’ll everhave. But we can stretch our supply.
Recycling
Water that goes down the drain endsup at a wastewater treatment plant.At these plants, water goes througha series of cleanings and treatments.Some of this “reclaimed” water isput back into the environment—rivers, lakes, the ocean, the ground.But some of it, after even morecleaning, is recycled—that is, it isdelivered to people to use.
California has been using reclaimedwater for irrigation for about 70years. Now recycled water can beused for all purposes except drinking:
� to water school grounds, ceme-teries, golf courses, nurseries,parks, greenbelts
� to irrigate crops and pastures
� to manufacture products and coolindustrial machinery
� to make snow, fight fires, cleanstreets
� to flush toilets
� to recharge groundwater
Using recycled water for these purposes saves large amounts of fresh water. Butreclaiming water to recycle it is expensive. First, ofcourse, money must be spent to clean the water. Butthen we must also build separate pipelines, pumps,and storage reservoirs for the recycled water.
However, as more facilities are built and more recy-cled water is used, the cost of recycled water willdecrease. Using more recycled water can help
California maintain a reliable supplyof fresh water.
Desalination
Where is most of the surface wateron the earth? In the ocean, of course.But ocean water is too salty to drink.We can, however, take the salt out ofthe water in a process called desali-nation.
California already has several desali-nation plants. One plant on SantaCatalina Island, off the coast ofSouthern California, produces 25%of the island’s drinking water. Thedesalination plant in the MontereyBay area is the largest in the state.
Because California is next to theocean, plenty of salt water is avail-able. However, turning seawater intofresh water is much more expensivethan other methods of supplyingfresh water. Money must be spent notonly to build and maintain the plantsbut also to pay for the huge amountsof energy it takes to remove the salt.Then the salt must be disposed of. It is often put back into the ocean,
where it may upset the delicate ecological balance of the marine environment.
As technology improves and as we need more waterto meet our growing demand, desalination may notbe so expensive.
WATER RECYCLING
DESALINATION
6
C NSERVATIONC NNECTION
WATER & ENERGY USE IN CALIFORNIA
L E S S O N 3 : W A T E R & T H E F U T U R EC NSERVATION C NNECTION
WATER & ENERGY USE IN CALIFORNIA
7

C. Ask: 1. What needs the most water? outdoor uses 2. What uses the most water in the house? toilets 3. For each use, what happens to the water? • For toilets, bathing, laundry, and faucet uses,
the water goes down the drain, into the sewer, then to the wastewater treatment plant.
• For drinking & cooking, the water is consumed by us.
• For outdoor uses, the water soaks into the ground.
D. Show students the empty container and tell them that it represents the wastewater treatment plant. Have students “dispose” of the water in the first container appropriately—that is: •-
use the water labeled OUTDOOR USES to water plants, or trees, or the lawn
• pour the water from FAUCETS, LAUNDRY, BATHING, and TOILETS into the empty container (signifying down the drain to the wastewater treatment plant)
• drink the water labeled DRINKING & COOKING (if you are sure that the water and the container are clean)
E. Ask students to imagine that next year thereʼs a drought and that your communityʼs total supply of water for household uses is now only 3/4 of what it was the year before. Refill the first container with 75 ounces of clean water. (Note: If instead of a drought, the population increased, the original supply might stay the same – 100 ounces – but the amount needed for each of the uses shown on the container would increase. The resulting effect would be the same.)
F. Ask students: 1. Is there enough water for all the uses? no 2. How could the supply be extended to have
enough? Water that went down the drain to the wastewater
treatment plant could be recycled to water lawns. Also, less water could perhaps be used for some of the other uses.
3. Would there be enough water if some of the water in the wastewater container were used?
yes, with still some left over 4. Is water recycled? Yes. California has been recycling water to use
for irrigation for many years.
G. Have students read the information about Recycling in their books on page 6. Discuss:
• What can recycled water be used for? • Why is recycled water sometimes more
expensive?
III. Learn About Desalination
A. Ask students: 1. Where do you see the most surface water when
you look at a world map or globe? in the ocean 2. Why donʼt we use ocean water? It s̓ too salty. 3. Is there any way to take the salt out of the
water? yes, through desalination
B. Set up the desalination demonstration: 1. Pour the cup of salt water into the teakettle. 2. Ask a student to use a straw to taste a little of the
water and tell the rest of the class how it tastes. 3. Place the teakettle on the hot plate. 4. Heat the salt water until it boils and turns into
steam. 5. Put on the oven mitt and hold one teacup upside
down over the escaping steam from the teakettle so the water vapor collects in the cup.
6. Place the second teacup underneath so that as the vapor condenses water will drip into the second cup.
7. When most of the water has boiled out of the tea-kettle, have students taste the water that has col-lected in the teacup.
Explain that the water has been “distilled,” which is one method (though not the one commonly used) to remove salt from water.
C. Have students read the information about Desalination in their books on page 6. Discuss:
L E S S O N 3 : W A T E R & T H E F U T U R E
8

IV. Learn About Conservation
A. Have students look at page 7 and ask:
1. Why is conservation the best way to stretch our water supply?
Conservation would: - increase our supply at no extra cost - decrease our costs for distributing water - decrease our costs for cleaning wastewater - benefit the environment by taking less fresh
water out of it and discharging less wastewa-ter into it.
2. What are the two major methods of conserving water?
We can conserve water with: - new technologies, such as toilets and washers
that use less water - non-wasteful practices, such as taking shorter
showers and planting low water-use plants.
B. Have students brainstorm ways to conserve water. Tell them that when they analyze their Home Water & Energy Surveys they will learn more about ways to save water.
V. Calculate Personal Water Use
A. Ask students to take out their Personal Water & Energy Use worksheets. Take a quick tally to see what water uses were most common among students.
B. Show the transparency How Much Water Does It Use? Point out to students that for each use two amounts are shown—a regular amount and a water conserving amount.
C. Have students fill in the amounts of water for each water use they have listed. For any uses not shown on the transparency, have students estimate the amount of water they used based on figures for other uses.
D. Have students total the number of gallons they used for one day. Add up the total number of gallons used by the class and divide by the number of students in the class to determine the average amount used per person.
E. Tell students that: - indoors, each person in California uses
approximately 100 gallons of water each day - outdoors, on average, each person uses almost
another 100 gallons of water each day - a family of 5 needs about 326,000 gallons of
water a year—thatʼs an acre-foot of water, which is enough to fill a football field a foot deep.
Compare these figures to your class average and discuss why there might be differences.
C O N N E C T I O N : W a t e r & t h e F u t u r e
Conservation
The best way to stretch our watersupply is to conserve water.Conservation means not wastingwater and using water efficiently.
Californians are familiar with con-servation. California has always haddroughts—long dry periods withoutmuch rain or snow. The longestdrought in California lasted 60years! During these times, peoplehad no choice but to use less water.But if we used less water every day,we could:
� make our water supply go further
� reduce costs for distributingwater
� benefit the environment by takingless fresh water out and puttingless wastewater back in.
Water can be conserved in homes,on farms, at businesses, and inindustries—through both improvedtechnology and non-wasteful practices.
New technologies include:
� faucets and showerheads that putout fewer gallons per minute
� toilets that use a lot less waterwith every flush
� recycling systems for water used incar washes, laundromats, amuse-ment parks, factories, power plants
� clothes washers and dishwashersthat use 40% less water
� drip irrigation systems that putwater only where it is needed
� evapotranspiration (ET) systems that monitor theevaporation from soil and thetranspiration from plants to
determine the exact amount ofwater lawns and plants need
� irrigation systems that returnrunoff from the bottom of a fieldto be used again.
Conservation practices include:
� turning water off when brushingyour teeth or washing dishes
� taking shorter showers
� keeping drinking water in therefrigerator instead of runningwater until it becomes cool
� planting low-water-use plants
� turning off sprinklers when it’sraining
� using a broom instead of a hose to clean pavement.
Conservation—with both water-saving devices and practices—wouldsave millions of gallons of water, aswell as millions of dollars, every day.
CONSERVATION PRACTICES
NEW TECHNOLOGIES
Continued....
7
C NSERVATIONC NNECTION
WATER & ENERGY USE IN CALIFORNIA
P e r s o n a l W a t e r & E n e r g y U s eName:__________________________________________ Date:________________
Water Use Time Gallons Used
Example: flush toilet 7:00 a.m.
_______ gallonsTOTAL
C NSERVATIONC NNECTION
WATER & ENERGY USE IN CALIFORNIA
Page 1 of 2
L E S S O N 3 : W A T E R & T H E F U T U R E
9
F. Ask students if from this list they can see any areas where they could conserve water.
G. Use students ̓personal use water figures to do some math exercises based on the level of the class.
• Use the average daily use per person to esti-mate the total daily use for the entire school, for the community, for the state (approxi-mately 35 million people).
• Figure the number of gallons a person would use in a year... in his/her entire life so far... by the time he/she is 45 and 85.
• Calculate how much water would be saved if everyone in the class used a low-flow showerhead instead of a regular showerhead for a day, a month, a year.
• Figure how much water could be conserved in one day by using all the water-saving methods.
• Calculate how many fewer gallons they would have to use to reduce their water use by 10%, by 20%.
(NOTE: Keep the Personal Water & Energy Use work-sheets to calculate energy use in Lesson 5.)
Extension Activities
• Conduct a shower versus bath experiment Have all students who have bathtubs at home fill their tubs to take a bath, but tell them that before they get in the tub to measure the depth of water. Make a chart in class recording the various depths of water. Next, tell students to take a shower in the same bathtub, but before they begin they should close the bathtub drain so that the water will collect in the tub. Tell them to time their shower and to measure the depth of water that has collected in the tub when they are finished. Record the figures on the chart and compare.
• Research conservation products and report on water savings. Determine an average cost for various new water-saving products (e.g., Energy Star washing machine, low-flow showerhead), and calculate how much water is saved and how long the product will take to pay for itself.
• Investigate indirect uses of water—that is, water that they do not use first-hand but that is needed to make products they use or to provide services they use. How much water is needed for such indirect water uses as: generating electricity, growing wheat to make bread, manufacturing a car, raising a cow, cleaning streets.
• Research and design a graywater reclamation system. Find out how various designs work for recycling water at home, what regulations must be followed, and what problems might exist? Have the class work in teams to design a system for a new home that is being built.
• Research the economics of recycling water. Compare using recycled water to using imported water. What are differences in cost? What are the advantages and disadvantages of each?
L E S S O N 3 : W A T E R & T H E F U T U R E
10
❂ Lesson Overview Students will: • prepare and give presentations on the various energy
sources we currently use • determine how energy is used in California • discuss the problem of energy supply meeting energy
demand
❂ Vocabulary • biomass • hydropower • solar • fission • nuclear power • thermal • fossil fuels • petrochemicals • turbine-generator • geothermal • photovoltaic • uranium
❂ Materials and Preparation • Conservation Connection student booklets • Energy Source Comparison worksheet
- copy for each student or group • materials to make posters
❂ Approximate Time Requirement • 2-3 class periods, depending on time to prepare and
give presentations
❂ Procedures
I. Think About Energy Sources
A. Have students open their student booklets to page 8, CONNECTION: Energy Sources & California.
B. Read aloud and discuss the questions under Think About It....
II. Prepare Student Presentations
A. Have students read the first paragraph on page 8 under Learn About It....
B. Tell students that to learn more about our energy resources, each of them is going to become an “expert” about a certain energy source and will then inform the rest of the class about that source.
C. Divide the class into seven groups, one for each of the energy sources described in their books:
• fossil fuels • biomass • wind • hydropower • geothermal • solar• nuclear power
D. Explain that each group should use the informa-tion in their books plus whatever other information they gather to become “experts” about their energy source. Tell students that each group is to prepare a poster and a brief report about their source but can also use other methods to present their infor-mation to the rest of the class.
E. Inform students how long you are giving them to prepare their presentations, when they will give their presentations, and about how long each presentation should be.
III. Think About Energy Use
A. Have students look at page 12 in their student booklets, CONNECTION: Energy Use & California.
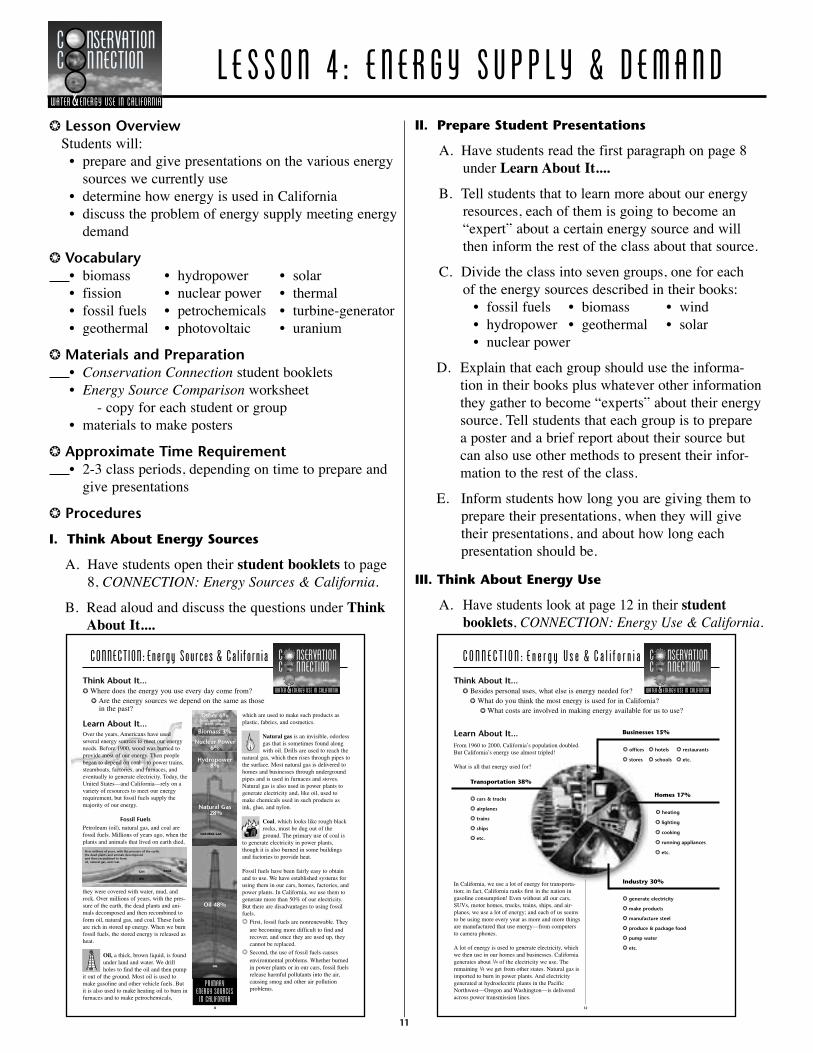
CONNECTION: Energy Sources & California
Think About It...� Where does the energy you use every day come from?
� Are the energy sources we depend on the same as those in the past?
Learn About It...Over the years, Americans have used several energy sources to meet our energyneeds. Before 1900, wood was burned toprovide most of our energy. Then peoplebegan to depend on coal—to power trains,steamboats, factories, and furnaces, andeventually to generate electricity. Today, theUnited States—and California—rely on avariety of resources to meet our energyrequirement, but fossil fuels supply themajority of our energy.
Fossil FuelsPetroleum (oil), natural gas, and coal arefossil fuels. Millions of years ago, when theplants and animals that lived on earth died,
they were covered with water, mud, androck. Over millions of years, with the pres-sure of the earth, the dead plants and ani-mals decomposed and then recombined toform oil, natural gas, and coal. These fuelsare rich in stored up energy. When we burnfossil fuels, the stored energy is released asheat.
Oil, a thick, brown liquid, is foundunder land and water. We drillholes to find the oil and then pump
it out of the ground. Most oil is used tomake gasoline and other vehicle fuels. Butit is also used to make heating oil to burn infurnaces and to make petrochemicals,
which are used to make such products asplastic, fabrics, and cosmetics.
Natural gas is an invisible, odorlessgas that is sometimes found alongwith oil. Drills are used to reach the
natural gas, which then rises through pipes tothe surface. Most natural gas is delivered tohomes and businesses through undergroundpipes and is used in furnaces and stoves.Natural gas is also used in power plants togenerate electricity and, like oil, used tomake chemicals used in such products asink, glue, and nylon.
Coal, which looks like rough blackrocks, must be dug out of theground. The primary use of coal is
to generate electricity in power plants,though it is also burned in some buildingsand factories to provide heat.
Fossil fuels have been fairly easy to obtainand to use. We have established systems forusing them in our cars, homes, factories, andpower plants. In California, we use them togenerate more than 50% of our electricity.But there are disadvantages to using fossilfuels.
� First, fossil fuels are nonrenewable. Theyare becoming more difficult to find andrecover, and once they are used up, theycannot be replaced.
� Second, the use of fossil fuels causesenvironmental problems. Whether burnedin power plants or in our cars, fossil fuelsrelease harmful pollutants into the air,causing smog and other air pollutionproblems.
PRIMARYENERGY SOURCES
IN CALIFORNIA
Oil 48%
Natural Gas28%
Hydropower8%
Nuclear Power6%
Biomass 3%
Other 6%(coal, geothermal,
wind, solar)
NATURAL GAS
OIL
GAS
OIL
COAL
Over millions of years, with the pressure of the earth, the dead plants and animals decomposed and then recombined to form oil, natural gas, and coal.
8
C NSERVATIONC NNECTION
WATER & ENERGY USE IN CALIFORNIA
CONNECT I ON : E ne r gy U se & Ca l i f o r n i a
Learn About It...From 1960 to 2000, California’s population doubled.But California’s energy use almost tripled!
What is all that energy used for?
In California, we use a lot of energy for transporta-tion; in fact, California ranks first in the nation ingasoline consumption! Even without all our cars,SUVs, motor homes, trucks, trains, ships, and air-planes, we use a lot of energy; and each of us seemsto be using more every year as more and more thingsare manufactured that use energy—from computersto camera phones.
A lot of energy is used to generate electricity, whichwe then use in our homes and businesses. Californiagenerates about 3/4 of the electricity we use. Theremaining 1/4 we get from other states. Natural gas isimported to burn in power plants. And electricitygenerated at hydroelectric plants in the PacificNorthwest—Oregon and Washington—is deliveredacross power transmission lines.
Think About It...� Besides personal uses, what else is energy needed for?
� What do you think the most energy is used for in California?� What costs are involved in making energy available for us to use?
Transportation 38%
� cars & trucks
� airplanes
� trains
� ships
� etc.
Businesses 15%
� offices � hotels � restaurants
� stores � schools � etc.
Industry 30%
� generate electricity
� make products
� manufacture steel
� produce & package food
� pump water
� etc.
Homes 17%
� heating
� lighting
� cooking
� running appliances
� etc.
12
C NSERVATIONC NNECTION
WATER & ENERGY USE IN CALIFORNIA
L E S S O N 4 : E N E R G Y S U P P L Y & D E M A N DC NSERVATION C NNECTION
WATER & ENERGY USE IN CALIFORNIA
11

B. Read aloud and discuss the questions under Think About It....
IV. Learn About Energy Use
A. Read the statistics under Learn About It... “
From 1960 to 2000, California s̓ population doubled. But California s̓ energy use almost tripled!” Point out that means each person is using more
energy. Ask students why they think thatʼs true. (We have more products that use energy; we have
bigger houses; we drive more; etc.)
B. Direct students ̓attention to the graph on page 12. Ask:
1. In what categories are you responsible for the use of energy?
All of them. We personally use energy in our homes. We attend school and shop in stores. We use products that are made by industry. And we ride in cars, buses, trains, and/or airplanes, as well as use products that are transported by ships, trucks, trains, and planes.
2. What provides the energy needed in each sector?
The transportation sector uses mainly oil, which is made into gasoline and other fuels. Homes, businesses, and industries depend mostly on natural gas and on electricity.
3. What energy sources are used to generate electricity?
All energy sources—fossil fuels, hydropower, nuclear power, biomass, geothermal, wind, solar—can be used to generate electricity. (NOTE: Have students look at the informa-tion under each energy source on pages 8-11 to find out and graph how much electricity each source generates in California.) In California, electricity is generated by: - fossil fuels (primarily natural gas) – more than 50% - hydropower – about 23% - nuclear power – about 16% - geothermal – about 5% - biomass – about 2% - wind – about 1% - solar – less than 1%
C. Read the paragraphs at the bottom of page 12 and then pose the question stated at the top of page 13:
“So whatʼs the problem?”
D. Discuss, as shown on page 13, the problems we face in California, and the nation, concerning our use of energy—supply, environment, money, population.
E. Have students speculate on the question at the bottom of the page—“How will we have enough energy for the future?”
V. Conduct Presentations
A. Distribute to each student or work group a copy of the Energy Source Comparison worksheet. Explain to students that as they listen to each presentation, they should be fill in the worksheet indicating the advantages and disadvantages of each energy source. Tell them to pay particular attention to the areas of:
- cost - supply - environmental effects
B. Have each “expert” group present their poster and information about their energy source. After each presentation, ask the class if they have any ques-tions to ask the experts.
C. Display the posters around the room.
CONNECT I ON : E ne r gy U se & Ca l i f o r n i a
So what’s the problem?
� First, supply.
The amount of energy we havedoesn’t always match the amountwe need. In the 1970s, the “energycrisis” had us waiting in long linesand paying high prices to buy gaso-line, sometimes only on specifieddays. Because we depend on othercountries for much of the oil weneed to manufacture gasoline, oursupply is not always certain.
In 2001, the “energy crisis” caused“rolling blackouts” throughoutCalifornia, meaning that variousareas were without electricity forperiods of time. Along with otherfactors, the shortage of electricitywas caused by:
– more demand during hot summer weather
– less supply from the hydroelectric plants in thePacific Northwest where rainfall was low.
� Second, the environment.Most of our energy comes fromburning fossil fuels, which emit pol-lutants into our air. In California,and other places, these pollutantscause smog. In other parts of thecountry, fossil fuels also contributeto acid rain; and in the world theymay be causing global warming.
Other energy sources also impactthe environment—whether taking upspace, flooding land behind dams, orcreating radioactive waste. The moreenergy we use, the more the envi-ronment is affected.
� Third, money.
It’s expensive to supply the energywe need. Fossil fuels must be drilledfor or dug out of the ground andtransported to where they are need-ed; power plants must be built;transmission lines must be connect-ed. When we import energy, evenmore money must be spent. As thedemand goes up and our supplygoes down, consumers will bespending even more each month forthe energy they use.
� Fourth, population.California is the fastest growingstate in the nation.
– In 2004, our population wasapproximately 35 million.
– By 2050, it is projected to be55 million.
Energy will be needed to make theproducts and distribute the waterconsumed by all these people. And,of course, each person will use ener-gy every day just to live their lives.
So how will we have enough energyfor the future?
S U P P L Y
P O P U L A T I O N
E N V I R O N M E N T
Continued....
13
C NSERVATIONC NNECTION
WATER & ENERGY USE IN CALIFORNIA
L E S S O N 4 : E N E R G Y S U P P L Y & D E M A N D
12

VI. Compare Energy Sources
A. When all the presentations have been completed, discuss the Energy Source Comparison worksheet using the sample responses below as a guide.
B. Point out to students that every energy source has advantages and disadvantages and that meeting our energy needs is not easy.
Energy Source ComparisonWhat are some advantages and disadvantages of each of our energy sources?
Think about: supply cost environmental effects
Energy Source Advantages Disadvantages
fossil fuels
hydropower
nuclear power
biomass
geothermal
wind power
solar
C NSERVATIONC NNECTION
WATER & ENERGY USE IN CALIFORNIA
Fairly easy to obtain and to use
Systems in place to use them inour cars, homes, factories, andpower plants
Renewable
Don’t have to pay for water
Clean for the environment
Large supply since uranium,the fuel, is a common mineralfound around the worldNot expensive because uraniumis common
NonrenewableDependence on other countries for theamount we useBecoming more difficult to find and get outof the ground so costs continue to increaseContribute to air pollution
Renewable
Inexpensive fuel (trash and plant waste)
Renewable
Don’t have to pay for fuel
Clean for the environment
Renewable
Don’t have to pay for wind
Clean for the environment
Renewable
Don’t have to pay for sunshine
Clean for the environment
Only a limited number of places withwater that can be used for hydropower
Radioactive waste, which can be harmfulto us
Pollutants released into the air when trashis burned
Only in areas where heat is close to thesurface
Costs to build special power plants and toreinject water into the ground
Not reliable since winds must blow at a constant high speed
Not reliable since the sun doesn’t alwaysshine
Needs special power plants and specialequipment—solar cells and solar collectors
L E S S O N 4 : E N E R G Y S U P P L Y & D E M A N D
13
S A M P L E R E S P O N S E S

Extension Activities
• Demonstrate air pollution. Gather the following materials: white porcelain cup or plate, candle, matches. Tell students that you are going to dem-onstrate how fossil fuels produce pollution.
- Light the candle. Explain that the candle is made, in part, from oil, a fossil fuel.
- Briefly place the cup or plate near the top of the flame until a black smudge appears; then remove the cup from the flame.
- Wipe off part of the black soot with a tissue to show that the cup was not burned or scorched. Ask students why they think the cup turned black.
- Explain that burning the candle releases hot gases and tiny particles—air emissions—which rise quickly up into the air; some of the emissions are invisible and some can be seen as smoke. When the smoke settles on a surface, it produces soot.
- Tell students that burning a candle produces very few air emissions; but burning fossil fuels in cars, power plants, factories, and other buildings produces a lot of air emissions that can cause air pollution.
• Identify fossil fuel products. Remind students that fossil fuels are used to make chemicals that are used to produce many products that we use every day. Give students a few examples of fossil fuels products:
- Plastic—bags, balls, toothbrushes, dishes, furniture
- Fabric—polyester, nylon, vinyl - Medicine—cough syrup, aspirin - Cosmetics—hand lotion, nail polish, shampoo - Other products—floor wax, glue, film, ink,
insect spray Have students identify various objects around the
classroom that are made from fossil fuels.
• Play “What Am I?” Divide students into two (or more) teams. Either alternate having the teams answer or pose the question to all teams and allow the first team that raises a hand (or rings a bell or calls a name) to answer. State various facts, including advantages and disadvantages, about an energy source and have students guess the source. For example: “Iʼm renewable; I do not create air pollution; I use falling water to create electricity.” (hydropower)
• Make a solar collector. Gather the following materials: black plastic trash bag, rubber hose about 2 or 3 feet long, thick rubber band, string, water. Tell students that they are going to make a solar collector to heat water.
- Fill the plastic bag about half full with water. - Insert one end of the rubber hose into the top
of the bag and secure the bag around the hose with the rubber band.
- Tie the string tightly around the plastic bag just under the end of the hose in the bag.
- Lay the bag in the sun for at least one hour. - Hold the bag upside down. Untie the string
around the bag and carefully feel the water than runs out through the hose.
• Measure and compare wind speed. Find the windiest spot at your school and use an anemom-eter to measure the wind speed at various heights, times of day, times of year.
• Demonstrate a turbine. Use a toy pinwheel (or construct a metal pinwheel out of a can lid) to demonstrate how the blades are turned by steam, falling water, and wind.
L E S S O N 4 : E N E R G Y S U P P L Y & D E M A N D
14
❂ Lesson Overview Students will: • learn about ways to meet our energy demand in the
future, including energy efficient products, renew-ables, fuel cells, and conservation
• analyze their personal energy use • calculate the cost of the energy they use.
❂ Vocabulary• BTU• efficiency• fuel cell• kilowatt hour• sustainable
❂ Materials and Preparation• Conservation Connection student booklets• Personal Water & Energy Use worksheets filled in by students• How Much Energy Does It Use? information sheet - make a transparency• an electricity bill and a natural gas bill
- bring in the bills and find the cost per kilowatt hour for electricity and the cost per BTU for natural gas
OR - call or check online to determine the costs
❂ Approximate Time Requirement• 1-2 class periods
❂ Procedures
I. Think About Energy & the Future
A. Have students open their student booklets to page 14, CONNECTION: Energy & the Future.
B. Read aloud and discuss the questions under Think About It....
II. Learn About Energy & The Future
A. Read aloud the first paragraph under Learn About It... on page 14.
B. Have students read the text on pages 14 and 15. Then use the questions below to briefly discuss what they read. Alternatively, write the questions on the chalkboard, divide students into groups, and have each group answer the questions using the information on pages 14 and 15.1. What does it mean to increase energy
efficiency?It means using less energy to do the same or more work.
2. Are appliances today more or less efficient than in the past?Appliances today are more efficient. Since 1980, appliances—such as refrigerators, dishwashers, clothes dryers—have improved in energy efficiency by 30 to 90%, depending on the product. Today, Energy Star rated products have advanced technologies that use 10 to 15% less energy than standard models.
3. How can a thermostat help us use less energy?Some thermostats can be programmed to automatically change the setting at various times of the day. That means that the heat or the air conditioning can be programmed to go up or down or off so that the heat or AC is not accidentally left on when it isn t̓ needed.
4. How much less energy does a compact
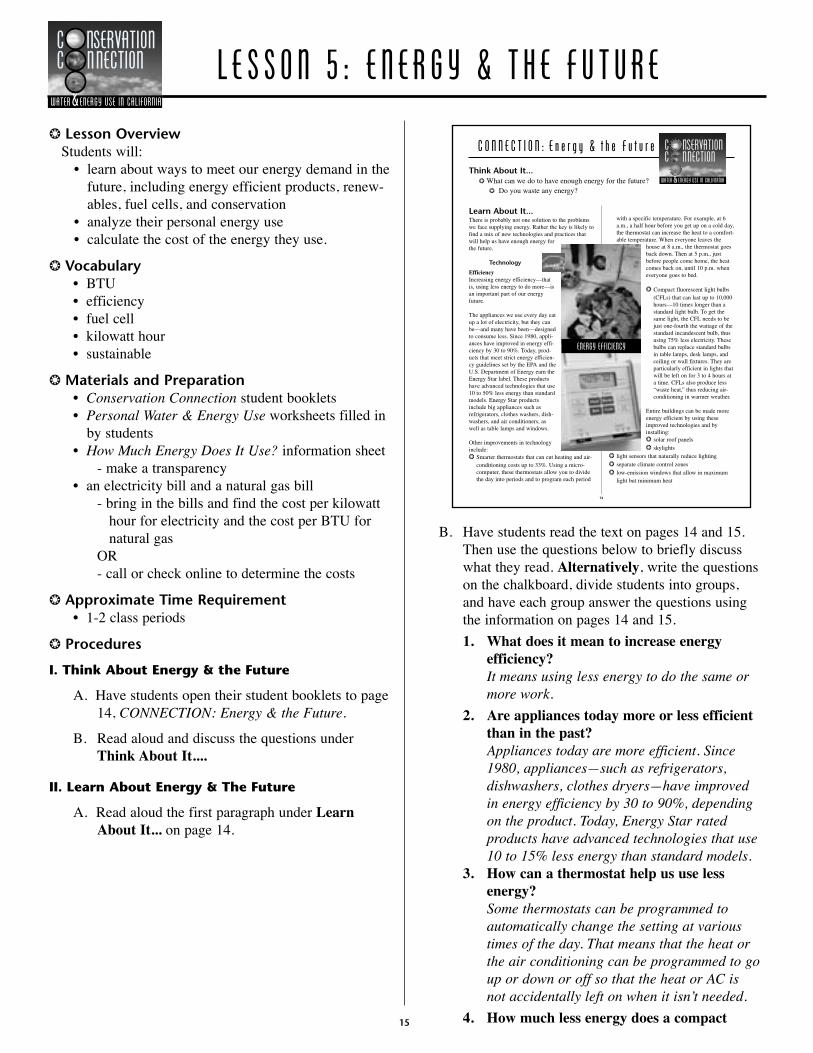
C O N N E C T I O N : E n e r g y & t h e F u t u r e
Think About It...� What can we do to have enough energy for the future?
� Do you waste any energy?
Learn About It...There is probably not one solution to the problemswe face supplying energy. Rather the key is likely tofind a mix of new technologies and practices thatwill help us have enough energy forthe future.
Technology
EfficiencyIncreasing energy efficiency—thatis, using less energy to do more—isan important part of our energyfuture.
The appliances we use every day eatup a lot of electricity, but they canbe—and many have been—designedto consume less. Since 1980, appli-ances have improved in energy effi-ciency by 30 to 90%. Today, prod-ucts that meet strict energy efficien-cy guidelines set by the EPA and theU.S. Department of Energy earn theEnergy Star label. These productshave advanced technologies that use10 to 50% less energy than standardmodels. Energy Star productsinclude big appliances such asrefrigerators, clothes washers, dish-washers, and air conditioners, aswell as table lamps and windows.
Other improvements in technologyinclude:� Smarter thermostats that can cut heating and air-
conditioning costs up to 33%. Using a micro-computer, these thermostats allow you to dividethe day into periods and to program each period
with a specific temperature. For example, at 6a.m., a half hour before you get up on a cold day,the thermostat can increase the heat to a comfort-able temperature. When everyone leaves the
house at 8 a.m., the thermostat goesback down. Then at 5 p.m., justbefore people come home, the heatcomes back on, until 10 p.m. wheneveryone goes to bed.
� Compact fluorescent light bulbs(CFLs) that can last up to 10,000hours—10 times longer than astandard light bulb. To get thesame light, the CFL needs to bejust one-fourth the wattage of thestandard incandescent bulb, thususing 75% less electricity. Thesebulbs can replace standard bulbsin table lamps, desk lamps, andceiling or wall fixtures. They areparticularly efficient in lights thatwill be left on for 3 to 4 hours ata time. CFLs also produce less“waste heat,” thus reducing air-conditioning in warmer weather.
Entire buildings can be made moreenergy efficient by using theseimproved technologies and byinstalling:� solar roof panels
� skylights
� light sensors that naturally reduce lighting
� separate climate control zones
� low-emission windows that allow in maximumlight but minimum heat
ENERGY EFFICIENCY
14
C NSERVATIONC NNECTION
WATER & ENERGY USE IN CALIFORNIA
L E S S O N 5 : E N E R G Y & T H E F U T U R EC NSERVATION C NNECTION
WATER & ENERGY USE IN CALIFORNIA
15

fluorescent light bulb use than a standard incandescent bulb?A compact fluorescent light bulb uses 75% less electricity than a standard light bulb, and it can last up to 10 times longer.
5. Why donʼt we use more renewable energy sources now?Compared to fossil fuels, renewable energy sources have been expensive, less efficient, and more difficult to use.
6. What are the benefits of using more renew-able energy sources?Renewable energy sources are:
- sustainable, meaning they will never run out
- non-polluting for our air and water - available in the United States, which
means we do not have to depend on other countries for them.
7. How does a fuel cell work?In a fuel cell, hydrogen and oxygen are com-bined to produce electricity; no fuel is burned.
8. What are the advantages and disadvantages to using fuel cells?An advantage to using fuel cells is that they produce no pollution; the only emissions from a fuel cell are heat and pure water vapor. The disadvantages are that hydrogen is very expensive and it is difficult to store.
9. Why do each of us use more energy today than we did in the past?Although energy efficiency of appliances has improved, we have more “things” that use energy. Also, many of our appliances have a “stand-by” mode, which continues to use energy even when the appliance is turned off.
10. What are the benefits of conserving energy?By conserving energy, which means using it wisely and not wasting it, we can: - save money - put fewer pollutants into the environment - have more energy available for the future.
III. Calculate Personal Energy Use
A. Ask students to take out their Personal Water & Energy Use worksheets. Take a quick tally to see what energy uses were most common among stu-dents.
B. Show the transparency How Much Energy Does It Use? Point out to students that:
• The amount of energy used by electric appliances is measured in watts. Our use of electricity is measured by kilowatt hours. One kilowatt-hour (kWh) is 1,000 watts of electricity use for one hour. That would be the same as a 1,000 watt hair dryer used for one hour, or a 100 watt incandescent light bulb burning for 10 hours.
• The amount of energy used by appliances that run on natural gas is measured in BTU, which stands for British Thermal Units. One BTU signifies the quantity of heat needed to raise the temperature of one pound of water by 1 degree Fahrenheit; it is a very small unit.
C. Have students fill in the number of kWh for each electrical appliance they used. Tell them that if
P e r s o n a l W a t e r & E n e r g y U s eName:__________________________________________ Date:________________
Energy Use Time Kilowatt Hours OR BTU Used
Example: alarm clock 6:30 a.m.
_______ kWh _______ BTUTOTAL
C NSERVATIONC NNECTION
WATER & ENERGY USE IN CALIFORNIA
Page 2 of 2
L E S S O N 5 : E N E R G Y & T H E F U T U R E
16

any of their appliances—furnace, clothes dryer, water heater, or stove—uses natural gas instead of electricity, they should fill in the BTU figure. (NOTE: If students aren t̓ sure, just have them use the kWh figure.) For any uses not shown on the transparency, have students estimate the number based on figures for other uses.
D. Have students figure the total number of kilowatt hours and BTU they used for one day. (NOTE: You can convert all numbers to kWh using this formula: 3,413 BTUs = 1 kWh.) Add up the total numbers used by the class and divide by the num-ber of students in the class to determine the aver-age amount used per person.
E. Tell students that figures indicating the average use of energy per person per day in California vary widely. Remind them that each person is responsible for not only direct energy usage but also indirect usage—the energy needed to make the products and grow the food that each of us uses.
F. Tell students that the average electricity use per household is calculated to be about 17 kilowatt hours per day. Explain that in a household, often several people at the same time use the same light, watch the same television, use the same heater, and so on.
G. Show students an electricity bill and a natural gas bill and point out the cost per kilowatt hour of electricity and cost of natural gas. Point out that natural gas is usually billed in therms and that one therm equals 100,000 BTU.(Alternatively, simply tell them the cost that you learned from your electricity and gas companies.)
H. Use students ̓personal use energy figures to do some math exercises based on the costs of elec-tricity and natural gas in your area.
• Figure the cost of the electricity and natural gas that they used.
• Use the average daily kWh use per person to estimate the total daily use and cost for the entire school, for the community, for the state (approximately 35 million people).
• Figure the number of kWh a person would use in a year... in his/her entire life so far... by the time he/she is 45 and 85. Then figure the costs.
Extension Activities
• Determine costs. Use the following formula to figure the cost of using various electrical appliances:
Watts x Hours Used x Cost = Operating Cost
• Research conservation products and report on savings. Determine an average cost for various new energy-saving products (e.g., Energy Star clothes dryer, programmable thermostat, low-emission windows) and calculate how much energy is saved and how long the product will take to pay for itself.
• Demonstrate efficiency. Gather the following materials: pots or pans of the same shape and size but of different materials (e.g., glass, steel, copper), hot plate, water, stopwatch. Heat equal amounts of the same temperature water in each pan until the water boils. Record the times and determine which material had the best heating efficiency.
• Experiment with lighting. Gather the following materials: photographerʼs light meter, fluorescent and incandescent light bulbs of equal wattage, a lamp that can use either bulb. In a darkened room, turn on the incandescent light. Use the light meter to measure the amount of light given off at dis-tances of 3 and 10 feet from the light. Record the findings. Carefully touch the bulb after it has been on for a few minutes to determine how hot it is. Follow the same procedures using the fluorescent bulb. Determine which is more efficient and why.
• Test low-emission windows. Gather the following materials: sheet of ordinary glass, sheet of low-emission glass, two identical boxes, two thermometers. Put a thermometer inside each box and place a sheet of glass on top of each box. Put the boxes next to each other outside in the sun. Measure and record the temperatures inside each box every 15 minutes. Expose the boxes to different conditions (e.g., sunny day, overcast day, tree-shaded) and compare the differences.
L E S S O N 5 : E N E R G Y & T H E F U T U R E
17

❂ Lesson Overview Students will: • analyze their Home Water & Energy Surveys
to determine areas where they could improve conservation at home
• review ways to save water and energy at home • develop personal and family conservation plans • evaluate and revise plans
❂ Vocabulary• aerator • insulation• caulk • mulch• displacement • weather strip• hybrid • xeriscape
❂ Materials and Preparation • Home Water & Energy Survey completed by
each student • Ways to Save Water & Energy at Home (5 pages) - make a transparency of each page • SUMMARY of Ways to Save Water & Energy
at Home (2 pages) - copy for each student (back-to-back if
possible) • Personal Water & Energy Conservation Plan - copy for each student or have students
make their own on notebook paper • Family Water & Energy Conservation Plan - copy for each student or have students
make their own on notebook paper
❂ Approximate Time Requirement • 1 class period to analyze and make personal plans • 1 class period to evaluate personal and family plans
and calculate savings
❂ Procedures
I. Analyze Completed Home Surveys
A. Have students get out their Home Water & Energy Survey. Ask how they did on the survey.
1. Did your families get involved? 2. What did your families say? 3. Did you find any areas needing improve-
ment?
B. Tell students to circle on their surveys the number of any item that was marked b or c . Explain that these answers indicate either a “waster” activity or a “donʼt know” response.
C. Take a quick tally to see which items were circled the most.
D. Explain that for every item there are recommenda-tions for “ways to save” water or energy. Distribute a copy of the SUMMARY of Ways to Save Water & Energy at Home to each student. Explain that this sheet summarizes the complete recommenda-tions that they will discuss using the overhead. Have students circle those items on the summary that they circled on their surveys.
E. Project the transparencies of Ways to Save Water & Energy at Home and review the recommenda-tions, especially in the areas where students had items circled. Explain that the second column pro-vides a little information about why it is important to save water or energy in that area (for example, heating and cooling); the other columns describe what actions could be taken in their homes to conserve water and energy. Point out that there are various levels of cost for implementing these recommendations—from no cost to quite a lot.
F. Explain that many of the recommendations relate directly to the items on the survey—for example: “wash full loads in clothes washer” and “turn down the heater thermostat.” But point out that there are also other recommendations in each area—for example: “use the shortest cycle possible in the clothes washer” and “install a new programmable thermostat.”
G. Have students look at the backs of their student booklets. Point out that this water and energy efficient home depicts all the recommendations of ways to save water and energy.
L E S S O N 6 : H O M E W A T E R & E N E R G Y S U R -C NSERVATION C NNECTION
WATER & ENERGY USE IN CALIFORNIA
1, 2Toilets
S U M M A R Y o f W a y s t o S a v e W a t e r & E n e r g y a t H o m e Page 1 of 2
No Cost Ways
• Use a wastebasket instead of flushingtrash down the toilet.
• Install a displacement device in the toilettank.
• Get new low-flush toilets.
Low Cost Ways Most Cost Ways
3, 4Showers
• Take shorter showers and shallower baths. • Install a new low-flow showerhead.
5, 6 Faucets
• Turn the water off while brushing yourteeth, shaving, washing dishes, etc.
• Install aerators on all your faucets.
7, 8Dishwasher andClothes Washer
• Wash full loads of dishes and clothes. • Use the shortest cycles.• Use cold water in clothes washer whenever
possible to save energy.• Air dry dishes in the dishwasher by opening
the door slightly after the final rinse to saveenergy.
• Replace old appliances with Energy Star-rated appliances.
Part 1: WATER
9, 10, 11Lawn and
Garden
• Trim around, clean out, adjust, and repairsprinklers so they direct water only ontothe lawn.
• Set a timer to remind you to turn sprinklersoff.
• Water early in the morning. (Avoid peakwater and energy use hours of noon to 8p.m.)
• Water only when necessary.• Water slowly to reduce runoff.• Build basins around plants.• Use mulch around trees, shrubs, and plants. • Adjust watering schedules with weather.
• Replace broken sprinklerheads.• Aerate your lawn so that water soaks in.• Use a shut-off nozzle on hose.• Install automatic irrigation timers.
• Update your irrigation system. • Plant low-water use lawns and plants.• Replace lawns with drought-tolerant ground
cover and shrubs.
12, 13Outdoor Cleaning
• Use a broom instead of the hose.• Use a bucket of water not a running hose
to wash your car.
• Use a shut-off nozzle on the hose.
14Pool
• Lower the water temperature to reduceevaporation and to save energy.
• Use a pool cover.
15Leaks
• Fix the leak. • Call a plumber.
C NSERVATIONC NNECTION
WATER & ENERGY USE IN CALIFORNIA
18

II. Make Personal Conservation Plans
A. Explain that many of the recommendations for conserving water and energy shown on the Ways to Save sheet are simple practices and habits that anyone can do—like turning off the water while brushing teeth—while others involve more effort and expense.
B. Ask students to look at the various ways to save in the areas where they have items circled. Discuss some of the activities that students can do person-ally to conserve water or energy—that is, practices and habits that they can do without the help of their families.
C. Distribute a Personal Water & Energy Conservation Plan to each student or have them make their own. Ask students to list those activities that they can and will do to help conserve water and energy. Discuss the activities that students list.
D. Have students illustrate one or more conservation practices on the back of their plans.
III. Make Family Conservation Plans
A. Tell students that they are to take home, share, and discuss with their families the SUMMARY of Ways to Save Water & Energy at Home. Encourage students to talk with their families about: • the importance of conserving water and
energy • the circled items on the Summary that indicate
areas in which their family can improve as shown by the survey
• what they learned about water and energy use and conservation in each of the areas.
( NOTE: You may also want to photocopy the Water and Energy Efficient Home from the back of the student booklet to send home with students.)
B. Distribute a Family Water & Energy Conservation Plan to each student or have them make their own. Tell students to work with their family mem-bers to make a list of the ways their family can save water and energy, using the recommendations on the Ways to Save sheet.
C. Set a date for the Family Plans to be completed and returned.
P e r s o n a l W a t e r & E n e r g y C o n s e r v a t i o n P l a nName:__________________________________________ Date:________________
List those activities that you can and will do to help conserve water and energy.
C NSERVATIONC NNECTION
WATER & ENERGY USE IN CALIFORNIA
F a m i l y W a t e r & E n e r g y C o n s e r v a t i o n P l a nName:__________________________________________ Date:________________
List what your family will do to help conserve water and energy.
N E W T E C H N O L O G Y
C O N S E R V A T I O N P R A C T I C E S
C NSERVATIONC NNECTION
WATER & ENERGY USE IN CALIFORNIA
L E S S O N 6 : H O M E W A T E R & E N E R G Y S U R V E Y
19

IV. Evaluate Conservation Plans
A. When students bring back their Family Water & Energy Conservation Plans, take a tally to see what students ̓families are planning to do to conserve water and energy.
B. Have students review their Personal Plans and their Family Plans each week. Tell them to put a check by the activities that are being done and to cross off any items that have been completed (for example: fix leaky faucet). Have students update and change plans where necessary.
C. Discuss the plans:1. Why are certain activities not being done?2. What changes have been easy to make? 3. What changes have been difficult?4. What else can they do?
Ask students to think about what they can do to see that the conservation practices are followed. For example, if long showers are still being taken, perhaps they could put a timer in the bathroom; if the heat is still being left on at night, perhaps they could put more blankets on the beds.
V. Calculate Savings in Water and Energy
A. Using the information on the sheets How Much Water Does It Use? (from Lesson 3) and How Much Energy Does It Use? (from Lesson 5), have students calculate:
• How much water and energy their family is saving.
• How much water and energy is being saved by the entire class.
B. Using the costs for water, electricity, and natural gas in your area (determined either from bills or by contacting utilities) have students calculate how much money their families can save per month, per year.
Extension Activities
• Design a water and energy efficient home. Have students research and make plans to build and furnish a home that would make efficient use of water and energy.
• Organize a conservation campaign. From their surveys, have students determine what areas most need improving. Have students plan how they can help people in their community conserve. For example, they might:
- develop flyers to hand out - fix leaks - distribute conservation equipment, such as
aerators - fix, unclog, or adjust sprinklers so that pave-
ment is not being watered - perform draft tests on windows and caulk air
leaks.
• Compare models. Have students look at and com-pare the “Energy Guide” on appliances such as refrigerators, clothes washers, clothes dryers, and dishwashers. Why do some models use less energy or water?
• Conduct solar experiments. How does window size affect solar heating? What placement of win-dows provides the most effective solar heating of a building? How does shading windows affect the temperature inside the building? Which keeps a room coolest: drapes, window shades, blinds?
• Demonstrate insulation. Gather the following materials: 2 small water glasses, 2 thermometers, ice chest with ice or a refrigerator, cotton balls, small corrugated cardboard box. Fill the glasses with equal amounts of room temperature water. Measure and record the temperatures. Put cotton balls on the bottom of the cardboard box; put one glass inside; then pack the empty space between the glass and the side of the box with cotton balls. Put a thermometer in each glass and place the glasses—one in the box and one not—inside the ice-filled ice chest or refrigerator. Check and record the water temperatures after 5 minutes and 10 minutes.
L E S S O N 6 : H O M E W A T E R & E N E R G Y S U R V E Y
20
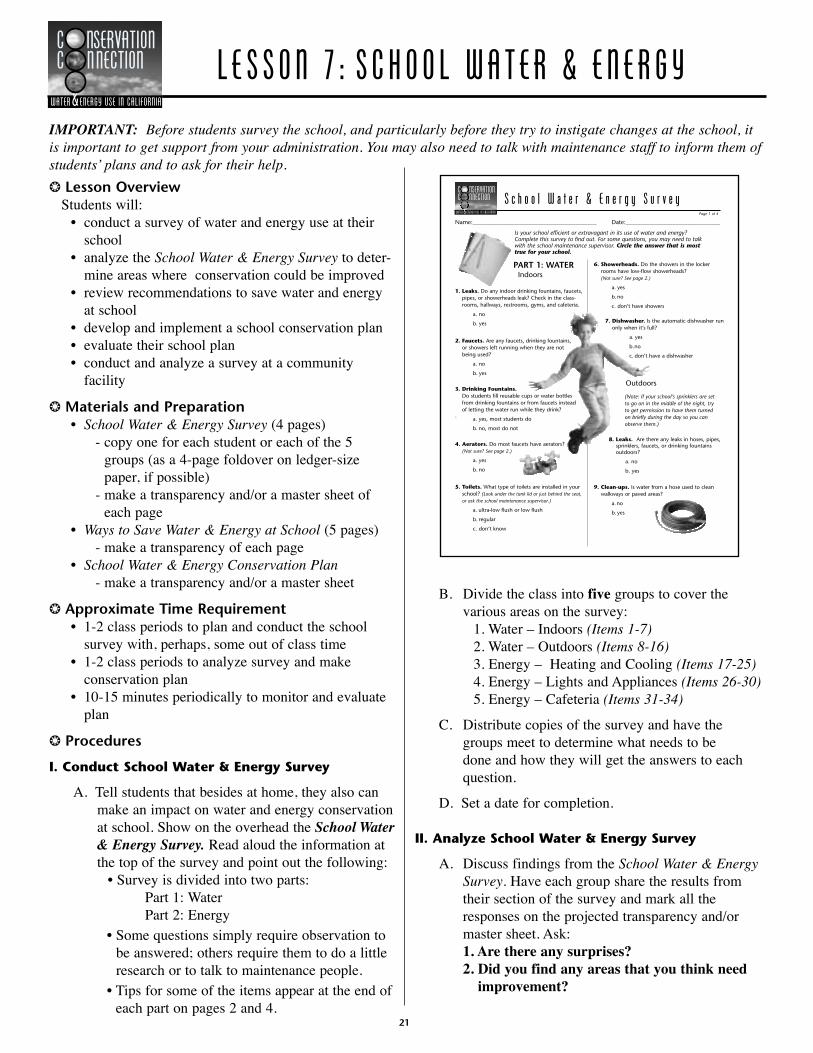
❂ Lesson Overview Students will: • conduct a survey of water and energy use at their
school • analyze the School Water & Energy Survey to deter-
mine areas where conservation could be improved • review recommendations to save water and energy
at school • develop and implement a school conservation plan • evaluate their school plan • conduct and analyze a survey at a community
facility
❂ Materials and Preparation • School Water & Energy Survey (4 pages) - copy one for each student or each of the 5
groups (as a 4-page foldover on ledger-size paper, if possible)
- make a transparency and/or a master sheet of each page
• Ways to Save Water & Energy at School (5 pages) - make a transparency of each page • School Water & Energy Conservation Plan - make a transparency and/or a master sheet
❂ Approximate Time Requirement • 1-2 class periods to plan and conduct the school
survey with, perhaps, some out of class time • 1-2 class periods to analyze survey and make
conservation plan • 10-15 minutes periodically to monitor and evaluate
plan
❂ Procedures
I. Conduct School Water & Energy Survey
A. Tell students that besides at home, they also can make an impact on water and energy conservation at school. Show on the overhead the School Water & Energy Survey. Read aloud the information at the top of the survey and point out the following:
• Survey is divided into two parts: Part 1: Water Part 2: Energy
• Some questions simply require observation to be answered; others require them to do a little research or to talk to maintenance people.
• Tips for some of the items appear at the end of each part on pages 2 and 4.
B. Divide the class into five groups to cover the various areas on the survey:
1. Water – Indoors (Items 1-7)2. Water – Outdoors (Items 8-16)3. Energy – Heating and Cooling (Items 17-25)4. Energy – Lights and Appliances (Items 26-30)5. Energy – Cafeteria (Items 31-34)
C. Distribute copies of the survey and have the groups meet to determine what needs to be done and how they will get the answers to each question.
D. Set a date for completion.
II. Analyze School Water & Energy Survey
A. Discuss findings from the School Water & Energy Survey. Have each group share the results from their section of the survey and mark all the responses on the projected transparency and/or master sheet. Ask:
1. Are there any surprises? 2. Did you find any areas that you think need
improvement?
S c h o o l W a t e r & E n e r g y S u r v e y
PART 1: WATERIndoors
1. Leaks. Do any indoor drinking fountains, faucets,pipes, or showerheads leak? Check in the class-rooms, hallways, restrooms, gyms, and cafeteria.
a. no
b. yes
2. Faucets. Are any faucets, drinking fountains, or showers left running when they are not being used?
a. no
b. yes
3. Drinking Fountains.Do students fill reusable cups or water bottlesfrom drinking fountains or from faucets instead of letting the water run while they drink?
` a. yes, most students do
b. no, most do not
4. Aerators. Do most faucets have aerators?(Not sure? See page 2.)
a. yes
b. no
5. Toilets. What type of toilets are installed in yourschool? (Look under the tank lid or just behind the seat,or ask the school maintenance supervisor.)
a. ultra-low flush or low flush
b. regular
c. don’t know
Is your school efficient or extravagant in its use of water and energy?Complete this survey to find out. For some questions, you may need to talkwith the school maintenance supervisor. Circle the answer that is mosttrue for your school.
6. Showerheads. Do the showers in the lockerrooms have low-flow showerheads?(Not sure? See page 2.)
a. yes
b.no
c. don’t have showers
7. Dishwasher. Is the automatic dishwasher runonly when it’s full?
a. yes
b.no
c. don’t have a dishwasher
Outdoors
(Note: If your school’s sprinklers are setto go on in the middle of the night, tryto get permission to have them turnedon briefly during the day so you canobserve them.)
8. Leaks. Are there any leaks in hoses, pipes,sprinklers, faucets, or drinking fountains outdoors?
a. no
b. yes
9. Clean-ups. Is water from a hose used to cleanwalkways or paved areas?
a.no
b. yes
Name:__________________________________________ Date:________________________________
Page 1 of 4
C NSERVATIONC NNECTION
WATER & ENERGY USE IN CALIFORNIA
L E SSON 7 : S CHOOL WAT ER & E N ERGY C NSERVATION C NNECTION
WATER & ENERGY USE IN CALIFORNIA
IMPORTANT: Before students survey the school, and particularly before they try to instigate changes at the school, it is important to get support from your administration. You may also need to talk with maintenance staff to inform them of students ̓plans and to ask for their help.
21

B. After the responses are recorded on the trans-parency or master sheet, circle the number of any item that has a b response. (NOTE: For #16 “Watering Amount,” circle the item for any response except “e.”) Tell students that these answers indicate a potential “waster” activity.
C. Explain that for every item there are recommenda-tions for “ways to save” water or energy. Project the transparencies of Ways to Save Water & Energy at School. Explain that the second column provides a little information about why it is important to save water or energy in that area (for example, leaks); the other columns describe what actions could be taken in schools to conserve water and energy. Point out that there are various levels of cost for implementing these recommen-dations.
D. Discuss the recommendations for each item need-ing improvement, that is, the items on the survey with a b response. Ask students if they have sug-gestions for conserving water and energy other than those listed.
E. If you have circled #16 on the survey (if your school has a lawn, this item should be circled), point out to students that the recommendation is perform the sprinkler test to see if your school needs to adjust sprinkling times. Have students perform the sprinkler test (page 3 on the Ways to Save sheet), checking either all lawn areas or just a portion of the school lawn to get the idea.
III. Develop a School Water & Energy Conservation Plan
A. Have students as a class decide what changes at their school they would like to work on. Suggest that they focus on only one or two areas (e.g., for water—leaks or overspraying sprinklers; for energy—lights on in empty rooms or equipment left on all night).
B. Project the School Water & Energy Conservation Plan. Discuss the examples shown on the plan. Point out to students that it is important to find out and go through the proper “chain of command” to make some changes; for example, just asking the maintenance crew to do something differently will not work if the maintenance department is follow-ing a district policy.
C. For the area(s) on which theyʼve decided to focus, have students start planning how to get changes made. Either: • work together as a class
or • divide the class into groups to plan how they
would go about improving conservation in the chosen area and what tasks need to be done. Have each group share their ideas with the class and then vote on which ideas to put into action.
S c h o o l W a t e r & E n e r g y C o n s e r v a t i o n P l a nName:__________________________________________ Date:________________
List activities that your school can and will do to help conserve water and energy.
Examples:
Stop sprinklers from spraying pavement.
Turn off lights in classrooms during lunch.
• Talk to maintenance about adjusting sprinklers.• Organize people to clean out sprinklerheads.
• Get approval from principal.• Start poster/sticker campaign to remind people.• Talk to teachers about displaying posters and stickers
in their rooms.
C NSERVATIONC NNECTION
WATER & ENERGY USE IN CALIFORNIA
Conservation Recommendations Tasks
L E SSON 7 : S CHOOL WAT ER & E N ERGY SURV EY
W a y s t o S a v e W a t e r & E n e r g y a t S c h o o l Page 1 of 5
Leaks
1. Leaks(indoors)
8. Leaks(outdoors)
A slow leak of only two table-spoons a minute wastes 15 gallons a day—that’s more than5,000 gallons a year!
No Cost Ways
• Fix the leaks.
Low Cost Ways More Cost Ways
Running Water
2. Faucets
3. Drinking Fountains
4. Aerators
About a gallon of water aminute flows out of a runningfaucet...and down the drain.
• Turn the water off if yousee a faucet, drinking fountain,or shower left running whenno one is using it.
• Install aerators on all yourfaucets; they are inexpensiveand easy to attach.
Toilets
5. Toilet Type
A regular toilet flushes away 5 to7 gallons of water—a lot morethan is needed. Low-flush toiletsuse only 3.5 gallons, and ultra-low flush use only 1.6 gallons todo the same job.
• Install new toilets. Checkwith your water agency for pro-grams to help your school getnew ultra-low flush toilets.
Showers
6. Showerheads
Low-flow showerheads can useup to 75% less water than regu-lar ones—and still provide agood shower. Using less hotwater means using less energyas well.
• Install new showerheads.The water and energy savingscould pay back the cost ofthe showerheads in as little astwo months.
Part 1: WATER
Dishwasher
7. Dishwasher
The dishwasher uses 15 or moregallons of water each time itruns—empty or full.
• Be sure it’s full beforerunning the dishwasher (ora clothes washer).
Cleaning
9. Clean-ups
A hose delivers about 10 gallonsof water a minute (more for bigger hoses).
• Use a broom to sweep awaydirt, leaves, and grass.
C NSERVATIONC NNECTION
WATER & ENERGY USE IN CALIFORNIA
22

Emphasize to students that for any presentations they make—to the principal, the school board, the maintenance supervisor—it is important for them to be prepared with data, costs, specific plans, and recommendations.
IV. Monitor and Evaluate School Conservation Plan
A. Monitor the progress of the School Water & Energy Conservation Plan. Discuss:
- what has and has not been accomplished- why certain tasks have yet to be done- what tasks need to be added- when tasks will be completed.
Make revisions to the plan and continue to monitor the progress.
B. As a class, have students evaluate the success of the plan they made to conserve water and energy at their school. If possible, see if they can compare water or energy usage before and after their plan, either by checking bills or by checking with the district office.
V. Survey Community Facility
A. Locate one or more community facilities (for example, parks, churches, community centers, local businesses) that are willing to have students survey their water and energy use.
B. Have students decide whether the home or school survey is more appropriate, or whether they should develop another survey specifically for that site.
C. Have students conduct and analyze the survey to determine where water and energy is being wasted at that facility.
D. From the survey results, have students compile specific recommendations for conserving water and energy at that facility and present the results. If appropriate, have students volunteer to help institute some of the changes.
Extension Activities
• Compare sunlight and electric light. Cover the windows and turn on the lights necessary to work comfortably. Add up the electrical usage to keep these lights on throughout the day. Now uncover the windows and see how many lights can be turned off. Compare the usage. Also, in warm weather, compare the temperature with windows covered and uncovered and consider air condition-ing load increase.
• Write proposals to make improvements. If students have found that their school needs new equipment to help conserve water or energy, have them write proposals to get the change done—both approval to make the change and money to fund the change.
• Go on patrol. Ask students to observe in the community where they see water and energy being wasted, for example, lights left on in office buildings all night, parks being watered in the rain. Keep a list and find out who to talk to change the “waster” activity.
• Examine heating and/or air conditioning systems. Ask the schoolʼs custodian or your districtʼs energy manager to take your students on a tour of your schoolʼs heating system and, if your school has it, air conditioning system. Have students find out how the electric and/or gas meter works, how the air gets heated or cooled, how the heated or cooled air gets into the rooms, what it costs each month to heat or cool the school.
L E SSON 7 : S CHOOL WAT ER & E N ERGY SURV EY
23
APP END I C E S C NSERVATION C NNECTION
WATER & ENERGY USE IN CALIFORNIA
24
Masters Worksheets and Information Sheets . . . . . . . . . . . . . . . . . . . . . . . . . . . . . 25
• Personal Water & Energy Use (2 pages) • How Much Water Does It Use? • Energy Source Comparison • How Much Energy Does It Use? • Summary of Ways to Save Water & Energy at Home (2 pages) • Personal Water & Energy Conservation Plan • Family Water & Energy Conservation Plan • School Water & Energy Conservation Plan • Assessment (2 pages)
Surveys and Recommendations . . . . . . . . . . . . . . . . . . . . . . . . . . . . . . . . 38
• Home Water & Energy Survey (4 pages) • Ways to Save Water & Energy at Home (5 pages) • School Water & Energy Survey (4 pages) • Ways to Save Water & Energy at School (5 pages)
Correlations to California State Content Standards . . . . . . . . . . . . . . . . . . . . . . 57Resources . . . . . . . . . . . . . . . . . . . . . . . . . . . . . . . . . . . . . . . . . . . . . . . . . . . . . . . . . . . . 58
PAGE

25
MAST ERS - WORKSH E E T S & I N F ORMAT I ON SH E E T S
C NSERVATION C NNECTION
WATER & ENERGY USE IN CALIFORNIA
• Personal Water & Energy Use (2 pages)
• How Much Water Does It Use?
• Energy Source Comparison
• How Much Energy Does It Use?
• Summary of Ways to Save Water & Energy at Home (2 pages)
• Personal Water & Energy Conservation Plan
• Family Water & Energy Conservation Plan
• School Water & Energy Conservation Plan
• Assessment (2 pages)
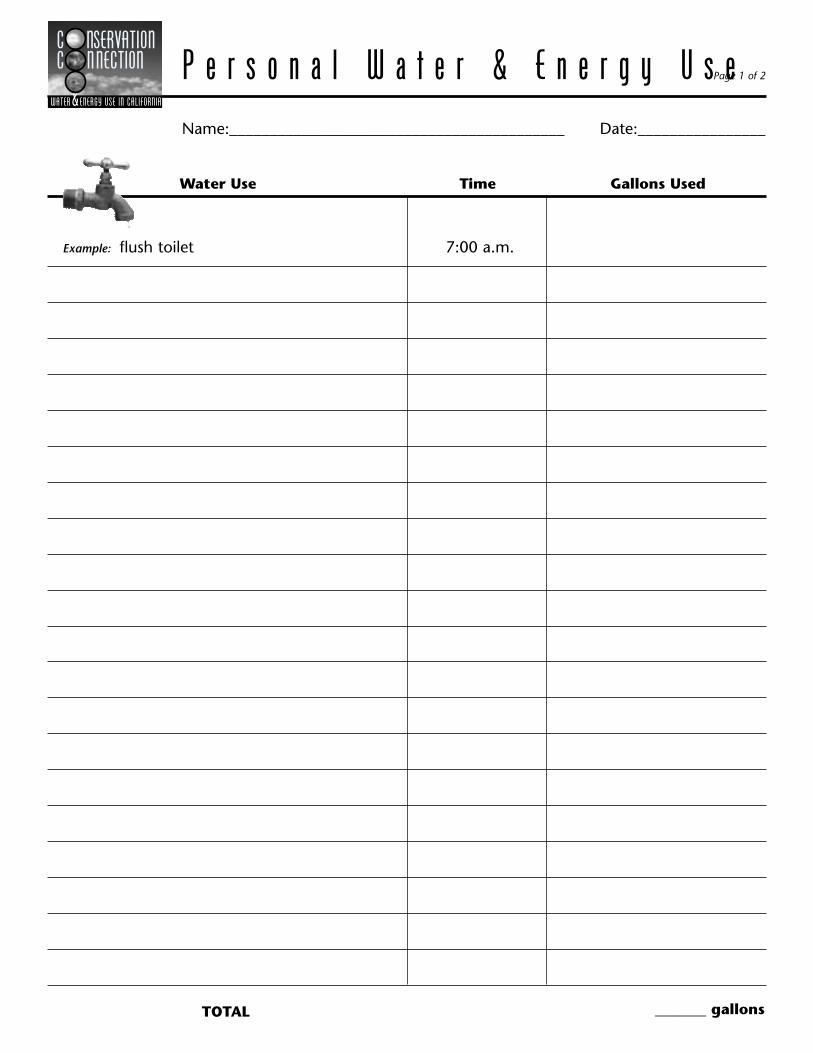
P e r s o n a l W a t e r & E n e r g y U s eName:__________________________________________ Date:________________
Water Use Time Gallons Used
Example: flush toilet 7:00 a.m.
_______ gallonsTOTAL
C NSERVATION C NNECTION
WATER & ENERGY USE IN CALIFORNIA
Page 1 of 2

P e r s o n a l W a t e r & E n e r g y U s eName:__________________________________________ Date:________________
Energy Use Time Kilowatt Hours OR BTU Used
Example: alarm clock 6:30 a.m.
_______ kWh _______ BTUTOTAL
C NSERVATION C NNECTION
WATER & ENERGY USE IN CALIFORNIA
Page 2 of 2
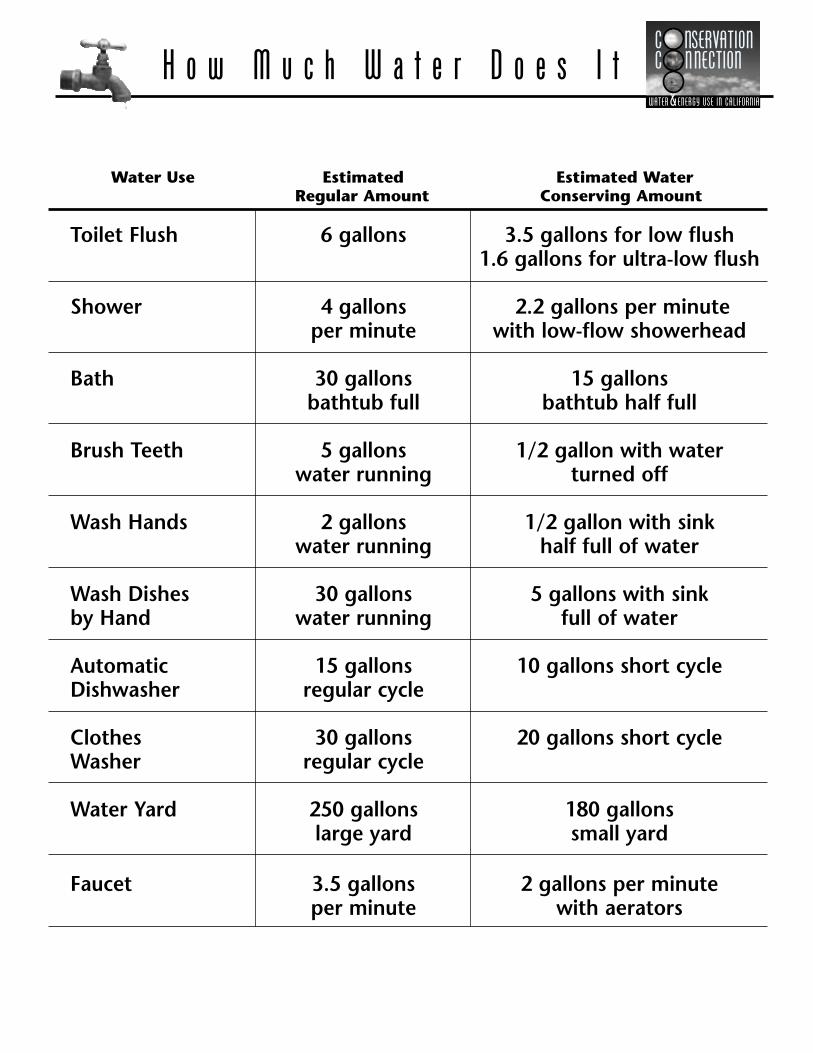
Toilet Flush 6 gallons 3.5 gallons for low flush 1.6 gallons for ultra-low flush
Shower 4 gallons 2.2 gallons per minute per minute with low-flow showerhead
Bath 30 gallons 15 gallons bathtub full bathtub half full
Brush Teeth 5 gallons 1/2 gallon with water water running turned off
Wash Hands 2 gallons 1/2 gallon with sink water running half full of water
Wash Dishes 30 gallons 5 gallons with sinkby Hand water running full of water
Automatic 15 gallons 10 gallons short cycleDishwasher regular cycle
Clothes 30 gallons 20 gallons short cycleWasher regular cycle
Water Yard 250 gallons 180 gallons large yard small yard
Faucet 3.5 gallons 2 gallons per minute per minute with aerators
H o w M u c h W a t e r D o e s I t U s e ?
Water Use Estimated Estimated Water Regular Amount Conserving Amount
C NSERVATION C NNECTION
WATER & ENERGY USE IN CALIFORNIA
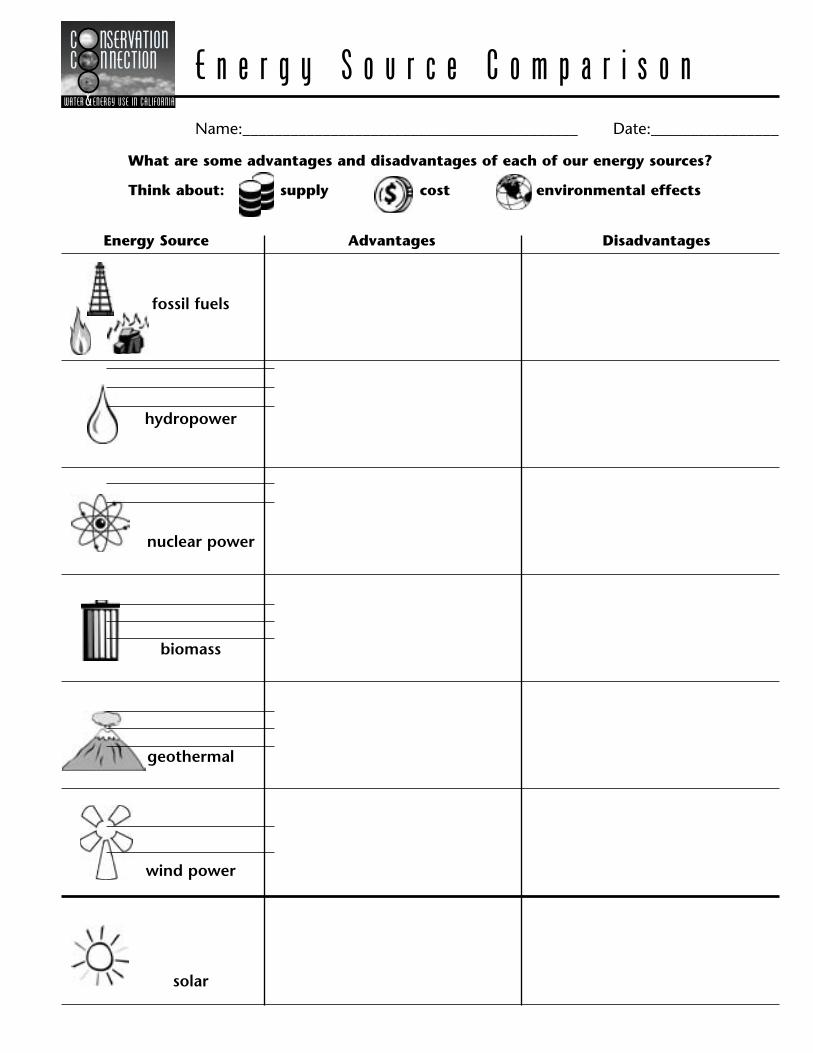
E n e r g y S o u r c e C o m p a r i s o nName:__________________________________________ Date:________________
What are some advantages and disadvantages of each of our energy sources?
Think about: supply cost environmental effects
Energy Source Advantages Disadvantages
fossil fuels
hydropower
nuclear power
biomass
geothermal
wind power
solar
C NSERVATION C NNECTION
WATER & ENERGY USE IN CALIFORNIA

Appliance Estimated Energy Use
H o w M u c h E n e r g y D o e s I t U s e ?
Air Conditioner – Room 1.3 kWh per hour Air Conditioner – Central 3.0 kWh per hourBlender 0.4 kWh per hourCassette Player 0.01 kWh per hourCD Player 0.01 kWh per hourClock 0.05 kWh per dayClothes Dryer 3.0 kWh per load OR 18,000 BTU per hourClothes Washer 0.25 kWh per loadCoffee Maker 0.20 kWh per potComputer 0.12 kWh per hourDishwasher 1.5 kWh per loadElectric Blanket 0.75 kWh per nightFan 0.17 kWh per hourFrying Pan 1.20 kWh per hourFurnace 15.0 kWh per hour OR 100,000 BTU per hourHair Dryer 1.0 kWh per hourHeater – Portable 1.5 kWh per hourIron 1.0 kWh per hourMicrowave 1.5 kWh per hourOven 3.0 kWh per hour OR 18,000 BTU per hourRadio 0.10 kWh per hourRange Burner 1.5 kWh per hour OR 9,000 BTU per hourRefrigerator 5.0 kWh per hourTelevision 0.20 kWh per hourToaster 0.10 kWh per useToaster Oven 0.75 kWh per hourVacuum Cleaner 0.75 kWh per hourVCR 0.02 kWh per hourWater Heater 13.0 kWh per day OR 36,000 BTU per hour100-Watt Incandescent 0.10 kWh per hourLight Bulb27-Watt Fluorescent 0.03 kWh per hourLight Bulb
C NSERVATION C NNECTION
WATER & ENERGY USE IN CALIFORNIA

1,
2To
ilet
s
SUM
MAR
Y of
Way
s to
Sav
e W
ater
& E
nerg
y at
Hom
e
Page
1 o
f 2
No
Co
st W
ays
• U
se a
was
teba
sket
inst
ead
of f
lush
ing
tras
h do
wn
the
toile
t.•
Inst
all a
dis
pla
cem
ent
devi
ce in
the
toi
let
tank
.•
Get
new
low
-flu
sh t
oile
ts.
Low
Co
st W
ays
Mo
st C
ost
Way
s
3,
4Sh
ow
ers
• Ta
ke s
hort
er s
how
ers
and
shal
low
er b
aths
. •
Inst
all a
new
low
-flo
w s
how
erhe
ad.
5,
6
Fau
cets
• Tu
rn t
he w
ater
off
whi
le b
rush
ing
your
te
eth,
sha
ving
, w
ashi
ng d
ishe
s, e
tc.
• In
stal
l aer
ator
s on
all
your
fau
cets
.
7,
8D
ish
was
her
an
d
Clo
thes
Was
her
• W
ash
full
load
s of
dis
hes
and
clot
hes.
•
Use
the
sho
rtes
t cy
cles
.•
Use
col
d w
ater
in c
loth
es w
ashe
r w
hene
ver
pos
sibl
e to
sav
e en
ergy
.•
Air
dry
dish
es in
the
dis
hwas
her
by o
pen
ing
the
door
slig
htly
aft
er t
he f
inal
rin
se t
o sa
ve
ener
gy.
• Re
pla
ce o
ld a
pp
lianc
es w
ith E
nerg
y St
ar-
rate
d ap
plia
nces
.
Par
t 1:
WA
TER
9,
10,
11
La
wn
an
d
Gar
den
• Tr
im a
roun
d, c
lean
out
, ad
just
, an
d re
pai
r sp
rinkl
ers
so t
hey
dire
ct w
ater
onl
y on
to
the
law
n.•
Set
a tim
er t
o re
min
d yo
u to
tur
n sp
rinkl
ers
off.
• W
ater
ear
ly in
the
mor
ning
. (A
void
pea
k w
ater
and
ene
rgy
use
hour
s of
noo
n to
8
p.m
.)•
Wat
er o
nly
whe
n ne
cess
ary.
• W
ater
slo
wly
to
redu
ce r
unof
f.•
Build
bas
ins
arou
nd p
lant
s.•
Use
mul
ch a
roun
d tr
ees,
shr
ubs,
and
pla
nts.
•
Adju
st w
ater
ing
sche
dule
s w
ith w
eath
er.
• Re
pla
ce b
roke
n sp
rinkl
erhe
ads.
• A
erat
e yo
ur la
wn
so t
hat
wat
er s
oaks
in.
• U
se a
shu
t-of
f no
zzle
on
hose
.•
Inst
all a
utom
atic
irrig
atio
n tim
ers.
• U
pda
te y
our
irrig
atio
n sy
stem
.
• Pl
ant
low
-wat
er u
se la
wns
and
pla
nts.
• Re
pla
ce la
wns
with
dro
ught
-tol
eran
t gr
ound
co
ver
and
shru
bs.
12,
13
Ou
tdoo
r C
lean
ing
• U
se a
bro
om in
stea
d of
the
hos
e.•
Use
a b
ucke
t of
wat
er n
ot a
run
ning
hos
e to
was
h yo
ur c
ar.
• U
se a
shu
t-of
f no
zzle
on
the
hose
.
14
Po
ol
• Lo
wer
the
wat
er t
emp
erat
ure
to r
educ
e ev
apor
atio
n an
d to
sav
e en
ergy
.•
Use
a p
ool c
over
.
15
Leak
s•
Fix
the
leak
.•
Cal
l a p
lum
ber. C N
SERVA
TION
C N
NECT
ION
WATE
R & EN
ERGY
USE I
N CAL
IFORN
IA

SUM
MAR
Y of
Way
s to
Sav
e W
ater
& E
nerg
y at
Hom
e
Page
2 o
f 2
No
Co
st W
ays
16,
17,
18
Hea
tin
g•
Wea
r m
ore
laye
rs o
f cl
othe
s.•
Keep
the
the
rmos
tat
at 6
8 de
gree
s or
low
er
durin
g th
e da
y an
d 58
deg
rees
or
low
er a
t ni
ght.
• In
stal
l a p
rogr
amm
able
the
rmos
tat.
• C
hang
e yo
ur f
urna
ce f
ilter
eve
ry m
onth
or
two.
• H
ave
your
fur
nace
ser
vice
d.
• Re
pla
ce a
n ol
d fu
rnac
e.
Low
Co
st W
ays
Mo
st C
ost
Way
s
19,
20
Co
oli
ng
• Se
t th
e th
erm
osta
t no
low
er t
han
78 d
egre
es
whe
n yo
u’re
hom
e an
d 85
deg
rees
whe
n yo
u’re
aw
ay.
• C
lose
sha
des
or c
urta
ins
over
sun
ny w
indo
ws.
• Av
oid
usin
g he
at-p
rodu
cing
ap
plia
nces
dur
ing
the
war
mes
t tim
e of
the
day
.
• U
se f
loor
and
cei
ling
fans
.•
Che
ck d
ucts
for
bre
aks
or le
aks.
• Sh
ade
air
cond
ition
ing
unit
from
dire
ct
sunl
ight
.
21
Insu
lati
on
22,
23
Win
do
ws
an
d D
oo
rs
• Ke
ep w
indo
ws
and
door
s cl
osed
whe
n yo
u ha
ve t
he h
eate
r or
air
cond
ition
er o
n.•
Wea
ther
str
ip o
utsi
de d
oors
and
cau
lk
win
dow
fra
mes
and
any
cra
cks,
hol
es,
or
open
ings
thr
ough
whi
ch a
ir ca
n flo
w.
Par
t 2:
ENER
GY
24
Wat
er H
eate
r•
Turn
dow
n th
e te
mp
erat
ure
to 1
30 d
egre
es
or le
ss,
or t
o th
e “c
onse
rvat
ion”
set
ting.
• W
rap
insu
latio
n ar
ound
wat
er h
eate
r
(esp
ecia
lly a
n ol
d on
e) a
nd a
roun
d th
e w
ater
pip
es le
adin
g fr
om t
he h
eate
r.
25,
26,
27
Lig
hts
an
d
Smal
l A
pp
lian
ces
28,
30
Ref
rig
erat
or
• O
pen
and
clo
se t
he r
efrig
erat
or d
oor
qui
ckly
.•
Redu
ce n
umbe
r of
tim
es y
ou o
pen
the
re
frig
erat
or.
• C
lean
the
coi
ls o
f yo
ur r
efrig
erat
or.
• Re
pla
ce o
ld r
efrig
erat
or w
ith lo
w e
nerg
y-us
e re
frig
erat
or.
Look
for
Ene
rgy-
Star
ap
plia
nces
.
29,
30
Clo
thes
Dry
er•
Rep
lace
old
dry
er w
ith lo
w e
nerg
y-us
e dr
yer.
Look
for
Ene
rgy-
Star
ap
plia
nces
.
• Pl
ant
deci
duou
s sh
ade
tree
s on
the
sou
th
and
wes
t si
des
of t
he h
ouse
.•
Add
awni
ngs
or s
hade
s ov
er o
utsi
de s
unny
w
indo
ws.
• In
stal
l roo
f ve
nts
or a
n at
tic f
an.
• Ad
d a
who
le h
ouse
fan
.
• Ad
d in
sula
tion
in o
utsi
de w
alls
and
cei
ling.
• Tu
rn o
ff lig
hts,
TVs
, st
ereo
s, e
tc.
that
are
n’t
bein
g us
ed.
• U
se c
lock
tim
ers
to s
hut
off
TVs
and
ster
eos
auto
mat
ical
ly.
• U
nplu
g ch
argi
ng u
nits
.•
Cha
nge
to lo
wer
-wat
tage
bul
bs.
• C
lean
bul
bs a
nd f
ixtu
res.
• U
se c
omp
act
fluor
esce
nt b
ulbs
whe
re
pos
sibl
e.•
Inst
all c
lock
tim
ers
or m
otio
n se
nsor
s to
tur
n lig
hts
off
auto
mat
ical
ly.
• U
se a
mic
row
ave
or a
sm
all e
lect
ric o
ven
for
smal
l am
ount
s.
• D
ry o
nly
full
load
s of
laun
dry.
• Se
t dr
yer
to a
uto-
dry
rath
er t
han
a tim
ed
cycl
e.
31
Car
po
oli
ng
• C
arp
ool w
hene
ver
pos
sibl
e.•
Wal
k or
bic
ycle
whe
n p
ossi
ble.
• Ta
ke p
ublic
tra
nsp
orta
tion.
• Ke
ep y
our
car’s
eng
ine
tune
d an
d tir
es
pro
per
ly in
flate
d.
• Bu
y a
car
that
get
s hi
gh g
as m
ileag
e,
such
as
a hy
brid
tha
t us
es g
asol
ine
and
elec
tric
ity.
C N
SERVA
TION
C N
NECT
ION
WATE
R & EN
ERGY
USE I
N CAL
IFORN
IA
P e r s o n a l W a t e r & E n e r g y C o n s e r v a t i o n Name:__________________________________________ Date:________________
List those activities that you can and will do to help conserve water and energy.
C NSERVATION C NNECTION
WATER & ENERGY USE IN CALIFORNIA

F a m i l y W a t e r & E n e r g y C o n s e r v a t i o n Name:__________________________________________ Date:________________
List what your family will do to help conserve water and energy.
N E W T E C H N O L O G Y
C O N S E R V A T I O N P R A C T I C E S
C NSERVATION C NNECTION
WATER & ENERGY USE IN CALIFORNIA
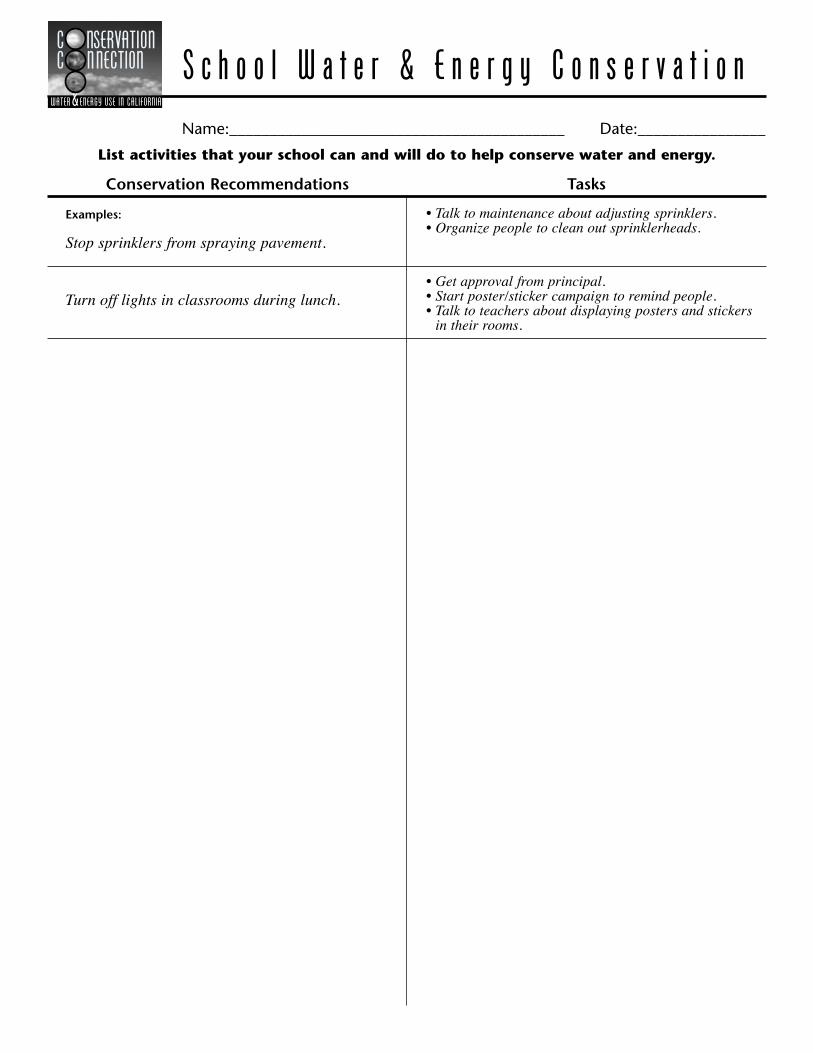
S c h o o l W a t e r & E n e r g y C o n s e r v a t i o n Name:__________________________________________ Date:________________
List activities that your school can and will do to help conserve water and energy.
Examples:
Stop sprinklers from spraying pavement.
Turn off lights in classrooms during lunch.
• Talk to maintenance about adjusting sprinklers.• Organize people to clean out sprinklerheads.
• Get approval from principal.• Start poster/sticker campaign to remind people.• Talk to teachers about displaying posters and stickers
in their rooms.
C NSERVATION C NNECTION
WATER & ENERGY USE IN CALIFORNIA
Conservation Recommendations Tasks

A s s e s s m e n t
1. Surface water refers to:
a. the ocean
b. water in lakes, streams, rivers, and oceans
c. water in aqueducts and reservoirs
2. Groundwater refers to:
a. all the water on top of the ground
b. all the water under the ground
c. the water in wells
3. In California, almost half of our water supply is used:
a. for crops and farm animals
b. in homes and businesses
c. for public services
4. Aqueducts are used to:
a. store water
b. prevent flooding
c. transport water
5. California’s population is:
a. increasing
b. staying about the same
c. decreasing
6. In California, our supply of water:
a. is more than we need
b. comes partly from water from other states
c. is mainly in the southern part of the state
Circle the letter of the answer that best completes each sentence.
7. Recycled water can be used:
a. only for irrigation
b. only if fresh water is not available
c. for all purposes except drinking
8. The main reason we don’t use desalination more is:
a. the Pacific Ocean is too salty
b. it is expensive
c. both a and b
9. We can conserve water:
a. through improved technology
b. by using non-wasteful practices
c. both a and b
10. In the United States, and in California, most of the energy we use comes from:
a. hydropower
b. nuclear power
c. fossil fuels
11. Hydropower is a:
a. renewable energy source
b. nonrenewable energy source
c. polluting energy source
12. The fuel for biomass is:
a. uranium
b. hydrogen
c. trash
Name:__________________________________________ Date:________________________________
Page 1 of 2
C NSERVATION C NNECTION
WATER & ENERGY USE IN CALIFORNIA

A s s e s s m e n t
13. One reason that wind doesn’t supply more of our energy is:
a. it’s a nonrenewable source
b. wind machines are too expensive
c. it is not reliable
14. Solar cells are used to:
a. make electricity
b. heat water
c. power fuel cells
15. In California, our supply of energy:
a. comes partly from other states
b. always meets our demand
c. is not a problem
16. Appliances today are generally:
a. more efficient than in the past
b. less efficient than in the past
c. bigger than those in the past
17. We can save energy in buildings by using:
a. incandescent light bulbs
b. programmable thermostats
c. more appliances with “stand-by” modes
18. Each person today uses more energy than people in the past because:
a. each appliance uses more energy
b. we have more appliances that use energy
c. both a and b
19. In the future, we may need to depend more on:
a. renewable energy sources
b. nonrenewable energy sources
c. fossil fuels
20. Conserving energy means that we will:
a. save money
b. protect the environment
c. both a and b
Page 2 of 2
C NSERVATION C NNECTION
WATER & ENERGY USE IN CALIFORNIA

38
MAST ERS - S URV EYS AND R ECOMMENDAT I ONS
C NSERVATION C NNECTION
WATER & ENERGY USE IN CALIFORNIA
• Home Water & Energy Survey (4 pages)
• Ways to Save Water & Energy at Home (5 pages)
• School Water & Energy Survey (4 pages)
• Ways to Save Water & Energy at School (5 pages)
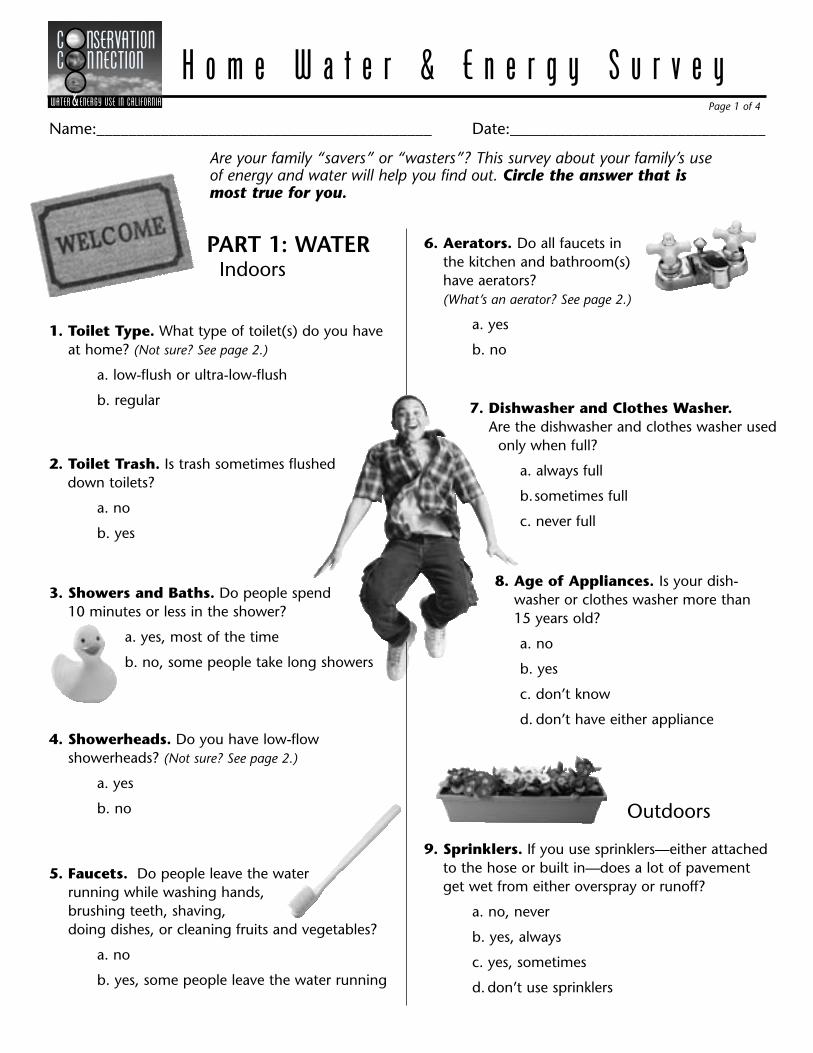
H o m e W a t e r & E n e r g y S u r v e y
PART 1: WATER Indoors
1. Toilet Type. What type of toilet(s) do you have at home? (Not sure? See page 2.)
a. low-flush or ultra-low-flush
b. regular
2. Toilet Trash. Is trash sometimes flushed down toilets?
a. no
b. yes
3. Showers and Baths. Do people spend 10 minutes or less in the shower?
a. yes, most of the time
b. no, some people take long showers
4. Showerheads. Do you have low-flow showerheads? (Not sure? See page 2.)
a. yes
b. no
5. Faucets. Do people leave the water running while washing hands, brushing teeth, shaving, doing dishes, or cleaning fruits and vegetables?
a. no
b. yes, some people leave the water running
Are your family “savers” or “wasters”? This survey about your family’s use of energy and water will help you find out. Circle the answer that is most true for you.
6. Aerators. Do all faucets in the kitchen and bathroom(s) have aerators? (What’s an aerator? See page 2.)
a. yes
b. no 7. Dishwasher and Clothes Washer.
Are the dishwasher and clothes washer used only when full?
a. always full
b.sometimes full
c. never full
8. Age of Appliances. Is your dish-
washer or clothes washer more than 15 years old?
a. no
b. yes
c. don’t know
d. don’t have either appliance
Outdoors
9. Sprinklers. If you use sprinklers—either attached to the hose or built in—does a lot of pavement get wet from either overspray or runoff?
a. no, never
b. yes, always
c. yes, sometimes
d. don’t use sprinklers
Name:__________________________________________ Date:________________________________
Page 1 of 4
C NSERVATION C NNECTION
WATER & ENERGY USE IN CALIFORNIA
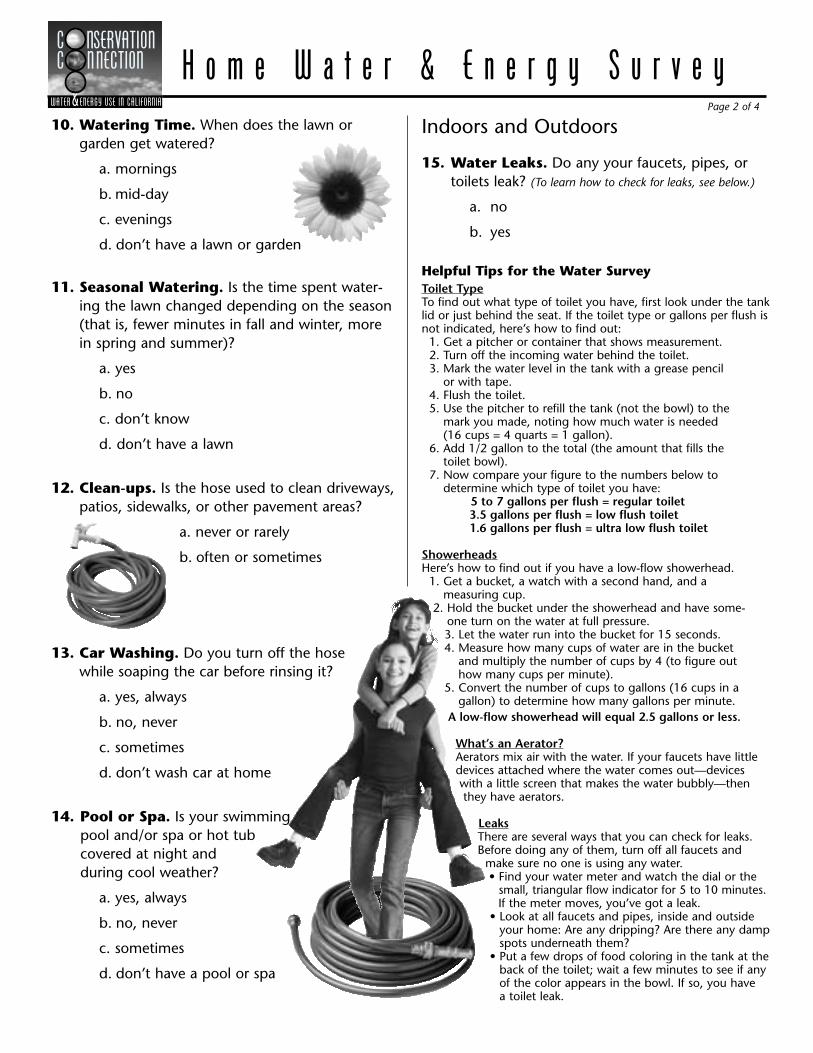
10. Watering Time. When does the lawn or garden get watered?
a. mornings
b. mid-day
c. evenings
d. don’t have a lawn or garden
11. Seasonal Watering. Is the time spent water-
ing the lawn changed depending on the season (that is, fewer minutes in fall and winter, more in spring and summer)?
a. yes
b. no
c. don’t know
d. don’t have a lawn
12. Clean-ups. Is the hose used to clean driveways, patios, sidewalks, or other pavement areas?
a. never or rarely
b. often or sometimes
13. Car Washing. Do you turn off the hose while soaping the car before rinsing it?
a. yes, always
b. no, never
c. sometimes
d. don’t wash car at home
14. Pool or Spa. Is your swimming pool and/or spa or hot tub covered at night and during cool weather?
a. yes, always
b. no, never
c. sometimes
d. don’t have a pool or spa
Indoors and Outdoors
15. Water Leaks. Do any your faucets, pipes, or toilets leak? (To learn how to check for leaks, see below.)
a. no
b. yes
Helpful Tips for the Water SurveyToilet TypeTo find out what type of toilet you have, first look under the tank lid or just behind the seat. If the toilet type or gallons per flush is not indicated, here’s how to find out: 1. Get a pitcher or container that shows measurement. 2. Turn off the incoming water behind the toilet. 3. Mark the water level in the tank with a grease pencil
or with tape. 4. Flush the toilet. 5. Use the pitcher to refill the tank (not the bowl) to the
mark you made, noting how much water is needed (16 cups = 4 quarts = 1 gallon).
6. Add 1/2 gallon to the total (the amount that fills the toilet bowl).
7. Now compare your figure to the numbers below to determine which type of toilet you have:
5 to 7 gallons per flush = regular toilet 3.5 gallons per flush = low flush toilet 1.6 gallons per flush = ultra low flush toilet
ShowerheadsHere’s how to find out if you have a low-flow showerhead. 1. Get a bucket, a watch with a second hand, and a
measuring cup. 2. Hold the bucket under the showerhead and have some-
one turn on the water at full pressure. 3. Let the water run into the bucket for 15 seconds. 4. Measure how many cups of water are in the bucket
and multiply the number of cups by 4 (to figure out how many cups per minute).
5. Convert the number of cups to gallons (16 cups in a gallon) to determine how many gallons per minute.
A low-flow showerhead will equal 2.5 gallons or less.
What’s an Aerator? Aerators mix air with the water. If your faucets have little
devices attached where the water comes out—devices with a little screen that makes the water bubbly—then they have aerators.
Leaks There are several ways that you can check for leaks.
Before doing any of them, turn off all faucets and make sure no one is using any water.
• Find your water meter and watch the dial or the small, triangular flow indicator for 5 to 10 minutes.
If the meter moves, you’ve got a leak. • Look at all faucets and pipes, inside and outside
your home: Are any dripping? Are there any damp spots underneath them?
• Put a few drops of food coloring in the tank at the back of the toilet; wait a few minutes to see if any of the color appears in the bowl. If so, you have a toilet leak.
Page 2 of 4
H o m e W a t e r & E n e r g y S u r v e yC NSERVATION C NNECTION
WATER & ENERGY USE IN CALIFORNIA

PART 2: ENERGY Heating and Cooling
16. Heater Thermostat. What temperature do you set your heater thermostat in winter?
a. 68 degrees or lower
b. 69 degrees or higher
c. don’t know
d. no heating system or no thermostat
17. Nighttime Temperature. Do you turn down your heater thermostat at night when people go to bed?
a. yes
b. no
c. don’t know
d. no thermostat
18. Furnace Maintenance. Do you have your furnace serviced every year if you have a gas or electric furnace or heater?
a. yes
b. no
c. don’t know
d. no furnace or heater
19. Air Conditioner Thermostat. What temperature do you set your air conditioner thermostat in the summer?
a. 78 degrees or higher
b. 77 degrees or lower
c. don’t know
d. no air conditioner or no thermostat
20. Window Shades. Are window
shades or curtains used to block out sun in warm weather?
a. yes
b. no
21. Insulation. Does your home have insulation in the ceiling and walls to keep heat in during cold weather and out during hot weather?
a. yes, both ceiling and walls are insulated
b. no
c. can’t tell
22. Weather Stripping. Does air leak in or out of windows or doors even when they are closed?
(Not sure? See page 4 for the “draftometer” test.)
a. no
b. yes
23. Windows and Doors. Are windows and out-side doors kept closed when the heater or air conditioner is on?
a. yes, most of the time
b. no, not usually
24. Water Heater Temperature. Is your water heater temperature set at 130 degrees or lower, or at the conservation, medium, or low settings?
a. yes
b. no
c. can’t tell
d. no water heater or not accessible
Page 3 of 4
H o m e W a t e r & E n e r g y S u r v e yC NSERVATION C NNECTION
WATER & ENERGY USE IN CALIFORNIA

Lights and Appliances
25. Light Bulbs. Do you have compact fluorescent light bulbs or fluorescent light tubes in most of your home? (What’s fluorescent lighting? See below.)
a. yes
b. no
26. Lights and Appliances. Are lights, televisions, stereos, and other electric appliances turned off when they’re not being used?
a. yes, most of the time
b. no, often they are left on
27. Cooking. Do you use a microwave or “toaster oven” for small meals or snacks?
a. yes
b. no
28. Refrigerator. Are the refrigerator and freezer doors opened and closed quickly rather than left standing open?
a. yes
b. no
29. Clothes Dryer. Is the clothes dryer used only for full loads?
a. yes
b. no
30. Age of Major Appliances. Do you have any “old” (15 years or more) major appliances: furnace, air conditioner, water heater, refrigerator?
a. no
b. yes
c. don’t know
Transportation
31. Carpooling. Does anyone in your family regularly carpool or use public transportation? a. yes
b. no
Helpful Tips for the Home Energy Survey
Draftometer TestTo check windows and doors for leaks, conduct the following test. 1. Cut a piece of thin, plastic food-
wrap about 5 inches wide and 10 inches long.
2. Tape the short edge of the plastic along the edge of a pencil.
3. Hold this “draftometer” near the edges of doors and win-dows. If the plastic moves, then air is leak-ing in or out.
What’s Fluorescent Lighting?Fluorescent light bulbs will likely be either tubes or oddly shaped bulbs, both of which stay cool, as opposed to round incandescent bulbs, which get very hot.
Page 4 of 4
H o m e W a t e r & E n e r g y C NSERVATION C NNECTION
WATER & ENERGY USE IN CALIFORNIA
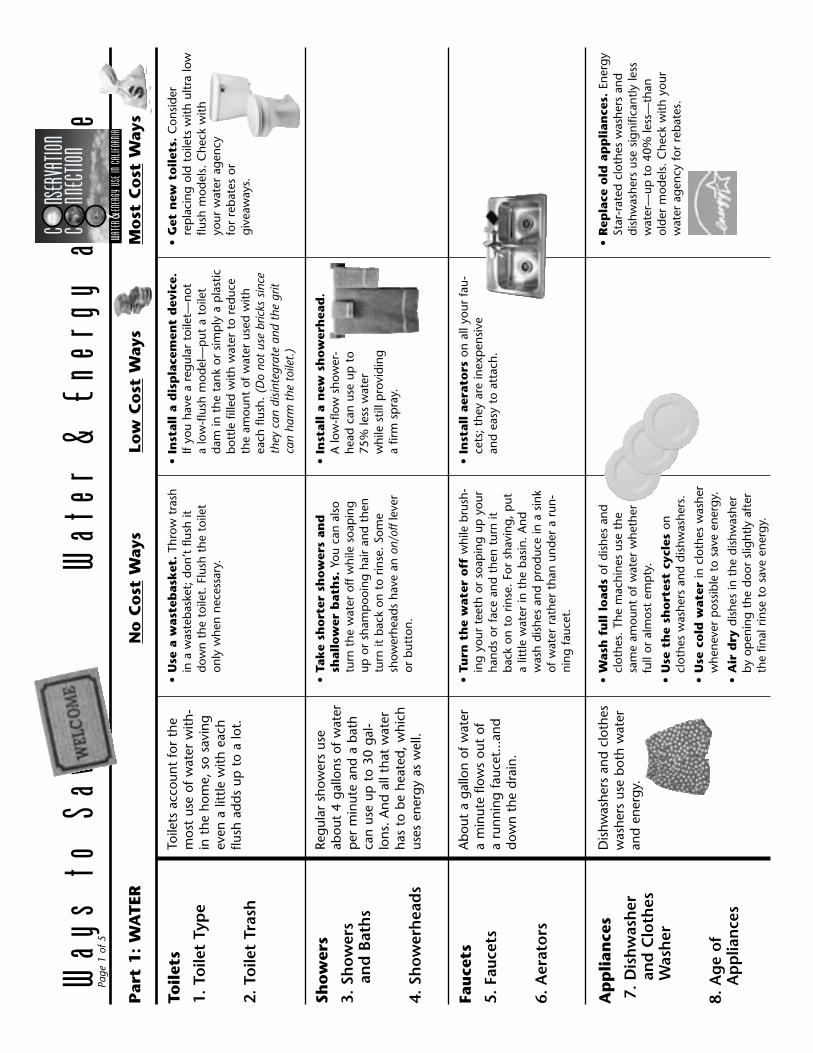
Way
s to
Sav
e
W
ater
& E
nerg
y at
Hom
e
Pa
ge 1
of 5
No
Co
st W
ays
Toil
ets
1. T
oile
t Ty
pe
2. T
oile
t Tr
ash
Toile
ts a
ccou
nt f
or t
he
mos
t us
e of
wat
er w
ith-
in t
he h
ome,
so
savi
ng
even
a li
ttle
with
eac
h flu
sh a
dds
up t
o a
lot.
• U
se a
was
teb
asket
. Th
row
tra
sh
in a
was
teba
sket
; do
n’t
flush
it
dow
n th
e to
ilet.
Flu
sh t
he t
oile
t on
ly w
hen
nece
ssar
y.
• In
stal
l a
dis
pla
cem
ent
dev
ice.
If
you
have
a r
egul
ar t
oile
t—no
t a
low
-flu
sh m
odel
—p
ut a
toi
let
dam
in t
he t
ank
or s
imp
ly a
pla
stic
bo
ttle
fill
ed w
ith w
ater
to
redu
ce
the
amou
nt o
f w
ater
use
d w
ith
each
flu
sh.
(Do
not
use
bric
ks s
ince
th
ey c
an d
isin
tegr
ate
and
the
grit
can
harm
the
toi
let.
)
• G
et n
ew t
oil
ets.
Con
side
r re
pla
cing
old
toi
lets
with
ultr
a lo
w
flush
mod
els.
Che
ck w
ith
your
wat
er a
genc
y
for
reba
tes
or
give
away
s.
Low
Co
st W
ays
Mo
st C
ost
Way
s
Sho
wer
s
3. S
how
ers
and
Bat
hs
4. S
how
erh
ead
s
Regu
lar
show
ers
use
abou
t 4
gallo
ns o
f w
ater
p
er m
inut
e an
d a
bath
ca
n us
e up
to
30 g
al-
lons
. A
nd a
ll th
at w
ater
ha
s to
be
heat
ed,
whi
ch
uses
ene
rgy
as w
ell.
• Ta
ke
sho
rter
sh
ow
ers
and
sh
allo
wer
bat
hs.
You
can
als
o tu
rn t
he w
ater
off
whi
le s
oap
ing
up o
r sh
amp
ooin
g ha
ir an
d th
en
turn
it b
ack
on t
o rin
se.
Som
e sh
ower
head
s ha
ve a
n on
/off
leve
r or
but
ton.
• In
stal
l a
new
sh
ow
erh
ead
.
A lo
w-f
low
sho
wer
- he
ad c
an u
se u
p t
o
75%
less
wat
er
whi
le s
till p
rovi
ding
a
firm
sp
ray.
Fau
cets
5. F
auce
ts
6. A
erat
ors
Abo
ut a
gal
lon
of w
ater
a
min
ute
flow
s ou
t of
a
runn
ing
fauc
et...
and
dow
n th
e dr
ain.
• Tu
rn t
he
wat
er o
ff w
hile
bru
sh-
ing
your
tee
th o
r so
apin
g up
you
r ha
nds
or f
ace
and
then
tur
n it
back
on
to r
inse
. Fo
r sh
avin
g, p
ut
a lit
tle w
ater
in t
he b
asin
. A
nd
was
h di
shes
and
pro
duce
in a
sin
k of
wat
er r
athe
r th
an u
nder
a r
un-
ning
fau
cet.
• In
stal
l ae
rato
rs o
n al
l you
r fa
u-ce
ts;
they
are
inex
pen
sive
an
d ea
sy t
o at
tach
.
Ap
pli
ance
s
7. D
ish
was
her
an
d C
loth
es
Was
her
8. A
ge
of
Ap
plia
nce
s
Dis
hwas
hers
and
clo
thes
w
ashe
rs u
se b
oth
wat
er
and
ener
gy.
• W
ash
fu
ll l
oad
s of
dis
hes
and
clot
hes.
The
mac
hine
s us
e th
e sa
me
amou
nt o
f w
ater
whe
ther
fu
ll or
alm
ost
emp
ty.
• U
se t
he
sho
rtes
t cy
cles
on
clot
hes
was
hers
and
dis
hwas
hers
.
• U
se c
old
wat
er in
clo
thes
was
her
whe
neve
r p
ossi
ble
to s
ave
ener
gy.
• A
ir d
ry d
ishe
s in
the
dis
hwas
her
by o
pen
ing
the
door
slig
htly
aft
er
the
final
rin
se t
o sa
ve e
nerg
y.
• R
epla
ce o
ld a
pp
lian
ces.
Ene
rgy
Star
-rat
ed c
loth
es w
ashe
rs a
nd
dish
was
hers
use
sig
nific
antly
less
w
ater
—up
to
40%
less
—th
an
olde
r m
odel
s. C
heck
with
you
r w
ater
age
ncy
for
reba
tes.
Par
t 1:
WA
TER
C N
SERVA
TION
C N
NECT
ION
WATE
R & EN
ERGY
USE I
N CAL
IFORN
IA

Law
n a
nd
G
ard
en
Wat
erin
g
9. S
pri
nkl
ers
10. W
ater
ing
Tim
e
11. S
easo
nal
W
ater
ing
Law
n an
d ga
rden
wat
er-
ing
alon
g w
ith o
ther
ou
tdoo
r w
ater
use
s ac
coun
t fo
r al
mos
t ha
lf of
all
hom
e w
ater
use
.
• A
dju
st y
ou
r sp
rin
kle
rs
if th
ey d
irect
wat
er o
nto
the
pav
e -m
ent
inst
ead
of o
n th
e la
wn.
• Tr
im a
rou
nd
sp
rin
kle
rhea
ds,
cl
ean
out
any
clog
ged
sprin
kler
s,
and
rep
air
brok
en s
prin
kler
head
s.
• Se
t a
tim
er s
o th
at y
ou d
on’t
for
-ge
t to
tur
n th
e sp
rinkl
ers
off.
• W
ater
ear
ly i
n t
he
mo
rnin
g
whe
n te
mp
erat
ures
are
coo
ler
and
the
air
is s
till.
Avoi
d p
eak
wat
er
and
ener
gy u
se h
ours
of
noon
to
8 p
.m.
• W
ater
on
ly w
hen
nec
essa
ry.
Che
ck b
y st
epp
ing
on t
he g
rass
; if
it sp
rings
bac
k, it
doe
sn’t
nee
d w
ater
.
• W
ater
slo
wly
to
redu
ce r
unof
f an
d to
allo
w t
he w
ater
to
soak
in
deep
ly.
If ne
cess
ary,
wat
er f
or 5
m
inut
es,
turn
the
wat
er o
ff fo
r 10
m
inut
es,
then
wat
er f
or a
noth
er 5
m
inut
es.
• B
uil
d b
asin
s. C
reat
ing
a fu
rrow
of
soi
l aro
und
pla
nts
will
hel
p g
et
the
wat
er t
o th
e ro
ots
and
avoi
d ru
noff.
• U
se m
ulc
h.
Putt
ing
chun
ks o
f ba
rk,
pea
t m
oss,
or
woo
d ch
ips
over
the
soi
l aro
und
tree
s, s
hrub
s,
and
pla
nts
will
red
uce
evap
orat
ion.
• A
dju
st w
ater
ing
sch
edu
les
with
wea
ther
and
sea
sons
. W
ater
le
ss d
urin
g co
ol m
onth
s, s
ome -
times
not
at
all i
n w
inte
r.
• R
epla
ce b
roken
sp
rin
kle
rhea
ds.
• A
erat
e yo
ur
law
n s
o th
at t
he
wat
er s
oaks
in.
Aer
ator
s ar
e us
ually
av
aila
ble
from
eq
uip
men
t re
ntal
ag
enci
es.
• U
se a
ho
se-e
nd
no
zzle
tha
t sh
uts
the
wat
er o
ff as
you
mov
e fr
om p
lant
to
pla
nt.
• In
stal
l au
tom
atic
irr
igat
ion
ti
mer
s. B
e su
re t
o re
set
them
sea
-so
nally
.
• U
pd
ate
you
r ir
rig
atio
n s
ys-
tem
. In
stal
l drip
irrig
atio
n, s
oake
r ho
ses,
or
mor
e ef
ficie
nt s
prin
kler
s w
here
nee
ded.
• X
eris
cap
e. R
epla
ce w
ater
-guz
-zl
ing
pla
nts
with
low
-wat
er u
sers
.
• R
edu
ce w
ater
-gu
zzli
ng
law
ns.
Re
pla
ce t
hem
with
dro
ught
- to
lera
nt g
roun
d co
ver
and
shru
bs.
No
Co
st W
ays
Low
Co
st W
ays
Mo
re C
ost
Way
s
Way
s to
Sav
e
W
ater
& E
nerg
y at
Hom
e
Pa
ge 2
of 5
C N
SERVA
TION
C N
NECT
ION
WATE
R & EN
ERGY
USE I
N CAL
IFORN
IA

Ou
tdo
or
Cle
anin
g
12. C
lean
-up
s
13. C
ar
Was
hin
g
A h
ose
deliv
ers
abou
t 10
ga
llons
a m
inut
e (m
ore
for
bigg
er h
oses
).
• U
se a
bro
om
to
swee
p a
way
dirt
, le
aves
, an
d gr
ass
from
pav
emen
t ar
eas.
Sav
e th
e w
ater
for
was
hing
.
• U
se a
bu
cket
ful
l of
wat
er t
o w
ash
your
car
, tu
rnin
g th
e ho
se o
n on
ly t
o rin
se.
• U
se a
ho
se-e
nd
no
zzle
tha
t sh
uts
the
wat
er o
ff w
hen
you
don’
t ne
ed it
.
Po
ol
14. P
ool o
r Sp
a
An
unco
vere
d po
ol
lose
s fr
om 9
00 t
o 3,
000
gallo
ns o
f w
ater
per
m
onth
, dep
endi
ng o
n si
ze, w
eath
er, a
nd w
ater
te
mpe
ratu
re. A
cov
er
cuts
dow
n on
eva
pora
-tio
n an
d he
at lo
ss—
sav-
ing
wat
er a
nd r
educ
ing
ener
gy c
osts
up
to 9
0 pe
rcen
t.
• Lo
wer
th
e w
ater
tem
per
atu
re.
If yo
ur p
ool i
s he
ated
, yo
u ca
n re
duce
wat
er lo
ss t
hrou
gh e
vap
o -ra
tion
by t
urni
ng d
own
the
ther
-m
osta
t as
war
m w
ater
eva
por
ates
fa
ster
tha
n co
ol w
ater
. Yo
u’ll
save
en
ergy
, to
o.
• U
se a
po
ol
cove
r. B
uy a
n in
su-
late
d co
ver
and
keep
the
poo
l or
spa
cove
red
whe
neve
r it
is n
ot
bein
g us
ed.
Leak
s
15. W
ater
Lea
ks
Even
a s
low
leak
of
on
ly t
wo
tabl
esp
oons
a
min
ute
was
tes
15
gallo
ns a
day
—th
at’s
m
ore
than
5,0
00 g
allo
ns
a ye
ar.
A le
aky
toile
t—on
e th
at k
eep
s ru
nnin
g —
can
was
te s
ever
al
gallo
ns a
min
ute!
• Fi
x th
e le
ak.
A d
ripp
ing
fauc
et
may
nee
d a
new
was
her.
A le
akin
g to
ilet
may
nee
d a
new
fla
pp
er.
A
leak
y p
ipe
may
nee
d so
me
plu
mb -
er’s
tap
e.
• C
all
a p
lum
ber
, if
ne
cess
ary,
if a
fau
cet
is
bro
ken,
a p
ipe
is
corr
oded
, or
a t
oile
t
need
s to
be
rep
lace
d.
No
Co
st W
ays
Low
Co
st W
ays
Mo
re C
ost
Way
s
Way
s to
Sav
e
W
ater
& E
nerg
y at
Hom
e
Pa
ge 3
of 5
C N
SERVA
TION
C N
NECT
ION
WATE
R & EN
ERGY
USE I
N CAL
IFORN
IA
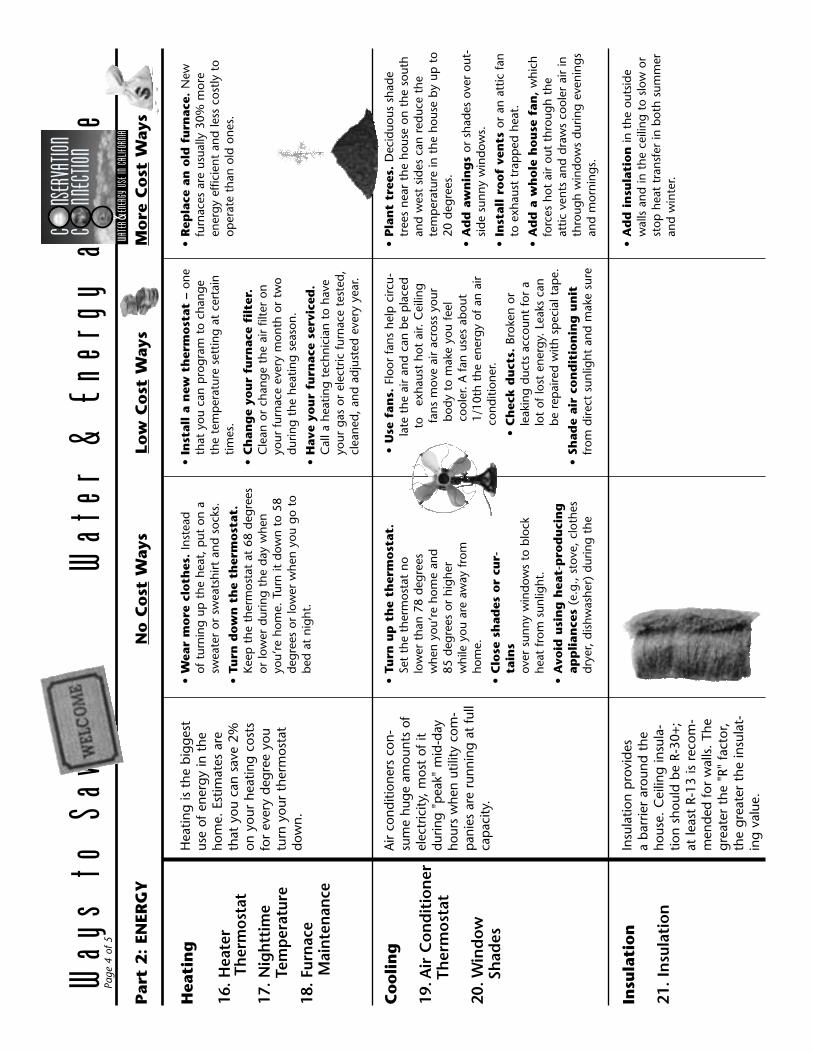
Hea
tin
g
16. H
eate
r
Ther
mos
tat
17. N
ight
tim
e
T
empe
ratu
re
18. F
urna
ce
M
aint
enan
ce
Hea
ting
is t
he b
igge
st
use
of e
nerg
y in
the
ho
me.
Est
imat
es a
re
that
you
can
sav
e 2%
on
you
r he
atin
g co
sts
for
ever
y de
gree
you
tu
rn y
our
ther
mos
tat
dow
n.
• W
ear
mo
re c
loth
es.
Inst
ead
of t
urni
ng u
p t
he h
eat,
put
on
a sw
eate
r or
sw
eats
hirt
and
soc
ks.
• Tu
rn d
ow
n t
he
ther
mo
stat
. Ke
ep t
he t
herm
osta
t at
68
degr
ees
or lo
wer
dur
ing
the
day
whe
n yo
u’re
hom
e. T
urn
it do
wn
to 5
8 de
gree
s or
low
er w
hen
you
go t
o be
d at
nig
ht.
• In
stal
l a
new
th
erm
ost
at –
one
th
at y
ou c
an p
rogr
am t
o ch
ange
th
e te
mp
erat
ure
sett
ing
at c
erta
in
times
.
• C
han
ge
you
r fu
rnac
e fi
lter
. C
lean
or
chan
ge t
he a
ir fil
ter
on
your
fur
nace
eve
ry m
onth
or
two
durin
g th
e he
atin
g se
ason
.
• H
ave
you
r fu
rnac
e se
rvic
ed.
Cal
l a h
eatin
g te
chni
cian
to
have
yo
ur g
as o
r el
ectr
ic f
urna
ce t
este
d,
clea
ned,
and
adj
uste
d ev
ery
year
.
Co
oli
ng
19. A
ir C
ond
itio
ner
T
her
mos
tat
20
. Win
dow
Sh
ades
Air
cond
ition
ers
con-
sum
e hu
ge a
mou
nts
of
elec
tric
ity, m
ost
of it
du
ring
"pea
k" m
id-d
ay
hour
s w
hen
utili
ty c
om-
pani
es a
re r
unni
ng a
t fu
ll ca
paci
ty.
• Tu
rn u
p t
he
ther
mo
stat
. Se
t th
e th
erm
osta
t no
lo
wer
tha
n 78
deg
rees
w
hen
you’
re h
ome
and
85 d
egre
es o
r hi
gher
w
hile
you
are
aw
ay f
rom
ho
me.
• C
lose
sh
ades
or
cur-
tain
s
over
sun
ny w
indo
ws
to b
lock
he
at f
rom
sun
light
.
• A
void
usi
ng
hea
t-p
rod
uci
ng
ap
pli
ance
s (e
.g.,
stov
e, c
loth
es
drye
r, di
shw
ashe
r) d
urin
g th
e
• P
lan
t tr
ees.
Dec
iduo
us s
hade
tr
ees
near
the
hou
se o
n th
e so
uth
and
wes
t si
des
can
redu
ce t
he
tem
per
atur
e in
the
hou
se b
y up
to
20 d
egre
es.
• A
dd
aw
nin
gs
or s
hade
s ov
er o
ut-
side
sun
ny w
indo
ws.
• In
stal
l ro
of
ven
ts o
r an
att
ic f
an
to e
xhau
st t
rap
ped
hea
t.
• A
dd
a w
ho
le h
ou
se f
an,
whi
ch
forc
es h
ot a
ir ou
t th
roug
h th
e at
tic v
ents
and
dra
ws
cool
er a
ir in
th
roug
h w
indo
ws
durin
g ev
enin
gs
and
mor
ning
s.
Insu
lati
on
21. I
nsu
lati
on
Insu
latio
n p
rovi
des
a ba
rrie
r ar
ound
the
ho
use.
Cei
ling
insu
la-
tion
shou
ld b
e R-
30+;
at
leas
t R-
13 is
rec
om-
men
ded
for
wal
ls.
The
grea
ter
the
"R"
fact
or,
the
grea
ter
the
insu
lat-
ing
valu
e.
• A
dd
in
sula
tio
n in
the
out
side
w
alls
and
in t
he c
eilin
g to
slo
w o
r st
op h
eat
tran
sfer
in b
oth
sum
mer
an
d w
inte
r.
• R
epla
ce a
n o
ld f
urn
ace.
New
fu
rnac
es a
re u
sual
ly 3
0% m
ore
ener
gy e
ffici
ent
and
less
cos
tly t
o op
erat
e th
an o
ld o
nes.
• U
se f
ans.
Flo
or f
ans
help
circ
u -la
te t
he a
ir an
d ca
n be
pla
ced
to
exh
aust
hot
air.
Cei
ling
fans
mov
e ai
r ac
ross
you
r bo
dy t
o m
ake
you
feel
co
oler
. A
fan
use
s ab
out
1/10
th t
he e
nerg
y of
an
air
cond
ition
er.
• C
hec
k d
uct
s. B
roke
n or
le
akin
g du
cts
acco
unt
for
a lo
t of
lost
ene
rgy.
Lea
ks c
an
be r
epai
red
with
sp
ecia
l tap
e.
• Sh
ade
air
con
dit
ion
ing
un
it
from
dire
ct s
unlig
ht a
nd m
ake
sure
Par
t 2:
ENER
GY
No
Co
st W
ays
Low
Co
st W
ays
Mo
re C
ost
Way
s
Way
s to
Sav
e
W
ater
& E
nerg
y at
Hom
e
Pa
ge 4
of 5
C N
SERVA
TION
C N
NECT
ION
WATE
R & EN
ERGY
USE I
N CAL
IFORN
IA

Win
do
ws
and
D
oo
rs
22. W
eath
er-
st
rip
pin
g23
. Win
dow
s
a
nd
Doo
rs
Nea
rly h
alf
of a
ll th
e en
ergy
use
d in
our
ho
mes
esc
apes
thr
ough
w
indo
ws
and
door
s,
incl
udin
g th
roug
h cr
acks
and
oth
er le
aks.
• K
eep
win
do
ws
and
do
ors
cl
osed
whe
n yo
u ha
ve e
ither
the
he
ater
or
air
cond
ition
er o
n.
• W
eath
er s
trip
an
d c
aulk
.
Put
wea
ther
str
ipp
ing
arou
nd
win
dow
fra
mes
and
out
side
doo
rs.
Use
cau
lkin
g to
sea
l any
cra
cks,
ho
les,
or
open
ings
aro
und
elec
tric
, p
lum
bing
, an
d lig
htin
g fix
ture
s th
roug
h w
hich
air
can
flow
.
Lig
hts
an
d S
mal
l A
pp
lian
ces
25. L
igh
t B
ulb
s
26. L
igh
ts a
nd
A
pp
lian
ces
27. C
ooki
ng
Turn
ing
off
unus
ed li
ghts
, te
levi
sion
s, s
tere
os,
and
othe
r ap
plia
nces
cou
ld
save
up
to
$200
a y
ear
in e
nerg
y co
sts.
• U
se c
om
pac
t fl
uo
resc
ent
bu
lbs
wh
ere
po
ssib
le.
Thes
e bu
lbs
last
abo
ut 1
0 tim
es lo
nger
th
an in
cand
esce
nt b
ulbs
and
use
ab
out
1/4t
h th
e en
ergy
.
• In
stal
l cl
ock
tim
ers
or
mo
tio
n
sen
sors
to
turn
ligh
ts o
ff au
to-
mat
ical
ly.
• U
se a
mic
row
ave
or
a sm
all
elec
tric
ove
n f
or s
mal
l am
ount
s.
They
gen
eral
ly u
se le
ss e
nerg
y.
Wat
er H
eate
r24
. Wat
er
Hea
ter
Tem
per
atur
e
The
wat
er h
eate
r is
the
se
cond
larg
est
ener
gy
user
in t
he h
ome.
• Tu
rn d
ow
n t
he
tem
per
a-tu
re.
Set
the
tem
per
atur
e at
130
de
gree
s or
less
, or
at
the
"con
ser -
vatio
n" o
r "m
ediu
m"
sett
ing.
• W
rap
in
sula
tio
n a
roun
d w
ater
he
ater
(es
pec
ially
an
old
one)
and
ar
ound
the
wat
er p
ipes
lead
ing
from
the
hea
ter.
• Tu
rn it
off
. Don
’t lig
ht a
n em
pty
room
or
ente
rtai
n it
with
mus
ic. U
se
natu
ral l
ight
whe
n po
ssib
le. U
se c
lock
tim
ers
to s
hut
off T
Vs a
nd s
tere
os
auto
mat
ical
ly. U
nplu
g ch
argi
ng u
nits
.
• C
han
ge
to t
he
low
est-
wat
tag
e b
ulb
s th
at y
ou n
eed
whe
n re
plac
ing
bulb
s.
• C
lean
bul
bs
and
fix
ture
s. D
ust
your
ligh
t bu
lbs
now
and
the
n as
cl
ean
bulb
s us
e le
ss e
nerg
y.
Maj
or
Ap
pli
ance
s
28. R
efri
ger
ator
29. C
loth
es D
ryer
30. A
ge
of
Ap
plia
nce
s
Refr
iger
ator
s, w
hich
run
al
l day
eve
ry d
ay o
f th
e ye
ar, c
an u
se a
bout
25%
of
you
r el
ectr
icity
.
• O
pen
an
d c
lose
th
e re
frig
erat
or
doo
r q
uick
ly a
nd r
educ
e th
e nu
m-
ber
of t
imes
you
ope
n it.
• C
lean
th
e co
ils o
f yo
ur r
efri
ger
a -to
r an
d be
sur
e th
ere’
s ro
om fo
r ai
r to
circ
ulat
e ar
ound
the
app
lianc
e.
• D
ry f
ull l
oad
s of
laun
dry.
• Se
t d
ryer
to
auto
-dry
rat
her
than
a
timed
cyc
le.
• R
epla
ce o
ld a
pp
lian
ces
with
lo
w e
nerg
y-us
e ap
plia
nces
. Lo
ok
for
Ener
gy-S
tar-
rate
d ap
plia
nces
. Si
nce
1980
, ap
plia
nces
hav
e im
pro
ved
in e
nerg
y ef
ficie
ncy
by
30 t
o 90
%.
Che
ck w
ith y
our
utili
ty
com
pan
y fo
r re
bate
s.
No
Co
st W
ays
Low
Co
st W
ays
Mo
re C
ost
Way
s
Tran
po
rtat
ion
31. C
arp
ool o
r
Pub
licTr
ans-
por
tati
on
In C
alifo
rnia
, clo
se t
o 40
% o
f th
e en
ergy
we
use
is f
or t
rans
port
atio
n.
• C
arp
oo
l w
hene
ver
pos
sibl
e.
• W
alk o
r b
icyc
le w
hen
it is
saf
e an
d p
ossi
ble.
• Ta
ke
pu
bli
c tr
ansp
ort
atio
n.
• K
eep
yo
ur
car’
s en
gin
e tu
ned
an
d th
e tir
es p
rop
erly
infla
ted.
• B
uy
a ca
r th
at g
ets
hig
h g
as
mil
eag
e, s
uch
as a
hyb
rid t
hat
uses
an
elec
tric
mot
or a
long
with
th
e ga
solin
e en
gine
.
Way
s to
Sav
e
W
ater
& E
nerg
y at
Hom
e
Pa
ge 5
of 5
C N
SERVA
TION
C N
NECT
ION
WATE
R & EN
ERGY
USE I
N CAL
IFORN
IA

S c h o o l W a t e r & E n e r g y S u r v e y
PART 1: WATER Indoors
1. Leaks. Do any indoor drinking fountains, faucets, pipes, or showerheads leak? Check in the class-rooms, hallways, restrooms, gyms, and cafeteria.
a. no
b. yes
2. Faucets. Are any faucets, drinking fountains, or showers left running when they are not being used?
a. no
b. yes
3. Drinking Fountains.
Do students fill reusable cups or water bottles from drinking fountains or from faucets instead of letting the water run while they drink?
` a. yes, most students do
b. no, most do not
4. Aerators. Do most faucets have aerators?
(Not sure? See page 2.)
a. yes
b. no
5. Toilets. What type of toilets are installed in your school? (Look under the tank lid or just behind the seat, or ask the school maintenance supervisor.)
a. ultra-low flush or low flush
b. regular
c. don’t know
Is your school efficient or extravagant in its use of water and energy? Complete this survey to find out. For some questions, you may need to talk with the school maintenance supervisor. Circle the answer that is most true for your school.
6. Showerheads. Do the showers in the locker rooms have low-flow showerheads? (Not sure? See page 2.)
a. yes
b. no
c. don’t have showers 7. Dishwasher. Is the automatic dishwasher run
only when it’s full?
a. yes
b.no
c. don’t have a dishwasher
Outdoors
(Note: If your school’s sprinklers are set to go on in the middle of the night, try to get permission to have them turned on briefly during the day so you can observe them.)
8. Leaks. Are there any leaks in hoses, pipes, sprinklers, faucets, or drinking fountains outdoors?
a. no
b. yes
9. Clean-ups. Is water from a hose used to clean
walkways or paved areas?
a. no
b. yes
Name:__________________________________________ Date:________________________________
Page 1 of 4
C NSERVATION C NNECTION
WATER & ENERGY USE IN CALIFORNIA

10. Pool Cover. Is a cover placed over the swim-ming pool at night and at other times when the pool is not being used?
a. yes
b. no
c. don’t have a pool
11. Overspray. Are there any areas
where the sprinklers spray more onto the pavement than onto the lawn?
a. no
b. yes
c. don’t use sprinklers
12. Sprinkler Condition. Are any of the sprinklers not working properly; for example, is water gushing out, trickling out, spraying poorly or unevenly, or spraying in the wrong direction?
a. no
b. yes
c. don’t use sprinklers
13. Seasonal Changes. Are sprinklers set to
water less during cooler months and more during warmer months?
a. yes
b. no
c. don’t have automatic sprinklers
14. Rain Shutoff. Does the sprinkler system have an automatic rain shutoff device that prevents the sprinklers from coming on during rainy weather or, if not, are sprinklers usually shut off manually in wet weather?
a. yes
b. no
c. don’t have automatic sprinklers
15. Runoff. Does water run off the lawn either onto paved areas or down drains or gutters when the lawn is watered?
a. not very much
b. quite a lot
c. don’t use sprinklers
16. Watering Amount. For approximately how many minutes are most of the sprinklers set to run each time they go on?
a. 1 to 10 minutes
b. 11 to 20 minutes
c. 21 to 30 minutes
d. more than 30 minutes
e. don’t have automatic sprinkler system
Helpful Tips for Water Survey
Showerheads Here’s how to find out if you have
low-flow showerheads. First get permission to do this test; then:
1. Get a bucket, a watch with a second hand, and a measuring cup.
2. Hold the bucket under the showerhead and have someone turn on the water at full pressure.
3. Let the water run into the bucket for 15 seconds. 4. Measure how much water is in the bucket and multiply
the number of cups in the bucket by 4 (to figure how many cups per minute).
5. Convert the number of cups to gallons (16 cups in a gallon) to determine how many gallons per minute.If the amount is 2.5 gallons or less, the showerhead is a low-flow unit.
What’s an Aerator? Aerators mix air with water. If your faucets have little devic-es attached where the water comes out—devices with a little screen that makes the water bubbly—then they have aerators.
Page 2 of 4
S c h o o l W a t e r & E n e r g y S u r v e yC NSERVATION C NNECTION
WATER & ENERGY USE IN CALIFORNIA

PART 2: ENERGY Heating and Cooling
17. Heating System. How old is your school’s heating system?
a. less than 10 years old
b. more than 10 years old
c. not sure
18. Heater Thermostat. At
what temperature is the heat set when school is in session?
a. 68 degrees or lower
b. 69 degrees or higher
c. no thermostat
19. Air Conditioner Thermostat.
At what temperature are air conditioning thermostats set when school is in session?
a. 78 degrees or higher
b. 77 degrees or lower
c. don’t have an air conditioner or thermostat
20. Nighttime/Weekend Temperature. Is the heating/cooling system turned off or down at night and on weekends when the school is empty?
a. yes
b. no
c. don’t have a heating/cooling system
21. Empty Rooms. Is the heating/ cooling system turned off in rooms that are not being used for a day or more?
a. yes
b. no
c. don’t have a heating/cooling system
S c h o o l W a t e r & E n e r g y 22. Closing Windows and Doors. Are windows
and outside doors kept closed when the heat or cooling is on?
a. yes, most of the time
b. no, sometimes accidentally left open or opened on purpose when the heat is too hot or the cooling too cold
c. don’t have a heating/cooling system
23. Air Leaks. Does air leak in or out of windows and doors when they are closed? (Not sure? See page 4 for the “draftometer” test.)
a. no
b. yes
24. Blocked Vents. Are heating or air conditioning vents blocked by furniture or other obstructions, such as stacks of books, equipment, drapes, etc.?
a. no
b. yes
c. don’t have vents
25. Shade Trees. Do trees shade the east and west sides of school buildings?
a. yes
b. no
Lights and Appliances
26. Lighting Unused Rooms. Do rooms that are not being used have the lights off?
a. yes, most of the time
b. no, lights often left on
Page 3 of 4
C NSERVATION C NNECTION
WATER & ENERGY USE IN CALIFORNIA

27. Too Much Lighting. Are rooms or areas in the school receiving more light than is needed? (To find out how to check, see below.)
a. no
b. yes
28. Turning Things Off. Are lights and electrical equipment (e.g., com- puters, TVs, radios) turned off consistently when they’re not needed for more than an hour?
a. yes
b. no
29. Fluorescent Lights. Is your school lit mostly by fluorescent or by incandescent light? (Not sure? See below.)
a. most lights are fluorescent
b. most lights are incandescent
30. Keeping Clean. Are light fixtures,
skylights, and windows clean or dirty?
a. most are clean
b. most are dirty
Cafeteria
31. Ovens. Are the ovens turned off when nothing is cooking?
a. yes
b. no
c. don’t have ovens
32. Exhaust Fans. Are exhaust fans (usually found above the stove or in the ceiling) run only when food is cooking?
a. yes
b. no
c. don’t have exhaust fans
33. Refrigerator Coils. Are the refrigerator coils clean or dirty? (Coils are usually located on the back of the refrigerator.)
a. clean
b. dirty or dusty
c. don’t have refrigerators
34. Equipment Placement. Are stoves or other heat-producing equipment located next to refrigerators or
other cooling equipment?
a. no
b. yes
c. don’t have stoves and/or refrigerators
Helpful Tips for Energy Survey
Draftometer Test To check windows and doors for leaks, conduct
the following “draftometer” test.1. Cut a piece of thin, plastic food-wrap about 5 inches
wide and 10 inches long.2. Tape the short edge of the plastic along the edge of a
pencil.3. Hold the draftometer near the edges of doors and win-
dows. If the plastic moves, then air is leaking in or out.
Too Much Light?Try this to find out:1. If a room is lit by several light fixtures, try leaving vari-
ous switches off.2. If that leaves entire areas too dark, talk to the mainte-
nance staff about removing a fluorescent tube here and there to see if all the tubes are needed for enough light. (Be sure not to leave any sockets for incandescent bulbs empty, which poses a danger for shock.)
What’s Fluorescent and What’s Incandescent? Fluorescent lights are usually either tubes or oddly shaped bulbs, both of which stay cool when they’re on.
Incandescent lights are usually round bulbs that get very hot when they’re on.
Page 4 of 4
S c h o o l W a t e r & E n e r g y S u r v e yC NSERVATION C NNECTION
WATER & ENERGY USE IN CALIFORNIA

Way
s to
Sav
e
W
ater
& E
nerg
y at
Sch
ool
Page
1 o
f 5
Leak
s
1. L
eaks
(
ind
oors
)
8. L
eaks
(
outd
oors
)
A s
low
leak
of
only
tw
o ta
ble-
spoo
ns a
min
ute
was
tes
15
gallo
ns a
day
—th
at’s
mor
e th
an
5,00
0 ga
llons
a y
ear!
No
Co
st W
ays
• Fi
x th
e le
aks.
Low
Co
st W
ays
Mo
re C
ost
Way
s
Ru
nn
ing
Wat
er
2. F
auce
ts
3. D
rin
kin
g
Fou
nta
ins
4. A
erat
ors
Abo
ut a
gal
lon
of w
ater
a m
in-
ute
flow
s ou
t of
a r
unni
ng f
au-
cet.
..and
dow
n th
e dr
ain.
• Tu
rn t
he
wat
er o
ff if
you
se
e a
fauc
et,
drin
king
fou
ntai
n,
or s
how
er le
ft r
unni
ng w
hen
no o
ne is
usi
ng it
.
• In
stal
l ae
rato
rs o
n al
l you
r fa
ucet
s; t
hey
are
inex
pen
sive
an
d ea
sy t
o at
tach
.
Toil
ets
5. T
oile
t Ty
pe
A r
egul
ar t
oile
t flu
shes
aw
ay 5
to
7 ga
llons
of
wat
er—
a lo
t m
ore
than
is n
eede
d. L
ow-f
lush
toi
lets
us
e on
ly 3
.5 g
allo
ns,
and
ultr
a-lo
w f
lush
use
onl
y 1.
6 ga
llons
to
do t
he s
ame
job.
• In
stal
l n
ew t
oil
ets.
Che
ck
with
you
r w
ater
age
ncy
for
pro
-gr
ams
to h
elp
you
r sc
hool
get
ne
w u
ltra-
low
flu
sh t
oile
ts.
Sho
wer
s
6. S
how
erh
ead
s
Low
-flo
w s
how
erhe
ads
can
use
up t
o 75
% le
ss w
ater
tha
n re
gula
r on
es—
and
still
pro
vide
a
good
sho
wer
. U
sing
less
hot
w
ater
mea
ns u
sing
less
ene
rgy
as w
ell.
• In
stal
l n
ew s
ho
wer
hea
ds.
Th
e w
ater
and
ene
rgy
savi
ngs
coul
d p
ay b
ack
the
cost
of
the
show
erhe
ads
in a
s lit
tle a
s tw
o m
onth
s.
Par
t 1:
WA
TER
Dis
hw
ash
er
7. D
ish
was
her
The
dish
was
her
uses
15
or m
ore
gallo
ns o
f w
ater
eac
h tim
e it
runs
—em
pty
or
full.
• B
e su
re i
t’s
full
bef
ore
runn
ing
the
dish
was
her
(or
a cl
othe
s w
ashe
r).
Cle
anin
g
9. C
lean
-up
s
A h
ose
deliv
ers
abou
t 10
gal
lons
of
wat
er a
min
ute
(mor
e fo
r
bigg
er h
oses
).
• U
se a
bro
om
to
swee
p a
way
di
rt,
leav
es,
and
gras
s.
C N
SERVA
TION
C N
NECT
ION
WATE
R & EN
ERGY
USE I
N CAL
IFORN
IA

Po
ols
10. P
ool C
over
An
unco
vere
d p
ool l
oses
fro
m
900
to 3
,000
gal
lons
of
wat
er
per
mon
th,
dep
endi
ng o
n si
ze,
wea
ther
, an
d w
ater
tem
-p
erat
ure.
A c
over
cut
s do
wn
on
evap
orat
ion
and
heat
loss
—
savi
ng w
ater
and
red
ucin
g en
ergy
cos
ts u
p t
o 90
per
cent
.
• A
dju
st s
pri
nkle
rs s
o th
at
they
sp
ray
onto
the
law
n.
• C
lean
ou
t cl
ogge
d di
rt a
nd
gras
s fr
om s
prin
kler
head
s.
• Fi
x o
r re
pla
ce b
roken
or
mis
sin
g s
pri
nkle
rhea
ds.
• C
ove
r th
e p
oo
l at
ni
ght
and
whe
n it
is n
ot b
eing
us
ed.
• X
eris
cap
e. R
epla
ce w
ater
- gu
zzlin
g p
lant
s an
d la
wns
with
lo
w-w
ater
use
rs.
Spri
nkle
rs
11. O
vers
pra
y
12. S
pri
nkl
er
Con
dit
ion
A li
ttle
ove
rsp
ray
can’
t be
he
lped
, bu
t yo
u do
n’t
wan
t m
ore
pav
emen
t th
an la
wn
bein
g w
ater
ed!
• C
han
ge
tim
es w
ith
th
e se
aso
ns,
pro
gram
min
g th
e w
ater
sys
tem
to
mat
ch t
he
seas
ons
and
the
wea
ther
.
• In
stal
l a
rain
sh
uto
ff
dev
ice,
whi
ch a
utom
atic
ally
sh
uts
off
the
sprin
klin
g sy
stem
w
hen
rain
wat
er f
ills
a co
llect
-in
g p
an.
Seas
on
al
Wat
erin
g
13. S
easo
nal
C
han
ges
14. R
ain
S
hut
off
Law
ns g
ener
ally
do
not
need
as
muc
h w
ater
in t
he f
all,
win
ter,
and
sprin
g as
the
y do
in t
he
hot
sum
mer
mon
ths.
And
the
y m
ay n
eed
little
wat
er d
urin
g th
e ra
iny
seas
on.
• A
erat
e th
e la
wn
(p
oke
hole
s in
to it
) if
the
soil
is v
ery
hard
and
com
pac
ted.
• R
edu
ce t
he
tim
e th
e la
wn
is b
eing
wat
ered
.
• W
ater
mo
re f
req
uen
tly
for
sho
rter
per
iod
s, e
spe -
cial
ly if
the
law
n is
slo
ped
or
if th
e so
il co
ntai
ns c
lay.
Ru
no
ff
15. R
unof
f
If w
ater
is r
unni
ng o
ff th
e la
wn,
it
may
mea
n:1.
The
soi
l is
not
abso
rbin
g th
e w
ater
.2.
The
sp
rinkl
ers
are
stay
ing
on
too
long
.
• D
o t
he
spri
nkle
r te
st
(exp
lain
ed o
n th
e ne
xt p
age)
to
det
erm
ine
how
oft
en a
nd
how
long
to
wat
er;
then
ad
just
you
r sp
rinkl
ing
times
.
Law
n W
ater
ing
16. W
ater
ing
A
mou
nt
Man
y la
wns
are
wat
ered
mor
e of
ten
than
the
y ne
ed t
o be
, or
th
ey m
ight
be
wat
ered
for
too
m
any
min
utes
at
a tim
e.
No
Co
st W
ays
Low
Co
st W
ays
Mo
re C
ost
Way
s
Way
s to
Sav
e
W
ater
& E
nerg
y at
Sch
ool
Pa
ge 2
of 5
C N
SERVA
TION
C N
NECT
ION
WATE
R & EN
ERGY
USE I
N CAL
IFORN
IA

Spri
nkle
r Te
st
Tota
l for
8 c
ans
=
31/4
inch
es (
3.25
)
3.25
÷
8
=
.406
inch
/can
.406
x
4
= 1
.624 (
15 /8 i
nch
es)
per
ho
ur
1.
Plac
e 5
to 1
0 st
raig
ht-s
ided
ca
ns o
f th
e sa
me
typ
e (s
uch
as t
una
cans
or
cat
food
ca
ns)
even
ly a
roun
d th
e
law
n an
d m
ark
thei
r
loca
tion
on a
map
or
grid
➔
of t
he la
wn.
2.
Run
the
sprin
kler
s fo
r 15
m
inut
es.
3.
Mea
sure
the
dep
th o
f w
ater
in
eac
h ca
n w
ith a
rul
er
and
indi
cate
on
the
grid
th
e am
ount
in e
ach
can.
4.
Det
erm
ine
the
aver
age
amou
nt b
y ad
ding
up
all
the
inch
es o
f w
ater
and
div
idin
g by
the
num
ber
of c
ans.
5.
Mul
tiply
the
ave
rage
dep
th
by 4
to
dete
rmin
e ho
w
man
y in
ches
of
wat
er y
our
sprin
kler
sys
tem
ap
plie
s p
er
hour
.
Exam
ple
Firs
t...
No
te a
ny
big
dif
fere
nce
s in
th
e am
oun
t o
f w
ater
in t
he
can
s.If,
for
exa
mp
le,
one
can
has
5 /8
inch
of
wat
er
and
anot
her
has
only
1 /4
inch
, it
mea
ns t
hat
the
sprin
kler
s ar
e no
t w
ater
ing
unifo
rmly
. Lo
ok f
or
pro
blem
s in
the
sp
rinkl
erhe
ads,
suc
h as
clo
gs o
r br
eaks
. If
par
t of
the
law
n is
n’t
rece
ivin
g en
ough
w
ater
, br
own
spot
s ca
n oc
cur;
if p
art
of t
he
law
n is
rec
eivi
ng t
oo m
uch
wat
er,
runo
ff ca
n oc
cur.
Seco
nd
... D
eter
min
e h
ow
man
y m
inut
es y
ou
nee
d t
o w
ater
yo
ur la
wn
eac
h w
eek.
Che
ck t
he L
awn
Wat
erin
g G
uide
for
Cal
iforn
ia,
A
NR
Publ
icat
ion
8044
, on
the
AN
R C
omm
unic
atio
n Se
rvic
es w
ebsi
te a
t
http
://a
nrca
talo
g.uc
davi
s.ed
u. T
he t
otal
nu
mbe
r of
min
utes
tha
t yo
ur la
wn
shou
ld b
e w
ater
ed e
ach
wee
k w
ill d
epen
d on
:
• ho
w m
uch
your
sp
rinkl
er o
utp
ut is
p
er h
our
(wha
t yo
u ca
lcul
ated
fro
m
the
Sprin
kler
Tes
t)
•
whe
re y
ou li
ve in
Cal
iforn
ia
• w
hat
mon
th it
is
• w
hat
kind
of
gras
s yo
u ha
ve.
Thir
d...
Ad
just
fo
r yo
ur la
wn
.D
eep
er,
less
fre
que
nt w
ater
ing
(s
omet
imes
onl
y on
ce a
wee
k)
is b
est
for
mos
t la
wns
to
pro
mot
e
deep
roo
t gr
owth
. Bu
t a
slop
ed
law
n, h
ard
or s
hallo
w s
oil,
a ho
t
clim
ate,
cer
tain
gra
sses
, or
oth
er
fact
ors
may
req
uire
tha
t th
e to
tal
num
ber
of w
ater
ing
min
utes
be
sp
read
thr
ough
out
the
wee
k.
An
alyz
e Yo
ur
Res
ult
s
Can
#1
____
inch
Can
#3
____
inch
Can
#2
____
inch
Can
#8
____
inch
Can
#7
____
inch
Can
#6
____
inch
Can
#4
____
inch
Can
#5
____
inch
1 /2
5 /8
1 /4
1 /4
1 /4
1 /2
1 /2
5 /8
Way
s to
Sav
e
W
ater
& E
nerg
y at
Sch
ool
Pa
ge 3
of 5
C N
SERVA
TION
C N
NECT
ION
WATE
R & EN
ERGY
USE I
N CAL
IFORN
IA

Ag
e
17. H
eati
ng
Syst
em
Mos
t ne
w h
eatin
g sy
stem
s ar
e ab
out
30%
mor
e ef
ficie
nt t
han
old
ones
, w
hich
mea
ns t
hey
are
bett
er f
or t
he e
nviro
nmen
t an
d m
uch
less
cos
tly t
o op
erat
e.
• A
dju
st t
he
ther
mos
tats
to
68
deg
rees
or
low
er fo
r he
at a
nd
78 d
egre
es o
r hi
gher
for
air
co
nditi
onin
g.
• Tu
rn s
yste
m o
ff a
t ni
ght
and
on
wee
kend
s or
at
leas
t se
t th
erm
o -st
ats
very
low
for
heat
and
ver
y hi
gh fo
r ai
r co
nditi
onin
g.
• C
lose
ven
ts o
r tu
rn o
ff th
erm
o-st
ats
in r
oom
s th
at a
re n
ot b
eing
us
ed—
even
if o
nly
for
a da
y.
• A
dju
st w
ind
ows
and
win
dow
co
veri
ng
s. In
stea
d of
usin
g th
e AC
, ope
n w
indo
ws,
whe
n po
s -sib
le, t
o le
t in
coo
l air;
clo
se w
in-
dow
cov
erin
gs t
o ke
ep o
ut h
ot
suns
hine
.
• M
onit
or t
he
syst
em t
o m
ake
sure
no
room
s ar
e to
o ho
t or
too
co
ol.
• In
stal
l a
new
hea
tin
g
syst
em.
Th
erm
ost
ats
18. H
eate
r
19. A
ir
Con
dit
ion
er
20. N
igh
ttim
e/
Wee
ken
d
21. E
mp
ty R
oom
s
Both
hea
ting
and
air
cond
i-tio
ning
con
sum
e en
orm
ous
amou
nts
of e
nerg
y, m
ost
of
it du
ring
pea
k m
id-d
ay h
ours
w
hen
utili
ty c
omp
anie
s ar
e ru
n-ni
ng a
t fu
ll ca
pac
ity.
• C
lose
win
do
ws
and
do
ors
w
hen
the
heat
or
air
cond
ition
-in
g is
on.
• C
aulk
aro
und
hole
s an
d cr
acks
whe
re a
ir is
le
akin
g in
or
out,
and
w
eath
er s
trip
aro
und
win
dow
fra
mes
and
ou
tsid
e do
ors.
Win
dow
s &
Doo
rs
22. C
losi
ng
Win
dow
s &
Doo
rs
23. A
ir L
eaks
A h
eatin
g or
coo
ling
syst
em
isn’
t ve
ry e
ffici
ent
if th
e w
arm
or
coo
l air
is ju
st a
llow
ed t
o es
cap
e th
roug
h op
en w
indo
ws
or d
oors
.
• R
emo
ve a
ny
ob
stru
ctio
ns
so t
hat
ther
e is
cle
ar s
pac
e in
fr
ont
of v
ents
.
Ven
ts
24. B
lock
ed V
ents
If an
ythi
ng is
kee
pin
g th
e ai
r fr
om c
omin
g ou
t of
the
ven
ts,
the
heat
er o
r ai
r co
nditi
oner
is
not
wor
king
effi
cien
tly.
Par
t 2:
ENER
GY
No
Co
st W
ays
Low
Co
st W
ays
Mo
re C
ost
Way
s
Way
s to
Sav
e
W
ater
& E
nerg
y at
Sch
ool
Pa
ge 4
of 5
C N
SERVA
TION
C N
NECT
ION
WATE
R & EN
ERGY
USE I
N CAL
IFORN
IA

Tree
s
25. S
had
e Tr
ees
Gen
eral
ly,
durin
g w
arm
m
onth
s, m
orni
ng s
un s
hine
s on
th
e ea
st s
ide
of b
uild
ings
and
af
tern
oon
sun
beat
s do
wn
on
the
wes
t si
de.
Plan
ting
shad
e tr
ees
can
sign
ifica
ntly
coo
l the
in
side
of
build
ings
.
• Tu
rn o
ff s
wit
ches
, w
here
pos
-sib
le, i
n ro
oms
that
hav
e m
ultip
le
switc
hes.
• R
emov
e so
me
bul
bs
(flu
ores
-ce
nts)
to
redu
ce e
xces
s lig
htin
g or
le
ave
in s
ome
burn
ed o
ut in
can-
desc
ent
bulb
s.•
Turn
th
ing
s of
f, e
spec
ially
lig
hts,
whe
n yo
u’re
the
last
per
son
leav
ing
a ro
om. T
urn
off a
pplia
nc-
es w
hen
no o
ne is
usin
g th
em.
• D
on’t
pre
-hea
t th
e ov
en a
nd
be s
ure
it is
turn
ed o
ff as
soo
n as
th
e fo
od c
omes
out
.•
Turn
exh
aust
fan
s of
f w
hen
noth
ing
is co
okin
g.
• P
lan
t sh
ade
tree
s on
th
e ea
st a
nd w
est
side
s
to s
hade
win
dow
s—es
pec
ially
if
you
live
in a
war
m c
limat
e.
Un
nec
essa
ry U
se
26. L
igh
tin
g
U
nus
ed
Roo
ms
27. T
oo M
uch
Lig
hti
ng
28. T
urn
ing
Th
ing
s O
ff
31. O
ven
s
32. E
xhau
st F
ans
Just
leav
ing
light
s on
in e
mp
ty
room
s ca
n w
aste
tho
usan
ds o
f do
llars
eac
h ye
ar.
• C
lean
lig
ht
fixt
ure
s,
skyl
igh
ts,
and
win
do
ws.
M
ore
natu
ral l
ight
will
com
e
in t
hrou
gh c
lean
win
dow
s an
d le
ss e
nerg
y w
ill b
e us
ed b
y cl
ean
light
bul
bs.
• U
se c
omp
act
fluo
resc
ent
bul
bs
whe
re p
ossib
le, p
artic
u-la
rly in
are
as w
here
the
ligh
ts a
re
left
on
for
a lo
ng t
ime.
Com
pact
flu
ores
cent
bul
bs c
ost
mor
e to
pu
rcha
se, b
ut t
hey
last
10
times
lo
nger
and
use
muc
h le
ss e
lect
ric-
ity, s
o th
ey s
ave
ener
gy c
osts
ove
r th
eir
lifet
ime.
Lig
ht
Bul
bs
29.
Fluo
resc
ent
Ligh
ts
30.
Kee
ping
Cle
an
Fluo
resc
ent
light
s us
e ab
out
1 /4
the
ener
gy o
f in
cand
esce
nt
light
ing.
• C
lean
th
e re
frig
erat
or
coil
s re
gu
larl
y.
• R
earr
ang
e eq
uip
men
t so
th
at h
eat-
pro
duci
ng a
pp
li -an
ces
are
not
next
to
thos
e ke
epin
g th
ings
coo
l.
Ref
rig
erat
ors
33. R
efri
gera
tor
Coi
ls
34. E
quip
men
t
Pl
acem
ent
Coi
ls re
mov
e he
at fr
om t
he in
side
of t
he r
efrig
erat
or. I
f the
y ar
e di
rty,
the
y w
on’t
wor
k ef
ficie
ntly
an
d th
e re
frig
erat
or w
ill h
ave
to
stay
on
long
er. A
nd if
the
ref
rig-
erat
or is
nex
t to
a s
tove
, it
has
to
wor
k ev
en h
arde
r an
d ru
n lo
nger
to
kee
p co
ol.
• In
stal
l m
oti
on
sen
sors
, w
hich
aut
omat
ical
ly t
urn
light
s of
f w
hen
no m
otio
n is
det
ecte
d in
a r
oom
, an
d th
en b
ack
on
whe
n so
meo
ne e
nter
s th
e ro
om.
No
Co
st W
ays
Low
Co
st W
ays
Mo
re C
ost
Way
s
Way
s to
Sav
e
W
ater
& E
nerg
y at
Sch
ool
Pa
ge 5
of 5
C N
SERVA
TION
C N
NECT
ION
WATE
R & EN
ERGY
USE I
N CAL
IFORN
IA

57
CORRE LA T I ONS T O CA L I F ORN I A S TA T E CONT EN T S TAN -C NSERVATION C NNECTION
WATER & ENERGY USE IN CALIFORNIA
Science Language Arts Math
Grade 6 Lesson 1 4a, 6b R 1.1, 2.3
2 7f R 1.1, 2.3 LS 1.4, 1.5, 1.7, 2.2a
3 R 1.1, 2.3 NS 2.3 S 2.1, 3.2 MR 2.5, 3.1
4 3d, 4a, 4b, R 1.1, 2.3 6a, 6b, 6c, 7c W 1.2a, 1.2b LS 1.4, 1.5, 1.6, 1.7, 2.2a,b
5 R 1.1, 2.3 A 2.1, 2.2 S 2.1, 3.2 MR 2.5
6 3a, 3b, 3d, 7d MR 1.1, 2.5
7 3a, 3b, 3d, 7d W 2.5a,b,c MR 1.1 LS 1.4, 1.5, 1.6, 1.7, 2.4a,b,c,d, 2.5a,b
Grade 7 Lesson 1 LS 2.2a,b,c
2 LS 1.4, 1.5, 1.6, 2.2a,b,c NS 1.3
3 NS 1.3, 1.6 A 1.1 MG 1.3 MR 2.6, 2.8
4 4e R 1.2 NS 1.3 W 2.3a,b, 2.5a,b,c A 1.5 LS 1.1, 1.4, 1.5, 1.6 2.2a,b,c, 2.3a,b
5 LS 2.2a,b,c MG 1.1, 1.3 MR 2.6, 2.8
6 MR 1.1, 2.6, 2.8
7 LS 1.4, 1.5, 1.6, 2.4a,b MR 1.1
Grade 8 Lesson 3 A 5.0, PS 1.0
4 6a, 7e W 2.3a,b,c,d, 2.4c
5 3b, 5a A 5.0, PS 1.0
6 R 2.1 A 5.0
7 LS 1.3, 1.6, 2.4a,b,c,d

58
Following are a few sites to explore for more information and other links concerning water and energy supply, demand, and conservation.
Alliance to Save Energy www.ase.org
California Department of Water Resources www.dwr.water.ca.gov
California Energy Commission www.energy.ca.gov www.consumerenergycenter.org
California Urban Water Conservation Council www.cuwcc.org
Energy Information Administration www.eia.doe.gov
Flex Your Power www.fypower.com
Renewable Energy Policy Project www.solstice.crest.org
Rocky Mountain Institute www.rmi.org
U.S. Bureau of Reclamation www.waterwiser.org www.watershare.usbr.gov
U.S. Environmental Protection Agency www.energystar.gov
Water Education Foundation www.watereducation.org
RESOURCESC NSERVATION C NNECTION
WATER & ENERGY USE IN CALIFORNIA