c3188 strat - prager & co., llc
TRANSCRIPT

STRATEGIC FINANCIAL ANALYSIS
FOR HIGHER EDUCATION
SIXTH EDITION
1.5" Logo
1" Logo�

STRATEGIC FINANCIAL ANALYSIS FOR HIGHER EDUCATION
SIXTH EDITION

©1982 by Peat, Marwick, Mitchell & Co.
©1995 by KPMG Peat Marwick LLP and Prager, McCarthy & Sealy
©1999 by KPMG LLP and Prager, McCarthy & Sealy, LLC
©2002 KPMG LLP, the U.S. member firm of KPMG International, a Swiss nonoperating association.
©2005 by Prager, Sealy, & Co., LLC; KPMG LLP, the U.S. member firm of KPMG International, a Swiss cooperative; and BearingPoint Inc.
All rights reserved. KPMG and the KPMG logo are registered trademarks of KPMG International. Sixth Edition
PLEASE NOTE: The tables of contents throughout this document are interactive;
click on any chapter, section, example, figure or table to go directly to that page.
iii
CONTENTS
TABLE OF CONTENTS
INTRODUCTION AND ACKNOWLEDGMENTS viii
CHAPTER ONE: FRAMEWORK FOR STRATEGIC FINANCIAL ANALYSIS 1
INTRODUCTION 1
PRINCIPLES OF STRATEGIC FINANCIAL ANALYSIS 2
WHAT IS THE INSTITUTIONAL MISSION? 2
HOW DOES MISSION TRANSLATE INTO STRATEGY? 4
WHAT IS THE OVERALL MEASUREMENT OF FINANCIAL HEALTH? 4
ARE RESOURCES SUFFICIENT AND FLEXIBLE ENOUGH TO SUPPORT THE MISSION? 5
ARE FINANCIAL RESOURCES, INCLUDING DEBT, MANAGED STRATEGICALLY TOADVANCE THE MISSION? 5
DOES ASSET PERFORMANCE AND MANAGEMENT SUPPORT THE STRATEGIC DIRECTION? 6
DO OPERATING RESULTS INDICATE THE INSTITUTION IS LIVING WITHIN AVAILABLE RESOURCES? 6
HOW CAN A COMPOSITE FINANCIAL INDEX BE USED STRATEGICALLY? 6
CHAPTER TWO: USING THE OPERATING AND CAPITAL BUDGETS STRATEGICALLY 7
INTRODUCTION 8
CREATING THE OPERATING BUDGET 9
CREATING THE CAPITAL BUDGET 12
CREATING A STRUCTURE TO COMMUNICATE STRATEGY IMPLEMENTATION 14
INTERGENERATIONAL EQUITY ISSUES 17
CHAPTER THREE: ALLOCATING RESOURCES TO ACHIEVE MISSION 23
INTRODUCTION 24
A FRAMEWORK FOR RESOURCE ALIGNMENT 24
THE RESOURCE ALLOCATION MAP 27
CHAPTER FOUR: STRATEGIC DEBT MANAGEMENT 35
INTRODUCTION 36
DEFINITION OF DEBT 37
DEBT AFFORDABILITY INSTEAD OF DEBT CAPACITY 37
EXTERNAL VERSUS INTERNAL MANAGEMENT OF DEBT 39
IMPLEMENTING A DEBT POLICY 39
USE OF DEBT VERSUS WORKING CAPITAL 42
FINANCIAL RATIOS WITHIN THE CONTEXT OF CREDIT ANALYSIS 43
iv
• STRATEGIC FINANCIAL ANALYSIS FOR HIGHER EDUCATION •
CHAPTER FIVE: MEASURING OVERALL FINANCIAL HEALTH USING FINANCIAL RATIOS 45
INTRODUCTION 46
COMBINING RATIOS FOR PUBLIC AND PRIVATE INSTITUTIONS 48
PEER GROUP COMPARISONS 49
LIMITATIONS IN CALCULATING AND USING FINANCIAL RATIOS 49
OTHER FINANCIAL RATIOS USED IN HIGHER EDUCATION 53
CHAPTER SIX: MEASURING RESOURCE SUFFICIENCY AND FLEXIBILITY 55
INTRODUCTION 56
PRIMARY RESERVE RATIO 56
SECONDARY RESERVE RATIO 59
CAPITALIZATION RATIO 60
CHAPTER SEVEN: MANAGEMENT OF RESOURCES, INCLUDING DEBT 61
INTRODUCTION 62
VIABILITY RATIO 63
DEBT BURDEN RATIO 65
DEBT SERVICE COVERAGE RATIO 67
LEVERAGE RATIO 69
SHORT-TERM LEVERAGE RATIO 70
CHAPTER EIGHT: MEASURING ASSET PERFORMANCE AND MANAGEMENT 71
INTRODUCTION 72
RETURN ON NET ASSETS RATIO 73
FINANCIAL NET ASSETS RATIO 75
PHYSICAL ASSET PERFORMANCE AND MANAGEMENT 76
PHYSICAL NET ASSETS RATIO 76
PHYSICAL ASSET REINVESTMENT RATIO 77
AGE OF FACILITIES RATIO 78
FACILITIES BURDEN RATIO 79
FACILITIES MAINTENANCE RATIO 80
DEFERRED MAINTENANCE RATIO 81
CHAPTER NINE: MEASURING OPERATING RESULTS 83
INTRODUCTION 84
NET OPERATING REVENUES RATIO 84
CASH INCOME RATIO 87
CONTRIBUTION RATIOS 89
DEMAND RATIOS 90
CONTENTS
CHAPTER TEN: THE COMPOSITE FINANCIAL INDEX (CFI) 93
COMPOSITE FINANCIAL INDEX—COMBINING THE CORE RATIOS INTO A SINGLE MEASURE 94
IMPLICATIONS OF THE CFI 96
CALCULATING THE CFI 97
INTEGRATING THE CFI INTO THE STRATEGIC PLAN 99
GRAPHIC FINANCIAL PROFILE—AN APPLICATION OF THE RATIOS 100
APPENDIX A: RATIO DEFINITIONS 106
APPENDIX B: UTOPIA UNIVERSITY FINANCIAL STATEMENTS 110
APPENDIX C: SAGACIOUS STATE FINANCIAL STATEMENTS WITH COMPONENT UNIT 117
APPENDIX D: FINANCIAL RATIO RESULTS 124
v
EXAMPLES
2.1 OPERATIONALIZING THE STRATEGIC PLAN—OPERATING BUDGET 11
2.2 OPERATIONALIZING THE STRATEGIC PLAN—CAPITAL BUDGET 13
2.3 INTERGENERATIONAL EQUITY ALLOCATION 21
5.1 CAPITALIZING STATE SUPPORT 53
9.1 CALCULATING AN OPERATING MARGIN 85
FIGURES
1.1 CHAPTER FLOW CHART 4
2.1 METHODOLOGY COMMONLY USED TO DRIVE THE PLANNING PROCESS 9
2.2 A MISSION-DRIVEN MODEL 10
2.3 IDENTIFYING STRATEGIC GAPS IN CAPITAL AND OPERATING BUDGETS 15
3.1 RELATIONSHIP OF FINANCES TO MISSION (QUADRANTS) 27
3.2 RELATIONSHIP OF MARKET TO COMPETENCIES (SECTORS) 27
4.1 LINKING DEBT POLICY TO THE MISSION 40
4.2 REPRESENTATIVE DETERMINANTS OF EXTERNAL CREDIT PROFILE 44
5.1 RATIO MAP 47
10.1 SCALE FOR CHARTING CFI PERFORMANCE 96
10.2 GRAPHIC FINANCIAL PROFILE 100
10.3 GRAPHIC FINANCIAL PROFILE FOR UTOPIA UNIVERSITY 101
10.4 INSTITUTION #1—GRAPHIC FINANCIAL PROFILE 102
10.5 INSTITUTION #2—GRAPHIC FINANCIAL PROFILE 103
10.6 INSTITUTION #3—GRAPHIC FINANCIAL PROFILE 104
10.7 INSTITUTION #4—GRAPHIC FINANCIAL PROFILE 105
vi
• STRATEGIC FINANCIAL ANALYSIS FOR HIGHER EDUCATION •
TABLES
2.1 UTOPIA UNIVERSITY ENDOWMENT ANALYSIS 22
3.1 QUADRANT/SECTOR MAPPING RESULTS 27
6.1 PRIMARY RESERVE RATIO CALCULATION 57
6.2 ILLUSTRATION OF THE PRIMARY RESERVE RATIO: PRIVATE INSTITUTIONS 58
6.3 ILLUSTRATION OF THE PRIMARY RESERVE RATIO: PUBLIC INSTITUTIONS 58
6.4 SECONDARY RESERVE RATIO CALCULATION 59
6.5 ILLUSTRATION OF THE SECONDARY RESERVE RATIO: PRIVATE INSTITUTIONS 59
6.6 ILLUSTRATION OF THE SECONDARY RESERVE RATIO: PUBLIC INSTITUTIONS 59
6.7 CAPITALIZATION RATIO CALCULATION 60
6.8 ILLUSTRATION OF THE CAPITALIZATION RATIO: PRIVATE INSTITUTIONS 60
6.9 ILLUSTRATION OF THE CAPITALIZATION RATIO: PUBLIC INSTITUTIONS 60
7.1 VIABILITY RATIO CALCULATION 63
7.2 ILLUSTRATION OF THE VIABILITY RATIO: PRIVATE INSTITUTIONS 64
7.3 ILLUSTRATION OF THE VIABILITY RATIO: PUBLIC INSTITUTIONS 64
7.4 DEBT BURDEN RATIO CALCULATION 65
7.5 ILLUSTRATION OF THE DEBT BURDEN RATIO: PRIVATE INSTITUTIONS 67
7.6 ILLUSTRATION OF THE DEBT BURDEN RATIO: PUBLIC INSTITUTIONS 67
7.7 DEBT SERVICE COVERAGE RATIO CALCULATION 67
7.8 ILLUSTRATION OF THE DEBT SERVICE COVERAGE RATIO: PRIVATE INSTITUTIONS 68
7.9 ILLUSTRATION OF THE DEBT SERVICE COVERAGE RATIO: PUBLIC INSTITUTIONS 68
7.10 LEVERAGE RATIO CALCULATION 69
7.11 ILLUSTRATION OF THE LEVERAGE RATIO: PRIVATE INSTITUTIONS 69
7.12 ILLUSTRATION OF THE LEVERAGE RATIO: PUBLIC INSTITUTIONS 69
7.13 SHORT-TERM LEVERAGE RATIO CALCULATION 70
8.1 RETURN ON NET ASSETS RATIO CALCULATION 74
8.2 ILLUSTRATION OF THE RETURN ON NET ASSETS RATIO: PRIVATE INSTITUTIONS 74
8.3 ILLUSTRATION OF THE RETURN ON NET ASSETS RATIO: PUBLIC INSTITUTIONS 74
8.4 FINANCIAL NET ASSETS RATIO CALCULATION 75
8.5 ILLUSTRATION OF THE FINANCIAL NET ASSETS RATIO: PRIVATE INSTITUTIONS 75
8.6 ILLUSTRATION OF THE FINANCIAL NET ASSETS RATIO: PUBLIC INSTITUTIONS 75
8.7 PHYSICAL NET ASSETS RATIO CALCULATION 76
8.8 ILLUSTRATION OF THE PHYSICAL NET ASSETS RATIO: PRIVATE INSTITUTIONS 76
8.9 ILLUSTRATION OF THE PHYSICAL NET ASSETS RATIO: PUBLIC INSTITUTIONS 76
8.10 PHYSICAL ASSET REINVESTMENT RATIO CALCULATION 77
8.11 ILLUSTRATION OF THE PHYSICAL ASSET REINVESTMENT RATIO: PRIVATE INSTITUTIONS 77
CONTENTS
vii
8.12 ILLUSTRATION OF THE PHYSICAL ASSET REINVESTMENT RATIO: PUBLIC INSTITUTIONS 77
8.13 AGE OF FACILITIES RATIO CALCULATION 78
8.14 ILLUSTRATION OF THE AGE OF FACILITIES RATIO: PRIVATE INSTITUTIONS 78
8.15 ILLUSTRATION OF THE AGE OF FACILITIES RATIO: PUBLIC INSTITUTIONS 78
8.16 FACILITIES BURDEN RATIO CALCULATION 79
8.17 FACILITIES MAINTENANCE RATIO CALCULATION 80
8.18 ILLUSTRATION OF THE FACILITY MAINTENANCE RATIO: PRIVATE INSTITUTIONS 80
8.19 ILLUSTRATION OF THE FACILITY MAINTENANCE RATIO: PUBLIC INSTITUTIONS 80
8.20 DEFERRED MAINTENANCE RATIO CALCULATION 81
9.1 NET OPERATING REVENUES RATIO CALCULATION 85
9.2 USING CHANGE IN UNRESTRICTED NET ASSETS FOR PRIVATE INSTITUTIONS 85
9.3 ILLUSTRATION OF THE NET OPERATING REVENUES RATIO: PRIVATE INSTITUTIONS 86
9.4 ILLUSTRATION OF THE NET OPERATING REVENUES RATIO: PRIVATE INSTITUTIONSUSING CHANGE IN UNRESTRICTED NET ASSETS 86
9.5 ILLUSTRATION OF THE NET OPERATING REVENUES RATIO: PUBLIC INSTITUTIONS 86
9.6 CASH INCOME RATIO CALCULATION 87
9.7 ILLUSTRATION OF THE CASH INCOME RATIO: PRIVATE INSTITUTIONS 88
9.8 ILLUSTRATION OF THE CASH INCOME RATIO: PUBLIC INSTITUTIONS 88
9.9 NET TUITION AND FEES RATIO CALCULATION 89
9.10 ILLUSTRATION OF THE NET TUITION AND FEES RATIO: PRIVATE INSTITUTIONS 90
9.11 ILLUSTRATION OF THE NET TUITION AND FEES RATIO: PUBLIC INSTITUTIONS 90
9.12 ILLUSTRATION OF THE NET TUITION DEPENDENCY RATIO: PRIVATE INSTITUTIONS 90
9.13 ILLUSTRATION OF THE NET TUITION DEPENDENCY RATIO: PUBLIC INSTITUTIONS 90
9.14 INSTRUCTION DEMAND RATIO CALCULATION 91
10.1 SCALE FOR CONVERTING THE CORE RATIOS TO STRENGTH FACTORS 97
10.2 CREATING THE WEIGHTING SCHEMA 99
10.3 UTOPIA UNIVERSITY—SUMMARY OF THE COMPOSITE FINANCIAL INDEX 99
viii
• STRATEGIC FINANCIAL ANALYSIS FOR HIGHER EDUCATION •
INTRODUCTION AND ACKNOWLEDGMENTS
The concept of financial analysis through selected measures, such as ratios, has been used in higher education formany years. The tailoring of these measures to match the changing needs of this industry is documented in the pre-ceding ratio analysis publications of this series. In some ways, this edition represents a continuation of the progres-sion expected in ratio analysis, but, in more ways, it represents a new starting point to use the ratios as a foundationfor strategic financial analysis in higher education.
The book’s new title reflects the fact that we recognize the increasing need to address numerous issues of strategicfinancial importance to boards and senior officers of both public and private institutions of higher learning, and not-for-profit organizations in general. This document recognizes the role that the use and analysis of financial ratios canhave in supporting decisions of critical importance to the institution. The ratios should not be the focus; rather, theyare tools to assist in the development of the answers to key questions of strategic financial importance.
This edition differs from prior editions in several important ways. For private institutions, since the fourth editionwe have eliminated some ratios, have reconsidered how better to use others, and have added new ratios on facilitiesand debt management. For public institutions, following several years of operations under the new GovernmentalAccounting Standards Board (GASB) standards, we have added many more ratios than appeared in the fifth edition.We have also introduced the concept of a Composite Financial Index (CFI), as well as other financial analytical andcommunication models.
Our approach to strategic financial analysis of higher education institutions is intended to apply to all types of pub-lic and private institutions, including large research and comprehensive universities, master institutions, liberal artscolleges, community colleges, individual institutions within a public higher education system, as well as the systemitself, and large not-for-profit organizations. This edition is written for chief financial officers, trustees, senior admin-istrators and financial analysts.
The universal basis for effective application of financial analysis is a clear institutional mission. We believe that everyinstitution must have a clearly articulated mission and that there should be both financial and nonfinancial measure-ment against objectives to help the institution understand the extent to which it is achieving that mission. Missioninspires and guides institutional stewards regarding what and why resources will be used to accomplish their vision.Mission is best activated by a strategic plan. Well-managed institutions use their mission to drive success and finan-cial metrics to determine affordability. The strategic plan should always support the mission; it is irrelevant otherwise.
Financial analysis can measure success factors against institution-specific objectives and provide the institution withthe tools to improve its financial profile to carry out its mission. We believe the following are four key financial ques-tions that institutions need to ask themselves:
• Are resources sufficient and flexible enough to support the mission?
• Are resources, including debt, managed strategically to advance the mission?
• Does asset performance and management support the strategic direction?
• Do operating results indicate the institution is living within available resources?
This publication will describe four strategic ratios and additional supporting ratios that will help answer thesequestions.
INTRODUCTION AND ACKNOWLEDGMENTS
BACKGROUND
Since Peat Marwick Mitchell & Co. (PMM) introduced the first edition of Ratio Analysis in Higher Education in the1970s, college and university trustees, senior managers and interested external parties have used financial ratios as atool to better understand and interpret financial statements. The second edition, published in 1982, added debt-related ratios relating to institutional creditworthiness and represented the beginning of the collaboration of KPMGLLP, successor to PMM, and Prager, Sealy & Co., LLC. The third edition, published in 1995, focused on privateinstitutions that implemented new accounting and reporting standards caused by FASB Statements of FinancialAccounting Standards nos. 116 and 117.
The fourth edition, Measuring Past Performance to Chart Future Direction, published in 1999, significantly advancedfinancial analysis and introduced several new models and concepts to higher education finance, including the use offinancial ratios in strategic planning. Many leaders in higher education view the third and fourth editions as mile-stone publications in finance for private institutions.
Published in 2002, the fifth edition, Ratio Analysis in Higher Education: New Insights for Leaders of Public HigherEducation, was designed solely for public institutions that adopted new accounting and reporting standards caused byGASB Statement No. 35. This edition introduced to public higher education leaders several of the concepts andapproaches used by private institutions that were contained in the third and fourth editions.
This sixth edition, Strategic Financial Analysis for Higher Education, combines ratios and models for private and pub-lic institutions. We believe that recombining the financial analysis framework for public and private institutions isnow appropriate because recent changes in the financial accounting and reporting model for public institutions havemade the financial statements more similar to their private counterparts. Although significant differences remain, webelieve that the two reporting models are now more similar than different. In addition, public and private institutionsincreasingly compete with each other in the marketplace for students, faculty, contributions, research support anddebt funding. Further, institutions should understand how financial analysts view the entire industry so that individ-ual institutions may better manage themselves.
SPONSORING ORGANIZATIONS
Strategic Financial Analysis for Higher Education has been a project jointly developed and sponsored by Prager, Sealy& Co., LLC, KPMG LLP and BearingPoint, Inc. Professionals from each organization have designed and developedthe concepts in this edition based on their experiences serving colleges and universities and other not-for-profitorganizations. Professionals from each organization have contributed to prior editions and many of the same peopleparticipated in the development of this edition as well. The development team includes:
Prager, Sealy & Co., LLCFred Prager, Managing Partner and industry leader in higher education financeChris Cowen, Managing Director and Head of the firm’s National Higher Education practiceJoe Beare, Vice President in the higher education group
KPMG LLPLou Mezzina, National Industry Director, Higher Education
ix

x
• STRATEGIC FINANCIAL ANALYSIS FOR HIGHER EDUCATION •
BearingPoint, Inc.
Ron Salluzzo, Chief Risk Officer. Prior to taking on that role, Ron led the State and Local Government and HigherEducation business group for North America. Previously, he was the National Industry Leader for HigherEducation for KPMG LLP.
Jennifer Lipnick, Senior Consultant with responsibilities for BearingPoint’s Higher Education BenchmarkingConsortium
Phil Tahey, retired partner of KPMG LLP and independent consultant
We have enjoyed the opportunity to provide these concepts to the higher education industry. We look forward to theongoing evolution of our financial models and tools and we look forward to working with our colleagues in the indus-try as we use these concepts to advance financial analysis for higher education.
We received valuable comments and advice from the following experienced and acknowledged leaders of highereducation and not-for-profit organizations: Glenn Cavagnaro, Associate Treasurer, University of Southern California;Herb Folpe, retired partner, KPMG LLP; Bob Gallo, retired managing director, BearingPoint, and retired partner,KPMG LLP; Sarah Gillman, Vice President, Budget and Financial Planning, Wildlife Conservation Society; LarryGoldstein, former Senior Vice President and Treasurer, National Association of College and University BusinessOfficers (NACUBO); Mike Gower, Vice President, Finance and Administration, University of Vermont; JohnMoriarty, Partner, KPMG LLP; Edith Murphree, Vice President for Finance, Emory University; Tori Nevois,Assistant Vice President and Deputy Treasurer, Duke University; Roger Patterson, Assistant Vice Chancellor forFinance, University of North Carolina, Chapel Hill; Betty Price, Associate Vice Chancellor for Finance/Controller,Vanderbilt University; Naomi Richman, Senior Vice President, Moody’s Investors Service; Ingrid Stanlis, Partner,KPMG LLP; Judy Van Gorden, Treasurer of the University and Chief Investment Officer Emeritus, University ofColorado.
We acknowledge the conceptual contributions of Fred Turk and Dan Robinson, retired partners of KPMG LLP,in developing the basic ideas for the first three editions of Ratio Analysis in Higher Education.

FRAMEWORK FOR STRATEGIC FINANCIAL ANALYSIS1
CHAPTER SUMMARY
This chapter introduces concepts that are further detailed in later chapters. The alignment of financial strategy tosupport the strategic direction of the institution is critical to attaining institutional goals. The mission, as defined by thestrategic plan, is the institutional driver; financial capacity is the measure of the affordability of the institution’s aspirations.
INTRODUCTION
Prager, Sealy & Co., LLC, KPMG LLP and BearingPoint, Inc. have worked with numerous higher educationinstitutions and other public-sector organizations over many decades. Based on our work, we have determined thatthere are several basic common attributes of successful higher education institutions, with success defined as achiev-ing mission. These attributes include:
• Well-defined mission that is executed and measured against clearly articulated objectives
• Effective leadership by the board and senior management
• Holistic approach in planning, resource allocation and measurement
• Strategically invested financial resources
• Strategically allocated debt and other resources
• Information communicated effectively to stakeholders
• Consistent environment of accountability at all levels
• Periodic assessment of programs, finances and mission
• Adaptable to a changing environment
These attributes and the framework for strategic financial analysis set forth in this publication are applicable to alltypes of higher education institutions and not-for-profit organizations, regardless of their mission, governancestructure, tax-exempt status or other characteristics.
Our work over many decades has led us to develop several unique approaches, methods and tools that higher educa-tion institutions can use to attain these attributes. This publication introduces a more comprehensive framework forfinancial analysis. Previous publications have focused solely or primarily on financial ratios and their use. We considerfinancial ratios to be a tool, albeit a very important one, of financial analysis. Other tools and methods discussed inthis publication address financial strategy and integration of financial goals with the institution’s mission and stra-tegic goals. We consider the effective use of these tools and methods to be more critical to measuring the achievementof the institutional mission.
1

2
• STRATEGIC FINANCIAL ANALYSIS FOR HIGHER EDUCATION •
PRINCIPLES OF STRATEGIC FINANCIAL ANALYSIS
We believe that strategic financial analysis can play an integral role in helping each institution achieve its mission by:
• Measuring success factors against institutional strategic objectives
• Assessing the linkage between institutional strategy and resource allocations depicted in the operating and capi-tal budgets
• Measuring and communicating how financial resources are aligned with strategy
• Quantifying the status, source and use of resources
• Determining what financial data is most important
• Correlating financial information with nonfinancial institutional drivers
• Assessing the institution’s ability to repay current and future debt, including its rationale for creditworthiness
• Gauging institutional performance and functional effectiveness
• Identifying financial anomalies and focusing attention on matters that should be of concern to the institution
• Establishing standards for benchmarking, measuring and making peer comparisons
WHAT IS THE INSTITUTIONAL MISSION?
The basis for effective application of strategic financial analysis is a clear institutional mission. We believe that everyinstitution should have a clearly articulated mission and that there must be measurement, both financial and non-financial, to help the institution understand the extent to which it is achieving that mission. Mission inspires andguides institutional stewards regarding what resources will be used to accomplish their vision. Mission is best acti-vated by a strategic plan. Well-managed institutions use their mission to drive success and financial metrics to deter-mine affordability.
Strategic financial analysis is a combination of approaches, methods and tools to analyze, evaluate and communicatefinancial information about whether an institution is achieving its mission from a financial perspective. Strategicfinancial analysis assists institutions and their stakeholders in making financial decisions needed to achieve their mis-sion, including:
• Aligning operating and capital budgets with mission and strategic plan goals
• Determining resource allocation, sufficiency, flexibility and management
• Achieving balance between financial and physical assets
• Integrating capital and operating budgets and facilities planning
• Investing funds for current versus future students, faculty and other constituents
• Evaluating return on assets deployed
• Identifying and communicating sources and uses of funds
• Integrating financial policies, such as investment, cash management and debt policies
CHAPTER ONE • FRAMEWORK FOR STRATEGIC FINANCIAL ANALYSIS
Strategic financial analysis considers the entire institution, including affiliates, regardless of the legal or accountingstructures used to remove, isolate or distance the affiliates from the primary institution. Much of public institutions’financial resources often reside in affiliated foundations; these foundations are generally not part of the institutionfrom a legal and accounting perspective. Other entities, such as partnerships in which the institution is a general orlimited partner, often issue debt for the benefit of the institution. The formation of these entities and related trans-actions are done to advance the institution toward mission achievement and are a critical part of the institution. Inaddition, this off-financial statement debt often impacts the institution’s debt capacity. Accordingly, they need to beincluded in the financial analysis.
Financial analysis encompasses all significant financial information of an institution, including its affiliates. Strategicfinancial analysis uses different types and sources of financial information, including operating budgets, capitalbudgets and annual financial reports. It also uses other information such as student headcount and the researchexpenditure base. This information should be readily available and the analyses easily repeatable.
An institution’s annual financial report is a summary of the institution’s significant financial events, consolidation ofsimilar financial transactions and a representation of the institution’s financial condition at a point in time. Theannual financial report can be an effective communication tool to the institution’s stakeholders. It is also generally thestarting point for external parties to perform financial analysis of an institution.
The financial measurement and analysis on the three financial statements and related information should correlatewith each other. A key component of financial analysis includes understanding the nature and significance of the non-financial drivers of the financial transactions. The analysis should not only include a correlation of financial informa-tion between each of the basic financial statements and related information, it should also include a correlationbetween financial information and the nonfinancial drivers.
Generally, some analysts have considered the cash flow statement less important than the other two statements. Forpublic institutions, this is due to the relatively recent inclusion of the cash flow statement. For private institutions,although the requirement to prepare a cash flow statement has been in effect since 1996, many institutions preparethe cash flow statement only for their annual financial reports and do not incorporate its use in internal financialanalysis, budgeting or strategic planning. While conceptually the statement of cash flows can be quite informative, inpractice it often is an afterthought. Nevertheless, the statement does contain some critical financial information andexternal analysts are increasing their focus on this statement. In the future, this statement may become a more impor-tant source of data for institutions and strategic financial analysis.
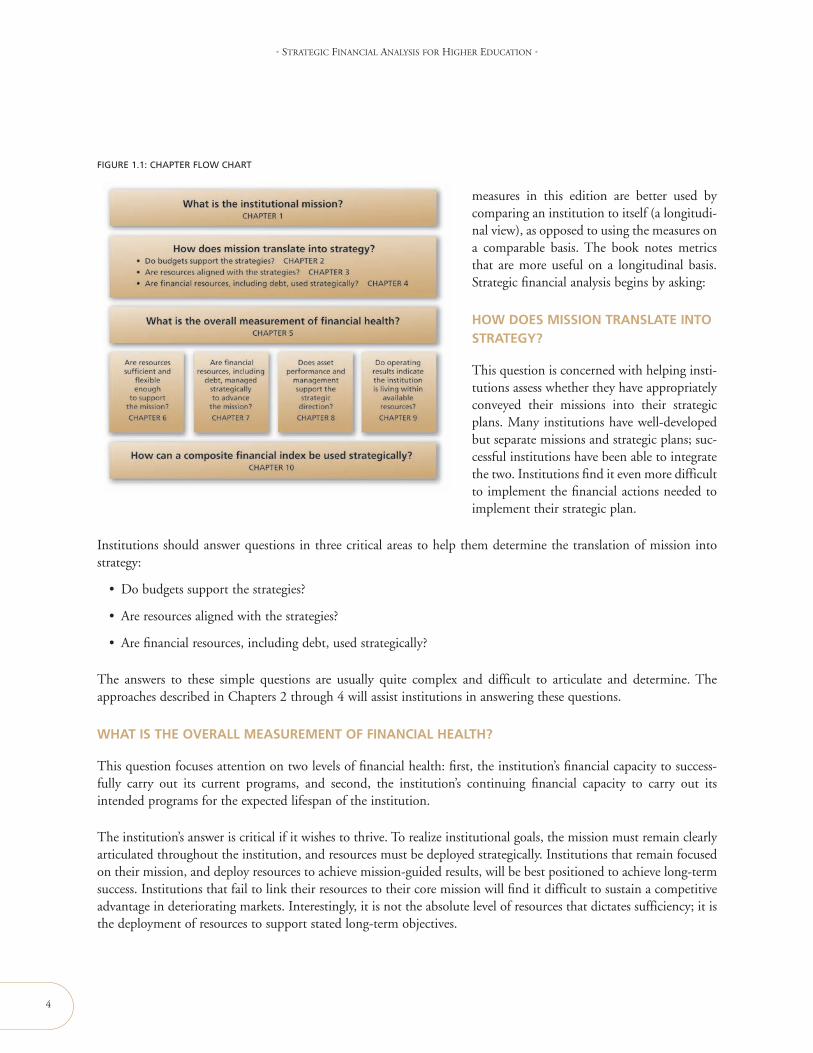
Strategic financial analysis can measure success factors against institution-specific objectives and provide the institu-tion with the tools to improve its financial profile to carry out its mission. To analyze and measure the financial andoperational success of an institution, leaders and interested observers should address four high-order questions. Theschematic on page 4 (see Figure 1.1) depicts the order in which we address these questions; a discussion of each ques-tion follows.
Measuring overall financial health is an essential first step when assessing the impact of transformation on the insti-tution and serves as a gateway to the four other high-level questions. The measurement of financial health in aninstitution logically leads to an interest in measuring comparability between institutions. When completing measuresof comparability between institutions, consideration of the type of institution, as well as the measures used, are impor-tant. Comparing institutions in different Carnegie classifications has some limitations. In addition, some of the
3
4
• STRATEGIC FINANCIAL ANALYSIS FOR HIGHER EDUCATION •
measures in this edition are better used bycomparing an institution to itself (a longitudi-nal view), as opposed to using the measures ona comparable basis. The book notes metricsthat are more useful on a longitudinal basis.Strategic financial analysis begins by asking:
HOW DOES MISSION TRANSLATE INTOSTRATEGY?
This question is concerned with helping insti-tutions assess whether they have appropriatelyconveyed their missions into their strategicplans. Many institutions have well-developedbut separate missions and strategic plans; suc-cessful institutions have been able to integratethe two. Institutions find it even more difficultto implement the financial actions needed toimplement their strategic plan.
Institutions should answer questions in three critical areas to help them determine the translation of mission intostrategy:
• Do budgets support the strategies?
• Are resources aligned with the strategies?
• Are financial resources, including debt, used strategically?
The answers to these simple questions are usually quite complex and difficult to articulate and determine. Theapproaches described in Chapters 2 through 4 will assist institutions in answering these questions.
WHAT IS THE OVERALL MEASUREMENT OF FINANCIAL HEALTH?
This question focuses attention on two levels of financial health: first, the institution’s financial capacity to success-fully carry out its current programs, and second, the institution’s continuing financial capacity to carry out itsintended programs for the expected lifespan of the institution.
The institution’s answer is critical if it wishes to thrive. To realize institutional goals, the mission must remain clearlyarticulated throughout the institution, and resources must be deployed strategically. Institutions that remain focusedon their mission, and deploy resources to achieve mission-guided results, will be best positioned to achieve long-termsuccess. Institutions that fail to link their resources to their core mission will find it difficult to sustain a competitiveadvantage in deteriorating markets. Interestingly, it is not the absolute level of resources that dictates sufficiency; it isthe deployment of resources to support stated long-term objectives.
FIGURE 1.1: CHAPTER FLOW CHART
CHAPTER ONE • FRAMEWORK FOR STRATEGIC FINANCIAL ANALYSIS
ARE RESOURCES SUFFICIENT AND FLEXIBLE ENOUGH TO SUPPORT THE MISSION?
This question is concerned with helping institutional stewards assess the status of the institution’s financial resources.Flexibility in making decisions about future institutional transformation will depend on the institution’s fiscal per-formance and financial base. Understanding this flexibility will help stewards and external parties determine institu-tional risk tolerance in the transformation process.
Two related questions address financial sufficiency and resulting flexibility:
• Is the institution clearly financially healthy, or not, as of the balance sheet date?
• Is the institution financially better off, or not, at the end of the fiscal year than it was at the beginning?
A simple and direct answer to each of these questions provides baseline information for further analysis and action.
ARE FINANCIAL RESOURCES, INCLUDING DEBT, MANAGED STRATEGICALLY TO ADVANCE THEMISSION?
The existence of resources alone is not sufficient to ensure that the institution will attain its goals because issuescritical to institutional mission are often nonfinancial, and the existence of resources does not guarantee they will beinvested strategically. However, insufficient resources certainly create a barrier to the achievement of institutionalgoals.
In previous editions of Ratio Analysis in Higher Education, we limited this question to address the management of debtexclusively; however, we have expanded the question to encompass the allocation of all resources. Increasingly, debt,internal funds, philanthropy and other sources of capital must be analyzed and managed strategically and consistentlyto optimize the institution’s capital structure and efficiently allocate resources. Debt should not be analyzed or man-aged in isolation; rather, it must be considered within the context of all institutional resources.
Debt is a tool available to the institution to allocate toward the achievement of its desired long-term strategies. Aswith other resources, debt is limited and therefore must be used sparingly and strategically. The development andadoption of a formal debt policy, which is discussed in Chapter 4, provides the framework through which the insti-tution can evaluate the use of debt to achieve strategic goals.
No institution, regardless of its wealth or competitive advantages, possesses sufficient resources to fund all programsand initiatives. Therefore, it is critical that the institution establish a mechanism to prioritize projects for funding, andthat institutional stewards have the conviction to deny funding for uses that, while worthwhile, do not represent insti-tutional priorities. We believe that successful institutions make the often difficult decisions not to fund low priorityrequests that divert funding from higher strategic institutional objectives. We have noted that many institutions withrelatively small endowments have found a way to do more with less and consciously reinvest resources in programand mission rather than exclusively in building financial resources.
5
6
• STRATEGIC FINANCIAL ANALYSIS FOR HIGHER EDUCATION •
DOES ASSET PERFORMANCE AND MANAGEMENT SUPPORT THE STRATEGIC DIRECTION?
The long-term financing of an institution is a daunting challenge facing its stewards and is an issue for external par-ties, including parents, accrediting bodies, donors and grantors, government agencies, lenders, and rating agencies.Because the long-term future of the institution depends on its ability to replace and enhance its capital base, manag-ing resource inflow streams is essential to achieving its mission. In addition, managing, renewing and replacing aninstitution’s large and complex physical asset infrastructure are increasingly significant challenges facing institutions.Stewards must, therefore, be wary of diversions that impede progress toward achieving the mission.
DO OPERATING RESULTS INDICATE THE INSTITUTION IS LIVING WITHIN AVAILABLE RESOURCES?
The allocation of scarce resources is a critical function in achieving institutional mission. Many institutions continueto undergo significant self-examination to improve academic and support services while lowering costs. Theseactivities are likely to accelerate in the years ahead as successful institutions direct resources to selected programsthat enhance their success, rather than spread insufficient resources over many programs.
The successful institution must be a superior performer in every area in which it chooses to participate, and superiorperformance requires long-term focus and investment. Success in any area in which the institution chooses to com-pete will require targeted and increasingly larger investments. It is therefore critical to identify which programs,research opportunities and other activities represent core, mission-related activities. By determining a select numberof areas in which the institution has a competitive edge, and then strengthening programs within those areas, the insti-tution will be able to improve that advantage. It must also be able to communicate those advantages, strengths anddirections to its stakeholders and the community at large.
Continuing to invest in noncore activities absorbs limited resources, including money, management time and insti-tutional focus. Areas in which an institution is clearly weak present opportunities for the competition. Historically,it was not possible for many institutions to take advantage of an institution’s perceived or real weaknesses, sincegeography and access to students created a natural barrier to entry. With the growth of technology and use of distancelearning channels, competition from both traditional and nontraditional organizations represents an increasedthreat—and an opportunity. A conceptual model is discussed in Chapter 3 that provides institutions with a mecha-nism to allocate scarce resources most effectively across these competing priorities.
HOW CAN A COMPOSITE FINANCIAL INDEX BE USED STRATEGICALLY?
Having one overall financial measurement of an institution helps governing boards and senior management under-stand the financial status of the institution. The Composite Financial Index (CFI) combines four core high-level ratiosinto a single score. This permits a strength or weakness in a specific ratio to be offset by another ratio, resulting in amore holistic approach to financial measurement. The CFI is best used as a component of financial goals of the stra-tegic plan and should be calculated over a long time horizon, both historically and projected to the future.
USING THE OPERATING AND CAPITALBUDGETS STRATEGICALLY
7
?
77
2
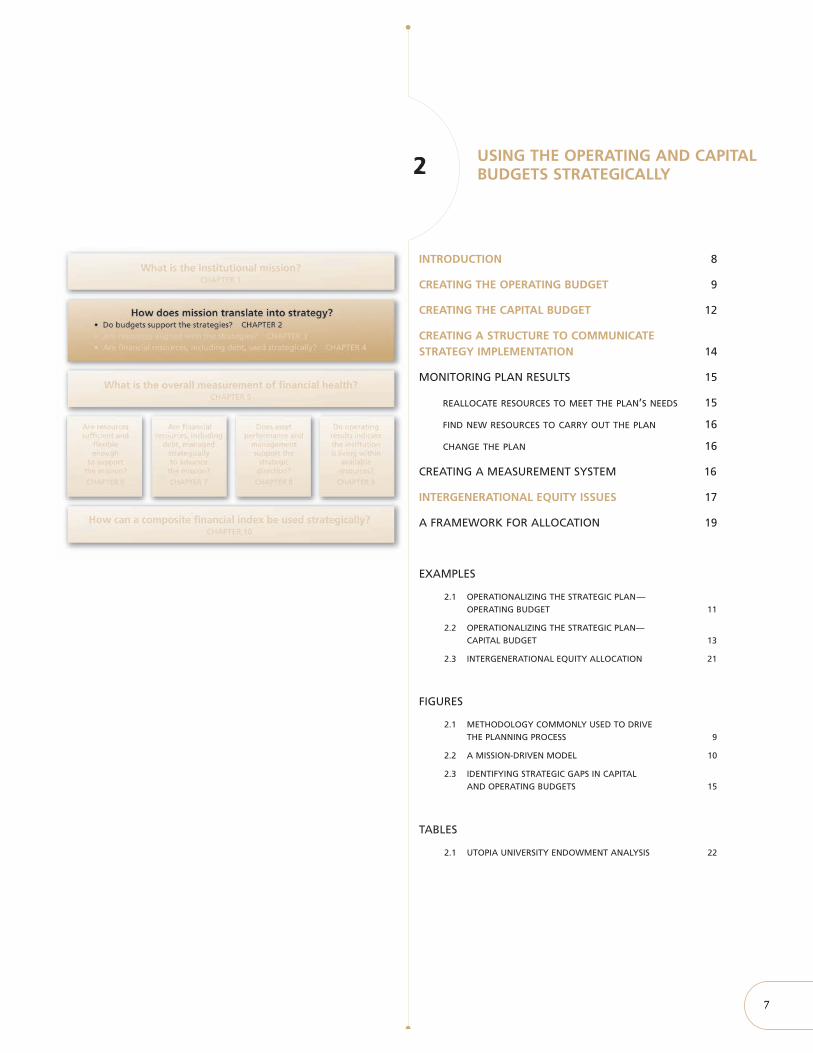
INTRODUCTION 8
CREATING THE OPERATING BUDGET 9
CREATING THE CAPITAL BUDGET 12
CREATING A STRUCTURE TO COMMUNICATESTRATEGY IMPLEMENTATION 14
MONITORING PLAN RESULTS 15
REALLOCATE RESOURCES TO MEET THE PLAN’S NEEDS 15
FIND NEW RESOURCES TO CARRY OUT THE PLAN 16
CHANGE THE PLAN 16
CREATING A MEASUREMENT SYSTEM 16
INTERGENERATIONAL EQUITY ISSUES 17
A FRAMEWORK FOR ALLOCATION 19
EXAMPLES
2.1 OPERATIONALIZING THE STRATEGIC PLAN—OPERATING BUDGET 11
2.2 OPERATIONALIZING THE STRATEGIC PLAN—CAPITAL BUDGET 13
2.3 INTERGENERATIONAL EQUITY ALLOCATION 21
FIGURES
2.1 METHODOLOGY COMMONLY USED TO DRIVETHE PLANNING PROCESS 9
2.2 A MISSION-DRIVEN MODEL 10
2.3 IDENTIFYING STRATEGIC GAPS IN CAPITALAND OPERATING BUDGETS 15
TABLES
2.1 UTOPIA UNIVERSITY ENDOWMENT ANALYSIS 22
USING THE OPERATING AND CAPITAL BUDGETS STRATEGICALLY 2
8
CHAPTER SUMMARY
This chapter offers a framework to improve the linkages between strategy and resource allocations and introduces toolsthat help an institution understand whether its resource allocation decisions are successful in furthering its strategies. Theaffordability of initiatives undertaken is more clearly visible with these tools because the institution creates standards andmeasures of performance prior to undertaking the initiative. We complete the chapter with a discussion of an approach toassess appropriate levels of internal investments an institution might make to ensure progress against its strategy.
INTRODUCTION
Institutions are often faced with the dilemma of how to create a “balanced budget.” This is especially true for publicinstitutions that have to deal with significant and often unpredictable changes to state appropriations. This balancingactivity has tended to focus on an “accounting balance” of the budget without necessarily focusing on whether thebudget is balanced from a strategic perspective. The distinction, which is critical to the long-term success of the insti-tution, relates to the types of annual investments and reinvestments required by the institution to meet its mission.
The typical budgetary process provides limited information about meeting strategic objectives. Generally, budgetsare prepared consistent with reporting lines, usually by departments, and do not capture information according toactivity, which is the way most strategic investments are made, particularly in new initiatives. This is a reasonablebudgetary methodology, since it aligns accountability and responsibility.
However, an operating budget presented in a typical manner does little to convey how the institution is achieving itsmission or implementing its strategic plan. We believe that the operating budget should be a communication toolabout the strategic plan, an expression of that plan, and a monitor for acquisition and deployment of resources.
Capital projects also have a significant impact on future operating budgets, due to increased operating costs andpotential programmatic expenditures and interest expense. Therefore, these investments must be viewed within thecontext of other demands on institutional funds. If operating and capital budgets are not integrated, future operat-ing budgets may underestimate outflows since capital budgetary requirements are not incorporated and decisionsregarding capital project priorities are not made within the context of all institutional priorities.
Creating a strategically balanced budget is not easy. It requires the necessary infrastructure—both human and tech-nological—to develop and modify data. Since much of an institution’s budget may consist of restricted funds, thereallocation of resources can be even more difficult, especially for public institutions that may have less control overthe operating budget, or for decentralized organizations that have little impact on divisional budgets and allocations.Despite these significant challenges, moving to a strategic budgeting model can have significant benefits for the insti-tution. While it may not be possible to move fully from an accounting-based to a strategy-based budget model in asingle year, incremental change can have a profound and cumulative positive impact.

CHAPTER TWO • USING THE OPERATING AND CAPITAL BUDGETS STRATEGICALLY
9
This chapter will discuss and present a structure for communicating and using the operating and capital budgets ina strategic manner. This is what we call Strategic Budgeting.
CREATING THE OPERATING BUDGET
The institutional operating budget is a critical management tool capable of energizing department heads, deans, vicepresidents and others to understand their progress against institutional goals. If this is not consistent with the insti-tution’s budgetary methods and activities, then the institution is likely unable to focus on achieving its goals. The useof financial ratios at a divisional or lower level, viewed over several years against a stated target, can help measureattainment of these objectives.
Generally, the context within which the budget process is established determines how budgets and the budgetaryprocess are viewed. To make the budget document a vibrant management tool, each institutional constituency mustview the budget both as a document that helps advance the institutional mission and also as a means of measuringprogress toward goals for the period covered by the budget. The phrase “covered by the budget” is significant becausetoo often the time frame is limited to a single year. If the budget is intended to demonstrate direction in a meaning-ful way and show progress in meeting the strategic plan’s goals, then institutions should consider using either budgetperiods that match service cycles or preparing rolling multiyear budgets. Service cycles represent the activities of theinstitution. For instance, the undergraduate instruction cycle is a 4–5 year time frame. Also, the sponsored researchcycle would be consistent with the term of the grant set by the sponsoring institution.
As a result of the strategic planning process, each con-stituent of the institution reads the final plan in relationto his or her own interests. In effect, board members,senior administrators, faculty, students and other inter-ested parties in the campus community will view thestrategic plan as a series of steps in an action plan fulfill-ing specific and generally different promises to eachgroup and often will focus on those components of theplan relevant to their community, potentially losing sightof the overall strategy.
If the context of the plan (that is, the institutional mis-sion) is unclear, the strategic plan can become a docu-ment that divides rather than unifies the institutionalcommunity around the institutional mission. This divi-sion occurs when promises in the plan are not fulfilled orwhen affected departments do not have effective com-munications about goal achievement.
Figure 2.1 graphically depicts a planning process lackingcohesiveness between the strategic plan and the operat-ing budget. If the operating budget becomes the drivingforce of the institution, the institution will have diffi-culty creating collaborative efforts. If the strategic plan,
FIGURE 2.1: METHODOLOGY COMMONLY USED TO DRIVE THEPLANNING PROCESS
mission, core values and vision of the institution are not clearly articulated through the budgetary process, then it islikely that there will be substantial disagreement within the institution regarding resource allocation.
To create collaboration, the commitments that the institution makes must tie the mission directly to the budget, withthe budget representing the strategic plan’s limiting factor or affordability index. The strategic planning process isthe time and place for discussion and conclusions on resource allocations. This type of collaborative effort requiresa strategic planning process that is dynamic in nature and revisited annually. The appropriate starting point fordecisions related to programmatic priorities is within the strategic plan, updated for changing and emergingcircumstances.
Properly executed, the operating budget represents the implementation of the strategic plan over a shorter timehorizon. Should planned strategies prove unaffordable, then the budgetary process should be structured to identifyaffordability issues and funding alternatives (e.g., new revenues, reallocation, expense reductions, etc.).
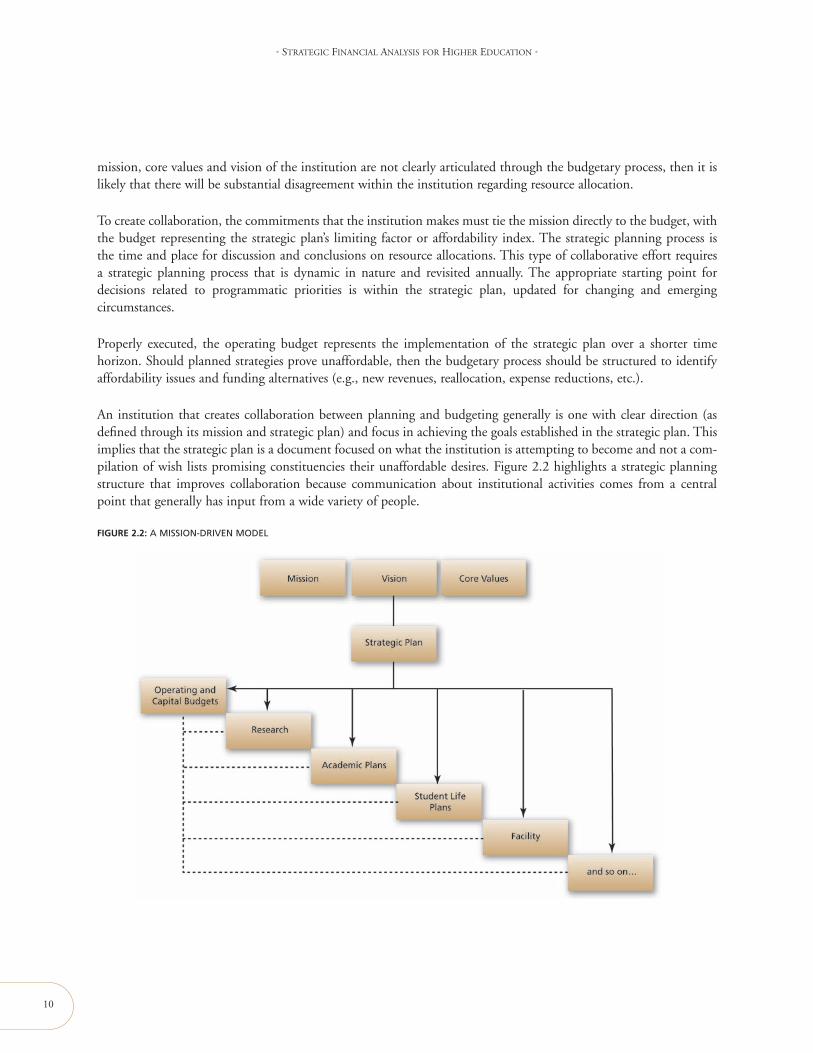
An institution that creates collaboration between planning and budgeting generally is one with clear direction (asdefined through its mission and strategic plan) and focus in achieving the goals established in the strategic plan. Thisimplies that the strategic plan is a document focused on what the institution is attempting to become and not a com-pilation of wish lists promising constituencies their unaffordable desires. Figure 2.2 highlights a strategic planningstructure that improves collaboration because communication about institutional activities comes from a centralpoint that generally has input from a wide variety of people.
10
• STRATEGIC FINANCIAL ANALYSIS FOR HIGHER EDUCATION •
FIGURE 2.2: A MISSION-DRIVEN MODEL

CHAPTER TWO • USING THE OPERATING AND CAPITAL BUDGETS STRATEGICALLY
11
An institution should be driven by its mission that is articulated through its strategic plan and limited by its finan-cial resources. Each of the individual unit plans within the institution is established to achieve the goals of the stra-tegic plan. The operating budget informs each of the individual plans about affordability of activities. This structureenables the institution to think in terms of reallocating resources to meet its mission and also allows assessment ofinstitutional reinvestments in program initiatives, human capital and physical capital.
The concept that budgets demonstrate institutional investment and reinvestment in mission-critical activities isdifficult to understand if the budget is by school, department or expense classification. Although this structure mayaid department heads in understanding and managing costs, there needs to be a separate presentation of informationthat informs the community about institutional investment activities. The size of the investments should be articu-lated in the strategic plan and demonstrated each year in the budget.
EXAMPLE 2.1: OPERATIONALIZING THE STRATEGIC PLAN—OPERATING BUDGET
Most institutions would agree that it is desirable to budget strategically; however, the complexities involved in doing
so may make it difficult or impractical. We acknowledge the effort and challenges involved in undertaking a strategic
approach to developing the operating budget, and also the fact that the measurement of success is problematic. This
is compounded by the fact that at many higher education institutions the budget and the financial results (audit) often
are not sufficiently similar. Despite these challenges, taking incremental action to move closer to a strategic budget
should be an objective.
Even absent a lengthy list of issues regarding implementation of such an approach, there will always be the challenge
of identifying resources that can be applied to fund new strategic initiatives. To the extent possible, institutions take
actions that establish central unrestricted funds in a provost/presidential account that can be allocated to strategic
initiatives. Over time, these resources can grow in order to fund further initiatives. Some examples as to how to gen-
erate such funds include:
• Allocate investment gains in periods of good returns. Most of us would agree that unsustainable gains should not
be used to fund ongoing operations, as this results in future budgetary challenges when, almost certainly, returns
decline. Establishing policies to create this fund at a time when surplus earnings do not yet exist may be the most
politically feasible.
• Use revenue-enhancing mechanisms in historical cost centers to seed a fund. Improving cash or debt management
processes can produce incremental income (or reduced expense) that can be applied to initiatives.
• Make the strategic initiatives fund self-perpetuating. Provide funding for new initiatives for a predetermined
period of time, at which point the project should either be self-supporting or might be discontinued. Successful
projects may be required to repay the initial contributions so that the funds can be recycled to future initiatives.
• Require divisional matching funds. Even in challenging financial times, many institutions/deans/professors will have
access to available funds. Use the strategic initiatives fund as a source of matching funds to leverage other
resources. This strategy places a substantial incentive for other members of the community to explore mechanisms
to shift funding toward new initiatives.
• Encourage donors to contribute to such funds. Since these funds will be spent on creative new programs and ini-
tiatives (unlike endowment), the gifts will have immediate impact, which some supporters may find compelling.
12
• STRATEGIC FINANCIAL ANALYSIS FOR HIGHER EDUCATION •
Recognize that creating a fund will take time and effort, but over time further resources can be generated. The initialsuccess of the process, hopefully, can encourage future additions to the fund.
CREATING THE CAPITAL BUDGET
Similar to the process for developing a strategic operating budget, the institution should follow a similar disciplinewhen developing its capital budget. The need for facilities renewal should be quantified, funded and analyzed on amultiyear basis so that the full impact of required capital investment is understood. The capital budget should includeboth repair and renovation, and new projects, which often may receive more attention from the administration anddonors. Even though deferred maintenance needs may appear insurmountable, even small budgeted contributionscan improve the situation over time.
The capital budget should be developed in conjunction with the development of the operating budget. Investmentin plant assets necessarily involves trade-offs and prioritizations among other institutional initiatives, and these invest-ment decisions should not be made in isolation. The institution should recognize the trade-offs between investing infacilities, investing in programs, and investing in financial assets. Institutions should recognize that all three of theseinvestment needs are ongoing and permanent even though the nature and amounts will vary significantly from yearto year.
The costs associated with the investment in facilities tend to be more permanent in nature than investments in otherareas, although this may not always be the case. Because facilities are long-lived, require future reinvestment and rep-resent a significant use of limited resources, capital needs must be prioritized through a multiyear capital budget thatis linked to the institution’s strategic plan. Since not all projects can (or should) be funded, capital investment mustbe ranked according to priorities determined on an institutionwide basis and difficult choices must be made (e.g.,there cannot be multiple number one priorities and a project should not become a priority due to a sense of entitle-ment or donor support that is inconsistent with the objectives outlined in the strategic plan).
The capital budget should recognize that there are various types of required facility investment, including new con-struction and facilities renewal. Often, new construction receives greater attention because of the ability to receiveexternal funding and the perceived desire to invest in new facilities that are visible memorials of the institution’scommitment to specific initiatives. Facilities renewal, on the other hand, may be more difficult to fund, may be moreeasily deferred (for some period of time) and may not produce a visible change. In addition, individual facilitiesrenewal or deferred maintenance items may not amount to a significant expenditure; however, in aggregate they mayrepresent a significant necessary reinvestment. Ignoring the funding of the deferred maintenance requirements in thecapital budget may underestimate the true facilities need and cost to the institution.
Capital budgets should be developed for multiyear periods. The decision to undertake a capital project today mayhave implications for future flexibility and budget capacity. If facility investment decisions are made on a solely incre-mental basis, it is possible that higher priority initiatives may be underfunded, or the full impact of facilities invest-ment is not appreciated, such as the need for additional infrastructure investment. While institutions often examinethe cost of investment in capital projects, it is also important to analyze the costs associated with not investing, ordelaying investment. Furthermore, any contingent investments need to be identified and incorporated so that the fullimpact on the institution can be analyzed.

CHAPTER TWO • USING THE OPERATING AND CAPITAL BUDGETS STRATEGICALLY
13
EXAMPLE 2.2: OPERATIONALIZING THE STRATEGIC PLAN—CAPITAL BUDGET
One of the concepts in this edition is to recommend thinking about capital budgeting on a portfolio basis—that is, not
distinguishing between repair and renovation and new building projects. All capital needs should be considered when
developing a comprehensive strategic capital budget, including funding for deferred maintenance and technological
obsolescence.
One reason that the deferred maintenance problem exists is that few (although a growing number) institutions actu-
ally have the resources to pay for the full desired amount of repair and renewal. This is due, in part, to the following
reasons:
• Few existing facilities actually have maintenance endowments.
• Expenditures for deferred maintenance are some of the easiest (at least in the short-run) to defer in times of budg-
etary difficulty.
• There is no incremental revenue source associated with the repairs to support new debt.
Institutions cannot solve the deferred maintenance issue immediately. The problem did not develop overnight and will
not be resolved in a single budget cycle. In fact, it likely will take several years, perhaps decades, to address the need.
The first steps involve trying to stop the growth of the repair backlog, and then determine ways to deal with it. These
include the following:
• Recognize that addressing deferred maintenance will be an ongoing challenge.
• Encourage that new buildings have established financial plans for repair and renovation to the extent possible.
Require development officers to explain the full cost of a building to donors and require the donor, or benefiting
school, to establish a maintenance endowment.
• Create a revolving fund for current repairs and consider the impact of seeding the fund with incremental debt. This
will spread out the current requirement, but a plan must be in place to ensure that the newly renovated facility will
have a funding source for future needs.
• Establish or increase a tax to provide funds for the revolving fund. This tax can be phased in so that there are not
undesirable immediate budget shocks. Units can plan for the funding requirements over several years. This will
require recognition that funding deferred maintenance is a high enough priority that it will require other program-
matic needs not to be funded.
• Treat renovation expenditures similar to new projects when developing the capital budget. If funds are being placed
in new facilities, explicitly acknowledge that this means the institution has assigned a higher priority to those uses.
• Report on the deferred maintenance needs along with new building requirements in a comprehensive capital report
to the governing board.
• Consider these capital budget requirements within the operating budget.
Sources of funding for capital products should be analyzed on a portfolio basis. The operating budget, reserves,philanthropy, government grants, and short-term and long-term debt all represent potential yet limited sources offunding for the capital budget. These sources should be analyzed collectively, so that optimal allocation of resourcesto institutional priorities may be made. Funding decisions should be made in a portfolio context. The institutionshould develop and maintain an ongoing list of requirements and pool of available resources, including internal andexternal funds.
14
• STRATEGIC FINANCIAL ANALYSIS FOR HIGHER EDUCATION •
CREATING A STRUCTURE TO COMMUNICATE STRATEGY IMPLEMENTATION
How does an institution begin the process of aligning all of its operating and capital plans (budgets) to its strategies?Because each institution is unique—both in its mission and current challenges—it is difficult to prescribe a definedset of steps to follow. However, each institution should implement a structure allowing planning and budgeting to bearticulated and to communicate a consistent message to the institutional community. Ideally, this will acknowledgecore strengths that are being advanced. A potentially successful communication structure involves the following:
• Create clearly stated goals in the strategic plan
• Determine key financial and nonfinancial success indicators/ratios
• Develop consistent framework for presentation of operating budgets
• Identify strategic initiatives upfront and budget for these initiatives first
• Track spending for initiatives as a separate component of the operating/capital budget
The starting point is the creation of clearly stated goals in the strategic plan. Each initiative that the institution is address-ing should specify its goals, resources (financial, capital, human and informational) allocated or reallocated, required newrevenues and their sources (if any), and key success indicators. Without clearly defined goals, resources and performancemeasures, it is unlikely that the initiative will receive adequate support and consequently will not be implemented.
The institution must determine its own key success indicators as part of the strategic planning process and they shouldbe included in the plan. Key success indicators should be established for each initiative and should include both non-financial indicators (as the drivers) and financial indicators (to create an affordability measure). The indicators shouldbe few in number and effectively communicated to the institution’s stakeholders and community.
Once the strategic plan clearly defines institutional initiatives, the framework for creation of other plans is established.The institution should require each unit preparing plans to use the same framework to ensure consistency in thedevelopment of its operating plans, both financial and nonfinancial. The focus should always be to measure the fewitems that allow determination of a plan’s success. Since all nonessential activities relating to the institution’s missionshould have been eliminated, each activity should have its own measurement.
The question of whether a budget is strategically balanced is answered by the spending patterns set forth in the oper-ating budget and whether investments from the capital budget indicate progress toward strategic objectives. If theoperating plan tends to be incremental in nature or lacks identification of resources for required capital investmentwhile the strategic plan represents substantive change, then a strategic gap exists in balancing the budget. Generallyspeaking, this represents a type of deferred obligation that the institution will be forced to make up at a later date, oran increased risk that key strategic initiatives will not be met.
Figure 2.3 presents two lines identifying strategic gaps. The top line represents the expenses of an institution that isreinvesting in itself at a rate sufficient to meet the objectives of its strategic plan. If repeatable revenues meet or exceedthis amount, the budget is strategically balanced. The second line represents a budget that “gets the job done” butincludes little investment in strategic initiatives. If revenue sources meet this line, the budget is financially balanced.Over a period of years, a strategic gap accumulates, and the institution should track the size of that gap, overthe period covered by the strategic plan. Our experience suggests that communication of the gap is as important asthe tracking.

There are two relatively simple but critical elements foroperating plans or budgets to articulate to the strategicplan. Always provide budget amounts for the initiativesfirst, not as add-ons, or the initiative will get lost. Second,always keep the amount for strategic initiatives as a sepa-rate component of the overall budget. A supplement tothe budget should present institutional investments inthree categories: physical capital, human capital and newprogram initiatives. The investment in human capital, inthis context, is rarely salary support. It often representsthe activities necessary for faculty and staff to create newskills that are required by the institutional mission.
For an understanding of the position of investments in capital activities, a similar analysis can be performed to quan-tify the cumulative effect of prolonged under-investment in required capital projects. Figure 2.3 presents capitalspending on a status quo basis (lower line) and spending required to complete the investments articulated in thestrategic plan. Again, to the extent these lines diverge, spending is occurring that is not consistent with the institu-tion’s stated strategies.
MONITORING PLAN RESULTS
One of the critical elements of managing the process of implementation is the ability to define success before begin-ning implementation. The plan must be priced and time phased, and there should be agreement on the metrics, bothfinancial and nonfinancial, that will be used at interim periods as well as at the plan’s completion.
If a gap exists in either the operating or capital budget, it should be cause for concern for governing boards, but ifsuch a gap is not communicated, it may not receive appropriate attention and necessary actions may be delayed tothe point where the plan’s objectives cannot be met. One of the key responsibilities of the board of any institution isoverseeing the strategic plan, from its initial approval to understanding its progress. Should a gap exist, at any point,a board has three potential actions to guide institutional activity consistent with the plan:
• Reallocate resources to meet the plan’s needs.
• Find new resources to carry out the plan.
• Change the plan.
Each of these actions has implications to the status quo of the institution and would not be easy to achieve in mostcases. However, allowing the plan to go unfulfilled without explanation or corrective action may impair the credi-bility of the institution’s leadership. Many times, a major strategy change is part of the compelling case for a capitalcampaign or other major fundraising initiatives.
Reallocate Resources to Meet the Plan’s Needs
This is a difficult task because it requires the institution to discontinue activities that may be ingrained in the insti-tutional psyche. Plans for reallocating resources can be developed at the lowest budgetary level of the institution or atthe highest. The fundamental issue is that institutions will not achieve substantial gains through reallocation efforts
CHAPTER TWO • USING THE OPERATING AND CAPITAL BUDGETS STRATEGICALLY
15
FIGURE 2.3: IDENTIFYING STRATEGIC GAPS IN CAPITALAND OPERATING BUDGETS

16
• STRATEGIC FINANCIAL ANALYSIS FOR HIGHER EDUCATION •
unless activities are changed. An example would be automating manual activities or changing workflow of specificprocedures. In most institutions, the largest cost is human resources. Any change in workflow requires a systemic wayof capturing the costs associated with redeploying people to fit institutional priorities. In Chapter 3, we discuss adifferent method and structure for assessing resource allocation.
Find New Resources to Carry Out the Plan
The challenge of meeting dynamic goals in a strategic plan is the ability of the institution to do things differentlyfrom the past. However, the hard work around achievement of strategy includes finding the resources to make theplan a reality. The case for a capital campaign is generally based on institutional needs. In some cases, the needs areimmediate, while in others the needs are based on institutional aspirations. In either case, if the board decides the wayto meet the stated strategic plan is through new funding, the measurement of funding for new things needs to be netnew money (truly new funds raised and not shifted, and net the incremental cost of raising the funds). In deployingthis strategy, a key element of monitoring is ensuring the funds raised fit the profile outlined in the strategic plan. Forexample, if the strategic plan calls for substantially unrestricted fundraising and most funds raised are permanentlyrestricted, the overall goal may be reached (sufficiency) but the types of funds may not meet the needs of the institu-tion (flexibility).
Change the Plan
At first glance, this option would appear to be the least desirable because of the implications to all constituents.Faculty may view backing off a plan on improving academics as a lack of commitment to the core mission. Donorsmay view a change as either indecisiveness or perhaps question whether money already raised will achieve theintended purpose. However, the larger and more long-term issue will be the credibility of the board and senior man-agement if they are aware the plan is not achievable and do not communicate that to the community.
CREATING A MEASUREMENT SYSTEM
A key component of achieving a plan’s goals is effective communication between the operating managers and centraladministration regarding financial and nonfinancial performance. For a manager to understand success, the commu-nication needs to be structural in nature, relatively frequent and repeatable. The institution must establish key per-formance indicators that make sense within the context of the budget. Too often financial performance indicatorsrelate solely to expense goals. The more important financial indicator is whether the department produced whateverunits of measure are required for the money spent. For example, if the admissions office indicates that it is underbudget in its costs and yet only recruited 95 percent of the budgeted students, this department should be consideredunsuccessful. Likewise, an admissions office enrolling all students required but at a higher than affordable discountrate should also be considered unsuccessful.
These two examples are relatively simple and straightforward and can be measured in almost every institution.However, measures of success should be required for each department that has budgetary authority. These key meas-ures need to be developed collaboratively and accepted by the department if they are to be effective.
Similarly, the capital budget should have a measurement component. Buildings are constructed or renovated to bet-ter achieve programmatic needs, provide needed space for strategic objectives, or provide the infrastructure thatenables the institution to carry out its mission. The capital budget should be analyzed within the context of how wellits components support the desired outcomes.
CHAPTER TWO • USING THE OPERATING AND CAPITAL BUDGETS STRATEGICALLY
17
Outcome measures should be agreed to as part of the development of the strategic plan and should be monitored atcritical junctures to understand whether or not the plan is successful, both in totality and in individual components.The Balanced Scorecard,1 developed by Drs. Robert Kaplan and David Norton, provides a measurement and man-agement system to help organizations achieve their strategic goals. The Balanced Scorecard suggests reviewingan organization from four perspectives, which have been adapted for our purposes:
1. The institution’s role as a learning organization;
2. Institutional infrastructure, or business process perspective;
3. Student, faculty and administration satisfaction; and
4. Financial metrics.
It is critical that only a few measures be used to identify institutional success, just as few measures should be used tomeasure performance at the department level.
Financial measures that an institution would use represent limiting factors, not drivers. For example, if a strategic planputs demands on the resources of the institution that would put it in a clearly unhealthy financial position, then theaffordability of the planned activity should be challenged. Conversely, if the anticipated financial results are strong asa result of the implementation of the strategic plan, but the nonfinancial key performance indicators are poor, thenfulfillment of mission is at risk.
Each institution must select its own unique measures of success and create some level of consensus that thosemeasures are in fact valid for the institution. From a financial perspective, these measures should include a blend ofending financial position at each measurement point and operating performance for those same periods. These meas-ures of institutional financial health are listed in Chapter 5.
Operating and capital budgets represent the anticipated economic wants and resulting physical requirements ofthe institution expressed in dollars. Expressing strategic initiatives in dollar terms can provide insight into the degreeto which the institution has funded its strategic initiatives. By putting these together, key stakeholders should be ableto establish useable expectations about institutional achievement of goals. The saying that “what gets measured getsdone” seems appropriate for higher education institutions. A systemic method of measurement may well providecommon ground for institutions to understand progress in institutional direction. A process of allocating resourceswithin the context of institutional priorities and competencies is presented in Chapter 3.
Budgeting on a strategic basis inevitably leads institutions to another question—is the institution investing appropri-ate amounts in itself on a consistent basis? The challenge of investing the right amount will directly influence themeasures of affordability of various initiatives.
INTERGENERATIONAL EQUITY ISSUES
There has been a significant amount of discussion over the years related to the appropriate level of spending that aninstitution should commit to in order to properly support current operations, as well as preserve sufficient equity for
1 See “What is the Balanced Scorecard” at www.balancedscorecard.org/basics/bsc1.html.
future generations. This section is focused on measuring the reasonableness of the levels of investment funds thatinstitutions hold and the strategic investments made. This discussion has exacerbated in recent years due to thesignificant growth in the size of capital campaigns, as well as the volatility in the financial markets.
The allocation of resources to support the operating and capital activities at any point in time is a serious considera-tion for governing boards and institutional stewards. If resources are committed to operations and physical plant atan unsustainable rate, the conclusion from the action is that the current generation of students, faculty and staff areviewed as more significant than succeeding generations. If current commitments of resources are less than the insti-tution can afford on a sustainable basis, the opposite is true. In most environments, where institutions intend to thrivein the long run, neither is true. This discussion is not centered on whether an institution wants to make appropriateinvestments covering all generations, but rather what is the mechanism for knowing the level that represents this equi-librium.
The answer to the question of balance is not uniform since each institution is unique. Even within a particular insti-tution, the answer to this question will change as the conditions impacting the institution change. There are timeswhen significant investment—whether in people, facilities, programs or new initiatives—is required and times whenharvesting return from investments is most appropriate. The answer to this challenge is to find a systemic method ofmanaging the equitable distribution of support among generations of constituent institutions.
The endowment and similar funds of an institution are intended to support operations in perpetuity, regardlessof whether the funds are true endowment (permanently restricted or nonexpendable) or funds that function asendowment based on board action. While the true endowment funds of the institution are required to be held inperpetuity, the gains realized on these funds may be treated differently in different states. Compliance with the regu-lations that apply to an institution is the first step in creating a measurement framework. The overall standard that isconsistent from state to state, however, is that the board of the institution has a fiduciary responsibility over itsinvested funds.
Historically, at many institutions, governing boards have addressed this issue by implementing a spending policy that,based on historical experience and their own judgment, resulted in spending cash income and gains in proportion tothe expectation of returns anticipated to be realized over a long period of time. The concept of a spending policythat considers the overall returns of an investment portfolio continues to be central to many institutions’ operatingsupport and financial planning process. This spending rate is a component of operating activities, which is part of themeasures in the Net Operating Revenues Ratio, a key ratio we discuss later in this publication.
Events in the financial marketplace, which has seen volatile changes in asset values, coupled with substantial givingin an expansive philanthropic environment, have raised questions about the efficiency of relatively fixed rates ofspending. A second challenge has been the debate over the deployment of resources when an institution embarks ona transformational program.
As institutions implement their strategic plans, it is usually clear that certain investments will be required for the goalsto be met. Strategic plans usually envision significant fundraising to obtain resources needed for the plan’s invest-ments. A significant risk to accomplishing an aggressive capital campaign is the institution’s inability to fund themajor capital campaign because the expenses are funded from unrestricted, expendable sources, whereas the majorityof funds raised are for permanently restricted net assets (endowments) and unrestricted nonexpendable activities suchas property, plant and equipment. Other activities that generally demand investment include new program initiatives
18
• STRATEGIC FINANCIAL ANALYSIS FOR HIGHER EDUCATION •
CHAPTER TWO • USING THE OPERATING AND CAPITAL BUDGETS STRATEGICALLY
19
that need to be funded as start-ups before significant funds can be found, recruitment of new faculty, investments innew marketing approaches to attract students, and investment in infrastructure, including facilities and technology.
A FRAMEWORK FOR ALLOCATION
To systemically ensure the equitable allocation of resources between generations, a program such as the one formu-lated below may help in understanding the extent to which the institution has decided to maintain its retained equityas well as the size of the investment of its equity in relation to the institution’s overall wealth. The suggested frame-work is intended to cover the broad components of a program to assess the levels of investments that an institutionis making and create parameters that would keep the investments within those levels.
The proposed framework is based on separation of an institution’s equity into Retained Equity and Invested Equitycomponents. An institution should establish additional information in its accounting records related to endowmentand similar funds, separate from the invested amounts or other accounting classifications. This information shouldsegregate the invested funds into two categories—the Retained Equity, which is the targeted level the funds wouldbe at if all conditions below are met, and the Invested Equity, which represents the amounts that may be used as inter-nal investments. Together, these two components comprise the total investment funds of the institution. This resultsin the total of the Retained and Invested equity amounts equaling the equity in invested funds (composed of expend-able and nonexpendable funds, regardless of the net asset classification). A critical component of the frameworkincludes reconciling the investment balance at market with the total unrestricted, temporarily restricted and perma-nently restricted net assets for private institutions (expendable and nonexpendable net assets for public institutions)that comprise the investments. This is a critical element to the framework because it provides insight into the flexi-bility of net assets as well as sufficiency.
Retained Equity is the amount the institution would invest if specific criteria were met. At the start of the program, theRetained Equity equals the total invested funds of the institution. Over a period of years, the two amounts will likelydiverge as the actual results of activities, such as returns on investments and inflation, impact the Retained Equityamount.
The Retained Equity account may play a key role in helping an institution reshape the components of its revenuestream. For example, if an institution wished to become less dependent on tuition as a revenue source, one of theannual criteria for the Retained Equity would be to grow this amount by a fixed percentage of the opening balance.To the extent this amount was not met in that year, the shortfall would be reflected as a negative amount in theInvested Equity account, since this tactic represents an institutional investment.
The Invested Equity component represents the amounts approved by the board for investments in the institution.Examples of investments that may be made include funding capital campaigns and providing seed money for pro-gram initiatives. This Equity component also captures variations in the criteria established to develop target amountsfor the Retained Equity account.
The Invested Equity can be either positive or negative. When it is positive, it would indicate availability of funds forthe purposes previously approved by the board. We would expect those purposes to be limited to strategic initiatives.In fact, if this amount were to be positive for an extended number of years, it would be incumbent upon the boardto define the reasons it is holding these funds as opposed to investing in approved initiatives. When Invested Fundsare zero, the institution is in equilibrium.

20
• STRATEGIC FINANCIAL ANALYSIS FOR HIGHER EDUCATION •
Clearly, achieving financial equilibrium without advancing the mission-based activities contemplated by the strategicplan represents a shortfall for the organization.
The Invested Equity can become negative by making investments or if program criteria have not been met. The pro-gram requires parameters or caps on how negative the Invested Equity can become. When negative, the institutionhas a measure of how much of the institution’s future funds have been invested in current investments. Should theInvested Equity component stay negative, in significant amounts, for an extended period of time, the institutionshould assess whether investments made are meeting expected returns and this may limit further investments until aposition of equilibrium has been achieved.
Due to the long-term nature of investments and the length of an institution’s business cycle, it may be reasonable forInvested Funds to be “out of balance” for extended periods of time. The board should also be aware of reasons for theInvested Funds to be either positive or negative.
The following are some parameters that should be established as operating principles for this framework:
1. Establish an overall baseline of the institution’s investment funds in relation to both its strategic needs as well ascompetitors’ balances. If the total funds are considered deficient in relation to these measures, the programshould include a growth factor each year in the Retained Equity. To the extent this is not met, it would become,in effect, another investment for the institution. This provision would apply until the deficient condition iscorrected.
2. To protect purchasing power, the institution should index its Retained Equity on an annual basis by estimatingthe impact of inflation. This will require selecting a measure such as the Higher Education Price Index (HEPI)2
and applying it consistently. Institutions may consider using the growth in their total expenses because it repre-sents a reasonable proxy of both the impact of changes in the program as well as inflation—which is the realpurchasing power the institution may want to protect.
3. Establish a policy on the maximum size, both negative and positive, that the Invested Equity can represent ofthe Retained Equity. This would allow the board to always gauge how much it has available for strategic invest-ments and its position relative to equilibrium. If Invested Equity grows beyond the maximum level for anextended period of time, the board should challenge whether its current investment profile represents an under-investment in the present day. Similarly, if the fund exceeds the maximum negative amount for an extendedperiod of time, the implication is that the investments made exceed current affordability and may risk the avail-ability of resources for future generations.
4. Add amounts created from market returns in excess of steps 2 and 3 above to the Invested Equity, and deductmarket returns that do not meet the amounts expected from steps 2 and 3 from the Invested Equity that willneed to be replenished at a later date.
5. Establish dates that investments are expected to be returned, and if not met, how future investments should beallocated so that the amounts will be restored.
6. Establish the sources from which the returns are expected to be generated. These could include market appre-ciation or some return on the investments made (e.g., a fixed percentage of the spending rate on new moneygenerated if the investment is a capital campaign).
2 Commonfund Institute assumed management of HEPI in September 2004.

CHAPTER TWO • USING THE OPERATING AND CAPITAL BUDGETS STRATEGICALLY
New gifts are generally added to the Retained Equity and are not used as repayments to, or otherwise impact, theInvested Equity. Significant new gifts would increase the amounts of the thresholds of the Invested Equity, if statedas a percentage of the Retained Equity.
21
EXAMPLE 2.3: INTERGENERATIONAL EQUITY ALLOCATION
The following is an example of a program and the framework that might be used to monitor the institutionalcommitment to balancing its intergenerational equity allocation. The amounts shown in the schedule are takenfrom the financial statements of Utopia University (see Appendix B). Some amounts were not taken directlyfrom the financial statements; therefore, the institution’s records would be required to complete those portionsof the schedule.
For this program, assume the following:
1. The baseline date for creation of this fund is the beginning of the prior year.
2. Because the institution’s overall investment funds are deficient in relation to most of the competitive peerinstitutions, in addition to protecting purchasing power of existing funds, we will plan for fund growth,over a long period of time, at 1 percent above the inflation rate, excluding new gifts. This will be thestandard until our invested funds equal or exceed our operating expenses. At the point where ourinvested funds exceed our operating expenses, we will index growth to ensure retention of purchasingpower.
3. We will continue our program of taking 1 percent of the earnings on new endowment and similaramounts created from the Capital Campaign from the allocated earnings, until the earlier of the InvestedEquity reaches zero, or the amounts borrowed for the Capital Campaign are paid back.
4. We will use the Higher Education Inflation Index to measure the impact of inflation on our operations;for purposes of illustration, we are assuming 3 percent.
5. Policy will require that the Invested Equity will not exceed 10 percent of the Retained Equity amount.
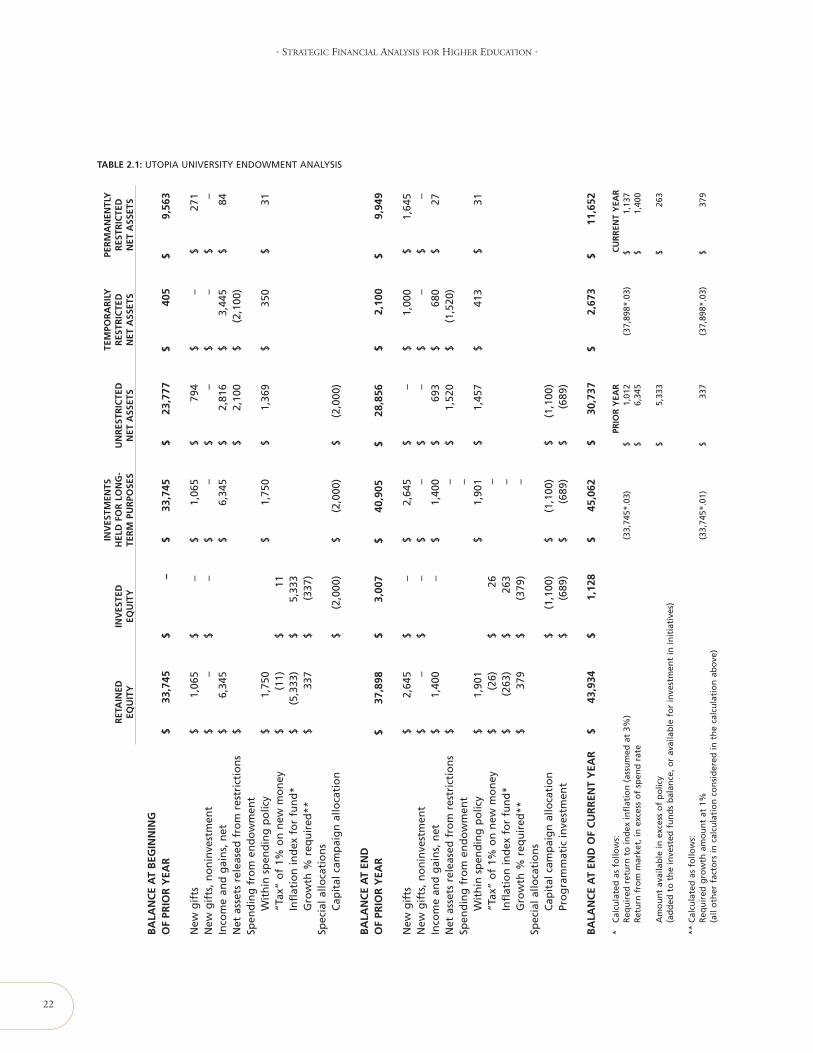
22
• STRATEGIC FINANCIAL ANALYSIS FOR HIGHER EDUCATION •
TABLE 2.1: UTOPIA UNIVERSITY ENDOWMENT ANALYSIS
INV
ESTM
ENTS
TEM
POR
AR
ILY
PER
MA
NEN
TLY
RET
AIN
EDIN
VES
TED
HEL
DFO
RLO
NG
-U
NR
ESTR
ICTE
DR
ESTR
ICTE
DR
ESTR
ICTE
DEQ
UIT
YEQ
UIT
YTE
RM
PUR
POSE
SN
ETA
SSET
SN
ETA
SSET
SN
ETA
SSET
S
BA
LAN
CE
AT
BEG
INN
ING
OF
PRIO
RY
EAR
$33
,745
$–
$33
,745
$23
,777
$40
5$
9,56
3
New
gif
ts$
1,06
5$
–$
1,06
5$
794
$–
$27
1N
ewg
ifts
,no
nin
vest
men
t$
–$
–$
–$
–$
–$
–In
com
ean
dg
ain
s,n
et$
6,34
5$
6,34
5$
2,81
6$
3,44
5$
84N
etas
sets
rele
ased
fro
mre
stri
ctio
ns
$$
2,10
0$
(2,1
00)
Spen
din
gfr
om
end
ow
men
tW
ith
insp
end
ing
po
licy
$1,
750
$1,
750
$1,
369
$35
0$
31“T
ax”
of
1%o
nn
ewm
on
ey$
(11)
$11
Infl
atio
nin
dex
for
fun
d*
$(5
,333
)$
5,33
3G
row
th%
req
uir
ed**
$33
7$
(337
)Sp
ecia
lallo
cati
on
sC
apit
alca
mp
aig
nal
loca
tio
n$
(2,0
00)
$(2
,000
)$
(2,0
00)
BA
LAN
CE
AT
END
OF
PRIO
RY
EAR
$37
,898
$3,
007
$40
,905
$28
,856
$2,
100
$9,
949
New
gif
ts$
2,64
5$
–$
2,64
5$
–$
1,00
0$
1,64
5N
ewg
ifts
,no
nin
vest
men
t$
–$
–$
–$
–$
–$
–In
com
ean
dg
ain
s,n
et$
1,40
0–
$1,
400
$69
3$
680
$27
Net
asse
tsre
leas
edfr
om
rest
rict
ion
s$
–$
1,52
0$
(1,5
20)
Spen
din
gfr
om
end
ow
men
t–
Wit
hin
spen
din
gp
olic
y$
1,90
1$
1,90
1$
1,45
7$
413
$31
“Tax
”o
f1%
on
new
mo
ney
$(2
6)$
26–
Infl
atio
nin
dex
for
fun
d*
$(2
63)
$26
3–
Gro
wth
%re
qu
ired
**$
379
$(3
79)
–Sp
ecia
lallo
cati
on
sC
apit
alca
mp
aig
nal
loca
tio
n$
(1,1
00)
$(1
,100
)$
(1,1
00)
Pro
gra
mm
atic
inve
stm
ent
$(6
89)
$(6
89)
$(6
89)
BA
LAN
CE
AT
END
OF
CU
RR
ENT
YEA
R$
43,9
34$
1,12
8$
45,0
62$
30,7
37$
2,67
3$
11,6
52
*C
alcu
late
das
follo
ws:
PRIO
RY
EAR
CU
RR
ENT
YEA
RR
equ
ired
retu
rnto
ind
exin
flat
ion
(ass
um
edat
3%)
(33,
745*
.03)
$1,
012
(37,
898*
.03)
$1,
137
Ret
urn
fro
mm
arke
t,in
exce
sso
fsp
end
rate
$6,
345
$1,
400
Am
ou
nt
avai
lab
lein
exce
sso
fp
olic
y$
5,33
3$
263
(ad
ded
toth
ein
vest
edfu
nd
sb
alan
ce,o
rav
aila
ble
for
inve
stm
ent
inin
itia
tive
s)
**C
alcu
late
das
follo
ws:
Req
uir
edg
row
tham
ou
nt
at1%
(33,
745*
.01)
$33
7(3
7,89
8*.0
3)$
379
(all
oth
erfa
cto
rsin
calc
ula
tio
nco
nsi
der
edin
the
calc
ula
tio
nab
ove
)
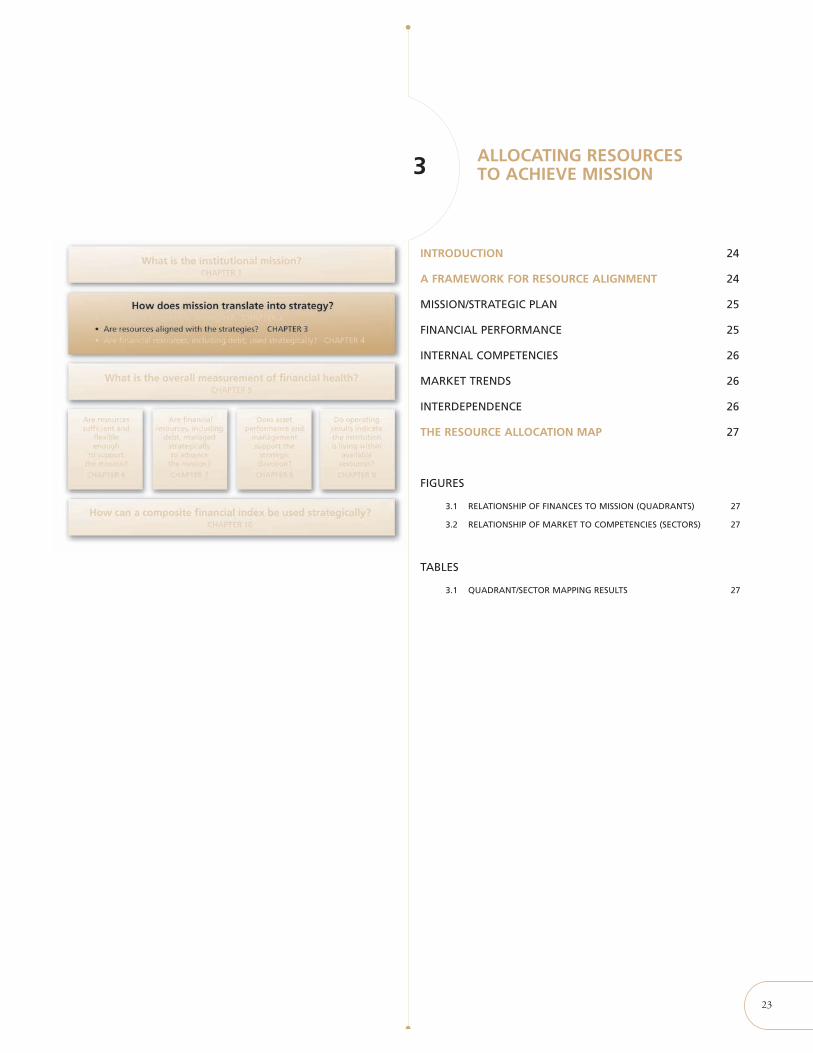
23
ALLOCATING RESOURCESTO ACHIEVE MISSION 3
INTRODUCTION 24
A FRAMEWORK FOR RESOURCE ALIGNMENT 24
MISSION/STRATEGIC PLAN 25
FINANCIAL PERFORMANCE 25
INTERNAL COMPETENCIES 26
MARKET TRENDS 26
INTERDEPENDENCE 26
THE RESOURCE ALLOCATION MAP 27
FIGURES
3.1 RELATIONSHIP OF FINANCES TO MISSION (QUADRANTS) 27
3.2 RELATIONSHIP OF MARKET TO COMPETENCIES (SECTORS) 27
TABLES
3.1 QUADRANT/SECTOR MAPPING RESULTS 27
ALLOCATING RESOURCES TO ACHIEVE MISSION 3
24
CHAPTER SUMMARY
An historic perspective often drives the concept of resource allocation and continued investment in selected programs. Thisbecomes problematic in dynamic environments when an institution is determining how to fund new initiatives, and evenwhich initiatives to fund. The approach offered in this chapter blends both external views (what is the market direction ofa program area, what are the competencies of the institution in each program area) with internal views (how does the pro-gram area match with the institutional mission and what are the financial results obtained by the program) to create amatrix that allows insight into the various programs the institution supports. This should help an institution as it determinesits longer-term programmatic commitments.
INTRODUCTION
As institutions better integrate their operating and capital budgets with their strategic plans, the strategic gap inbudgeting described in Chapter 2 becomes more clear. At some institutions, this strategic budget gap may be verypronounced and significant. Institutions will have to make difficult resource allocation decisions to achieve theirmission and plan goals. Institutions also have to be able to identify and measure the impact of external forces on theirplans. This assessment needs to be continuous rather than only performed during the plan’s creation.
Traditional planning approaches may miss a key step—a step that allows the institution to smoothly translate itsmission into a strategy with a high probability of success. In this chapter, we present a mechanism for filling this gapby effectively managing resource allocation. The Resource Allocation Map is a framework that enables leaders to assesskey components and variables that will impact successful implementation of the strategic plan. This framework is alsouseful as a reference point as the institution selects the tactics needed to turn strategies into action.
Theoretically, resource allocation is a simple matter of knowledgeable people making informed decisions that alignthe institution’s resources with its goals. In practice, it is far more complex—particularly for higher education, whichoperates on multiyear business cycles and serves diverse stakeholders and purposes.
A resource allocation framework can fill this gap in strategy implementation in higher education, helping decisionmakers determine where to invest limited resources to achieve the greatest good. At the highest level, this means bal-ancing internal values with external pressures. Understanding and managing both sides of this equation are essentialfor institutional well-being; those institutions that ignore market forces risk financial difficulty, while those that ne-glect internal values risk becoming a commodity business because there would be no differentiation in their offerings.
A FRAMEWORK FOR RESOURCE ALIGNMENT
Developed specifically for public and private higher education institutions, this framework is designed to help insti-tutions map resources to anticipated results. It can be used to assess any level—school, division, department, pro-gram or institute—as long as the organizational unit is consistent across the institution. However, the use of theframework must be customized to the institution’s unique mission and characteristics.
CHAPTER THREE • ALLOCATING RESOURCES TO ACHIEVE MISSION
25
Recognizing that higher education is too diverse for a single formula, we have created a Resource Allocation Map thatcan be adapted to an institution’s unique circumstances and desired direction. The ultimate goal is to help an insti-tution consistently move in the direction to which it is committed. By inserting this framework into the strategicplanning process between the creation of the institutional vision and the strategic plan, leaders can build a strong casefor where resources should be allocated—and why.
Our experience has indicated that few institutions believe they have the resources to fully fund all potential activitiesor even all programmatic areas they currently attempt to support. Yet, their allocation of resources follows more a pat-tern of incremental behavior that is based on history rather than strategy. The Resource Allocation Map is intendedto suggest effective actions given certain circumstances, not to provide absolute answers in terms of reallocatingresources away from or toward a specific unit. It is built around four dimensions that can help leaders align resourceswith the institution’s long-term strategic direction:
• Mission/strategic plan
• Financial performance
• Internal competencies
• Market trends
MISSION/STRATEGIC PLAN
While everyone talks about the importance of mission, the difficulty lies in translating mission into actionableplans. Mission is not just what the institution is and does; it is what the institution wants to become. This shouldbe the guiding force that drives everything else; in fact, it represents the key determinant of an institution’s ability tosucceed.
Depending on the institution, “mission critical” may be measured in terms of lines of business (teaching, research,public service) or disciplines (arts and sciences, business, education, graduate programs). Measurement can bedirected toward the beneficiaries of the institution, such as measuring student success (graduation rates), program-matic improvement (retention rates or perhaps enrollment yield), or faculty development (percentage change in fac-ulty terminal degrees, publishing proclivity). Whatever the focus, mission should be defined in clear, compelling,measurable terms that spur commitment and action.
Articulating a mission that achieves this goal is not a simple matter. For example, a mission of “educating students”is so broad, it cannot coalesce people around a specific set of actions. Conversely, a mission that is too narrow, suchas becoming the preeminent provider of creative writing instruction, may preclude active participation by a large por-tion of the institution. If the mission is not specific enough to provide relevant guidance, the institution may wish tosubstitute the strategic plan as a guide.
FINANCIAL PERFORMANCE
As mission is the institutional driver, financial health is the measure of affordability. Affordability is a delicate matter;while this issue should not drive decisions, ignoring it could jeopardize the entire institution. It may be entirely appro-priate to support initiatives that do not have a quantifiable return; however, leaders must appreciate the institutionalimpact of diverting resources from other areas.

26
• STRATEGIC FINANCIAL ANALYSIS FOR HIGHER EDUCATION •
Financial performance can be measured in many ways, depending on what the institution views as critical. Thecriteria for financial success are institution-specific and may be the result of a combination of factors, such asoperating results, budget size, return on net assets, and so on. A few high-level measures, consistently used, willprovide the best indication of financial performance.
INTERNAL COMPETENCIES
To effectively manage resource allocation, leaders must also have a clear understanding of what the institution doeswell (or can do well), what it is known for and how it compares to its peers.
Competency refers to the accumulated value of resources, programs, processes, relationships, infrastructure and abil-ities of faculty, staff, students and other stakeholders. To maintain competencies or improve them, the institutionmust have a plan for identifying and quantifying human and capital investments—and a plan for generating orreallocating funds to these investments.
MARKET TRENDS
Which programs are hot? Which are not? What does this mean for the institution? Is the market large enoughto support the strategy? Questions like these must be answered to understand the impact of outside forces on theinstitution.
Market trend analysis provides an external view of the institution based on data such as the direction of researchfunding, demand for particular programs and demographic changes in the student body. Measures may vary fromcampus to campus but should identify the criteria most important to the institution and support that view withempirical evidence. Examples include the National Institutes of Health (NIH) and the National Science Foundation(NSF) funding at the programmatic level (if that is the critical unit of measure) and numbers of matriculatingstudents in programs.
This is not to say that market forces should determine institutional spending decisions. On the contrary, we see it asone element that, when paired with the others, can help answer important questions.
INTERDEPENDENCE
The highest and best value of using this framework lies in the interdependence of all four parts: mission, finances,internal competencies and market trends. Assessing programmatic areas along these parameters creates a map that canhelp align resources to produce the greatest gains.
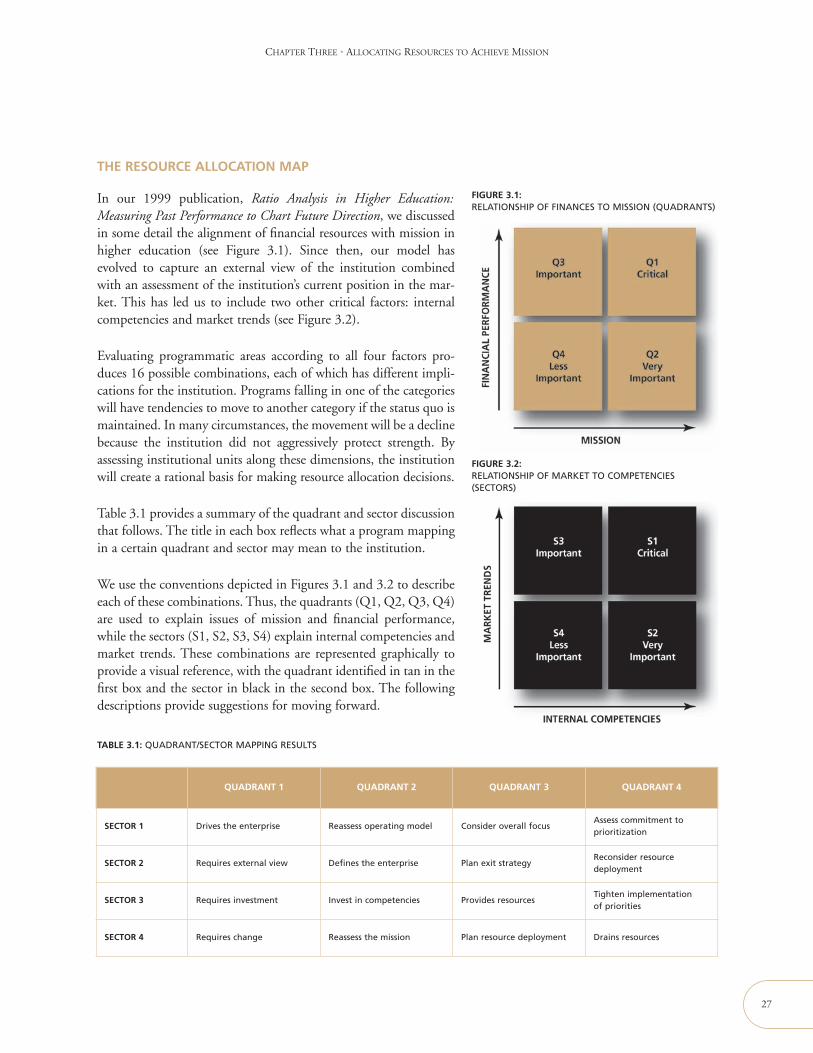
CHAPTER THREE • ALLOCATING RESOURCES TO ACHIEVE MISSION
27
QUADRANT 1 QUADRANT 2 QUADRANT 3 QUADRANT 4
SECTOR 1 Drives the enterprise Reassess operating model Consider overall focusAssess commitment toprioritization
SECTOR 2 Requires external view Defines the enterprise Plan exit strategyReconsider resourcedeployment
SECTOR 3 Requires investment Invest in competencies Provides resourcesTighten implementationof priorities
SECTOR 4 Requires change Reassess the mission Plan resource deployment Drains resources
TABLE 3.1: QUADRANT/SECTOR MAPPING RESULTS
THE RESOURCE ALLOCATION MAP
In our 1999 publication, Ratio Analysis in Higher Education:Measuring Past Performance to Chart Future Direction, we discussedin some detail the alignment of financial resources with mission inhigher education (see Figure 3.1). Since then, our model hasevolved to capture an external view of the institution combinedwith an assessment of the institution’s current position in the mar-ket. This has led us to include two other critical factors: internalcompetencies and market trends (see Figure 3.2).
Evaluating programmatic areas according to all four factors pro-duces 16 possible combinations, each of which has different impli-cations for the institution. Programs falling in one of the categorieswill have tendencies to move to another category if the status quo ismaintained. In many circumstances, the movement will be a declinebecause the institution did not aggressively protect strength. Byassessing institutional units along these dimensions, the institutionwill create a rational basis for making resource allocation decisions.
Table 3.1 provides a summary of the quadrant and sector discussionthat follows. The title in each box reflects what a program mappingin a certain quadrant and sector may mean to the institution.
We use the conventions depicted in Figures 3.1 and 3.2 to describeeach of these combinations. Thus, the quadrants (Q1, Q2, Q3, Q4)are used to explain issues of mission and financial performance,while the sectors (S1, S2, S3, S4) explain internal competencies andmarket trends. These combinations are represented graphically toprovide a visual reference, with the quadrant identified in tan in thefirst box and the sector in black in the second box. The followingdescriptions provide suggestions for moving forward.
FIGURE 3.1:RELATIONSHIP OF FINANCES TO MISSION (QUADRANTS)
FIGURE 3.2:RELATIONSHIP OF MARKET TO COMPETENCIES(SECTORS)
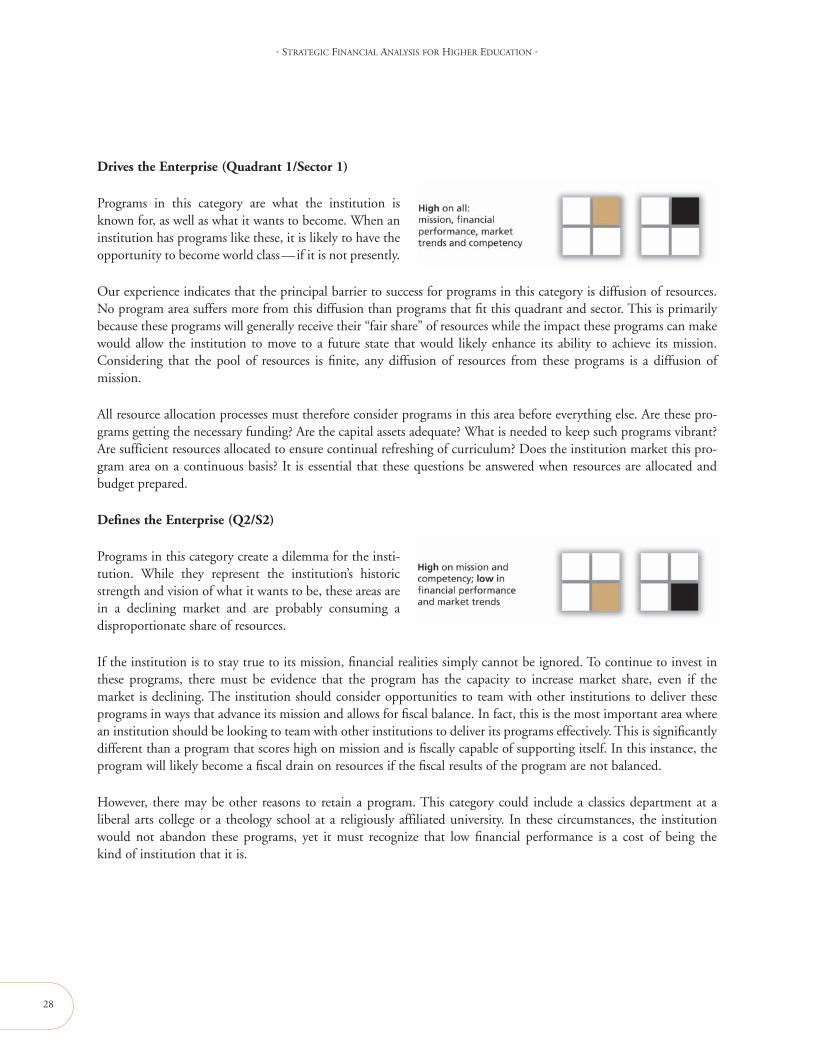
28
• STRATEGIC FINANCIAL ANALYSIS FOR HIGHER EDUCATION •
Drives the Enterprise (Quadrant 1/Sector 1)
Programs in this category are what the institution isknown for, as well as what it wants to become. When aninstitution has programs like these, it is likely to have theopportunity to become world class—if it is not presently.
Our experience indicates that the principal barrier to success for programs in this category is diffusion of resources.No program area suffers more from this diffusion than programs that fit this quadrant and sector. This is primarilybecause these programs will generally receive their “fair share” of resources while the impact these programs can makewould allow the institution to move to a future state that would likely enhance its ability to achieve its mission.Considering that the pool of resources is finite, any diffusion of resources from these programs is a diffusion ofmission.
All resource allocation processes must therefore consider programs in this area before everything else. Are these pro-grams getting the necessary funding? Are the capital assets adequate? What is needed to keep such programs vibrant?Are sufficient resources allocated to ensure continual refreshing of curriculum? Does the institution market this pro-gram area on a continuous basis? It is essential that these questions be answered when resources are allocated andbudget prepared.
Defines the Enterprise (Q2/S2)
Programs in this category create a dilemma for the insti-tution. While they represent the institution’s historicstrength and vision of what it wants to be, these areas arein a declining market and are probably consuming adisproportionate share of resources.
If the institution is to stay true to its mission, financial realities simply cannot be ignored. To continue to invest inthese programs, there must be evidence that the program has the capacity to increase market share, even if themarket is declining. The institution should consider opportunities to team with other institutions to deliver theseprograms in ways that advance its mission and allows for fiscal balance. In fact, this is the most important area wherean institution should be looking to team with other institutions to deliver its programs effectively. This is significantlydifferent than a program that scores high on mission and is fiscally capable of supporting itself. In this instance, theprogram will likely become a fiscal drain on resources if the fiscal results of the program are not balanced.
However, there may be other reasons to retain a program. This category could include a classics department at aliberal arts college or a theology school at a religiously affiliated university. In these circumstances, the institutionwould not abandon these programs, yet it must recognize that low financial performance is a cost of being thekind of institution that it is.
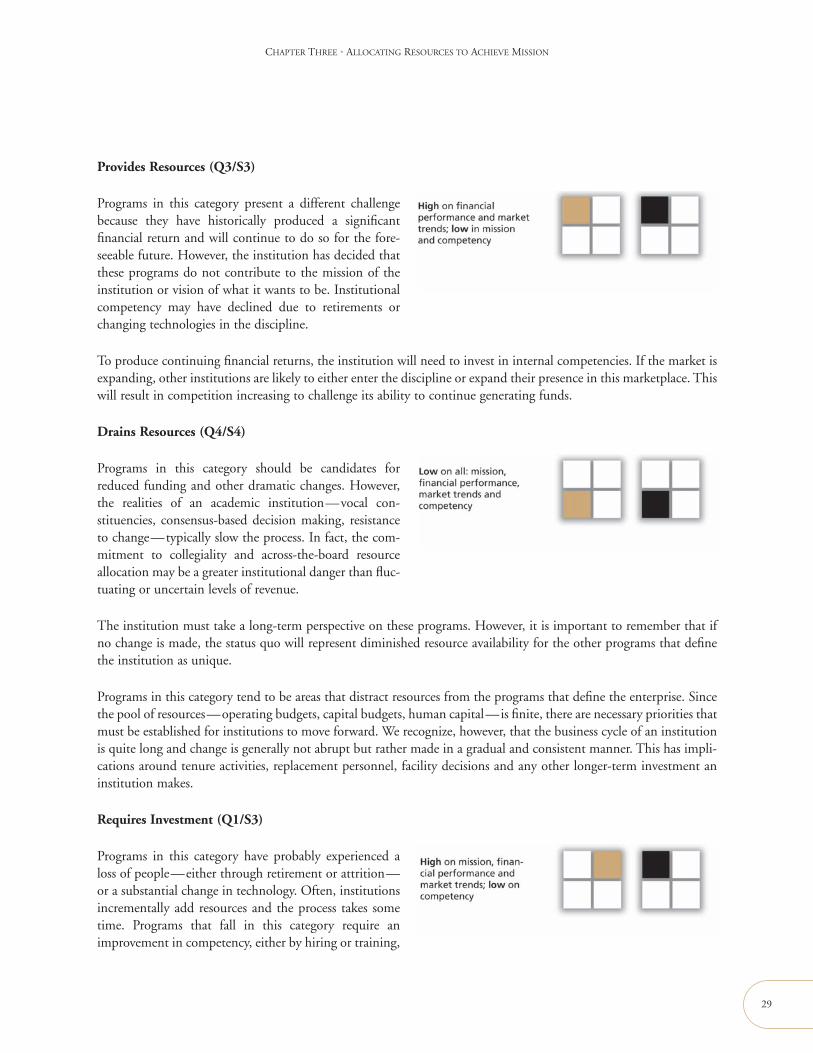
CHAPTER THREE • ALLOCATING RESOURCES TO ACHIEVE MISSION
Provides Resources (Q3/S3)
Programs in this category present a different challengebecause they have historically produced a significantfinancial return and will continue to do so for the fore-seeable future. However, the institution has decided thatthese programs do not contribute to the mission of theinstitution or vision of what it wants to be. Institutionalcompetency may have declined due to retirements orchanging technologies in the discipline.
To produce continuing financial returns, the institution will need to invest in internal competencies. If the market isexpanding, other institutions are likely to either enter the discipline or expand their presence in this marketplace. Thiswill result in competition increasing to challenge its ability to continue generating funds.
Drains Resources (Q4/S4)
Programs in this category should be candidates forreduced funding and other dramatic changes. However,the realities of an academic institution—vocal con-stituencies, consensus-based decision making, resistanceto change—typically slow the process. In fact, the com-mitment to collegiality and across-the-board resourceallocation may be a greater institutional danger than fluc-tuating or uncertain levels of revenue.
The institution must take a long-term perspective on these programs. However, it is important to remember that ifno change is made, the status quo will represent diminished resource availability for the other programs that definethe institution as unique.
Programs in this category tend to be areas that distract resources from the programs that define the enterprise. Sincethe pool of resources—operating budgets, capital budgets, human capital—is finite, there are necessary priorities thatmust be established for institutions to move forward. We recognize, however, that the business cycle of an institutionis quite long and change is generally not abrupt but rather made in a gradual and consistent manner. This has impli-cations around tenure activities, replacement personnel, facility decisions and any other longer-term investment aninstitution makes.
Requires Investment (Q1/S3)
Programs in this category have probably experienced aloss of people—either through retirement or attrition—or a substantial change in technology. Often, institutionsincrementally add resources and the process takes sometime. Programs that fall in this category require animprovement in competency, either by hiring or training,
29
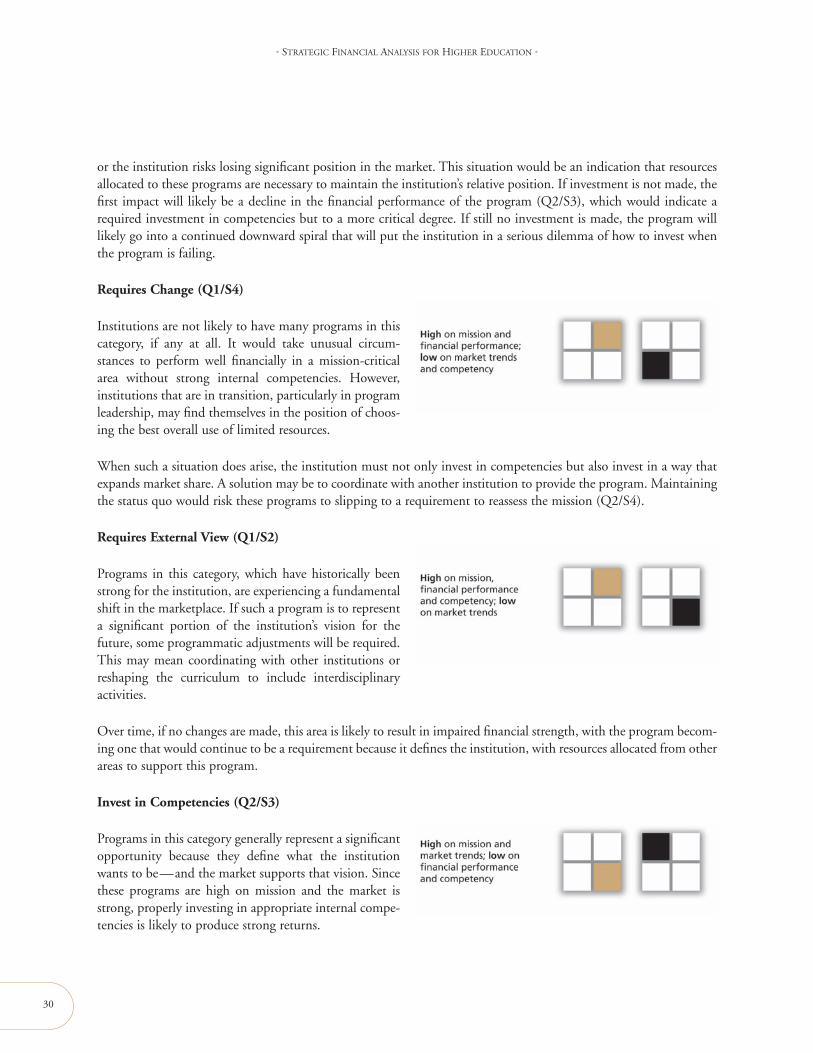
30
• STRATEGIC FINANCIAL ANALYSIS FOR HIGHER EDUCATION •
or the institution risks losing significant position in the market. This situation would be an indication that resourcesallocated to these programs are necessary to maintain the institution’s relative position. If investment is not made, thefirst impact will likely be a decline in the financial performance of the program (Q2/S3), which would indicate arequired investment in competencies but to a more critical degree. If still no investment is made, the program willlikely go into a continued downward spiral that will put the institution in a serious dilemma of how to invest whenthe program is failing.
Requires Change (Q1/S4)
Institutions are not likely to have many programs in thiscategory, if any at all. It would take unusual circum-stances to perform well financially in a mission-criticalarea without strong internal competencies. However,institutions that are in transition, particularly in programleadership, may find themselves in the position of choos-ing the best overall use of limited resources.
When such a situation does arise, the institution must not only invest in competencies but also invest in a way thatexpands market share. A solution may be to coordinate with another institution to provide the program. Maintainingthe status quo would risk these programs to slipping to a requirement to reassess the mission (Q2/S4).
Requires External View (Q1/S2)
Programs in this category, which have historically beenstrong for the institution, are experiencing a fundamentalshift in the marketplace. If such a program is to representa significant portion of the institution’s vision for thefuture, some programmatic adjustments will be required.This may mean coordinating with other institutions orreshaping the curriculum to include interdisciplinaryactivities.
Over time, if no changes are made, this area is likely to result in impaired financial strength, with the program becom-ing one that would continue to be a requirement because it defines the institution, with resources allocated from otherareas to support this program.
Invest in Competencies (Q2/S3)
Programs in this category generally represent a significantopportunity because they define what the institutionwants to be—and the market supports that vision. Sincethese programs are high on mission and the market isstrong, properly investing in appropriate internal compe-tencies is likely to produce strong returns.
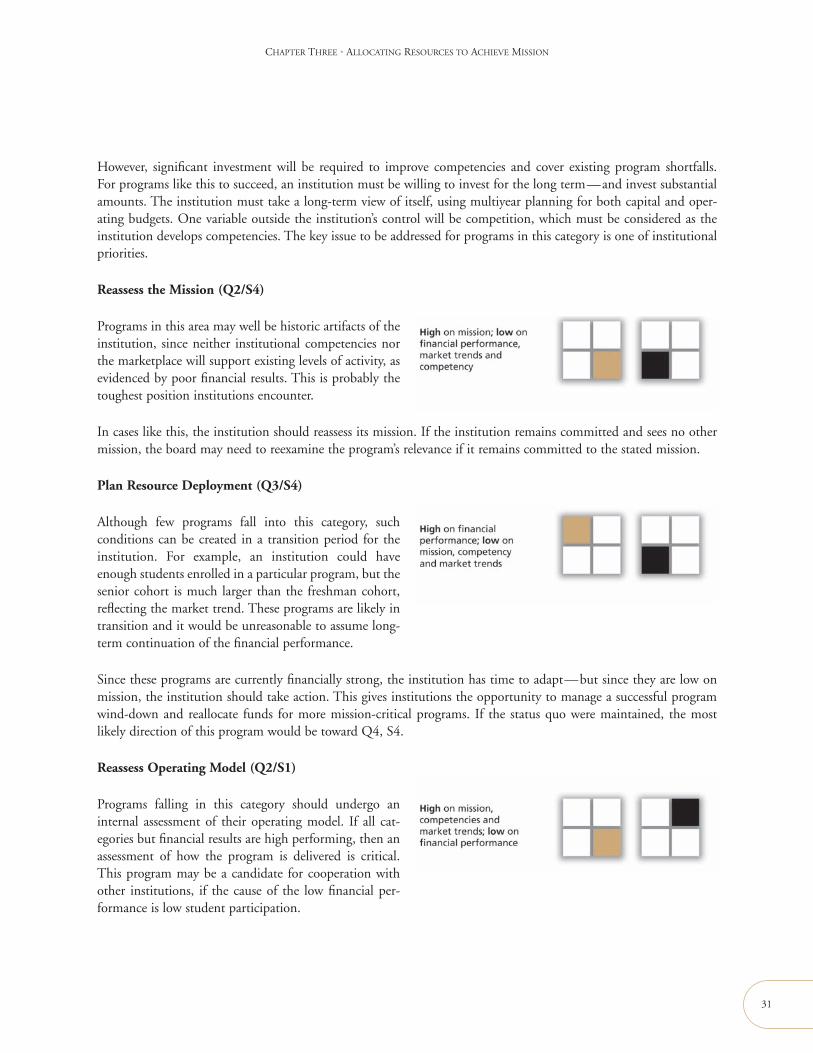
CHAPTER THREE • ALLOCATING RESOURCES TO ACHIEVE MISSION
However, significant investment will be required to improve competencies and cover existing program shortfalls.For programs like this to succeed, an institution must be willing to invest for the long term—and invest substantialamounts. The institution must take a long-term view of itself, using multiyear planning for both capital and oper-ating budgets. One variable outside the institution’s control will be competition, which must be considered as theinstitution develops competencies. The key issue to be addressed for programs in this category is one of institutionalpriorities.
Reassess the Mission (Q2/S4)
Programs in this area may well be historic artifacts of theinstitution, since neither institutional competencies northe marketplace will support existing levels of activity, asevidenced by poor financial results. This is probably thetoughest position institutions encounter.
In cases like this, the institution should reassess its mission. If the institution remains committed and sees no othermission, the board may need to reexamine the program’s relevance if it remains committed to the stated mission.
Plan Resource Deployment (Q3/S4)
Although few programs fall into this category, suchconditions can be created in a transition period for theinstitution. For example, an institution could haveenough students enrolled in a particular program, but thesenior cohort is much larger than the freshman cohort,reflecting the market trend. These programs are likely intransition and it would be unreasonable to assume long-term continuation of the financial performance.
Since these programs are currently financially strong, the institution has time to adapt—but since they are low onmission, the institution should take action. This gives institutions the opportunity to manage a successful programwind-down and reallocate funds for more mission-critical programs. If the status quo were maintained, the mostlikely direction of this program would be toward Q4, S4.
Reassess Operating Model (Q2/S1)
Programs falling in this category should undergo aninternal assessment of their operating model. If all cat-egories but financial results are high performing, then anassessment of how the program is delivered is critical.This program may be a candidate for cooperation withother institutions, if the cause of the low financial per-formance is low student participation.
31
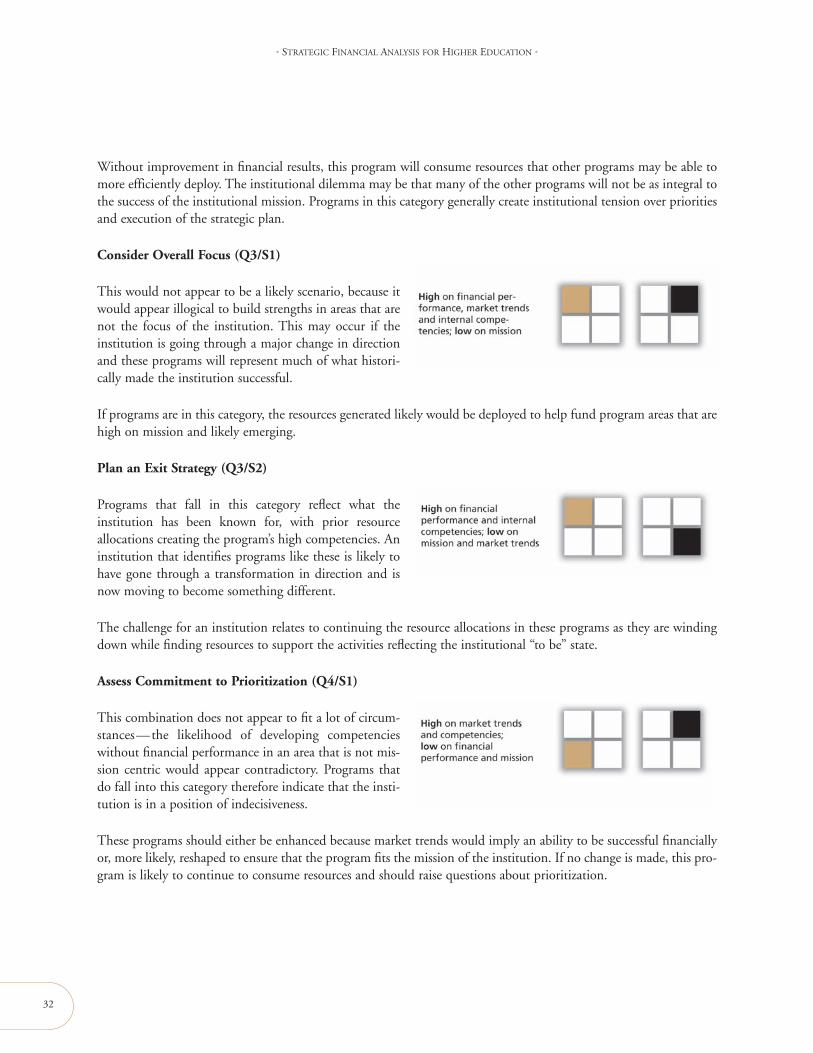
32
• STRATEGIC FINANCIAL ANALYSIS FOR HIGHER EDUCATION •
Without improvement in financial results, this program will consume resources that other programs may be able tomore efficiently deploy. The institutional dilemma may be that many of the other programs will not be as integral tothe success of the institutional mission. Programs in this category generally create institutional tension over prioritiesand execution of the strategic plan.
Consider Overall Focus (Q3/S1)
This would not appear to be a likely scenario, because itwould appear illogical to build strengths in areas that arenot the focus of the institution. This may occur if theinstitution is going through a major change in directionand these programs will represent much of what histori-cally made the institution successful.
If programs are in this category, the resources generated likely would be deployed to help fund program areas that arehigh on mission and likely emerging.
Plan an Exit Strategy (Q3/S2)
Programs that fall in this category reflect what theinstitution has been known for, with prior resourceallocations creating the program’s high competencies. Aninstitution that identifies programs like these is likely tohave gone through a transformation in direction and isnow moving to become something different.
The challenge for an institution relates to continuing the resource allocations in these programs as they are windingdown while finding resources to support the activities reflecting the institutional “to be” state.
Assess Commitment to Prioritization (Q4/S1)
This combination does not appear to fit a lot of circum-stances—the likelihood of developing competencieswithout financial performance in an area that is not mis-sion centric would appear contradictory. Programs thatdo fall into this category therefore indicate that the insti-tution is in a position of indecisiveness.
These programs should either be enhanced because market trends would imply an ability to be successful financiallyor, more likely, reshaped to ensure that the program fits the mission of the institution. If no change is made, this pro-gram is likely to continue to consume resources and should raise questions about prioritization.
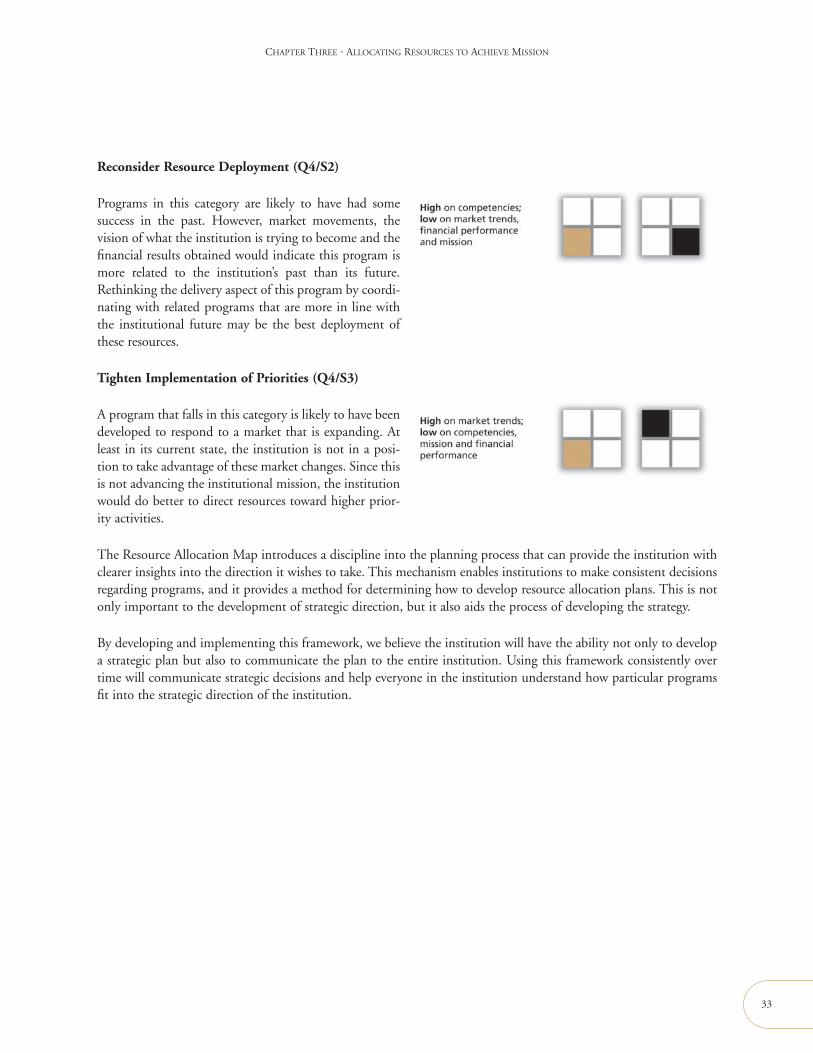
CHAPTER THREE • ALLOCATING RESOURCES TO ACHIEVE MISSION
Reconsider Resource Deployment (Q4/S2)
Programs in this category are likely to have had somesuccess in the past. However, market movements, thevision of what the institution is trying to become and thefinancial results obtained would indicate this program ismore related to the institution’s past than its future.Rethinking the delivery aspect of this program by coordi-nating with related programs that are more in line withthe institutional future may be the best deployment ofthese resources.
Tighten Implementation of Priorities (Q4/S3)
A program that falls in this category is likely to have beendeveloped to respond to a market that is expanding. Atleast in its current state, the institution is not in a posi-tion to take advantage of these market changes. Since thisis not advancing the institutional mission, the institutionwould do better to direct resources toward higher prior-ity activities.
The Resource Allocation Map introduces a discipline into the planning process that can provide the institution withclearer insights into the direction it wishes to take. This mechanism enables institutions to make consistent decisionsregarding programs, and it provides a method for determining how to develop resource allocation plans. This is notonly important to the development of strategic direction, but it also aids the process of developing the strategy.
By developing and implementing this framework, we believe the institution will have the ability not only to developa strategic plan but also to communicate the plan to the entire institution. Using this framework consistently overtime will communicate strategic decisions and help everyone in the institution understand how particular programsfit into the strategic direction of the institution.
33

STRATEGIC DEBT MANAGEMENT
35
4
INTRODUCTION 36
DEFINITION OF DEBT 37
DEBT AFFORDABILITY INSTEAD OF DEBT CAPACITY 37
EXTERNAL VERSUS INTERNAL MANAGEMENTOF DEBT 39
IMPLEMENTING A DEBT POLICY 39
CREATING A DEBT POLICY 40
DEVELOPING A DEBT POLICY 40
USE OF DEBT VERSUS WORKING CAPITAL 42
FINANCIAL RATIOS WITHIN THE CONTEXTOF CREDIT ANALYSIS 43
FIGURES
4.1 LINKING DEBT POLICY TO THE MISSION 40
4.2 REPRESENTATIVE DETERMINANTS OF EXTERNALCREDIT PROFILE 44

STRATEGIC DEBT MANAGEMENT4
36
CHAPTER SUMMARY
Debt is a critical component of the resources available to an institution to fund capital projects. Used strategically and undera program designed to maximize the use of debt to achieve institutional goals increases the likelihood of an institution meet-ing its mission. An agreed to and well-understood debt policy will assist an institution in funding the projects that arethe “best in line,” not necessarily the “next in line.” A consistently applied debt policy should result in better alignment offunding priorities with strategy over a long period of time.
INTRODUCTION
What is meant by the term, the strategic management of debt? Traditional debt management focuses on issuingproject-specific debt instruments or other financial transactions. Strategic debt management concerns internalprioritization, budgeting and strategic planning, focusing on institutional policies, internal procedures, project priori-tization and funding decisions. This results in transactions that are structured based on the management of the entiredebt portfolio and in consideration of the institution’s total resources. With the growing array and complexity ofavailable financial products, the continuing pressure for facilities, and increasing focus on balance sheet management,senior institutional leaders’ responsibilities continue to multiply, resulting in an increased need for policies, analyticaltools and a framework for decision making.
Focusing on how managing debt can advance the institution’s mission will also help the institution understand howanalysts, lenders and purchasers of debt evaluate its ability to assume and repay debt. If the debt that is incurred isused to support the mission and the institution is well managed, the institution will be in a better position to achieveits long-term goals and build competitive advantages. In contrast, if the debt is used to fund activities that do notcapitalize on its competitive strengths, the financial situation is likely to erode because resources have not been allo-cated to their highest and best use. Thus, the institution would be further away from having the resources needed toachieve its strategic objectives and is more likely to have lost crucial ground in the competition for students, facultyand financial support. If the institution remains focused on its mission, it can use its leverage effectively to deployadditional resources to achieve its long-term goals.
This chapter discusses several aspects of strategic debt management, including:
• Definition of debt
• Debt affordability instead of debt capacity
• External versus internal management of debt
• Implementing a debt policy
• Use of debt versus working capital
• Financial ratios within the context of credit analysis

CHAPTER FOUR • STRATEGIC DEBT MANAGEMENT
37
DEFINITION OF DEBT
At one time it was relatively simple to determine an answer to the question, What is the amount of institutional debt?One simply looked at the bonds and notes payable in the financial statements. Today, this is no longer a simple orstraightforward inquiry. Many innovative financing structures have been developed and are more frequently used byhigher education institutions. In addition to traditional bonds, notes and capital leases, an institution may have usedan affiliated foundation or subsidiary to access financing, executed long-term operating leases, guaranteed an affili-ate’s debt or employed off-balance sheet structures. Add to this the fact that “debt” often is in the eye of the beholder,and many different stakeholders may define debt differently. Therefore, it is important that the institution thoroughlyanalyzes its obligations and determines the most appropriate debt measure for itself, which may include adding non-traditional debt and perhaps also considering excluding more traditional debt, depending on its use. In any case, adefinition that is thoughtful, strategic and applied consistently over time is appropriate.
In considering debt, particularly in assessing an institution’s long-term ability to achieve its mission, all obligationsthat use an institution’s long-term debt capacity, even if these transactions are not reported on the balance sheet ordisclosed in the notes to the financial statements, should be included. The ultimate test of what constitutes outstand-ing debt from a credit perspective is neither the legal structure nor the accounting treatment. The greater the essen-tiality of the asset to an institution’s mission, the greater the likelihood it is on-credit and therefore must be includedin calculating all credit ratios, regardless of the legal and accounting treatment.
As with any financial decision, we encourage leaders to ask why a specific financial structure is being considered andto understand its objectives, expected benefits and potential risks. For example, there may be many valid reasons toengage a third-party developer or use long-term lease structures; however, if the primary or sole motivation for aparticular financing structure, especially one that is more costly, is to keep a transaction off the balance sheet and awayfrom the credit analysts, then the transaction, rather than the institution’s mission, is driving the decision.Furthermore, in recent years we have witnessed the migration of many off-balance sheet structures onto the institu-tion’s balance sheet, and the inclusion of many of these structures in credit analysis. We believe that this trend is likelyto continue, which underscores the need for mission and strategy, rather than accounting and law, to drive financingdecisions.
Similarly, there may be types of debt employed for nonproject purposes. This may include leverage in the endow-ment, draws on an operating line or commercial paper program for nonproject purposes, opportunistic short-termborrowings, etc. While technically debt and subject to institutional analysis, these uses should not be included in thecalculations of various ratios that are based on project-related debt.
After making these adjustments, a more appropriate picture of the institution’s liabilities emerges, which may differconsiderably from the long-term debt indicated on the balance sheet. Thus, a concept of total project-related debt,which adds nondebt uses of credit (e.g., off-balance sheet borrowings, guarantees of affiliates) and subtracts non-capital uses of debt, is a better measure for use in calculating many ratios.
DEBT AFFORDABILITY INSTEAD OF DEBT CAPACITY
While debt may provide a significant source of additional funding, it is also a burden for future generations forced toassume responsibility for principal and interest payments for past projects or faced with diminished debt capacity fornew priorities. Planning for additional debt must be done with care since the cost of a new facility is not only debt
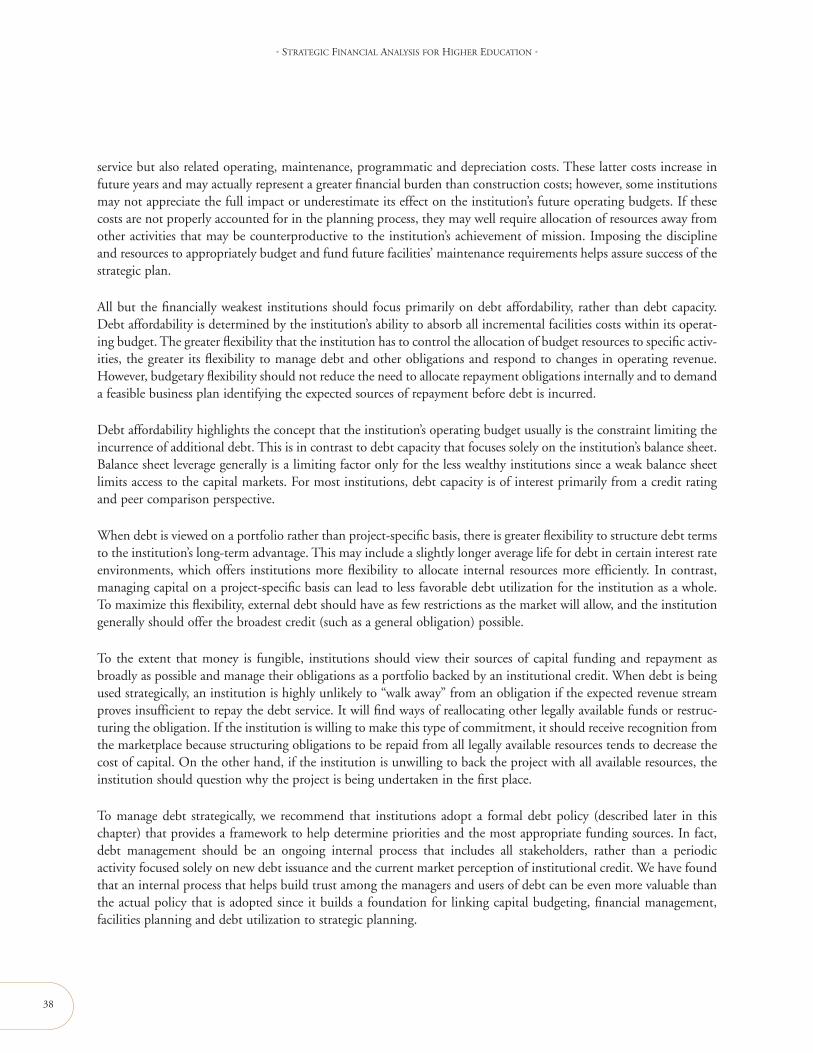
38
• STRATEGIC FINANCIAL ANALYSIS FOR HIGHER EDUCATION •
service but also related operating, maintenance, programmatic and depreciation costs. These latter costs increase infuture years and may actually represent a greater financial burden than construction costs; however, some institutionsmay not appreciate the full impact or underestimate its effect on the institution’s future operating budgets. If thesecosts are not properly accounted for in the planning process, they may well require allocation of resources away fromother activities that may be counterproductive to the institution’s achievement of mission. Imposing the disciplineand resources to appropriately budget and fund future facilities’ maintenance requirements helps assure success of thestrategic plan.
All but the financially weakest institutions should focus primarily on debt affordability, rather than debt capacity.Debt affordability is determined by the institution’s ability to absorb all incremental facilities costs within its operat-ing budget. The greater flexibility that the institution has to control the allocation of budget resources to specific activ-ities, the greater its flexibility to manage debt and other obligations and respond to changes in operating revenue.However, budgetary flexibility should not reduce the need to allocate repayment obligations internally and to demanda feasible business plan identifying the expected sources of repayment before debt is incurred.
Debt affordability highlights the concept that the institution’s operating budget usually is the constraint limiting theincurrence of additional debt. This is in contrast to debt capacity that focuses solely on the institution’s balance sheet.Balance sheet leverage generally is a limiting factor only for the less wealthy institutions since a weak balance sheetlimits access to the capital markets. For most institutions, debt capacity is of interest primarily from a credit ratingand peer comparison perspective.
When debt is viewed on a portfolio rather than project-specific basis, there is greater flexibility to structure debt termsto the institution’s long-term advantage. This may include a slightly longer average life for debt in certain interest rateenvironments, which offers institutions more flexibility to allocate internal resources more efficiently. In contrast,managing capital on a project-specific basis can lead to less favorable debt utilization for the institution as a whole.To maximize this flexibility, external debt should have as few restrictions as the market will allow, and the institutiongenerally should offer the broadest credit (such as a general obligation) possible.
To the extent that money is fungible, institutions should view their sources of capital funding and repayment asbroadly as possible and manage their obligations as a portfolio backed by an institutional credit. When debt is beingused strategically, an institution is highly unlikely to “walk away” from an obligation if the expected revenue streamproves insufficient to repay the debt service. It will find ways of reallocating other legally available funds or restruc-turing the obligation. If the institution is willing to make this type of commitment, it should receive recognition fromthe marketplace because structuring obligations to be repaid from all legally available resources tends to decrease thecost of capital. On the other hand, if the institution is unwilling to back the project with all available resources, theinstitution should question why the project is being undertaken in the first place.
To manage debt strategically, we recommend that institutions adopt a formal debt policy (described later in thischapter) that provides a framework to help determine priorities and the most appropriate funding sources. In fact,debt management should be an ongoing internal process that includes all stakeholders, rather than a periodicactivity focused solely on new debt issuance and the current market perception of institutional credit. We have foundthat an internal process that helps build trust among the managers and users of debt can be even more valuable thanthe actual policy that is adopted since it builds a foundation for linking capital budgeting, financial management,facilities planning and debt utilization to strategic planning.
CHAPTER FOUR • STRATEGIC DEBT MANAGEMENT
39
EXTERNAL VERSUS INTERNAL MANAGEMENT OF DEBT
Typically, institutions have issued and managed debt and allocated debt service costs on a project-by-project basis.Thus, a project’s debt service cost may be based on luck, prevailing market conditions and the type of fundingemployed (e.g., equity, gifts, tax-exempt debt, taxable debt, third-party loans, fixed or variable obligations, etc.).
This project-based financing approach makes budgeting and project planning extremely difficult and can lead toinequities among various institutional divisions. Increasingly, public and private institutions have approached theissue of internal management of debt by adopting a more corporate view of debt and the treasury function byhaving the institution function as a central bank and lend debt proceeds to individual departments or schools tofinance projects at a common repayment rate. This method of disbursement can help alleviate the problem of fund-ing timing and produce benefits such as reduced year-to-year budget variances; external debt that can be structuredto optimize prevailing market conditions (subject to considerations such as tax law and federal reimbursementrequirements and state or donor restrictions); and reduced administrative burden. The internal repayment rate shouldbe reviewed regularly, although we recommend that the actual rates be adjusted infrequently.
Implementing an enterprisewide structure can be a challenge, as historical budgets and costs and internal politics mustbe considered. However, managing debt on a portfolio basis with the objective of lowering overall institutional costsand risks and providing a predictable funding cost provides the institution with a number of long-termadvantages. Depending on the funding needs of the institution, a bank line of credit or commercial paper programcan further assist in managing a source of available funds while minimizing the frequency of, and dependency on,individual bond transactions.
The decisions regarding fixed and variable rate debt highlight this point. For most institutions, it may be desirableto maintain a portion of its outstanding debt in a variable rate mode. If debt is managed on a transactional basiswith the actual interest expense directly passed through to users, beneficiaries of variable rate debt financing will enjoysignificant cost savings during low interest rate periods but may not evaluate or appreciate the significant risk theyassume, and their projects may encounter substantial budgetary difficulty if short-term rates rise. The result ofemploying this project-based funding rationale is that the institution may have less than an ideal overall allocationbetween fixed and variable rate debt. By managing debt on a portfolio basis, the institution is better positioned tobenefit from and diversify exposure to short-term interest rates, as well as consider the impact on the institution’sassets.
IMPLEMENTING A DEBT POLICY
Debt is a tool to achieve the desired long-term strategies of the institution, and, as such, a debt policy should be linkedto the mission and strategic objectives of the institution. A formal debt policy provides the framework through whichthe institution can evaluate the use of debt to achieve strategic goals. Since management is best able to evaluate itsneeds, the institution—and not credit-rating agencies—should determine debt policy. A number of the ratios pre-sented in this book can help set targets for evaluating the amount of desired debt at an institution. An institution willbe stronger financially and programmatically if it develops an internal debt policy and articulates this policy to itsstakeholders and periodically measures attainment.
The policy should achieve the following objectives:
• First, the debt policy should be specifically customized to reflect the institution’s unique culture, advantages, lim-
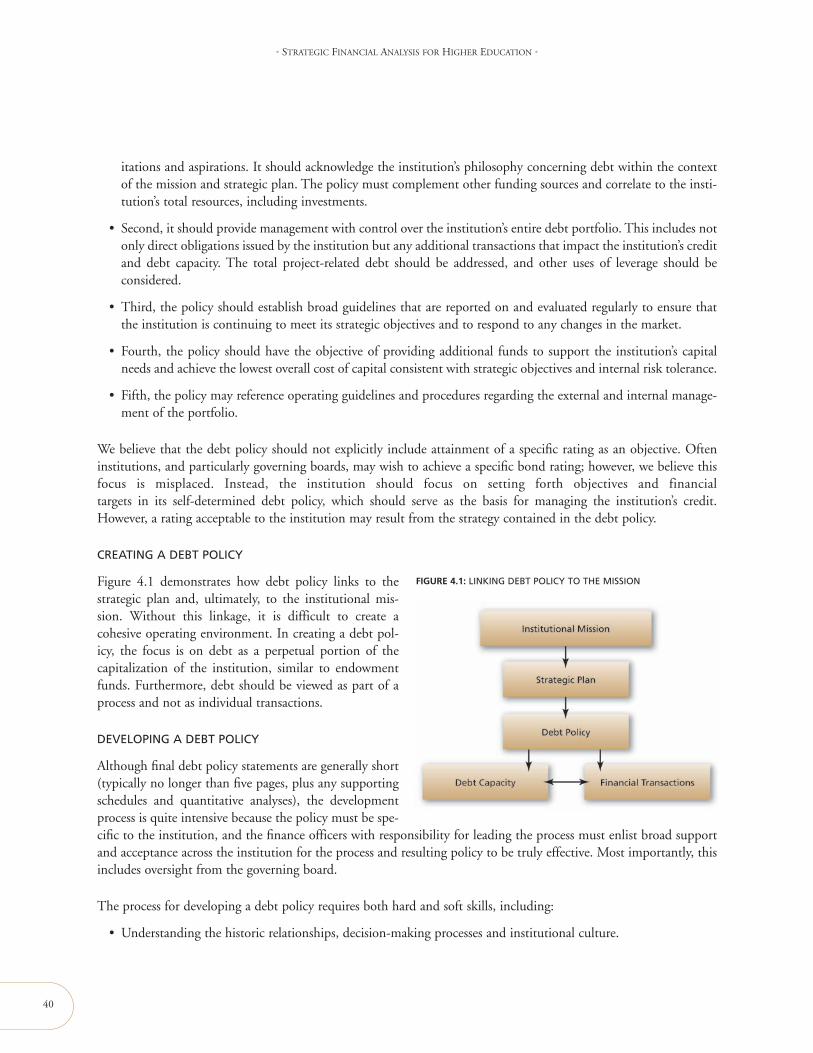
40
• STRATEGIC FINANCIAL ANALYSIS FOR HIGHER EDUCATION •
itations and aspirations. It should acknowledge the institution’s philosophy concerning debt within the contextof the mission and strategic plan. The policy must complement other funding sources and correlate to the insti-tution’s total resources, including investments.
• Second, it should provide management with control over the institution’s entire debt portfolio. This includes notonly direct obligations issued by the institution but any additional transactions that impact the institution’s creditand debt capacity. The total project-related debt should be addressed, and other uses of leverage should beconsidered.
• Third, the policy should establish broad guidelines that are reported on and evaluated regularly to ensure thatthe institution is continuing to meet its strategic objectives and to respond to any changes in the market.
• Fourth, the policy should have the objective of providing additional funds to support the institution’s capitalneeds and achieve the lowest overall cost of capital consistent with strategic objectives and internal risk tolerance.
• Fifth, the policy may reference operating guidelines and procedures regarding the external and internal manage-ment of the portfolio.
We believe that the debt policy should not explicitly include attainment of a specific rating as an objective. Ofteninstitutions, and particularly governing boards, may wish to achieve a specific bond rating; however, we believe thisfocus is misplaced. Instead, the institution should focus on setting forth objectives and financialtargets in its self-determined debt policy, which should serve as the basis for managing the institution’s credit.However, a rating acceptable to the institution may result from the strategy contained in the debt policy.
CREATING A DEBT POLICY
Figure 4.1 demonstrates how debt policy links to thestrategic plan and, ultimately, to the institutional mis-sion. Without this linkage, it is difficult to create acohesive operating environment. In creating a debt pol-icy, the focus is on debt as a perpetual portion of thecapitalization of the institution, similar to endowmentfunds. Furthermore, debt should be viewed as part of aprocess and not as individual transactions.
DEVELOPING A DEBT POLICY
Although final debt policy statements are generally short(typically no longer than five pages, plus any supportingschedules and quantitative analyses), the developmentprocess is quite intensive because the policy must be spe-cific to the institution, and the finance officers with responsibility for leading the process must enlist broad supportand acceptance across the institution for the process and resulting policy to be truly effective. Most importantly, thisincludes oversight from the governing board.
The process for developing a debt policy requires both hard and soft skills, including:
• Understanding the historic relationships, decision-making processes and institutional culture.
FIGURE 4.1: LINKING DEBT POLICY TO THE MISSION
CHAPTER FOUR • STRATEGIC DEBT MANAGEMENT
41
• Overcoming any resistance and skepticism (which may necessitate the intervention of an external party).
• Determining the appropriate level for approval, such as the degree of governing board involvement.
• Ensuring that the debt policy is consistent with the institution’s investment policy and with assumptions regard-ing returns, cash balances, etc., to enable balance sheet management.
• Evaluating existing debt structures, internal loans and other obligations.
• Determining how to incorporate prior decisions and structures into the new framework (without causingunintentional negative results) and whether existing financial structures must be reevaluated.
• Understanding the institution’s level of risk tolerance in managing its debt portfolio and establishing internallending rates.
• Communicating throughout the process with stakeholders about the expected benefits and output of theongoing process.
The debt policy must be helpful to management, regularly communicated and periodically reviewed.
Because the policy should reflect the institution’s unique needs and strategic objectives, there is no one model debtpolicy that fits all institutions. In fact, the process of developing and customizing the policy to the institution iscritical. However, in developing a debt policy, the following guidelines should be considered:
• Articulate the institution’s philosophy about debt that governs all commitments of the institution. This shouldexplain why the debt policy is being created, how it will be used to govern the incurrence of debt to achieve stra-tegic objectives and for what purposes deviations are acceptable. It provides criteria for management and the gov-erning board to interpret the other components of the policy. The institution may wish to explicitly acknowledgethat the policy is consistent with state law and guidelines and legal and tax requirements.
• Select the limited number of key ratios and establish specific financial targets or limits for the appropriate finan-cial boundaries of the institution’s operations. Generally, no more than two to four ratios are used to representthe overall health of the institution and to keep the evaluation at a high, strategic level (other ratios could betracked as well for management purposes). Typically, the Viability Ratio and Debt Service Burden Ratio wouldbe two of the ratios monitored.
• Develop a policy and procedure for the prioritization and monitoring of capital projects with input at the appli-cable operating level (e.g., school, department) of the institution. Guidelines should be broad enough to allowmanagement flexibility; however, the policy should give priority to projects that are mission-critical and/or havea related revenue stream for repayment.
• Consider the desired mix of variable and fixed debt as well as permissible (or prohibited) debt structures andcovenants. Targets should be established for fixed and variable rate debt percentages. When determining theappropriate variable rate allocation, the institution’s cash and fixed-income holdings should be considered.
• Contemplate the use of derivative products and establish guidelines regarding their evaluation and applicability.Increasingly, institutions have been developing a policy specifically geared to derivatives. A derivatives policyshould complement or form a part of the debt policy.
• State that the institution will interact with the rating agencies and analysts. The institution should not specifythe attainment or maintenance of a specific rating as part of the policy.
42
• STRATEGIC FINANCIAL ANALYSIS FOR HIGHER EDUCATION •
• Include the methodology and calculations to support the items contained in the policy, as well as calculations ofthe ratios (including projections), as appendices.
• Establish a policy regarding the internal use, management and repayment of debt.
• Establish the format for regular reports to the governing board.
• Establish internal guidelines and procedures regarding savings thresholds, debt structuring objectives and otheradministrative requirements of the debt portfolio. Include acknowledgment that a process for dealing with legal,tax and other external requirements must be in place, although these operating procedures should not be part ofthe actual policy.
Once the debt policy is developed and adopted, it must be implemented and monitored. Recommendations foreffective buy-in for the debt policy across campus and for minimal administrative burden include:
• Meet with affected representatives before and after adoption to explain why the policy was enacted and how itspecifically affects them. Since certain long-standing behaviors may have to be modified, it is critical to involveall constituents.
• Ensure that data is available to make informed decisions.
• Modify or create appropriate incentives to ensure that the desired outcome will be achieved. Since the debtpolicy exists to help the institution effectively achieve its strategic plan, be certain that all activities support thatobjective.
• Determine whether any other activities, relationships or processes should be modified. No institution wants togo through continual adjustment and change. Consider implementation at a time when other changes are beingconsidered, and determine that all activities are consistent to achieve the desired outcomes.
• Accept that there may need to be certain exceptions to the policy, or that it may need to be phased in over a num-ber of years for certain areas or projects. However, it is important that the exceptions or phase-ins have a limit,since a dual system should not be perpetuated as that creates increased administrative burden and systemicinequities.
• Although changes to the policy and procedures should be minimized, recognize that some changes are likely asnew information is received and improvements identified.
• Ensure that the policy and supporting procedures are living documents and accurately reflect how the institutionconducts business. Establishing a policy to “sit on the shelf” is an unproductive exercise for all concerned.
• Understand that implementing the policy will take time and effort. If the institution is not prepared to makethat commitment currently, it is better to wait until necessary resources are available and the initiative becomesa priority.
USE OF DEBT VERSUS WORKING CAPITAL
For some institutions, cash management has not been a top priority. Low interest rates, imperfect data for cash pro-jections, diffuse responsibility for investing, cash management and finance, and nonaligned financial incentives havelessened the need to maximize the return on the institution’s working capital. Despite these challenges, even relativelysmall improvements to the cash management function can enhance financial performance.
CHAPTER FOUR • STRATEGIC DEBT MANAGEMENT
43
When determining the appropriate amount of asset liquidity to maintain, the institution should also consider theamount of short-term debt and lines of credit. Establishing policies or recommendations regarding debt, liquidity,cash or investments in isolation is not ideal; only when considering all assets and liabilities will the institution achievegreater flexibility as well as enhanced overall performance. Such policies should address:
• The appropriate level of cash and similar investments to keep on hand. Institutions that claim not to have aproblem with cash management because there is always more than sufficient cash on hand may benefit fromreducing cash balances and increasing longer-term investments.
• Whether a line of credit and/or commercial paper program or other forms of short-term borrowing should beavailable to augment internal funds for liquidity and cash needs.
• Whether the acquisition of short-term assets is more cost effective to be funded with cash, operating leases, abank line or tax-exempt short-term debt. The decision among these options should be based on economics andshould not affect the institution’s long-term debt capacity for facilities.
• Whether a fixed-rate long-term debt portfolio actually may be riskier to the institution than a portfolio thatincludes some variable rate debt. When considering liabilities exclusively, it may appear that a 100 percent fixed-rate debt portfolio imposes the least amount of risk to the institution’s operating budget. However, when earn-ings from short-term investments that support the budget are considered, the overall effect is to produce greatervolatility in the institution’s budget. Hedging of the institution’s average cash and cash equivalents with floatingrate debt minimizes exposure to the institution overall.
• That institutional liquidity to support operations and potentially external debt should be managed on a portfo-lio basis.
An institution should review investment policy, spending rules, cash management strategies and debt policy togetherto determine whether they are supportive or have some inconsistencies that prevent the institution from optimizingits net assets. Examining financial investments, cash, facilities and debt within the same context truly permits theinstitution to take a holistic approach to its finances based on management of its entire balance sheet.
Institutions, like individuals, borrow money for two reasons—they have to or they want to. If they are doing sobecause they want to, it is generally because tax-exempt debt is widely regarded as being a more attractive source ofcapital than internal reserves. In fact, when projecting investment return, most asset managers will assume an expectedannual rate of return above the institution’s external cost of capital, sometimes significantly above this cost. Fewinvestment managers would project that investment returns would not surpass either the institution’s cost of capitalor the return that could be realized on a portfolio of fixed-income securities over the long term. If the institutionbelieves its long-term returns are not really achievable, it would be financially advantageous to use internal rather thanexternal funds for capital expenditure. When performing any financial projections, it is critical to make variousassumptions and prepare various alternative scenarios. The use of Monte Carlo or similar simulations, historical infor-mation and scenario modeling can assist in interpreting projections and making informed decisions.
FINANCIAL RATIOS WITHIN THE CONTEXT OF CREDIT ANALYSIS
Financial ratios provide a useful guide for evaluating the credit of both public and private educational institutions aswell as other not-for-profit organizations; however, it is important to remember that an institution’s current and pro-jected financial health represents only one criterion necessary to evaluate credit and debt capacity. In fact, in many
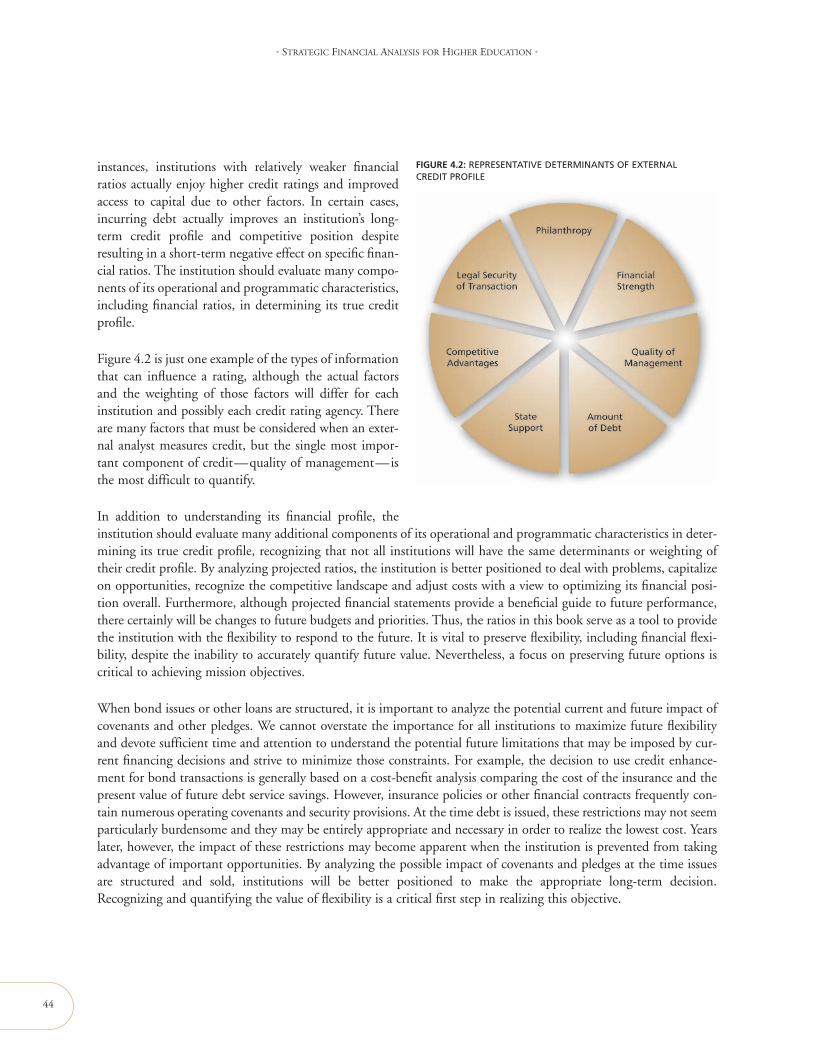
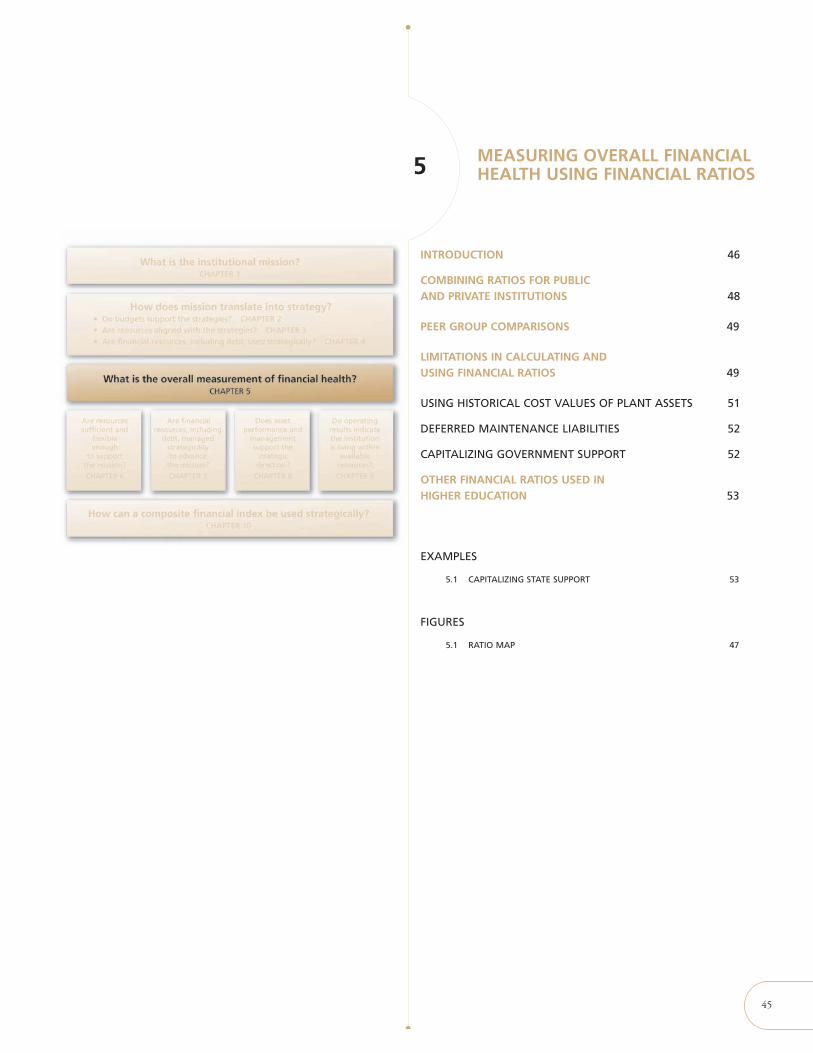
45
MEASURING OVERALL FINANCIALHEALTH USING FINANCIAL RATIOS5
INTRODUCTION 46
COMBINING RATIOS FOR PUBLICAND PRIVATE INSTITUTIONS 48
PEER GROUP COMPARISONS 49
LIMITATIONS IN CALCULATING ANDUSING FINANCIAL RATIOS 49
USING HISTORICAL COST VALUES OF PLANT ASSETS 51
DEFERRED MAINTENANCE LIABILITIES 52
CAPITALIZING GOVERNMENT SUPPORT 52
OTHER FINANCIAL RATIOS USED INHIGHER EDUCATION 53
EXAMPLES
5.1 CAPITALIZING STATE SUPPORT 53
FIGURES
5.1 RATIO MAP 47
CHAPTER SUMMARY
This chapter presents concepts that we have developed since the first edition of Ratio Analysis in Higher Education andare the foundation of the strategic analyses presented in the prior chapters. There has been evolution in thought, driven bothby changing accounting models for both private and public institutions and the increasing sophistication of institutions inunderstanding their financial position and financial needs. We believe the fundamental concept of assessing financial healthby using a limited number of ratios has improved the understanding of the financial health of colleges and universities.
INTRODUCTION
Ratio analysis is an important method of strategic financial analysis to measure and analyze financial information.Earlier editions of Ratio Analysis in Higher Education focused on ratios as a tool to understand and communicatefinancial information to stakeholders. Those publications emphasized the calculation and objective of the ratios sinceeither many of the ratios were new to higher education or the users of the ratios did not understand fully the unique-ness of higher education financial reporting. Over time, we evolved the concepts and use of ratios and developed someoverall indicators of financial health. However, ratios are just one tool of financial analysis to determine whether theinstitution is using its financial resources effectively to achieve its mission and are not calculated solely for themselves.
Several principles guided the earlier editions of Ratio Analysis in Higher Education. We have reexamined these princi-ples for using ratios and have adjusted them to reflect the continuously challenging financial environment facinghigher education. These principles are:
• Use ratios to measure the acquisition and use of resources to achieve the institution’s mission
• Focus on summary information to address key questions raised by stakeholders
• Present a few key ratios to answer these questions
• Focus on trends in institutional ratios
Ratio analysis can measure success factors against institution-specific objectives and provide the institution with thetools to improve its financial profile to carry out its mission. The principles of ratio analysis can serve as a yardstickto measure the use of financial resources to achieve the institution’s mission. Financial ratio analysis quantifies thestatus, sources and uses of these resources and the institution’s relative ability to repay current and future debt.Business officers and board members can use these measures to gauge institutional performance. Finally, ratios canfocus planning activities on those steps necessary to improve the institution’s financial profile in relation to its visionand mission.
As presented on page 47, a ratio map illustrates four core, higher-level ratios that provide information on the overallfinancial health of the institution and other ratios collected around related activities to provide deeper insight into theinstitution. For public institutions, these core ratios were described in the fifth edition of Ratio Analysis in HigherEducation: New Insights for Leaders of Public Higher Education. Chapters 6–9 describe the other ratios that provide adeeper understanding of the institution’s activities as the four key questions are answered. Chapter 10 introduces a
MEASURING OVERALL FINANCIAL HEALTH USING FINANCIAL RATIOS5
46
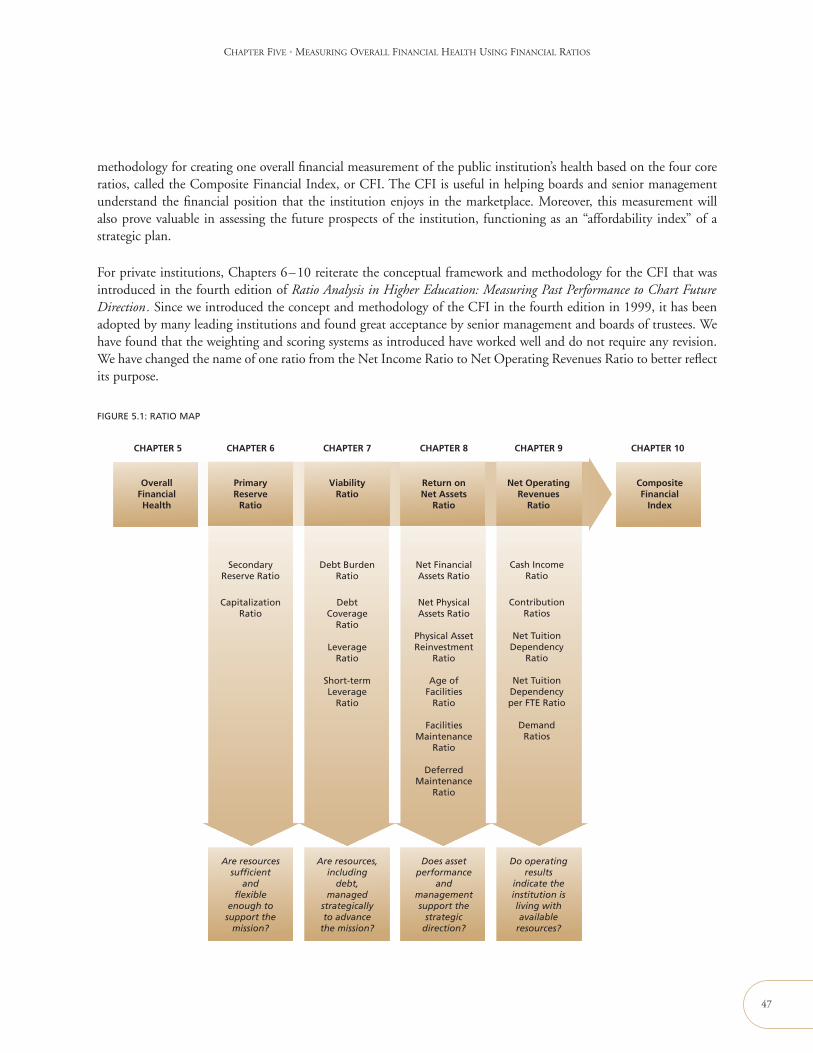
CHAPTER FIVE • MEASURING OVERALL FINANCIAL HEALTH USING FINANCIAL RATIOS
methodology for creating one overall financial measurement of the public institution’s health based on the four coreratios, called the Composite Financial Index, or CFI. The CFI is useful in helping boards and senior managementunderstand the financial position that the institution enjoys in the marketplace. Moreover, this measurement willalso prove valuable in assessing the future prospects of the institution, functioning as an “affordability index” of astrategic plan.
For private institutions, Chapters 6–10 reiterate the conceptual framework and methodology for the CFI that wasintroduced in the fourth edition of Ratio Analysis in Higher Education: Measuring Past Performance to Chart FutureDirection. Since we introduced the concept and methodology of the CFI in the fourth edition in 1999, it has beenadopted by many leading institutions and found great acceptance by senior management and boards of trustees. Wehave found that the weighting and scoring systems as introduced have worked well and do not require any revision.We have changed the name of one ratio from the Net Income Ratio to Net Operating Revenues Ratio to better reflectits purpose.
47
Primary Reserve
Ratio
ViabilityRatio
Return onNet Assets
Ratio
OverallFinancialHealth
Composite Financial
Index
CHAPTER 6 CHAPTER 7 CHAPTER 8 CHAPTER 9CHAPTER 5 CHAPTER 10
Net Operating Revenues
Ratio
Secondary Reserve Ratio
Debt Burden Ratio
Net Financial Assets Ratio
Cash Income Ratio
CapitalizationRatio
Debt Coverage
Ratio
Leverage Ratio
Short-term Leverage
Ratio
Net Physical Assets Ratio
Physical Asset Reinvestment
Ratio
Age ofFacilities
Ratio
Facilities Maintenance
Ratio
DeferredMaintenance
Ratio
Contribution Ratios
Net Tuition Dependency
Ratio
Net Tuition Dependency per FTE Ratio
Demand Ratios
Are resources sufficient
andflexible
enough to support the
mission?
Are resources, including
debt, managed
strategicallyto advance
the mission?
Does asset performance
and management support the
strategicdirection?
Do operating results
indicate the institution isliving with available
resources?
FIGURE 5.1: RATIO MAP
48
• STRATEGIC FINANCIAL ANALYSIS FOR HIGHER EDUCATION •
The concepts that have evolved are (a) fewer measures are better, as long as they are the correct ones, and (b) every-one in an institution should have key performance metrics to drive mission and assess performance. Figure 5.1 mapsall the financial statement ratios discussed in this book into the functional areas they help analyze and the high-orderquestions they help answer. Some of the ratios are new to this edition. Some ratios from previous editions have beenreorganized in other areas and others have been deleted to reflect the evolving needs of financial officers in thedynamic higher education environment.
COMBINING RATIOS FOR PUBLIC AND PRIVATE INSTITUTIONS
Private and public institutions compete with each other for resources, students and faculty. In addition, due to stategovernment reductions in aid, many public institutions are increasing efforts to raise funds and reduce reliance onunpredictable governmental sources of operating and capital funds. This has resulted in many public institutions seek-ing ways to become more self-reliant and having to manage themselves more like private institutions. We do notbelieve that the different missions between public and private institutions, and differences in missions between solelyprivate institutions or solely public institutions, are significant enough to prevent using financial ratios to measuresimilar financial events. Our experience in higher education has also indicated that private and public institutionsperform the same basic functions and that financial ratios can measure and communicate the same objective.Although the methodology for public and private institutions remain the same, calculations will differ.
For public institutions, it is important to measure the entire public institution’s financial resources, debt and finan-cial performance. This will include the institution itself, its affiliated foundations used for fundraising, research or realestate, and other special-purpose entities used to construct and/or operate institution-related assets such as studenthousing. Although individually significant fundraising affiliated foundations are now presented in the public institu-tion’s financial statements, internal analysts may find it desirable to include all affiliates in the calculations so that theentire institution is represented in the calculations. External analysts may still find it difficult to obtain financial infor-mation about all affiliates and should consider materiality in determining which affiliated entities’ financial informa-tion beyond those already presented is necessary so that exclusion does not result in the analysis being materiallyincomplete or misleading. Analysts may also consider doing a “with and without” analysis to determine the impactof these affiliates.
Also for public institutions, the financial ratios described here and in subsequent chapters combine entities that fol-low accounting practices issued by both the GASB and the Financial Accounting Standards Board (FASB). Generally,affiliated foundations and special-purpose entities will follow FASB standards that are different from GASB standards.However, these differences are less after adoption of GASB Statements nos. 33, 34 and 35 by public institutions andare not significant enough to warrant exclusion of the affiliated entities. In addition, since in many cases, the major-ity of the public institution’s financial resources, and in some cases a significant portion of debt, reside in the affili-ated entities, excluding these entities from financial analysis of the public institution would result in misleading orincomplete analysis.
The financial information required to calculate the ratios for public institutions is contained in the financial state-ments of the institution or the separate financial statements of the affiliates, if the affiliate information or statementsis not presented with the institution’s statements. These affiliates are referred to in the calculations as component units(C.U.). In evaluating the net assets of affiliated fundraising foundations following FASB standards, the analyst shoulddetermine whether the foundation’s funds held for the benefit of the institution are reported as liabilities and makeadjustments so that these funds are reported as net assets. Some information may not be disclosed in the financialstatements but can be obtained from the accounting records.
CHAPTER FIVE • MEASURING OVERALL FINANCIAL HEALTH USING FINANCIAL RATIOS
The financial information required to calculate the ratios for private institutions is contained primarily in the finan-cial statements, but some information will need to be obtained from the accounting records.
PEER GROUP COMPARISONS
Prior editions of Ratio Analysis in Higher Education have noted the use of financial ratios to make peer comparisons.Publications have increased the use of peer rankings over time, especially concerning the quality of academic programsand the institution as a whole. These peer comparisons have benefited many institutions and provided managementa way to communicate an institution’s goals and progress toward those goals to its various stakeholders. Institutionshave also used peer comparisons successfully by establishing an aspirant peer group. However, it has also become evi-dent that some institutions have over-used peer comparisons and have forgotten three basic principles of financialanalysis—one, ratios should be used to measure success factors in order to improve the institution financially toachieve its mission; two, that the information being compared must be on a fairly consistent basis; and three, thatpeer comparisons are only a weak relative indicator and do not measure attainment of an institution’s unique mission.Therefore, common sense, qualitative interpretation and longitudinal interpretation are required.
Some stakeholders have desired direct financial comparisons between private and public institutions. Unfortunately,this was not at all possible due to significant differences between financial reporting principles for private and publicinstitutions since 1996, when the financial reporting principles changed significantly for private institutions. In 2002,the financial reporting principles changed significantly for public institutions, making them more comparable to pri-vate institutions. These differences narrowed further in 2004 as public institutions were required to include theirfundraising foundations that meet certain criteria as part of their financial statements.
However, even though the differences have narrowed, significant differences still remain between the financialaccounting and reporting principles used by public and private institutions. These differences include recognition ofcontributions and funds held by others, nature of restrictions, use of restricted net assets, and categorization of cashtransactions in the statement of cash flows. Because of these significant differences, great care should be exercisedwhen making financial comparisons between public and private institutions.
Longitudinal comparisons are generally more important than peer comparisons since the institution can adapt theratios over time to meet institutional needs and reflect changing conditions. In addition, as discussed here and in sub-sequent chapters, many ratio calculations can be modified to better reflect the objectives of the particular institution.The institution is generally assured of a consistent basis and availability of information sources, not all of which arereported in the institution’s annual financial report. Causes of changes in ratios can also be identified more easily.Internal comparisons can be used over a longer time horizon to monitor historical institutional performance, estab-lish prospective targets and, combined with nonfinancial drivers, present a more thorough analysis and evaluation.
LIMITATIONS IN CALCULATING AND USING FINANCIAL RATIOS
While we believe that financial ratio comparisons across institutions—public or private—are useful, we recognizethat a number of limitations continue to exist that make comparisons between public and private institutions, or evenamong public universities, difficult in some comparative areas. Public institutions have different operating andgovernance structures that make financial analysis challenging and generally require a more rigorous review of thefinancial information contained in the comprehensive financial statements. Some public institutions rely on the spon-soring government for a credit rating for debt, whereas others obtain their own credit rating. In some instances, debtrelated to a public institution’s plant assets does not reside at the institution level but at a higher level such as a state
49

50
• STRATEGIC FINANCIAL ANALYSIS FOR HIGHER EDUCATION •
system. In addition, public institutions rely on their sponsoring governments for operating and capital support; insome instances, other governmental units may also support the institution, such as a state supporting county-basedcommunity colleges. This support generally permits public institutions to operate at a lower operating surplus andexpendable net asset level than their private counterparts; however, this funding dependency reduces operating andfinancial flexibility. In addition, in some states, public institutions are not permitted to maintain expendable net assetbalances above a certain level; institutions that incur operating surpluses or have significant expendable net assets mayfind future operating support reduced.
We have established threshold values for the four core ratios and certain other ratios described in Chapters 6–9 basedon evaluations of private and public institutions. Recognizing that public institutions may require greater operatingindependence to have the flexibility to adapt to changing market conditions, we have concluded that the thresholdvalues should be the same for private and public institutions, unless otherwise indicated. Similarly, government sup-port is a significant strength for public institutions and should be considered in any financial analysis.
Likewise, we have determined that the threshold values and the scoring and weighting systems used in calculating theComposite Financial Index described in Chapter 10 should be the same for private and public institutions. Thesethresholds are more useful for private institutions and public institutions that are managing themselves (or desire to)with direct responsibility for budget, operation, debt and investment management. Many public institutions may findthe threshold values too high or cannot attain them due to operating and governance restrictions; however, the val-ues indicate that these institutions possess minimal operating and financial flexibility independent of the state, whichwe believe limits the institutions’ ability to adapt to a changing market and invest in significant new strategic initia-tives, absent the identification of a specific new funding source.
Although the ratio calculations for public institutions should include their component units, in certain cases thatinformation may not be available from the public institutions’ financial statements. For example, institutions are notrequired to present the statement of cash flows for their component units. Excluding the component units from thesecalculations is appropriate unless the institutions have access to the detailed financial statements and accountingrecords. In other cases, inclusion of the component units’ information will not be appropriate. For example, includ-ing depreciation expense and accumulated depreciation of the FASB component units that are fundraising entities inthe Age of Facilities Ratio would generally not be appropriate. However, if the component units are operating enti-ties, such as a medical practice plan or research foundation, then inclusion should occur.
Public institutions and their reported component units are included in higher-level financial statements such as a statesystem or department of education. For inclusion into this higher-level reporting entity, public institutions arerequired to provide the higher-level entity information showing a consolidated statement of net assets and statementof revenues, expenses and changes in net assets. These consolidated statements include elimination of inter-entitytransactions and balances between the public institution and its component units. A consolidated statement of cashflows is not prepared since discretely presented component units are not required to present a statement of cash flows.
Analysts preparing financial ratios for public institutions should use the consolidated information from those sched-ules since the basis of the ratios is the institution as a whole. However, these schedules and consolidated informationgenerally are neither published, separately disclosed nor available to the general public. As a result, analysts may berequired to use the separate financial statements of the public institution and its component units. These statementswill not be on a consolidated basis and not have inter-entity transactions and balances eliminated.
CHAPTER FIVE • MEASURING OVERALL FINANCIAL HEALTH USING FINANCIAL RATIOS
For example, calculating total expenses for the institution itself and its component units may result in double-counting certain expenses. To illustrate, an institution’s component unit will receive contributions for operating sup-port. It would record revenue when earned and expenses reflecting the distribution to the institution. The institutionwould record revenue from the receipt from the component unit and the expenses if funds were used. As a result,expenses are counted both in the component unit and the institution in the institution’s separate financial statements.It may be unlikely that expenses would be recorded in the same accounting period by both the institution and thecomponent unit.
The ratio calculations illustrated in Chapters 6–9 use information from the separate financial statements from a rep-resentative public institution and its component unit fundraising foundation. For purposes of the illustrated ratios,we have not eliminated the double-counting of transactions but have indicated in the calculations the need to elimi-nate inter-entity transactions and balances.
While there are a number of factors impacting only public institutions, other considerations affect both public andprivate universities.
USING HISTORICAL COST VALUES OF PLANT ASSETS
An institution’s assets contain a number of components such as investments that are comparable across institutions,since they can be easily valued on a current basis (with the exception of private equity or alternative investments).However, for most institutions, another major component of assets is the carrying value of plant, which is moredifficult to interpret and compare across institutions. This discrepancy may affect the relative wealth of institutionsbased on the degree of investment in plant.
Unlike investments, plant facilities are carried at historical value less accumulated depreciation. If plant were stated atmarket value, the value of many institutions’ facilities would increase considerably. This is especially true for thoseinstitutions located in urban environments that have experienced significant real estate appreciation that has not beenreflected in the valuation of the institutions’ real estate or for those institutions that possess vacant land available forfuture development. The effect of not stating real estate at market values is to understate the wealth of the institutionand overstate the return on net assets.
Despite these shortcomings, calculating plant based on historical cost has its advantages and is preferable for a num-ber of reasons. First, historical value is contained in the audited financial statements and is a readily available figure,if not an entirely accurate one. Second, it is not clear that current market value is any more objective and correct thanhistorical value. In order to state plant facilities at market, an institution would need to continually appraise its prop-erty, a costly and time-consuming process. Appraisals themselves are subjective measurements, and they would onlycontinue to make comparison of plant values across institutions extremely difficult. Last, realization of the currentvalue of the real estate owned would require conversion through sale, which would impair the institutional ability tocarry on program activities. When these assets are used as collateral, the fair value is generally assessed in determin-ing the collateral to loan ratios.
Plant represents a significant asset to most higher education institutions. While few institutions intend to sell off coreassets to relocate or liquidate, quantifying and understanding the true value of these assets is an important exercise asinstitutions increasingly seek ways to use plant assets in more creative ways to generate investable resources.
51
52
• STRATEGIC FINANCIAL ANALYSIS FOR HIGHER EDUCATION •
DEFERRED MAINTENANCE LIABILITIES
Although stating plant at historical value tends to underestimate the value of an institution’s real estate holdings, thefailure to include deferred maintenance as a liability on an institution’s balance sheet overstates the value of net assetsbecause it fails to account for an unfunded future cost. Maintenance of campus facilities can be delayed indefinitely;however, at some point an institution will find it desirable to upgrade its facilities, because of either need or competi-tive pressure, and at that point it will incur a potentially significant cost.
Since deferred maintenance does not appear as a liability, the institution that has chosen to invest in plant appearsless wealthy on a relative basis than its peer institutions that have elected to delay the necessary reinvestment in plant.When this liability is eventually funded, the institution that has postponed investment in plant will experience apotentially significant deterioration in some fundamental financial ratios.
There is no formula to suggest universally appropriate levels of investments in either plant or endowment. However,there are trade-offs in the current period between the two alternatives, and management must make the allocationthat is most appropriate for the given institution. Measurements can be affected if the decision to invest in plantresults in an institution’s appearing less wealthy than a peer, when in fact its financial managers have simply madea different investment decision. An acknowledgment of unfunded liabilities must be made in order to make com-parisons across institutions more equal. For the reasons stated previously, adjusting for unfunded liabilities on thevaluation of plant is not desirable, either. Rather, it is recommended that management be aware of the level of deferredmaintenance and calculate financial ratios on a forward basis. Since unfunded maintenance is a deferred cost ratherthan an avoided cost, at some point the liability must be funded. By calculating the Return on Net Assets Ratio,among others, on a projected basis, management will be able to determine the implication of delaying investmentin plant.
As a final point, the choice between deployment of resources in plant or investments is not entirely equivalent, sinceinvestment in plant is far less liquid and therefore not readily available to pay debt service. The difference betweentwo equivalent institutions, one of which has elected to invest in plant and the other to defer maintenance, will beapparent in the expendable net assets ratios that exclude investment in plant. This distinction is appropriate; how-ever, there should not be a differential when measuring the total net assets of each institution.
CAPITALIZING GOVERNMENT SUPPORT
One of the most substantial sources of funding and a significant strength for many public institutions is the level ofgovernment support, partially evidenced in state appropriations. This is a considerable source of funding for manypublic institutions and, for some, historically has served to lessen the reliance on endowment funds, which have beencritical for private institutions. While we believe that public institutions and their supporting foundations should con-tinue to aggressively solicit philanthropy and build investments, we also believe that demonstrated committed gov-ernment support represents an important asset of the institution, yet one that is not reflected on the balance sheet.
A public institution may consider “capitalizing” the government appropriations (e.g., using the perpetuity formula bydividing steady state appropriations by an applicable interest rate, such as 4–5 percent, which would represent atraditional payout rate) for analysis purposes. This approach would capture the value of the appropriations to theinstitution and identify the level of investments the institution would require to replace government support.
CHAPTER FIVE • MEASURING OVERALL FINANCIAL HEALTH USING FINANCIAL RATIOS
OTHER FINANCIAL RATIOS USED IN HIGHER EDUCATION
Others, including those analyzing the institution’s credit and the Department of Education, have developed manyfinancial ratios for higher education institutions. Some of these other developers’ ratios are very similar to the ratiosin this publication and earlier editions of Ratio Analysis in Higher Education, both in name and calculation. It isimportant to note that the purpose of the ratios and CFI scoring system are substantially different from those usedby these other developers because their purposes vary significantly. Credit rating agencies and financial institutionsuse ratios to evaluate an institution’s creditworthiness. The Department of Education’s purpose is to identify institu-tions that might bear increased financial risk to its student financial aid programs in a short time horizon. Our ratiosassist institutions in understanding the affordability of their strategic plans and to monitor and evaluate the financialresults of implementing those strategic initiatives over a longer-time horizon.
The illustrated examples of the ratio calculations in subsequent chapters are from sample private and public highereducation institutions’ financial statements. The private institution, Utopia University, is presented in Appendix B,whereas the public institution, Sagacious State University, and its component unit function is presented in AppendixC. These statements are derived from actual financial statements.
53
EXAMPLE 5.1: CAPITALIZING STATE SUPPORT
As discussed, state appropriations are a valuable resource for many public institutions, yet it is a resource that is not
reflected on the balance sheet. To quantify the benefit of the appropriation, it may be helpful to determine the
amount of endowment that would be required to replace lost state funding or to improve comparison between pub-
lic and private institutions (with all the other caveats) by capitalizing the state appropriations (or other sources of
external funding). Adding that to the institution’s assets can provide the opportunity for interesting analysis.
Let’s assume that an institution receives $10 million per year in state appropriations. To generate this level of endow-
ment payout, a $200 million endowment would be required (5 percent payout multiplied by $200 million equals the
$10 million current year’s payment). Replacing $20 million in current appropriations would require a $400 million
endowment, etc. Adding this figure to the balance sheet as an implied endowment represents a starting point.
While this is a rough approximation, there are other issues that need to be considered. What is the “correct” level of
assumed state support? Given some state reductions in recent years, how accurate is the appropriation that is being
assumed? Institutions should use a figure that seems reasonable but is not certain.
While the example presented above works for the current year, over time the benefit of institutional endowment over
state appropriations becomes significant. If we assume that over the long term an endowment will grow at, say, 7 per-
cent, a greater amount of payout (at an assumed 5 percent) will be available for the institution, keeping up with an
assumed 2 percent inflation (i.e., a real return of 5 percent). For public institutions relying on state support, this would
require a higher annual increase in appropriations. If state appropriations were growing at only 3 percent per year, for
example, a much higher implied endowment would be required (the 3 percent can be viewed as the earnings, and the
inflation and payout as the expenditures). For the public and private institutions in our example to be equivalent, state
appropriations would have to increase at a rate of 7 percent per year. If not, the capitalized endowment we use today
will be insufficient to generate the desired payout in the future.
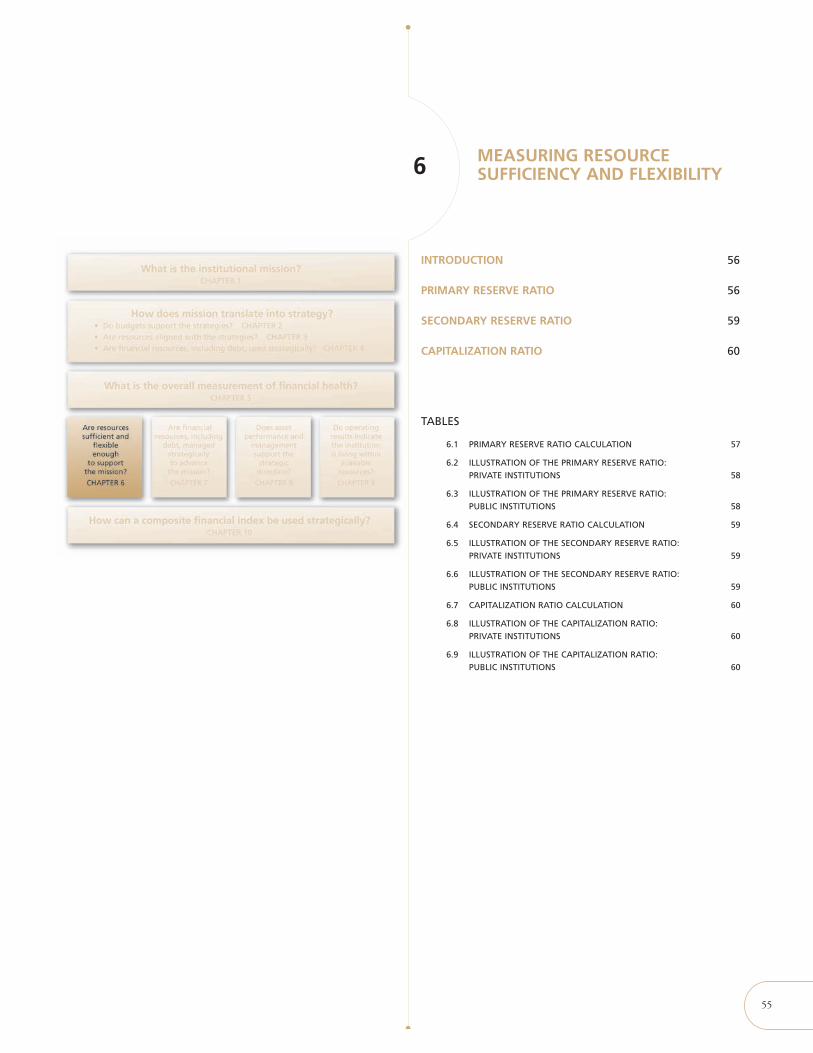
55
MEASURING RESOURCESUFFICIENCY AND FLEXIBILITY6
INTRODUCTION 56
PRIMARY RESERVE RATIO 56
SECONDARY RESERVE RATIO 59
CAPITALIZATION RATIO 60
TABLES
6.1 PRIMARY RESERVE RATIO CALCULATION 57
6.2 ILLUSTRATION OF THE PRIMARY RESERVE RATIO: PRIVATE INSTITUTIONS 58
6.3 ILLUSTRATION OF THE PRIMARY RESERVE RATIO:PUBLIC INSTITUTIONS 58
6.4 SECONDARY RESERVE RATIO CALCULATION 59
6.5 ILLUSTRATION OF THE SECONDARY RESERVE RATIO:PRIVATE INSTITUTIONS 59
6.6 ILLUSTRATION OF THE SECONDARY RESERVE RATIO:PUBLIC INSTITUTIONS 59
6.7 CAPITALIZATION RATIO CALCULATION 60
6.8 ILLUSTRATION OF THE CAPITALIZATION RATIO:PRIVATE INSTITUTIONS 60
6.9 ILLUSTRATION OF THE CAPITALIZATION RATIO:PUBLIC INSTITUTIONS 60
MEASURING RESOURCE SUFFICIENCY AND FLEXIBILITY6
56
CHAPTER SUMMARY
One of the difficulties in understanding the financial statements of higher education institutions is that not all equityaccounts have the same availability. Measuring sufficiency of resources is important, but only in the context of understand-ing whether those resources are also flexible enough to meet the institutional needs. We have designed the Primary ReserveRatio to give insight into whether the institution has sufficient flexible resources to meet its needs.
INTRODUCTION
Institutions are continuously evaluating whether or not they have adequate resources and access to a sufficient amountof funds to meet current and future operating and capital requirements. The level that defines “adequate resources”depends on an institution’s unique needs over the long term and therefore differs from institution to institution. Sincedemands typically increase over time, the institution must constantly explore methods of managing and expandingits financial base. The ratios presented in this chapter are useful in calculating whether the institution is financiallysound, and whether it has the ability to achieve and sustain a level of resources sufficient to realize its strategic objec-tives. In some institutions, the financial statements will present unrestricted net assets that, while legally available forspending, would be difficult to use on an unrestricted basis due to internal political issues, such as earmarking fordepartments, as well as donor expectations, such as the classification of appreciation on permanently restricted gifts.
Again, an institution’s needs must be linked to the mission. Determining what resources are required to enable theinstitution to achieve its strategic objectives may be the most significant issue addressed by the governing board.Included in the analysis must be the required reinvestments in program, technology and financial aid, as well as capi-tal assets. By performing this type of examination, the institution can identify whether resources are sufficient to meetits future needs in order to realize strategic objectives that support the mission. If the resources fall short, the institu-tion must analyze the following issues:
• Can resources be increased sufficiently in order to realize objectives?
• Does the institution need to reevaluate and perhaps modify its mission and priorities in light of its current andfuture resources?
The Primary Reserve Ratio is the key indicator for these specific questions. This indicator helps determine bothwhether there are sufficient resources and whether the net assets have enough flexibility.
PRIMARY RESERVE RATIO
The Primary Reserve Ratio measures the financial strength of the institution by comparing expendable net assets tototal expenses. Expendable net assets represent those assets that the institution can access relatively quickly and spendto satisfy its debt obligations. This ratio provides a snapshot of financial strength and flexibility by indicating howlong the institution could function using its expendable reserves without relying on additional net assets generated byoperations. Trend analysis indicates whether an institution has increased its net worth in proportion to the rate ofgrowth in its operating size.
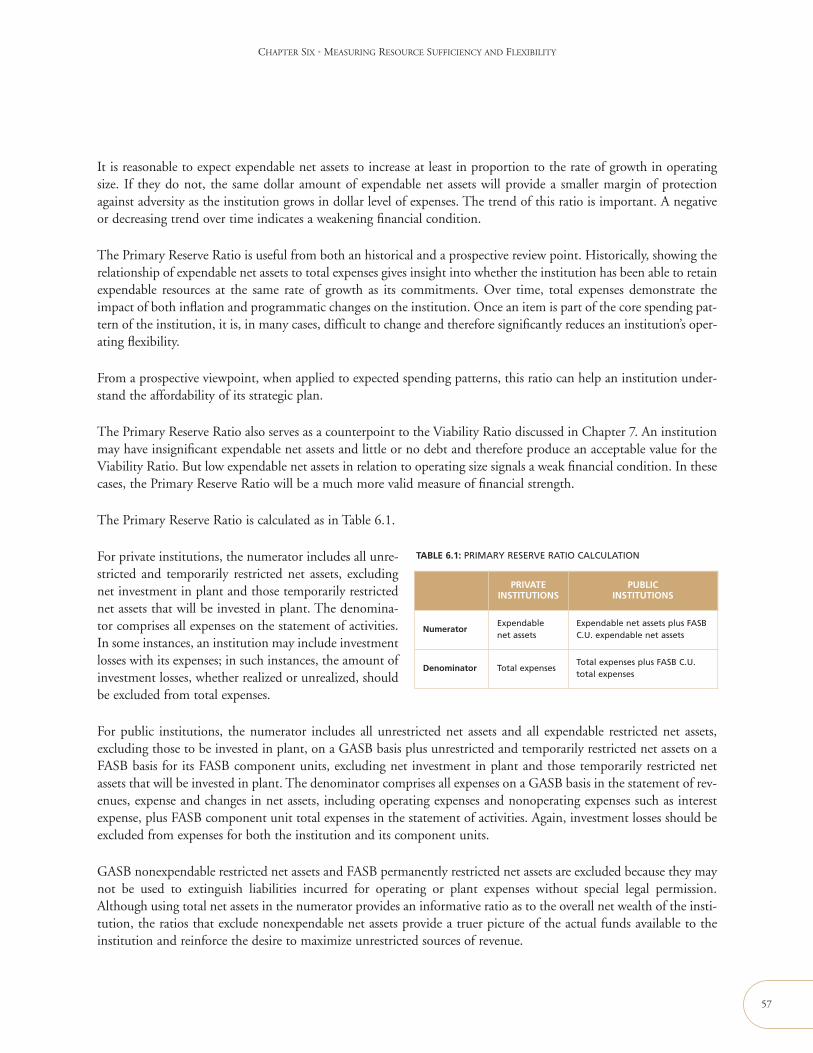
It is reasonable to expect expendable net assets to increase at least in proportion to the rate of growth in operatingsize. If they do not, the same dollar amount of expendable net assets will provide a smaller margin of protectionagainst adversity as the institution grows in dollar level of expenses. The trend of this ratio is important. A negativeor decreasing trend over time indicates a weakening financial condition.
The Primary Reserve Ratio is useful from both an historical and a prospective review point. Historically, showing therelationship of expendable net assets to total expenses gives insight into whether the institution has been able to retainexpendable resources at the same rate of growth as its commitments. Over time, total expenses demonstrate theimpact of both inflation and programmatic changes on the institution. Once an item is part of the core spending pat-tern of the institution, it is, in many cases, difficult to change and therefore significantly reduces an institution’s oper-ating flexibility.
From a prospective viewpoint, when applied to expected spending patterns, this ratio can help an institution under-stand the affordability of its strategic plan.
The Primary Reserve Ratio also serves as a counterpoint to the Viability Ratio discussed in Chapter 7. An institutionmay have insignificant expendable net assets and little or no debt and therefore produce an acceptable value for theViability Ratio. But low expendable net assets in relation to operating size signals a weak financial condition. In thesecases, the Primary Reserve Ratio will be a much more valid measure of financial strength.
The Primary Reserve Ratio is calculated as in Table 6.1.
For private institutions, the numerator includes all unre-stricted and temporarily restricted net assets, excludingnet investment in plant and those temporarily restrictednet assets that will be invested in plant. The denomina-tor comprises all expenses on the statement of activities.In some instances, an institution may include investmentlosses with its expenses; in such instances, the amount ofinvestment losses, whether realized or unrealized, shouldbe excluded from total expenses.
For public institutions, the numerator includes all unrestricted net assets and all expendable restricted net assets,excluding those to be invested in plant, on a GASB basis plus unrestricted and temporarily restricted net assets on aFASB basis for its FASB component units, excluding net investment in plant and those temporarily restricted netassets that will be invested in plant. The denominator comprises all expenses on a GASB basis in the statement of rev-enues, expense and changes in net assets, including operating expenses and nonoperating expenses such as interestexpense, plus FASB component unit total expenses in the statement of activities. Again, investment losses should beexcluded from expenses for both the institution and its component units.
GASB nonexpendable restricted net assets and FASB permanently restricted net assets are excluded because they maynot be used to extinguish liabilities incurred for operating or plant expenses without special legal permission.Although using total net assets in the numerator provides an informative ratio as to the overall net wealth of the insti-tution, the ratios that exclude nonexpendable net assets provide a truer picture of the actual funds available to theinstitution and reinforce the desire to maximize unrestricted sources of revenue.
CHAPTER SIX • MEASURING RESOURCE SUFFICIENCY AND FLEXIBILITY
57
PRIVATEINSTITUTIONS
PUBLICINSTITUTIONS
NumeratorExpendablenet assets
Expendable net assets plus FASBC.U. expendable net assets
Denominator Total expensesTotal expenses plus FASB C.U.total expenses
TABLE 6.1: PRIMARY RESERVE RATIO CALCULATION
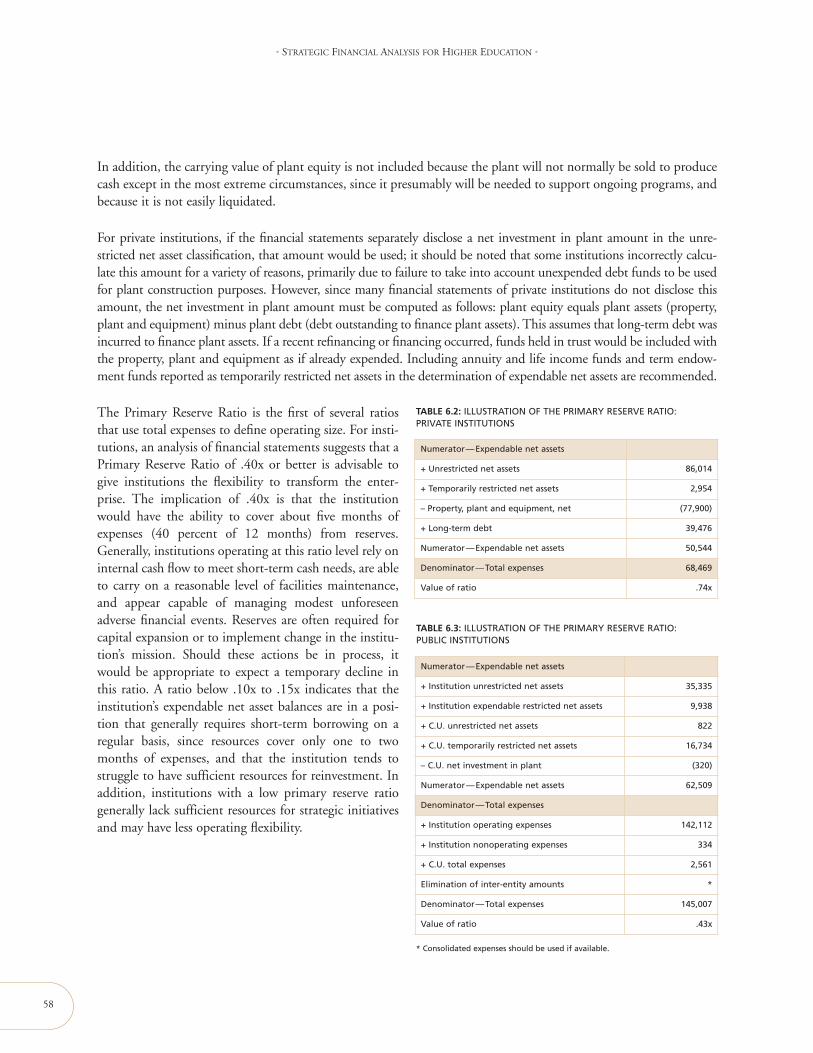
In addition, the carrying value of plant equity is not included because the plant will not normally be sold to producecash except in the most extreme circumstances, since it presumably will be needed to support ongoing programs, andbecause it is not easily liquidated.
For private institutions, if the financial statements separately disclose a net investment in plant amount in the unre-stricted net asset classification, that amount would be used; it should be noted that some institutions incorrectly calcu-late this amount for a variety of reasons, primarily due to failure to take into account unexpended debt funds to be usedfor plant construction purposes. However, since many financial statements of private institutions do not disclose thisamount, the net investment in plant amount must be computed as follows: plant equity equals plant assets (property,plant and equipment) minus plant debt (debt outstanding to finance plant assets). This assumes that long-term debt wasincurred to finance plant assets. If a recent refinancing or financing occurred, funds held in trust would be included withthe property, plant and equipment as if already expended. Including annuity and life income funds and term endow-ment funds reported as temporarily restricted net assets in the determination of expendable net assets are recommended.
The Primary Reserve Ratio is the first of several ratiosthat use total expenses to define operating size. For insti-tutions, an analysis of financial statements suggests that aPrimary Reserve Ratio of .40x or better is advisable togive institutions the flexibility to transform the enter-prise. The implication of .40x is that the institutionwould have the ability to cover about five months ofexpenses (40 percent of 12 months) from reserves.Generally, institutions operating at this ratio level rely oninternal cash flow to meet short-term cash needs, are ableto carry on a reasonable level of facilities maintenance,and appear capable of managing modest unforeseenadverse financial events. Reserves are often required forcapital expansion or to implement change in the institu-tion’s mission. Should these actions be in process, itwould be appropriate to expect a temporary decline inthis ratio. A ratio below .10x to .15x indicates that theinstitution’s expendable net asset balances are in a posi-tion that generally requires short-term borrowing on aregular basis, since resources cover only one to twomonths of expenses, and that the institution tends tostruggle to have sufficient resources for reinvestment. Inaddition, institutions with a low primary reserve ratiogenerally lack sufficient resources for strategic initiativesand may have less operating flexibility.
58
• STRATEGIC FINANCIAL ANALYSIS FOR HIGHER EDUCATION •
TABLE 6.2: ILLUSTRATION OF THE PRIMARY RESERVE RATIO:PRIVATE INSTITUTIONS
Numerator—Expendable net assets
+ Unrestricted net assets 86,014
+ Temporarily restricted net assets 2,954
– Property, plant and equipment, net (77,900)
+ Long-term debt 39,476
Numerator—Expendable net assets 50,544
Denominator—Total expenses 68,469
Value of ratio .74x
TABLE 6.3: ILLUSTRATION OF THE PRIMARY RESERVE RATIO:PUBLIC INSTITUTIONS
Numerator—Expendable net assets
+ Institution unrestricted net assets 35,335
+ Institution expendable restricted net assets 9,938
+ C.U. unrestricted net assets 822
+ C.U. temporarily restricted net assets 16,734
– C.U. net investment in plant (320)
Numerator—Expendable net assets 62,509
Denominator—Total expenses
+ Institution operating expenses 142,112
+ Institution nonoperating expenses 334
+ C.U. total expenses 2,561
Elimination of inter-entity amounts *
Denominator—Total expenses 145,007
Value of ratio .43x
* Consolidated expenses should be used if available.
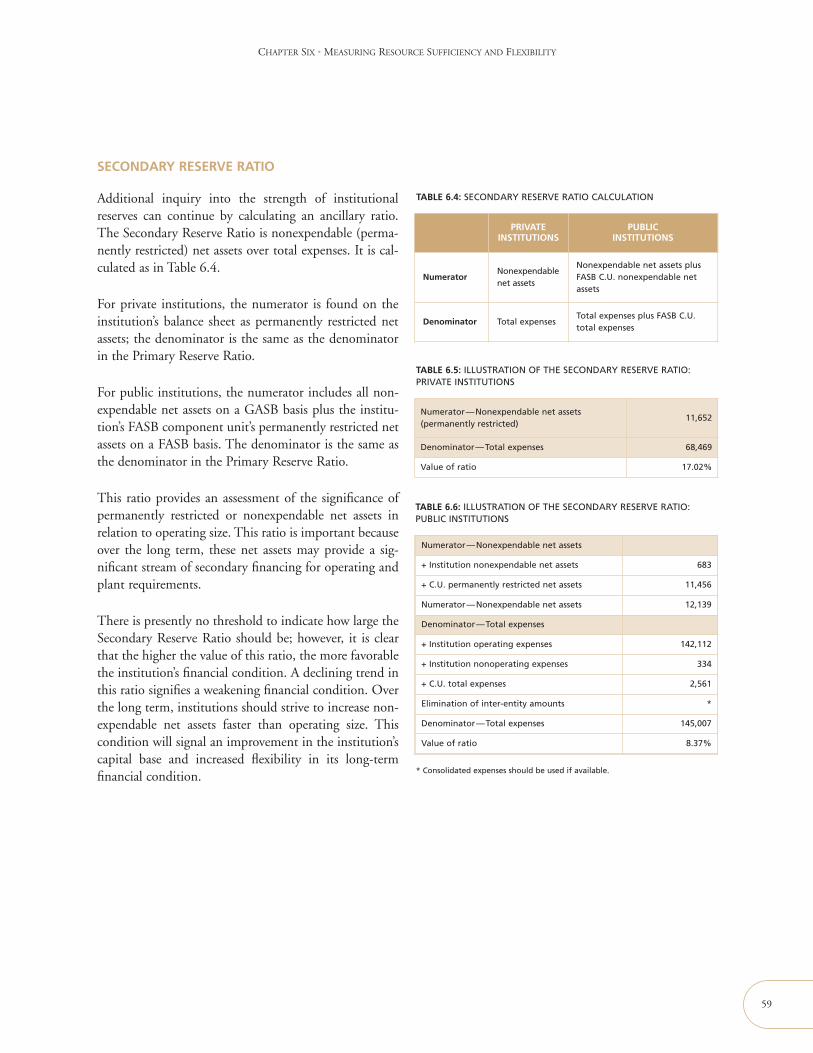
SECONDARY RESERVE RATIO
Additional inquiry into the strength of institutionalreserves can continue by calculating an ancillary ratio.The Secondary Reserve Ratio is nonexpendable (perma-nently restricted) net assets over total expenses. It is cal-culated as in Table 6.4.
For private institutions, the numerator is found on theinstitution’s balance sheet as permanently restricted netassets; the denominator is the same as the denominatorin the Primary Reserve Ratio.
For public institutions, the numerator includes all non-expendable net assets on a GASB basis plus the institu-tion’s FASB component unit’s permanently restricted netassets on a FASB basis. The denominator is the same asthe denominator in the Primary Reserve Ratio.
This ratio provides an assessment of the significance ofpermanently restricted or nonexpendable net assets inrelation to operating size. This ratio is important becauseover the long term, these net assets may provide a sig-nificant stream of secondary financing for operating andplant requirements.
There is presently no threshold to indicate how large theSecondary Reserve Ratio should be; however, it is clearthat the higher the value of this ratio, the more favorablethe institution’s financial condition. A declining trend inthis ratio signifies a weakening financial condition. Overthe long term, institutions should strive to increase non-expendable net assets faster than operating size. Thiscondition will signal an improvement in the institution’scapital base and increased flexibility in its long-termfinancial condition.
CHAPTER SIX • MEASURING RESOURCE SUFFICIENCY AND FLEXIBILITY
59
PRIVATEINSTITUTIONS
PUBLICINSTITUTIONS
NumeratorNonexpendablenet assets
Nonexpendable net assets plusFASB C.U. nonexpendable netassets
Denominator Total expensesTotal expenses plus FASB C.U.total expenses
TABLE 6.5: ILLUSTRATION OF THE SECONDARY RESERVE RATIO:PRIVATE INSTITUTIONS
Numerator—Nonexpendable net assets(permanently restricted)
11,652
Denominator—Total expenses 68,469
Value of ratio 17.02%
TABLE 6.6: ILLUSTRATION OF THE SECONDARY RESERVE RATIO:PUBLIC INSTITUTIONS
Numerator—Nonexpendable net assets
+ Institution nonexpendable net assets 683
+ C.U. permanently restricted net assets 11,456
Numerator—Nonexpendable net assets 12,139
Denominator—Total expenses
+ Institution operating expenses 142,112
+ Institution nonoperating expenses 334
+ C.U. total expenses 2,561
Elimination of inter-entity amounts *
Denominator—Total expenses 145,007
Value of ratio 8.37%
* Consolidated expenses should be used if available.
TABLE 6.4: SECONDARY RESERVE RATIO CALCULATION
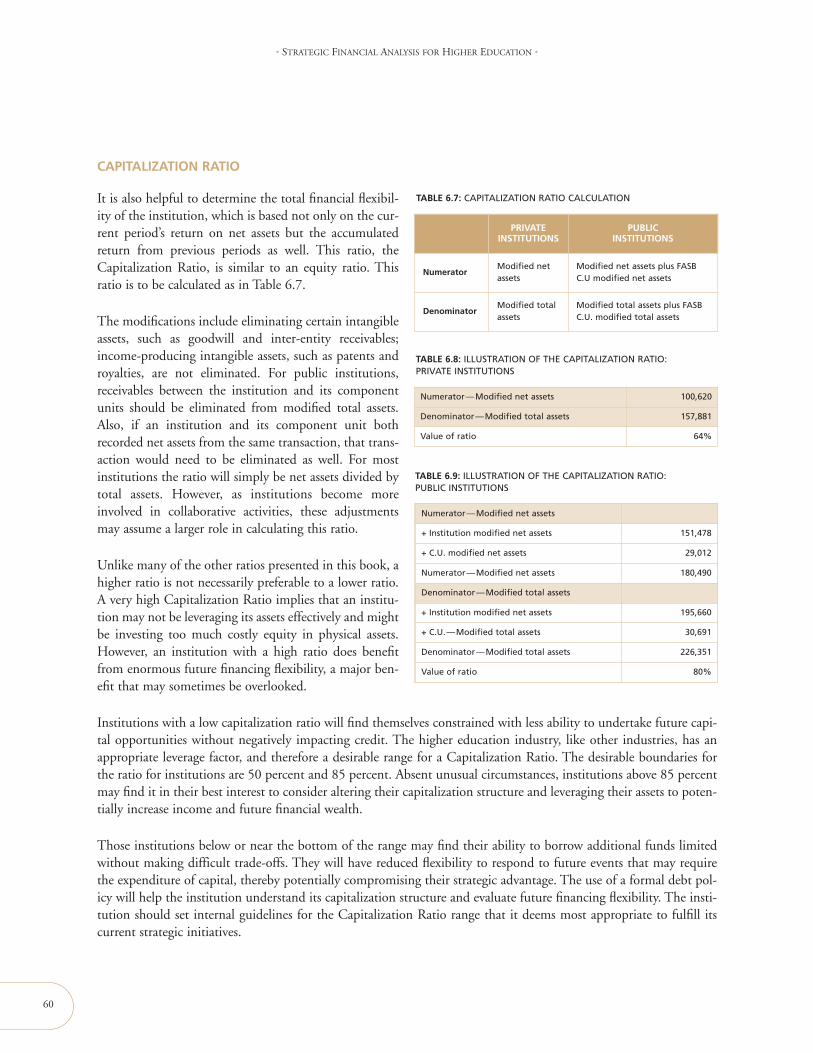
CAPITALIZATION RATIO
It is also helpful to determine the total financial flexibil-ity of the institution, which is based not only on the cur-rent period’s return on net assets but the accumulatedreturn from previous periods as well. This ratio, theCapitalization Ratio, is similar to an equity ratio. Thisratio is to be calculated as in Table 6.7.
The modifications include eliminating certain intangibleassets, such as goodwill and inter-entity receivables;income-producing intangible assets, such as patents androyalties, are not eliminated. For public institutions,receivables between the institution and its componentunits should be eliminated from modified total assets.Also, if an institution and its component unit bothrecorded net assets from the same transaction, that trans-action would need to be eliminated as well. For mostinstitutions the ratio will simply be net assets divided bytotal assets. However, as institutions become moreinvolved in collaborative activities, these adjustmentsmay assume a larger role in calculating this ratio.
Unlike many of the other ratios presented in this book, ahigher ratio is not necessarily preferable to a lower ratio.A very high Capitalization Ratio implies that an institu-tion may not be leveraging its assets effectively and mightbe investing too much costly equity in physical assets.However, an institution with a high ratio does benefitfrom enormous future financing flexibility, a major ben-efit that may sometimes be overlooked.
Institutions with a low capitalization ratio will find themselves constrained with less ability to undertake future capi-tal opportunities without negatively impacting credit. The higher education industry, like other industries, has anappropriate leverage factor, and therefore a desirable range for a Capitalization Ratio. The desirable boundaries forthe ratio for institutions are 50 percent and 85 percent. Absent unusual circumstances, institutions above 85 percentmay find it in their best interest to consider altering their capitalization structure and leveraging their assets to poten-tially increase income and future financial wealth.
Those institutions below or near the bottom of the range may find their ability to borrow additional funds limitedwithout making difficult trade-offs. They will have reduced flexibility to respond to future events that may requirethe expenditure of capital, thereby potentially compromising their strategic advantage. The use of a formal debt pol-icy will help the institution understand its capitalization structure and evaluate future financing flexibility. The insti-tution should set internal guidelines for the Capitalization Ratio range that it deems most appropriate to fulfill itscurrent strategic initiatives.
Numerator—Modified net assets
+ Institution modified net assets 151,478
+ C.U. modified net assets 29,012
Numerator—Modified net assets 180,490
Denominator—Modified total assets
+ Institution modified net assets 195,660
+ C.U.—Modified total assets 30,691
Denominator—Modified total assets 226,351
Value of ratio 80%
60
• STRATEGIC FINANCIAL ANALYSIS FOR HIGHER EDUCATION •
PRIVATEINSTITUTIONS
PUBLICINSTITUTIONS
NumeratorModified netassets
Modified net assets plus FASBC.U modified net assets
DenominatorModified totalassets
Modified total assets plus FASBC.U. modified total assets
TABLE 6.8: ILLUSTRATION OF THE CAPITALIZATION RATIO:PRIVATE INSTITUTIONS
Numerator—Modified net assets 100,620
Denominator—Modified total assets 157,881
Value of ratio 64%
TABLE 6.9: ILLUSTRATION OF THE CAPITALIZATION RATIO:PUBLIC INSTITUTIONS
TABLE 6.7: CAPITALIZATION RATIO CALCULATION
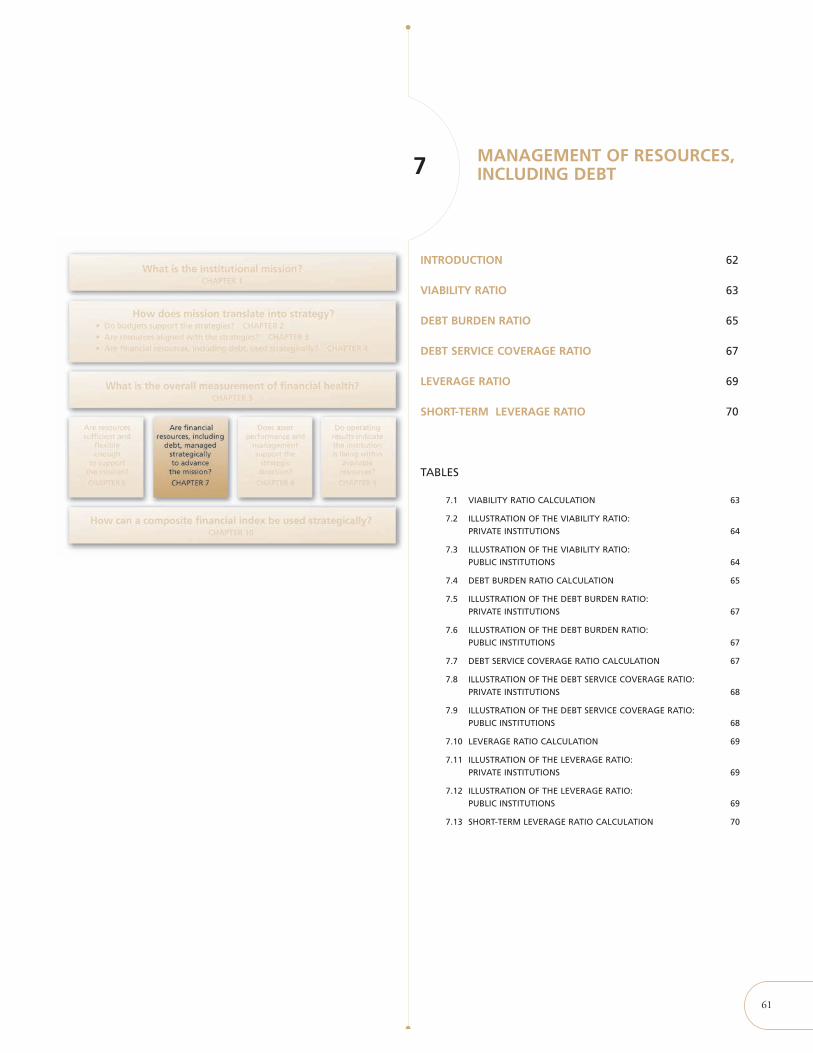
61
MANAGEMENT OF RESOURCES,INCLUDING DEBT 7
INTRODUCTION 62
VIABILITY RATIO 63
DEBT BURDEN RATIO 65
DEBT SERVICE COVERAGE RATIO 67
LEVERAGE RATIO 69
SHORT-TERM LEVERAGE RATIO 70
TABLES
7.1 VIABILITY RATIO CALCULATION 63
7.2 ILLUSTRATION OF THE VIABILITY RATIO:PRIVATE INSTITUTIONS 64
7.3 ILLUSTRATION OF THE VIABILITY RATIO:PUBLIC INSTITUTIONS 64
7.4 DEBT BURDEN RATIO CALCULATION 65
7.5 ILLUSTRATION OF THE DEBT BURDEN RATIO:PRIVATE INSTITUTIONS 67
7.6 ILLUSTRATION OF THE DEBT BURDEN RATIO:PUBLIC INSTITUTIONS 67
7.7 DEBT SERVICE COVERAGE RATIO CALCULATION 67
7.8 ILLUSTRATION OF THE DEBT SERVICE COVERAGE RATIO:PRIVATE INSTITUTIONS 68
7.9 ILLUSTRATION OF THE DEBT SERVICE COVERAGE RATIO:PUBLIC INSTITUTIONS 68
7.10 LEVERAGE RATIO CALCULATION 69
7.11 ILLUSTRATION OF THE LEVERAGE RATIO:PRIVATE INSTITUTIONS 69
7.12 ILLUSTRATION OF THE LEVERAGE RATIO:PUBLIC INSTITUTIONS 69
7.13 SHORT-TERM LEVERAGE RATIO CALCULATION 70
MANAGEMENT OF RESOURCES, INCLUDING DEBT 7
62
CHAPTER SUMMARY
In Chapter 4, we discussed debt policy development and its importance. In this chapter, we present the fundamental ratiosthat an institution can use to understand its debt position in relation to its overall financial health. These ratios will helpan institution understand when the financial burden of taking on debt outweighs its strategic usefulness to achieve mission.The primary driver of this insight is the Viability Ratio, supported by a series of other ratios that measure whether debt pay-ments are appropriately sized for the institution and whether the operations are strong enough to support the debt issued.
What is the strategic management of debt? While for many, debt revolves around a bond issue or other financial transaction,the debt management function actually is much more about internal prioritization, budgeting and strategic planning. Perhaps75 percent or more of the actual debt management function has absolutely nothing to do with a bond issue; therefore, effec-tive debt management should focus on institutional policies, internal procedures, project prioritization and funding decisions.Resulting transactions will then be structured based on the management of the entire debt portfolio and consideration of theinstitution’s assets. With the growing array and complexity of available financial products, the continuing pressure for facili-ties, and the increasing focus on balance sheet management, the financial officer’s responsibilities continue to multiply, result-ing in an increased need for policies as well as analytical tools and a framework for decision making.
INTRODUCTION
Capital for land, buildings and equipment generally comes from three or four primary sources: internally generatedfunds, contributed funds, borrowed funds and, for public institutions, government appropriations. Internally gener-ated funds and contributed funds represent institutional equity, typically the most expensive and scarce source offunding. The ratios in this chapter focus on all types of funds borrowed for capital-related purposes, regardless offinancing structure (total project-related debt), which may differ, perhaps significantly, from the long-term debtreported in the audited financial statements. While the appropriate amount and use of debt differ across institutions,all leaders should ask the same fundamental question—Has the institution managed debt (and all other sources of capi-tal) strategically to advance the mission?
At the same time, the ratios in this chapter will also help the institution understand how analysts, as well as lendersand purchasers of debt, evaluate its ability to assume and pay debt service. Methods for accessing additional resourcesto support institutional objectives include the issuance of debt and the use of alternate financing structures. If the debtthat is incurred is used to support the mission, the institution will be in a better position to achieve its long-term goalsand build competitive advantages. In contrast, if the debt is used to fund activities that do not capitalize on its com-petitive strengths, the financial situation is likely to erode, as debt capacity may cover too broad a range of activities.Thus, the institution would be no closer to having the resources needed to achieve its strategic objectives and, in fact,may have lost crucial ground in the competition for students, faculty and financial support. If the institution remainsfocused on its mission, it can use leverage effectively to deploy additional resources to achieve its long-term goals.
The following five main debt management ratios indicate an institution’s ability to assume new debt. Two of theratios, the Viability Ratio and Leverage Ratio, are statement of net assets or balance sheet measures that indicate debtcapacity and generally are regarded as governing the institution’s ability to issue new debt. However, as we have indi-cated, the debt affordability measures are at least as important, and we consider the Debt Burden Ratio and Debt
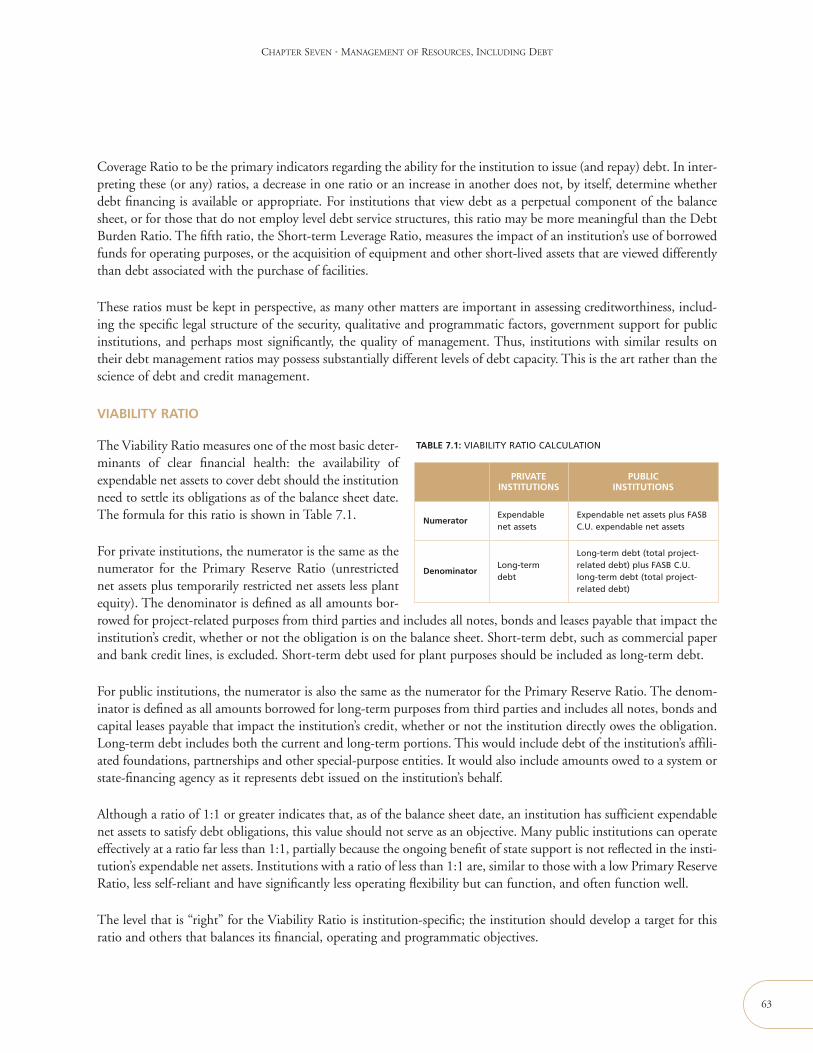
CHAPTER SEVEN • MANAGEMENT OF RESOURCES, INCLUDING DEBT
Coverage Ratio to be the primary indicators regarding the ability for the institution to issue (and repay) debt. In inter-preting these (or any) ratios, a decrease in one ratio or an increase in another does not, by itself, determine whetherdebt financing is available or appropriate. For institutions that view debt as a perpetual component of the balancesheet, or for those that do not employ level debt service structures, this ratio may be more meaningful than the DebtBurden Ratio. The fifth ratio, the Short-term Leverage Ratio, measures the impact of an institution’s use of borrowedfunds for operating purposes, or the acquisition of equipment and other short-lived assets that are viewed differentlythan debt associated with the purchase of facilities.
These ratios must be kept in perspective, as many other matters are important in assessing creditworthiness, includ-ing the specific legal structure of the security, qualitative and programmatic factors, government support for publicinstitutions, and perhaps most significantly, the quality of management. Thus, institutions with similar results ontheir debt management ratios may possess substantially different levels of debt capacity. This is the art rather than thescience of debt and credit management.
VIABILITY RATIO
The Viability Ratio measures one of the most basic deter-minants of clear financial health: the availability ofexpendable net assets to cover debt should the institutionneed to settle its obligations as of the balance sheet date.The formula for this ratio is shown in Table 7.1.
For private institutions, the numerator is the same as thenumerator for the Primary Reserve Ratio (unrestrictednet assets plus temporarily restricted net assets less plantequity). The denominator is defined as all amounts bor-rowed for project-related purposes from third parties and includes all notes, bonds and leases payable that impact theinstitution’s credit, whether or not the obligation is on the balance sheet. Short-term debt, such as commercial paperand bank credit lines, is excluded. Short-term debt used for plant purposes should be included as long-term debt.
For public institutions, the numerator is also the same as the numerator for the Primary Reserve Ratio. The denom-inator is defined as all amounts borrowed for long-term purposes from third parties and includes all notes, bonds andcapital leases payable that impact the institution’s credit, whether or not the institution directly owes the obligation.Long-term debt includes both the current and long-term portions. This would include debt of the institution’s affili-ated foundations, partnerships and other special-purpose entities. It would also include amounts owed to a system orstate-financing agency as it represents debt issued on the institution’s behalf.
Although a ratio of 1:1 or greater indicates that, as of the balance sheet date, an institution has sufficient expendablenet assets to satisfy debt obligations, this value should not serve as an objective. Many public institutions can operateeffectively at a ratio far less than 1:1, partially because the ongoing benefit of state support is not reflected in the insti-tution’s expendable net assets. Institutions with a ratio of less than 1:1 are, similar to those with a low Primary ReserveRatio, less self-reliant and have significantly less operating flexibility but can function, and often function well.
The level that is “right” for the Viability Ratio is institution-specific; the institution should develop a target for thisratio and others that balances its financial, operating and programmatic objectives.
63
PRIVATEINSTITUTIONS
PUBLICINSTITUTIONS
NumeratorExpendablenet assets
Expendable net assets plus FASBC.U. expendable net assets
DenominatorLong-termdebt
Long-term debt (total project-related debt) plus FASB C.U.long-term debt (total project-related debt)
TABLE 7.1: VIABILITY RATIO CALCULATION
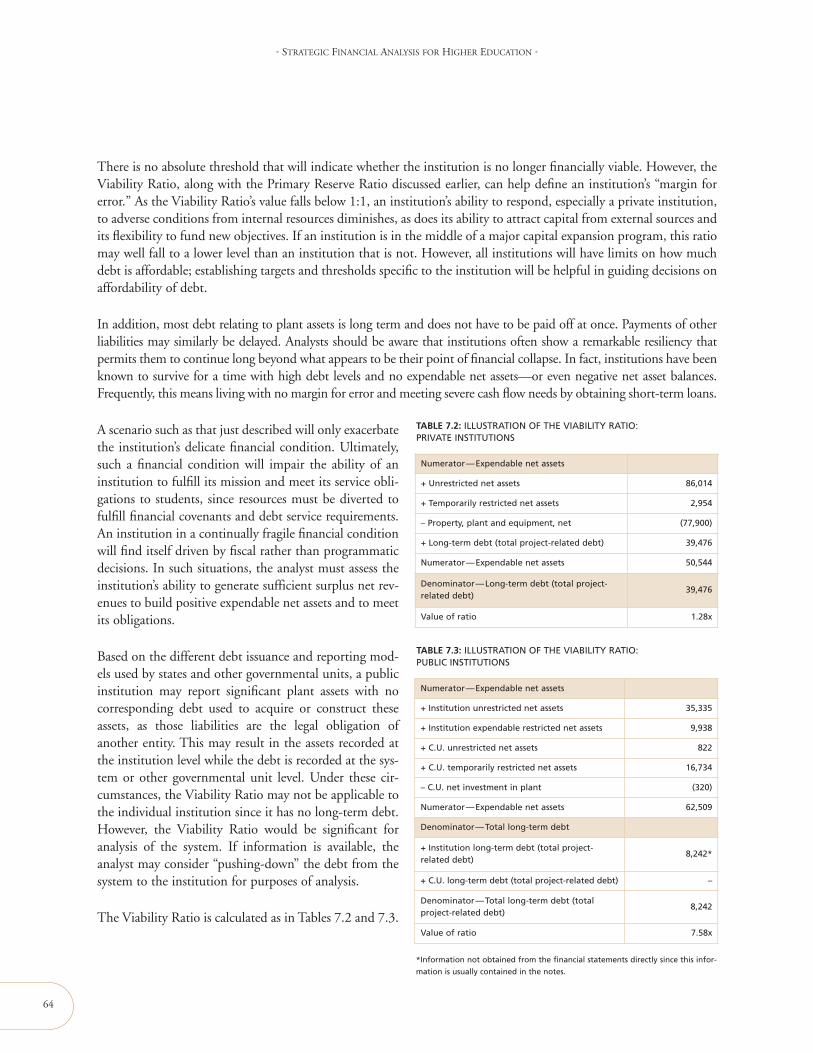
64
• STRATEGIC FINANCIAL ANALYSIS FOR HIGHER EDUCATION •
There is no absolute threshold that will indicate whether the institution is no longer financially viable. However, theViability Ratio, along with the Primary Reserve Ratio discussed earlier, can help define an institution’s “margin forerror.” As the Viability Ratio’s value falls below 1:1, an institution’s ability to respond, especially a private institution,to adverse conditions from internal resources diminishes, as does its ability to attract capital from external sources andits flexibility to fund new objectives. If an institution is in the middle of a major capital expansion program, this ratiomay well fall to a lower level than an institution that is not. However, all institutions will have limits on how muchdebt is affordable; establishing targets and thresholds specific to the institution will be helpful in guiding decisions onaffordability of debt.
In addition, most debt relating to plant assets is long term and does not have to be paid off at once. Payments of otherliabilities may similarly be delayed. Analysts should be aware that institutions often show a remarkable resiliency thatpermits them to continue long beyond what appears to be their point of financial collapse. In fact, institutions have beenknown to survive for a time with high debt levels and no expendable net assets—or even negative net asset balances.Frequently, this means living with no margin for error and meeting severe cash flow needs by obtaining short-term loans.
A scenario such as that just described will only exacerbatethe institution’s delicate financial condition. Ultimately,such a financial condition will impair the ability of aninstitution to fulfill its mission and meet its service obli-gations to students, since resources must be diverted tofulfill financial covenants and debt service requirements.An institution in a continually fragile financial conditionwill find itself driven by fiscal rather than programmaticdecisions. In such situations, the analyst must assess theinstitution’s ability to generate sufficient surplus net rev-enues to build positive expendable net assets and to meetits obligations.
Based on the different debt issuance and reporting mod-els used by states and other governmental units, a publicinstitution may report significant plant assets with nocorresponding debt used to acquire or construct theseassets, as those liabilities are the legal obligation ofanother entity. This may result in the assets recorded atthe institution level while the debt is recorded at the sys-tem or other governmental unit level. Under these cir-cumstances, the Viability Ratio may not be applicable tothe individual institution since it has no long-term debt.However, the Viability Ratio would be significant foranalysis of the system. If information is available, theanalyst may consider “pushing-down” the debt from thesystem to the institution for purposes of analysis.
The Viability Ratio is calculated as in Tables 7.2 and 7.3.
TABLE 7.2: ILLUSTRATION OF THE VIABILITY RATIO:PRIVATE INSTITUTIONS
Numerator—Expendable net assets
+ Unrestricted net assets 86,014
+ Temporarily restricted net assets 2,954
– Property, plant and equipment, net (77,900)
+ Long-term debt (total project-related debt) 39,476
Numerator—Expendable net assets 50,544
Denominator—Long-term debt (total project-related debt)
39,476
Value of ratio 1.28x
TABLE 7.3: ILLUSTRATION OF THE VIABILITY RATIO:PUBLIC INSTITUTIONS
Numerator—Expendable net assets
+ Institution unrestricted net assets 35,335
+ Institution expendable restricted net assets 9,938
+ C.U. unrestricted net assets 822
+ C.U. temporarily restricted net assets 16,734
– C.U. net investment in plant (320)
Numerator—Expendable net assets 62,509
Denominator—Total long-term debt
+ Institution long-term debt (total project-related debt)
8,242*
+ C.U. long-term debt (total project-related debt) –
Denominator—Total long-term debt (totalproject-related debt)
8,242
Value of ratio 7.58x
*Information not obtained from the financial statements directly since this infor-
mation is usually contained in the notes.

DEBT BURDEN RATIO
Although not a core strategic financial ratio, the DebtBurden Ratio is a key tool in measuring debt affordabil-ity and should be considered as a key financial indicatorfor any institution using debt. This ratio examines theinstitution’s dependence on borrowed funds as a sourceof financing its mission and the relative cost of borrow-ing to overall expenditures. It compares the level of cur-rent debt service with the institution’s total expenditures.Debt service includes both interest and principal pay-ments. This ratio is calculated as in Table 7.4.
For private institutions, the numerator of this ratio includes interest on all indebtedness, which is approximated byinterest paid, plus the current year’s principal payments; both are generally available from the statements of cash flows.However, if an institution or affiliate has refinanced debt, the statement of cash flows would present a large principalrepayment amount. In these cases, the contractual principal repayment amount would be the more appropriateamount to use. This can usually be found in the notes to financial statements. The debt service figure may be adjusted(see below). The denominator is total expenses from the statement of activities (both operating and nonoperating),less depreciation expense plus debt service principal payments.
For public institutions, the numerator of this ratio includes interest on all indebtedness, which is approximated byinterest paid, plus the current year’s principal payments; both generally are available from the GASB and FASB com-ponent unit statements of cash flows. However, if an institution or affiliate has refinanced debt, the statement of cashflows would reflect a large principal repayment amount, and the contractual principal amount would be more appro-priate to use, which can usually be found in the notes to the financial statements. The denominator is total GASBoperating expenses plus nonoperating expenses less depreciation expense plus debt service principal payments, plusFASB component unit total expenses less depreciation expense plus debt service principal payments. Even if the com-ponent units are fundraising entities, inclusion of their expenses in the denominator is appropriate. Including thecomponent unit portion in the numerator calculation would not be appropriate unless the component units wereoperating entities.
Alternatively, some institutions prefer to measure debt service as a percentage of total revenues. The rationale for usinga revenue measure is that the revenues represent the actual source of funds to pay debt service, and the use of anexpenditure measure provides an incentive to grow rather than limit expenditures, since a growing expense base, evenabsent growth in revenues, would make the institution look better for this ratio. While we agree with these observa-tions, we find difficulty in managing to a ratio based on revenues, due to the significant volatility in total revenuesfrom year to year caused by operating gifts, investment performance or state appropriations.
We believe it is important to calculate the Debt Burden Ratio (and other ratios) for the institution as a whole, sinceit provides a clearer picture of the overall flexibility available for the institution if it needs to make budgetary trade-offs in order to finance additional capital expenditures. This ratio helps show that all financial decisions made by theinstitution have an impact on its ability to make other choices and therefore must be considered in this context.
CHAPTER SEVEN • MANAGEMENT OF RESOURCES, INCLUDING DEBT
65
PRIVATEINSTITUTIONS
PUBLICINSTITUTIONS
Numerator Debt serviceDebt service plus FASB C.U.debt service
DenominatorAdjustedexpenses
Adjusted expenses plus FASBC.U. adjusted expenses
TABLE 7.4: DEBT BURDEN RATIO CALCULATION

66
• STRATEGIC FINANCIAL ANALYSIS FOR HIGHER EDUCATION •
The industry often has viewed an upper threshold for this ratio at 7 percent, meaning that current principal paymentsand interest expense should not represent more than 7 percent of total expenditures; however, a number of institu-tions operate effectively with a higher ratio, while others would find this ratio unacceptable.
Because debt service represents required payments from the operating budget, a higher debt service burden indicatesthat the institution has less flexibility to manage the remaining portion of the budget. Institutions with greater budg-etary flexibility will find that they are comfortable with a higher ratio than institutions with little ability to makeadjustments to the operating budget, either by increasing revenues or decreasing expenditures. This is the reason whyinstitutions with a more diverse revenue stream may be comfortable with a higher Debt Burden Ratio than institu-tions dependent on tuition or certain public institutions with minimal control of their operating budgets.Furthermore, it is those institutions able to withstand a higher debt service burden that are in a better position to bearthe risks associated with variable rate debt or other types of financings. At the same time, institutions uncomfortablewith a higher debt service burden may be enticed by the lower interest rates typically offered by variable rate prod-ucts, yet it is precisely these institutions that have little maneuvering room to adjust the budget if interest rates increasesignificantly. We therefore recommend that institutions with variable rate debt budget at an interest rate higher thanthe actual interest rate (especially in low interest rate environments) and establish a rate stabilization fund.
Normalizing debt service to account for variable rate debt or nonlevel debt structures is important for both internalor peer comparisons. An institution with a higher amount of debt may have a lower debt burden, either due to lessamortization or use of different types of debt. It may not indicate an actually lower debt burden over time. In calcu-lating a Debt Service Burden Ratio, institutions with a significant amount of variable rate debt may wish to use anaverage rate for calculations or use a corporate cost of capital (e.g., internal billing rate) multiplied by the outstand-ing debt in order to calculate interest, and use a “level” assumed amortization for principal (e.g., 1/30th of total debtoutstanding as the principal component).
While 7 percent is a generally accepted threshold, it is important to note that institutions that exceed 7 percent willnot necessarily be excluded from obtaining additional external funding. It is clear, however, that institutions above thisthreshold will face greater scrutiny from rating agencies and lenders. Since debt service is a legal claim on resources, thehigher the ratio the fewer the resources available for other operational needs. Therefore, allocating a higher percentageof the budget to debt service represents a prioritization made by the institution, such as making needed improvementsto the physical plant over increasing financial aid or investment in new programs. As long as this choice is recognizedand accepted, a higher ratio can be acceptable, especially for a short period of time. A level trend or a decreasing trendindicates that debt service has sufficient coverage without impinging further on financial resources required to supportother functional areas. On the other hand, a rising trend in this ratio usually signifies an increasing demand on finan-cial resources to repay debt.
The determination of an acceptable debt burden is influenced by a number of factors. Although this ratio is based onthe total budget (as indicated by total expenses), the actual burden on the institution depends on the nature of the rev-enues. Two institutions with similar budgets, yet where one has far more flexibility in allocating funds, have very dif-ferent levels of affordability. For the institution with a great degree of budget flexibility, finding the repayment sourcefor an incremental $1 is not as difficult as for the institution that has much of its budget committed. The actual por-tion of the budget that is truly available for reallocation and being devoted to debt service, for many institutions, issurprisingly small. While we propose 7 percent as a desired limit or target, we recognize that for some institutions, 5percent or less may be more realistic (e.g., large institutions with a substantial restricted research budget) and some insti-tutions can function with 7–10 percent of the budget dedicated to debt service, although we believe that sustainingthis level of expenditure will be difficult over the long term and reduce the flexibility to fund other strategic initiatives.
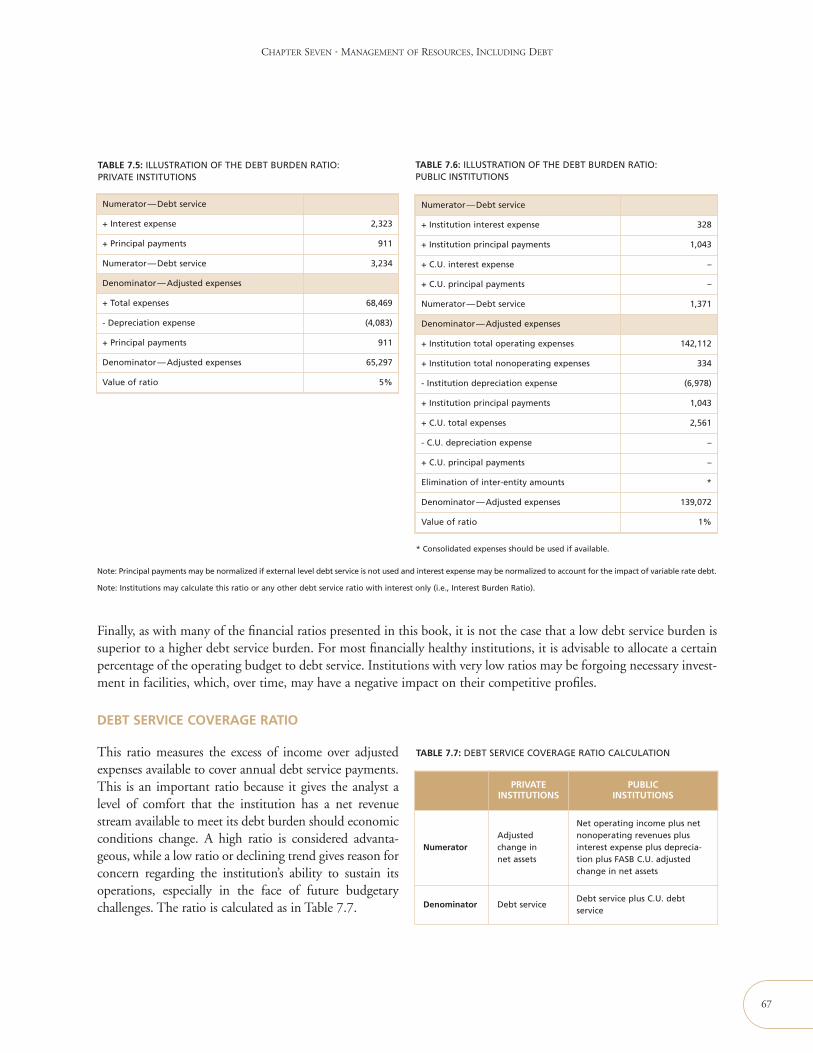
CHAPTER SEVEN • MANAGEMENT OF RESOURCES, INCLUDING DEBT
Finally, as with many of the financial ratios presented in this book, it is not the case that a low debt service burden issuperior to a higher debt service burden. For most financially healthy institutions, it is advisable to allocate a certainpercentage of the operating budget to debt service. Institutions with very low ratios may be forgoing necessary invest-ment in facilities, which, over time, may have a negative impact on their competitive profiles.
DEBT SERVICE COVERAGE RATIO
This ratio measures the excess of income over adjustedexpenses available to cover annual debt service payments.This is an important ratio because it gives the analyst alevel of comfort that the institution has a net revenuestream available to meet its debt burden should economicconditions change. A high ratio is considered advanta-geous, while a low ratio or declining trend gives reason forconcern regarding the institution’s ability to sustain itsoperations, especially in the face of future budgetarychallenges. The ratio is calculated as in Table 7.7.
67
TABLE 7.5: ILLUSTRATION OF THE DEBT BURDEN RATIO:PRIVATE INSTITUTIONS
Numerator—Debt service
+ Interest expense 2,323
+ Principal payments 911
Numerator—Debt service 3,234
Denominator—Adjusted expenses
+ Total expenses 68,469
- Depreciation expense (4,083)
+ Principal payments 911
Denominator—Adjusted expenses 65,297
Value of ratio 5%
TABLE 7.6: ILLUSTRATION OF THE DEBT BURDEN RATIO:PUBLIC INSTITUTIONS
Numerator—Debt service
+ Institution interest expense 328
+ Institution principal payments 1,043
+ C.U. interest expense –
+ C.U. principal payments –
Numerator—Debt service 1,371
Denominator—Adjusted expenses
+ Institution total operating expenses 142,112
+ Institution total nonoperating expenses 334
- Institution depreciation expense (6,978)
+ Institution principal payments 1,043
+ C.U. total expenses 2,561
- C.U. depreciation expense –
+ C.U. principal payments –
Elimination of inter-entity amounts *
Denominator—Adjusted expenses 139,072
Value of ratio 1%
Note: Principal payments may be normalized if external level debt service is not used and interest expense may be normalized to account for the impact of variable rate debt.
Note: Institutions may calculate this ratio or any other debt service ratio with interest only (i.e., Interest Burden Ratio).
PRIVATEINSTITUTIONS
PUBLICINSTITUTIONS
NumeratorAdjustedchange innet assets
Net operating income plus netnonoperating revenues plusinterest expense plus deprecia-tion plus FASB C.U. adjustedchange in net assets
Denominator Debt serviceDebt service plus C.U. debtservice
* Consolidated expenses should be used if available.
TABLE 7.7: DEBT SERVICE COVERAGE RATIO CALCULATION
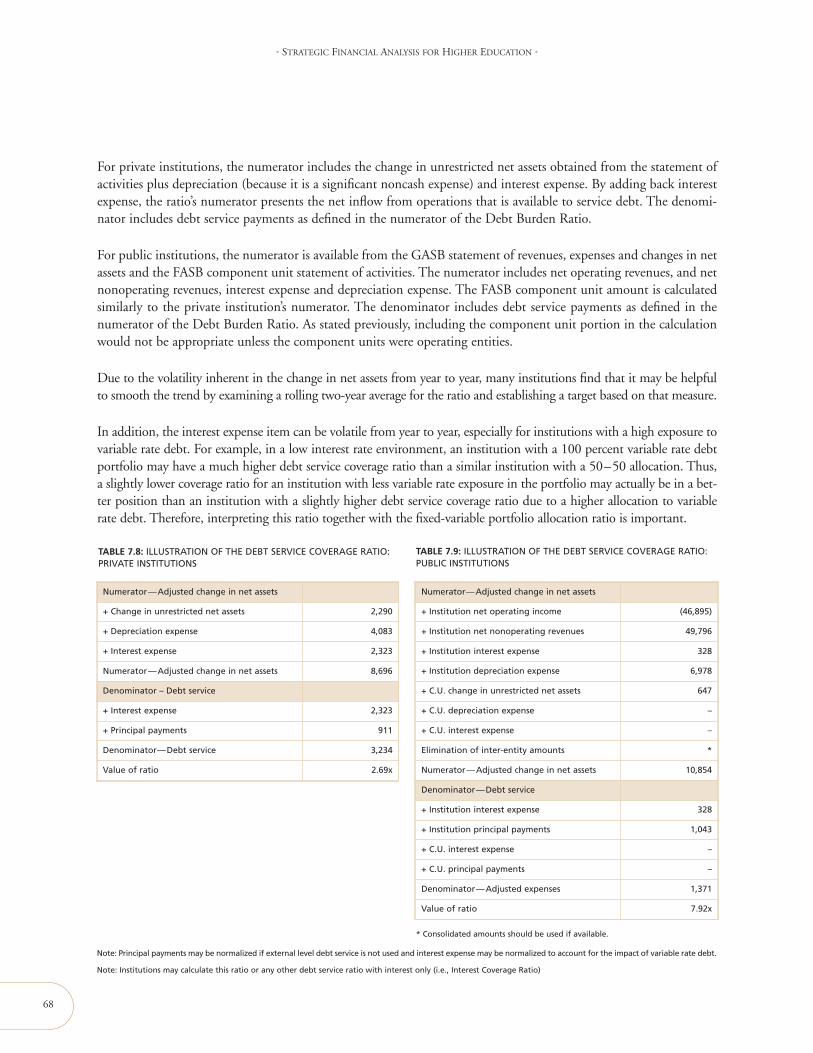
68
• STRATEGIC FINANCIAL ANALYSIS FOR HIGHER EDUCATION •
For private institutions, the numerator includes the change in unrestricted net assets obtained from the statement ofactivities plus depreciation (because it is a significant noncash expense) and interest expense. By adding back interestexpense, the ratio’s numerator presents the net inflow from operations that is available to service debt. The denomi-nator includes debt service payments as defined in the numerator of the Debt Burden Ratio.
For public institutions, the numerator is available from the GASB statement of revenues, expenses and changes in netassets and the FASB component unit statement of activities. The numerator includes net operating revenues, and netnonoperating revenues, interest expense and depreciation expense. The FASB component unit amount is calculatedsimilarly to the private institution’s numerator. The denominator includes debt service payments as defined in thenumerator of the Debt Burden Ratio. As stated previously, including the component unit portion in the calculationwould not be appropriate unless the component units were operating entities.
Due to the volatility inherent in the change in net assets from year to year, many institutions find that it may be helpfulto smooth the trend by examining a rolling two-year average for the ratio and establishing a target based on that measure.
In addition, the interest expense item can be volatile from year to year, especially for institutions with a high exposure tovariable rate debt. For example, in a low interest rate environment, an institution with a 100 percent variable rate debtportfolio may have a much higher debt service coverage ratio than a similar institution with a 50–50 allocation. Thus,a slightly lower coverage ratio for an institution with less variable rate exposure in the portfolio may actually be in a bet-ter position than an institution with a slightly higher debt service coverage ratio due to a higher allocation to variablerate debt. Therefore, interpreting this ratio together with the fixed-variable portfolio allocation ratio is important.
TABLE 7.8: ILLUSTRATION OF THE DEBT SERVICE COVERAGE RATIO:PRIVATE INSTITUTIONS
Numerator—Adjusted change in net assets
+ Change in unrestricted net assets 2,290
+ Depreciation expense 4,083
+ Interest expense 2,323
Numerator—Adjusted change in net assets 8,696
Denominator – Debt service
+ Interest expense 2,323
+ Principal payments 911
Denominator—Debt service 3,234
Value of ratio 2.69x
TABLE 7.9: ILLUSTRATION OF THE DEBT SERVICE COVERAGE RATIO:PUBLIC INSTITUTIONS
Numerator—Adjusted change in net assets
+ Institution net operating income (46,895)
+ Institution net nonoperating revenues 49,796
+ Institution interest expense 328
+ Institution depreciation expense 6,978
+ C.U. change in unrestricted net assets 647
+ C.U. depreciation expense –
+ C.U. interest expense –
Elimination of inter-entity amounts *
Numerator—Adjusted change in net assets 10,854
Denominator—Debt service
+ Institution interest expense 328
+ Institution principal payments 1,043
+ C.U. interest expense –
+ C.U. principal payments –
Denominator—Adjusted expenses 1,371
Value of ratio 7.92x
Note: Principal payments may be normalized if external level debt service is not used and interest expense may be normalized to account for the impact of variable rate debt.
Note: Institutions may calculate this ratio or any other debt service ratio with interest only (i.e., Interest Coverage Ratio)
* Consolidated amounts should be used if available.
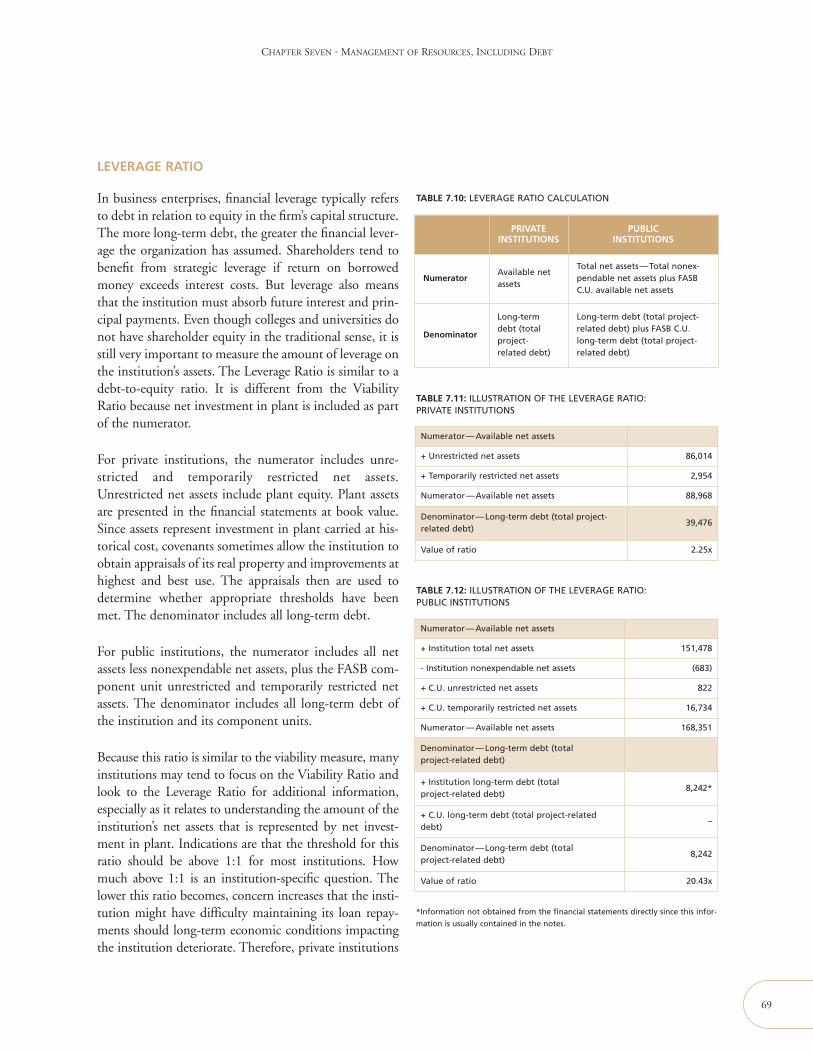
LEVERAGE RATIO
In business enterprises, financial leverage typically refersto debt in relation to equity in the firm’s capital structure.The more long-term debt, the greater the financial lever-age the organization has assumed. Shareholders tend tobenefit from strategic leverage if return on borrowedmoney exceeds interest costs. But leverage also meansthat the institution must absorb future interest and prin-cipal payments. Even though colleges and universities donot have shareholder equity in the traditional sense, it isstill very important to measure the amount of leverage onthe institution’s assets. The Leverage Ratio is similar to adebt-to-equity ratio. It is different from the ViabilityRatio because net investment in plant is included as partof the numerator.
For private institutions, the numerator includes unre-stricted and temporarily restricted net assets.Unrestricted net assets include plant equity. Plant assetsare presented in the financial statements at book value.Since assets represent investment in plant carried at his-torical cost, covenants sometimes allow the institution toobtain appraisals of its real property and improvements athighest and best use. The appraisals then are used todetermine whether appropriate thresholds have beenmet. The denominator includes all long-term debt.
For public institutions, the numerator includes all netassets less nonexpendable net assets, plus the FASB com-ponent unit unrestricted and temporarily restricted netassets. The denominator includes all long-term debt ofthe institution and its component units.
Because this ratio is similar to the viability measure, manyinstitutions may tend to focus on the Viability Ratio andlook to the Leverage Ratio for additional information,especially as it relates to understanding the amount of theinstitution’s net assets that is represented by net invest-ment in plant. Indications are that the threshold for thisratio should be above 1:1 for most institutions. Howmuch above 1:1 is an institution-specific question. Thelower this ratio becomes, concern increases that the insti-tution might have difficulty maintaining its loan repay-ments should long-term economic conditions impactingthe institution deteriorate. Therefore, private institutions
CHAPTER SEVEN • MANAGEMENT OF RESOURCES, INCLUDING DEBT
69
PRIVATEINSTITUTIONS
PUBLICINSTITUTIONS
NumeratorAvailable netassets
Total net assets—Total nonex-pendable net assets plus FASBC.U. available net assets
Denominator
Long-termdebt (totalproject-related debt)
Long-term debt (total project-related debt) plus FASB C.U.long-term debt (total project-related debt)
TABLE 7.11: ILLUSTRATION OF THE LEVERAGE RATIO:PRIVATE INSTITUTIONS
Numerator—Available net assets
+ Unrestricted net assets 86,014
+ Temporarily restricted net assets 2,954
Numerator—Available net assets 88,968
Denominator—Long-term debt (total project-related debt)
39,476
Value of ratio 2.25x
TABLE 7.12: ILLUSTRATION OF THE LEVERAGE RATIO:PUBLIC INSTITUTIONS
Numerator—Available net assets
+ Institution total net assets 151,478
- Institution nonexpendable net assets (683)
+ C.U. unrestricted net assets 822
+ C.U. temporarily restricted net assets 16,734
Numerator—Available net assets 168,351
Denominator—Long-term debt (totalproject-related debt)
+ Institution long-term debt (totalproject-related debt)
8,242*
+ C.U. long-term debt (total project-relateddebt)
–
Denominator—Long-term debt (totalproject-related debt)
8,242
Value of ratio 20.43x
*Information not obtained from the financial statements directly since this infor-
mation is usually contained in the notes.
TABLE 7.10: LEVERAGE RATIO CALCULATION
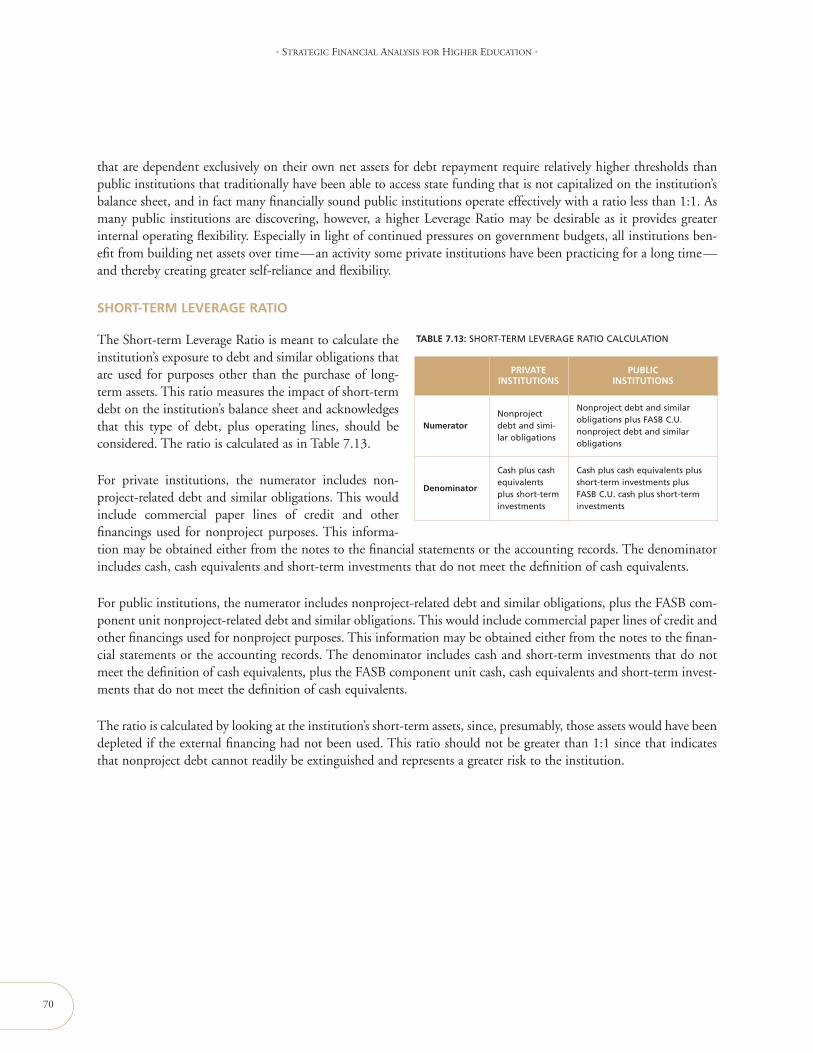
that are dependent exclusively on their own net assets for debt repayment require relatively higher thresholds thanpublic institutions that traditionally have been able to access state funding that is not capitalized on the institution’sbalance sheet, and in fact many financially sound public institutions operate effectively with a ratio less than 1:1. Asmany public institutions are discovering, however, a higher Leverage Ratio may be desirable as it provides greaterinternal operating flexibility. Especially in light of continued pressures on government budgets, all institutions ben-efit from building net assets over time—an activity some private institutions have been practicing for a long time—and thereby creating greater self-reliance and flexibility.
SHORT-TERM LEVERAGE RATIO
The Short-term Leverage Ratio is meant to calculate theinstitution’s exposure to debt and similar obligations thatare used for purposes other than the purchase of long-term assets. This ratio measures the impact of short-termdebt on the institution’s balance sheet and acknowledgesthat this type of debt, plus operating lines, should beconsidered. The ratio is calculated as in Table 7.13.
For private institutions, the numerator includes non-project-related debt and similar obligations. This wouldinclude commercial paper lines of credit and otherfinancings used for nonproject purposes. This informa-tion may be obtained either from the notes to the financial statements or the accounting records. The denominatorincludes cash, cash equivalents and short-term investments that do not meet the definition of cash equivalents.
For public institutions, the numerator includes nonproject-related debt and similar obligations, plus the FASB com-ponent unit nonproject-related debt and similar obligations. This would include commercial paper lines of credit andother financings used for nonproject purposes. This information may be obtained either from the notes to the finan-cial statements or the accounting records. The denominator includes cash and short-term investments that do notmeet the definition of cash equivalents, plus the FASB component unit cash, cash equivalents and short-term invest-ments that do not meet the definition of cash equivalents.
The ratio is calculated by looking at the institution’s short-term assets, since, presumably, those assets would have beendepleted if the external financing had not been used. This ratio should not be greater than 1:1 since that indicatesthat nonproject debt cannot readily be extinguished and represents a greater risk to the institution.
70
• STRATEGIC FINANCIAL ANALYSIS FOR HIGHER EDUCATION •
PRIVATEINSTITUTIONS
PUBLICINSTITUTIONS
NumeratorNonprojectdebt and simi-lar obligations
Nonproject debt and similarobligations plus FASB C.U.nonproject debt and similarobligations
Denominator
Cash plus cashequivalentsplus short-terminvestments
Cash plus cash equivalents plusshort-term investments plusFASB C.U. cash plus short-terminvestments
TABLE 7.13: SHORT-TERM LEVERAGE RATIO CALCULATION

71
MEASURING ASSET PERFORMANCEAND MANAGEMENT
8
INTRODUCTION 72
RETURN ON NET ASSETS RATIO 73
FINANCIAL NET ASSETS RATIO 75
PHYSICAL ASSET PERFORMANCE AND MANAGEMENT 76
PHYSICAL NET ASSETS RATIO 76
PHYSICAL ASSET REINVESTMENT RATIO 77
AGE OF FACILITIES RATIO 78
FACILITIES BURDEN RATIO 79
FACILITIES MAINTENANCE RATIO 80
DEFERRED MAINTENANCE RATIO 81
TABLES
8.1 RETURN ON NET ASSETS RATIO CALCULATION 74
8.2 ILLUSTRATION OF THE RETURN ON NET ASSETS RATIO:PRIVATE INSTITUTIONS 74
8.3 ILLUSTRATION OF THE RETURN ON NET ASSETS RATIO:PUBLIC INSTITUTIONS 74
8.4 FINANCIAL NET ASSETS RATIO CALCULATION 75
8.5 ILLUSTRATION OF THE FINANCIAL NET ASSETS RATIO:PRIVATE INSTITUTIONS 75
8.6 ILLUSTRATION OF THE FINANCIAL NET ASSETS RATIO:PUBLIC INSTITUTIONS 75
8.7 PHYSICAL NET ASSETS RATIO CALCULATION 76
8.8 ILLUSTRATION OF THE PHYSICAL NET ASSETS RATIO:PRIVATE INSTITUTIONS 76
8.9 ILLUSTRATION OF THE PHYSICAL NET ASSETS RATIO:PUBLIC INSTITUTIONS 76
8.10 PHYSICAL ASSET REINVESTMENT RATIO CALCULATION 77
8.11 ILLUSTRATION OF THE PHYSICAL ASSET REINVESTMENTRATIO: PRIVATE INSTITUTIONS 77
8.12 ILLUSTRATION OF THE PHYSICAL ASSET REINVESTMENTRATIO: PUBLIC INSTITUTIONS 77
8.13 AGE OF FACILITIES RATIO CALCULATION 78
8.14 ILLUSTRATION OF THE AGE OF FACILITIES RATIO:PRIVATE INSTITUTIONS 78
8.15 ILLUSTRATION OF THE AGE OF FACILITIES RATIO:PUBLIC INSTITUTIONS 78
8.16 FACILITIES BURDEN RATIO CALCULATION 79
8.17 FACILITIES MAINTENANCE RATIO CALCULATION 80
8.18 ILLUSTRATION OF THE FACILITY MAINTENANCE RATIO:PRIVATE INSTITUTIONS 80
8.19 ILLUSTRATION OF THE FACILITY MAINTENANCE RATIO:PUBLIC INSTITUTIONS 80
8.20 DEFERRED MAINTENANCE RATIO CALCULATION 81
MEASURING ASSET PERFORMANCE AND MANAGEMENT8
72
CHAPTER SUMMARY
All of the assets that are under the stewardship of a board and senior management need to demonstrate some financial returnover a long period of time or the institution will be consumed by deficits that draw resources away from other activities. Thischapter helps an institution understand whether the investments it has historically made are obtaining returns that can bereinvested in other programs and/or facilities.
INTRODUCTION
Higher education is an asset-intensive industry, requiring institutions to possess significant amounts of financial andphysical assets to fulfill their missions. Institutions must effectively and efficiently manage their assets for optimumperformance. Institutions also face critical decisions on the amount, timing and nature of asset deployment andallocation.
In the fourth edition of Ratio Analysis for Higher Education, we introduced several new financial asset ratios. We alsorevitalized several physical asset ratios from previous editions. These have generally performed well for privateinstitutions and we believe they will work well for public institutions.
As we continued our work with various types of institutions since publication of the fourth edition, two mattersbecame apparent concerning asset management. First, although financial asset measures, performance reporting andplanning have been regularly calculated and quantified, physical asset measures, management, performance reportingand planning have lagged behind, even though physical asset values sometimes exceed financial asset values for manyinstitutions. Second, the need for integrating the planning of financial and physical assets has become critical formany institutions, public and private. In addition, the implicit (and sometimes explicit) covenant between publicinstitutions and their sponsoring governments to fund maintenance and physical asset needs has been called intoquestion due to financial constraints of the sponsoring governments.
As a result, we have revised our overall question from one of financial asset performance to one encompassing all typesof assets, addressing both their management and performance.
For this edition, we have defined physical assets to be buildings, land, infrastructure, equipment and other types ofplant assets, including technology infrastructure; financial assets are all other assets since they will ultimately beconverted into cash or invested over a long-term horizon. This same principle also applies to net assets.
This chapter is segregated into two sections—financial assets and physical assets. We have also added several newratios to this edition. Our institutional core ratio, the Return on Net Asset Ratio, remains and takes on greater impor-tance since it reflects performance of both physical and financial assets.
Institutions often are concerned about whether the rate of growth in their net assets is sufficient to support theinstitution over time. If net assets continue to grow each year, the institution is presumed wealthier than it was theprevious year. However, the rate of growth, in relation to commitments made, and the type of net asset growth arebetter indicators of whether the institution is improving its financial ability to achieve its strategic objectives.

CHAPTER EIGHT • MEASURING ASSET PERFORMANCE AND MANAGEMENT
The ratios in this chapter strive to address the following questions:
• Is the institution better off financially at the end of the year than at the beginning of the year?
• Is the institution sufficiently invested in financial assets to continue expanding its equity?
• Is the institution making appropriate investments and maximizing their return for appropriate levels of risk?
• Is the institution adequately reinvesting and renewing its physical assets?
Several ratios supporting the core Return on Net Assets Ratio are new. Although there is no capital structure or equitycomposition that is appropriate for all institutions, the ancillary ratios provide insight into the flexibility that the insti-tution has to respond to additional opportunities and capital needs and whether those capital needs are being met.
RETURN ON NET ASSETS RATIO
This ratio determines whether the institution is financially better off than in previous years by measuring totaleconomic return. This ratio furnishes a broad measure of the change in an institution’s total wealth over a single yearand is based on the level and change in total net assets, regardless of asset classification. Thus, the ratio provides themost comprehensive measure of the growth or decline in total wealth of an institution over a specific period of time.
A decline in this ratio may be appropriate and even warranted if it reflects a strategy to better fulfill the institution’smission. On the other hand, an improving trend in this ratio indicates that the institution is increasing its net assetsand is likely to be able to set aside financial resources to strengthen its future financial flexibility.
The Return on Net Assets Ratio, like all the others, is better applied over an extended period so that the results oflong-term plans are measured. Long-term returns are quite volatile and vary significantly based on the prevailing levelof inflation in the economy. Therefore, establishing fixed nominal return targets is not possible. Rather, institutionsshould establish a real rate of return target in the range of approximately 3 to 4 percent. The real return plus the actualinflation index, either the Consumer Price Index (CPI) or the Higher Education Price Index (HEPI) will produce thenominal rate of return. A useful proxy to measure changes specific to an institution from the impact of both inflationand programmatic commitments may be the growth of total expenses over a long period of time. However, as witheach ratio, there are no absolute measures. For example, if an institution’s strategic plan calls for activities that willconsume substantial resources, such as program expansion, a high return on net assets may be required in order tomaintain a properly capitalized institution.
Because the Return on Net Assets Ratio is affected by a number of potentially volatile items, it is important that theinstitution understand the causes of the change in this ratio from year to year. If, for example, large investment returnsor nonrecurring gains are providing a substantial percentage of the increase in net assets, any market correction couldhave negative implications, possibly impacting program financing.
It is important that an institution project this ratio under various future assumptions. In years of high investmentreturns, net assets can increase substantially over the short term, thereby improving the ratio. However, positiveexternal developments may imply that an institution has the capacity to defer cost-reducing activities or postponenecessary adjustments to tuition levels. Then, when market conditions become relatively flat or turn negative, theinstitution could find its financial performance inadequate. If so, an extended period may be spent attempting torecover, possibly at the expense of necessary programmatic initiatives.
73
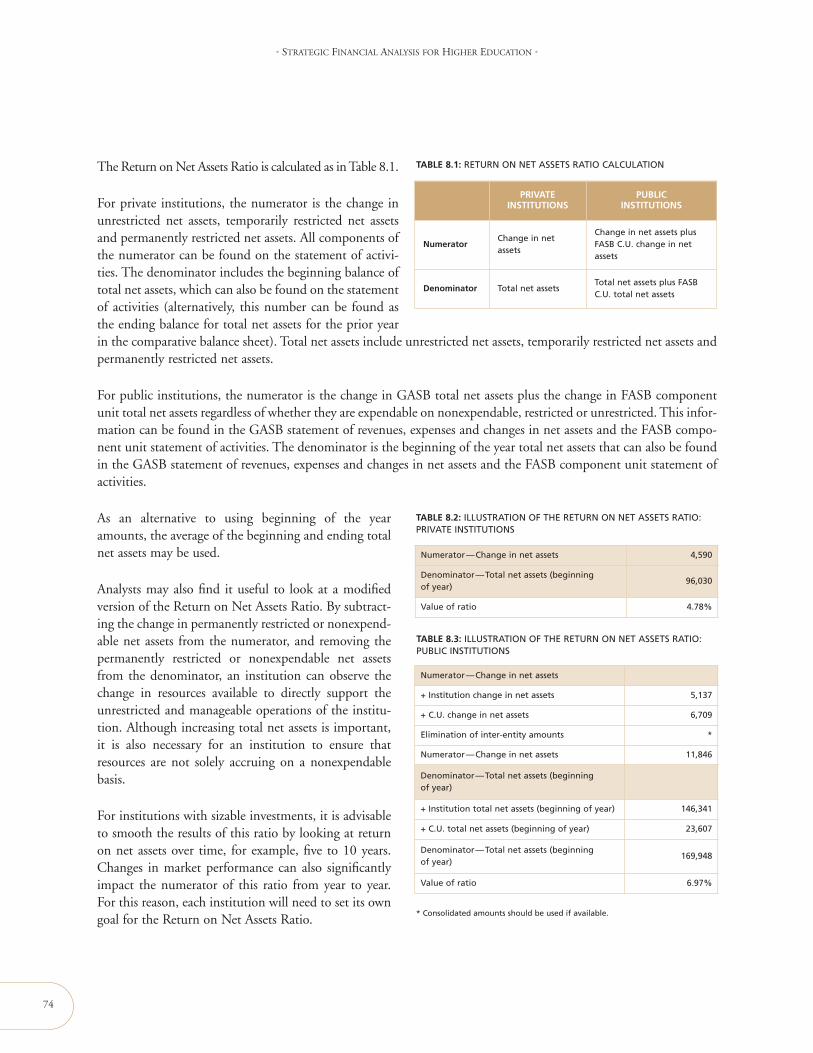
74
• STRATEGIC FINANCIAL ANALYSIS FOR HIGHER EDUCATION •
The Return on Net Assets Ratio is calculated as in Table 8.1.
For private institutions, the numerator is the change inunrestricted net assets, temporarily restricted net assetsand permanently restricted net assets. All components ofthe numerator can be found on the statement of activi-ties. The denominator includes the beginning balance oftotal net assets, which can also be found on the statementof activities (alternatively, this number can be found asthe ending balance for total net assets for the prior yearin the comparative balance sheet). Total net assets include unrestricted net assets, temporarily restricted net assets andpermanently restricted net assets.
For public institutions, the numerator is the change in GASB total net assets plus the change in FASB componentunit total net assets regardless of whether they are expendable on nonexpendable, restricted or unrestricted. This infor-mation can be found in the GASB statement of revenues, expenses and changes in net assets and the FASB compo-nent unit statement of activities. The denominator is the beginning of the year total net assets that can also be foundin the GASB statement of revenues, expenses and changes in net assets and the FASB component unit statement ofactivities.
As an alternative to using beginning of the yearamounts, the average of the beginning and ending totalnet assets may be used.
Analysts may also find it useful to look at a modifiedversion of the Return on Net Assets Ratio. By subtract-ing the change in permanently restricted or nonexpend-able net assets from the numerator, and removing thepermanently restricted or nonexpendable net assetsfrom the denominator, an institution can observe thechange in resources available to directly support theunrestricted and manageable operations of the institu-tion. Although increasing total net assets is important,it is also necessary for an institution to ensure thatresources are not solely accruing on a nonexpendablebasis.
For institutions with sizable investments, it is advisableto smooth the results of this ratio by looking at returnon net assets over time, for example, five to 10 years.Changes in market performance can also significantlyimpact the numerator of this ratio from year to year.For this reason, each institution will need to set its owngoal for the Return on Net Assets Ratio.
PRIVATEINSTITUTIONS
PUBLICINSTITUTIONS
NumeratorChange in netassets
Change in net assets plusFASB C.U. change in netassets
Denominator Total net assetsTotal net assets plus FASBC.U. total net assets
TABLE 8.1: RETURN ON NET ASSETS RATIO CALCULATION
Numerator—Change in net assets 4,590
Denominator—Total net assets (beginningof year)
96,030
Value of ratio 4.78%
Numerator—Change in net assets
+ Institution change in net assets 5,137
+ C.U. change in net assets 6,709
Elimination of inter-entity amounts *
Numerator—Change in net assets 11,846
Denominator—Total net assets (beginningof year)
+ Institution total net assets (beginning of year) 146,341
+ C.U. total net assets (beginning of year) 23,607
Denominator—Total net assets (beginningof year)
169,948
Value of ratio 6.97%
TABLE 8.2: ILLUSTRATION OF THE RETURN ON NET ASSETS RATIO:PRIVATE INSTITUTIONS
TABLE 8.3: ILLUSTRATION OF THE RETURN ON NET ASSETS RATIO:PUBLIC INSTITUTIONS
* Consolidated amounts should be used if available.

FINANCIAL NET ASSETS RATIO
A new ratio to this edition is the Financial Net Assets Ratio, which measures the percentage of financial net assets tototal net assets. While the Capitalization Ratio described in Chapter 6 is useful in identifying the total flexibility ofan institution by measuring its capitalization structure, the Financial Net Assets Ratio and its counterpart discussednext, the Physical Net Assets Ratio, provide useful insights into the allocation of equity between physical and finan-cial net assets. Together, these ratios help an analystunderstand the institution’s flexibility and whether itsasset and net asset structures are in equilibrium. As insti-tutions increasingly manage their overall balance sheet,consideration of the composition of assets, including adesired allocation across all assets, and funding sourcesbecomes increasingly important.
As discussed previously, institutions at the low end of theCapitalization Ratio range have limited future flexibilityto respond to unanticipated capital needs without com-promising credit or forcing difficult trade-offs. TheFinancial Net Asset Ratio helps evaluate what equityresources the institution has available to meet theseneeds. If the equity is weighted heavily in property, plantand equipment, the institution may have relatively lessability to allocate internal funds to new initiatives thanan institution with a similar Capitalization Ratio that ismore heavily allocated in financial assets.
An institution whose equity is comprised primarily ofphysical assets will be reducing its opportunity toincrease expendable wealth because the physical assetsgenerally do not directly generate a return on investedequity. This may place the institution at a competitivedisadvantage versus its peers in the future, unless theinvestment in physical facilities produces increased rev-enue, such as new research space, new dormitories toserve unfilled demand or fee-generating facilities.Therefore, the Financial Net Assets and the Physical NetAssets Ratios provide an indication of the equilibrium ofinvestment for an institution because they recognize thetrade-offs between investment for the current generation(physical assets) and investment for future generations(financial assets).
The Financial Net Assets Ratio is calculated as in Table 8.4.
CHAPTER EIGHT • MEASURING ASSET PERFORMANCE AND MANAGEMENT
75
PRIVATEINSTITUTIONS
PUBLICINSTITUTIONS
NumeratorTotal net assets—Net investment inplant net assets
Total net assets—Investedin capital assets, net ofrelated debt, plus FASB C.U.total net assets—FASB C.U.net investment in plant netassets
Denominator Total net assetsTotal net assets plus FASBC.U. total net assets
Numerator—Financial net assets
+ Total net assets 100,620
- Property, plant and equipment, net (77,900)
+ Long-term debt (total project-related debt) 39,476
Numerator—Financial net assets 62,196
Denominator—Total net assets 100,620
Value of ratio 62%
Numerator—Financial net assets
+ Institution total net assets 151,478
- Institution invested in capital assets, net ofrelated debt
(105,386)
+ C.U. total net assets 29,012
- C.U. net investment in plant (320)
Numerator—Financial net assets 74,784
Denominator—Total net assets
+ Institution total net assets 151,478
+ C.U. total net assets 29,012
Denominator—Total net assets 180,490
Value of ratio 41%
TABLE 8.5: ILLUSTRATION OF THE FINANCIAL NET ASSETS RATIO:PRIVATE INSTITUTIONS
TABLE 8.6: ILLUSTRATION OF THE FINANCIAL NET ASSETS RATIO:PUBLIC INSTITUTIONS
TABLE 8.4: FINANCIAL NET ASSETS RATIO CALCULATION
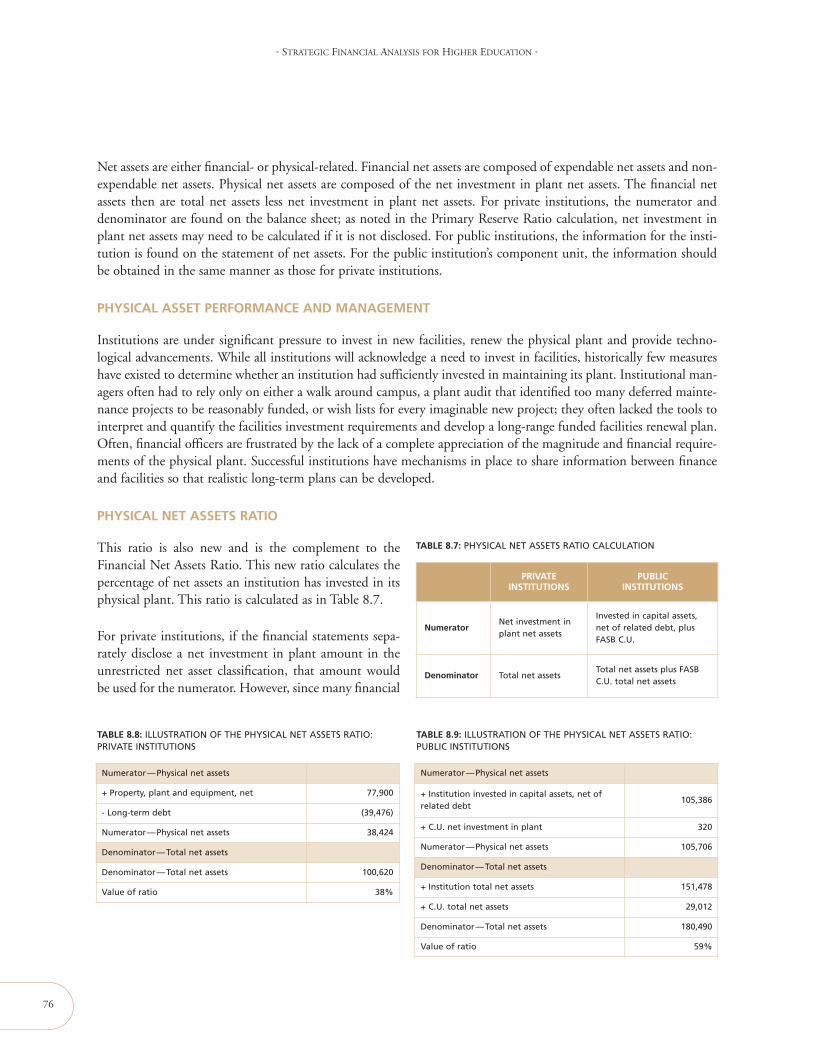
76
• STRATEGIC FINANCIAL ANALYSIS FOR HIGHER EDUCATION •
Net assets are either financial- or physical-related. Financial net assets are composed of expendable net assets and non-expendable net assets. Physical net assets are composed of the net investment in plant net assets. The financial netassets then are total net assets less net investment in plant net assets. For private institutions, the numerator anddenominator are found on the balance sheet; as noted in the Primary Reserve Ratio calculation, net investment inplant net assets may need to be calculated if it is not disclosed. For public institutions, the information for the insti-tution is found on the statement of net assets. For the public institution’s component unit, the information shouldbe obtained in the same manner as those for private institutions.
PHYSICAL ASSET PERFORMANCE AND MANAGEMENT
Institutions are under significant pressure to invest in new facilities, renew the physical plant and provide techno-logical advancements. While all institutions will acknowledge a need to invest in facilities, historically few measureshave existed to determine whether an institution had sufficiently invested in maintaining its plant. Institutional man-agers often had to rely only on either a walk around campus, a plant audit that identified too many deferred mainte-nance projects to be reasonably funded, or wish lists for every imaginable new project; they often lacked the tools tointerpret and quantify the facilities investment requirements and develop a long-range funded facilities renewal plan.Often, financial officers are frustrated by the lack of a complete appreciation of the magnitude and financial require-ments of the physical plant. Successful institutions have mechanisms in place to share information between financeand facilities so that realistic long-term plans can be developed.
PHYSICAL NET ASSETS RATIO
This ratio is also new and is the complement to theFinancial Net Assets Ratio. This new ratio calculates thepercentage of net assets an institution has invested in itsphysical plant. This ratio is calculated as in Table 8.7.
For private institutions, if the financial statements sepa-rately disclose a net investment in plant amount in theunrestricted net asset classification, that amount wouldbe used for the numerator. However, since many financial
PRIVATEINSTITUTIONS
PUBLICINSTITUTIONS
NumeratorNet investment inplant net assets
Invested in capital assets,net of related debt, plusFASB C.U.
Denominator Total net assetsTotal net assets plus FASBC.U. total net assets
TABLE 8.9: ILLUSTRATION OF THE PHYSICAL NET ASSETS RATIO:PUBLIC INSTITUTIONS
Numerator—Physical net assets
+ Property, plant and equipment, net 77,900
- Long-term debt (39,476)
Numerator—Physical net assets 38,424
Denominator—Total net assets
Denominator—Total net assets 100,620
Value of ratio 38%
TABLE 8.8: ILLUSTRATION OF THE PHYSICAL NET ASSETS RATIO:PRIVATE INSTITUTIONS
Numerator—Physical net assets
+ Institution invested in capital assets, net ofrelated debt
105,386
+ C.U. net investment in plant 320
Numerator—Physical net assets 105,706
Denominator—Total net assets
+ Institution total net assets 151,478
+ C.U. total net assets 29,012
Denominator—Total net assets 180,490
Value of ratio 59%
TABLE 8.7: PHYSICAL NET ASSETS RATIO CALCULATION
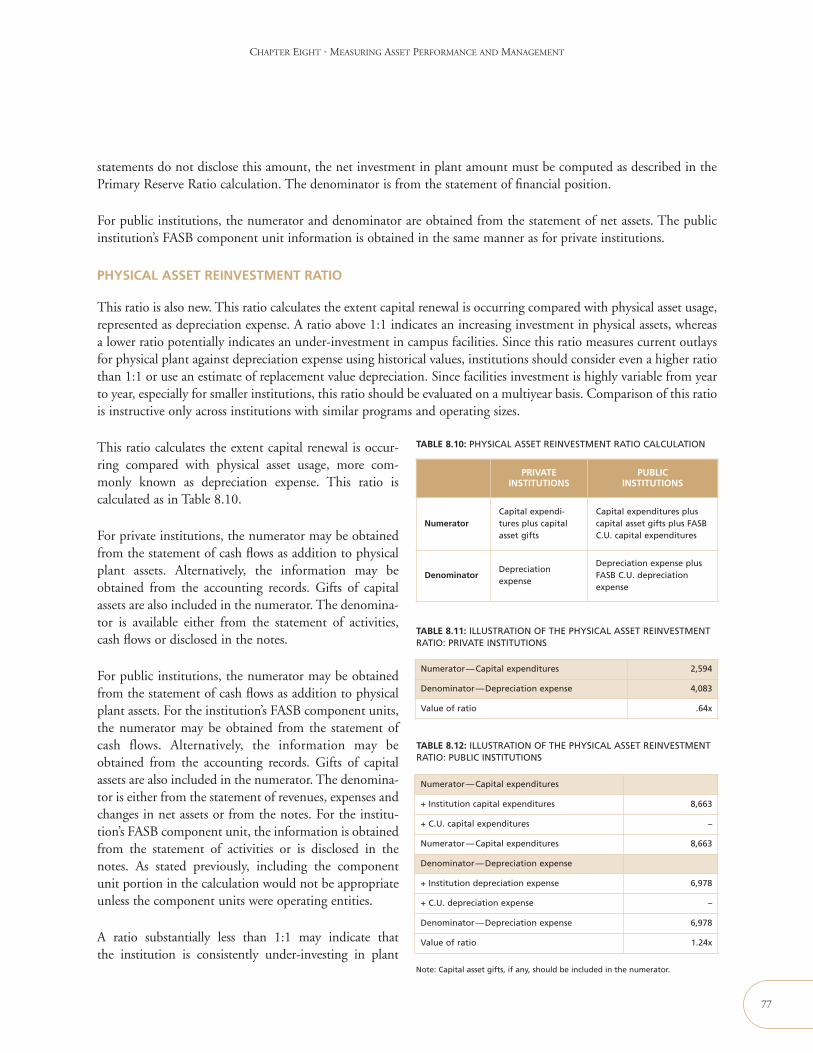
CHAPTER EIGHT • MEASURING ASSET PERFORMANCE AND MANAGEMENT
statements do not disclose this amount, the net investment in plant amount must be computed as described in thePrimary Reserve Ratio calculation. The denominator is from the statement of financial position.
For public institutions, the numerator and denominator are obtained from the statement of net assets. The publicinstitution’s FASB component unit information is obtained in the same manner as for private institutions.
PHYSICAL ASSET REINVESTMENT RATIO
This ratio is also new. This ratio calculates the extent capital renewal is occurring compared with physical asset usage,represented as depreciation expense. A ratio above 1:1 indicates an increasing investment in physical assets, whereasa lower ratio potentially indicates an under-investment in campus facilities. Since this ratio measures current outlaysfor physical plant against depreciation expense using historical values, institutions should consider even a higher ratiothan 1:1 or use an estimate of replacement value depreciation. Since facilities investment is highly variable from yearto year, especially for smaller institutions, this ratio should be evaluated on a multiyear basis. Comparison of this ratiois instructive only across institutions with similar programs and operating sizes.
This ratio calculates the extent capital renewal is occur-ring compared with physical asset usage, more com-monly known as depreciation expense. This ratio iscalculated as in Table 8.10.
For private institutions, the numerator may be obtainedfrom the statement of cash flows as addition to physicalplant assets. Alternatively, the information may beobtained from the accounting records. Gifts of capitalassets are also included in the numerator. The denomina-tor is available either from the statement of activities,cash flows or disclosed in the notes.
For public institutions, the numerator may be obtainedfrom the statement of cash flows as addition to physicalplant assets. For the institution’s FASB component units,the numerator may be obtained from the statement ofcash flows. Alternatively, the information may beobtained from the accounting records. Gifts of capitalassets are also included in the numerator. The denomina-tor is either from the statement of revenues, expenses andchanges in net assets or from the notes. For the institu-tion’s FASB component unit, the information is obtainedfrom the statement of activities or is disclosed in thenotes. As stated previously, including the componentunit portion in the calculation would not be appropriateunless the component units were operating entities.
A ratio substantially less than 1:1 may indicate thatthe institution is consistently under-investing in plant
77
PRIVATEINSTITUTIONS
PUBLICINSTITUTIONS
NumeratorCapital expendi-tures plus capitalasset gifts
Capital expenditures pluscapital asset gifts plus FASBC.U. capital expenditures
DenominatorDepreciationexpense
Depreciation expense plusFASB C.U. depreciationexpense
TABLE 8.11: ILLUSTRATION OF THE PHYSICAL ASSET REINVESTMENTRATIO: PRIVATE INSTITUTIONS
Numerator—Capital expenditures 2,594
Denominator—Depreciation expense 4,083
Value of ratio .64x
TABLE 8.12: ILLUSTRATION OF THE PHYSICAL ASSET REINVESTMENTRATIO: PUBLIC INSTITUTIONS
Numerator—Capital expenditures
+ Institution capital expenditures 8,663
+ C.U. capital expenditures –
Numerator—Capital expenditures 8,663
Denominator—Depreciation expense
+ Institution depreciation expense 6,978
+ C.U. depreciation expense –
Denominator—Depreciation expense 6,978
Value of ratio 1.24x
Note: Capital asset gifts, if any, should be included in the numerator.
TABLE 8.10: PHYSICAL ASSET REINVESTMENT RATIO CALCULATION
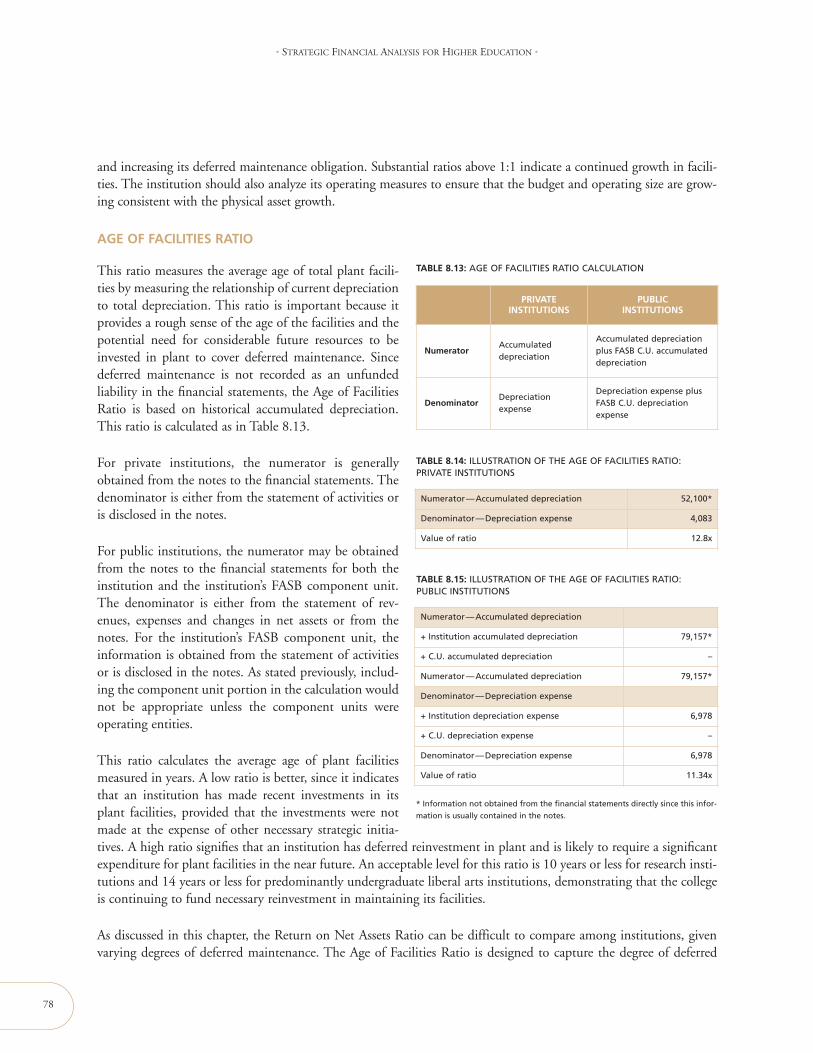
and increasing its deferred maintenance obligation. Substantial ratios above 1:1 indicate a continued growth in facili-ties. The institution should also analyze its operating measures to ensure that the budget and operating size are grow-ing consistent with the physical asset growth.
AGE OF FACILITIES RATIO
This ratio measures the average age of total plant facili-ties by measuring the relationship of current depreciationto total depreciation. This ratio is important because itprovides a rough sense of the age of the facilities and thepotential need for considerable future resources to beinvested in plant to cover deferred maintenance. Sincedeferred maintenance is not recorded as an unfundedliability in the financial statements, the Age of FacilitiesRatio is based on historical accumulated depreciation.This ratio is calculated as in Table 8.13.
For private institutions, the numerator is generallyobtained from the notes to the financial statements. Thedenominator is either from the statement of activities oris disclosed in the notes.
For public institutions, the numerator may be obtainedfrom the notes to the financial statements for both theinstitution and the institution’s FASB component unit.The denominator is either from the statement of rev-enues, expenses and changes in net assets or from thenotes. For the institution’s FASB component unit, theinformation is obtained from the statement of activitiesor is disclosed in the notes. As stated previously, includ-ing the component unit portion in the calculation wouldnot be appropriate unless the component units wereoperating entities.
This ratio calculates the average age of plant facilitiesmeasured in years. A low ratio is better, since it indicatesthat an institution has made recent investments in itsplant facilities, provided that the investments were notmade at the expense of other necessary strategic initia-tives. A high ratio signifies that an institution has deferred reinvestment in plant and is likely to require a significantexpenditure for plant facilities in the near future. An acceptable level for this ratio is 10 years or less for research insti-tutions and 14 years or less for predominantly undergraduate liberal arts institutions, demonstrating that the collegeis continuing to fund necessary reinvestment in maintaining its facilities.
As discussed in this chapter, the Return on Net Assets Ratio can be difficult to compare among institutions, givenvarying degrees of deferred maintenance. The Age of Facilities Ratio is designed to capture the degree of deferred
78
• STRATEGIC FINANCIAL ANALYSIS FOR HIGHER EDUCATION •
PRIVATEINSTITUTIONS
PUBLICINSTITUTIONS
NumeratorAccumulateddepreciation
Accumulated depreciationplus FASB C.U. accumulateddepreciation
DenominatorDepreciationexpense
Depreciation expense plusFASB C.U. depreciationexpense
TABLE 8.13: AGE OF FACILITIES RATIO CALCULATION
TABLE 8.14: ILLUSTRATION OF THE AGE OF FACILITIES RATIO:PRIVATE INSTITUTIONS
Numerator—Accumulated depreciation 52,100*
Denominator—Depreciation expense 4,083
Value of ratio 12.8x
TABLE 8.15: ILLUSTRATION OF THE AGE OF FACILITIES RATIO:PUBLIC INSTITUTIONS
Numerator—Accumulated depreciation
+ Institution accumulated depreciation 79,157*
+ C.U. accumulated depreciation –
Numerator—Accumulated depreciation 79,157*
Denominator—Depreciation expense
+ Institution depreciation expense 6,978
+ C.U. depreciation expense –
Denominator—Depreciation expense 6,978
Value of ratio 11.34x
* Information not obtained from the financial statements directly since this infor-
mation is usually contained in the notes.
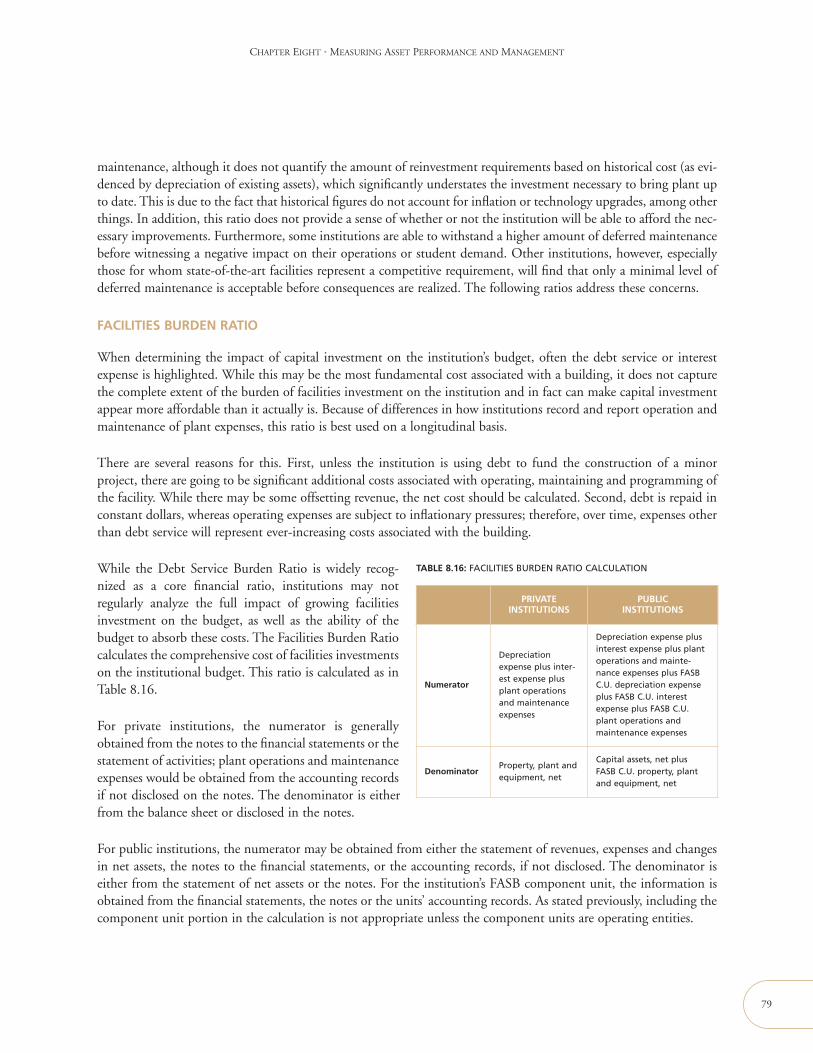
CHAPTER EIGHT • MEASURING ASSET PERFORMANCE AND MANAGEMENT
maintenance, although it does not quantify the amount of reinvestment requirements based on historical cost (as evi-denced by depreciation of existing assets), which significantly understates the investment necessary to bring plant upto date. This is due to the fact that historical figures do not account for inflation or technology upgrades, among otherthings. In addition, this ratio does not provide a sense of whether or not the institution will be able to afford the nec-essary improvements. Furthermore, some institutions are able to withstand a higher amount of deferred maintenancebefore witnessing a negative impact on their operations or student demand. Other institutions, however, especiallythose for whom state-of-the-art facilities represent a competitive requirement, will find that only a minimal level ofdeferred maintenance is acceptable before consequences are realized. The following ratios address these concerns.
FACILITIES BURDEN RATIO
When determining the impact of capital investment on the institution’s budget, often the debt service or interestexpense is highlighted. While this may be the most fundamental cost associated with a building, it does not capturethe complete extent of the burden of facilities investment on the institution and in fact can make capital investmentappear more affordable than it actually is. Because of differences in how institutions record and report operation andmaintenance of plant expenses, this ratio is best used on a longitudinal basis.
There are several reasons for this. First, unless the institution is using debt to fund the construction of a minorproject, there are going to be significant additional costs associated with operating, maintaining and programming ofthe facility. While there may be some offsetting revenue, the net cost should be calculated. Second, debt is repaid inconstant dollars, whereas operating expenses are subject to inflationary pressures; therefore, over time, expenses otherthan debt service will represent ever-increasing costs associated with the building.
While the Debt Service Burden Ratio is widely recog-nized as a core financial ratio, institutions may notregularly analyze the full impact of growing facilitiesinvestment on the budget, as well as the ability of thebudget to absorb these costs. The Facilities Burden Ratiocalculates the comprehensive cost of facilities investmentson the institutional budget. This ratio is calculated as inTable 8.16.
For private institutions, the numerator is generallyobtained from the notes to the financial statements or thestatement of activities; plant operations and maintenanceexpenses would be obtained from the accounting recordsif not disclosed on the notes. The denominator is eitherfrom the balance sheet or disclosed in the notes.
For public institutions, the numerator may be obtained from either the statement of revenues, expenses and changesin net assets, the notes to the financial statements, or the accounting records, if not disclosed. The denominator iseither from the statement of net assets or the notes. For the institution’s FASB component unit, the information isobtained from the financial statements, the notes or the units’ accounting records. As stated previously, including thecomponent unit portion in the calculation is not appropriate unless the component units are operating entities.
79
PRIVATEINSTITUTIONS
PUBLICINSTITUTIONS
Numerator
Depreciationexpense plus inter-est expense plusplant operationsand maintenanceexpenses
Depreciation expense plusinterest expense plus plantoperations and mainte-nance expenses plus FASBC.U. depreciation expenseplus FASB C.U. interestexpense plus FASB C.U.plant operations andmaintenance expenses
DenominatorProperty, plant andequipment, net
Capital assets, net plusFASB C.U. property, plantand equipment, net
TABLE 8.16: FACILITIES BURDEN RATIO CALCULATION
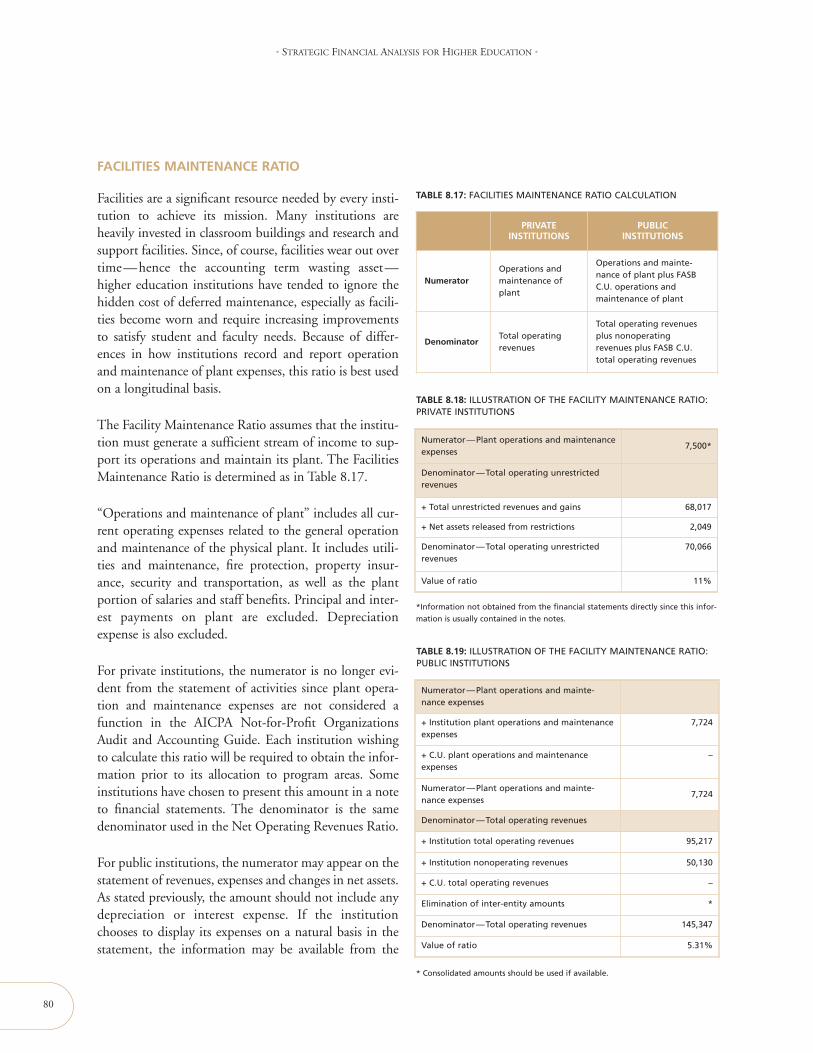
FACILITIES MAINTENANCE RATIO
Facilities are a significant resource needed by every insti-tution to achieve its mission. Many institutions areheavily invested in classroom buildings and research andsupport facilities. Since, of course, facilities wear out overtime—hence the accounting term wasting asset—higher education institutions have tended to ignore thehidden cost of deferred maintenance, especially as facili-ties become worn and require increasing improvementsto satisfy student and faculty needs. Because of differ-ences in how institutions record and report operationand maintenance of plant expenses, this ratio is best usedon a longitudinal basis.
The Facility Maintenance Ratio assumes that the institu-tion must generate a sufficient stream of income to sup-port its operations and maintain its plant. The FacilitiesMaintenance Ratio is determined as in Table 8.17.
“Operations and maintenance of plant” includes all cur-rent operating expenses related to the general operationand maintenance of the physical plant. It includes utili-ties and maintenance, fire protection, property insur-ance, security and transportation, as well as the plantportion of salaries and staff benefits. Principal and inter-est payments on plant are excluded. Depreciationexpense is also excluded.
For private institutions, the numerator is no longer evi-dent from the statement of activities since plant opera-tion and maintenance expenses are not considered afunction in the AICPA Not-for-Profit OrganizationsAudit and Accounting Guide. Each institution wishingto calculate this ratio will be required to obtain the infor-mation prior to its allocation to program areas. Someinstitutions have chosen to present this amount in a noteto financial statements. The denominator is the samedenominator used in the Net Operating Revenues Ratio.
For public institutions, the numerator may appear on thestatement of revenues, expenses and changes in net assets.As stated previously, the amount should not include anydepreciation or interest expense. If the institutionchooses to display its expenses on a natural basis in thestatement, the information may be available from the
80
• STRATEGIC FINANCIAL ANALYSIS FOR HIGHER EDUCATION •
PRIVATEINSTITUTIONS
PUBLICINSTITUTIONS
NumeratorOperations andmaintenance ofplant
Operations and mainte-nance of plant plus FASBC.U. operations andmaintenance of plant
DenominatorTotal operatingrevenues
Total operating revenuesplus nonoperatingrevenues plus FASB C.U.total operating revenues
TABLE 8.18: ILLUSTRATION OF THE FACILITY MAINTENANCE RATIO:PRIVATE INSTITUTIONS
TABLE 8.19: ILLUSTRATION OF THE FACILITY MAINTENANCE RATIO:PUBLIC INSTITUTIONS
*Information not obtained from the financial statements directly since this infor-
mation is usually contained in the notes.
Numerator—Plant operations and maintenanceexpenses
7,500*
Denominator—Total operating unrestrictedrevenues
+ Total unrestricted revenues and gains 68,017
+ Net assets released from restrictions 2,049
Denominator—Total operating unrestrictedrevenues
70,066
Value of ratio 11%
Numerator—Plant operations and mainte-nance expenses
+ Institution plant operations and maintenanceexpenses
7,724
+ C.U. plant operations and maintenanceexpenses
–
Numerator—Plant operations and mainte-nance expenses
7,724
Denominator—Total operating revenues
+ Institution total operating revenues 95,217
+ Institution nonoperating revenues 50,130
+ C.U. total operating revenues –
Elimination of inter-entity amounts *
Denominator—Total operating revenues 145,347
Value of ratio 5.31%
* Consolidated amounts should be used if available.
TABLE 8.17: FACILITIES MAINTENANCE RATIO CALCULATION
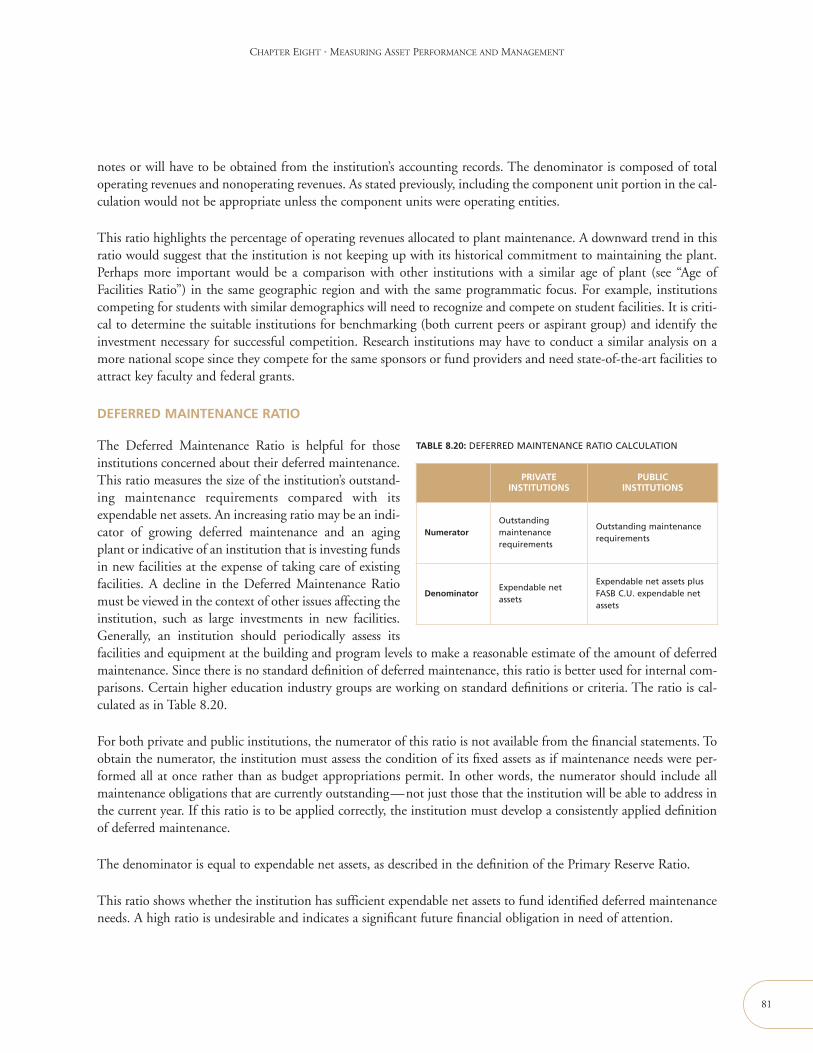
CHAPTER EIGHT • MEASURING ASSET PERFORMANCE AND MANAGEMENT
notes or will have to be obtained from the institution’s accounting records. The denominator is composed of totaloperating revenues and nonoperating revenues. As stated previously, including the component unit portion in the cal-culation would not be appropriate unless the component units were operating entities.
This ratio highlights the percentage of operating revenues allocated to plant maintenance. A downward trend in thisratio would suggest that the institution is not keeping up with its historical commitment to maintaining the plant.Perhaps more important would be a comparison with other institutions with a similar age of plant (see “Age ofFacilities Ratio”) in the same geographic region and with the same programmatic focus. For example, institutionscompeting for students with similar demographics will need to recognize and compete on student facilities. It is criti-cal to determine the suitable institutions for benchmarking (both current peers or aspirant group) and identify theinvestment necessary for successful competition. Research institutions may have to conduct a similar analysis on amore national scope since they compete for the same sponsors or fund providers and need state-of-the-art facilities toattract key faculty and federal grants.
DEFERRED MAINTENANCE RATIO
The Deferred Maintenance Ratio is helpful for thoseinstitutions concerned about their deferred maintenance.This ratio measures the size of the institution’s outstand-ing maintenance requirements compared with itsexpendable net assets. An increasing ratio may be an indi-cator of growing deferred maintenance and an agingplant or indicative of an institution that is investing fundsin new facilities at the expense of taking care of existingfacilities. A decline in the Deferred Maintenance Ratiomust be viewed in the context of other issues affecting theinstitution, such as large investments in new facilities.Generally, an institution should periodically assess itsfacilities and equipment at the building and program levels to make a reasonable estimate of the amount of deferredmaintenance. Since there is no standard definition of deferred maintenance, this ratio is better used for internal com-parisons. Certain higher education industry groups are working on standard definitions or criteria. The ratio is cal-culated as in Table 8.20.
For both private and public institutions, the numerator of this ratio is not available from the financial statements. Toobtain the numerator, the institution must assess the condition of its fixed assets as if maintenance needs were per-formed all at once rather than as budget appropriations permit. In other words, the numerator should include allmaintenance obligations that are currently outstanding—not just those that the institution will be able to address inthe current year. If this ratio is to be applied correctly, the institution must develop a consistently applied definitionof deferred maintenance.
The denominator is equal to expendable net assets, as described in the definition of the Primary Reserve Ratio.
This ratio shows whether the institution has sufficient expendable net assets to fund identified deferred maintenanceneeds. A high ratio is undesirable and indicates a significant future financial obligation in need of attention.
81
PRIVATEINSTITUTIONS
PUBLICINSTITUTIONS
NumeratorOutstandingmaintenancerequirements
Outstanding maintenancerequirements
DenominatorExpendable netassets
Expendable net assets plusFASB C.U. expendable netassets
TABLE 8.20: DEFERRED MAINTENANCE RATIO CALCULATION

82
• STRATEGIC FINANCIAL ANALYSIS FOR HIGHER EDUCATION •
The Deferred Maintenance Ratio should be assessed in conjunction with ratios that monitor the institution’s abilityto raise funds from external sources. If the institution has little or no plant debt, high unrestricted net assets, and rel-atively low expenses, an institution might choose to turn to other sources of funding to address its deferred mainte-nance needs. However, if the institution borrows to fund deferred maintenance, the institution will need to considercarefully the financial burden it places on future generations in terms of interest and principal payments. Ideally, thedebt repayment term would be consistent with the remaining useful life of the facilities repaired.

83
MEASURING OPERATING RESULTS9
INTRODUCTION 84
NET OPERATING REVENUES RATIO 84
CASH INCOME RATIO 87
CONTRIBUTION RATIOS 89
DEMAND RATIOS 90
EXAMPLES
9.1 CALCULATING AN OPERATING MARGIN 85
TABLES
9.1 NET OPERATING REVENUES RATIO CALCULATION 85
9.2 USING CHANGE IN UNRESTRICTED NET ASSETS FORPRIVATE INSTITUTIONS 85
9.3 ILLUSTRATION OF THE NET OPERATING REVENUESRATIO: PRIVATE INSTITUTIONS 86
9.4 ILLUSTRATION OF THE NET OPERATING REVENUES RATIO:PRIVATE INSTITUTIONS USING CHANGE IN UNRESTRICTEDNET ASSETS 86
9.5 ILLUSTRATION OF THE NET OPERATING REVENUES RATIO:PUBLIC INSTITUTIONS 86
9.6 CASH INCOME RATIO CALCULATION 87
9.7 ILLUSTRATION OF THE CASH INCOME RATIO:PRIVATE INSTITUTIONS 88
9.8 ILLUSTRATION OF THE CASH INCOME RATIO:PUBLIC INSTITUTIONS 88
9.9 NET TUITION AND FEES RATIO CALCULATION 89
9.10 ILLUSTRATION OF THE NET TUITION AND FEES RATIO:PRIVATE INSTITUTIONS 90
9.11 ILLUSTRATION OF THE NET TUITION AND FEES RATIO:PUBLIC INSTITUTIONS 90
9.12 ILLUSTRATION OF THE NET TUITION DEPENDENCY RATIO:PRIVATE INSTITUTIONS 90
9.13 ILLUSTRATION OF THE NET TUITION DEPENDENCY RATIO:PUBLIC INSTITUTIONS 90
9.14 INSTRUCTION DEMAND RATIO CALCULATION 91
CHAPTER SUMMARY
All institutions must, over the long run, operate in either a surplus or at least break-even position. However, this area oftenis confused with commercial organizations being required to “make a profit” each year. The primary reason institutions needto generate some level of surplus over long periods of time is because operations are one of the sources of resources for reinvest-ment in institutional initiatives. Conversely, generating a known deficit in the short term may well be the best strategic deci-sion a board makes, if it is an affordable investment in its future and the deficit will clearly be eliminated through specificactions. The issue for institutions arises when the deficits are unplanned, unmanaged and occurring in core existing opera-tions.
INTRODUCTION
The ratios in this chapter explore different aspects of an institution’s operations. In addition, contribution anddemand ratios can also be used to further explore specific aspects of operations. As with the ratios in the previouschapters, no analysis should be conducted without placing these ratios within the perspective of the institution’s mis-sion and other strategic initiatives. This is especially important in performing trend analysis. When examining move-ment in trends, it is vital to consider any change in the strategic initiatives and mission of the institution. All of theratios covered in this chapter are better utilized on a longitudinal basis.
Comparison of operating results between private and public institutions are not meaningful due to significant differ-ences in financial recognition and measurement. The operating statement for public institutions, the statement of rev-enues, expenses and other changes in net assets, does not distinguish items between net asset classes. In addition, thereporting standards for public institutions are very prescriptive as to format and sequencing, including compositionof an operating indicator. The standards are also very flexible in that expenses may be reported either by natural clas-sification or by function. Unlike private institutions, public institutions may consider depreciation and plant opera-tions and maintenance expenses to be functions and are not required to allocate these expenses to other functions.On the other hand, private institutions must report revenues and expenses by net asset class and functional expensesmust be reported either in the statement or in the notes. Private institutions may also disclose an operating measure;the reporting standards do not prescribe the components of an operating measure but permit institutions to use ameasure they are able to define as long as adequate disclosure concerning its composition is made.
NET OPERATING REVENUES RATIO
This ratio is a primary indicator, explaining how the surplus from operating activities affects the behavior of the otherthree core ratios. A large surplus or deficit directly impacts the amount of funds an institution adds to or subtractsfrom net assets, thereby affecting the Primary Reserve Ratio, the Return on Net Assets Ratio and the Viability Ratio.
For private institutions, this ratio used to be called the Net Income Ratio. We have changed its name to better expressits purpose and to conform the name to a ratio introduced in the fifth edition, Ratio Analysis in Higher Education:New Insights for Leaders of Public Higher Education.
MEASURING OPERATING RESULTS9
84
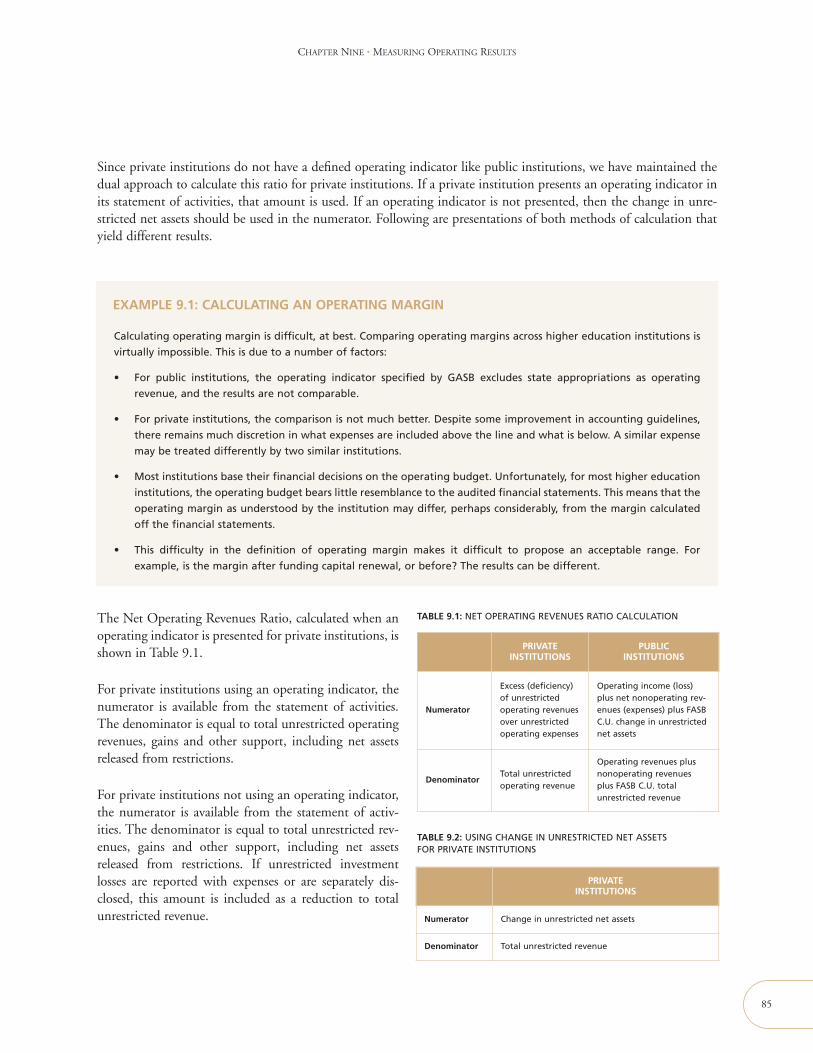
Since private institutions do not have a defined operating indicator like public institutions, we have maintained thedual approach to calculate this ratio for private institutions. If a private institution presents an operating indicator inits statement of activities, that amount is used. If an operating indicator is not presented, then the change in unre-stricted net assets should be used in the numerator. Following are presentations of both methods of calculation thatyield different results.
The Net Operating Revenues Ratio, calculated when anoperating indicator is presented for private institutions, isshown in Table 9.1.
For private institutions using an operating indicator, thenumerator is available from the statement of activities.The denominator is equal to total unrestricted operatingrevenues, gains and other support, including net assetsreleased from restrictions.
For private institutions not using an operating indicator,the numerator is available from the statement of activ-ities. The denominator is equal to total unrestricted rev-enues, gains and other support, including net assetsreleased from restrictions. If unrestricted investmentlosses are reported with expenses or are separately dis-closed, this amount is included as a reduction to totalunrestricted revenue.
CHAPTER NINE • MEASURING OPERATING RESULTS
85
EXAMPLE 9.1: CALCULATING AN OPERATING MARGIN
Calculating operating margin is difficult, at best. Comparing operating margins across higher education institutions is
virtually impossible. This is due to a number of factors:
• For public institutions, the operating indicator specified by GASB excludes state appropriations as operating
revenue, and the results are not comparable.
• For private institutions, the comparison is not much better. Despite some improvement in accounting guidelines,
there remains much discretion in what expenses are included above the line and what is below. A similar expense
may be treated differently by two similar institutions.
• Most institutions base their financial decisions on the operating budget. Unfortunately, for most higher education
institutions, the operating budget bears little resemblance to the audited financial statements. This means that the
operating margin as understood by the institution may differ, perhaps considerably, from the margin calculated
off the financial statements.
• This difficulty in the definition of operating margin makes it difficult to propose an acceptable range. For
example, is the margin after funding capital renewal, or before? The results can be different.
PRIVATEINSTITUTIONS
PUBLICINSTITUTIONS
Numerator
Excess (deficiency)of unrestrictedoperating revenuesover unrestrictedoperating expenses
Operating income (loss)plus net nonoperating rev-enues (expenses) plus FASBC.U. change in unrestrictednet assets
DenominatorTotal unrestrictedoperating revenue
Operating revenues plusnonoperating revenuesplus FASB C.U. totalunrestricted revenue
PRIVATEINSTITUTIONS
Numerator Change in unrestricted net assets
Denominator Total unrestricted revenue
TABLE 9.2: USING CHANGE IN UNRESTRICTED NET ASSETSFOR PRIVATE INSTITUTIONS
TABLE 9.1: NET OPERATING REVENUES RATIO CALCULATION
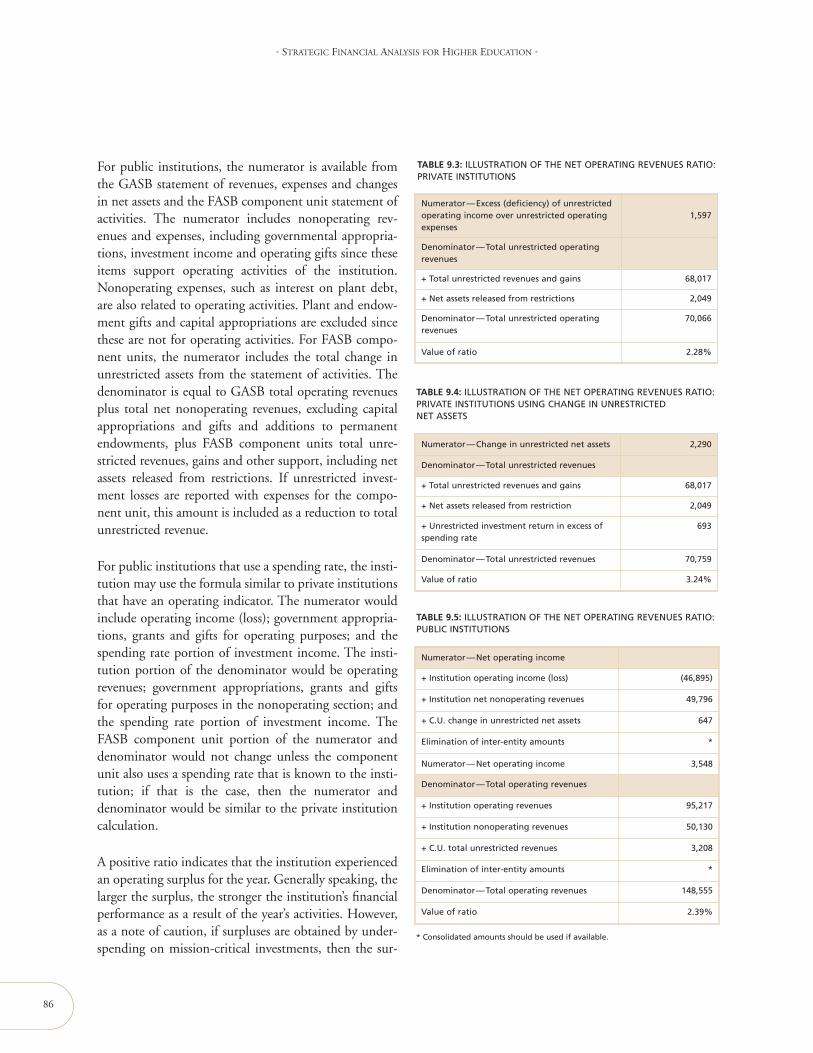
86
• STRATEGIC FINANCIAL ANALYSIS FOR HIGHER EDUCATION •
For public institutions, the numerator is available fromthe GASB statement of revenues, expenses and changesin net assets and the FASB component unit statement ofactivities. The numerator includes nonoperating rev-enues and expenses, including governmental appropria-tions, investment income and operating gifts since theseitems support operating activities of the institution.Nonoperating expenses, such as interest on plant debt,are also related to operating activities. Plant and endow-ment gifts and capital appropriations are excluded sincethese are not for operating activities. For FASB compo-nent units, the numerator includes the total change inunrestricted assets from the statement of activities. Thedenominator is equal to GASB total operating revenuesplus total net nonoperating revenues, excluding capitalappropriations and gifts and additions to permanentendowments, plus FASB component units total unre-stricted revenues, gains and other support, including netassets released from restrictions. If unrestricted invest-ment losses are reported with expenses for the compo-nent unit, this amount is included as a reduction to totalunrestricted revenue.
For public institutions that use a spending rate, the insti-tution may use the formula similar to private institutionsthat have an operating indicator. The numerator wouldinclude operating income (loss); government appropria-tions, grants and gifts for operating purposes; and thespending rate portion of investment income. The insti-tution portion of the denominator would be operatingrevenues; government appropriations, grants and giftsfor operating purposes in the nonoperating section; andthe spending rate portion of investment income. TheFASB component unit portion of the numerator anddenominator would not change unless the componentunit also uses a spending rate that is known to the insti-tution; if that is the case, then the numerator anddenominator would be similar to the private institutioncalculation.
A positive ratio indicates that the institution experiencedan operating surplus for the year. Generally speaking, thelarger the surplus, the stronger the institution’s financialperformance as a result of the year’s activities. However,as a note of caution, if surpluses are obtained by under-spending on mission-critical investments, then the sur-
TABLE 9.3: ILLUSTRATION OF THE NET OPERATING REVENUES RATIO:PRIVATE INSTITUTIONS
TABLE 9.4: ILLUSTRATION OF THE NET OPERATING REVENUES RATIO:PRIVATE INSTITUTIONS USING CHANGE IN UNRESTRICTEDNET ASSETS
Numerator—Excess (deficiency) of unrestrictedoperating income over unrestricted operatingexpenses
1,597
Denominator—Total unrestricted operatingrevenues
+ Total unrestricted revenues and gains 68,017
+ Net assets released from restrictions 2,049
Denominator—Total unrestricted operatingrevenues
70,066
Value of ratio 2.28%
Numerator—Change in unrestricted net assets 2,290
Denominator—Total unrestricted revenues
+ Total unrestricted revenues and gains 68,017
+ Net assets released from restriction 2,049
+ Unrestricted investment return in excess ofspending rate
693
Denominator—Total unrestricted revenues 70,759
Value of ratio 3.24%
TABLE 9.5: ILLUSTRATION OF THE NET OPERATING REVENUES RATIO:PUBLIC INSTITUTIONS
Numerator—Net operating income
+ Institution operating income (loss) (46,895)
+ Institution net nonoperating revenues 49,796
+ C.U. change in unrestricted net assets 647
Elimination of inter-entity amounts *
Numerator—Net operating income 3,548
Denominator—Total operating revenues
+ Institution operating revenues 95,217
+ Institution nonoperating revenues 50,130
+ C.U. total unrestricted revenues 3,208
Elimination of inter-entity amounts *
Denominator—Total operating revenues 148,555
Value of ratio 2.39%
* Consolidated amounts should be used if available.
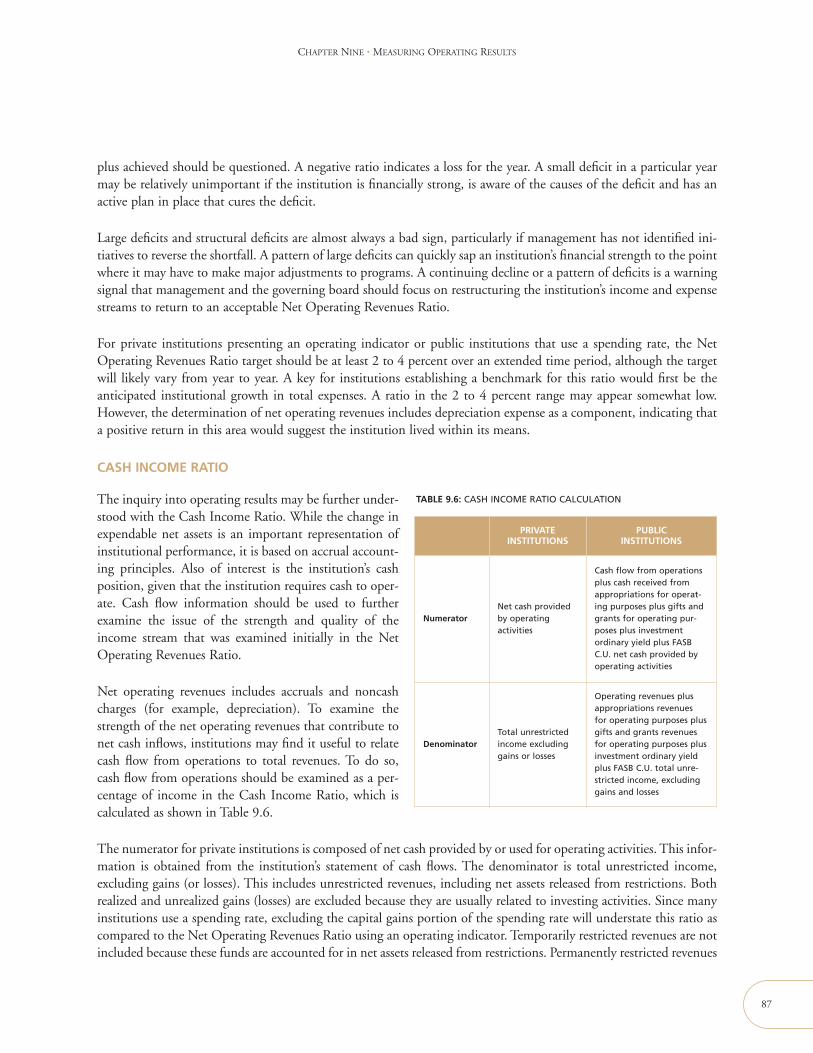
CHAPTER NINE • MEASURING OPERATING RESULTS
plus achieved should be questioned. A negative ratio indicates a loss for the year. A small deficit in a particular yearmay be relatively unimportant if the institution is financially strong, is aware of the causes of the deficit and has anactive plan in place that cures the deficit.
Large deficits and structural deficits are almost always a bad sign, particularly if management has not identified ini-tiatives to reverse the shortfall. A pattern of large deficits can quickly sap an institution’s financial strength to the pointwhere it may have to make major adjustments to programs. A continuing decline or a pattern of deficits is a warningsignal that management and the governing board should focus on restructuring the institution’s income and expensestreams to return to an acceptable Net Operating Revenues Ratio.
For private institutions presenting an operating indicator or public institutions that use a spending rate, the NetOperating Revenues Ratio target should be at least 2 to 4 percent over an extended time period, although the targetwill likely vary from year to year. A key for institutions establishing a benchmark for this ratio would first be theanticipated institutional growth in total expenses. A ratio in the 2 to 4 percent range may appear somewhat low.However, the determination of net operating revenues includes depreciation expense as a component, indicating thata positive return in this area would suggest the institution lived within its means.
CASH INCOME RATIO
The inquiry into operating results may be further under-stood with the Cash Income Ratio. While the change inexpendable net assets is an important representation ofinstitutional performance, it is based on accrual account-ing principles. Also of interest is the institution’s cashposition, given that the institution requires cash to oper-ate. Cash flow information should be used to furtherexamine the issue of the strength and quality of theincome stream that was examined initially in the NetOperating Revenues Ratio.
Net operating revenues includes accruals and noncashcharges (for example, depreciation). To examine thestrength of the net operating revenues that contribute tonet cash inflows, institutions may find it useful to relatecash flow from operations to total revenues. To do so,cash flow from operations should be examined as a per-centage of income in the Cash Income Ratio, which iscalculated as shown in Table 9.6.
The numerator for private institutions is composed of net cash provided by or used for operating activities. This infor-mation is obtained from the institution’s statement of cash flows. The denominator is total unrestricted income,excluding gains (or losses). This includes unrestricted revenues, including net assets released from restrictions. Bothrealized and unrealized gains (losses) are excluded because they are usually related to investing activities. Since manyinstitutions use a spending rate, excluding the capital gains portion of the spending rate will understate this ratio ascompared to the Net Operating Revenues Ratio using an operating indicator. Temporarily restricted revenues are notincluded because these funds are accounted for in net assets released from restrictions. Permanently restricted revenues
87
PRIVATEINSTITUTIONS
PUBLICINSTITUTIONS
NumeratorNet cash providedby operatingactivities
Cash flow from operationsplus cash received fromappropriations for operat-ing purposes plus gifts andgrants for operating pur-poses plus investmentordinary yield plus FASBC.U. net cash provided byoperating activities
DenominatorTotal unrestrictedincome excludinggains or losses
Operating revenues plusappropriations revenuesfor operating purposes plusgifts and grants revenuesfor operating purposes plusinvestment ordinary yieldplus FASB C.U. total unre-stricted income, excludinggains and losses
TABLE 9.6: CASH INCOME RATIO CALCULATION
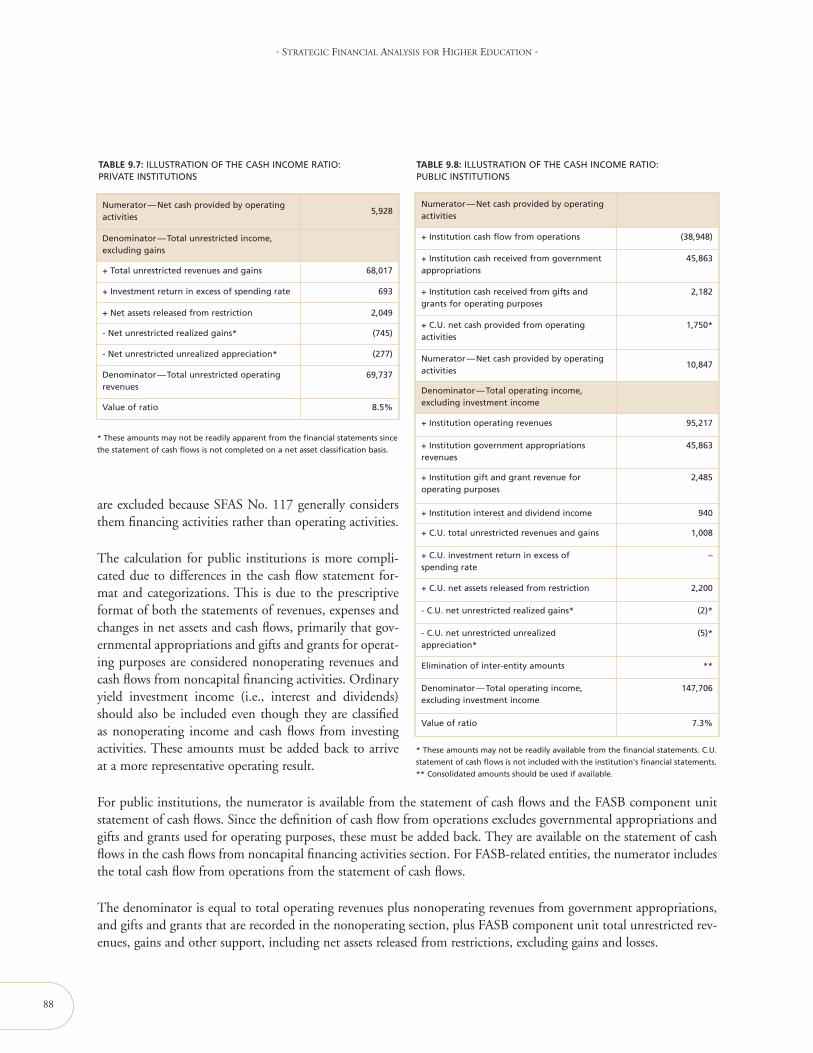
are excluded because SFAS No. 117 generally considersthem financing activities rather than operating activities.
The calculation for public institutions is more compli-cated due to differences in the cash flow statement for-mat and categorizations. This is due to the prescriptiveformat of both the statements of revenues, expenses andchanges in net assets and cash flows, primarily that gov-ernmental appropriations and gifts and grants for operat-ing purposes are considered nonoperating revenues andcash flows from noncapital financing activities. Ordinaryyield investment income (i.e., interest and dividends)should also be included even though they are classifiedas nonoperating income and cash flows from investingactivities. These amounts must be added back to arriveat a more representative operating result.
For public institutions, the numerator is available from the statement of cash flows and the FASB component unitstatement of cash flows. Since the definition of cash flow from operations excludes governmental appropriations andgifts and grants used for operating purposes, these must be added back. They are available on the statement of cashflows in the cash flows from noncapital financing activities section. For FASB-related entities, the numerator includesthe total cash flow from operations from the statement of cash flows.
The denominator is equal to total operating revenues plus nonoperating revenues from government appropriations,and gifts and grants that are recorded in the nonoperating section, plus FASB component unit total unrestricted rev-enues, gains and other support, including net assets released from restrictions, excluding gains and losses.
88
• STRATEGIC FINANCIAL ANALYSIS FOR HIGHER EDUCATION •
TABLE 9.7: ILLUSTRATION OF THE CASH INCOME RATIO:PRIVATE INSTITUTIONS
Numerator—Net cash provided by operatingactivities
5,928
Denominator—Total unrestricted income,excluding gains
+ Total unrestricted revenues and gains 68,017
+ Investment return in excess of spending rate 693
+ Net assets released from restriction 2,049
- Net unrestricted realized gains* (745)
- Net unrestricted unrealized appreciation* (277)
Denominator—Total unrestricted operatingrevenues
69,737
Value of ratio 8.5%
TABLE 9.8: ILLUSTRATION OF THE CASH INCOME RATIO:PUBLIC INSTITUTIONS
Numerator—Net cash provided by operatingactivities
+ Institution cash flow from operations (38,948)
+ Institution cash received from governmentappropriations
45,863
+ Institution cash received from gifts andgrants for operating purposes
2,182
+ C.U. net cash provided from operatingactivities
1,750*
Numerator—Net cash provided by operatingactivities
10,847
Denominator—Total operating income,excluding investment income
+ Institution operating revenues 95,217
+ Institution government appropriationsrevenues
45,863
+ Institution gift and grant revenue foroperating purposes
2,485
+ Institution interest and dividend income 940
+ C.U. total unrestricted revenues and gains 1,008
+ C.U. investment return in excess ofspending rate
–
+ C.U. net assets released from restriction 2,200
- C.U. net unrestricted realized gains* (2)*
- C.U. net unrestricted unrealizedappreciation*
(5)*
Elimination of inter-entity amounts **
Denominator—Total operating income,excluding investment income
147,706
Value of ratio 7.3%
* These amounts may not be readily apparent from the financial statements since
the statement of cash flows is not completed on a net asset classification basis.
* These amounts may not be readily available from the financial statements. C.U.
statement of cash flows is not included with the institution's financial statements.
** Consolidated amounts should be used if available.

CONTRIBUTION RATIOS
Using ratios referred to as contribution and demand ratios can also result in further analysis of revenues by source andexpenses by type. Contribution and demand ratios address the causes of why an institution’s overall financial ratioshave behaved in the manner observed.
Contribution ratios are derived from the following main sources of revenues:
• Tuition and fees, net of financial aid
• Grants and contracts
• Government appropriations
• Contributions
• Auxiliary enterprise
• Hospital operations
The numerator would be each applicable source of revenue. The denominator would be total expenses. We believethat it is better to express these sources of revenues as ratios compared with expenses instead of a percentage of totaloperating revenues. Using total operating revenues can be misleading, especially when expenses are increasing fasterthan revenues, resulting in a decline in each of these sources. Furthermore, many of these revenue sources mayexperience significant year-to-year variability and therefore make annual review difficult.
An example of the Net Tuition and Fees Contribution Ratio would be as shown in Table 9.9.
For private institutions, the numerator is tuition and feerevenue, net of tuition discounts, which is from the state-ment of activities. Total expenses are the same as thedenominator in the Primary Reserve Ratio. Again, ifexpenses include realized or unrealized investment losses,these should be excluded from expenses. Note that sincethe numerator for each contribution ratio is the revenuecomponent and the denominator is total expenses, thesum of all contribution ratios will be greater (less) than100 percent, with the difference representing the surplus(deficit).
For public institutions, the numerator is composed of tuition and fees revenues that are found on the statement ofrevenues, expenses and changes in net assets. The denominator is institutional operating expenses plus institutionalnonoperating expenses. For contribution ratios, the denominator should only represent institutional expenses. Asstated previously, including the component unit portion in the calculation would not be appropriate unless the com-ponent units were operating entities.
Two other ancillary ratios may provide additional information about the strength of the funds available to an insti-tution. Heavily tuition-dependent institutions (that is, institutions that receive more than 60 percent of their revenue
CHAPTER NINE • MEASURING OPERATING RESULTS
89
PRIVATEINSTITUTIONS
PUBLICINSTITUTIONS
NumeratorNet tuition andfees revenues
Net tuition and feesrevenues
Denominator Total expenses Total expenses
TABLE 9.9: NET TUITION AND FEES RATIO CALCULATION
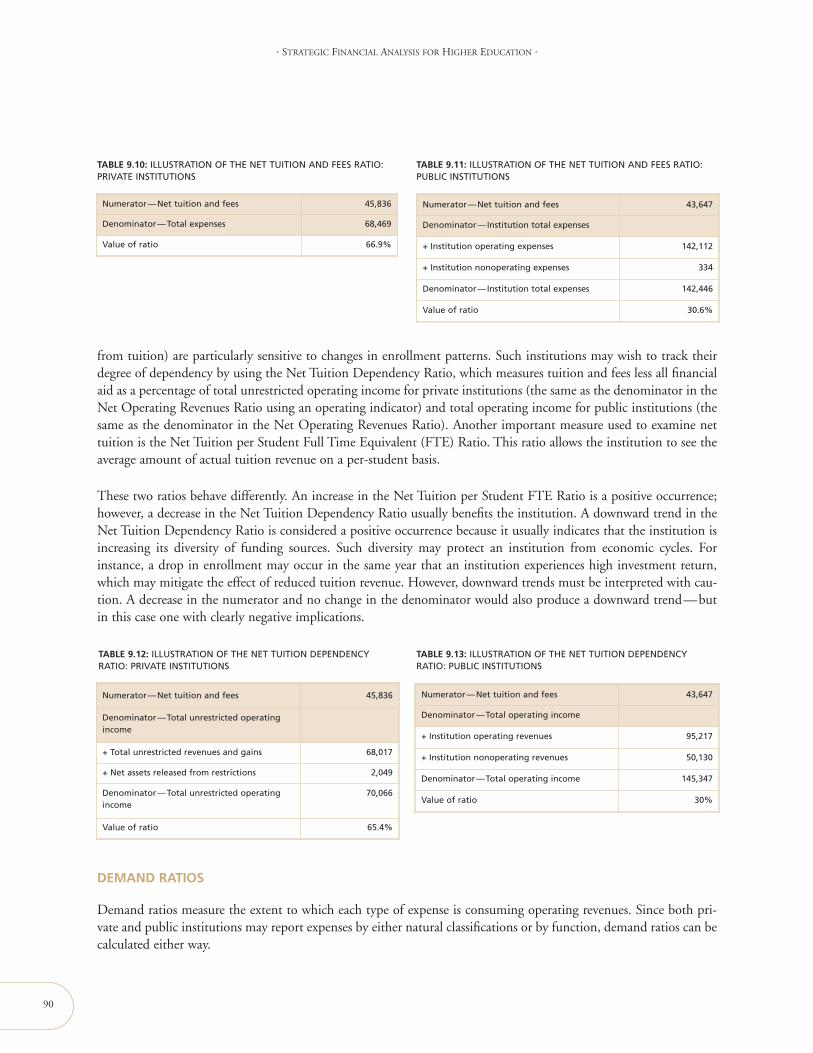
from tuition) are particularly sensitive to changes in enrollment patterns. Such institutions may wish to track theirdegree of dependency by using the Net Tuition Dependency Ratio, which measures tuition and fees less all financialaid as a percentage of total unrestricted operating income for private institutions (the same as the denominator in theNet Operating Revenues Ratio using an operating indicator) and total operating income for public institutions (thesame as the denominator in the Net Operating Revenues Ratio). Another important measure used to examine nettuition is the Net Tuition per Student Full Time Equivalent (FTE) Ratio. This ratio allows the institution to see theaverage amount of actual tuition revenue on a per-student basis.
These two ratios behave differently. An increase in the Net Tuition per Student FTE Ratio is a positive occurrence;however, a decrease in the Net Tuition Dependency Ratio usually benefits the institution. A downward trend in theNet Tuition Dependency Ratio is considered a positive occurrence because it usually indicates that the institution isincreasing its diversity of funding sources. Such diversity may protect an institution from economic cycles. Forinstance, a drop in enrollment may occur in the same year that an institution experiences high investment return,which may mitigate the effect of reduced tuition revenue. However, downward trends must be interpreted with cau-tion. A decrease in the numerator and no change in the denominator would also produce a downward trend—butin this case one with clearly negative implications.
DEMAND RATIOS
Demand ratios measure the extent to which each type of expense is consuming operating revenues. Since both pri-vate and public institutions may report expenses by either natural classifications or by function, demand ratios can becalculated either way.
90
• STRATEGIC FINANCIAL ANALYSIS FOR HIGHER EDUCATION •
TABLE 9.10: ILLUSTRATION OF THE NET TUITION AND FEES RATIO:PRIVATE INSTITUTIONS
Numerator—Net tuition and fees 45,836
Denominator—Total expenses 68,469
Value of ratio 66.9%
TABLE 9.11: ILLUSTRATION OF THE NET TUITION AND FEES RATIO:PUBLIC INSTITUTIONS
Numerator—Net tuition and fees 43,647
Denominator—Institution total expenses
+ Institution operating expenses 142,112
+ Institution nonoperating expenses 334
Denominator—Institution total expenses 142,446
Value of ratio 30.6%
TABLE 9.12: ILLUSTRATION OF THE NET TUITION DEPENDENCYRATIO: PRIVATE INSTITUTIONS
Numerator—Net tuition and fees 45,836
Denominator—Total unrestricted operatingincome
+ Total unrestricted revenues and gains 68,017
+ Net assets released from restrictions 2,049
Denominator—Total unrestricted operatingincome
70,066
Value of ratio 65.4%
TABLE 9.13: ILLUSTRATION OF THE NET TUITION DEPENDENCYRATIO: PUBLIC INSTITUTIONS
Numerator—Net tuition and fees 43,647
Denominator—Total operating income
+ Institution operating revenues 95,217
+ Institution nonoperating revenues 50,130
Denominator—Total operating income 145,347
Value of ratio 30%

CHAPTER NINE • MEASURING OPERATING RESULTS
Demand ratios by natural classification would include:
• Salaries and wages • Fringe benefits
• Payments to suppliers • Interest
• Depreciation • Travel
• Utilities • Other
Demand ratios by functional classification would include:
• Instruction • Research
• Public service • Academic support
• Student services • General services and administration
• Plant operations and maintenance • Auxiliary enterprises
• Hospital operations
Private institutions may find it more desirable to calculate ratios before allocations of plant operations and deprecia-tion to the other functions. Public institutions may find it desirable to allocate depreciation expense to the other func-tions to derive a more complete level of total expenses by function.
The numerator would be the applicable type of expense for the demand ratio being calculated. The denominatorwould be total operating income as calculated in the Net Tuition Dependency Ratio. Consolidated amounts shouldbe used where appropriate. Note that since the numerator for each Demand Ratio is the expense component and thedenominator is operating income, the sum of all Demand Ratios will be greater (less) than 100 percent, with the dif-ference representing the deficit (surplus).
An example of the Instruction Demand Ratio would beshown as in Table 9.14.
91
PRIVATEINSTITUTIONS
PUBLICINSTITUTIONS
NumeratorInstructionexpenses
Instruction expenses
DenominatorTotal unrestrictedoperating income
Total operating income
TABLE 9.14: INSTRUCTION DEMAND RATIO CALCULATION
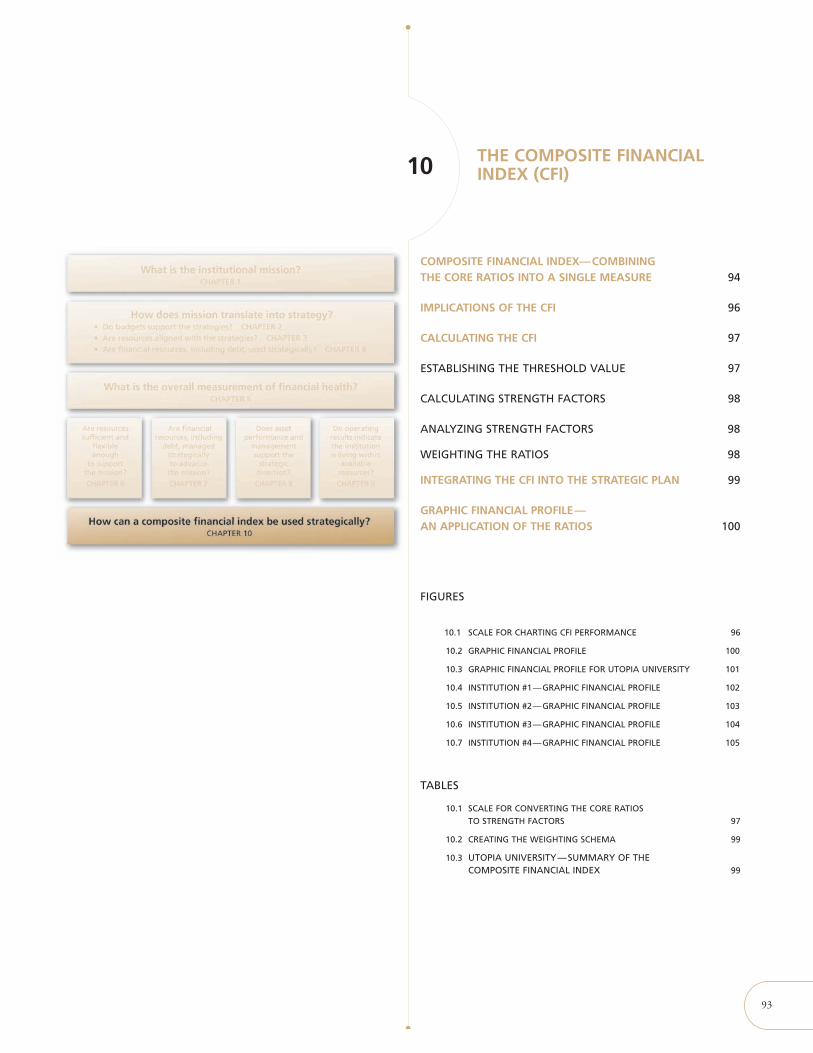
93
THE COMPOSITE FINANCIALINDEX (CFI) 10
COMPOSITE FINANCIAL INDEX—COMBININGTHE CORE RATIOS INTO A SINGLE MEASURE 94
IMPLICATIONS OF THE CFI 96
CALCULATING THE CFI 97
ESTABLISHING THE THRESHOLD VALUE 97
CALCULATING STRENGTH FACTORS 98
ANALYZING STRENGTH FACTORS 98
WEIGHTING THE RATIOS 98
INTEGRATING THE CFI INTO THE STRATEGIC PLAN 99
GRAPHIC FINANCIAL PROFILE—AN APPLICATION OF THE RATIOS 100
FIGURES
10.1 SCALE FOR CHARTING CFI PERFORMANCE 96
10.2 GRAPHIC FINANCIAL PROFILE 100
10.3 GRAPHIC FINANCIAL PROFILE FOR UTOPIA UNIVERSITY 101
10.4 INSTITUTION #1—GRAPHIC FINANCIAL PROFILE 102
10.5 INSTITUTION #2—GRAPHIC FINANCIAL PROFILE 103
10.6 INSTITUTION #3—GRAPHIC FINANCIAL PROFILE 104
10.7 INSTITUTION #4—GRAPHIC FINANCIAL PROFILE 105
TABLES
10.1 SCALE FOR CONVERTING THE CORE RATIOSTO STRENGTH FACTORS 97
10.2 CREATING THE WEIGHTING SCHEMA 99
10.3 UTOPIA UNIVERSITY—SUMMARY OF THECOMPOSITE FINANCIAL INDEX 99
THE COMPOSITE FINANCIAL INDEX (CFI) 10
94
CHAPTER SUMMARY
After looking at the relative strengths and weaknesses of each of the four core ratios, it is useful for an institution to be ableto combine them into a single score. This combination, using a reasonable weighting plan, allows a weakness or strength ina specific ratio to be offset by another ratio result, thereby allowing a more holistic approach to understanding the total finan-cial health of the institution.
COMPOSITE FINANCIAL INDEX—COMBINING THE CORE RATIOS INTO A SINGLE MEASURE
In Chapters 6–9, we represented four core higher-level ratios that can provide information on the overall financialhealth of the institution. These ratios are:
• Primary Reserve Ratio
• Viability Ratio
• Return on Net Assets Ratio
• Net Operating Revenues Ratio
For public institutions, this chapter introduces a methodology for creating one overall financial measurement of thepublic institution’s health based on those four core ratios. This measure is called the Composite Financial Index, orCFI. The CFI is useful in helping governing boards and senior management understand the financial position thatthe institution enjoys in the marketplace. Moreover, this measurement will also prove valuable in assessing futureprospects of the institution, functioning as an “affordability index” of a strategic plan. For private institutions, thischapter reiterates the conceptual framework and methodology for the CFI introduced in the fourth edition of RatioAnalysis in Higher Education: Measuring Past Performance to Chart Future Directions .
Since we introduced the concept and methodology of the CFI in the fourth edition in 1999, it has been adopted bymany leading institutions and found great acceptance by senior management and governing boards. We are convincedthat the CFI is a very valuable tool for senior managers and boards of trustees to help understand not only the stateof an institution’s financial situation at a point in time but also serve as a valuable tool, unavailable from other sources,that can provide insight into the trends of an institution’s key financial indicators.
We believe this for several reasons. First, by blending the four key measures of financial health into a single number,a more balanced view of the state of the institution’s finances is possible because a weakness in one measure maybe offset by the strength of another measure. Second, by using the same criteria to determine the CFI over a periodof time, the board and management are given the opportunity to measure the overall financial progress that it ismaking. Lastly, the measure is easily understood and remembered, so it can become part of institutional communi-cations on where the institution is as well as how far the institution has come.
Our recommendation is that each institution develop the CFI that is tailored to the institutional needs and then applyit over an extended period of time—both historically and as a planning tool as the institution develops a prioritized
CHAPTER TEN • THE COMPOSITE FINANCIAL INDEX (CFI)
and priced strategic plan. By tailoring the CFI in this way, the institution will have insight into the financial impactof different activities.
As an example, if an institution has just completed a significant investment in new facilities with a significant debtcomponent, the expectation that both the CFI and the Viability Ratio will be depressed is reasonable. Similarly, if theinstitution has recently completed a major capital campaign, the CFI may well have improved, and the governingboard and senior management have the opportunity to consider whether the amount of the increase matched overallexpectations.
As with any financial analysis, we believe a long period of time, at least five years, represents enough measurementpoints to effectively understand the financial direction of the institution. We also believe that once developed, theschema should be fixed, and if there is a compelling reason for a change, that all information be restated so that com-parative data is consistent. However, the weighting should not be revised as a response to changes or deteriorationin certain financial indicators but should only be done if the institution’s financial or programmatic objectives havefundamentally changed over the long term.
We have also found, however, that applying the CFI as a peer group measure has some limitations. This is differentfrom the comparison of an individual ratio, where senior managers of an institution believe they have the capabilityto understand the action to take if an individual ratio is different from another institution. This relates to the fact thatthere are a limited number of most likely reasons for movement in a selected ratio. However, when the ratios are com-bined, the underlying reasons for change may be indiscernible because of the number of possible variations.
Within this edition, we present the development of the CFI using specific weightings for each ratio that we believerepresent an appropriate assessment of the relative importance of each ratio and a reasonable assessment of balancebetween an institution’s short- and long-term needs. However, the weighting of the ratios becomes the key variablethat would reflect differences in institutional philosophy and approach to financial planning. We have determinedthat the weighting and scoring systems developed for private institutions in the fourth edition are appropriate for pub-lic institutions. We have validated this assessment through calculations using public institutions’ financial statementsand information.
The four-step methodology is as follows:
• Compute the values of the four core ratios;
• Convert these figures to strength factors along a common scale;
• Multiply the strength factors by specific weighting factors; and
• Total the resulting four numbers to reach the single CFI score.
The CFI only measures the financial component of an institution’s well-being. It must be analyzed in context withother associated activities and plans to achieve an assessment of the overall health, not just financial health, of theinstitution. As an example, if two institutions have identical CFI scores but one requires substantial investments tomeet its mission-critical issues and the other has already made those investments, the first institution is less healthythan the second. In fact, an institution’s CFI can become too high as well as too low. When put in the context ofachievement of mission, a very high CFI with little achievement of mission may indicate a failing institution.
95
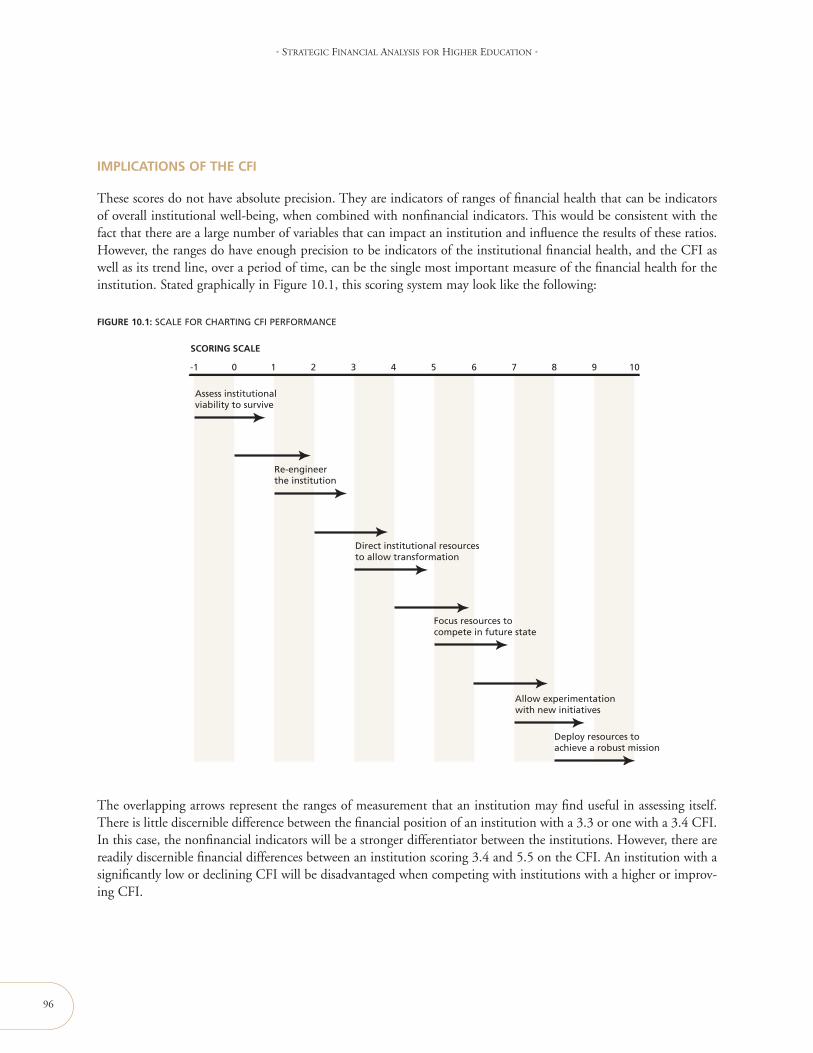
96
• STRATEGIC FINANCIAL ANALYSIS FOR HIGHER EDUCATION •
IMPLICATIONS OF THE CFI
These scores do not have absolute precision. They are indicators of ranges of financial health that can be indicatorsof overall institutional well-being, when combined with nonfinancial indicators. This would be consistent with thefact that there are a large number of variables that can impact an institution and influence the results of these ratios.However, the ranges do have enough precision to be indicators of the institutional financial health, and the CFI aswell as its trend line, over a period of time, can be the single most important measure of the financial health for theinstitution. Stated graphically in Figure 10.1, this scoring system may look like the following:
The overlapping arrows represent the ranges of measurement that an institution may find useful in assessing itself.There is little discernible difference between the financial position of an institution with a 3.3 or one with a 3.4 CFI.In this case, the nonfinancial indicators will be a stronger differentiator between the institutions. However, there arereadily discernible financial differences between an institution scoring 3.4 and 5.5 on the CFI. An institution with asignificantly low or declining CFI will be disadvantaged when competing with institutions with a higher or improv-ing CFI.
SCORING SCALE
Assess institutional viability to survive
Re-engineerthe institution
Direct institutional resourcesto allow transformation
Focus resources tocompete in future state
Allow experimentation with new initiatives
Deploy resources toachieve a robust mission
1 2-1 0 3 4 5 6 7 8 9 10
FIGURE 10.1: SCALE FOR CHARTING CFI PERFORMANCE
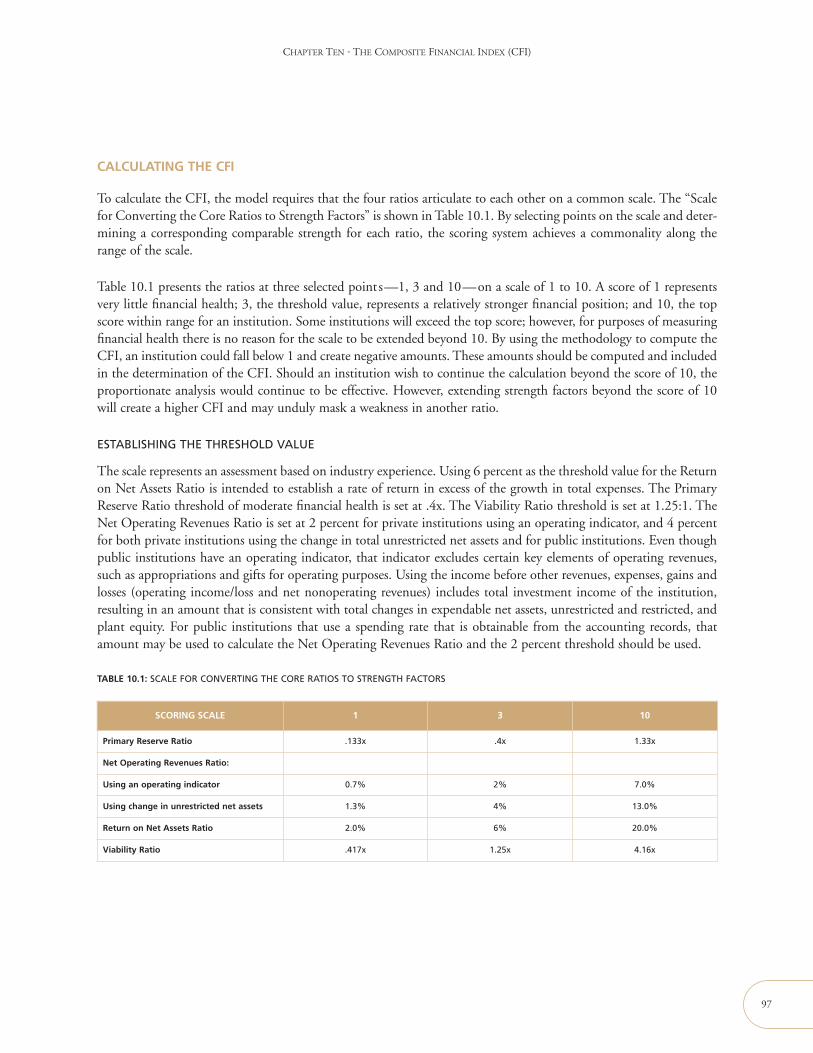
CHAPTER TEN • THE COMPOSITE FINANCIAL INDEX (CFI)
CALCULATING THE CFI
To calculate the CFI, the model requires that the four ratios articulate to each other on a common scale. The “Scalefor Converting the Core Ratios to Strength Factors” is shown in Table 10.1. By selecting points on the scale and deter-mining a corresponding comparable strength for each ratio, the scoring system achieves a commonality along therange of the scale.
Table 10.1 presents the ratios at three selected points—1, 3 and 10—on a scale of 1 to 10. A score of 1 representsvery little financial health; 3, the threshold value, represents a relatively stronger financial position; and 10, the topscore within range for an institution. Some institutions will exceed the top score; however, for purposes of measuringfinancial health there is no reason for the scale to be extended beyond 10. By using the methodology to compute theCFI, an institution could fall below 1 and create negative amounts. These amounts should be computed and includedin the determination of the CFI. Should an institution wish to continue the calculation beyond the score of 10, theproportionate analysis would continue to be effective. However, extending strength factors beyond the score of 10will create a higher CFI and may unduly mask a weakness in another ratio.
ESTABLISHING THE THRESHOLD VALUE
The scale represents an assessment based on industry experience. Using 6 percent as the threshold value for the Returnon Net Assets Ratio is intended to establish a rate of return in excess of the growth in total expenses. The PrimaryReserve Ratio threshold of moderate financial health is set at .4x. The Viability Ratio threshold is set at 1.25:1. TheNet Operating Revenues Ratio is set at 2 percent for private institutions using an operating indicator, and 4 percentfor both private institutions using the change in total unrestricted net assets and for public institutions. Even thoughpublic institutions have an operating indicator, that indicator excludes certain key elements of operating revenues,such as appropriations and gifts for operating purposes. Using the income before other revenues, expenses, gains andlosses (operating income/loss and net nonoperating revenues) includes total investment income of the institution,resulting in an amount that is consistent with total changes in expendable net assets, unrestricted and restricted, andplant equity. For public institutions that use a spending rate that is obtainable from the accounting records, thatamount may be used to calculate the Net Operating Revenues Ratio and the 2 percent threshold should be used.
97
TABLE 10.1: SCALE FOR CONVERTING THE CORE RATIOS TO STRENGTH FACTORS
SCORING SCALE 1 3 10
Primary Reserve Ratio .133x .4x 1.33x
Net Operating Revenues Ratio:
Using an operating indicator 0.7% 2% 7.0%
Using change in unrestricted net assets 1.3% 4% 13.0%
Return on Net Assets Ratio 2.0% 6% 20.0%
Viability Ratio .417x 1.25x 4.16x
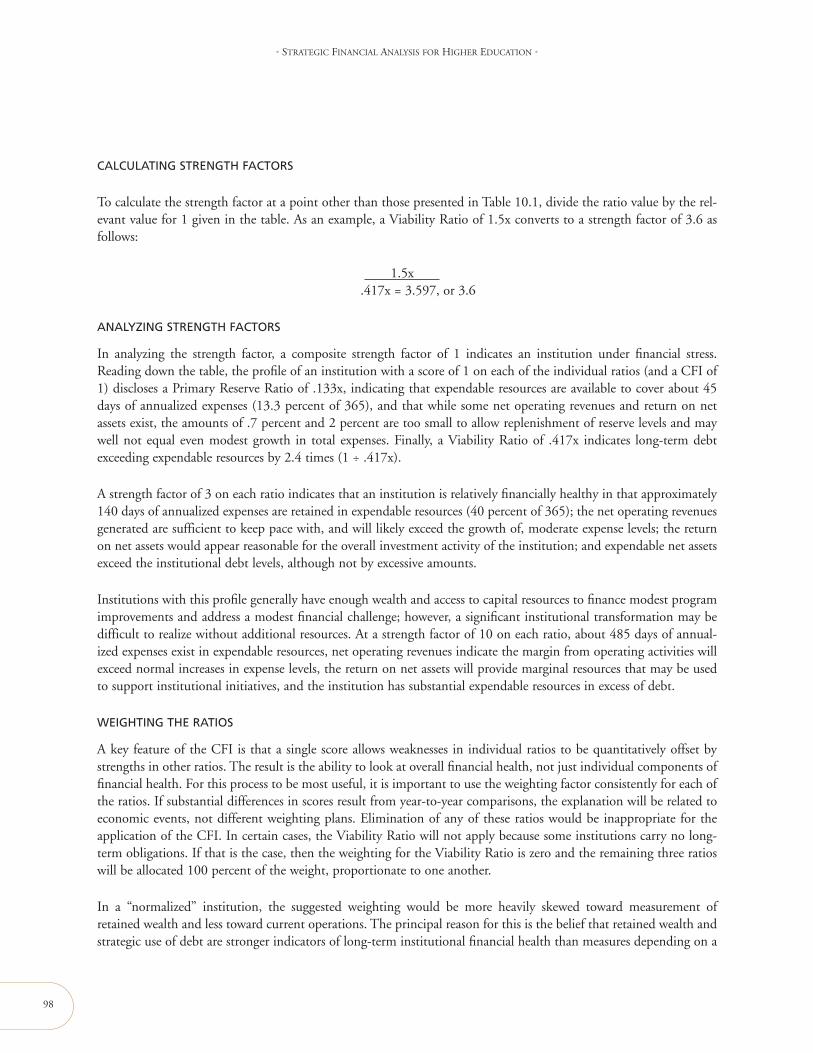
98
• STRATEGIC FINANCIAL ANALYSIS FOR HIGHER EDUCATION •
CALCULATING STRENGTH FACTORS
To calculate the strength factor at a point other than those presented in Table 10.1, divide the ratio value by the rel-evant value for 1 given in the table. As an example, a Viability Ratio of 1.5x converts to a strength factor of 3.6 asfollows:
1.5x.417x = 3.597, or 3.6
ANALYZING STRENGTH FACTORS
In analyzing the strength factor, a composite strength factor of 1 indicates an institution under financial stress.Reading down the table, the profile of an institution with a score of 1 on each of the individual ratios (and a CFI of1) discloses a Primary Reserve Ratio of .133x, indicating that expendable resources are available to cover about 45days of annualized expenses (13.3 percent of 365), and that while some net operating revenues and return on netassets exist, the amounts of .7 percent and 2 percent are too small to allow replenishment of reserve levels and maywell not equal even modest growth in total expenses. Finally, a Viability Ratio of .417x indicates long-term debtexceeding expendable resources by 2.4 times (1 ÷ .417x).
A strength factor of 3 on each ratio indicates that an institution is relatively financially healthy in that approximately140 days of annualized expenses are retained in expendable resources (40 percent of 365); the net operating revenuesgenerated are sufficient to keep pace with, and will likely exceed the growth of, moderate expense levels; the returnon net assets would appear reasonable for the overall investment activity of the institution; and expendable net assetsexceed the institutional debt levels, although not by excessive amounts.
Institutions with this profile generally have enough wealth and access to capital resources to finance modest programimprovements and address a modest financial challenge; however, a significant institutional transformation may bedifficult to realize without additional resources. At a strength factor of 10 on each ratio, about 485 days of annual-ized expenses exist in expendable resources, net operating revenues indicate the margin from operating activities willexceed normal increases in expense levels, the return on net assets will provide marginal resources that may be usedto support institutional initiatives, and the institution has substantial expendable resources in excess of debt.
WEIGHTING THE RATIOS
A key feature of the CFI is that a single score allows weaknesses in individual ratios to be quantitatively offset bystrengths in other ratios. The result is the ability to look at overall financial health, not just individual components offinancial health. For this process to be most useful, it is important to use the weighting factor consistently for each ofthe ratios. If substantial differences in scores result from year-to-year comparisons, the explanation will be related toeconomic events, not different weighting plans. Elimination of any of these ratios would be inappropriate for theapplication of the CFI. In certain cases, the Viability Ratio will not apply because some institutions carry no long-term obligations. If that is the case, then the weighting for the Viability Ratio is zero and the remaining three ratioswill be allocated 100 percent of the weight, proportionate to one another.
In a “normalized” institution, the suggested weighting would be more heavily skewed toward measurement ofretained wealth and less toward current operations. The principal reason for this is the belief that retained wealth andstrategic use of debt are stronger indicators of long-term institutional financial health than measures depending on a
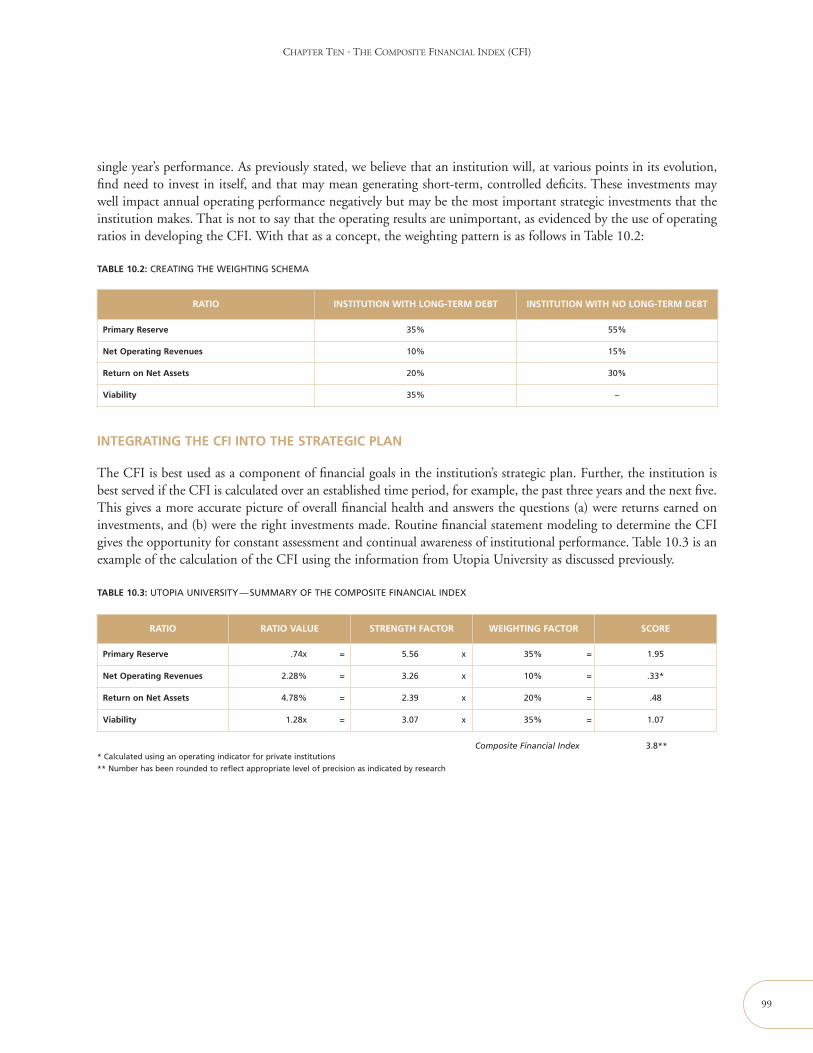
single year’s performance. As previously stated, we believe that an institution will, at various points in its evolution,find need to invest in itself, and that may mean generating short-term, controlled deficits. These investments maywell impact annual operating performance negatively but may be the most important strategic investments that theinstitution makes. That is not to say that the operating results are unimportant, as evidenced by the use of operatingratios in developing the CFI. With that as a concept, the weighting pattern is as follows in Table 10.2:
INTEGRATING THE CFI INTO THE STRATEGIC PLAN
The CFI is best used as a component of financial goals in the institution’s strategic plan. Further, the institution isbest served if the CFI is calculated over an established time period, for example, the past three years and the next five.This gives a more accurate picture of overall financial health and answers the questions (a) were returns earned oninvestments, and (b) were the right investments made. Routine financial statement modeling to determine the CFIgives the opportunity for constant assessment and continual awareness of institutional performance. Table 10.3 is anexample of the calculation of the CFI using the information from Utopia University as discussed previously.
CHAPTER TEN • THE COMPOSITE FINANCIAL INDEX (CFI)
99
RATIO INSTITUTION WITH LONG-TERM DEBT INSTITUTION WITH NO LONG-TERM DEBT
Primary Reserve 35% 55%
Net Operating Revenues 10% 15%
Return on Net Assets 20% 30%
Viability 35% –
TABLE 10.3: UTOPIA UNIVERSITY—SUMMARY OF THE COMPOSITE FINANCIAL INDEX
RATIO RATIO VALUE STRENGTH FACTOR WEIGHTING FACTOR SCORE
Primary Reserve .74x = 5.56 x 35% = 1.95
Net Operating Revenues 2.28% = 3.26 x 10% = .33*
Return on Net Assets 4.78% = 2.39 x 20% = .48
Viability 1.28x = 3.07 x 35% = 1.07
Composite Financial Index 3.8*** Calculated using an operating indicator for private institutions
** Number has been rounded to reflect appropriate level of precision as indicated by research
TABLE 10.2: CREATING THE WEIGHTING SCHEMA
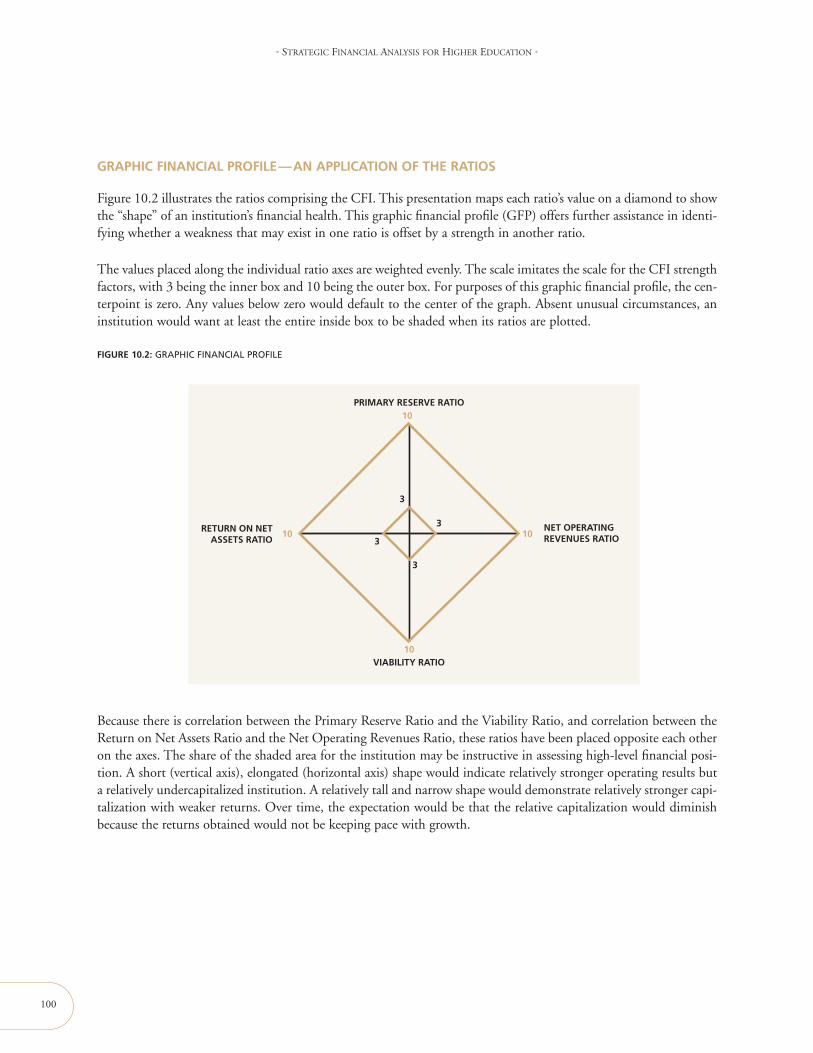
GRAPHIC FINANCIAL PROFILE—AN APPLICATION OF THE RATIOS
Figure 10.2 illustrates the ratios comprising the CFI. This presentation maps each ratio’s value on a diamond to showthe “shape” of an institution’s financial health. This graphic financial profile (GFP) offers further assistance in identi-fying whether a weakness that may exist in one ratio is offset by a strength in another ratio.
The values placed along the individual ratio axes are weighted evenly. The scale imitates the scale for the CFI strengthfactors, with 3 being the inner box and 10 being the outer box. For purposes of this graphic financial profile, the cen-terpoint is zero. Any values below zero would default to the center of the graph. Absent unusual circumstances, aninstitution would want at least the entire inside box to be shaded when its ratios are plotted.
Because there is correlation between the Primary Reserve Ratio and the Viability Ratio, and correlation between theReturn on Net Assets Ratio and the Net Operating Revenues Ratio, these ratios have been placed opposite each otheron the axes. The share of the shaded area for the institution may be instructive in assessing high-level financial posi-tion. A short (vertical axis), elongated (horizontal axis) shape would indicate relatively stronger operating results buta relatively undercapitalized institution. A relatively tall and narrow shape would demonstrate relatively stronger capi-talization with weaker returns. Over time, the expectation would be that the relative capitalization would diminishbecause the returns obtained would not be keeping pace with growth.
100
• STRATEGIC FINANCIAL ANALYSIS FOR HIGHER EDUCATION •
FIGURE 10.2: GRAPHIC FINANCIAL PROFILE
PRIMARY RESERVE RATIO
VIABILITY RATIO
NET OPERATING REVENUES RATIO1010
10
10
3
3
3
3RETURN ON NETASSETS RATIO
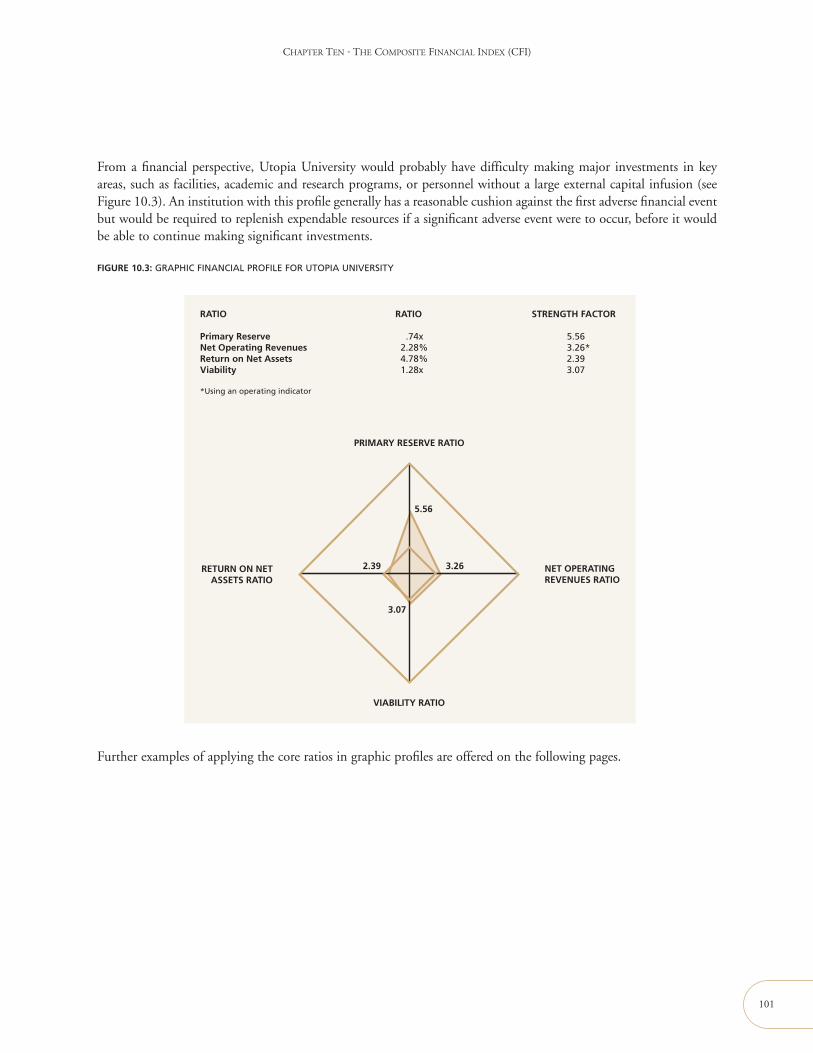
From a financial perspective, Utopia University would probably have difficulty making major investments in keyareas, such as facilities, academic and research programs, or personnel without a large external capital infusion (seeFigure 10.3). An institution with this profile generally has a reasonable cushion against the first adverse financial eventbut would be required to replenish expendable resources if a significant adverse event were to occur, before it wouldbe able to continue making significant investments.
Further examples of applying the core ratios in graphic profiles are offered on the following pages.
CHAPTER TEN • THE COMPOSITE FINANCIAL INDEX (CFI)
101
FIGURE 10.3: GRAPHIC FINANCIAL PROFILE FOR UTOPIA UNIVERSITY
PRIMARY RESERVE RATIO
VIABILITY RATIO
3.262.39
3.07
5.56
RETURN ON NETASSETS RATIO
RATIO
Primary ReserveNet Operating RevenuesReturn on Net AssetsViability
*Using an operating indicator
RATIO
.74x2.28%
4.78% 1.28x
STRENGTH FACTOR
5.563.26*
2.393.07
NET OPERATING REVENUES RATIO
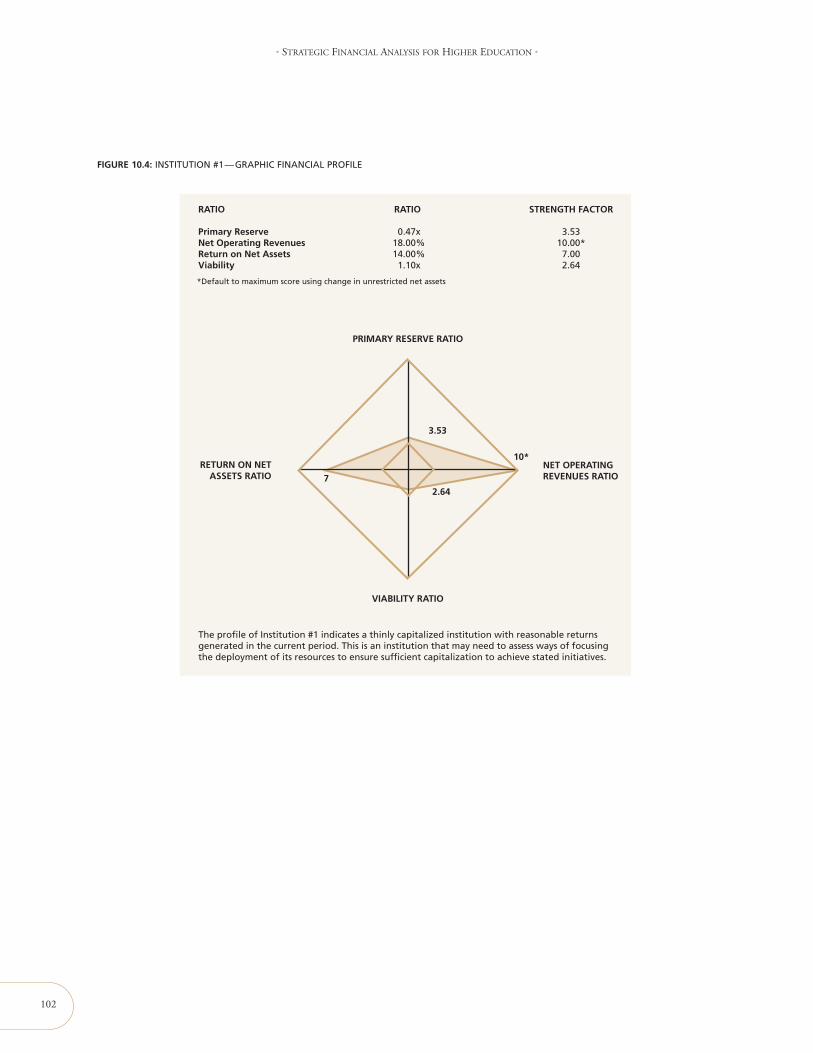
102
• STRATEGIC FINANCIAL ANALYSIS FOR HIGHER EDUCATION •
FIGURE 10.4: INSTITUTION #1—GRAPHIC FINANCIAL PROFILE
PRIMARY RESERVE RATIO
VIABILITY RATIO
72.64
3.53
10*RETURN ON NET
ASSETS RATIO
RATIO
Primary ReserveNet Operating RevenuesReturn on Net AssetsViability
RATIO
0.47x 18.00% 14.00% 1.10x
STRENGTH FACTOR
3.5310.00*7.002.64
*Default to maximum score using change in unrestricted net assets
NET OPERATING REVENUES RATIO
The profile of Institution #1 indicates a thinly capitalized institution with reasonable returns generated in the current period. This is an institution that may need to assess ways of focusing the deployment of its resources to ensure sufficient capitalization to achieve stated initiatives.
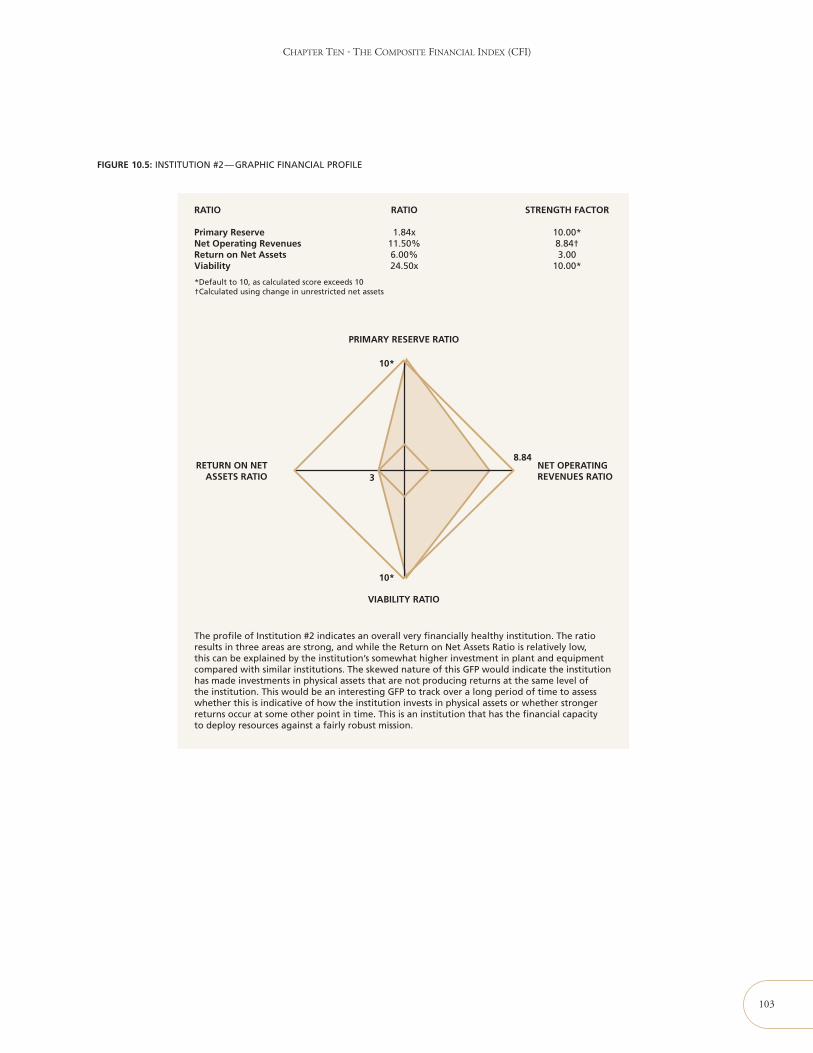
CHAPTER TEN • THE COMPOSITE FINANCIAL INDEX (CFI)
103
FIGURE 10.5: INSTITUTION #2—GRAPHIC FINANCIAL PROFILE
PRIMARY RESERVE RATIO
VIABILITY RATIO
8.84
10*
10*
3RETURN ON NET
ASSETS RATIO
RATIO
Primary ReserveNet Operating RevenuesReturn on Net AssetsViability
RATIO
1.84x11.50%6.00%24.50x
STRENGTH FACTOR
10.00*8.84†3.00
10.00*
*Default to 10, as calculated score exceeds 10†Calculated using change in unrestricted net assets
NET OPERATING REVENUES RATIO
The profile of Institution #2 indicates an overall very financially healthy institution. The ratio results in three areas are strong, and while the Return on Net Assets Ratio is relatively low,this can be explained by the institution’s somewhat higher investment in plant and equipmentcompared with similar institutions. The skewed nature of this GFP would indicate the institution has made investments in physical assets that are not producing returns at the same level ofthe institution. This would be an interesting GFP to track over a long period of time to assess whether this is indicative of how the institution invests in physical assets or whether stronger returns occur at some other point in time. This is an institution that has the financial capacityto deploy resources against a fairly robust mission.

104
• STRATEGIC FINANCIAL ANALYSIS FOR HIGHER EDUCATION •
FIGURE 10.6: INSTITUTION #3—GRAPHIC FINANCIAL PROFILE
PRIMARY RESERVE RATIO
VIABILITY RATIO
6.0
7.37
10*4.5RETURN ON NETASSETS RATIO
RATIO
Primary ReserveNet Operating RevenuesReturn on Net AssetsViability
RATIO
0.98x 17.00% 9.00% 2.50x
STRENGTH FACTOR
7.3710.00*
4.506.00
*Default to 10, as calculated score exceeds 10
NET OPERATING REVENUES RATIO
The profile of Institution #3 indicates a financially strong institution that has produced substantial returns on current activities. At present, there are no perceived financial weaknesses and the institution should focus on moving selected institutional initiatives forward. As with Institution #2, the return on net assets is lower than the other three ratios, but it is at a high enough level to indicate that the institution would likely not run into return issues, at least in the periods near this calculation.
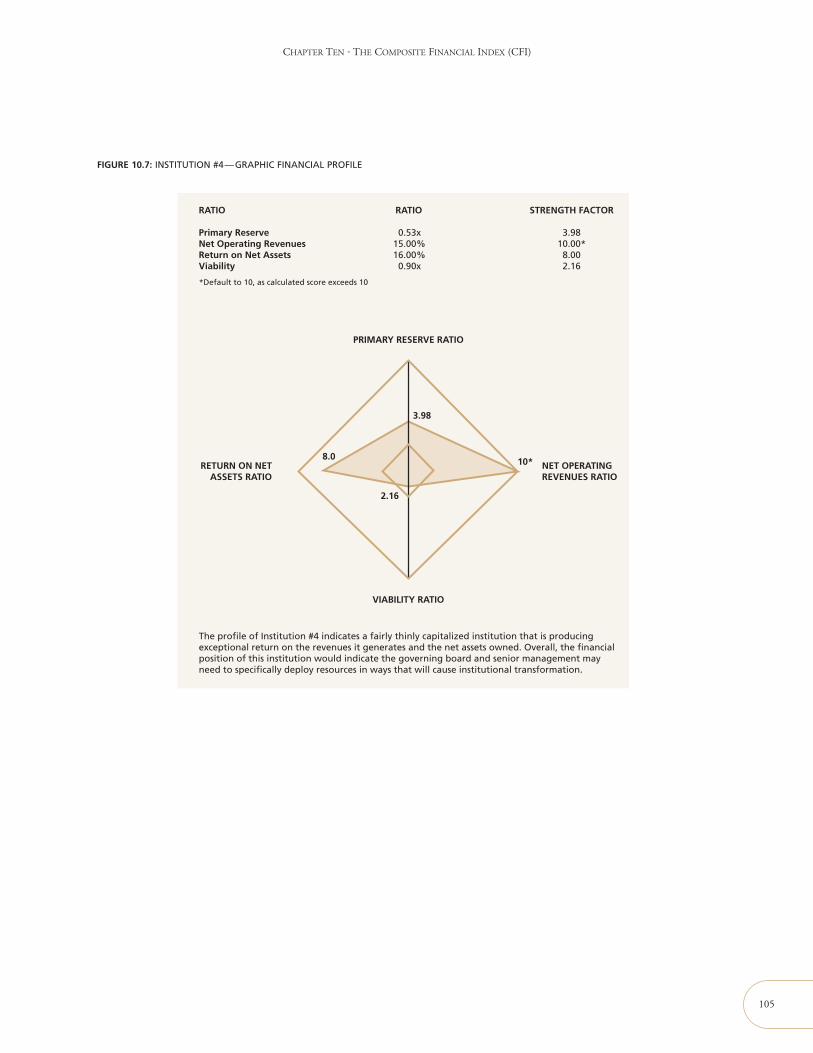
CHAPTER TEN • THE COMPOSITE FINANCIAL INDEX (CFI)
105
FIGURE 10.7: INSTITUTION #4—GRAPHIC FINANCIAL PROFILE
PRIMARY RESERVE RATIO
VIABILITY RATIO
2.16
3.98
10*8.0RETURN ON NET
ASSETS RATIO
RATIO
Primary ReserveNet Operating RevenuesReturn on Net AssetsViability
RATIO
0.53x 15.00% 16.00% 0.90x
STRENGTH FACTOR
3.9810.00*
8.002.16
*Default to 10, as calculated score exceeds 10
NET OPERATING REVENUES RATIO
The profile of Institution #4 indicates a fairly thinly capitalized institution that is producing exceptional return on the revenues it generates and the net assets owned. Overall, the financial position of this institution would indicate the governing board and senior management may need to specifically deploy resources in ways that will cause institutional transformation.
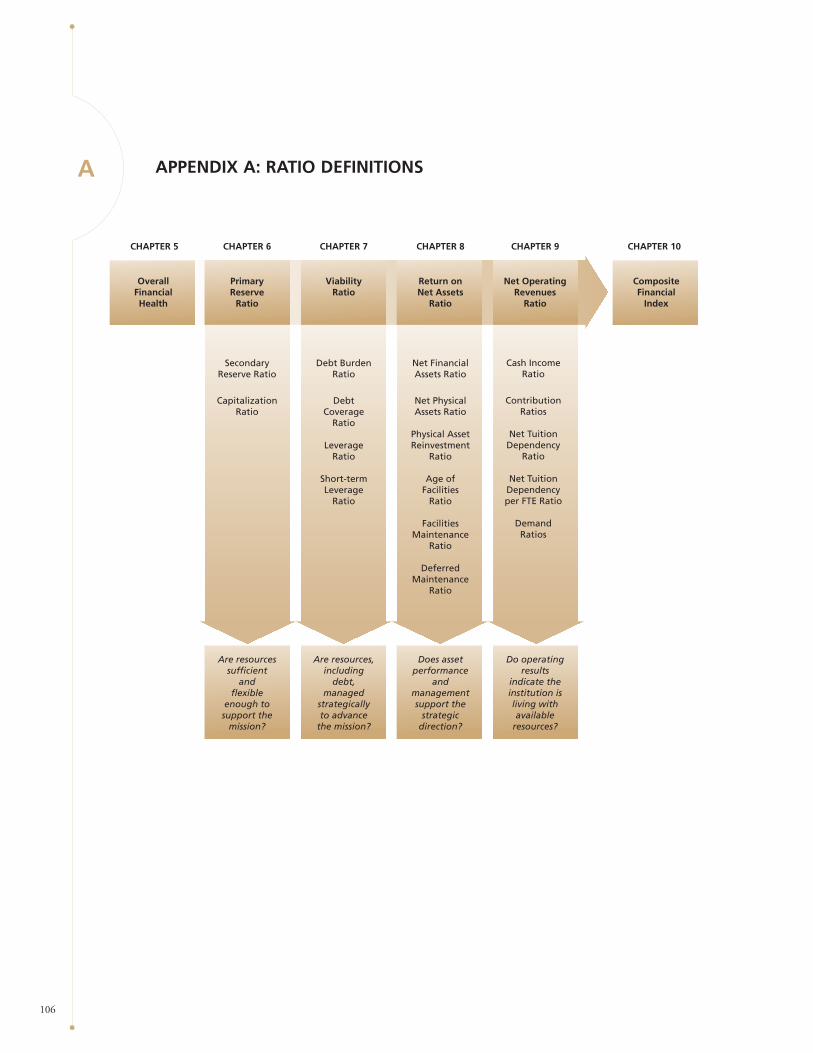
APPENDIX A: RATIO DEFINITIONS A
106
Primary Reserve
Ratio
ViabilityRatio
Return onNet Assets
Ratio
OverallFinancialHealth
Composite Financial
Index
CHAPTER 6 CHAPTER 7 CHAPTER 8 CHAPTER 9CHAPTER 5 CHAPTER 10
Net Operating Revenues
Ratio
Secondary Reserve Ratio
Debt Burden Ratio
Net Financial Assets Ratio
Cash Income Ratio
CapitalizationRatio
Debt Coverage
Ratio
Leverage Ratio
Short-term Leverage
Ratio
Net Physical Assets Ratio
Physical Asset Reinvestment
Ratio
Age ofFacilities
Ratio
Facilities Maintenance
Ratio
DeferredMaintenance
Ratio
Contribution Ratios
Net Tuition Dependency
Ratio
Net Tuition Dependency per FTE Ratio
Demand Ratios
Are resources sufficient
andflexible
enough to support the
mission?
Are resources, including
debt, managed
strategicallyto advance
the mission?
Does asset performance
and management support the
strategicdirection?
Do operating results
indicate the institution isliving with available
resources?
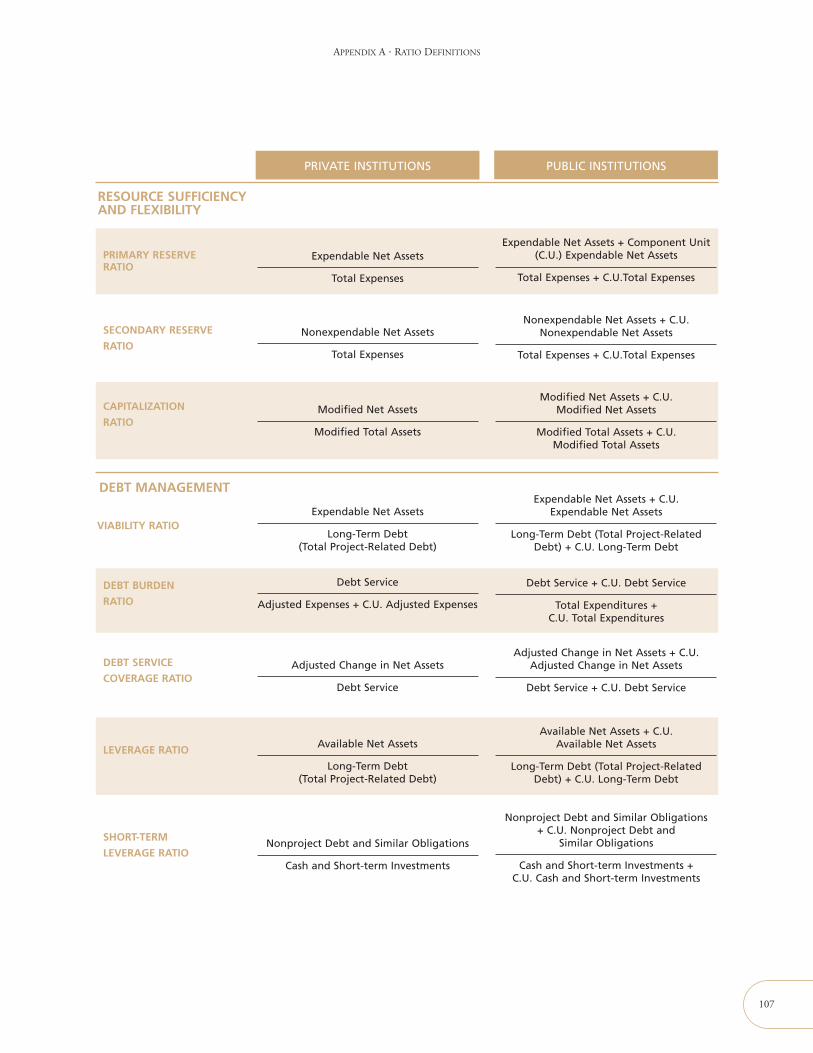
APPENDIX A • RATIO DEFINITIONS
107
SHORT-TERM
LEVERAGE RATIONonproject Debt and Similar Obligations
Cash and Short-term Investments
Nonproject Debt and Similar Obligations+ C.U. Nonproject Debt and
Similar Obligations
Cash and Short-term Investments +C.U. Cash and Short-term Investments
Expendable Net Assets
Total Expenses
Expendable Net Assets + Component Unit(C.U.) Expendable Net Assets
Total Expenses + C.U.Total Expenses
PRIVATE INSTITUTIONS PUBLIC INSTITUTIONS
Nonexpendable Net Assets
Total Expenses
Nonexpendable Net Assets + C.U.Nonexpendable Net Assets
Total Expenses + C.U.Total Expenses
Modified Net Assets
Modified Total Assets
Modified Net Assets + C.U.Modified Net Assets
Modified Total Assets + C.U.Modified Total Assets
RESOURCE SUFFICIENCYAND FLEXIBILITY
PRIMARY RESERVERATIO
SECONDARY RESERVE
RATIO
CAPITALIZATION
RATIO
VIABILITY RATIO
DEBT BURDEN
RATIO
DEBT MANAGEMENT
Expendable Net Assets
Long-Term Debt(Total Project-Related Debt)
Expendable Net Assets + C.U.Expendable Net Assets
Long-Term Debt (Total Project-RelatedDebt) + C.U. Long-Term Debt
Debt Service
Adjusted Expenses + C.U. Adjusted Expenses
Debt Service + C.U. Debt Service
Total Expenditures +C.U. Total Expenditures
DEBT SERVICE
COVERAGE RATIOAdjusted Change in Net Assets
Debt Service
Adjusted Change in Net Assets + C.U.Adjusted Change in Net Assets
Debt Service + C.U. Debt Service
LEVERAGE RATIO Available Net Assets
Long-Term Debt(Total Project-Related Debt)
Available Net Assets + C.U.Available Net Assets
Long-Term Debt (Total Project-RelatedDebt) + C.U. Long-Term Debt
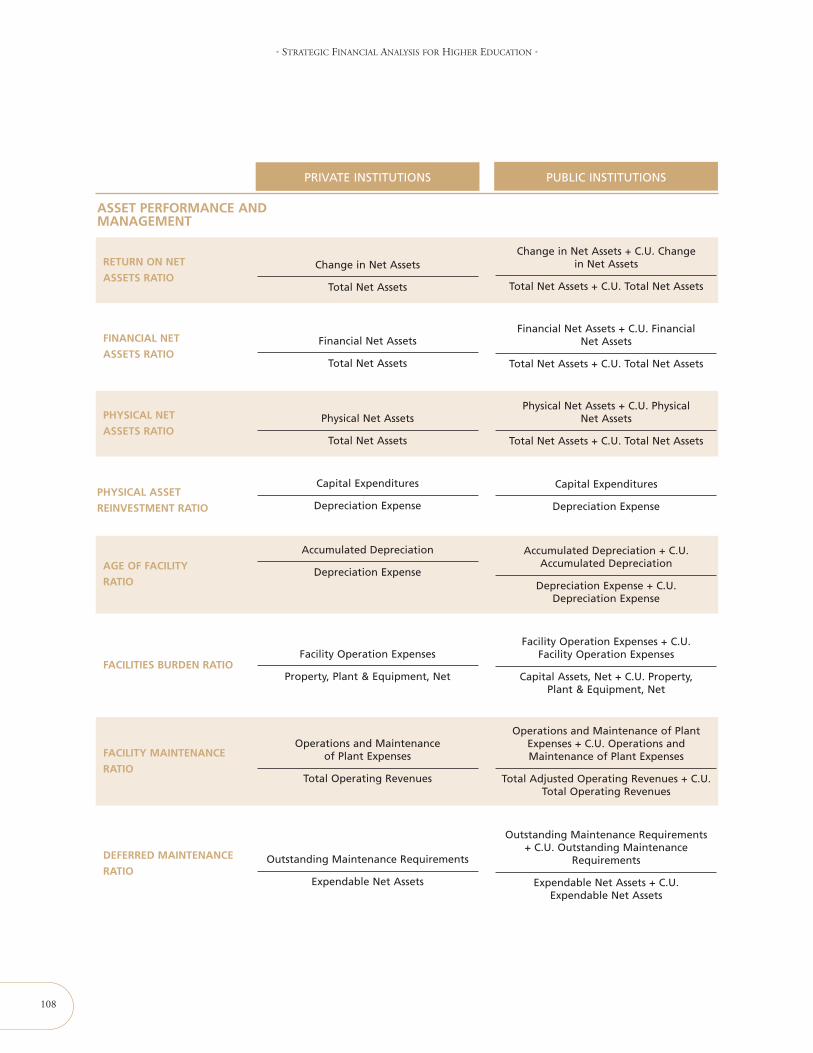
108
• STRATEGIC FINANCIAL ANALYSIS FOR HIGHER EDUCATION •
Change in Net Assets
Total Net Assets
Change in Net Assets + C.U. Changein Net Assets
Total Net Assets + C.U. Total Net Assets
PRIVATE INSTITUTIONS PUBLIC INSTITUTIONS
Financial Net Assets
Total Net Assets
Financial Net Assets + C.U. FinancialNet Assets
Total Net Assets + C.U. Total Net Assets
Physical Net Assets
Total Net Assets
Physical Net Assets + C.U. PhysicalNet Assets
Total Net Assets + C.U. Total Net Assets
ASSET PERFORMANCE ANDMANAGEMENT
RETURN ON NET
ASSETS RATIO
FINANCIAL NET
ASSETS RATIO
PHYSICAL NET
ASSETS RATIO
PHYSICAL ASSET
REINVESTMENT RATIO
AGE OF FACILITY
RATIO
Capital Expenditures
Depreciation Expense
Capital Expenditures
Depreciation Expense
Accumulated Depreciation
Depreciation Expense
Accumulated Depreciation + C.U.Accumulated Depreciation
Depreciation Expense + C.U.Depreciation Expense
FACILITIES BURDEN RATIOFacility Operation Expenses
Property, Plant & Equipment, Net
Facility Operation Expenses + C.U.Facility Operation Expenses
Capital Assets, Net + C.U. Property,Plant & Equipment, Net
FACILITY MAINTENANCE
RATIO
Operations and Maintenanceof Plant Expenses
Total Operating Revenues
Operations and Maintenance of PlantExpenses + C.U. Operations andMaintenance of Plant Expenses
Total Adjusted Operating Revenues + C.U.Total Operating Revenues
DEFERRED MAINTENANCE
RATIOOutstanding Maintenance Requirements
Expendable Net Assets
Outstanding Maintenance Requirements+ C.U. Outstanding Maintenance
Requirements
Expendable Net Assets + C.U.Expendable Net Assets
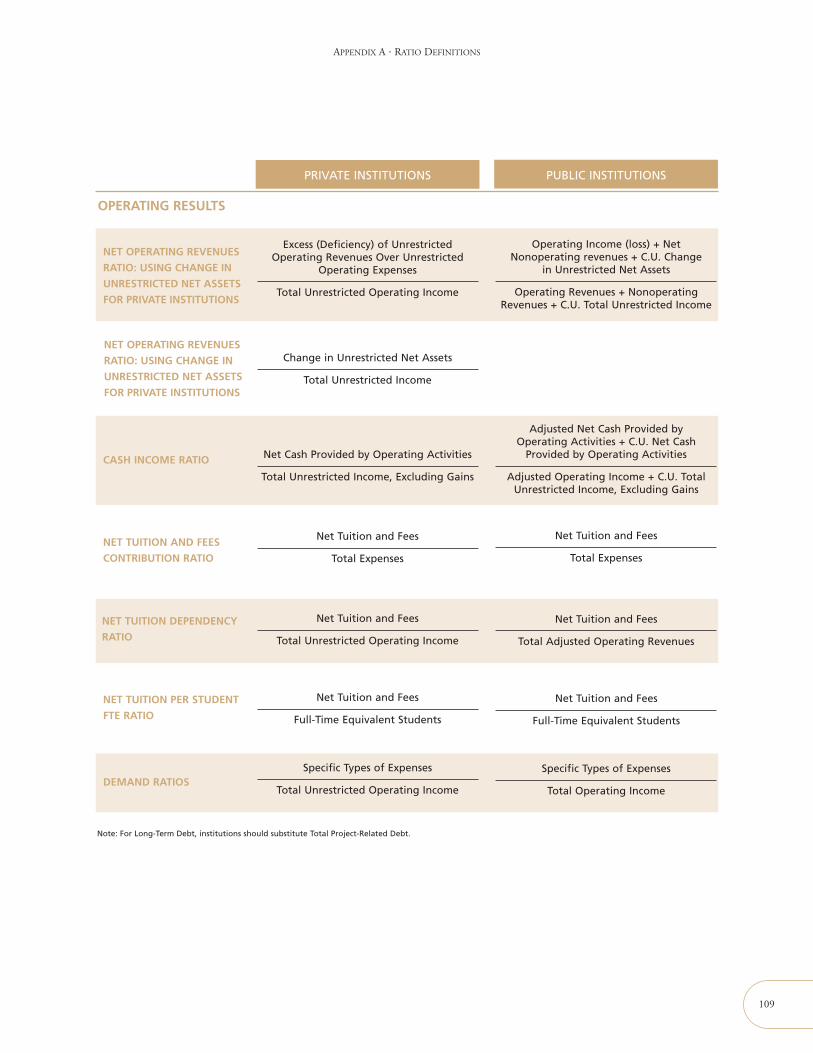
APPENDIX A • RATIO DEFINITIONS
109
PRIVATE INSTITUTIONS PUBLIC INSTITUTIONS
Net Cash Provided by Operating Activities
Total Unrestricted Income, Excluding Gains
Adjusted Net Cash Provided byOperating Activities + C.U. Net Cash
Provided by Operating Activities
Adjusted Operating Income + C.U. TotalUnrestricted Income, Excluding Gains
Net Tuition and Fees
Total Expenses
Net Tuition and Fees
Total Expenses
OPERATING RESULTS
NET OPERATING REVENUES
RATIO: USING CHANGE IN
UNRESTRICTED NET ASSETS
FOR PRIVATE INSTITUTIONS
CASH INCOME RATIO
NET TUITION AND FEES
CONTRIBUTION RATIO
NET TUITION DEPENDENCY
RATIO
NET TUITION PER STUDENT
FTE RATIO
Net Tuition and Fees
Total Unrestricted Operating Income
Net Tuition and Fees
Total Adjusted Operating Revenues
Net Tuition and Fees
Full-Time Equivalent Students
DEMAND RATIOSSpecific Types of Expenses
Total Unrestricted Operating Income
Specific Types of Expenses
Total Operating Income
Excess (Deficiency) of UnrestrictedOperating Revenues Over Unrestricted
Operating Expenses
Total Unrestricted Operating Income
Operating Income (loss) + NetNonoperating revenues + C.U. Change
in Unrestricted Net Assets
Operating Revenues + NonoperatingRevenues + C.U. Total Unrestricted Income
Change in Unrestricted Net Assets
Total Unrestricted Income
NET OPERATING REVENUES
RATIO: USING CHANGE IN
UNRESTRICTED NET ASSETS
FOR PRIVATE INSTITUTIONS
Note: For Long-Term Debt, institutions should substitute Total Project-Related Debt.
Net Tuition and Fees
Full-Time Equivalent Students
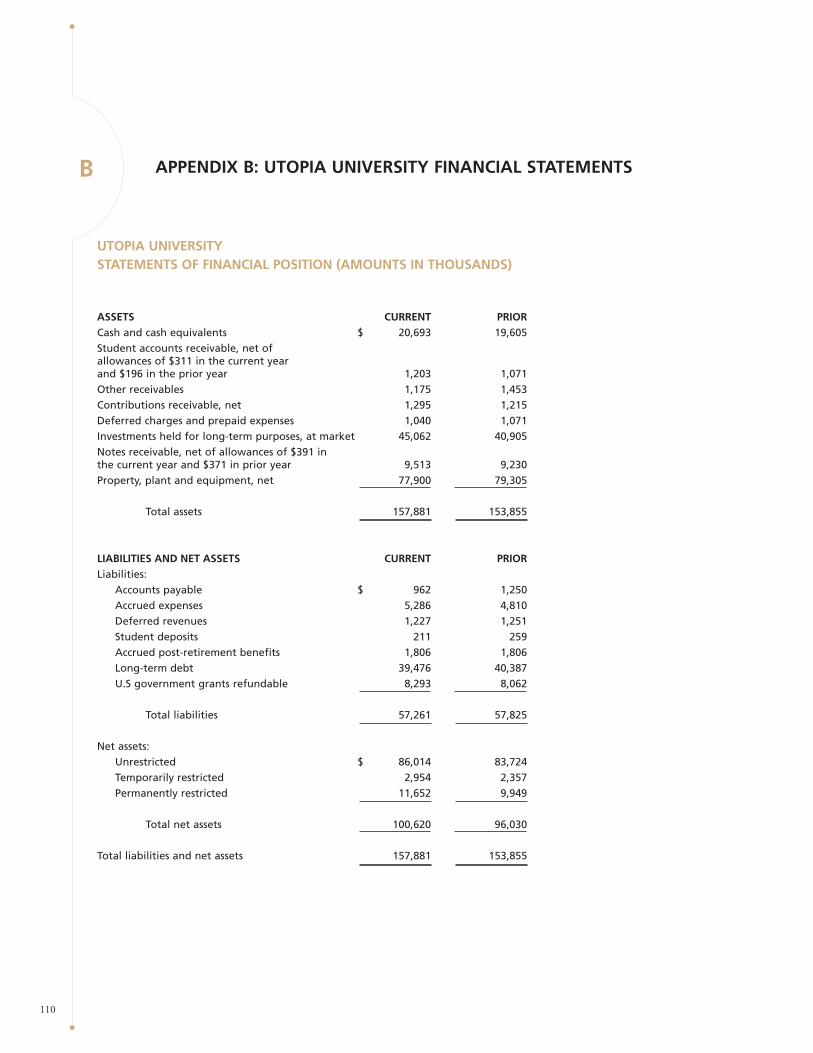
APPENDIX B: UTOPIA UNIVERSITY FINANCIAL STATEMENTSB
110
UTOPIA UNIVERSITYSTATEMENTS OF FINANCIAL POSITION (AMOUNTS IN THOUSANDS)
ASSETS CURRENT PRIORCash and cash equivalents $ 20,693 19,605Student accounts receivable, net ofallowances of $311 in the current yearand $196 in the prior year 1,203 1,071Other receivables 1,175 1,453Contributions receivable, net 1,295 1,215Deferred charges and prepaid expenses 1,040 1,071Investments held for long-term purposes, at market 45,062 40,905Notes receivable, net of allowances of $391 inthe current year and $371 in prior year 9,513 9,230Property, plant and equipment, net 77,900 79,305
Total assets 157,881 153,855
LIABILITIES AND NET ASSETS CURRENT PRIORLiabilities:
Accounts payable $ 962 1,250Accrued expenses 5,286 4,810Deferred revenues 1,227 1,251Student deposits 211 259Accrued post-retirement benefits 1,806 1,806Long-term debt 39,476 40,387U.S government grants refundable 8,293 8,062
Total liabilities 57,261 57,825
Net assets:Unrestricted $ 86,014 83,724Temporarily restricted 2,954 2,357Permanently restricted 11,652 9,949
Total net assets 100,620 96,030
Total liabilities and net assets 157,881 153,855

APPENDIX B • UTOPIA UNIVERSITY FINANCIAL STATEMENTS
111
UTOPIA UNIVERSITYCURRENT YEAR STATEMENT OF ACTIVITIES (AMOUNTS IN THOUSANDS)
TEMPORARILY PERMANENTLYUNRESTRICTED UNRESTRICTED UNRESTRICTED TOTAL
RevenuesEducational and general:
Tuition and fees $ 60,374 – – 60,374Less scholarship allowances (14,538) – – (14,538)
Net tuition and fees 45,836 – – 45,836
Federal grants and contracts 1,467 – – 1,467State grants and contracts 1,194 – – 1,194Private gifts and grants 2,598 553 – 3,151Interest on loans receivable 37 – – 37Investment income 1,457 413 31 1,901Other sources 628 – – 628
Auxiliary enterprises 14,800 – – 14,800
Total revenues and gains 68,017 966 31 69,014
Net assets released from restrictions—satisfaction of program restrictions 2,049 (2,049) – –
Total revenues, gains andother support 70,066 (1,083) 31 69,014
Expenses
Educational and general:Instruction 30,854 – – 30,854Research 57 – – 57Public services 42 – – 42Academic support 7,305 – – 7,305Student services 10,012 – – 10,012Institutional support 10,183 – – 10,183
Total educational and general 58,453 – – 58,453
Auxiliary enterprises 10,016 – – 10,016
Total expenses 68,469 68,469
Excess (deficiency) of operatingrevenues over operating expenses 1,597 (1,083) 31 545
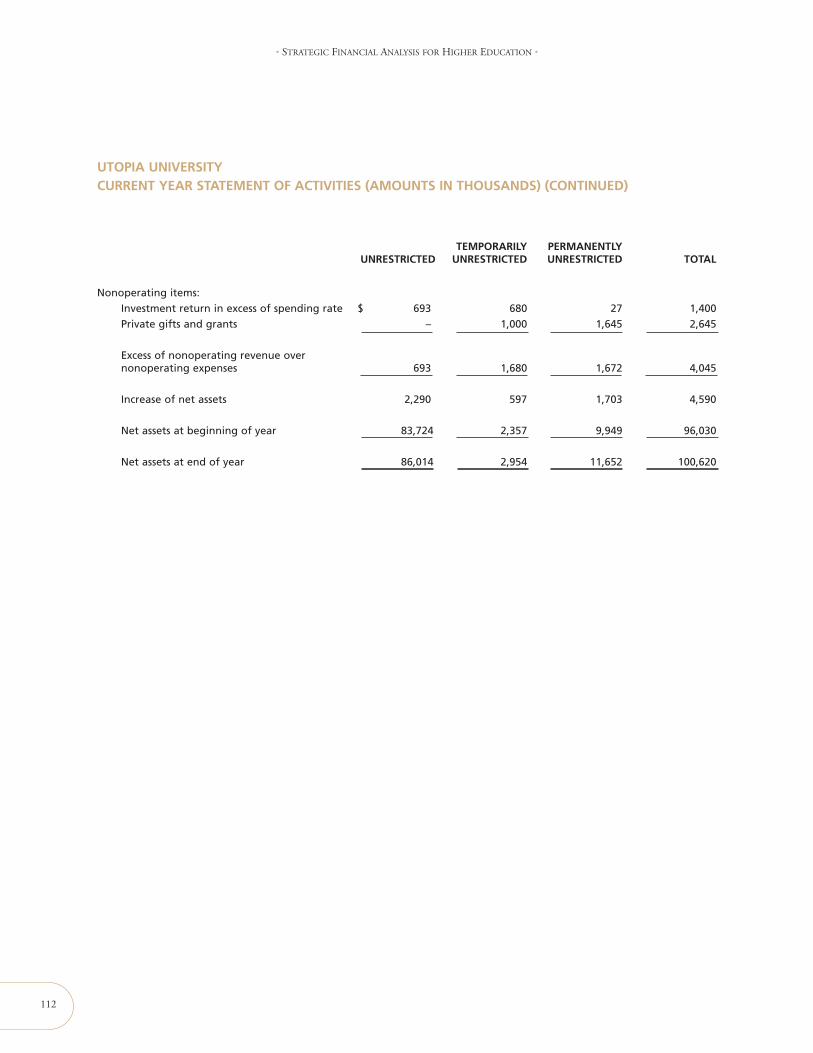
112
• STRATEGIC FINANCIAL ANALYSIS FOR HIGHER EDUCATION •
Nonoperating items:Investment return in excess of spending rate $ 693 680 27 1,400Private gifts and grants – 1,000 1,645 2,645
Excess of nonoperating revenue overnonoperating expenses 693 1,680 1,672 4,045
Increase of net assets 2,290 597 1,703 4,590
Net assets at beginning of year 83,724 2,357 9,949 96,030
Net assets at end of year 86,014 2,954 11,652 100,620
TEMPORARILY PERMANENTLYUNRESTRICTED UNRESTRICTED UNRESTRICTED TOTAL
UTOPIA UNIVERSITYCURRENT YEAR STATEMENT OF ACTIVITIES (AMOUNTS IN THOUSANDS) (CONTINUED)
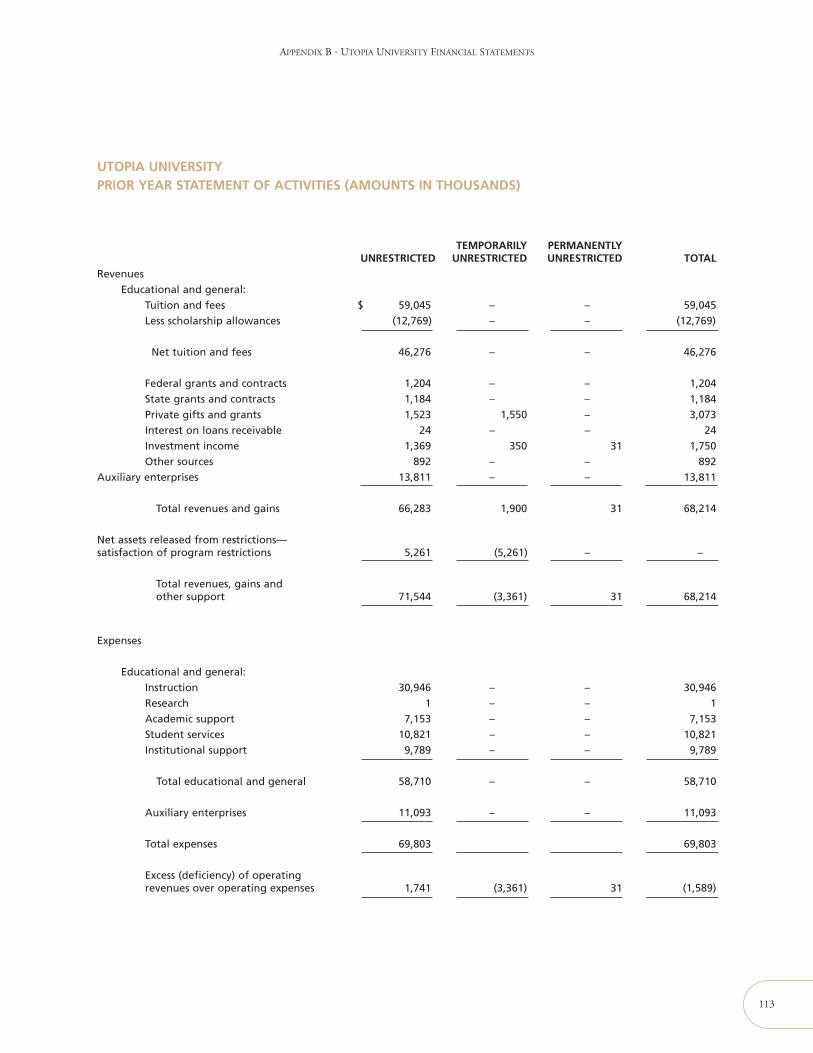
APPENDIX B • UTOPIA UNIVERSITY FINANCIAL STATEMENTS
113
UTOPIA UNIVERSITYPRIOR YEAR STATEMENT OF ACTIVITIES (AMOUNTS IN THOUSANDS)
TEMPORARILY PERMANENTLYUNRESTRICTED UNRESTRICTED UNRESTRICTED TOTAL
RevenuesEducational and general:
Tuition and fees $ 59,045 – – 59,045Less scholarship allowances (12,769) – – (12,769)
Net tuition and fees 46,276 – – 46,276
Federal grants and contracts 1,204 – – 1,204State grants and contracts 1,184 – – 1,184Private gifts and grants 1,523 1,550 – 3,073Interest on loans receivable 24 – – 24Investment income 1,369 350 31 1,750Other sources 892 – – 892
Auxiliary enterprises 13,811 – – 13,811
Total revenues and gains 66,283 1,900 31 68,214
Net assets released from restrictions—satisfaction of program restrictions 5,261 (5,261) – –
Total revenues, gains andother support 71,544 (3,361) 31 68,214
Expenses
Educational and general:Instruction 30,946 – – 30,946Research 1 – – 1Academic support 7,153 – – 7,153Student services 10,821 – – 10,821Institutional support 9,789 – – 9,789
Total educational and general 58,710 – – 58,710
Auxiliary enterprises 11,093 – – 11,093
Total expenses 69,803 69,803
Excess (deficiency) of operatingrevenues over operating expenses 1,741 (3,361) 31 (1,589)
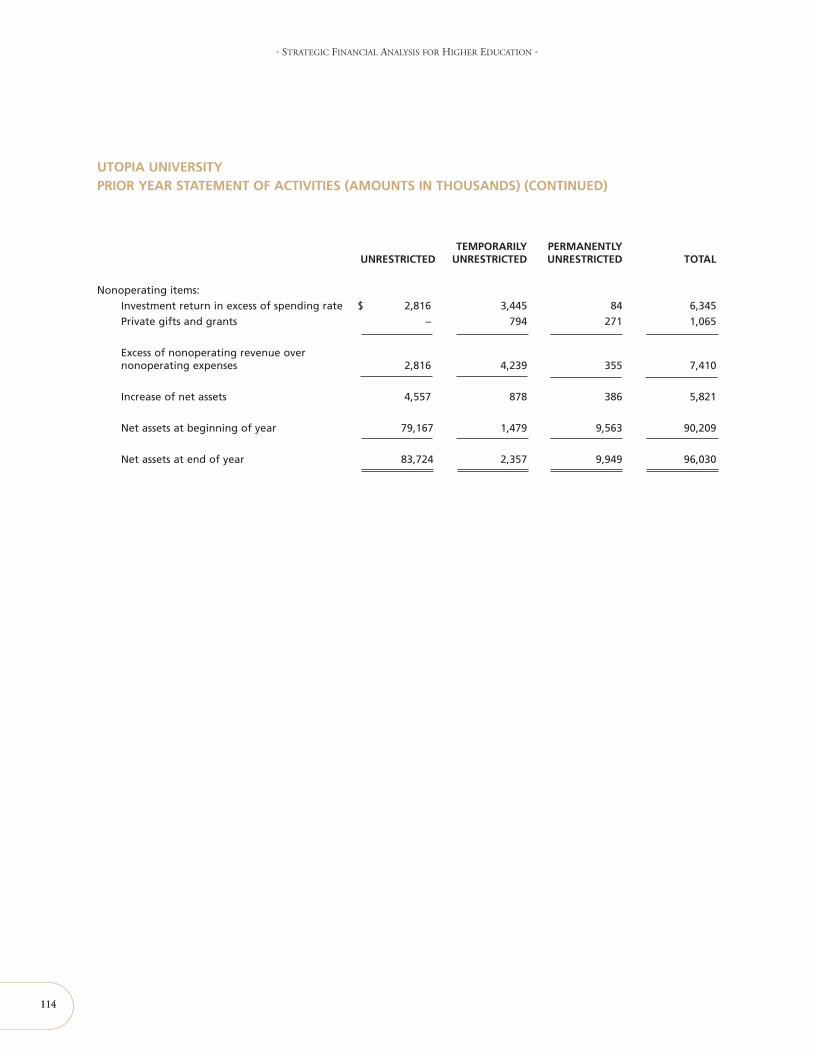
114
• STRATEGIC FINANCIAL ANALYSIS FOR HIGHER EDUCATION •
Nonoperating items:Investment return in excess of spending rate $ 2,816 3,445 84 6,345Private gifts and grants – 794 271 1,065
Excess of nonoperating revenue overnonoperating expenses 2,816 4,239 355 7,410
Increase of net assets 4,557 878 386 5,821
Net assets at beginning of year 79,167 1,479 9,563 90,209
Net assets at end of year 83,724 2,357 9,949 96,030
114
TEMPORARILY PERMANENTLYUNRESTRICTED UNRESTRICTED UNRESTRICTED TOTAL
UTOPIA UNIVERSITYPRIOR YEAR STATEMENT OF ACTIVITIES (AMOUNTS IN THOUSANDS) (CONTINUED)

APPENDIX B • UTOPIA UNIVERSITY FINANCIAL STATEMENTS
115
UTOPIA UNIVERSITYSTATEMENT OF ACTIVITIES: STATEMENT OF CASH FLOWS (AMOUNTS IN THOUSANDS)
CURRENT PRIORCash flows from operating activities:
Change in net assets $ 4,590 5,821Adjustments to reconcile change in net assetsto net cash provided by operating activities:
Depreciation expense 4,083 3,915Net realized gains on investments (2,265) (1,069)Net unrealized (appreciation)depreciation of investments 1,036 (4,340)Provision for losses on studentaccounts receivable, net 115 78Gifts and grants received forlong-term investment (1,645) (271)Gifts of property, plant and equipment (84) (174)(Increases) decreases in:
Student accounts receivable (247) (271)Other receivables 278 55Contributions receivable (80) 1,454Deferred charges and prepaid expenses 31 44
Increases (decreases) in:Accounts payable (288) (188)Accrued expenses 476 226Deferred revenues (24) (88)Student deposits (48) (9)Accrued post-retirement benefits – 132
Net cash provided by operating activities 5,928 5,315
Cash flows from investing activities:Purchases of property, plant and equipment, net (2,594) (3,279)Purchases of investments (20,740) (25,918)Proceeds from sale of investments 17,812 24,556Disbursements of notes receivable, net of repayments and other reductions (283) (303)
Net cash provided by operating activities (5,085) (4,944)
Cash flows from financing activities:Principal repayments of indebtedness (911) (1,292)Gifts and grants received for long-term investment 1,645 271Increase in U.S. government grants refundable, net 231 273
Net cash provided by (used for)financing activities 965 (748)

116
• STRATEGIC FINANCIAL ANALYSIS FOR HIGHER EDUCATION •
UTOPIA UNIVERSITYSTATEMENT OF ACTIVITIES: STATEMENT OF CASH FLOWS (AMOUNTS IN THOUSANDS)(CONTINUED)
Net increase (decrease) in cashand cash equivalents 1,088 (377)
Cash and cash equivalents—beginning of year 19,605 19,982
Cash and cash equivalents—end of year 20,693 19,605
Supplemental disclosure of cash flow information:Cash paid during the year for intereston long-term debt 2,323 2,822
Significant noncash financing and investing activities:Gifts of property, plant and equipment 84 174
CURRENT PRIOR
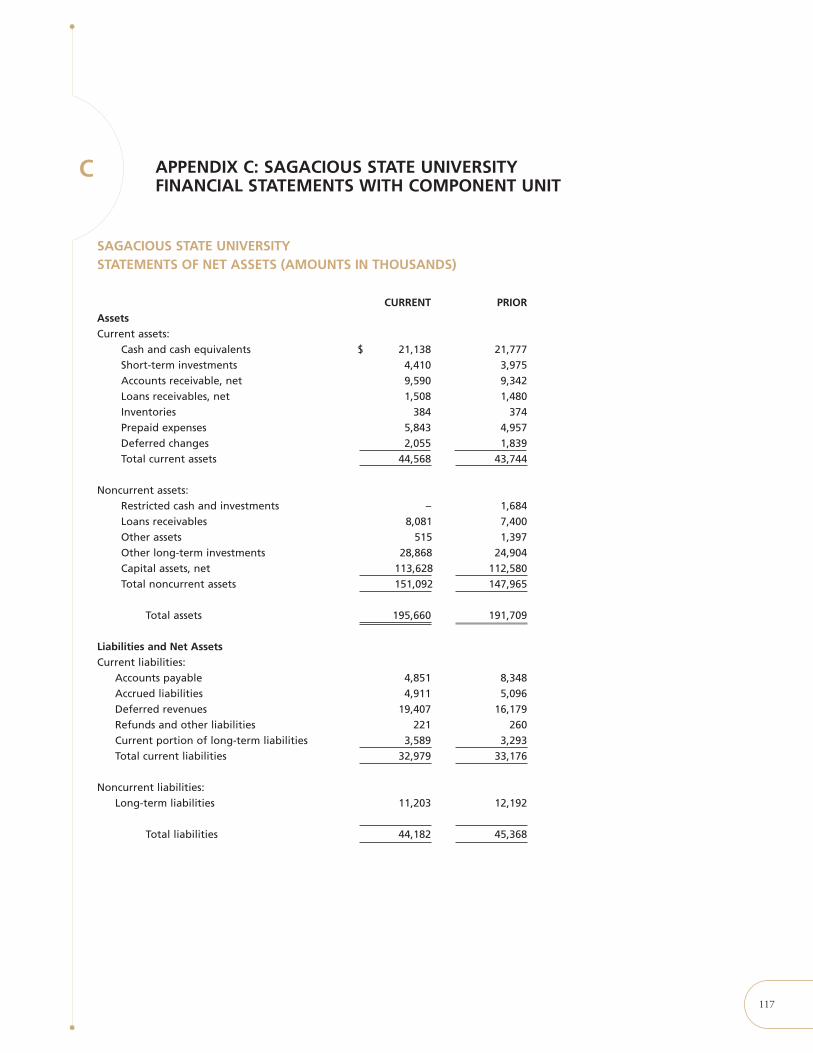
APPENDIX C: SAGACIOUS STATE UNIVERSITYFINANCIAL STATEMENTS WITH COMPONENT UNIT
C
117
CURRENT PRIORAssetsCurrent assets:
Cash and cash equivalents $ 21,138 21,777Short-term investments 4,410 3,975Accounts receivable, net 9,590 9,342Loans receivables, net 1,508 1,480Inventories 384 374Prepaid expenses 5,843 4,957Deferred changes 2,055 1,839Total current assets 44,568 43,744
Noncurrent assets:Restricted cash and investments – 1,684Loans receivables 8,081 7,400Other assets 515 1,397Other long-term investments 28,868 24,904Capital assets, net 113,628 112,580Total noncurrent assets 151,092 147,965
Total assets 195,660 191,709
Liabilities and Net AssetsCurrent liabilities:
Accounts payable 4,851 8,348Accrued liabilities 4,911 5,096Deferred revenues 19,407 16,179Refunds and other liabilities 221 260Current portion of long-term liabilities 3,589 3,293Total current liabilities 32,979 33,176
Noncurrent liabilities:Long-term liabilities 11,203 12,192
Total liabilities 44,182 45,368
SAGACIOUS STATE UNIVERSITYSTATEMENTS OF NET ASSETS (AMOUNTS IN THOUSANDS)
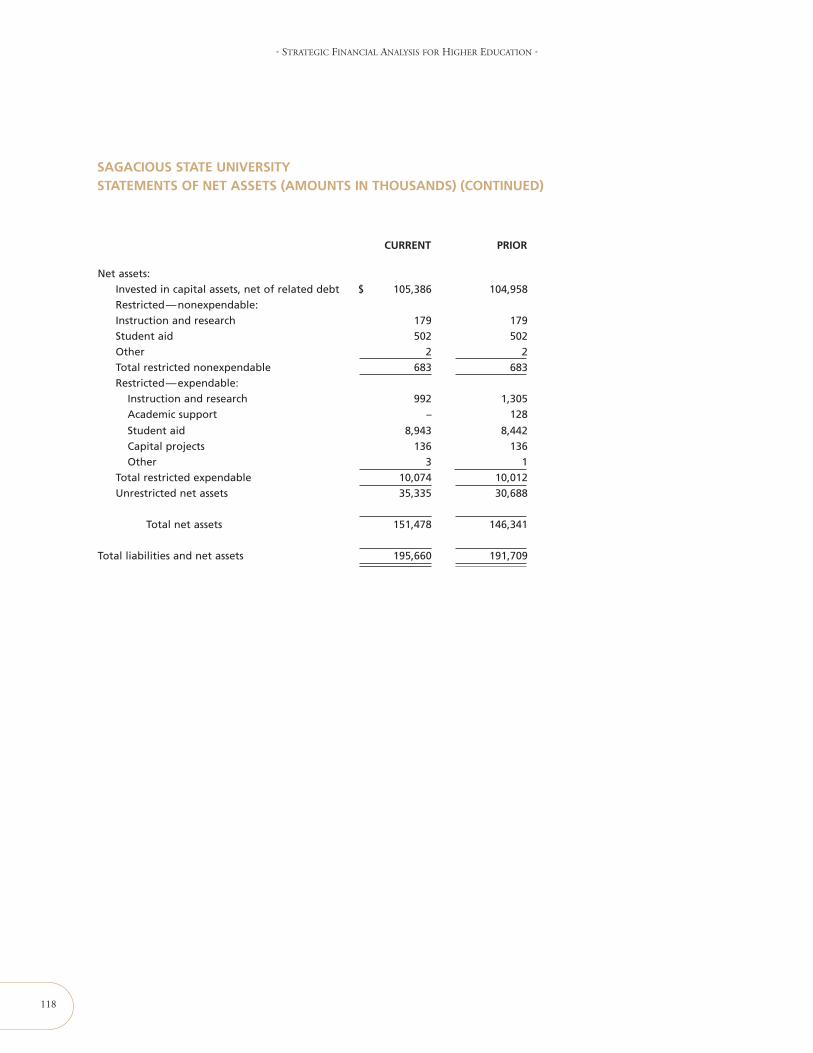
118
• STRATEGIC FINANCIAL ANALYSIS FOR HIGHER EDUCATION •
Net assets:Invested in capital assets, net of related debt $ 105,386 104,958Restricted—nonexpendable:Instruction and research 179 179Student aid 502 502Other 2 2Total restricted nonexpendable 683 683Restricted—expendable:
Instruction and research 992 1,305Academic support – 128
Student aid 8,943 8,442Capital projects 136 136Other 3 1
Total restricted expendable 10,074 10,012Unrestricted net assets 35,335 30,688
Total net assets 151,478 146,341
Total liabilities and net assets 195,660 191,709
SAGACIOUS STATE UNIVERSITYSTATEMENTS OF NET ASSETS (AMOUNTS IN THOUSANDS) (CONTINUED)
CURRENT PRIOR
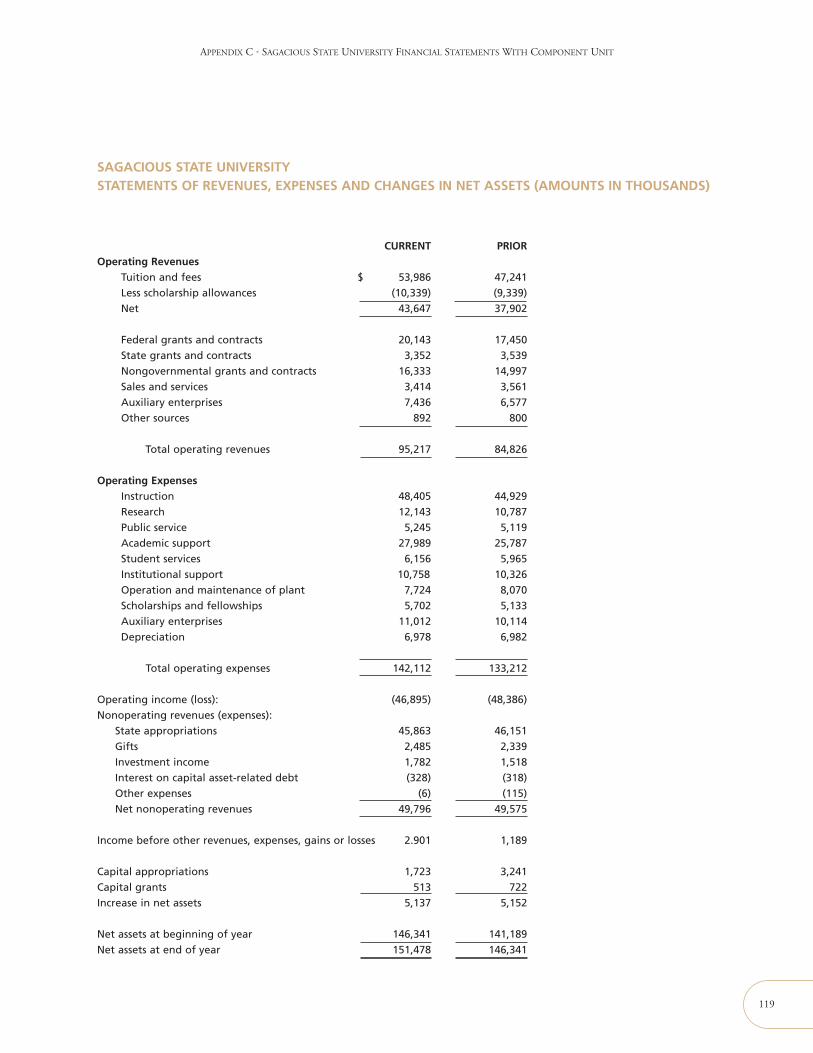
APPENDIX C • SAGACIOUS STATE UNIVERSITY FINANCIAL STATEMENTS WITH COMPONENT UNIT
119
CURRENT PRIOROperating Revenues
Tuition and fees $ 53,986 47,241Less scholarship allowances (10,339) (9,339)Net 43,647 37,902
Federal grants and contracts 20,143 17,450State grants and contracts 3,352 3,539Nongovernmental grants and contracts 16,333 14,997Sales and services 3,414 3,561Auxiliary enterprises 7,436 6,577Other sources 892 800
Total operating revenues 95,217 84,826
Operating ExpensesInstruction 48,405 44,929Research 12,143 10,787Public service 5,245 5,119Academic support 27,989 25,787Student services 6,156 5,965Institutional support 10,758 10,326Operation and maintenance of plant 7,724 8,070Scholarships and fellowships 5,702 5,133Auxiliary enterprises 11,012 10,114Depreciation 6,978 6,982
Total operating expenses 142,112 133,212
Operating income (loss): (46,895) (48,386)Nonoperating revenues (expenses):
State appropriations 45,863 46,151Gifts 2,485 2,339Investment income 1,782 1,518Interest on capital asset-related debt (328) (318)Other expenses (6) (115)Net nonoperating revenues 49,796 49,575
Income before other revenues, expenses, gains or losses 2.901 1,189
Capital appropriations 1,723 3,241Capital grants 513 722Increase in net assets 5,137 5,152
Net assets at beginning of year 146,341 141,189Net assets at end of year 151,478 146,341
SAGACIOUS STATE UNIVERSITYSTATEMENTS OF REVENUES, EXPENSES AND CHANGES IN NET ASSETS (AMOUNTS IN THOUSANDS)
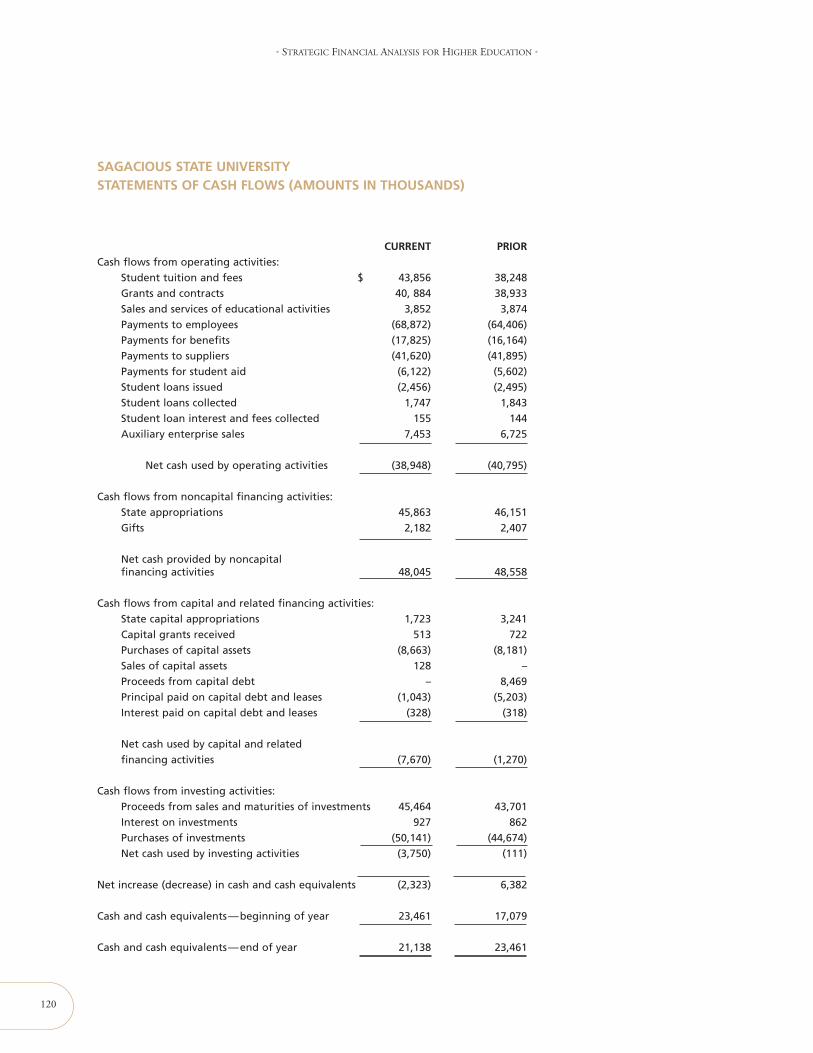
120
• STRATEGIC FINANCIAL ANALYSIS FOR HIGHER EDUCATION •
SAGACIOUS STATE UNIVERSITY STATEMENTS OF CASH FLOWS (AMOUNTS IN THOUSANDS)
CURRENT PRIORCash flows from operating activities:
Student tuition and fees $ 43,856 38,248Grants and contracts 40, 884 38,933Sales and services of educational activities 3,852 3,874Payments to employees (68,872) (64,406)Payments for benefits (17,825) (16,164)Payments to suppliers (41,620) (41,895)Payments for student aid (6,122) (5,602)Student loans issued (2,456) (2,495)Student loans collected 1,747 1,843Student loan interest and fees collected 155 144Auxiliary enterprise sales 7,453 6,725
Net cash used by operating activities (38,948) (40,795)
Cash flows from noncapital financing activities:State appropriations 45,863 46,151Gifts 2,182 2,407
Net cash provided by noncapitalfinancing activities 48,045 48,558
Cash flows from capital and related financing activities:State capital appropriations 1,723 3,241Capital grants received 513 722Purchases of capital assets (8,663) (8,181)Sales of capital assets 128 –Proceeds from capital debt – 8,469Principal paid on capital debt and leases (1,043) (5,203)Interest paid on capital debt and leases (328) (318)
Net cash used by capital and relatedfinancing activities (7,670) (1,270)
Cash flows from investing activities:Proceeds from sales and maturities of investments 45,464 43,701Interest on investments 927 862Purchases of investments (50,141) (44,674)Net cash used by investing activities (3,750) (111)
Net increase (decrease) in cash and cash equivalents (2,323) 6,382
Cash and cash equivalents—beginning of year 23,461 17,079
Cash and cash equivalents—end of year 21,138 23,461
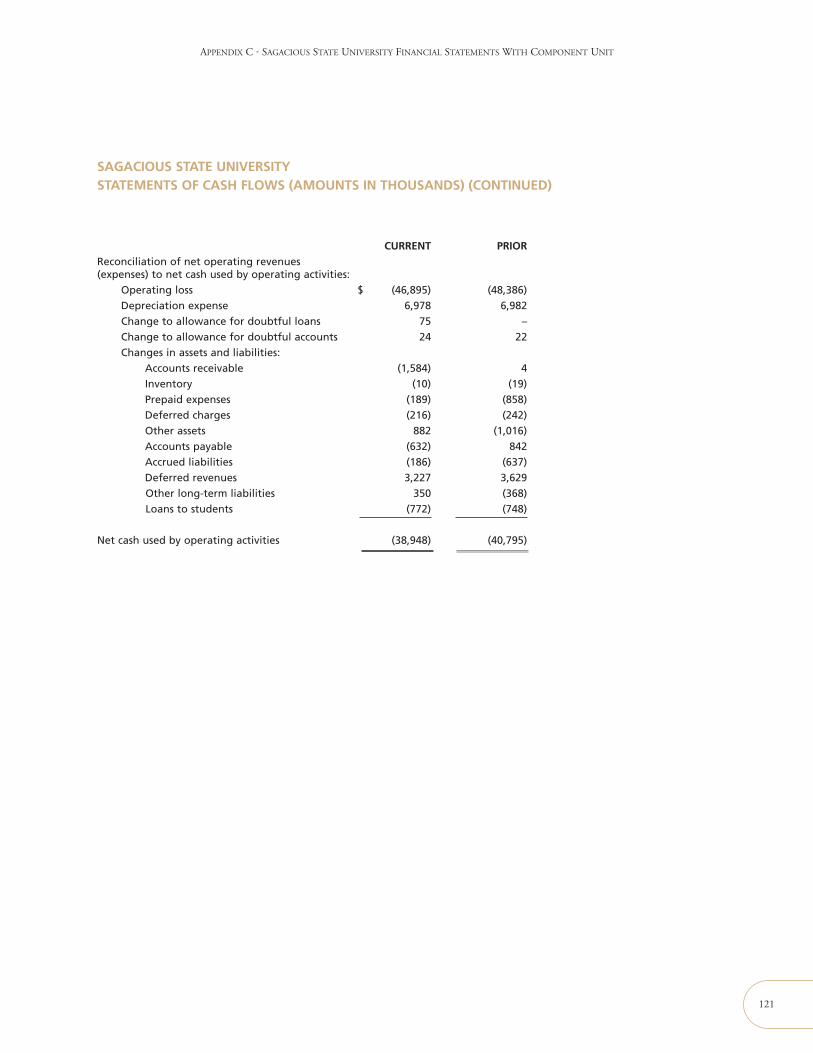
APPENDIX C • SAGACIOUS STATE UNIVERSITY FINANCIAL STATEMENTS WITH COMPONENT UNIT
121
CURRENT PRIORReconciliation of net operating revenues(expenses) to net cash used by operating activities:
Operating loss $ (46,895) (48,386)Depreciation expense 6,978 6,982Change to allowance for doubtful loans 75 –Change to allowance for doubtful accounts 24 22Changes in assets and liabilities:
Accounts receivable (1,584) 4Inventory (10) (19)Prepaid expenses (189) (858)Deferred charges (216) (242)Other assets 882 (1,016)Accounts payable (632) 842Accrued liabilities (186) (637)Deferred revenues 3,227 3,629Other long-term liabilities 350 (368)Loans to students (772) (748)
Net cash used by operating activities (38,948) (40,795)
SAGACIOUS STATE UNIVERSITYSTATEMENTS OF CASH FLOWS (AMOUNTS IN THOUSANDS) (CONTINUED)
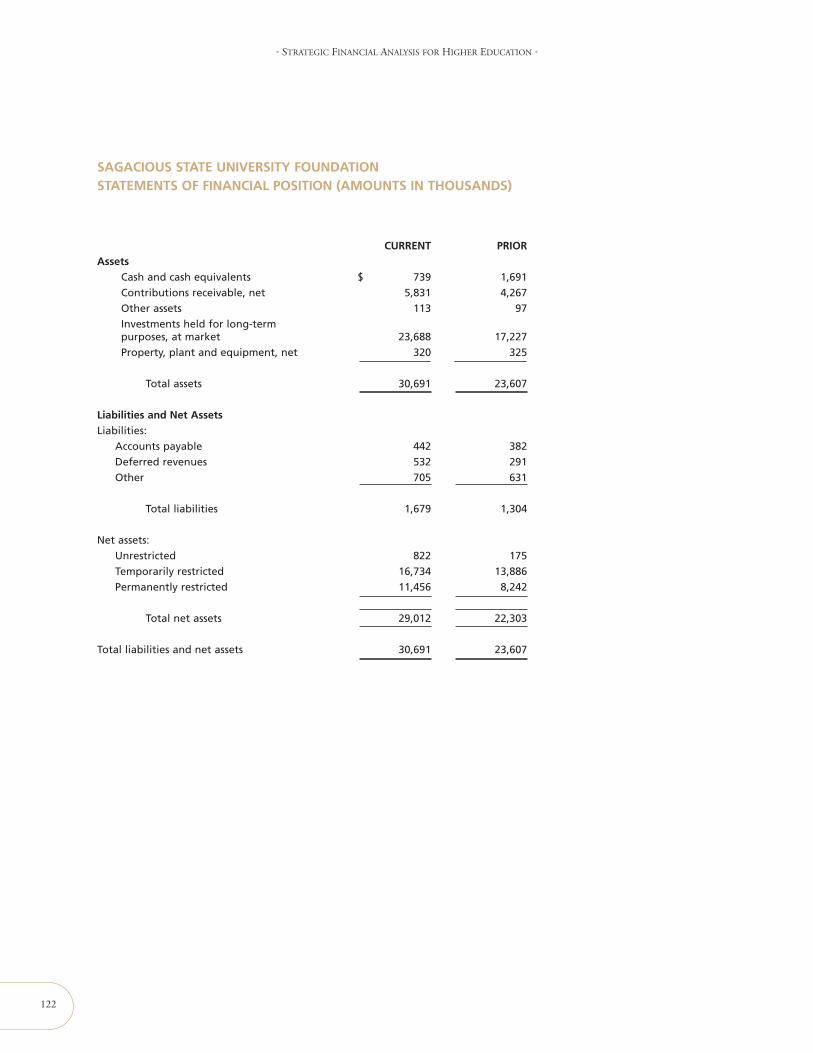
122
• STRATEGIC FINANCIAL ANALYSIS FOR HIGHER EDUCATION •
SAGACIOUS STATE UNIVERSITY FOUNDATIONSTATEMENTS OF FINANCIAL POSITION (AMOUNTS IN THOUSANDS)
CURRENT PRIORAssets
Cash and cash equivalents $ 739 1,691Contributions receivable, net 5,831 4,267Other assets 113 97Investments held for long-termpurposes, at market 23,688 17,227Property, plant and equipment, net 320 325
Total assets 30,691 23,607
Liabilities and Net AssetsLiabilities:
Accounts payable 442 382Deferred revenues 532 291Other 705 631
Total liabilities 1,679 1,304
Net assets:Unrestricted 822 175Temporarily restricted 16,734 13,886Permanently restricted 11,456 8,242
Total net assets 29,012 22,303
Total liabilities and net assets 30,691 23,607
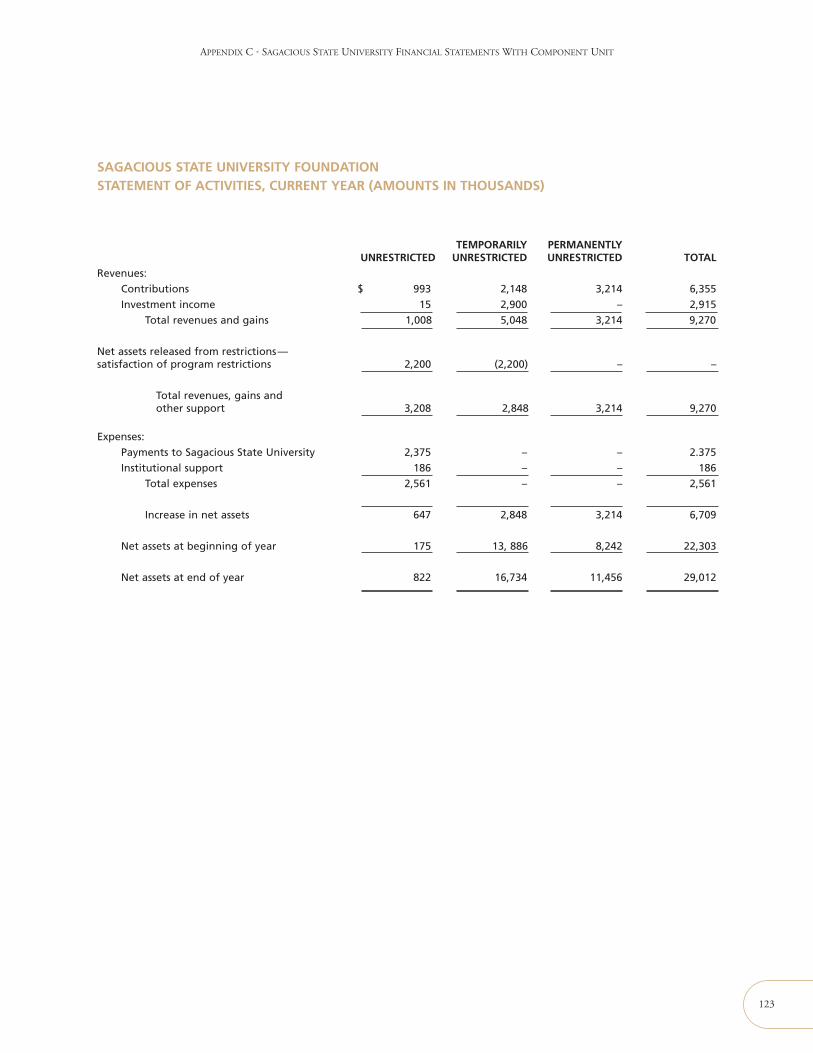
APPENDIX C • SAGACIOUS STATE UNIVERSITY FINANCIAL STATEMENTS WITH COMPONENT UNIT
123
SAGACIOUS STATE UNIVERSITY FOUNDATIONSTATEMENT OF ACTIVITIES, CURRENT YEAR (AMOUNTS IN THOUSANDS)
TEMPORARILY PERMANENTLYUNRESTRICTED UNRESTRICTED UNRESTRICTED TOTAL
Revenues:Contributions $ 993 2,148 3,214 6,355Investment income 15 2,900 – 2,915
Total revenues and gains 1,008 5,048 3,214 9,270
Net assets released from restrictions—satisfaction of program restrictions 2,200 (2,200) – –
Total revenues, gains andother support 3,208 2,848 3,214 9,270
Expenses:Payments to Sagacious State University 2,375 – – 2.375Institutional support 186 – – 186
Total expenses 2,561 – – 2,561
Increase in net assets 647 2,848 3,214 6,709
Net assets at beginning of year 175 13, 886 8,242 22,303
Net assets at end of year 822 16,734 11,456 29,012
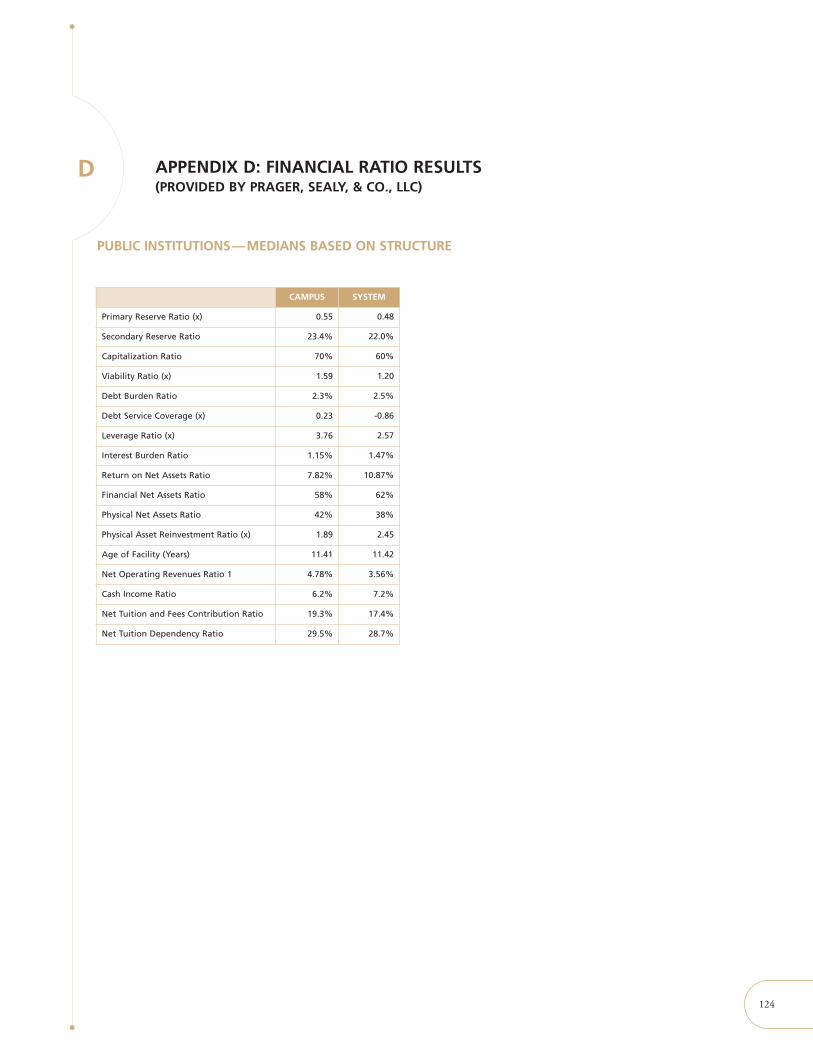
APPENDIX D: FINANCIAL RATIO RESULTS(PROVIDED BY PRAGER, SEALY, & CO., LLC)
D
124
CAMPUS SYSTEM
Primary Reserve Ratio (x) 0.55 0.48
Secondary Reserve Ratio 23.4% 22.0%
Capitalization Ratio 70% 60%
Viability Ratio (x) 1.59 1.20
Debt Burden Ratio 2.3% 2.5%
Debt Service Coverage (x) 0.23 -0.86
Leverage Ratio (x) 3.76 2.57
Interest Burden Ratio 1.15% 1.47%
Return on Net Assets Ratio 7.82% 10.87%
Financial Net Assets Ratio 58% 62%
Physical Net Assets Ratio 42% 38%
Physical Asset Reinvestment Ratio (x) 1.89 2.45
Age of Facility (Years) 11.41 11.42
Net Operating Revenues Ratio 1 4.78% 3.56%
Cash Income Ratio 6.2% 7.2%
Net Tuition and Fees Contribution Ratio 19.3% 17.4%
Net Tuition Dependency Ratio 29.5% 28.7%
PUBLIC INSTITUTIONS—MEDIANS BASED ON STRUCTURE
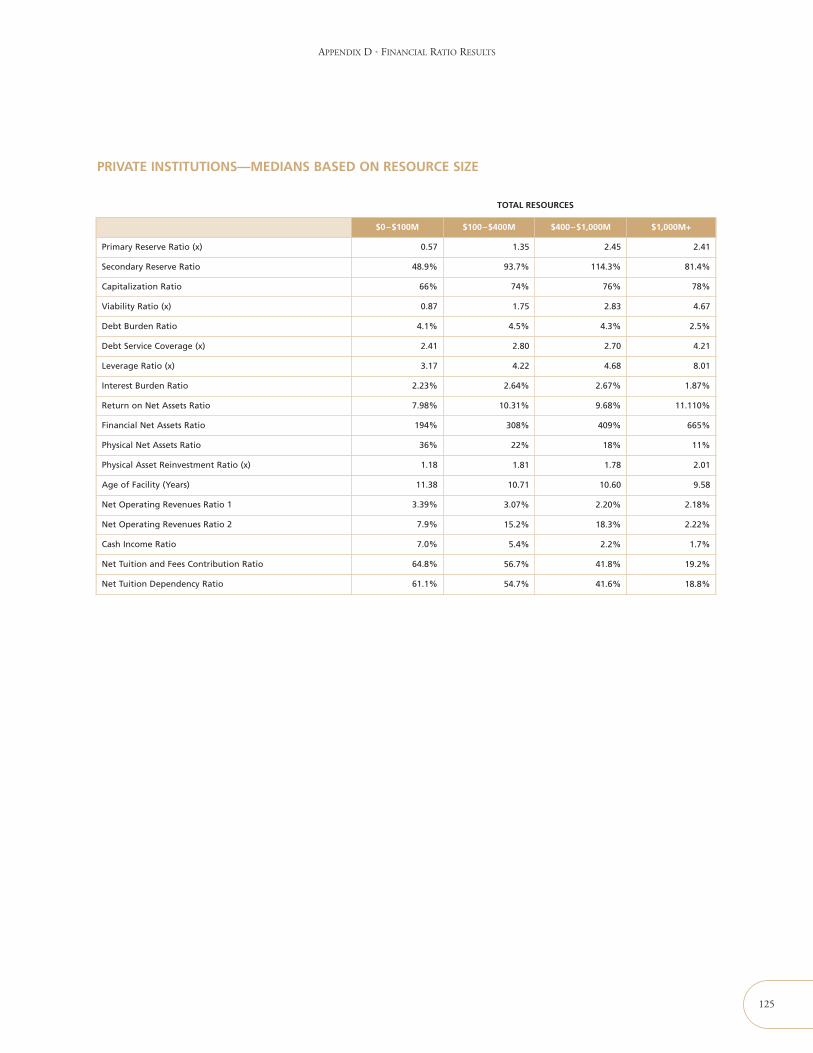
APPENDIX D • FINANCIAL RATIO RESULTS
125
$0–$100M $100–$400M $400–$1,000M $1,000M+
Primary Reserve Ratio (x) 0.57 1.35 2.45 2.41
Secondary Reserve Ratio 48.9% 93.7% 114.3% 81.4%
Capitalization Ratio 66% 74% 76% 78%
Viability Ratio (x) 0.87 1.75 2.83 4.67
Debt Burden Ratio 4.1% 4.5% 4.3% 2.5%
Debt Service Coverage (x) 2.41 2.80 2.70 4.21
Leverage Ratio (x) 3.17 4.22 4.68 8.01
Interest Burden Ratio 2.23% 2.64% 2.67% 1.87%
Return on Net Assets Ratio 7.98% 10.31% 9.68% 11.110%
Financial Net Assets Ratio 194% 308% 409% 665%
Physical Net Assets Ratio 36% 22% 18% 11%
Physical Asset Reinvestment Ratio (x) 1.18 1.81 1.78 2.01
Age of Facility (Years) 11.38 10.71 10.60 9.58
Net Operating Revenues Ratio 1 3.39% 3.07% 2.20% 2.18%
Net Operating Revenues Ratio 2 7.9% 15.2% 18.3% 2.22%
Cash Income Ratio 7.0% 5.4% 2.2% 1.7%
Net Tuition and Fees Contribution Ratio 64.8% 56.7% 41.8% 19.2%
Net Tuition Dependency Ratio 61.1% 54.7% 41.6% 18.8%
PRIVATE INSTITUTIONS—MEDIANS BASED ON RESOURCE SIZE
TOTAL RESOURCES

For more information about Strategic Financial Analysis, please contact:
Ron Salluzzo, Jennifer Lipnick or Andre DeBose of BearingPoint, Inc.: [email protected] Cowen of Prager, Sealy, & Co., LLC: [email protected] Prager of Prager, Sealy, & Co., LLC: [email protected] Mezzina of KPMG LLP: [email protected] Tahey: [email protected]

1.5" Logo
1" Logo�