cabbage value chain profile · cabbage is a leafy green biennial, grown as an annual vegetable for...
TRANSCRIPT

1
A PROFILE OF THE SOUTH AFRICAN CABBAGE MARKET VALUE CHAIN
2014
Directorate Marketing Private Bag X 15
ARCADIA 0007
Tel: 012 319 8455/6 Fax: 012 319 8131
Email: [email protected]

2
TABLE OF CONTENT 1. DESCRIPTION OF THE INDUSTRY 3
1.1 Production areas 4
1.2 Production trends 4
2. MARKET STRUCTURE 5
2.1 Domestic market and prices 5
2.2 South Africa Cabbage Exports 6
2.3 Share Analysis 15
2.4 South African Cabbage Imports 18
2.5 Processing 21
3. MARKET INTELLIGENCE 24
3.1 Tariffs 24
3.2 Non tariff barriers 26
3.3 The United States 28
3.4 Asian Market Access 28
4. GENERAL DISTRIBUTION CHANNELS 28
5. LOGISTICAL ISSUES 29
5.1 Mode of transport 29
5.2 Cold chain management 29
5.3 Packaging 29
6. COMPETITIVENESS OF SOUTH AFRICAN CABBAGE EXPORTS 30
7. CHALLENGES 33
8. ACKNOWLEDGEMENTS 33

3
1. DESCRIPTION OF THE INDUSTRY
Cabbage is a leafy green biennial, grown as an annual vegetable for its dense-leaved heads. Cabbage belongs to a class of vegetables called Brassica, also known as cruciferous vegetables because their flowers are cross-shaped. Other crucifers are broccoli, kale, cauliflower and Brussels sprouts. As with most vegetable crops, cabbages are mostly produced for and marketed through the national fresh produce markets, the informal market and chain stores. Cabbage is used raw in salads, such as coleslaw, as a cooked vegetable, or preserved in pickles or sauerkraut. Cabbage is 90% water and an excellent source of minerals, Vitamin A and C and the B vitamins. Fresh cabbage juice has been shown to promote rapid healing of peptic ulcers.
Source: Statistics and Economic Analysis, DAFF
Figure 1 above illustrates the contribution of the cabbage industry to the gross value of agricultural production over a 10 year period. In 2004 the industry contribution was the lowest recorded in a 10 year period, despite the highest production output recorded in the same year. This can be attributed to high production which, occurred while the prices were not favorable for the producers. From 2005 to 2007, the gross value increased steadily and in 2008, there was a 10% decline in contribution due to decline in producer price in the same year. In 2009, the contribution increased significantly by 46% compared to 2008, this can be attributed to higher producer prices. There was a 5.3% decrease in cabbage gross value in 2010 when compared to the previous year. This can be attributed to a decline in prices in the same year. During 2011, the industry gross value increased by 4.5% when compared to the previous year. This can be attributed to increase in production output, which occurred while the producer prices were favorable. The high industry contribution was recorded in 2012 and the gross value has increased by 9% when compared to the 2011 gross value. The increase in gross value can be attributed to 19% increase in producer price in the same season. In 2013, cabbage gross value increased by 22.9%, when compared to the previous year value and this can be ascribed to a slight increase in production output and good producer price.
0
50000000
100000000
150000000
200000000
250000000
300000000
Val
ue
(Ran
d)
Years
Figure 1: Gross value of cabbage production

4
1.1 Production areas
Cabbage grows best under cool conditions cabbage. Cabbages are produced in all provinces of South Africa, but the production is concentrated in Western Cape, Kwazulu Natal, Eastern Cape, Gauteng, Free State and North West provinces. Globally, China followed by India, Russia, Japan, South Korea, Ukraine and Indonesia are the top countries in cabbage production. Top five African countries producing cabbage are Egypt, Kenya, Ethiopia, Niger and South Africa.
1.2 Production trends
Figure 2 below illustrates the production volumes for cabbages over the past ten years.
Source: Statistics and Economic Analysis, DAFF
High production volumes were recorded in 2004 and during 2005, the production output declined by 9.2% when compared to the previous year. During 2006, production volumes dropped further and the lowest production output was recorded in 2007.There was a 6% increase in production volumes in 2008, when compared to the 2007 production volume. In 2009 the production volumes fell by 1% compared to 2008 production year. The decline in production can be attributed to increasing high production input costs and unfavorable climatic conditions. Total production of cabbage has increased by 8.9% compared to the 2009 production season. In 2011, production output increased by 1.3%, when compared to the previous year output. During 2012, production dropped by 8.4% when compared to the 2011 production season. In 2013, production volume slightly increased by 2.3% when compared to the previous year output.
0
20000
40000
60000
80000
100000
120000
140000
160000
180000
200000
Ton
s
Years
Figure 2: Total production of cabbage

5
Source: Statistics and Economic Analysis, DAFF
Figure 3 above depicts local consumption of cabbages compared to the production over the 10 year period. South African average cabbage consumption was approximately 144 061 tons per annum. Consumption volumes have gone up by 2.3% compared to 2012 consumption volumes. The figure illustrates that the production of cabbage is slightly higher than the consumption. Most of the cabbages are produced for domestic consumption. South Africa is self sufficient in terms of cabbage production and the surplus is also exported.
2. MARKET STRUCTURE
The cabbage industry operates in the deregulated environment where the prices are determined by the forces of demand and supply. Fresh cabbages are sold through the fresh produce market, processors, restaurants, hawkers, retailers and chain stores. Cabbages are also exported to other countries through export agents and marketing companies. South Africa also imports from other countries.
2.1 Domestic market and prices
National Fresh Produce Markets remain an important channel for the sale of fresh cabbage in South Africa. In 2013, approximately 74% of cabbages were distributed through fresh produce markets. The remaining 26% represent a direct sale from producer to wholesalers, retailers, processors, informal traders, exports and consumers.
0
20000
40000
60000
80000
100000
120000
140000
160000
180000
200000
2004 2005 2006 2007 2008 2009 2010 2011 2012 2013
Ton
s
Years
Figure 3: Cabbage production vs consumption
Production (Tons) Consumption (Tons)

6
Source: Statistics and Economic Analysis, DAFF
Figure 4 above illustrates the sales of cabbage in the national fresh produce market over the period of 10 years. In 2004, cabbages were sold at the lower prices due to highest volumes of cabbage supplied in the same period. During 2005, the price increased by 24.8% when compared to a price in the previous year due to a 10.3% increased cabbage volumes across the markets. From 2006 to 2007, prices increased steadily as the volume supplied dropped across the markets. In 2008 the price dropped by 16% compared to 2007 as the volumes increased across the markets. In 2009, the prices eased marginally higher by 51% due to 11% decline in volume across the market. Market prices dropped by 13.5% in 2010 due to 8.9% increase in cabbage volumes and in 2011, the price increased by 5.9% as volumes supplied across the markets dropped by 2.2%. During 2012, market price eased higher by 17% due to 6.3% drop in cabbage volume supplied at the markets. In 2013, market price has gone up by 19.7% despite a 2.8% increase in cabbage volume supplied at the market and this can be attributed to strong cabbage uptake during the same year.
2.2 South Africa Cabbage Exports
South Africa is not a major cabbage exporter; more than 70% of cabbage produced is absorbed by the domestic fresh market. In 2013, it represented 0.26% of world exports and it ranked number 29 in the world. South Africa has increased its export share in the world, but its competitiveness in the in world, as it was ranked number 49 in world cabbage exports during 2012. South African cabbage exports were mainly destined to Lesotho, Botswana, Swaziland, Namibia, Angola and Mozambique. Figure 5 below illustrates South Africa cabbage export destinations during 2013.
R 0
R 500
R 1 000
R 1 500
R 2 000
R 2 500
0
20000
40000
60000
80000
100000
120000
140000
160000
Ran
d/t
on
Ton
s
Years
Figure 4: Sales of cabbage at national fresh produce markets
Volume (tons) Price (Rand/ton)

7
Source: Trade Map
Further details relating to the exports of cabbage in 2013 are presented in Table 2. Table 2: South Africa’s major cabbage export destinations in 2013
Importers
Exported value 2013 (USD thousand)
Share in South Africa's exports (%)
Exported quantity 2013 (tons)
Unit value (USD/unit)
Exported growth in value between 2009-2013 (%, p.a.)
Exported growth in quantity between 2009-2013 (%, p.a.)
Exported growth in value between 2012-2013 (%, p.a.)
World 3018 100 9659 312 44 71 476
Lesotho 1396 46.3 5383 259
Botswana 947 31.4 2849 332
Swaziland 195 6.5 175 1114
Namibia 150 5 289 519
Angola 104 3.4 95 1095 5 -8 68
Mozambique 101 3.3 721 140 43 59 35
Mauritius 36 1.2 49 735 0 0 38
Netherlands 21 0.7 20 1050 -23 -21 -50
Switzerland 11 0.4 10 1100 -12 -10 -62
Congo 10 0.3 10 1000 -9 -19 67
Zambia 7 0.2 5 1400 13 -21 40
Gabon 6 0.2 9 667 25 32
United Kingdom 6 0.2 4 1500 -53 -54
Source: Trade Map
0 10 20 30 40 50
Lesotho Botswana Swaziland
Namibia Angola
Mozambique Mauritius
Netherlands Switzerland
Congo Zambia Gabon Other
Figure 5: South Africa's cabbage exports destinations in 2013
Share in South Africa's exports (%)

8
Table 2 indicates that during 2013, South Africa cabbage exports, which was left at to ship stores and bunkers dropped to 0.1%. During 2013, the export share to Lesotho was 46.3%. This was a significant diversity in exports as in 2012, 42.6% of South Africa’s exports were destined to the Seychelles. Botswana commanded 31.4% export share, Swaziland commanded 6.5% and Namibia has commanded 5% share of South African cabbage exports. South African cabbage exports to the world have increased by 44% and 71% in quantity and value between 2009 and 2013 period. South African exports to the Netherlands have decreased by 23% in value and 21% in quantity between 2009 and 2013 period. South African cabbage exports to Switzerland have decreased by 12% in value and 10% quantity between 2009 and 2013 period. Figure 6 below illustrates cabbage exports from South Africa over the past 10 years. In 2004 cabbage export volumes were over 800 tons per annum and this can be attributed to high production volume in the same year. During 2005, exports dropped by 26% and this can be attributed to 10% drop in domestic production in the same production year. High cabbage exports were recorded in 2007 and 2008 despite the decline in production volumes in the same years. In 2009, the cabbage export dropped by 34% compared to 2008 exports. This can be attributed to the decline in production volume in the same year. In 2010, the exports increased by 6.9% compared to the previous year. There was a 4.8% increase in 2011 cabbage exports and this can be attributed to the increase in domestic production. In 2012, cabbage exports increased by 3.7% when compared to the 2011 exports. During 2013, South Africa’s cabbage export has gone up by 21.8%, when compared to the previous year exports and this can be ascribed to 2.3% increase in domestic production output. It was generally more profitable to export cabbage in 2005 and 2009, since higher export value were recorded for volumes exported. In 2013, it was less profitable to export cabbage since low export value was recorded for volume exported.
Source: Quantec Easydata
0
1000000
2000000
3000000
4000000
5000000
6000000
7000000
0
200
400
600
800
1000
1200
Ran
d
Ton
s
Years
Figure 6: South Africa's cabbage exports
Volume (Tons) Value (Rand)

9
Figure 7 below illustrates the South Africa cabbage exports to the regions. South Africa exported cabbages mainly to Africa, Europe and from 2005 to 2010 a considerable amount of cabbage exports were not allocated to any region. A small quantity of cabbage was exported to Asian, Americas and Oceania regions. From 2010 to 2012, there were no cabbage exports destined to the Americas region. From 2003 to 2008 and 2011, there were no cabbage exports to Oceania region. Small exports to these regions can be attributed to Asian and United States countries being among top cabbage producers in the world. In 2011, unallocated cabbage exports have decreased significantly and during 2012 the unallocated exports have increased. During 2011 and 2012, African region remained the major market for cabbage exports originating from South Africa. In 2012, there was an increase in export volumes destined to Asian and Oceania regions. During 2013, African region continued to be the main export market for cabbage exports from South Africa. In the same year, there was an increase in volumes exported to Asia and Oceania while the export to Europe has dropped by 51.3%.
Source: Quantec Easydata
Figure 8 below illustrates the value of South African cabbage exports. The figure shows that it was generally more profitable to export cabbage to European region, this is illustrated by high export value. Export to African countries earned less value despite high volumes to the region. From 2009 to 2010, cabbage exports from Europe have been declining due to drop in volumes exported to that region. The highest export value was recorded in 2005 for Europe and in 2012 for the African region. During 2011 and 2012, it was more profitable to export cabbage to Asian and European regions and at the same time the value of unallocated cabbage exports have also dropped. In 2013, Europe continued to be more a profitable market for exports from South Africa, and unallocated exported had recorded a higher value. Africa, Oceania and Asia regions were the least profitable export markets.
2004 2005 2006 2007 2008 2009 2010 2011 2012 2013
Africa 591201 206046 369072 499151 581724 282171 513457 666328 701365 908862
Americas 30 35 819 2810 99 39 0 0 0 0
Asia 1817 3562 432 4288 1779 1914 467 740 1430 7649
Europe 204942 254176 223103 279302 241044 194848 101804 93393 84476 41173
Oceania 0 0 0 0 0 2000 1631 0 690 2200
Not allocated 16335 141034 159543 218651 207355 198634 109764 1878 2660 3205
0 100000 200000 300000 400000 500000 600000 700000 800000 900000
1000000
Vo
lum
e (K
g)
Years
Figure 7: Cabbage exports to the regions

10
Source: Quantec Easydata
Figure 9 is the illustration of cabbage exports by South African provinces.
Source: Quantec Easydata
2004 2005 2006 2007 2008 2009 2010 2011 2012 2013
Africa 571600 882436 755136 1495865 1842210 1421178 1830220 2522051 3427508 2715279
Americas 30 69 2840 25324 684 272 0 0 0 0
Asia 45509 47092 14708 55407 65218 68751 4719 18622 14703 7847
Europe 3484332 4585744 2512502 2816549 2806685 1973199 777369 925030 826767 431916
Oceania 0 0 0 0 0 12000 14024 0 1200 2200
Not allocated 40952 445038 569170 1027625 838585 1030805 586494 20114 26185 29541
0 500000
1000000 1500000 2000000 2500000 3000000 3500000 4000000 4500000 5000000
Val
ue
(Ran
d)
Years
Figure 8: Value of cabbage export from the regions
2004 2005 2006 2007 2008 2009 2010 2011 2012 2013
Western Cape 531910 493061 937247 863704 2166573 1930030 1433114 839301 918960 1490783
Eastern Cape 0 0 0 0 0 0 0 0 0 3600
Free State 494583 0 0 0 0 0 0 0 98298 102594
Kwazulu-Natal 6241 553301 55597 1005438 20635 103928 251335 481834 1940455 79714
North West 0 0 0 0 0 0 388 24664 19717 25540
Gauteng 3109689 4914017 2705340 3551627 3366175 2472247 1525902 2031618 1255612 1355255
Mpumalanga 0 0 156172 0 0 0 0 102632 61451 128902
Limpopo 0 0 0 0 0 0 2088 5769 1872 395
0
1000000
2000000
3000000
4000000
5000000
6000000
Val
ue(
Ran
ds)
Year
Figure 9 : Value of cabbage exports by South African Provinces

11
Figure 9; above illustrates the cabbage exports by the provinces of the past ten years. In 2011, South African cabbages were exported through Western Cape, Gauteng, Kwazulu Natal, City of Tshwane and North West to a lesser extent. There was a slight decline in value of cabbage exports compared to 2010. In 2011, Limpopo Province has recorded a cabbage export value for the first time in a ten year period. During 2012, cabbage export recorded for Kwazulu Natal has considerably increased while the cabbage exports for North West, Gauteng, Mpumalanga and Limpopo have dropped. Free State has contributed to South Africa exports after seven years of zero cabbage exports trade. In 2013, Western Cape and Gauteng continued to lead in cabbage exports originating from South Africa. In the same year Free State, Mpumalanga, North West has increased their export value while Kwazulu Natal export value has significantly dropped. The high export values for Western Cape, Gauteng, and KwaZulu Natal can be attributed to the export exit points, Cape Town harbour, OR Tambo International Airport and Durban harbour. The following figures (figure 10-14) show the value of cabbage exports from the various districts in all Provinces in South Africa.
Source: Quantec Easydata Figure 10 above indicates that cabbage exports from Western Cape province were mainly from the City of Cape Town. Eden district municipality contributed notably in 2009, 2010 and 2011. In 2011, Cape Winelands contributed to Western Cape provincial cabbage export for the first time in a 10 year period. The highest export value was recorded in 2008 from the City of Cape Town. In 2012, value of the City of Cape Town export has considerably increased while the value for Cape Winelands has significantly dropped. During 2013, City of Cape Town continued to lead in cabbage export from the Western Cape Province and the value has substantially increased, when compared to 2012 export value.
2004 2005 2006 2007 2008 2009 2010 2011 2012 2013
City of Cape Town 531910 493061 937247 863704 2166573 1922973 1424521 806832 915336 1487443
West Coast 0 0 0 0 0 0 1901 0 0 1965
Eden 0 0 0 0 0 7056 6692 22469 0 0
Cape Winelands 0 0 0 0 0 0 0 10000 3624 1375
0
500000
1000000
1500000
2000000
2500000
Val
ue
(Ran
d)
Years
Figure 10: Value of cabbage exports by Western Cape Province

12
Source: Quantec Easydata Figure 11 above indicates that cabbage exports from Kwazulu Natal province were from Ethekwini district municipality and the high value was recorded in 2007. In 2008, the export value dropped significantly and from 2009 to 2011 the export value has been increasing steadily. Uthungulu district contributed to provincial cabbage exports only in 2005. During 2012, Ethekwini cabbage export value dropped significantly when compared to 2011 export value. In the same year Sisonke contributed significantly for the first time to cabbage export value recorded for Kwazulu Natal province. During 2013, Kwazulu Natal cabbage exports were from Ethekwini and the export value for this municipality has dropped by 95.8% when compared to 2012 export value.
Source: Quantec Easydata
2004 2005 2006 2007 2008 2009 2010 2011 2012 2013
Uthungulu 0 9159 0 0 0 0 0 0 0 0
Ethekwini 6241 544142 55597 1005438 20635 103928 251335 481834 1919268 79714
Sisonke 0 0 0 0 0 0 0 0 21187 0
0
500000
1000000
1500000
2000000
2500000 V
alu
e (R
and
)
Years
Figure 11: Value of cabbage exports by Kwazulu Natal Province
2004 2005 2006 2007 2008 2009 2010 2011 2012 2013
Sedibeng 0 0 138 0 0 0 46 0 0 32582
West Rand 0 0 0 0 0 0 26582 13115 177701 755502
Ekurhuleni 12105 46449 24353 247837 354753 0 164868 111009 102356 184288
City of Johannesburg 3097584 4867568 2679163 3242233 3003734 2467959 1277842 1753683 920918 335449
City of Tshwane 0 0 1686 61557 7688 4288 56563 35810 54636 47434
0
1000000
2000000
3000000
4000000
5000000
6000000
Val
ue
(Ran
d)
Years
Figure 12: Value of cabbage export from Gauteng Province
13
As can be seen from Figure 12 above, cabbage exports from Gauteng province were from the City of Johannesburg municipality. Ekurhuleni, City of Tshwane, and West Rand have contributed to a lesser extent. The high export values were recorded in 2005 for the City of Johannesburg. From 2008 to 2010, exports value for the City of Johannesburg municipality has been declining and in 2011, the export value has gone up. Sedibeng cabbage export values were insignificant. During 2012, West Rand and the City of Tshwane cabbage export values have significantly improved while the values for Ekurhuleni and City of Johannesburg have dropped. In 2013, West Rand has contributed significantly to Gauteng cabbage exports, and Sedibeng has recorded a notable export share for the first time in a ten year period. In the same year, Ekurhuleni export value has notably increased while export values for the City of Johannesburg and City of Tshwane have decreased.
Source: Quantec Easydata
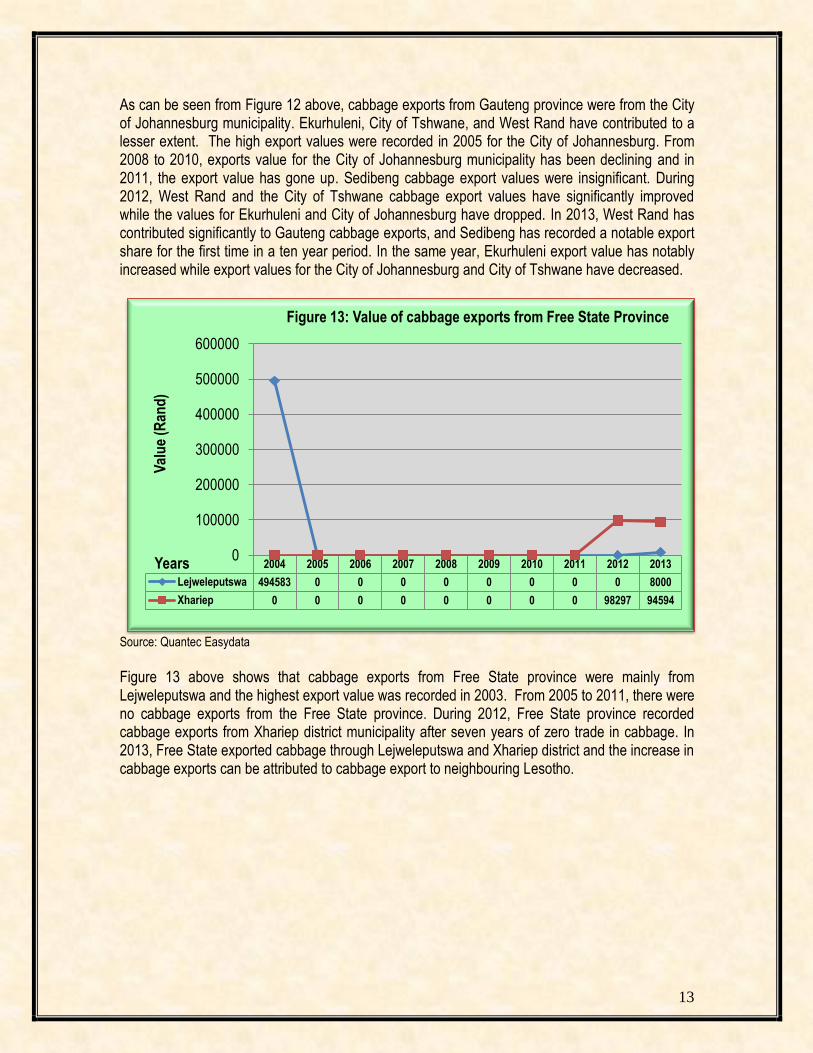
Figure 13 above shows that cabbage exports from Free State province were mainly from Lejweleputswa and the highest export value was recorded in 2003. From 2005 to 2011, there were no cabbage exports from the Free State province. During 2012, Free State province recorded cabbage exports from Xhariep district municipality after seven years of zero trade in cabbage. In 2013, Free State exported cabbage through Lejweleputswa and Xhariep district and the increase in cabbage exports can be attributed to cabbage export to neighbouring Lesotho.
2004 2005 2006 2007 2008 2009 2010 2011 2012 2013
Lejweleputswa 494583 0 0 0 0 0 0 0 0 8000
Xhariep 0 0 0 0 0 0 0 0 98297 94594
0
100000
200000
300000
400000
500000
600000
Val
ue
(Ran
d)
Years
Figure 13: Value of cabbage exports from Free State Province

14
Source: Quantec Easydata
Figure 14 above, shows that the cabbage exports from Mpumalanga province was from Ehlanzeni (2006, 2011 and 2012) and Nkangala (2006) municipalities. The highest cabbage export value was recorded in 2006 from Ehlanzeni. From 2007 to 2010, there were no cabbage exports from Mpumalanga province. During 2012, the cabbage export value for Ehlanzeni has dropped significantly when compared to 2011 export value. In 2013, Mpumalanga cabbage exports were from Ehlanzeni and the export value has double when compared to the previous year export.
Source: Quantec Easydata
2004 2005 2006 2007 2008 2009 2010 2011 2012 2013
Nkangala 0 0 2143 0 0 0 0 0 0 0
Ehlanzeni 0 0 154029 0 0 0 0 102632 61451 128902
0
20000
40000
60000
80000
100000
120000
140000
160000
180000
Val
ue
(Ran
d)
Years
Figure 14: Value of cabbage exports by Mpumalanga Province
2004 2005 2006 2007 2008 2009 2010 2011 2012 2013
Bojanala 0 0 0 0 0 0 388 0 0 0
Southern Distric 0 0 0 0 0 0 0 24664 19713 25540
0
5000
10000
15000
20000
25000
30000
Val
ue
(Ran
ds)
Years
Figure 15: Value of cabbage exports by North West Province

15
Figure 15 above illustrates that North West province recorded its first cabbage export value in 2010 and the value was insignificant. During 2011, the cabbage exports were from Southern district and the value was notably higher when compared to zero trade in the previous years. In 2012, export value dropped by 20% when compared to 2011 export value. During 2013, North West cabbage export was still from Southern district and the value has gone up by 29.6% and this can be ascribed to an increase cabbage export to neigbouring Botswana.
Source: Quantec Easydata
Figure 16 above illustrates that cabbage export started in 2010 and the province has recorded exports from Vhembe, Capricorn and Waterberg. In 2011, notable export value was recorded for Vhembe district and during 2012 the value has significantly dropped. In 2013, Limpopo province exported cabbage from Waterberg district but the value was insignificant.
2.3 Share Analysis
Table 3 illustrates the provincial share towards national cabbage exports. Western Cape and Gauteng have commanded the greatest share of provincial cabbage export. Free State province has commanded high percentage in 2003. In 2011, Western Cape province commanded 24.08% and Gauteng 58.28% share of South Africa cabbage exports. The KwaZulu Natal province has gained export share, compared to 2010, which was 7.83%. In 2011, Mpumalanga province commanded a 2.94% share. This is an improvement as the province had 0% share for most of the years except for 2006. During 2012, Kwazulu Natal was a leading province in cabbage export with 45.17% share, followed by Gauteng with 29.22% and Western Cape with 21.39%. Free State province commanded a 2.29% share during 2012 and in 2013 the share has gone up to 3.22%. During 2013, Western Cape and Gauteng notably increased their cabbage export shares to 46.78% and 42.53% respectively. In the same year, Kwazulu Natal export share has dropped from 45.17% to 2.50%. The high export share in the Western Cape and Gauteng can be attributed to registered exporters and exports exit points based in these provinces.
2004 2005 2006 2007 2008 2009 2010 2011 2012 2013
Vhembe 0 0 0 0 0 0 423 5708 1854 0
Capricorn 0 0 0 0 0 0 85 0 13 0
Waterberg 0 0 0 0 0 0 1580 61 4 395
0
1000
2000
3000
4000
5000
6000
Val
ue
( R
and
s)
Years
Figure 16: Value of cabbage exports by Limpopo Province

16
Table 3: Share of provincial cabbage exports to the RSA cabbage exports (%) Year Provinces
2004 2005 2006 2007 2008 2009 2010 2011 2012 2013
Western Cape 12.84 8.27 24.32 15.93 39.01 42.83 44.64 24.08 21.39 46.78
Free State 11.94 0 0 0 0 0 0 0 2.29 3.22
Kwazulu-Natal 0.15 9.28 1.44 18.55 0.37 2.31 7.83 13.82 45.17 2.50
North West 0 0 0 0 0 0 0.01 0.71 0.46 0.80
Gauteng 75.07 82.44 70.19 65.52 60.61 54.86 47.52 58.28 29.22 42.53
Mpumalanga 0 0 4.05 0 0 0 0 2.94 1.43 4.04
Limpopo 0 0 0 0 0 0 0 0.17 0.04 0.01
South Africa 100 100 100 100 100 100 100 100 100 100 Source: Calculated from Quantec Easydata
Table 4: Share of district cabbage exports to the total Western Cape provincial cabbage exports (%) Year District
2004 2005 2006 2007 2008 2009 2010 2011 2012 2013
City of Cape Town 100 100 100 100 100 99.63 99.40 96.13 99.61 99.78
West Coast 0 0 0 0 0 0 0.13 0 0 0.13
Overberg 0 0 0 0 0 0 0 0 0 0
Eden 0 0 0 0 0 0.37 0.47 2.68 0 0
Cape Winelands 0 0 0 0 0 0 0 1.19 0.39 0.09
Western Cape 100 100 100 100 100 100 100 100 100 100 Source: Calculated from Quantec Easydata
Table 4 above indicates that the City of Cape Town commanded the greatest share of cabbage exports from Western Cape province during the period under review. Other municipalities export shares were all insignificant. Cape Town Harbour renders the exit point of cabbage exports. In 2011, Cape Winelands contributed to cabbage exports for the first time in a ten year period. During 2012, City of Cape Town continued to lead in Western Cape cabbage exports and it has commanded 99.61% share. In 2013, City of Cape Town increased its export share from 99.61% to 99.78%, West Coast and Cape Winelands export shares were insignificant. Table 5: Share of district cabbage exports to Kwazulu Natal provincial cabbage exports (%) Years District
2004 2005 2006 2007 2008 2009 2010 2011 2012 2013
Uthungulu 0 1.66 0 0 0 0 0 0 0 0
Ethekwini 100 98.34 100 100 100 100 100 100 98.91 100
Sisonke 0 0 0 0 0 0 0 0 1.09 0
Kwazulu Natal 100 100 100 100 100 100 100 100 100 100 Source: Calculated from Quantec Easydata
Table 5 above, shows that in 2004, 2006 to 2011, Ethekwini has commanded 100% share of cabbage exports from Kwazulu Natal the province. In 2005, Uthungula commanded a 1.66% share of cabbage export from Kwazulu Natal. During 2012, continued to lead in the Kwazulu Natal cabbage export and it has commanded 98.91% share of cabbage exports. In 2013, Ethekwini commanded a 100% share of cabbage export from the Kwazulu Natal province. The greatest share by Ethekwini can be attributed to Durban harbour which renders exports exit point.

17
Table 6: Share of district cabbage exports to the Gauteng provincial cabbage exports (%) Year District
2004 2005 2006 2007 2008 2009 2010 2011 2012 2013
Sedibeng 0 0 0 0 0 0 0 0 0 2.40
West Rand 0 0 0 0 0 0 1.74 6.45 14.15 55.75
Ekurhuleni 0.39 0.95 0.90 6.98 10.54 0 10.80 5.46 8.15 13.60
City of Johannesburg 99.61 99.05 99.04 91.29 89.23 99.83 83.74 86.32 73.34 24.75
City of Tshwane 0 0 0.06 1.73 0.23 0.17 3.71 1.65 4.35 3.50
Gauteng 100 100 100 100 100 100 100 100 100 100
Source: Calculated from Quantec Easydata
Table 6 above, illustrates that the City of Johannesburg commanded the greatest share of cabbage exports by Gauteng province. In 2010, City of Johannesburg cabbage export share has declined; these can be attributed to increase in export share for Ekurhuleni and City of Tshwane. In 2011, West Rand and City of Johannesburg have increased their export share. During 2012, the export share of the City of Johannesburg has dropped by 12.98%. At the same period City of Tshwane, West Rand and Ekurhuleni cabbage export shares have notably increased. In 2013, West Rand was a lead municipality in cabbage export from Gauteng and it has commanded 55.75% share. In the same year Sedibeng has contributed to Gauteng cabbage export share for the first time in a ten year period, while the City of Johannesburg export share has dropped from 73.34% to 24.75%. OR Tambo International Airport renders the exit point of cabbages exports from Gauteng province. Table 7: Share of district cabbage exports to the Free State provincial cabbage exports (%) Year District
2004 2005 2006 2007 2008 2009 2010 2011 2012 2013
Lejweleputswa 100 0 0 0 0 0 0 0 0 7.80
Xhariep 0 0 0 0 0 0 0 0 100 92.20
Free State 100 0 0 0 0 0 0 0 100 100
Source: Calculated from Quantec Easydata
Table 7 above, indicates that Lejweleputswa commanded a 100% share of cabbage exports from the Free State province in 2004. From 2005 to 2011, Free State province has recorded a zero trade for cabbage. In 2012, Xhariep commanded a 100% share of cabbage exports from Free State province. During 2013, Xhariep commanded 92.20% and Lejweleputswa has commanded 7.80% share of cabbage exports from Free State province. Table 8: Share of district cabbage exports to Mpumalanga provincial cabbage exports (%) Year District
2004 2005 2006 2007 2008 2009 2010 2011 2012 2013
Nkangala 0 0 1.37 0 0 0 0 0 0 0
Ehlanzeni 0 0 98.63 0 0 0 0 100 100 100
Mpumalanga 0 0 100 0 0 0 0 100 100 100
Source: Calculated from Quantec Easy data

18
Table 8, illustrates that, Ehlanzeni commanded the greatest share of cabbage export from Mpumalanga Province. From 2007 to 2010 the province has a recorded zero trade for cabbage. During 2006, Nkangala contributed insignificantly to Mpumalanga cabbage export share. From 2011 and 2013, Ehlanzeni has commanded 100% share of cabbage exports from Mpumalanga province. Table 9: Share of district cabbage exports to the North West provincial cabbage exports (%)
Year District
2004 2005 2006 2007 2008 2009 2010 2011 2012 2013
Bojanala 0 0 0 0 0 0 100 0 0 0
Southern District 0 0 0 0 0 0 0 100 100 100
North West 0 0 0 0 0 0 100 100 100 100 Source: Calculated from Quantec Easy data
Table 9 above shows that from 2004 to 2009, North West has recorded zero trade for cabbage. In 2010, Bojanala commanded a 100% share of cabbage export from North West. From 2011 to 2013, Southern district commanded a 100% share of cabbage exports. Table 10: Share of district cabbage exports to the Limpopo provincial cabbage exports (%)
Year District
2004 2005 2006 2007 2008 2009 2010 2011 2012 2013
Vhembe 0 0 0 0 0 0 20.26 98.94 99.09 0
Capricorn 0 0 0 0 0 0 4.07 0 0.69 0
Waterberg 0 0 0 0 0 0 75.67 1.06 0.21 100
Limpopo 0 0 0 0 0 0 100 100 100 100 Source: Calculated from Quantec Easy data
Table 10 illustrates that, from 2004 to 2009, Limpopo province has recorded a zero trade for cabbage. In 2010 Waterberg commanded the greatest share of 75.67% and Vhembe has commanded 20.26% share of Limpopo cabbage export. In 2011 and 2012, Vhembe commanded the greatest share of cabbage exports. During 2013, Waterberg has commanded 100% share of cabbage exports from Limpopo.
2.4 South African Cabbage Imports
South Africa is not a major cabbage importer and its cabbage imports represent 0% of the world imports. During 2013, South Africa’s imports were ranked 111 in world imports. In 2013, South Africa has decreased its cabbage imports as in 2012, it was ranked 99 in world cabbage imports. South Africa is self sufficient in terms of cabbage production, hence the low cabbage import except in 2005 and 2012. United States of America, Canada, Germany, Japan, Russian Federation, Hong Kong and Netherlands were top countries importing cabbage during 2013.

19
Source: Quantec Easydata
Figure 17 above shows that cabbage imports were relatively unstable for the past 10 years and the significant imports were in 2005 and 2012. The increase in imports during 2005 can be attributed to the slight decrease in production of cabbage in the same year and it was also cheap to import since higher volumes were imported at a lower value. It was expensive to import cabbage except in 2004 and 2005 since less volume was imported at higher values. In 2010 cabbage imports increased significantly despite an 8.9% increase in domestic production volumes. In 2011, cabbage exports decreased by 61.5%, which can be attributed to increase in domestic production output, it was also expensive to import cabbage. During 2012, South Africa cabbage imports were incomparably higher when compared to the 2011 imports. The increase in imports can be attributed to an 8.4% drop in domestic cabbage output in the same year. South Africa’s cabbage imports dropped by 61.6% during 2013 and this can be attributed to 2.3% increase in domestic cabbage output. In the same year, it was more expensive to import cabbage when compared to the other years. Figure 18 below illustrates the South Africa cabbage imports from the regions. From 2004 to 2006, South Africa imported high quantities of cabbage from African countries (Zimbabwe and Zambia). South Africa also imported considerable volumes of cabbage from Asia (Sri Lanka, China and Lebanon). South Africa’s cabbage imports from Oceania region were only in 2003. In 2010, South Africa imported considerable amount of cabbages from European region (France and United Kingdom) after six years of not importing from that region. In 2011, cabbage imports were sourced from Africa (Zimbabwe) and Asia (Lebanon).In 2012, South Africa imported cabbages only from the African region (Kenya and Ghana). During 2013, African region (Kenya and Swaziland) remained the main source of cabbage imports by South Africa, and imports from Asia (Lebanon) were less significant.
0
100000
200000
300000
400000
500000
600000
700000
800000
0
5
10
15
20
25
30
35
Val
ue
(Ran
d)
Vo
lum
e (T
on
s)
Years
Figure 17: Cabbage imports by South Africa
Volume (Tons) Value (Rand)

20
Source: Quantec Easydata
Figure 19 is the illustration of value of South Africa’s cabbage exports from the regions.
Source: Calculated from Quantec Easy data
Figure 19 above shows the value of South Africa cabbage imports by the regions. It was expensive to import cabbage from Europe, as high value was recorded for low cabbage volumes. In 2005, it was cheaper to import cabbage from African countries as low import value was recorded for high cabbage volumes. In 2011, it was expensive to import cabbage from the Asian region. In 2012, it was more expensive to import cabbage from the African region as more value was recorded for value imported. During 2013, cabbage imports from Asia were more expensive than imports sourced from African region.
2004 2005 2006 2007 2008 2009 2010 2011 2012 2013
Africa 13903 32596 11877 9 998 0 4421 1102 22739 8741
Asia 88 34 0 330 1280 108 274 800 0 270
Europe 0 0 0 0 0 0 254 0 0 6
0
5000
10000
15000
20000
25000
30000
35000 V
olu
me
(Kg
)
Years
Figure 18 : South Africa cabbage imports from the regions
2004 2005 2006 2007 2008 2009 2010 2011 2012 2013
Africa 18558 8840 21919 5 1466 0 4696 8629 667265 356518
Asia 308 107 0 522 5964 815 3330 16705 0 13779
Europe 0 0 0 0 0 0 12854 0 0 496
0
100000
200000
300000
400000
500000
600000
700000
800000
Val
ue
(Ran
d)
Years
Figure 19: Value of South Africa imports from the regions

21
2.5 Processing
Fresh cut cabbage is used raw in salads such as coleslaw and as cooked vegetable (added to soups or stews). Cabbage is also dehydrated (dried, flaked or powder) for use as a flavoring agent in soups and as an ingredient in other dehydrated foods. Cabbage leaves are used to treat acute inflammation. A paste of raw cabbage may be placed in a cabbage leaf and wrapped around the affected area to reduce discomfort. Cabbage can also be canned, pickled, frozen and cabbage juice can be extracted to make ink. In 2007 and 2010 there has been a considerable increase in volumes that were canned. In 2011, there was a 13% drop in cabbage canning activities. During 2012, canning activities dropped further by 2.9%, when compared to the 2011 canning activities. In 2004, there was no cabbage freezing activities recorded. During 2012, the volumes that were frozen were incomparably higher when compared to 2011 volumes. There were no cabbage dehydration activities from 2010 to 2013 production year. In 2012, there was a 9.2% increase in cabbage volumes that were processed when compared to 2011 production year. In 2013, canning activities has gone up by 32.5%, freezing activities has decreased by 91.93% and total processing volumes have gone up by 16.9%. Volumes of cabbages processed during the past ten years are presented in Table 8. Table 8: Processed cabbages
Year
Canning Freezing Dehydration Total processing
Volume
(Tons)
Value
( Rand)
Volume
(Rand)
Value
(Rand)
Volume
( Tons)
Value
(Rand)
Volume
( Tons)
Value
( Rand)
2004 934.5 R 1,168,618 0 R 0 404.9 R 109,330 1339.4 R 1,277,947
2005 928.1 R 1,284,425 105.6 R 52,428 35 R 10,158 1068.7 R 1,347,010
2006 993.8 R 1,361,082 112.5 R 60,420 345.9 R 103,791 1452.2 R 1,525,294
2007 1333 R2,120,016 186 R117,952 839 R259 928 2357 R2,497,896
2008 1116 R1,503,537 182 R140,688 269 R85,759 1566 R1,729,984
2009 879 R1,862,705 50 R76,040 50 R27,500 976 R1,966,244
2010 1029 R2,076,322 15 R28,047 0 0 1044 R2,104,369
2011 895 R2,170,826 14 R37,661 0 0 909 R2,208,487
2012 869 R2,146,514 124 R199,528 0 0 993 R2,346,042
2013 1152 R2,771,343 10 R27,544 0 0 1161 R2,798,887
Source: Statistics and Economic Analysis, DAFF
The cabbage value chain tree explaining its various uses is illustrated in Figure 20 while the market value chain for cabbage is presented in Figure 21.

22
Figure 20: Cabbage value chain tree explaining its uses
Fresh cabbage
Freezing
Canning Dehydration
Juice
Soup
Flaked
Cabbage Atchaar
Cabbage salads Ink
Prickled
cabbage

23
Figure 21: Market value chain for cabbage
The cabbage value chain can be broken down into the following levels: the producers of cabbage (farmers); pack house owners (cleans, grade and quality control); cold storage and transport facilities (store and transport cabbage on behalf of farmers); traders in cabbage (market and sell cabbages); processors (add value to cabbage and process cabbage to other usable forms); and end users (consumers).
Input suppliers Farmers/Producers
Harvesting
Handling/Cooling
Quality grade standards and packaging
Imports
Storage and distribution
Exporters
Fresh produce markets, Wholesalers, Supermarkets, Retailers and informal markets
Processors: Dehydration, Freezing and juice extraction
Consumers

24
3. MARKET INTELLIGENCE
3.1 Tariffs
Tariffs applied by the various markets to cabbages originating from South Africa during 2012 and 2013 are presented in Table 9. Table 9: Tariffs applied by various exports markets to cabbage originating from South Africa.
Country Product description (H07490) Trade regime description
Applied tariff
Estimated total ad valorem equivalent tariff Applied tariff
Estimated total ad valorem equivalent tariff
2012 2013
Angola Cabbage fresh or chilled MFN duties (Applied) 15.00% 15.00% 50.00% 50.00%
China Cabbage fresh or chilled MFN duties (Applied) 13.00% 13.00% 13.00% 13.00%
Congo Cabbage fresh or chilled MNF duties (Applied) 30.00% 30.00% 30.00% 30.00%
Botswana Cabbage fresh or chilled Intra SACU rate 0.00% 0.00% 0.00% 0.00%
Canada White or red cabbage fresh or chilled
Preferential tariff for GSP countries 5.00% 5.00% 5.00% 5.00%
Germany White or red cabbage fresh or chilled
Preferential tariff for South Africa 0.00% 0.00% 0.00% 0.00%
Hong Kong Cabbage fresh or chilled MFN duties (Applied) 0.00% 0.00% 0.00% 0.00%
Japan Cabbage fresh or chilled MNF duties (Applied) 3.00% 3.00% 3.00% 3.00%
Namibia Cabbage fresh or chilled Intra SACU rate 0.00% 0.00% 0.00% 0.00%
Mauritius Cabbage fresh or chilled MNF duties (Applied) 0.00% 0.00% 0.00% 0.00%
Lesotho Cabbage fresh or chilled Intra SACU rate 0.00% 0.00% 0.00% 0.00%
Mozambique White or red cabbage fresh or chilled
Preferential tariff for South Africa 15.00% 15.00% 15.00% 15.00%
Netherlands White or red cabbage fresh or chilled
Preferential tariff for South Africa 0.00% 0.00% 0.00% 0.00%

25
Country Product description (H07490) Trade regime description
Applied tariff
Estimated total ad valorem equivalent tariff Applied tariff
Estimated total ad valorem equivalent tariff
2012 2013
India Cabbage fresh or chilled MFN duties (Applied) 30.00% 30.00% 30.00% 30.00%
Russian Federation Cabbage fresh or chilled General tariff 15.00% 15.00% 15.00% 15.00%
Swaziland Cabbage and edible brassicas Intra SACU rate 0.00% 0.00% 0.00% 0.00%
Switzerland Cabbage fresh or chilled Preferential tariff for SACU members 0.00% 0.00% 0.00% 0.00%
United Kingdom
White or red cabbage fresh or chilled
Preferential tariff for South Africa 0.00% 0.00% 0.00% 0.00%
United States of America Cabbage fresh or chilled
Preferential tariff for GSP countries 0.00% 0.00% 0.00% 0.00%
Kenya White or red cabbage fresh or chilled
Preferential tariff for South Africa 0.00% 0.00% 25.00% 25.00%
Zimbabwe Cabbage fresh or chilled MFN duties (Applied) 40.00% 40.00% 40.00% 40.00% Source: Market Access Map
During 2013, South Africa has diversified 89.2% of its cabbage exports to Lesotho, Botswana, Swaziland and Namibia. These countries apply 0% Intra SACU rate to cabbage export originating from South Africa. South Africa also exported to Mozambique, and Angola and these countries apply 15% and 50% tariff respectively, in spite of the existence of the SADC-FTA. The lucrative export markets for cabbage from South Africa exist in Mauritius, Russian Federation and Hong Kong since these countries apply zero tariffs to cabbage exports originating from South Africa. In European markets (United Kingdom, Germany and Netherlands) preferential tariff of 0.00% is applied to cabbage exports originating from South Africa due to EU-SA Free Trade Agreement (FTA). Kenya is the second top cabbage producer in Africa and its domestic production is protected by 25% tariff. China and India are the top countries producing cabbage in the world and their domestic producers are protected by 13% and 30% tariff.

26
3.2 Non tariff barriers
3.2.1 The European Union Non-tariff barriers can be divided into those that are mandatory and laid out in the EU Commission’s legislature, and those that are as a result of consumers, retailers, importers and other distributions’ preferences. 3.2.2 Product legislation: quality and marketing There are a number of pieces of EU legislation that govern the quality of produce that may be imported, marketed and sold within the EU. General Food Law covers matters in procedures of food safety and hygiene (micro-biological and chemical), including provisions on the traceability of food (for example, Hazard Analysis and Critical Control Points, of HACCP). EU Marketing Standards, which govern the quality and labeling of vegetables, are laid out in the CAP framework under regulation EC 2200/96. These regulations include diameter, weight and class specifications, and any produce that does not comply with these standards are not allowed to be sold on the EU markets (detailed lists of products and their standards can be found in the annexes to the directive). The legislation (under EU 1148/2001) also dictates that a Certificate of Conformity must be obtained by anyone wishing to export and sell vegetables in the EU, if that particular vegetable falls under the jurisdiction on the EU marketing standards, Vegetables to be used in further processing needs a Certificate of Industrial Use, whilst another legislative directive covers the Maximum Residue Limits (MRL) of various pesticides allowed. 3.2.3 Product legislation: phytosanitary regulations The international standard for phytosanitary measures was set up by the International Plant Protection Committee (IPPC) to protect against the spreading of diseases or insects through the importation of certain agricultural goods. The EU has its own particular rules formalized under EC 2002/89, which attempts to prevent contact of EU crops with harmful organisms from elsewhere in the world. The crux of the directive is that it authorizes the Plant Protection Services to inspect a large number of vegetable products upon arrival in the EU. This inspection consists of a physical examination of a consignment deemed to have a level of phytosanitary risk, identification of any harmful organisms and certification of the validity of any phytosanitary certificate covering the consignment. If the consignment does not comply with the requirements, it may not enter the EU, although certain organisms can be fumigated at the expense of the exporter.
27
3.2.4 Product legislation: packaging The EU commission lays downs rules for materials that come into contact with food and which may endanger people’s health or bring about an unacceptable change in the composition of the foodstuffs. The framework legislation for this EC 1935/2004. Recycling packaging materials are also emphasized under 94/62/EC, whereby member states are required to recycle between 50% and 65% of packaging waste. If exporters do not ship produce in packaging which is reusable, they may be liable for the costs incurred by the importing companies. Wood packaging is subject to phytosanitary controls (see Directive EC 2002/89) and may need to undergo heat treatment, fumigation, etc. 3.2.5 Non-legal market requirements: social and environmental accountability To access a market, importers must not only comply with the legal requirements set out above, but also with market requirement s and demands. For the most part, these revolve around quality and the perceptions of European consumers about the environmental, social, health and safety aspects of both the products and the production techniques. Whilst supplying vegetables that complies with these issues may not be mandatory in the legal sense, they are becoming increasingly important in Europe and cannot be ignored by existing or potential exporters. (i) Social responsibility is becoming important in the industry, not only amongst consumers, but also for retail outlets and wholesalers. The Social Accountability 8000 (SA8000) certification is a management system based on International Labour Organization (ILO) conventions, and deals with issues such as a child labour, health and safety, and freedom of association, and requires an on-site audit to be performed annually. The certificate is seen as necessary for accessing any European market successfully. The major retailers in the EU also play an important role in tackling environmental issues, which means that exporters have to take these into account when negotiating exporting arrangements. (ii) Environmental issues are becoming increasingly important with European consumers. Consumer movements are lobbying against purchasing non-environmental friendly or non-sustainable produce. To this end, both governments and private partners have created standards (such as ISO 14001 and EUREPGAP) and labels to ensure produce adhere to particular specifications. Labels are an absolute must for exporters attempting to enter the rapidly expanding organic produce market. The EU Commission has recently adopted and EU label for identifying food produced according to EU organic standards in the directive EEC 209/91 3.2.6 Consumer health and safety requirements Increasing consumer conscience about health and safety issues has prompted a number of safety initiatives in Europe, such as EUREPGAP on good agricultural practices (GAP) by the main European retailers, the international management system of HACCP, which is independently certified and required by legislation for European producers as well as food imported into Europe (EC 852/2004), and the ISO 9000 management standards system (for procedures and working methods), which is certified by the International Standards Organization (ISO).

28
3.3 The United States
The USDA has quality standards for vegetables that provide a basis for domestic and international trade and promote efficiency in marketing and procurement. At the same time the USDA issues quality certificates based on these standards and a comprehensive grading system. Graders are located around the country at terminal markets. These certification services, which facilitate the ordering and purchasing of products by large-volume buyers, assure these buyers that the product they purchase will meet the terms of the contract in terms of quality, processing, size, packaging and delivery.
3.4 Asian Market Access
Japan’s agricultural sector is heavily protected, with calculations from the Organization for Economic Co-operation and Development (OECD) estimating that almost 60% of the value of Japan’s farm production comes from trade barriers or domestic subsidies. Japan uses tariff rate quotas (TRQ) to protect its most sensitive products, and reserves the right for trading many of these products (within the quota) for one or two state trading enterprises. However, these extremely protective measures apply only to some products; others are able to compete more effectively with outside competition, often on the grounds of higher quality. Perhaps the biggest barrier to trade with Japan in vegetable markets is its strict phytosanitary requirements, which have often been challenged in the WTO as having little or no scientific justification. Other measures that are being challenged include Japan’s use of fumigation on agricultural products when cosmopolitan pests (already found in Japan) are detected. Japan is also increasing its labeling requirements.
4. GENERAL DISTRIBUTION CHANNELS
There are roughly three distinct sales channels for exporting vegetables. One can sell directly to an importer with or without the assistance of an agent (usually larger, more established commercial farms/orchards). One can supply a vegetable combine, which will then contract out importers/marketers and try to take advantage of economies of scale and increased bargaining power. At the same time vegetable combines might also supply large retail chains. One can also be a member of a private or co-operate export organization (including marketing boards) which will find agents or importers and market the produce collectively. Similar to a vegetable combine, an export organization can either supply wholesale markets or retail chains depending on particular circumstances. Export organizations and marketing boards will wash, sort and package the produce.

29
5. LOGISTICAL ISSUES
5.1 Mode of transport
The transportation of vegetables falls within two categories – ocean cargo and air cargo – with ocean cargo taking much longer to reach the desired location but costing considerably less. Of course, the choice of transportation method depends, for the most part, on the fragility of the produce and how long it can remain relatively fresh. With the advent of technology and container improvements, the feasibility, cost and attractiveness of sea transportation have improved considerably. As more developing countries begin to export and supply major developed countries markets, so the number and regularity of maritime routes, and the container vessels travelling these routes, increase. Presently South American countries like Peru benefit from the asparagus trade, which has lead to some level of economies of scale with other vegetable products, and this has enabled cheaper transport prices for their other vegetable varieties. Such economic of scale could benefit SADC countries if more producers became exporters and took advantage of the various ports which have special capabilities in handling vegetable produce (for example, the proposed terminal in Maputo).
5.2 Cold chain management
Cold chain management is crucial when handling perishable products, from the initial packing houses to the refrigerated container trucks that transport the produce to the shipping terminals, through to the storage facilities at these terminals (and their pre-cooling capability), onto the actual shipping vessels and their containers, and finally on to the importers and distributors that must clear the produce and transport it to the markets/retail outlets, etc. For every 10oC increase above the recommended temperature, the rate of respiration and ripening of produce can increase twice or even thrice. Related to this are the increasingly important traceability standards, which require an efficiently controlled supply chain and internationally accepted business standards.
5.3 Packaging
Packaging also plays a vital role in ensuring safe and efficient transport of a product and conforming to handling requirements, uniformity, recyclable materials specifications, phytosanitary requirements, proper storage needs and even attractiveness (for marketing purposes).

30
6. COMPETITIVENESS OF SOUTH AFRICAN CABBAGE EXPORTS
Figure 22 below, shows that South Africa cabbage exports are growing faster than the world imports into Gabon, Zambia and Malawi. South Africa’s performance in these countries is regarded as gains in the dynamic market. South Africa cabbage exports to Mozambique, Mauritius, Mayotte and Angola are growing slower than the world imports to these countries. South Africa performance in these countries is regarded as loss in the dynamic markets. South Africa’s cabbage exports are declining faster than the world imports into France, United Kingdom, Democratic Republic of Congo, Switzerland, and Congo. South Africa’s exports are growing while the world imports are declining into Zimbabwe and Seychelles. South Africa has gained market share in these declining market. Figure 23 below, shows that Lesotho and Botswana were major markets for cabbage export originating from South Africa during 2013. These countries together, they have commanded 77.64% of South Africa cabbage exports. Prospective exports markets for cabbage from South Africa are mainly in Angola but, it have increased its tariff to 50%. Other smaller markets exist in Democratic Republic of Congo, Mauritius and Mayotte. However, if South Africa is to diversify its cabbage exports, the most lucrative markets exist in Mozambique as it has increased its cabbage imports from the world by 53% between 2009 and 2013 period. Congo cabbage imports have risen by 30%, and Mayotte imports have risen by 15%. Cabbage imports from the world to Zimbabwe and Seychelles have declined between 2009 and 2013 and as a result, these countries have recorded a negative growth rate. South Africa cabbage exports which, were left on ship store and bunker has declined by 15% between 2009 and 2013.

31
Figure 22: Growth in demand for cabbages exported by South Africa in 2013
Source: ITC Trade Map

32
Figure 23: Prospects for market diversification for cabbages exported by South Africa in 2013
Source: ITC Trade Map

33
7. CHALLENGES
Cabbage is a difficult crop to grow because it is susceptible to many insects, diseases and pest. Ensuring a quality pack can be a problem for hand harvesters. Cabbage has to be harvested only at optimum maturity to meet potential buyer’s quality standards. The amount of profit made from cabbage crop depends on how well it meets market specifications. Cabbage crop quality is frequently measured using physical and sensory criteria. Rising consumer concerns about food safety have come to impact the assessment of cabbage crop quality.
8. ACKNOWLEDGEMENTS
The following organizations are to be acknowledged National Department of Agriculture, Forestry and Fisheries Directorate: Statistics and Economic Analysis Private Bag X246 Pretoria 0001 Tel (012) 930 1134 Fax (012) 319 8031 Trade and Industrial Policy Strategies (TIPS) P.O. Box 11214 Hatfield 0028 Tel (012) 431 7900 Fax (012) 431 7910 Quantec Easy Data www. easydata.co.za Market Access Map www.macmap.org www.trademap.org Disclaimer: this document and its contents have been compiled by the Department of Agriculture, Forestry and Fisheries for the purpose of detailing the cabbage industry. Anyone who uses this information does so at his/her own risk. The views expressed in this document are those of the Department of Agriculture, Forestry and Fisheries with regard to the agricultural industry, unless otherwise stated. The Department of Agriculture, Forestry and Fisheries accepts no liability that can be incurred resulting from the use of this information