cadmus group report - solacity inc. | ottawa solar power
TRANSCRIPT

Status Report on Small Wind Energy Projects Supported by the Massachusetts Renewable Energy Trust
Prepared by: Shawn Shaw Alyssa Rosen David Beavers Dave Korn
November 10, 2008
Executive Summary This report analyzes the energy output of 21 small wind turbines installed in Massachusetts, with funding from the Massachusetts Renewable Energy Trust (MRET), to determine whether these systems are, on average, meeting energy production estimates made prior to, or directly after, their installation. This report also identifies possible causes of lower‐than‐expected energy production and quantifies their impacts. Data collected and analyzed for this status report includes:
• Monthly energy production values for the 21 small wind energy systems • Interval wind speed data from 6 National Climactic Data Center weather stations • Wind speed and profile data from 19 meteorological towers throughout Massachusetts • Test data on small wind turbine power output and inverter efficiency
Key findings of this status report include:
• Based on data reported to MRET in grant applications and on monthly readings of revenue‐quality energy meters connected to each system, no installer or turbine model is meeting its energy‐production target.
• The 21 small wind energy systems examined in this report are producing approximately 29 percent of the energy that installers predicted they would in grant applications filed with MRET.
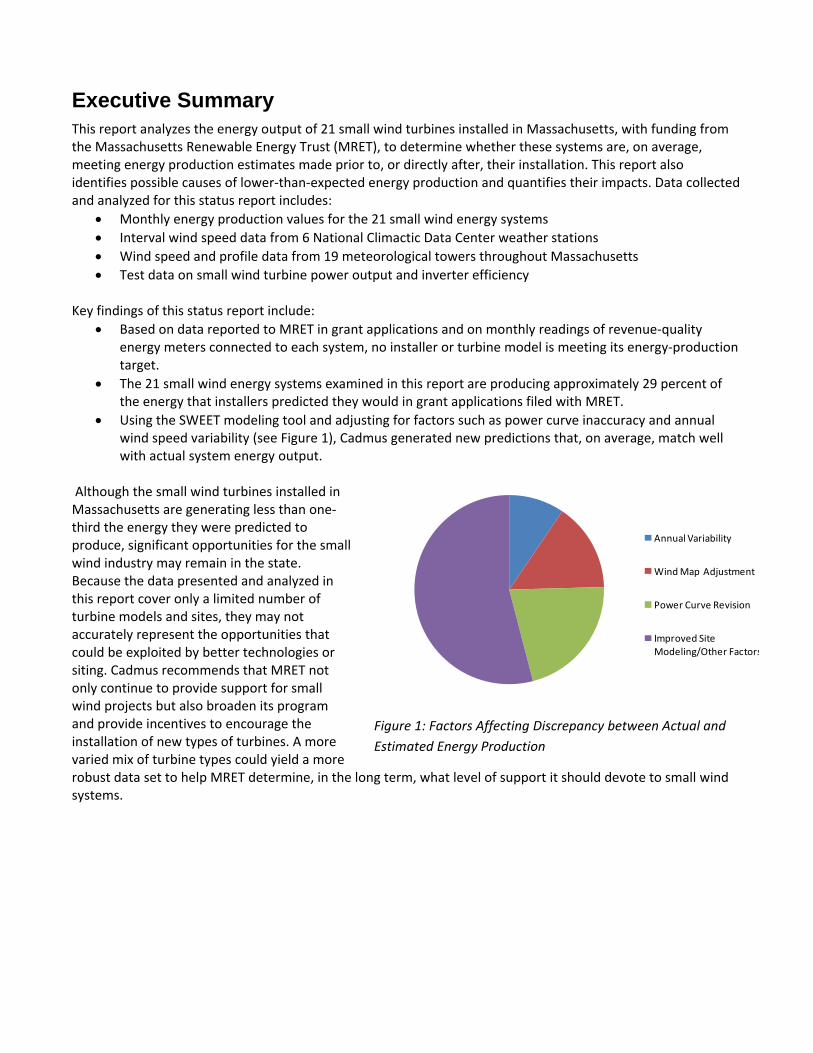
• Using the SWEET modeling tool and adjusting for factors such as power curve inaccuracy and annual wind speed variability (see Figure 1), Cadmus generated new predictions that, on average, match well with actual system energy output.
Although the small wind turbines installed in Massachusetts are generating less than one‐third the energy they were predicted to produce, significant opportunities for the small wind industry may remain in the state. Because the data presented and analyzed in this report cover only a limited number of turbine models and sites, they may not accurately represent the opportunities that could be exploited by better technologies or siting. Cadmus recommends that MRET not only continue to provide support for small wind projects but also broaden its program and provide incentives to encourage the installation of new types of turbines. A more varied mix of turbine types could yield a more robust data set to help MRET determine, in the long term, what level of support it should devote to small wind systems.
Annual Variability
Wind Map Adjustment
Power Curve Revision
Improved Site Modeling/Other Factors
Figure 1: Factors Affecting Discrepancy between Actual and Estimated Energy Production

Contents Executive Summary ................................................................................................................................................... 2
Contents .................................................................................................................................................................... 3
Acknowledgements ................................................................................................................................................... 1
Introduction............................................................................................................................................................... 2
Data, Methods, and Limitations ................................................................................................................................ 3
The SWEET Model ................................................................................................................................................. 5
Overview of Program Performance........................................................................................................................... 6
Performance of Medium‐to‐Large‐Scale Wind Energy Systems ........................................................................... 9
System Performance by Turbine Model................................................................................................................ 9
System Performance by Installer......................................................................................................................... 10
Analysis of System Performance Data..................................................................................................................... 11
Contributing Factor: Year‐to‐Year Variations in Wind Speed.............................................................................. 12
Contributing Factor: Accuracy of Wind Map Predictions.................................................................................... 13
Contributing Factor: Accuracy of Manufacturer Reported Power Curves .......................................................... 14
Contributing Factor: Additional Site/Equipment Losses and Model Improvements .......................................... 16
Feedback from Past/Current Programs and Verification Projects ...................................................................... 17
Summary of Factors Affecting System Energy Output Estimates ....................................................................... 17
Program Recommendations.................................................................................................................................... 21
Conclusions.............................................................................................................................................................. 22
Selected References ................................................................................................................................................ 23
Appendix A: System Level Descriptions................................................................................................................... 24

1
AcknowledgementsThe authors would like to thank those who, over the past several months, have reviewed and commented upon this document and associated data. In particular, the authors wish to thank Trudy Forsyth, and the rest of the small wind turbine testing team, at the National Wind Technology Center and Mick Sagrillo, at Wisconsin Focus on Energy, for their valuable insights and contributions to this work.

2
Introduction The Massachusetts Renewable Energy Trust (MRET), which administers the Renewable Energy Trust Fund, is a quasi‐public agency that provides funding to Massachusetts residents to install solar, wind, and other renewable energy technologies. Funding for the Renewable Energy Trust comes from small, incremental charges on customer electric bills. Small‐scale wind power, as discussed in this report, refers to wind turbines that have nameplate rated outputs of 10 kW or less, as reported by the manufacturer. These turbines generally have rotors up to 8 meters in diameter and stand atop towers ranging from 10 to 40 meters. Typical small wind system applications include residential and light commercial behind‐the‐meter load reduction/net metering. These systems are also very popular in the agricultural sector. Building‐integrated systems, in which, typically, a number of small turbines are mounted directly to the roof or outer structure of a building, are an emerging alternative to traditional small wind turbine installations, though this report primarily focuses on traditional free‐standing systems. Interest in small wind power has surged among Massachusetts residents, businesses, and municipalities over the past 2 years. The cause of this surge most likely relates to the growing interest in wind power nationwide and the growing controversy surrounding the Cape Wind project. This increased interest—and its corresponding purchases and installations—has also been partially fuelled by expectations of short payback periods and significant economic benefits. According to all of the most commonly used estimating methods, residential‐scale wind turbines, installed in the modest 4.5 to 5.5 m/s1 wind regimes common in some areas of Massachusetts, should be relatively cost‐effective, with simple paybacks falling within the life of the system. However, as discussed in this report, the 21 small wind systems in Massachusetts are falling far short of their predicted energy output targets, thereby decreasing their cost‐effectiveness. The primary purpose of this report is to quantify and investigate the potential cause(s) of this underperformance. This report takes an iterative approach to the issue of underperformance, beginning with wind speed variability over time and continuing on to explore wind map accuracy, site conditions, and wind turbine power curve specifications. When site‐specific data such as wind speeds are lacking, the report’s authors draw on secondary sources for appropriate adjustments to an energy production model used to predict the energy output of each system. As a contractor to the MRET, The Cadmus Group, Inc. was asked to investigate the status of the small wind systems installed under various MRET programs, particularly the Small Renewables Initiative (SRI). Cadmus provides a variety of technical support services to MRET, including the administration of the online Production Tracking System (PTS) which collects monthly energy production data from over 800 MRET grantees. In particular, for small wind, Cadmus has been assisting MRET through post‐installation inspections, resource development and outreach, data collection, and analysis. This status report focuses on the 21 small wind systems installed in Massachusetts. These systems represent a variety of site types, wind speeds, and turbine specifications. Methods used to collect and analyze the data related to these systems are discussed in the following section.
1 Throughout this document, unless noted otherwise, given wind speeds can be assumed to refer to wind speeds at 30m above effective ground level

3
Data, Methods, and Limitations This report discusses the energy production of the 21 small wind energy systems installed in Massachusetts using funds from the Renewable Energy Trust Fund. Ideally, each system would have its own data monitoring equipment to collect a suite of measurements, such as wind speed, energy output, temperature, and barometric pressure, for analysis. Unfortunately, system‐specific data generally are not available, so inferences must be made based on data from other sources. Table 1, below, identifies the sources from which data were drawn to complete this report and briefly discusses any pertinent issues or caveats related to using a particular source. Throughout this report, references are made to annual energy production (AEP) estimates. Some estimates were completed by installers, who employed various estimation methods, typically online tools available from the turbine manufacturer (e.g., WindCAD). These tools rely on various inputs and assumptions that vary from installer to installer, as each has a slightly different way of conducting site assessments and calculating AEP. Other estimates were completed by Cadmus using the Small Wind Energy Estimator Tool (SWEET). As of this writing, Cadmus is developing a new version of SWEET with a number of enhanced features and improved accuracy. Throughout this report SWEETv1.0, the original release of the tool, was used unless otherwise noted. Table 1: Data Sources and Qualitative Discussion of Potential Uncertainties Report Section Data Sources and Analysis Completed Comments Actual System Energy Production
Grantee‐reported energy production data, by month, is used throughout this report to derive annual energy production (AEP). For systems with more or less than 1 year of data, a weighting factor was applied to monthly production values to extrapolate to annual energy output. Error of closure on pre and post weighted production values was determined to be less than 10%.
Data entered monthly by grantee, based on readout of revenue quality energy meter. Some additional uncertainty was introduced as a result of the monthly weighting applied to some systems to derive annual energy production numbers. Also, the monthly resolution of the energy data makes direct diagnosis of system level performance challenging.
Year‐to‐Year Wind Speed Variation
Annual average wind speeds were calculated for the past 10 years at 6 National Climactic Data Center (NCDC) weather stations. The wind speed data over the past 12 months was compared with the long term average at each of these stations to identify potential regional trends in wind speed over time.
Data from additional weather stations could enhance the accuracy of this analysis. There are few stations with available data before 1998, however, making longer term averaging difficult. As with wind map accuracy, the year‐to‐year variability implicitly assumes that the variability at nearby small wind sites is similar to the variability at one, or more, of the 6 NCDC sites examined.
Wind Map Accuracy
Examination of 18 wind resource assessments completed by RERL for the Community Wind Collaborative and other projects. The reported average wind speed for each assessment was corrected to a long‐term average and compared to the wind speed predicted by AWS Truewind for the same location, suggesting some general conclusions about the accuracy of the wind map for various areas of Massachusetts.
The data were adjusted to a long‐term average using a ratio method from a nearby weather station. The results of this comparison were sorted by region and applied to small wind systems within those regions. Without a full measure correlate predict analysis, it can be difficult to draw conclusions on the true long‐term wind speeds at each site and to extrapolate the wind map variance for the sites to small wind systems in the same region.
Accuracy of Manufacturer Reported Power Curves
Concurrent wind speed/power output data were examined for one site in Massachusetts. In addition, some manufacturers were contacted and supplied updated/revised power curves, which were used in SWEETv2.1.4 modeling, with the resulting AEP estimates compared to actual AEP.
Obviously, with only a single site reporting monitored wind speed/power output data, verification of manufacturer power curves is difficult. However, modeling was done using both reported and tested/revised power curves. To assess the accuracy of a power curve, the main tool available is modeling, in which case a result coincident with actual production is ideal. However, it should be emphasized that a coincident result does not necessarily indicate a causal relationship.
Site Conditions and Other Factors
SWEETv2.1.4 includes higher wind shear exponents for moderate‐very rough terrain, as well as a porosity factor for scaling the effective ground level calculation based on obstacle type.
The revised wind shear values were obtained from 16 RERL site reports and are based on approximately 1 year of wind data at each site. Each site was classified and the wind shears for each classification (moderate‐very rough) were averaged to obtain the new values.

4
Two primary metrics are used in this report to describe the performance of small wind turbines at specific sites. These terms and their definitions are discussed below. Capacity Factor: While capacity factor (CF) is not generally used as a metric for small wind turbines, given the arbitrary nature of “rated” power, the term is used in this report to describe how well a wind system is performing relative to its nameplate/rated capacity. This is an important metric to consider from a programmatic perspective because the Small Renewables Initiative (SRI) provides incentives for small wind systems based on their nameplate capacity. In addition, the SRI’s minimum technical requirements include a minimum estimated capacity factor of 10 percent. Capacity factor, therefore, allows a comparison of system performance with MRET requirements and committed funding, as systems that have a higher capacity factor will, by definition, be a better investment of MRET‐administered funds. For the purposes of this report, capacity factor is calculated as follows:
760,8⋅=
CAEPCF
Where, AEP = Annual Energy Production (either estimated or observed, in kWh/yr) C = Nameplate capacity (kW) Unfortunately, capacity factor gives only an indication of overall system performance at a specific site; it does not identify the cause(s) of low energy production. Capacity factor will increase for systems in windier locations, on taller towers, and using more efficient turbines. Relative Production: Relative production (RP) is used to describe the actual performance of a small wind system compared to its predicted energy output. This metric demonstrates how well a small wind system’s future energy output can be predicted based on available estimating techniques, micrositing, wind speeds, and turbine information. Relative production is calculated as follows:
edAEPpredictactualAEPRP =
RP is calculated by dividing observed annual energy production by the predicted annual energy production. For example, if a system was predicted to produce 10,000 kWh per year and onsite meter readings indicated an AEP of 5,000 kWh, the relative production for that system would be 50 percent. The benefit of using RP as a metric is that, by using estimated output as a basis, it implicitly includes some normalization for wind speed, turbine efficiency, and terrain conditions. The drawbacks of the relative production metric are that it does not convey absolute energy output and that its reliance on an energy production estimate must force the assumption that this estimate is accurate and derived in a manner consistent with estimates at other sites.

5
The SWEET Model SWEET was developed by Cadmus in 2007 to provide a consistent and uniform estimating method that would allow better comparisons between manufacturer‐generated estimates by eliminating some of the uncertainty associated with comparing multiple estimating methods. The Cadmus estimates in this report are based on data from publicly available data sources (e.g., wind maps) and data collected during site visits. Data collected during site visits typically includes GPS coordinates, tree/obstacle heights, terrain conditions/roughness, and topography, segmented by direction. The data are entered into SWEET, which provides further guidance to users on selecting values for terrain‐roughness classes, described as smooth, moderate, rough, and very rough. These terrain classes affect the estimated wind shear exponent and effective ground level. Figures 2 and 3 show examples of terrain classes used in SWEET.
The revised version of SWEET currently under development includes all of the above features as well as inputs for obstacle porosity, Weibull shape factor, and other loss factors (e.g., voltage drop, blade weathering). SWEETv2.1.4 also uses more conservative values for wind shear exponents and other assumed
parameters. Additional details on the revised edition of SWEET are given later in this report.
Figure 3: Example of a ‘rough’ site, based on presence of heavy/thick tree cover.
Figure 2: Roof mounted small wind turbine at an industrial facility. This is an example of a ‘very rough’ site due to the uneven terrain and the mixture of buildings and vegetation of varying
heights.

6
Overview of Program Performance The SRI has funded the installation of 36 wind projects with rated capacities of 10 kW or less. These small systems provide an installed rated turbine capacity of 259.4 kW. Twenty‐one of the systems were included in this analysis after screening for data quality, known equipment failures/issues, and availability of reported energy production or other key data. The systems are installed throughout Massachusetts in locations of varying
wind resource. They are shown superimposed on the Massachusetts wind map in Figure 4. It is interesting to note that many of the systems are not installed in very windy locations. In fact, about half of the systems included in this analysis have 30m annual average wind speeds of less than 5 m/s, generally considered marginal for small wind applications. The breakdown of these installations by turbine manufacturer and model is given in Figure 5. Since most small wind systems installed in Massachusetts use Bergey Excel turbines, the results presented in this report are weighted
towards the Bergey Excel system. As shown in Figure 6, tower heights for small wind projects in Massachusetts cover a wide range, up through approximately 150 feet. Most installed towers are between 80 and 120 feet tall.
Figure 4: Locations of Small Wind Turbines Included in Analysis. Note that some points may overlap, as some systems are installed near each other or at the same
site.
0
2
4
6
8
10
12
14
16
18
20
BWC Excel 10 kW
400 Watt Air‐X
ARE 442 Scirocco E5.5‐6
Skystream ARE 110 Endurance S250
WES Tulipo BWC XL.1 BWC Excel 7.5kW
Aircon 10
Included in Analysis (n=21)
Installed (n=36)
Figure 5: Completed Installations, by Turbine Manufacturer and Model

7
Based on monthly readings of energy output submitted to the PTS, these 21 systems have an average capacity factor of approximately 4.9 percent and a cumulative energy production of approximately 72,000 kWh. The systems have been in operation for 8 to 19 months, with a median of 11 months in operation. Figure 7 clearly shows that none of the 21 systems meet the installer’s energy production estimates; most produce less than half their expected energy output. The average actual energy production is 29 percent of the installer’s estimate provided in the MRET grant application for project funding. Energy output estimates by Cadmus using SWEETv1.0 are included in Figure 7. The independent estimate is generally more accurate, with a 41percent RP, but absolute accuracy compared to actual energy output remains low. To minimize uncertainty due to variations in estimation methods, the Cadmus estimates are used throughout the remainder of this report as the basis for exploring the gap between predicted and actual energy output for these 21 small wind energy systems.
0
1
2
3
4
5
6
40 50 60 70 80 90 100 110 120 130 140 >140
Number of Installations
Tower Height (ft)
Figure 6: Tower height of 21 small wind turbine installations in Massachusetts

8
0% 20% 40% 60% 80% 100%
1
2
3
4
5
6
7
8
9
10
11
12
13
14
15
16
17
18
19
20
21
Relative Production
Systems
Independent Estimate (SWEETv1.0)
Installer Estimate
Figure 7: Relative Production of 21 Small Wind Systems, Based on Installer and Cadmus Estimates of AEP Examination of Figure 7 and the more specific site data given in Appendix A produces several interesting observations:
• Including factors such as obstacle displacement height and documented wind shear exponents for rough terrain is not sufficient to accurately predict AEP, although it does improve accuracy by, on average, 13 percent.
• The variability in relative production values suggests that standardized equipment issues (such as incorrect power curves) may not be the sole cause of low AEP but are likely a contributing factor.
• All but one (System 15) of the systems located in the south coast/Cape Cod region of Massachusetts have relative productions of 40 percent or less.
• Only 2 of the 15 Bergey Excel turbines installed are producing more than 40 percent of their expected energy output.
• AEP prediction accuracy/performance tends to be better for systems meeting the American Wind Energy Association (AWEA) site selection guidelines (i.e., blade rotor 30 feet or more above any surrounding obstacles).

9
Performance of Medium-to-Large-Scale Wind Energy Systems If small wind systems are not meeting performance expectations, it may be interesting to consider the performance of several larger wind projects for comparison. Three medium/large wind projects provide energy production data to the PTS. Table 3 summarizes their performance. The systems range in capacity from 100 to 1,500 kW, and their CFs range from 15 to 31percent. RP for these systems, based on developer AEP estimates, ranges from 66 to 97 percent. Note that, much like 10 kW and smaller systems, these large systems were developed using wind maps and similar data, rather than onsite meteorological data. That the AEP estimates for these larger systems are more accurate is likely a function of better developer training, more accurate turbine performance data, and more sophisticated estimating tools/methods.
Table 3: MRET Large Wind Project Performance
Site Turbine (Capacity) Tower Height Capacity Factor
Relative Production
Large wind site 1 Fuhrlander FL100 (100 kW) 35m 15% 90% Large wind site 2 Vestas V47 (660 kW) 50m 17% 66% Large wind site 3 GE SLE (1,500 kW) 77m 31% 97%
System Performance by Turbine Model Although Figure 7 clearly shows that none of the small wind systems examined is meeting the performance expectations provided by the installer or by an independent estimate, it does little to explain the cause(s) of this underperformance. By grouping individual systems into categories by turbine model, we can look for patterns indicating that a particular turbine may be performing below its power curve. As shown in Figure 7, all systems are underperforming to some degree, but models such as the Endurance S250 and the Eoltec Scirroco are generating nearly as much energy as was predicted (albeit based on small sample sizes). Other machines, such as the Bergey Excel and the Southwest Air‐X, fall farther short of their production targets. It is tempting to infer from Figure 8 that higher RP turbines are “better” than lower RP turbines. Unfortunately, this inference oversimplifies the matter, since RP relies on the assumption that all estimates are completed consistently and are equally accurate, given the information available. Rather than focus on any single value in Figure 8, it is most useful to note the wide spread between turbine models. Assuming similarly modeled site conditions and accurate inputs (wind speed in particular) suggests that SWEET is generating an estimate based on potentially inaccurate information about the turbines’ power curves.
0% 10% 20% 30% 40% 50% 60% 70% 80% 90% 100%
BWC Excel 10 kW
400 Watt Air‐X
ARE 442
Scirocco E5.5‐6
Skystream
ARE 110
Endurance S250
Figure 8: Relative Production of Small Wind Systems by Turbine Manufacturer

10
0% 10% 20% 30% 40% 50% 60%
1
2
3
4
5
6
7
8
9
10
11
Relative Production
Installer
Figure 9: Relative Production by Installer
System Performance by Installer There are 11 installers of small wind systems that are reporting data to the PTS. As shown in Figure 10, most have installed only one or two systems. The most prolific is Installer 2, whose 7 installations reporting to the PTS have an average CF of 3.7 percent. The installers with the highest RP, Installers 7 and 8, have average relative productions of 55 percent and 47 percent, respectively. This observation raises the question of how installer experience, as reflected by number of systems installed, affects relative production. More experienced installers would be expected to generate more accurate estimates of AEP, but as shown in Figure 10, this does not appear to be the case.2 It is difficult to draw sweeping conclusions because there is little variation in the installers’ experience and no
clear correlation between their experience and RP. Since this report covers only 2 years, most of the installers have had only a single installation season and so no long‐term performance data for their systems.
2 Installation experience outside of MRET‐funded systems has not been included here
0%
10%
20%
30%
40%
50%
60%
0 1 2 3 4 5 6 7
Installer Relative Production
Installations Completed
Figure 10: Effect of Installer Experience on Relative Production

11
Analysis of System Performance Data As discussed in the previous sections, the poor energy output of the 21 small wind energy systems examined in this report cannot be explained through an aggregate assessment of either turbine models or installers; a more detailed analysis is required. Therefore, the authors took a site‐by‐site approach to identify the causes of lower‐than‐expected energy output. For each of the 21 sites, they created a SWEET model based on observed site conditions and inputs from the AWS Truewind New England wind map. Next, they analyzed several key factors affecting system energy output to determine any impact those factors might have had on the performance of the small wind turbines. It is often convenient to blame the most uncertain or “mysterious” inputs to the AEP estimate, such as average annual wind speed or turbulence, but the data do not necessarily support that conclusion. Instead, a number of likely causes must be examined in an attempt to gauge their potential impact on estimated AEP. Potential causes of poor agreement between predicted and actual energy output include:
• Accuracy/variability of annual average wind speed data • Accuracy of manufacturer power curve • Greater than expected losses due to site conditions (turbulence/wind shear) • Other system losses (e.g. wiring/voltage drop, wind speed/direction changes)

12
Contributing Factor: Year-to-Year Variations in Wind Speed It is tempting to conclude that the low energy output observed thus far is due to a temporary period of low wind
speeds in the state and that future energy production should increase dramatically. Unfortunately, the available data do not support this conclusion. Although wind speeds over the past 12 months have been 6 percent to 9 percent lower than the 10‐year average, as shown in Figure 11, they have not been low enough to explain fully 21 small wind systems’ lower‐than‐expected energy production, as shown in Figure 12. The aggregate RP for all systems covered in this report and presented in Figure 12 were calculated after derating wind speeds at each site based on the ratio of annual average wind speed over the past year and the past 10 years, taken at the
reference station nearest to each of the 21 sites. The result of that calculation is an adjusted annual average wind speed that should represent how the wind regime under which these systems have been operating compares to the long term expected wind speeds. After applying this derating factor and recalculating the AEP, the average RP for all 21 systems increases from 41 percent to 47 percent. While an improvement in estimating accuracy, this change is only a modest step towards explaining the large difference between expected and observed energy output.
Figure 11: Comparison of 10 Year and 12 Month Average Wind Speeds at 6 Massachusetts NCDC Weather Stations
41%47%
0%
10%
20%
30%
40%
50%
60%
70%
80%
90%
100%
Base SWEET Adjusted SWEET‐Annual Wind Speed Variation
Relative
Produ
ction
Figure 12: Comparison of Original Cadmus Relative Production Estimate and Revised Relative Production Using Annual Average Wind Speeds Normalized for Annual Variations
13
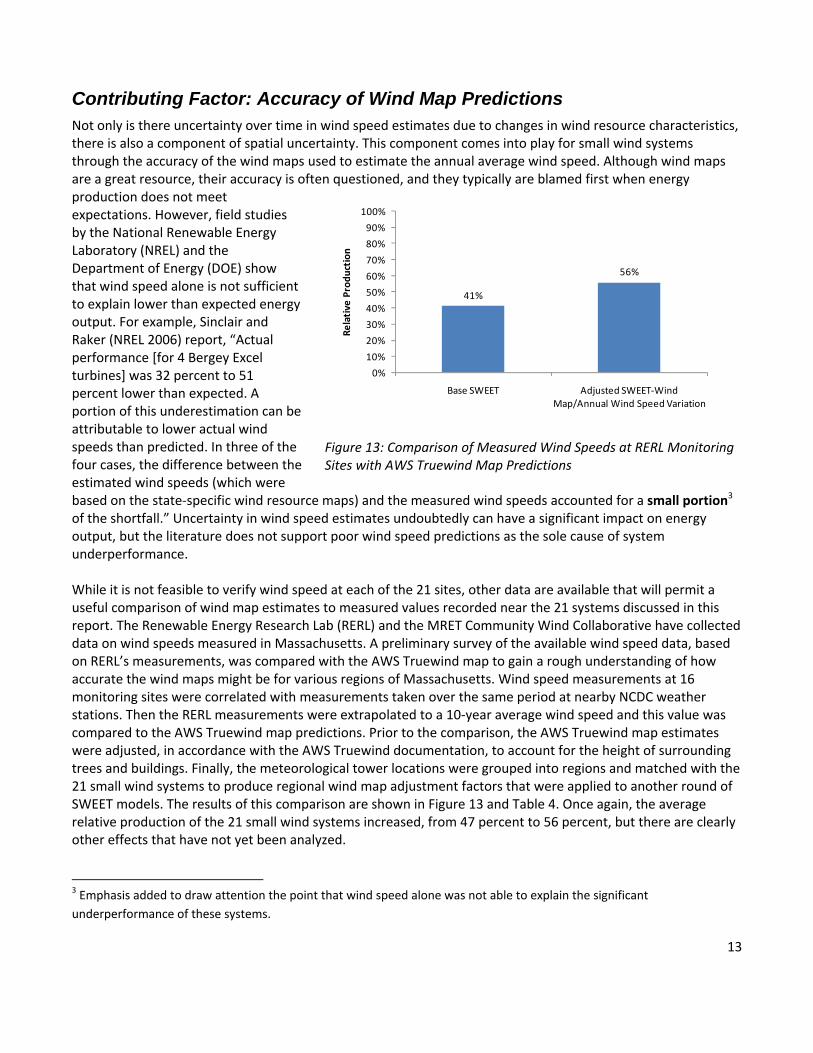
Contributing Factor: Accuracy of Wind Map Predictions Not only is there uncertainty over time in wind speed estimates due to changes in wind resource characteristics, there is also a component of spatial uncertainty. This component comes into play for small wind systems through the accuracy of the wind maps used to estimate the annual average wind speed. Although wind maps are a great resource, their accuracy is often questioned, and they typically are blamed first when energy production does not meet expectations. However, field studies by the National Renewable Energy Laboratory (NREL) and the Department of Energy (DOE) show that wind speed alone is not sufficient to explain lower than expected energy output. For example, Sinclair and Raker (NREL 2006) report, “Actual performance [for 4 Bergey Excel turbines] was 32 percent to 51 percent lower than expected. A portion of this underestimation can be attributable to lower actual wind speeds than predicted. In three of the four cases, the difference between the estimated wind speeds (which were based on the state‐specific wind resource maps) and the measured wind speeds accounted for a small portion3 of the shortfall.” Uncertainty in wind speed estimates undoubtedly can have a significant impact on energy output, but the literature does not support poor wind speed predictions as the sole cause of system underperformance. While it is not feasible to verify wind speed at each of the 21 sites, other data are available that will permit a useful comparison of wind map estimates to measured values recorded near the 21 systems discussed in this report. The Renewable Energy Research Lab (RERL) and the MRET Community Wind Collaborative have collected data on wind speeds measured in Massachusetts. A preliminary survey of the available wind speed data, based on RERL’s measurements, was compared with the AWS Truewind map to gain a rough understanding of how accurate the wind maps might be for various regions of Massachusetts. Wind speed measurements at 16 monitoring sites were correlated with measurements taken over the same period at nearby NCDC weather stations. Then the RERL measurements were extrapolated to a 10‐year average wind speed and this value was compared to the AWS Truewind map predictions. Prior to the comparison, the AWS Truewind map estimates were adjusted, in accordance with the AWS Truewind documentation, to account for the height of surrounding trees and buildings. Finally, the meteorological tower locations were grouped into regions and matched with the 21 small wind systems to produce regional wind map adjustment factors that were applied to another round of SWEET models. The results of this comparison are shown in Figure 13 and Table 4. Once again, the average relative production of the 21 small wind systems increased, from 47 percent to 56 percent, but there are clearly other effects that have not yet been analyzed. 3 Emphasis added to draw attention the point that wind speed alone was not able to explain the significant underperformance of these systems.
41%
56%
0%
10%
20%
30%
40%
50%
60%
70%
80%
90%
100%
Base SWEET Adjusted SWEET‐Wind Map/Annual Wind Speed Variation
Relative
Produ
ction
Figure 13: Comparison of Measured Wind Speeds at RERL Monitoring Sites with AWS Truewind Map Predictions

14
From Table 4 it appears that the AWS Truewind map may significantly overpredict the annual average wind speed in western Massachusetts, on the South Shore, and on Cape Cod, in particular. This overprediction has a significant impact on the estimated AEP, as shown in Figure 13. In RERL 2005, Gambhir et al. examined the predictive accuracy of the AWS Truewind maps for 15 Massachusetts sites, using the statistical t‐test as the primary figure of merit. While the authors are cautious about making general conclusions, their report states: “Out of 15 sites in Massachusetts, we see that for a large majority of the sites, the model over predicts [wind speeds] and for only 2 sites . . . it under
predicts. Based on these results the TrueWind map users should keep in mind that a small fractional reduction in the model’s mean wind speed estimates would [keep] them on the safer side.” The authors do not quantify what such a “small fractional reduction” might be, but based on Cadmus’ analysis, adjusting the wind map speeds by 8 to 12 percent may improve the accuracy of the resulting wind speed predictions.
Contributing Factor: Accuracy of Manufacturer Reported Power Curves SWEET, along with every other known estimating method associated with small wind turbines, relies on manufacturer‐reported power curves. Unfortunately, the development of these power curves is not as closely regulated or standardized as the development of power curves for larger turbines. Consequently, manufacturers of small wind turbines have significant latitude in determining their power curves, and little has been done to certify these power curves through third‐party testing or other means. Work by organizations such as the Small Wind Certification Council (SWCC) and the American Wind Energy Association (AWEA) may address this issue in the future. Invariably, these curves should be viewed as marketing pieces, more than stringent engineering test results.
Table 4: Regional Wind Map Adjustment Factors Based on Analysis
of 16 Meteorological Towers
Region Wind Map Adjustment Western Mass 0.88 Cape Cod 0.92 South Coast 0.95 South Shore 0.92 North Shore 0.92
0%
2%
4%
6%
8%
10%
12%
14%
16%
18%
20%
0
2
4
6
8
10
12
1 2 3 4 5 6 7 8 9 10 11 12 13 14 15 16 17 18 19 20
Wind Spee
d Freq
uency
System
AC Po
wer Outpu
t (kW)
Wind Speed (m/s)
Original Bergey Reported (WindCAD) Bergey Updated June 2008 Wind Frequency
Figure 14: Bergey Excel Reported and Updated Power Curves, with Weibull Distribution of Wind Speeds at 5 m/s Annual Average

15
Verifying the power curve of a small wind turbine is time and resource intensive. Projects to conduct these tests to IEC‐61400 standards are underway at NREL and at several sites in Connecticut, as part of the Connecticut Clean Energy Fund’s Small Wind Turbine Demonstration Project. Unfortunately, these studies are in their early stages and data on the turbines tested are not expected to be available in the near future. Recently, Bergey Windpower released a new power curve for the Excel S SH3055 blade set. It applies to all of the Bergey Excel turbines discussed in this report and is significantly different than the previously advertised power curve. According to Bergey, the new curve is tested to IEC 61400‐12, using 1‐minute interval data on a turbine operating under real‐world conditions. The two power curves are compared in Figure 14. In addition to the two power curves, a Weibull distribution about a mean wind speed of 5 m/s is shown. Figure 14 clearly shows that the new power curve is significantly lower than the previously reported power curve for wind speeds up to around 14 m/s. Comparing these curves with the probability distribution shows that the overall impact of this power curve will be to lower energy output estimates. Although there is much more energy in the higher wind speeds, where the new power curve is higher than the previously reported curve, systems such as those discussed in this report rarely ever experience wind speeds above 12 m/s. The impact of this new power curve on RP is shown in Figure 15. After accounting for the revised Bergey power curve, annual variability, and adjustments to the AWS Truewind wind map, the fleet‐wide average relative production increased to 69 percent.
In addition, power curve measurements made by the data acquisition system (DAS) at Falmouth Academy shows similarities between the onsite measured power curve and the new curve released by Bergey Windpower. The Falmouth Academy DAS and revised Bergey power curves are shown in Figure 16.
0
12
3
4
56
7
8
1 2 3 4 5 6 7 8 9 10 11
Wind Speed Bin (m/s)
Syst
em O
utpu
t Pow
er (k
W)
Reported Pow erCurve
Revised Pow erCuve
Measured On-Site
Figure 16: Partial Bergey Excel‐S power curve from Falmouth Academy DAS and Bergey Windpower Literature
41%
69%
0%
10%
20%
30%
40%
50%
60%
70%
80%
90%
100%
Base SWEET Adjusted SWEET‐Annual Wind Speed, Wind Map, and Power
Curve VariationsRe
lative
Produ
ction
Figure 15: Relative Production Estimated Using New Bergey Excel‐S Power Curve and Previously Discussed Wind Speed Adjustments

16
Contributing Factor: Additional Site/Equipment Losses and Model Improvements In addition to uncertainty around the manufacturers’ power curve data, there is considerable uncertainty around the additional losses associated with wind system availability. Most, if not all, small wind turbines have controls that put the system into standby or monitoring mode when turbine output falls below a certain level. If the wind at a site is particularly gusty, a turbine can go through repeated on/off cycles. In these situations, the system may shut down as the wind speed decreases but, depending on its factory‐set response time, the inverter may remain in standby mode through one or more subsequent gusts. To quantify the amount of energy lost due to standby timing, it is necessary to track wind speed and power output concurrently, keeping track of high wind speeds coinciding with standby power draw. Without measured data, there is no way to accurately estimate the magnitude of this loss. Highly variable or turbulent winds can rapidly change not only speed but also direction. When wind direction changes, the turbine generally responds by trying to turn into the wind. Rapidly changing wind speed and direction can cause excessive “tracking” as the turbine yaws and tries to turn into the wind. During these times, the turbine rotor is not perpendicular to the wind flow and power output decreases. The magnitude of the energy loss due to this effect is difficult to estimate without detailed system monitoring, and it is not surprising that none of the commonly available estimating tools attempt to include losses for turbine tracking. Due to the lack of sufficiently detailed data, Cadmus was not able to quantify the impacts of either system low‐speed shutdowns or yaw error. System output also is adversely affected by obstacles and rough terrain. SWEETv1.0 models this effect via a wind shear exponent and calculation of effective ground level. These two adjustments first reduce the hub height by an amount proportional to the height of surrounding obstacles and then, using this new effective hub height and an appropriate wind shear exponent for the terrain, calculate an adjusted hub height wind speed. Literature values for the wind shear exponent (Ray, Rogers, McGowan, 2006) over various terrain types appear, based on Cadmus’ review of 13 meteorological sites, to be generally too low. Figure 16 compares the literature values for wind shear (used in SWEETv1.0) with values obtained from Cadmus’ analysis of the available meteorological tower data for 19 sites in Massachusetts. The categories displayed along the x‐axis of Figure 17 denote a site’s classification. Moderate sites are typically open with no significant trees or other large obstacles. Rough sites are
0
0.1
0.2
0.3
0.4
0.5
0.6
Moderate Sites Rough Sites Very Rough Sites
Wind Shear Expo
nent (alph
a) SWEETv1.0.0
SWEETv2.1.4
Figure 17: Wind Shear Exponents Used in Original and Revised SWEET Models. New Values were Calculated Based on 17 Sites with One Year Wind Monitoring at Two, or More, Anemometer Heights

17
less open and often include some dense forest or partially wooded terrain. Very rough sites include buildings/subdivisions, tree cover of varying heights, and similar site characteristics. In addition to adjusting the wind shear exponents used in SWEET, an additional factor allows changes in the porosity of obstacles. The current revision, for example, allows the user to choose between building and vegetative obstacles. SWEETv1.0 assumes that all obstacles are vegetation, the dominant type of obstacle seen at small wind project sites in Massachusetts. However, buildings and other solid obstructions impede the flow of wind more than natural obstructions, so adding this new factor will tend to generate more conservative estimates for sites with solid obstructions. The site conditions mentioned above are often exacerbated by towers that are too short for the sites selected. In many cases, short towers are the result of well‐intentioned, but poorly written, bylaws and zoning ordinances. While town officials may feel 100 feet is a quite generous height allowance, it is not sufficient considering that nearby trees may be upwards of 75 feet tall in many locations. This forces knowledgeable installers to choose between a well‐producing system and no system at all.
Feedback from Past/Current Programs and Verification Projects To better understand this issue, we reviewed publicly available wind turbine field performance studies. Results appear mixed, with no clear guidance on causes for low performance. For example, as part of the New York/New Jersey Distributed Wind Power Field Verification Project, 4 Bergey Excel turbines were installed and monitored over a 2‐year period. During this time, the turbines showed capacity factors ranging from 3.1 to 13.1 percent. The sites with lower production appeared to have more buildings or trees near the tower base, but the reports did not discuss turbulence effects or other potential causes for these low capacity factors. An NREL field study of 4 Bergey Excel turbines installed in the Pacific Northwest shows similarly varied results. In general, all 4 turbines underperformed by 20 to 50 percent, and although wind speed was measured at each site, variations between expected and actual wind speeds could not account for the systems’ underperformance. A number of energy fund programs currently provide incentives for individuals or businesses to install small wind energy systems. Unfortunately, most of these programs do not track the energy output of funded systems. Instead, they rely on estimated outputs to determine cost effectiveness, set rebates, and assign program benefits. As has been shown in this report, this practice may significantly overestimate small wind energy system benefits and lead to artificially inflated cost‐benefit ratios for small wind programs.
Summary of Factors Affecting System Energy Output Estimates Verifying the performance of small wind energy systems is easily a field of study unto itself. The goal of this report is not to identify a definitive cause for either the low energy output of existing small wind projects in Massachusetts or to diagnose the unrealistically high performance expectations assigned to these systems prior to installation. The data presented here are an attempt to explore some, but not all, of the factors that may play a significant role in the performance of the 21 systems studied and to provide MRET with the tools to understand the issue and plan accordingly for future programs. With that in mind, it is useful to consider all of the contributing factors presented in this report and examine them side‐by‐side. Many of these factors are intrinsically linked and all come with a degree of uncertainty due to

18
the imperfect nature of the data available. These factors are summarized and considered in Table 5. The relative contribution of each factor to closing the overall RP gap is shown in Figure 18. The impact of the improved site modeling in the updated SWEET is, once again, to raise the overall RP. Figure 18 displays the cumulative results, after all modifications, of the SWEET models for all 21 sites. The average RP is 101percent, with the RP of individual systems ranging from 60 to 360 percent, as shown in Figure 19. The single outlier shown in Figure 19, B. Fearing, is for a system installed on a 35‐ft tall tower in complex terrain. The standard power law equation, wind shear exponent, and other standard estimating methods may not apply to this type of system. Therefore, the outlier is displayed for reference in Figure 15, but is not included in the results given elsewhere in this report. Overall, there is clearly significant improvement over the initial round of estimates, but further work should be done to narrow the range in RP from site to site, particularly for shorter towers in complex terrain.
41%47%
56%
69%
101%
0%
20%
40%
60%
80%
100%
120%
Original Estimate
Annual Variability
Wind Map Adjustment
Power Curve Revision
Improved Site Modeling/Other
Factors
Relative
Produ
ction
Figure 18: Overall Cumulative Relative Production for Each Contributing Factor Examined, for 21 Small Wind Energy Systems

19
0% 50% 100% 150% 200% 250% 300% 350% 400%
1
2
3
4
5
6
7
8
9
10
11
12
13
14
15
16
17
18
19
20
21
Relative Production
Site
Figure 19: Relative Production by Site, Estimated Using Revised SWEET and All Weighting Factors from Previous Sections. Error bars represent +/‐ 20% relative production.

20
Contributing Factor to Poor Estimates/Low AEP
Average Impact on AEP Uncertainty
Yearly Wind Speed Variations 5-6%
Moderate: The data for this factor are based on regional weather stations that may be located up to 50 miles from the actual site(s) being considered. However, for most sites in the Cape Cod/South Coast region, weather stations are within 20 miles.
Accuracy of Available Wind Maps 8-15%
Moderate: Similar to the yearly wind speed variance, wind map accuracy data is based on a limited number of sites which may, or may not, be close to the actual installations considered in this report. However, due to the level of scrutiny applied to each site, the overall data quality is believed to be higher, lending a somewhat higher level of confidence to this as a source of underperformance.
Accuracy of Manufacturer Reported Power Curves 14-18%
Moderate: The new power curve for the Bergey Excel appears to be much more consistent with observed energy production. Nevertheless, significant uncertainty remains in the power curves for the other turbines. Not only is the test procedure employed by the manufacturers a source of uncertainty, power curves tested under ideal site conditions cannot necessarily be directly applied to sites with more complex terrain.
Other Site/Equipment Losses 0-30%
High: There is no publicly available research into several of these loss factors, such as energy loss due to turbine tracking. Without further research, it is difficult to assign even an order of magnitude AEP impact.
Table 5: Discussion of the impact of various factors on AEP estimates

21
Program Recommendations Based on the findings of this report, Cadmus suggests that MRET consider several areas of improvement when preparing the new small wind program to replace the Small Renewables Initiative.
• On‐Site Monitoring: Much of this report is based on analysis and inference from secondary data sources. Had onsite data been available for even a fraction of the systems analyzed here, a more robust analysis would have been possible. The incremental cost of equipment to monitor wind speed, wind direction, and inverter/controller output energy is approximately $1,000 to $1,500, and several companies offer technology that could prove suitable.
• Split Incentives Between Up‐front and Production Based Payments: The current system of funding small wind systems based on rated capacity has some inherent complications. For example, the arbitrary nature of turbine nameplate power ratings and the lack of oversight on power curve measurements/reporting provide manufacturers with a great deal of flexibility that they can use to gain the best rebates from MRET—regardless of how well their product may actually perform. Cadmus suggests moving forward with plans to pay a portion of the total incentive up‐front to offset first costs and then pay the remainder as a production incentive. Cadmus encourages MRET to consider prevailing interest rates when setting the production incentive levels because a system owner could lose much of its production payments simply in paying interest on the loan used to pay system costs not covered by the up‐front rebate.
• Encourage the Entrance of New Technologies: While small wind has not proven as successful as most would have hoped, many new turbines and technologies are becoming available. These should be encouraged in Massachusetts to broaden MRET’s small wind portfolio. The current data are based largely on turbines made by one manufacturer, and it is very possible that a broader selection of turbine options would identify some turbines that have superior energy production performance. Possible mechanisms for this support include MRET‐sponsored data collection and a bonus for first‐time installations of new turbines in Massachusetts.
• Pursue an Updated Wind Map for Massachusetts: Since there is no online version of the AWS Truewind New England Wind Map, installers may have difficulty accurately estimating energy output for systems once the new program takes effect. This situation could lead to more work for MRET, which may have to spend more time reviewing applications and checking wind speeds. Nearly every wind project installed in Massachusetts has used the New England Wind Map in some capacity, and this valuable product should be updated and once again made available to the Massachusetts wind energy community.
• Encourage Further Development in Windier Areas: As shown in Figure 4, systems have not always been installed in the windier areas of Massachusetts and some of the windier areas, such as Cape Cod and Martha’s Vineyard, are comparatively untapped for small wind. Given the critical importance of wind speed to high energy output, MRET should encourage project development in these areas.
• Broad Educational Outreach: Among the barriers to the development of taller towers and, thus, more successful small wind projects are public perception and permitting related to visibility. Most municipalities that consider a small wind zoning ordinance use 100 feet as the default upper limit on height. This effectively limits installations to 80‐ or 90‐ft towers, which are often too short for the sites where they are installed. Pushing towns towards more realistic expectations of tower height may give installers more latitude to install systems that will have access to faster, less turbulent wind regimes.

22
Conclusions This report assesses the measured energy output of 21 wind energy systems, 10 kW and smaller, installed using funds from the Massachusetts Renewable Energy Trust. These systems have fallen short of both installer and independent energy production estimates; the purpose of this report has been to quantify this shortfall and attempt to identify possible causes for the systems’ underperformance. The lower‐than‐expected energy output for small wind systems in Massachusetts cuts across equipment manufacturers, geographic locations, reported wind speeds, and installers. Upon closely examining the available data, Cadmus concludes that:
• On average, small wind energy systems in Massachusetts are producing approximately 29 percent of their expected energy output specified in grant applications to MRET.
• This underperformance appears to be due to a combination of factors, including wind map inaccuracy, annual variations in wind speed, inaccurate turbine performance data, and inaccurate site modeling assumptions (e.g., wind shear, obstacle porosity).
• After adjusting for these factors, it is possible to generate significantly more accurate estimates of system energy output. Cadmus was able to predict the annual energy output of 20 small wind systems to within, on average, 5 percent accuracy. Individual systems’ relative production varied from 60 to 180 percent in most cases.
• Published wind shear exponents may be significantly lower than measured values for Massachusetts, and perhaps elsewhere as well.
• Wind speeds statewide, over the past 12 months have been 6 to 9 percent below the 10‐year average, based on data from 6 NCDC weather stations.
• The AWS Truewind map appears to overpredict wind speeds across Massachusetts by 5 to 12 percent, based on an analysis of 16 meteorological tower sites.
Although significant progress has been made in explaining the performance characteristics of 21 existing small wind energy systems, more work may be necessary before small wind energy system performance at individual sites in Massachusetts can be adequately explained and accurately predicted. This understanding and improved accuracy will help minimize financial risk to MRET, installers, and the potential system owners in Massachusetts. Cadmus recommends that MRET consider:
• Developing and making available an updated wind map to replace the New England Wind Map that is no longer being supported by AWS Truewind
• Offering a new small wind program that rewards good site selection, sensible system design, and new or better small wind technologies
• Conducting or supporting the monitoring of, at a minimum, wind speed, wind direction, and AC power output of new small wind energy systems as they are installed in Massachusetts
• Further investigating the high degree of variability between relative production at existing sites in an effort to improve confidence in site‐level energy output predictions
• Releasing for the use of the Massachusetts small wind community a new Small Wind Energy Estimator Tool that includes the correction factors discussed in this report. Cadmus also recommends that the tool include caveats to alert users that results will remain variable from site to site.

23
Selected References Adams, James R. III, “DOE Field Verification Program for Small Wind Turbines”, AWS Scientific (now AWS Truewind), September 2003.
Sinclair, K. and Raker, J., “Regional Field Verification‐Operational Results from Four Small Wind Turbines in the Pacific Northwest”, National Renewable Energy Laboratory, Conference Paper # NREL/CP‐500‐38110, August 2006.
Van Dam, Jeroen and Meadors, Mark; “Wind Turbine Generator System Power Performance Test Report for the Bergey Excel‐S/60 Wind Turbine with SH3052 Airfoil Blades in Golden, Colorado”, National Renewable Energy Laboratory, February 2003.
Ray, M.L., Rogers, A.L., and McGowan, J.G.; “Analysis of wind shear models and trends in different terrains”, University of Massachusetts, Department of Mechanical and Industrial Engineering, Renewable Energy Research Laboratory; 2006.

24
Appendix A: System Level Descriptions
System Number Turbine Months in Operation
Approx Location
Actual/ Projected AEP (kWh)
30m Wind Speed (m/s)
Hub Height (m)
Meets AWEA Siting Guidelines?
1 ARE 442 12 Oak Bluffs 8,800 5.5 31 Yes
2 400 Watt Air-X
12 Scituate 13 5.8 8 No
3 BWC EXCEL 10 KW
13 Falmouth 3,217 6.4 24 No
4 BWC EXCEL 10 KW
11 Rochester 3,449 4.8 24 No
5 BWC EXCEL 10 KW
14 Amesbury 2,464 4.8 37 Yes
6 BWC EXCEL 10 KW
19 Amesbury 3,226 4.8 37 Yes
7 BWC EXCEL 10 KW
14 Plymouth 7,294 7.5 30 Yes
8 BWC EXCEL 10 KW
11 East Bridgewater
1,268 4.7 30 No
9 BWC EXCEL 10 KW
19 Freetown 3,332 4.5 30 Yes
10 BWC EXCEL 10 KW
18 Haverhill 3,468 5.1 48 Yes
11 Scirocco E5.5-6
11 Heath 3,676 4.5 32 No
12 BWC EXCEL 10 KW
10 Newbury 5,170 4.8 24 Yes
13 BWC EXCEL 10 KW
8 New Braintree
3,126 5.0 27 No
14 BWC EXCEL 10 KW
13 Freetown 1,512 4.8 24 No
15 EXCEL S 10KW
10 Westport 4,050 4.8 36 No
16 EXCEL S 10KW
11 Westport 5,669 5.6 11 Yes
17 EXCEL S 10KW
9 Westport 3,316 5.1 24 Yes
18 Skystream 3.7 9 Hadley 1,129 5.2 15 Yes
19 Skystream 3.7 10 Rochester 707 4.0 11 No
20 ARE-110 13 Tisbury 2,020 5.7 26 Yes
21 Endurance S250
9 Tisbury 3,795 5.7 26 Yes