caffeine intake and the plasma proteome · caffeine intake and the plasma proteome ouxi tian ......
TRANSCRIPT
Caffeine Intake and the Plasma Proteome
By
Ouxi Tian
A thesis submitted in conformity with the requirements
for the degree of Master of Science (M.Sc.)
Graduate Department of Nutritional Sciences
University of Toronto
© Copyright by Ouxi Tian 2013
ii
Caffeine Intake and the Plasma Proteome
Ouxi Tian
Master of Science
Graduate Department of Nutritional Sciences
University of Toronto
2013
Abstract
Caffeine has been implicated in a number of health conditions, but the mechanisms
and physiological pathways affected are not all well understood. Genetic variation in the
caffeine metabolizing gene, CYP1A2 (rs762551), is associated with differences in caffeine
metabolism and disease risk. The objectives of this thesis were to determine the association
between caffeine intake and the plasma proteome and whether CYP1A2 genotype modifies any
associations. Subjects (n=1095) were from the Toronto Nutrigenomics and Healthy Study.
Initially, no significant associations were seen between caffeine intake and 54 high-abundance
plasma proteins. After stratification by CYP1A2 genotype, plasma gelsolin levels decreased
significantly with increasing caffeine intake among the slow metabolizers (A/C +C/C). These
results suggest that plasma gelsolin levels are affected by caffeine intake and this association is
only evident among slow metabolizers. Gelsolin may have a role in mediating some of the
biological effects of caffeine.
iii
Acknowledgments
First and foremost, I would like to thank my thesis supervisor, Dr. Ahmed El-Sohemy, for not
only giving me the opportunity to complete this project, but also for being a great mentor. Your
patience, empathy, and wisdom have made this journey a memorable and rewarding experience. I am
grateful of all the support and help you have given me.
I would also like to express my appreciation to Dr. Anthony Hanley and Dr. Richard Bazinet of my
Advisory Committee for their valuable encouragement, insightful comments, and challenging questions.
I would like to thank my loved ones, who have supported me throughout the entire process, by
keeping me spirited, and providing me with the comfort of home-cooked meals and occasional ice
cream! I will be grateful forever for your love.
To the El-Sohemy lab, I am deeply grateful for the support and guidance each and every one of
you has offered me. No matter whether it is a SAS code or a random question, you have never failed to
help me to find a solution. The success of my thesis would not have been possible without your help and
encouragement.
Thank you to the Nutritional Sciences Department as well, especially Dr. Pauline Darling, who
trusted in me and accepted me into the program.
Finally, I would like to thank all of the brothers and sisters from my Bible Study group for your
continued prayers, care, and support. I am grateful for God’s provision of joys, challenges, and grace for
growth.
“The Lord is my strength and my shield; my heart trusts in him, and he helps me. My heart leaps for joy,
and with my song I praise him.” (Psalm 28:7, NIV)
iv
Table of Contents
Chapter 1: Introduction and Literature Review ············································································· 9
1.1 Introduction ···························································································································· 11
1.1.1 Thesis Organization ······························································································ 11
1.2 Caffeine ··································································································································· 11
1.2.1 Physical and Chemical Properties of Caffeine ····················································· 11
1.2.2 Caffeine: Sources and Consumption ···································································· 12
1.2.3 Pharmacokinetics of Caffeine ·············································································· 17
1.2.3.1 Absorption and Distribution ····························································· 17
1.2.3.2 Caffeine Metabolism ········································································ 17
1.2.4 Cytochrome P450································································································· 19
1.2.4.1 CYP1A2 and Factors that Influence CYP1A2 Activity ························ 19
1.2.5 The CYP1A2 Gene································································································· 23
1.2.5.1 Genetic Variation in CYP1A2 ····························································· 23
1.3 Caffeine Pharmacology ··········································································································· 26
1.3.1 Caffeine Mechanism of Action – the Adenosine Receptor Antagonist ··············· 26
1.3.2 Physiological and Psychological Effects of Caffeine ············································ 27
1.4 Caffeine Intake and Associated Health Outcomes ································································· 30
1.4.1 Caffeine and Cardiovascular Diseases ································································· 30
1.4.1.1 Caffeine, CYP1A2, and Cardiovascular Diseases ······························· 32
1.4.2 Caffeine and Parkinson’s disease········································································· 33
1.4.2.1 Caffeine, CYP1A2, and Parkinson’s disease ······································ 34
1.4.3 Caffeine and Breast Cancer·················································································· 35
1.4.3.1 Caffeine, CYP1A2, and Breast Cancer ··············································· 35
1.4.4 Caffeine and Type 2 Diabetes ·············································································· 36
1.4.5 Caffeine and Health Summary ············································································· 37
1.5 Proteomics – an Approach towards Understanding the Influence of Diet on Health············ 37
1.5.1 Proteomics and Nutrition Research ····································································· 38

v
1.5.2 Proteomics – the Search for Biomarkers ····························································· 39
1.5.3 Proteomics Techniques ························································································ 41
1.5.4 The Proteomics Panel ·························································································· 43
1.6 Hypothesis, Objectives, and Thesis Organization ··································································· 44
Chapter 2: Association between Caffeine Intake and the Plasma Proteome in Humans ··········· 45
2.1 Abstract ··································································································································· 45
2.2 Introduction ···························································································································· 46
2.3 Materials and Methods ··········································································································· 48
2.3.1 Study Population ·································································································· 48
2.3.2 Physical Activity and Anthropometric Measurements ········································ 49
2.3.3 Biochemical Measurements and Genotyping······················································ 49
2.3.4 Plasma Proteomics Measurements ····································································· 50
2.3.5 Statistical Analysis ································································································ 50
2.4 Results ····································································································································· 52
2.5 Discussion ································································································································ 59
Chapter 3: Association between Caffeine Intake and Plasma Gelsolin Concentrations in Other
Caffeine-Related Genes among Slow Metabolizers of Caffeine ··················································· 63
3.1 Abstract ··································································································································· 63
3.2 Introduction ···························································································································· 64
3.3 Materials and Methods ··········································································································· 66
3.3.1 Study Population ·································································································· 66
3.3.2 Biochemical Measurements and Genotyping······················································ 66
3.3.3 Plasma Proteomics Measurement – Gelsolin, Isoform 1 ···································· 66
3.3.4 Statistical Analysis ································································································ 66
3.4 Results ····································································································································· 67
3.5 Discussion ································································································································ 73
Chapter 4: Overview and General Discussion ·············································································· 79
4.1 Overview ································································································································· 79
4.2 Limitations ······························································································································· 81

vi
4.3 Future Directions ···················································································································· 83
vii
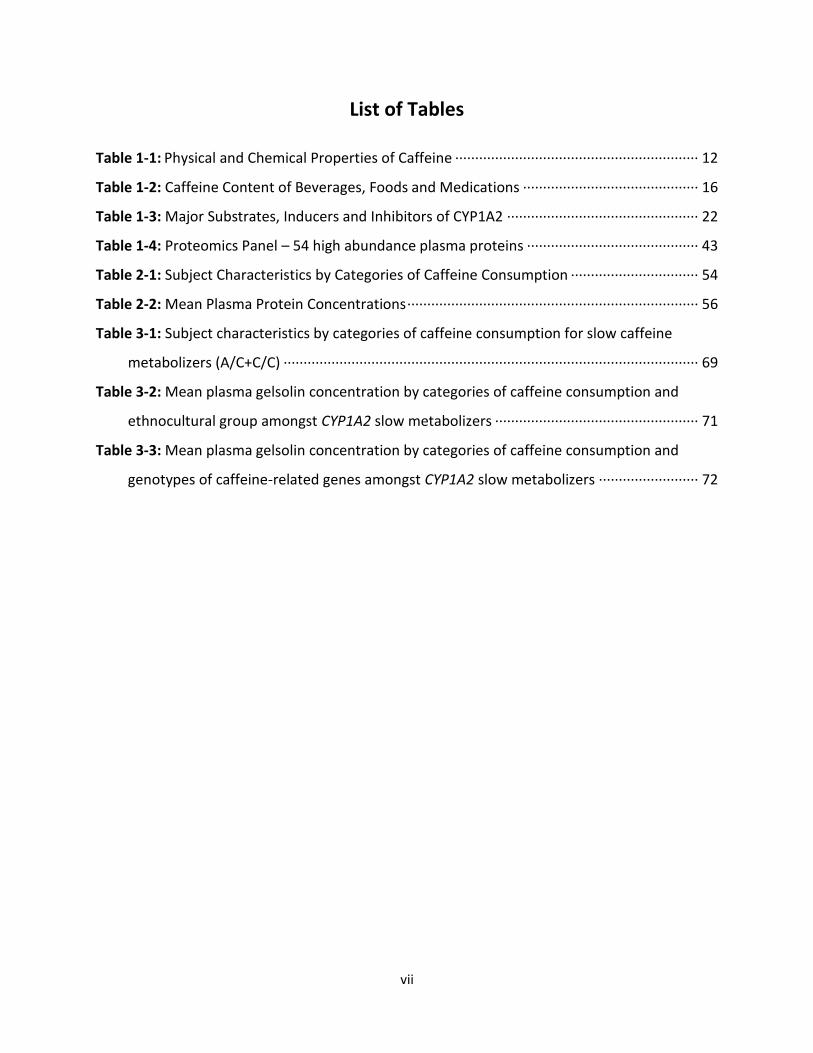
List of Tables
Table 1-1: Physical and Chemical Properties of Caffeine ····························································· 12
Table 1-2: Caffeine Content of Beverages, Foods and Medications ············································ 16
Table 1-3: Major Substrates, Inducers and Inhibitors of CYP1A2 ················································ 22
Table 1-4: Proteomics Panel – 54 high abundance plasma proteins ··········································· 43
Table 2-1: Subject Characteristics by Categories of Caffeine Consumption ································ 54
Table 2-2: Mean Plasma Protein Concentrations ········································································· 56
Table 3-1: Subject characteristics by categories of caffeine consumption for slow caffeine
metabolizers (A/C+C/C) ········································································································ 69
Table 3-2: Mean plasma gelsolin concentration by categories of caffeine consumption and
ethnocultural group amongst CYP1A2 slow metabolizers ··················································· 71
Table 3-3: Mean plasma gelsolin concentration by categories of caffeine consumption and
genotypes of caffeine-related genes amongst CYP1A2 slow metabolizers ························· 72

viii
List of Figures
Figure 1-1: SNPs within the CYP1A2 Gene ···················································································· 25
Figure 2-1: Plasma Gelsolin Concentrations among Slow Caffeine Metabolizers························ 58

1
Chapter 1 – Introduction and Literature Review
1.1 Introduction
Caffeine is one of the most widely consumed bioactive substance in the world [1].
Approximately 80% of the world’s population consume caffeine regularly and 90% of adults in
North America consume caffeine on a daily basis [2]. Like cocaine and amphetamine, caffeine
stimulates motor activation, increases arousal, and produces desirable as well as adverse
effects [3]. In addition to coffee and tea, caffeine is also commonly found in energy drinks, soft
drinks, and chocolate [4]. However, the most important source of caffeine globally comes from
coffee [5].
Because of caffeine’s widespread use and its variability in consumption behaviour, many
studies have sought to elucidate caffeine’s effects on health and disease risk. In particular, the
effect of caffeine on cardiovascular diseases (CVD), such as hypertension and myocardial
infarction (MI), have been very controversial [6]. Although the adverse effects of caffeine on
cardiovascular health have been emphasized, recent studies show that long-term caffeine
consumption is not associated with an increased risk of CVD events [7, 8]. Inconsistencies
between study results could be attributed to methodological issues including differences in
study design and a variety of confounding factors. For example, caffeine metabolism can be
influenced by genetics, gender, age, and smoking status [9].
Variation in the cytochrome P450 1A2 gene (CYP1A2), which codes for the enzyme
responsible for caffeine metabolism, has been associated with different CVD outcomes.
2
Consumption of 4 or more cups of coffee per day has been associated with a significantly
increased risk of MI in those with the CYP1A2 -163C allele (slow metabolizers) while subjects
with the CYP1A2 AA genotype (fast metabolizers) experienced a protective effect with
moderate coffee consumption [10]. This modifying effect of CYP1A2 (rs762551) was also
supported by a prospective study on hypertension [11]. In addition to CVD, genetic variation in
CYP1A2 has been shown to play a role in modulating the association between caffeine and
several other health outcomes including Parkinson’s disease [12], breast cancer[13], and
osteoporosis [14]. However, due to the complexity of caffeine metabolism and other
confounders, the results of these studies are inconsistent. Therefore, the influence of caffeine
on disease-associated pathways is still unclear and must be studied more comprehensively to
better understand the potential health effects of caffeine.
Recent advances in proteomics allows for the targeted-quantification of numerous high-
abundance plasma proteins. Many plasma proteins are useful indicators of health and disease
risk [15]. Therefore, examining the relationship between caffeine intake and plasma proteins
may help identify proteins that are influenced by caffeine. Since these proteins represent
molecules from many physiologically important pathways, they can also provide insight into
pathways affected by caffeine intake. A study on dietary patterns showed that individuals
consuming different diets also have different plasma proteomic profiles, which may influence
the risk of developing diseases later in life [16]. However, to date, there is no published data on
the association between caffeine consumption and the plasma proteome.
3
The purpose of this thesis was to determine whether caffeine intake is associated with
the human plasma proteome. Because individuals with different CYP1A2 genotype exhibit
differences in caffeine metabolism (and to account for residual confounding), another focus of
this thesis was to determine whether the rs762551 polymorphism in CYP1A2 modifies any
association between caffeine intake and plasma proteins. An association between CYP1A2,
caffeine intake and the plasma proteome would indicate that a genetic subset of individuals is
more influenced by the effects of caffeine. Proteins that are associated with caffeine
consumption would also provide further understanding into disease-related pathways linked to
caffeine intake.
1.1.1 Thesis Organization
This thesis consists of four chapters. Chapter 1 provides an overview of recent
literature on caffeine as well as the benefits of applying proteomics towards nutrition research.
Chapter 2 discusses the association between caffeine intake and the plasma proteome, and the
modifying effect of CYP1A2. Chapter 3 explores the association between caffeine intake, the
plasma proteome and other caffeine-related genes. Chapter 4 summarizes the research and
identifies limitations as well as directions for future research.
1.2 Caffeine
1.2.1 Physical and Chemical Properties of Caffeine
Caffeine (1, 3, 7-trimethylxanthine) is a colourless and odourless powder at room
temperature [17]. It is a naturally occurring alkaloid that can be extracted from coffee beans,
tea leaves, cocoa beans, cola nuts and other plants via decaffeination [18]. In addition, caffeine
4
can also be synthesized chemically through methylation of other methylxanthines
(theobromine or theophylline) and synthesis from dimethyl urea and malinic acid [18]. Caffeine
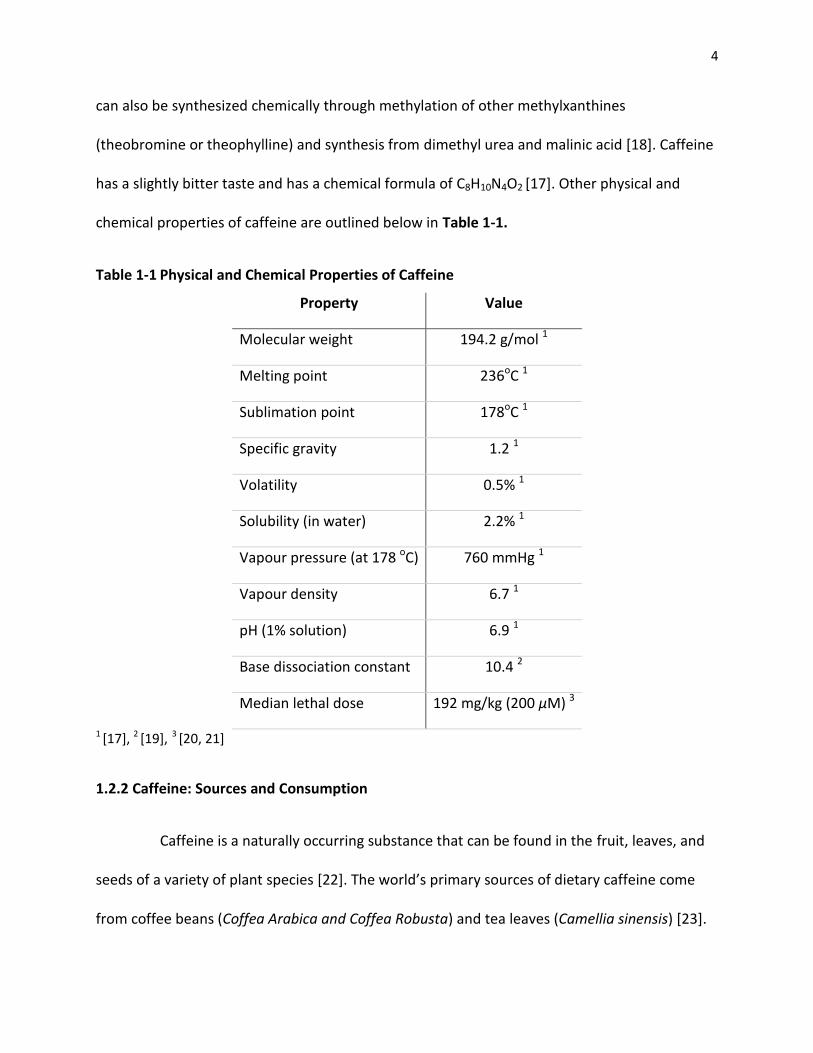
has a slightly bitter taste and has a chemical formula of C8H10N4O2 [17]. Other physical and
chemical properties of caffeine are outlined below in Table 1-1.
Table 1-1 Physical and Chemical Properties of Caffeine
Property Value
Molecular weight 194.2 g/mol 1
Melting point 236oC 1
Sublimation point 178oC 1
Specific gravity 1.2 1
Volatility 0.5% 1
Solubility (in water) 2.2% 1
Vapour pressure (at 178 oC) 760 mmHg 1
Vapour density 6.7 1
pH (1% solution) 6.9 1
Base dissociation constant 10.4 2
Median lethal dose 192 mg/kg (200 μM) 3
1 [17], 2 [19], 3 [20, 21]
1.2.2 Caffeine: Sources and Consumption
Caffeine is a naturally occurring substance that can be found in the fruit, leaves, and
seeds of a variety of plant species [22]. The world’s primary sources of dietary caffeine come
from coffee beans (Coffea Arabica and Coffea Robusta) and tea leaves (Camellia sinensis) [23].
5
Other common sources of caffeine include cacao bean (Theobroma cacao), kola nut (Cola
acuminate), guarana berries (Paullinia cupana), and yerba mate (Ilex paraguariensis) [23].
In North America, caffeine is most commonly consumed in the form of beverages such
as coffee (60%-75%) and tea (15%-30%) in the adult diet [20]. In comparison, caffeinated soft
drinks and chocolate contribute to the majority of caffeine intake in children [20]. With
caffeine’s increasing popularity, new caffeinated products such as energy drinks, sport drinks,
juices, waters, and snack items, have been developed over the past decade and have become
widely accepted by many individuals [22]. In addition to caffeinated foods and beverages,
caffeine can also be found in a variety of over-the-counter medications such as cold remedies
and analgesics as well as in dietary supplements [24]. Therefore, due to its widespread use and
availability, caffeine has often been referred to as the world’s most commonly used
psychoactive substance with intake levels exceeding that of alcohol and nicotine [21].
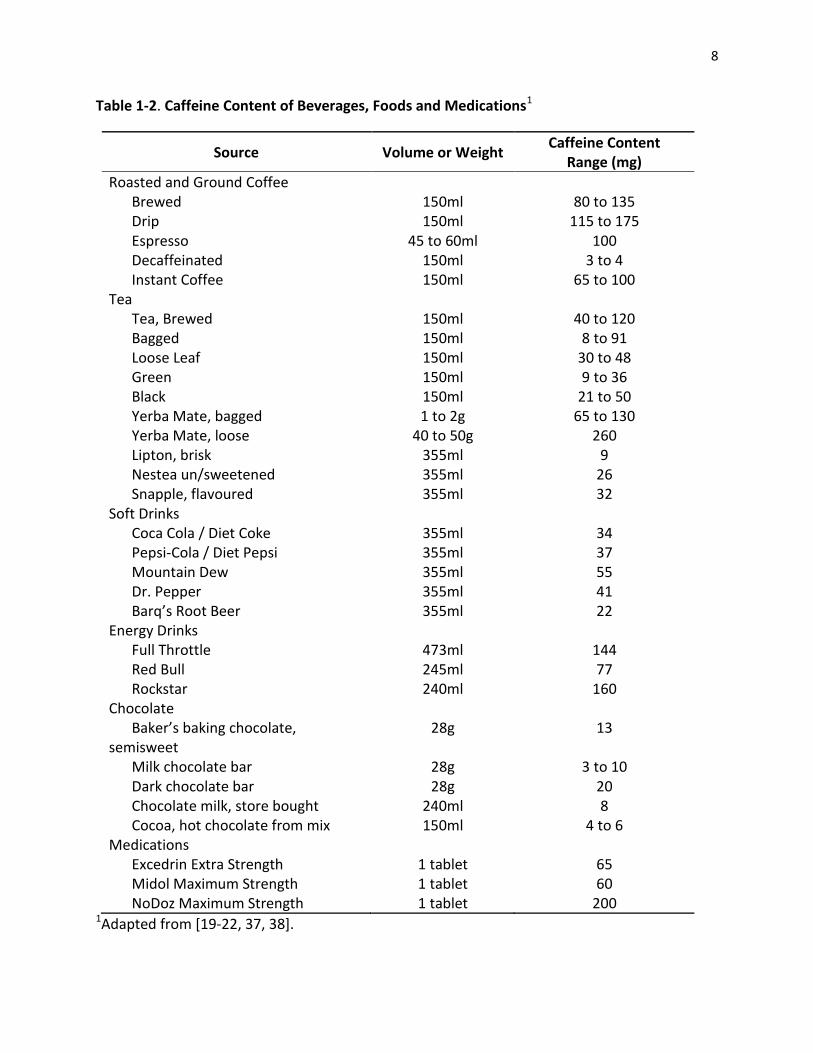
The amount of caffeine in foods and beverages is highly variable [20]. Overall, coffee
and energy drinks contain the most amount of caffeine on average while chocolate and other
cocoa confectionary products contain the least [25]. As shown in Table.1.2.2, there is also great
variability in caffeine concentration within the same type of product, especially for tea and
coffee. For example, the amount of caffeine in a cup of plain brewed coffee can range between
80-135 mg and the amount of caffeine in a cup of green tea can range between 9-36 mg (Table
1-2) [22]. This variability is often the result of plant variety, environmental growing conditions,
treatment, processing, storage, and preparation method [26]. Furthermore, caffeine
concentration can also vary by brand and purchase location [27-30]. A study analyzing the
6
caffeine content of coffees found that even between the same type of coffees purchased at the
same store, the amount of caffeine differed greatly depending on the time it was purchased
[31].
The pattern of caffeine consumption around the world also differs greatly between
populations. African countries such as Kenya and South Africa consume the lowest amount of
caffeine (50 mg/d), whereas adults from European countries such as Sweden and Finland may
reach an average daily intake of more than 400 mg caffeine [22, 23]. In the US and Canada, the
average intake of caffeine from all sources ranges from 210-238 mg/person per day, which falls
in the middle of the global caffeine intake spectrum [23]. The primary source of caffeine in
North America and many European countries is coffee, whereas tea is the beverage of choice in
the United Kingdom and some Asian countries [20]. Furthermore, the amount of daily caffeine
intake also varies by age. In Canada, adults consume about 2.4 mg/kg of caffeine daily, and
children consume 1.1 mg/kg of caffeine per day [32]. Based on extensive research on the health
effects of caffeine, Health Canada has also set out recommendations for caffeine consumption.
Specifically, a moderate intake of up to 400 mg of caffeine per day is not associated with
adverse effects in healthy adults; however, pregnant or nursing women, and children 13 years
of age and younger are recommended to not exceed 300 mg/d and 2.5 mg/kg of body weight,
respectively [20].
At the individual level, caffeine consumption patterns are also highly variable. Many
factors such as lifestyle, health, and social habits, have all been proposed to influence caffeine
consumption behaviours [33]. A study examining factors related to caffeine consumption found
7
that the time of day was an important predictor of caffeine intake. The arousing effects of
caffeine are often sought after by individuals at times when arousal is low such as during sleep
deprivation or post-prandial drowsiness [34]. In addition to environmental and social factors,
genetics also plays a role in both consumption behaviour and response to caffeine intake.
Specifically, a polymorphism in the adenosine A2A receptor (A2AR) gene (ADORA2A, 1976 T>C)
has been associated with caffeine-induced anxiety and habitual caffeine consumption [35].
Compared to carriers of the C allele, individuals with the TT genotype tend to consume lower
amounts of caffeine (<100 mg/d) and are more sensitive to caffeine-induced anxiety [35].
Furthermore, variation in the catechol-O-methyltransferease (COMT) gene that affects the
breakdown of epinephrine and norepinephrine, is found to be associated with an increase in
self-reported heart rate after caffeine consumption in those with the Met/Met genotype [36].
8
Table 1-2. Caffeine Content of Beverages, Foods and Medications1
Source Volume or Weight Caffeine Content
Range (mg)
Roasted and Ground Coffee Brewed 150ml 80 to 135 Drip 150ml 115 to 175 Espresso 45 to 60ml 100 Decaffeinated 150ml 3 to 4 Instant Coffee 150ml 65 to 100
Tea Tea, Brewed 150ml 40 to 120 Bagged 150ml 8 to 91 Loose Leaf 150ml 30 to 48 Green 150ml 9 to 36 Black 150ml 21 to 50 Yerba Mate, bagged 1 to 2g 65 to 130 Yerba Mate, loose 40 to 50g 260 Lipton, brisk 355ml 9 Nestea un/sweetened 355ml 26 Snapple, flavoured 355ml 32
Soft Drinks Coca Cola / Diet Coke 355ml 34 Pepsi-Cola / Diet Pepsi 355ml 37 Mountain Dew 355ml 55 Dr. Pepper 355ml 41 Barq’s Root Beer 355ml 22
Energy Drinks Full Throttle 473ml 144 Red Bull 245ml 77 Rockstar 240ml 160
Chocolate Baker’s baking chocolate,
semisweet 28g 13
Milk chocolate bar 28g 3 to 10 Dark chocolate bar 28g 20 Chocolate milk, store bought 240ml 8 Cocoa, hot chocolate from mix 150ml 4 to 6
Medications Excedrin Extra Strength 1 tablet 65 Midol Maximum Strength 1 tablet 60 NoDoz Maximum Strength 1 tablet 200
1Adapted from [19-22, 37, 38].

9
1.2.3 Pharmacokinetics of Caffeine
1.2.3.1. Absorption and Distribution
After ingestion, caffeine is rapidly and completely absorbed from the gastrointestinal
tract into the blood stream [39]. In healthy adults, the intake of a single dose of caffeine (4
mg/kg) is noted to reach peak plasma concentrations within 1-2 hours [40]. A concentration of
0.25 to 2 mg/l or approximately 1 to 10 µM is achieved after consuming a dose of 0.4 to
2.5 mg/kg caffeine, which is equivalent to consuming one cup of coffee [41]. The rate of gastric
emptying for caffeine can reach up to 90% within 3.5 hours after intake [42]. Depending on the
source of caffeine, the rate of absorption is also variable. For example, a study looking at the
rate of caffeine absorption found that caffeine’s pharmacological effects were experienced
fastest (within 5 to 10 minutes) when it was administered in the form of chewing gum [43].
Caffeine is also a lipophilic molecule that is able to pass through all biological
membranes and becomes readily distributed to all areas of the body [44]. After ingestion,
caffeine can be found in many bodily fluids such as plasma, cerebrospinal fluid, saliva, bile, and
breast milk [45]. Furthermore, the passage of caffeine through tissues is not limited by the
blood-brain barrier, and an equilibrium of caffeine can be continuously maintained between
the mother and her fetus [44, 46]. Therefore, pregnant women are advised to limit caffeine
intake as the fetus is readily exposed to caffeine and its potentially harmful effects [47].
1.2.3.2. Caffeine Metabolism
There are several routes of caffeine metabolism that take place primarily in the liver:
3-N-demethylation to paraxanthine (84%), 1-N-demethylation to theobromine (12%), and 7-N-
10
demethylation to theophylline (4%) [48]. Paraxanthine is the primary metabolite of caffeine and
shares a similar molecular structure and half-life with caffeine [49]. The level of paraxanthine in
the serum is less variable than caffeine throughout the day; however, its serum concentration is
not as sensitive as that of caffeine’s in response to recent intake [49, 50]. Theobromine
contributes to the greatest percentage of biologically active caffeine metabolites [51]. Similar to
caffeine, theobromine is rapidly absorbed into the body and has a serum half-life of 8-12 hours
[52]. The most important pharmacologic effects of this metabolite include stimulation of the
cardiovascular system, relaxation of smooth muscles and diuresis [53]. Theophylline, the third
major metabolite of caffeine also exhibits similar effects as caffeine in the body. However,
theophylline is more potent and has stronger toxicological effects than caffeine and
theobromine [54]. Furthermore, the half-life of theophylline is longer and more variable than
that of caffeine [54]. All three of the aforementioned caffeine metabolites undergo further
demethylations and oxidation to urates in the liver with about 3% remaining in the form of
caffeine in the urine [55, 56]. The cytochrome P450 1A2 (CYP1A2) enzyme is responsible for the
majority of caffeine metabolism in the liver, especially via the 3-N-demethylation pathway [48].
In addition to CYP1A2, other CYP isoforms such as CYP2E1, CYP2C8, CYP3A4, as well as N-
acetyltransferase and xanthine oxidase, are involved in the further breakdown of caffeine
metabolites as well [56, 57].
The rate of caffeine metabolism is affected by many factors. Lower doses of caffeine
intake (70-100 mg) show linear pharmacokinetics [41] while higher doses (250-500 mg) exhibit
significant delay in elimination half-life showing saturable metabolism [58]. The average half-
life of caffeine has been observed to be 2.5-5 hours [40]. However, the elimination of caffeine
11
shows large inter-individual variability and has been observed to have half-lives ranging
between 2.3-9.9 hours [39]. The large variability in caffeine half-life can be attributed to many
factors including age, sex, use of oral contraceptives, smoking, pregnancy, and health status
[59]. Newborn infants have the longest caffeine plasma half-life of 65-100 hours due to their
premature digestive and hepatic systems [60]. The rate of metabolism increases drastically with
the half-life of caffeine decreasing to 14 hours in infants between 3-5 months old [60]. At 6
months old, the metabolism of caffeine in infants becomes comparable to the rate of
metabolism in adults [60]. In addition to age, there is also evidence supporting gender
differences in caffeine metabolism. Females were shown to metabolize caffeine less efficiently
than males due to slower hepatic enzyme activity [61]. Female users of oral contraceptives also
have a caffeine half-life that almost doubles that of non-users [62]. In addition, the half-life of
caffeine has been noted to increase from 4 hours to 18 hours during the first and third
trimesters of pregnancy, respectively [44]. The rate of caffeine elimination, as observed by
Carillo and others, is two times faster in individuals smoking cigarette [63]. In contrast,
individuals with chronic liver disease and those who are long-term consumers of alcohol have
increased caffeine half-life [59, 64]. Many of the aforementioned factors are linked to variation
in CYP1A2 activity.
1.2.4 Cytochrome P450
1.2.4.1 CYP1A2 and Factors that Influence CYP1A2 Activity
CYP1A2 protein expression and activity have been shown to exhibit wide inter-individual
variation with more than 40-fold differences in liver CYP1A2 mRNA expression [65]. CYP1A2
12
belongs to a superfamily of heme-containing metalloenzymes that is involved in the
metabolism of a variety of exogenous and endogenous compounds [66]. While some CYP
enzymes are expressed in different tissues throughout the body, CYP1A2 is exclusively
expressed in the liver [66]. The active-site of CYP1A2 is narrow and planar. Therefore, only
planar molecules with polyaromatic rings, such as caffeine, can fit into the active-site of CYP1A2
[67]. In addition to caffeine, the substrates of CYP1A2 include a variety of drugs such as
clozapine [68] and olanzapine [69], and endogenous compounds such as estradiol [70] and
bilirubin [71]. CYP1A2 is also responsible for the bioactivation of several procarcinogens
including polycyclic aromatic hydrocarbons and aromatic heterocyclic amines [72, 73]. Table 1-
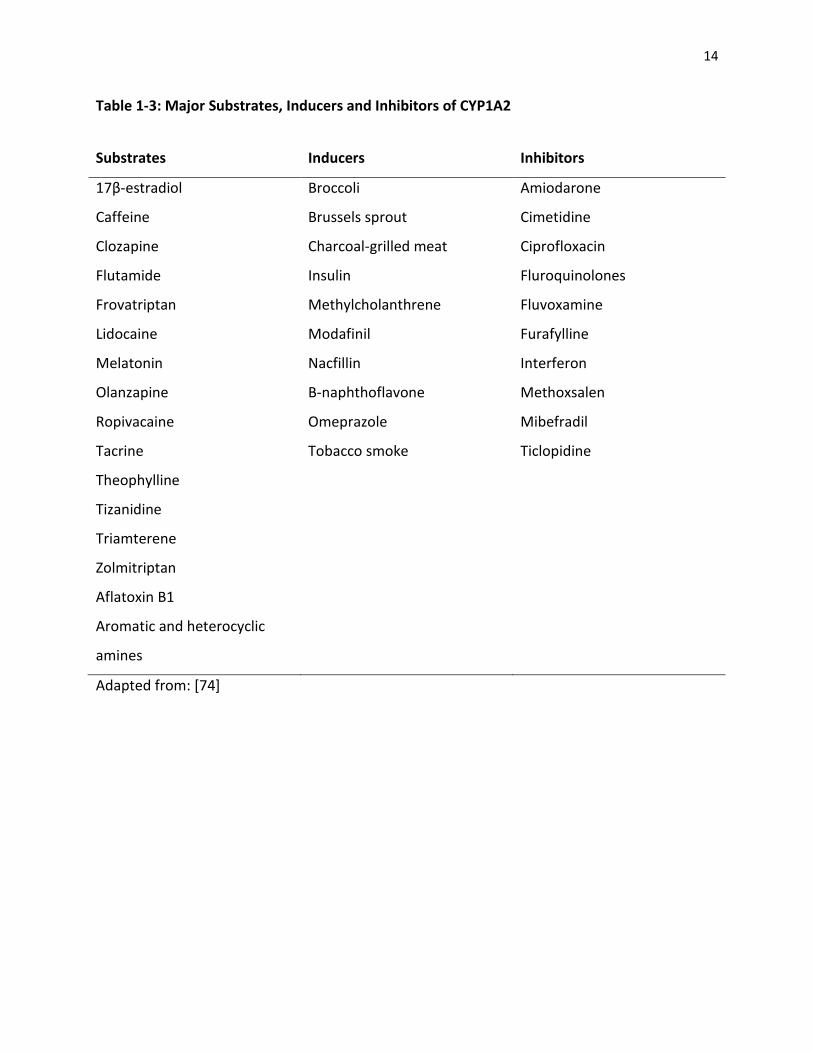
3 provides a list of the major substrates as well as inducers and inhibitors of CYP1A2.
CYP1A2 activity is influenced by numerous environmental factors that are associated
with differences in the rate of caffeine clearance [74]. A well-known potent inducer of CYP1A2
is cigarette smoke [75]. The polycyclic aromatic hydrocarbons present in tobacco smoke
activate the aryl hydrocarbon receptor [76]. Since the aryl hydrocarbon receptor is a
transcription factor that leads to the expression of the CYP1A2 gene, the rate of caffeine
metabolism is higher in smokers compared to non-smokers [76]. In contrast, exogenous female
sex steroids such as ethinyl estradiol and gestodene, which are used in oral contraceptives, are
known to inhibit and decrease CYP1A2 activity [77]. Therefore, users of oral contraceptives or
women with high levels of estrogen often experience delayed caffeine clearance [78].
Furthermore, many food-derived chemicals also modulate the expression and activity of CYP-
related enzymes [79]. Consumption of cruciferous vegetables such as broccoli and cauliflower,
have been shown to induce CYP1A2 activity while apiaceous vegetables such as carrots and
13
celery are known to inhibit CYP1A2 activity [80]. Intake of charcoal-grilled meat is also
associated with higher CYP1A2 activity in men [81]. In addition to dietary factors, heavy
exercise has been associated with enhanced hepatic drug metabolism as well [82]. A study
examining 30 days of vigorous exercise (8-11 hours/day) in male subjects noted a 70% increase
in CYP1A2 activity [83]. Ethnicity also plays a role in determining the efficiency of CYP1A2
activity and caffeine metabolism. Perera and colleagues observed that South Asian (Sri Lankan
and Indian) subjects have significantly lower CYP1A2 activity compared to European
participants [84]. Koreans, Chinese, and individuals of African descent also have slower CYP1A2
activity compared to Caucasians [85, 86]. Although CYP1A2 activity can be influenced by many
dietary and lifestyle factors, twin studies suggest that up to 70% of the observed variations in
CYP1A2 activity are due to genetics [87] .
14
Table 1-3: Major Substrates, Inducers and Inhibitors of CYP1A2
Substrates Inducers Inhibitors
17β-estradiol Broccoli Amiodarone
Caffeine Brussels sprout Cimetidine
Clozapine Charcoal-grilled meat Ciprofloxacin
Flutamide Insulin Fluroquinolones
Frovatriptan Methylcholanthrene Fluvoxamine
Lidocaine Modafinil Furafylline
Melatonin Nacfillin Interferon
Olanzapine Β-naphthoflavone Methoxsalen
Ropivacaine Omeprazole Mibefradil
Tacrine Tobacco smoke Ticlopidine
Theophylline
Tizanidine
Triamterene
Zolmitriptan
Aflatoxin B1
Aromatic and heterocyclic
amines
Adapted from: [74]
15
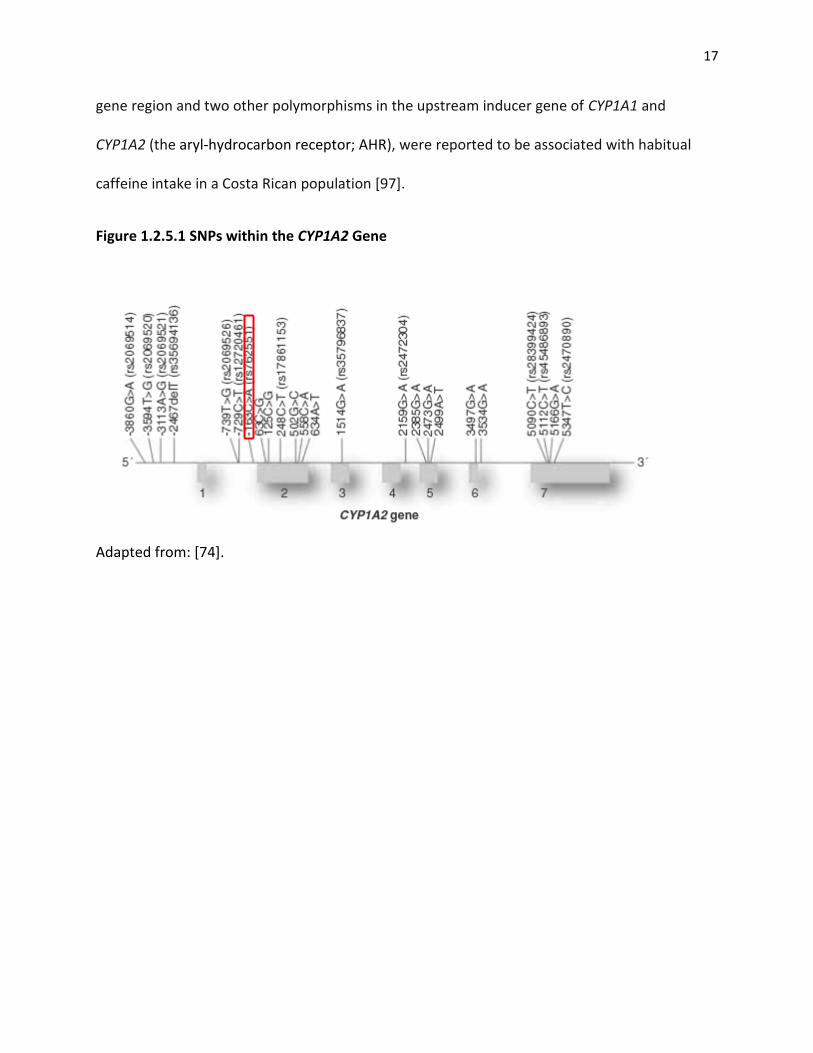
1.2.5 The CYP1A2 Gene
The CYP1A2 gene is part of the CYP1A cluster and is located on chromosome 15 at
15q24.1 [88]. CYP1A2 is the positive strand of the q-arm of chromosome 15 while CYP1A1 is the
negative strand [88]. These two genes are separated by a 23.3 kb spacer region while sharing a
common 5’-flanking region [88]. This spacer region is suggested to regulate the expression of
CYP1A2 and CYP1A1; however, the exact mechanism is unclear [89]. The CYP1A2 gene spans a
region of 7.8 kb, which includes seven exons and six introns [90]. Overall, the CYP1A2 gene only
produces one transcript, which translates into a protein of 516 amino acid residues (CYP1A2)
[88]. As shown in Figure 1.2.5.1, there are several single nucleotide polymorphisms within
CYP1A2, which are associated with altered CYP1A2 expression and activity.
1.2.5.1 Genetic Variation in CYP1A2
Since caffeine metabolism is mediated by CYP1A2 activity, variation in the gene coding
for this enzyme has been the focus of much research. As early as the 1960s, research has noted
variability in O-deethylation, which is a marker reaction for CYP1A2 [91]. More than 150 SNPs
have been identified for CYP1A2, and numerous studies involving multi-ethnic groups have
shown differences in minor allele distributions as well as common haplotype frequencies [74]. A
single AC nucleotide substitution within intron 1 at position -163 (rs762551) is one of the
most common CYP1A2 polymorphisms in Caucasians. The frequency of this polymorphism
ranges from 30% in the British population [92] to 70% in the Swedish population [86].
The -163A>C polymorphism in CYP1A2 has been associated with decreased enzyme
inducibility and activity among Caucasians [74]. A study examining this -163A>C polymorphism
16
reported that smokers who are carriers of the C allele metabolized caffeine at a rate that was
1.6-fold slower than individuals with the AA genotype [93]. Although this observation was
limited to smokers, later research on caffeine and the -163A>C polymorphism showed that
caffeine consumption alone is also an inducer of CYP1A2 in non-smokers [94]. Djordjevic and
colleagues demonstrated that heavy coffee consumption (>3 cups/day) is associated with
higher CYP1A2 inducibility in subjects homozygous for the A allele [94]. Therefore, genetic
variation in CYP1A2 is associated with the rate of caffeine metabolism and clearance. Carriers of
the C allele are ‘slow’ caffeine metabolizers [93] and tend to breakdown caffeine at a slower
rate. Individuals with the AA genotype are ‘fast’ caffeine metabolizers and can eliminate
caffeine from the body more rapidly than slow metabolizers [74].
In addition to modifying the rate of caffeine metabolism, CYP1A2 polymorphisms are
also associated with disease risk. Studies show that slow caffeine metabolizers have an
increased risk of developing myocardial infarction [10] and hypertension [11], whereas an
opposite effect was observed in fast caffeine metabolizers. A study by Guessous et al., [95]
found that non-smokers with the fast metabolizer genotype reported higher caffeine intake and
were 35% less likely to become hypertensive compared to non-smokers who are slow caffeine
metabolizers. Therefore, the capacity to break down caffeine may be a determinant in one’s
susceptibility to CVD events. However, the -163A>C polymorphism within CYP1A2 is associated
with caffeine metabolism and not caffeine consumption behaviour. A recent genome-wide
association studies (GWAS) suggested that the -163A>C variant is only mildly associated with
coffee consumption and that other variants within CYP1A2 may have a greater influence on
habitual caffeine intake [96]. A different polymorphism (rs6968865) in the CYP1A1-CYP1A2
17
gene region and two other polymorphisms in the upstream inducer gene of CYP1A1 and
CYP1A2 (the aryl-hydrocarbon receptor; AHR), were reported to be associated with habitual
caffeine intake in a Costa Rican population [97].
Figure 1.2.5.1 SNPs within the CYP1A2 Gene
Adapted from: [74].
18
1.3.1 Caffeine Pharmacology
1.3.1 Caffeine Mechanism of Action – the Adenosine Receptor Antagonist
The antagonistic effect of caffeine on the adenosine receptors (A1 and A2A) is the most
important pharmacodynamic property of caffeine. Adenosine is a purine nucleoside that can
increase or decrease cellular concentrations of cyclic AMP through its action on the adenosine
A1 and A2A receptors [59]. Adenosine has higher binding affinity for the A1 receptors that inhibit
adenyl cyclase, and lower binding affinity for the A2A receptors that stimulates adenyl cyclase
[59]. These receptors are present in many tissues throughout the body including the brain, the
respiratory, gastrointestinal, renal, and cardiovascular systems, as well as in adipose tissue [59].
Since adenosine is not produced and released from vesicles in response to the firing of neurons,
it does not meet the classical definition of a neurotransmitter [98]. However, similar to an
inhibitory neurotransmitter, adenosine acts to either reduce the activity of excitatory tissues
such as the brain and the heart, or induce vasodilation that increases the delivery of metabolic
substrates [99]. Furthermore, adenosine also elicits sedation and anticonvulsant activities
through reducing the spontaneous firing of neurons in different regions of the brain [100]. The
binding of adenosine to A2A receptors inhibits the release of many neurotransmitters including
acetylcholine, norepinephrine, dopamine, gamma amino butyric acid and serotonin [98]. The
structure of caffeine (double ring) is very similar to adenosine thereby making caffeine a non-
selective adenosine receptor antagonist [101, 102]. Under normal physiological conditions,
caffeine has high affinity for the A1 and A2a receptors, and competes with adenosine for binding
to these receptors [103]. Through the competitive inhibition of adenosine receptors, caffeine
19
effectively increases the release of many neurotransmitters, which affects neurotransmission in
different regions of the brain [48, 104]. For example, caffeine consumption increases the level
of circulating catecholamines (norepinepherine, epinephrine and domapine) and serotonin in
the brain [104]. Overall, caffeine’s effects on the body are the reversal of those normally
achieved by the binding of adenosine to its receptors [105]. Stimulatory effects such as
increased arousal and alertness are produced after consuming caffeinated foods and beverages
[105]. However, the extent of these effects varies greatly between individuals, and is partially
explained by genetic variation in the pathways of caffeine metabolism [35]. Polymorphisms in
the adenosine A1 and A2A receptors and dopamine D1 and D2 receptors have been associated
with self-reported anxiety [35, 106].
Other mechanisms of action, such as the mobilization of intracellular calcium to
enhance neurotransmission [107] and the inhibition of phosphodiesterase activity [108], have
been proposed for caffeine as well. However, studies show that the levels of caffeine intake
required to mobilize calcium and inhibit phosphodiesterase are extremely high and are toxic to
humans [107, 109, 110]. In contrast, the concentration of caffeine required to antagonize
adenosine receptors is much lower and can be achieved with normal dietary doses (10-100 µM)
[110]. Therefore, the competitive antagonism of adenosine receptors remains the most
plausible explanation for the physiological effects of caffeine.
1.3.2 Physiological and Psychological Effects of Caffeine
Caffeine produces subjective and behavioural effects that are similar to those
produced by classical psychostimulant drugs such as amphetamine and cocaine, which are
20
dopaminergically mediated [110]. Depending on the dosage and frequency of caffeine intake,
several physiological effects may occur. Positive experiences such as increased alertness,
concentration, arousal, and enhanced cognitive performance have been associated with low to
moderate (200-300 mg) caffeine consumption [111, 112]. A recent study demonstrated that
caffeine, as a central nervous system stimulant, was able to facilitate cognitive function through
a proofreading task [113]. A systemic review of 13 randomized trials in subjects with shift work
disorder or jet lag also observed that compared to placebo, those that consumed caffeine were
much better at reasoning, recall, orientating, and forming concepts [114]. Therefore, the
desirable physiological effects produced by caffeine can often lead to dependence and
reinforcing behaviours in those that consume it [115]. Indeed, there are studies providing
clinical evidence for caffeine dependence syndrome [116, 117]. In contrast, unpleasant effects
such as increased anxiety, nervousness, and tension are experienced by some caffeine
consumers as well [37].
Dose-response to caffeine varies greatly between individuals. Some caffeine consumers
may experience instant discomfort such as headaches or sleeplessness after only a single cup of
coffee [118]. On the contrary, through increased exposure, many other coffee consumers
continue to experience the pleasant effects of caffeine even after drinking several cups of
coffee [118]. Tolerance to the acute effects of caffeine can develop rapidly, and habitual
consumers experience the effects of caffeine much differently compared to those that consume
caffeine infrequently [91]. The difference in susceptibility to caffeine’s effects may occur at the
metabolic or at the drug-receptor level, which may be influenced by demographic and
environmental factors [91]. In particular, genetic predisposition has become an important
21
source of variability and a key topic of caffeine research in recent years [91, 118]. A study on
habitual caffeine consumption showed that genetic polymorphism in the adenosine A2A
receptor (ADORA2A) rather than CYP1A2 is associated with regular caffeine consumption [35].
Individuals who are carriers of the ADORA C allele were more likely to consume more caffeine
than those homozygous for the T allele [35]. Similarly, a study on the catechol-O-
methyltransferase gene (COMT) and caffeine consumption showed that self-reported increased
heart rate after consuming caffeine was associated with COMT genotype. The authors
suggested that individuals who have an impaired ability to breakdown catecholamines are more
likely to experience increased heart rate [36].
Caffeine withdrawal is another condition to be considered when examining caffeine’s
effect on the body. Withdrawal symptoms such as lethargy, depression and irritability, often
occur after12-24 hours of caffeine abstinence [119]. Flu-like symptoms such as nausea,
vomiting, and muscle stiffness are also associated with caffeine withdrawal in some individuals
[119]. Furthermore, the severity of withdrawal symptoms appears to be positively associated
with the amount of usual caffeine intake; however, a modest consumption of 100 mg/d has
been associated with withdrawal as well [119]. The prevention or relief of withdrawal
symptoms can be achieved with as little as 25 mg of caffeine [120]. Therefore, some have
argued that the positive effects associated with caffeine intake may be simply the reversal of
the adverse effects of caffeine withdrawal [121]. In contrast, others have also suggested it is
the combination of both reinforcing effects and the reversal of withdrawal that is responsible
for caffeine intake behaviours [34, 122].
22
In addition to the aforementioned effects, caffeine intake has also been associated with
diuresis, cerebrovascular constriction, increased lipolysis, increased respiratory rate and
bronchodilation, increased gastric secretion, and enhanced athletic performance [59, 110, 123].
Moreover, caffeine intake also adversely affects sleep quality and increases daytime sleepiness
[59, 124, 125]. Overall, sensitivity to caffeine dose and effects is highly variable between
individuals, which may be explained by differences in pharmacokinetics [56] and genetics [74].
1.4 Caffeine Intake and Associated Health Outcomes
As the most widely consumed stimulant in the world, caffeine’s influence over disease
risk has been studied extensively. Consumption of caffeinated beverages has been associated
with both beneficial and adverse health outcomes; however, results have been inconsistent.
Therefore, based on current data, there is insufficient evidence to either promote or discourage
the use of caffeine as part of one’s daily diet. Nevertheless, Health Canada recommends
limiting consumption to a daily intake of no more than 400 mg for healthy adults and no more
than 300 mg for pregnant or nursing women[126].These recommendations are based on early
studies linking caffeine intake to CVD [126]. For children less than 12 years old, the
recommended intake levels are based on a daily dose of 2.5 mg/kg of body weight (which was
shown to be safe in young adolescents) and the average body weight of children
[126].Behavioural effects such as hyperactivity and increased anxiety were also considered in
these recommendations [126].With a rise in the number of caffeinated products being
marketed to consumers [122], it is necessary to further investigate caffeine’s effects on the
body and its impact on disease-associated pathways. Since genetic variation in CYP1A2 is
23
known to modify the associations between caffeine intake and certain health outcomes, it is
also necessary to examine the influence of genetics on the complex relationship between
caffeine and disease risk. The following section is a summary of some of the most studied and
controversial health outcomes related to caffeine consumption.
1.4.1 Caffeine and Cardiovascular Diseases
Cardiovascular-related complications are among the leading causes of death around
the world [5]. The onset and pathogenesis of cardiovascular diseases (CVD) are complex and
multi-faceted. Health conditions such as high cholesterol, high homocysteine level,
atherosclerosis and arterial calcification are all categorized as risk factors for CVD [127]. As
suggested by the American Heart Association, even a modest modification to diet and lifestyle
can be beneficial for reducing cardiovascular risk [128]. Although many epidemiological studies
have examined the relationship between caffeine intake and CVD, results are still controversial
[129]. The most well-known effect of caffeine on the cardiovascular system is its ability to
induce arterial stiffness, which can increase blood pressure [5].
As the consumption of caffeinated foods and beverages continues to increase, any
possible relationship between caffeine intake and CVD may be significant towards the overall
burden of the disease. To date, results of epidemiological studies have demonstrated inverse
associations [130-133], positive associations [134-138], no association [139-143], U- and J-
shaped associations [144-146], as well as sex-specific associations [147-151] between caffeine
intake and CVD. For example, a recent dose-response, meta-analysis on habitual coffee
consumption and the risk of heart failure found that consuming 4 servings of coffee per day is
24
inversely associated with the risk of heart failure [152]. Another meta-analysis of 21 prospective
cohort studies conducted between 1966 and 2008 showed no differences in the relative risks of
developing coronary artery disease between different levels of long-term coffee consumption
[8]. Instead, long-term coffee consumption was associated with a significant decrease in
coronary artery disease in both men and women at 10-year follow-up [8]. Although the results
of this meta-analysis are in agreement with previous meta-analyses on prospective cohort
studies, conflicting findings are seen in case-control studies [153]. Case-control studies
examining the association between caffeine intake and CVD often show a significant increase in
CVD risk as caffeine consumption increases [153]. The inconsistencies between prospective
cohort and case-control studies may be due to the difference in the duration of time between
exposure and outcome. Studies show that caffeine consumption is more likely to elicit an acute
onset cardiovascular event [134, 154, 155], and does not contribute to the development of
chronic CVD risk factors such as diabetes [156, 157] or atherosclerosis [139, 151]. Therefore,
short-term case-control studies are more likely to capture the acute effects of caffeine leading
to a positive association between caffeine consumption and CVD development. In contrast, the
acute effects of caffeine are attenuated or less pronounced in prospective studies of long-term
coffee consumption. Happonen et al. [135] showed that the risk of acute coronary events
decreased in men consuming moderate amounts of coffee at 14 year follow-up compared to 5
year follow-up. In addition to differences in study design, other associated lifestyle factors such
as smoking and chronic alcohol abuse may also contribute to the overall risk for CVD. Kleemola
and colleagues noted that the increase in mortality from coronary heart disease in men who are
heavy coffee drinkers is mainly attributed to the effects of smoking and high serum cholesterol
25
levels [146]. Adjustments for these factors resulted in lower risk ratios of CVDs in heavy coffee
drinkers compared to non-drinkers [146]. Therefore, inadequate adjustments for confounding
factors may have also lead to discrepancies in studies on caffeine and CVD.
1.4.1.1 Caffeine, CYP1A2, and Cardiovascular Diseases
Genetics is another major contributing factor towards the variability seen in caffeine
consumption and CVD risk. The influence of genetic variation in CYP1A2 on coffee consumption
and the risk of myocardial infarction (MI) was studied by Cornelis et al. [10] in a Costa Rican
population. Results of this case-control study showed that subjects with the slow metabolizer
genotype were at an increased risk of developing MI as they consumed 2 or more cups of
coffee per day. In comparison, subjects that metabolize caffeine at a faster rate (fast
metabolizers) experienced a protective effect as they consumed coffee at a moderate level (1-3
cups/d)[10]. The authors suggested that the increased risk among slow metabolizers can be
attributed to caffeine alone as variation in CYP1A2 genotype has not been associated with any
potential lifestyle confounders, and caffeine is the sole substance in coffee that is metabolized
via CYP1A2 [10]. The results of this study were supported by another study examining the
modifying effect of CYP1A2 genotype on coffee consumption and the risk of hypertension [11].
Similarly, this prospective study showed that slow caffeine metabolizers were at an increased
risk of developing hypertension compared to fast metabolizers with increasing coffee
consumption [11]. The protective effect of moderate coffee consumption on CVD risk in the fast
metabolizers seen in both studies could be explained by the unmasking of beneficial
compounds such as antioxidants in coffee [158]. These two studies also suggest that variation in
26
CYP1A2 indicates that the associations are not likely due to residual confounding since any
unaccounted for exposures associated with caffeine intake should be similar between fast and
slow metabolizers. Therefore, it is important to stratify subjects by CYP1A2 genotype in studies
involving caffeine.
1.4.2 Caffeine and Parkinson’s disease
Although the effect of caffeine on CVD risk is debatable, caffeine consumption has
been associated with significant decreases in other chronic disease such as Parkinson’s disease
(PD). An inverse association between caffeine and PD has been observed in several
epidemiological studies [159-161]. PD is a neurodegenerative disorder resulting from the death
of dopaminergic neurons in the brain [162]. Current research on PD has put a strong emphasis
on identifying adenosine A2A receptor antagonists, such as caffeine, that may have the potential
to delay dopaminergic neurodegeneration [162]. A 30-year follow-up study by Ross and
colleagues showed that high caffeine intake was associated with a significant decrease in the
development of PD [159]. Specifically, the risk of PD in men who consumed 28 oz or more
coffee per day was five times lower than men who consumed no coffee after adjusting for age
and smoking status [159]. The results of that study were supported by several large prospective
studies, which all consistently showed an inverse association between caffeine intake and the
risk of PD [161, 163].
1.4.2.1 Caffeine, CYP1A2, and Parkinson’s disease
Similar to caffeine’s relationship with CVD, differences in metabolism due to genetic
variation in CYP1A2 have also been studied in regards to PD. Since slow caffeine metabolizers
27
experience an extended duration of caffeine exposure, the neuroprotective effects of caffeine
would also be expected to be more pronounced in slow caffeine metabolizers. To date, studies
have not shown any significant differences between slow and fast metabolizers on the
protective effects of caffeine on PD [164, 165]. However, the number of studies on caffeine,
CYP1A2, and PD is limited and adjustments for confounders are also lacking in these studies.
For instance, Popat et al. [164] did not adjust for smoking status, which is a known inducer of
CYP1A2 that can increase the efficiency of caffeine metabolism in certain individuals [93].
Therefore, further understanding of the pathways and mechanisms behind caffeine’s effect on
PD risk is warranted.
1.4.3 Caffeine and Breast Cancer
The association between caffeine and breast cancer is also unclear. Some studies show a
lower risk for breast cancer with coffee consumption [166-168], while others suggest no
association [169, 170]. For instance, a case-control study of 1,932 breast cancer cases and 1,985
controls reported that caffeinated-coffee consumption was associated with a 40% decrease in
breast cancer risk [166]. In contrast, another prospective cohort study from the Women’s
Health Study showed no association between breast cancer and coffee consumption [170].
However, because breast cancer is a multifactorial disease with complex etiology [171], many
potential confounders exist making studies on breast cancer and caffeine intake challenging.
The mechanism by which caffeine may affect breast carcinogenesis is also uncertain as caffeine
has been shown to stimulate and suppress the development of mammary tumors in animal
studies [172]. Furthermore, there are also no randomized controlled trials on caffeine
28
consumption and breast cancer as long-term caffeine consumption is difficult to measure and
the latency period for breast cancer is also variable [173, 174].
1.4.3.1 Caffeine, CYP1A2, and Breast Cancer
The modifying effect of CYP1A2 genotype on caffeine intake and health has also been
reflected in breast cancer development. A cross-sectional study of 195 women showed that
CYP1A2 activity is associated with several breast cancer risk factors including free estradiol
levels, blood lipids, sex hormone binding globulin levels, and body size [175]. Although this
study suggested that increased CYP1A2 activity is positively associated with many factors that
increase breast cancer risk, the level of CYP1A2 enzyme activity was measured instead of
stratifying subjects based on genotype [175]. To further understand the role of CYP1A2 in
breast cancer development, Kotsopoulus et al. [13] utilized a genetics approach and reported
that carriers of the BRCA1 mutation were 64% less likely to develop breast cancer if they have
the slow metabolizer genotype and consumed coffee regularly. However, no protective effect
was observed among fast metabolizers. Another study on breast volume and CYP1A2 genotype
also observed that moderate to high coffee consumption in women who are slow caffeine
metabolizers is associated with lower breast volume [176]. Previous studies have shown that
small breast size in lean women is associated with a decreased risk of breast cancer [177, 178].
Overall, results from the aforementioned studies have demonstrated the protective effect of
regular coffee consumption on breast cancer development, which is primarily restricted to slow
caffeine metabolizers [176]. In contrast, there are also studies showing no association between
CYP1A2 genotype, coffee consumption and breast cancer risk. For example, a recent case-
29
control study by Lowcock et al., [179] found that the rs762551 SNP in CYP1A2 did not modify
the association between coffee or caffeine intake and breast cancer risk. Therefore, the
relationship between caffeine and breast cancer remains uncertain and requires further
investigation.
1.4.4 Caffeine and Type 2 Diabetes
Another beneficial health effect associated with coffee consumption is the decreased
risk of type 2 diabetes [180]. A prospective study in Germany showed that in comparison to
drinking one cup of coffee per day, coffee consumption of more than four cups per day was
associated with a decreased risk of type 2 diabetes and did not increase the risk for CVD or total
cancer risk [181]. Results from a meta-analysis also showed that coffee consumption is
inversely associated with type 2 diabetes [180]. However, the observed decrease in diabetes
risk was similar for both caffeinated and decaffeinated coffee suggesting that constituents of
coffee other than caffeine, such as antioxidants and minerals, may be responsible for this effect
[182].
1.4.5 Caffeine and Health Summary
In summary, the pharmacological effects of caffeine have influences over multiple
systems in the body. The acute effects of caffeine may be harmful towards cardiovascular
health while long term consumption has been shown to be protective against PD and breast
cancer risk, which may be modulated by CYP1A2 genotype. Inconsistent results from the many
epidemiological studies of caffeine and disease risk demand further research into the
underlying mechanisms and pathways, which may help to clarify the relationships between
30
caffeine and disease outcome. The following section on proteomics describes one such
approach towards the understanding of biological processes related to caffeine.
1.5 Proteomics – an Approach towards Understanding the Influence of Diet on Health
Nutrition plays an influential role in the early stages of disease development, but the
underlying mechanisms and biological pathways are not well understood. The complexity of
diet and its bioactive components make identifying the roles and actions of food components in
the body a challenging task; yet traditional experimental methods are too limited in their ability
to study the interactions between diet and disease [183]. The emerging field of nutrigenomics,
which combines genetics techniques with ‘omics’ research (proteomics, metabolomics),
presents a significant advantage towards understanding the complex relationships between
diet and disease on the biochemical and molecular level [184]. Specifically, proteomics has
been used as a strategy for studying the expression of multiple proteins at a given time point
and characterizing the status of cells, tissues, and organs under specific biological conditions
[185]. This type of approach is appropriate for nutrition research as it examines the functional
product (protein) of gene expression rather than simply measuring the transcriptional status of
DNA via methods such as gene arrays [184]. Therefore, proteomics is also useful towards
evaluating the consequences of dietary interventions.
1.5.1 Proteomics and Nutrition Research
Protein expressions within an organism are often influenced by the interactions
between the genome and the environment such as diet [183]. Proteomics, as a quantitative
technique, is a preferred approach for determining the effects of such influences [183]. Plasma,
31
lymphocytes, and platelets, can all be easily extracted from the blood for analysis [186]. The
proteome is a full collection of proteins expressed by the human genome and the plasma has
been described as “the largest version of the human proteome in one sample” [187]. The
plasma contains more than 106 different molecules representing the products of approximately
30,000 genes [187]. Therefore, the human plasma provides an invaluable resource for the
identification of disease markers and pathways [188]. Biomarkers are important for health
research as they reflect the adequacy of nutrition, monitor the progression of disease, and
detect responses to dietary or medicinal interventions [183].A proteomics approach was also
used in a study examining the effects of fish oil, conjugated linoleic acid, and elaidic acid on
lipid and glucose metabolism [189]. Using an animal model, this study found that
supplementing dietary fatty acids decreased plasma cholesterol levels; however, the level of
insulin did not increase consistently across all three types of fatty acid supplementation [189].
This study also identified 65 cystolic and 8-membrane proteins that are significantly regulated
in pathways related to lipid and glucose metabolism as well as oxidative stress, which
demonstrates another advantage of using proteomics in nutrition research [189]. This study
showed that the use of proteomics along with biological standards was beneficial towards
gaining a deeper understanding of the mechanisms behind dietary fatty acid intake and lipid
metabolism.
1.5.2 Proteomics – the Search for Biomarkers
In addition to assessing dietary interventions, changes in plasma protein concentrations
are also reflective of health conditions and disease risk [184]. The composition or concentration
32
of plasma proteins is thought to differ under various physiological conditions such that most
abnormalities of the body are reflected by the plasma proteome [187]. Therefore, the
comparison of a panel of independent disease-related proteins is especially useful towards the
evaluation of disease risk and health response. Studies searching for biomarkers of CVD have
identified a wide array of proteins including C-reactive protein and homocysteine that are
closely associated with CVD risk and outcomes [187]. In addition to identifying traditional or
well-known biomarkers [190], proteomics is also a useful tool for the discovery of novel links
between less studied plasma proteins and various health conditions. For example, a cross-
sectional study on hormonal contraceptive use and the plasma proteome identified several
proteins that differed in concentration between users and non-users that have not been
examined in previous research [191]. These proteins belong to various physiological pathways
that may be involved in inflammation, coagulation and blood pressure [191]. Therefore, in
addition to the traditional effects of hormonal contraceptives on the cardiovascular system, this
study provided insight into novel pathophysiologic effects of hormonal contraceptive use [191].
Studies examining the association between dietary intakes of vitamin C [192] and vitamin E
[193] and disease risk have also identified plasma proteins from several different physiological
pathways that are associated with these vitamins. In addition to vitamin C’s anti-inflammatory
properties and its association with acute-phase proteins [194], vitamin C was found to be
inversely related to circulating levels of vitamin D binding protein [192]. Therefore, with the aid
of proteomics, vitamin C is suggested to have unknown roles in pathways related to vitamin D
physiology [192]. Furthermore, proteomics has also been used in cancer detection [195] and
the identification of new biomarkers related to cardiometabolic disease [187].
33
1.5.3 Proteomics Techniques
Since a comprehensive analysis of proteins in the body can help further elucidate the
biological roles of proteins and identify changes in physiological pathways triggered by food
components in the diet, it is important to understand the nature of techniques employed in
proteomics research [184]. Traditional methods such as two-dimensional (2D) gel
electrophoresis followed by mass spectrometry are widely used in proteomic studies [196].
These methods play an important role in the identification of proteins as they can provide a
physical separation of polypeptides, which gives information on the molecular weight, iso-
electric point, and other parameters that are characteristic of the protein [196]. However, 2D
gel electrophoresis is unable to capture the dynamic range of protein concentrations in the
human plasma [184]. Protein concentrations in the plasma can vary up to 10 orders of
magnitude in humans [184]. For example, the concentration of albumin in the plasma is ~5.5 x
1010 pg/ml while the concentration of interleukin-6, a cytokine involved in inflammation, is ~1-5
pg/ml [187, 197]. Thus, the sensitivity of traditional proteomic methods may be limited and
insufficient for measuring the effects of certain food components on the plasma proteome.
Newer technologies have been developed in recent years, which greatly advanced the
field of proteomics. These advancements have helped identify many clinically useful biomarkers
in a sensitive and specific manner. In particular, mass spectrometry-based multiple reaction
monitoring (MRM), is one such method that enables the targeted quantification and profiling of
several proteins in complex biological samples [198]. MRM involves a two-stage filtering
process starting with the ionization and fragmentation of all peptides in a given sample. After

34
peptide fragmentation, the second filtering process only allows for a small number of
sequence-specific fragment ions to be mass-analyzed instead of a full scan of all possible
peptide fragments as usually completed in traditional mass spectrometry methods [199, 200].
With the addition of stable isotope labeled peptides as synthetic internal standards, the
concentration of the protein of interest can be measured by comparing signals from exogenous
labeled and endogenous unlabeled fragments [199, 200]. Because the exogenous (synthetic
internal standards) and endogenous (protein of interest) fragments have the same
physiochemical properties, they will only differ by mass [199, 200]. Therefore, unlike traditional
mass spectrometry methods, MRM is highly selective and allows for the identification for
specific peptides or protein fragments of interest. This method can be used to determine the
absolute concentration of peptides across a dynamic range of up to 104 [199, 200].
1.5.4 The Proteomics Panel
In the current project, mass-spectrometry based MRM was used to measure the
concentration of 54 high-abundance plasma proteins representing molecules from various
physiological pathways (Table 1-4). Previous research showed that the concentration of these
proteins vary across ethnic groups and those with different dietary habits [16]. Therefore, it
was of interest to see whether caffeine intake and variation in CYP1A2 also influence the
concentration of these proteins.

35
Table 1-4: Proteomics Panel – 54 High Abundance Plasma Proteins
Hemostasis Lipid metabolism Amyloid diseases Innate immunity Transmembrane
transport Signal transduction Other
Plasminogen Apolipoprotein A-IV Apolipoprotein A-IV Complement factor B Transferrin Plasminogen Alpha-1B-
glycoprotein Coagulation factor XIIa HC Apolipoprotein C-III Plasminogen Complement factor H Apolipoprotein A-I Vitronectin Alpha-2-antiplasmin
Alpha-1-Anti-trypsin Vitamin D-binding
protein Serum amyloid P-
component ComplementC9 Albumin Angiotensinogen
Alpha-1-antichymotrypsin
Fibrinogen gamma chain Apolipoprotein A-II
precursor Prothrombin
Complement C4 beta chain
Ceruloplasmin Prothrombin Adiponectin
Fibrinogen beta chain Albumin Transthyretin L-selectin Complement C3 Afamin
Kininogen-1 Apolipoprotein E Apolipoprotein A-I Complement C3 Fibrinogen gamma chain Alpha-1-acid
glycoprotein 1
L-selectin Angiotensinogen Gelsolin, isoform 1 Fibronectin Alpha-2-HS-glycoprotein
Complement C1 inactivator Apolipoprotein A-I Fibrinogen alpha chain Alpha-2-macroglobulin Apolipoprotein A-IV
Apolipoprotein B-100 Apolipoprotein B-100 Fibrinogen beta chain Apolipoprotein C-I
Transferrin Kininogen-1 Apolipoprotein C-III
Clusterin Fibrinogen alpha chain Apolipoprotein D
Albumin Apolipoprotein L1
Prothrombin Zinc-alpha-2-glycoprotein
Antithrombin-III Beta-2-glycoprotein I
Apolipoprotein A-I Complement C4
gamma chain
Fibronectin Vitamin D-binding
protein Histidine-rich glycoprotein Fibrinopeptide A
Alpha-2-macroglobulin Heparin cofactor II
Alpha-2-antiplasmin Haptoglobin beta
chain
Fibrinogen alpha chain
Hemopexin Inter-alpha-trypsin
inhibitor HC Vitronectin
36
1.6 Hypothesis, Objectives, and Thesis Organization
The main goal of the research presented in the following chapters is to further
understand the effect of caffeine intake on biological pathways in the body. A proteomics
approach is used to identify proteins in the plasma that may be influenced by different levels of
caffeine intake. Since the rs762551 SNP in CYP1A2 is known to modify caffeine metabolism, it is
also of interest to determine whether slow and fast caffeine metabolizers exhibit differences in
plasma proteomic profiles with different levels of caffeine consumption. The results of this
research may help identify potential biomarkers in disease-related pathways that are
associated with caffeine intake. Overall, it is hypothesized that different levels of caffeine intake
are associated with differences in the plasma proteome, which may be modified by the
rs762551 SNP of CYP1A2.
Objective 1 (Chapter 2): To determine the association between caffeine intake and the plasma
proteome, and whether the CYP1A2 polymorphism (rs762551) modifies any associations.
Objective 2 (Chapter 3): To determine whether any proteins associated with caffeine intake
from Objective 1 are modified by polymorphisms in other caffeine-related genes.
37
Chapter 2: Association between caffeine intake and the plasma
proteome in humans
2.1 Abstract
Caffeine intake has been associated with both an increased and decreased risk of various health
conditions. However, many of the physiological pathways affected remain unclear. CYP1A2 is
the major enzyme that metabolizes caffeine and a single nucleotide polymorphism (rs762551)
affects the rate of caffeine metabolism. The main objective of this study was to determine the
association between caffeine intake and the plasma proteome and whether CYP1A2 genotype
modifies any association. Subjects (n=1095) aged 20-29 years from the Toronto Nutrigenomics
and Health Study completed a 196-item semi-quantitative food frequency questionnaire and
provided a fasting blood sample from which DNA and plasma were obtained for genotyping and
proteomics analysis. Fifty-four proteins were measured by mass spectrometry multiple reaction
monitoring (MS-MRM). Subjects were categorized into three groups according to habitual
caffeine intake (<100 mg/d, 100-200 mg/d, and >200 mg/d) and stratified by CYP1A2 genotype.
Among carriers of the C allele (slow metabolizers), plasma concentrations of gelsolin isoform 1
were significantly (P<0.005) lower among those in the highest category of caffeine intake
compared to those with the lowest level of intake. No differences in protein concentration
were observed for AA homozygotes (fast metabolizers). These findings show that caffeine
intake is associated with lower gelsolin levels only among slow caffeine metabolizers, and
suggest that gelsolin might mediate some of the biological effects of caffeine.
38
2.2 Introduction
Caffeine (1, 3, 7-trimethyxanthine) is the most popular stimulant used around the world
and is found in many commonly consumed beverages [1]. More than 80% of the world’s
population consumes caffeine regularly [2]. Caffeine consumption has multiple systemic effects
and has been associated with several diseases including those of the cardiovascular,
neuropsychiatric, and endocrine systems [180, 201, 202]. Although numerous studies have
examined the effects of caffeine on the risk of various diseases, the results have been
inconsistent [134, 145, 203, 204]. Genetic variation that influences caffeine metabolism may
modify the association between caffeine intake and disease risk [10, 11].
Cytochrome P450 1A2 (CYP1A2) is responsible for the majority of caffeine metabolism
in the liver [48]. This enzyme is encoded by the CYP1A2 gene on chromosome 15q24.1 and
plays an important role in the metabolism of drugs, caffeine, and environmental toxins [9].
Over 95% of caffeine is metabolized through demethylation by CYP1A2 in the liver [56]. CYP1A2
activity is highly variable between individuals and is affected by both environmental and genetic
factors [74]. A common AC single nucleotide polymorphism (rs762551) in the CYP1A2 gene is
associated with decreased enzyme inducibility and activity [74]. Carriers of the C allele can be
considered ‘slow’ caffeine metabolizers and tend to break down caffeine at a slower rate [93].
Individuals who are homozygous for the A allele are ‘fast’ caffeine metabolizers (13), and may
be less susceptible to any effects of caffeine compared to slow metabolizers. Cornelis et al.,
showed that slow metabolizers are at an increased risk of myocardial infarction with increased
coffee consumption while fast metabolizers experienced a protective effect with moderate
39
coffee consumption [10]. Consistent with these findings, CYP1A2 genotype was shown to
modify the association between coffee consumption and risk of hypertension with slow
metabolizers having an increased risk of developing hypertension and fast metabolizers having
a lower risk [11].
Although CYP1A2 variants may modify the association between caffeine and
cardiovascular disease risk, the underlying mechanisms and physiological pathways affected by
caffeine are not well understood. Recent advances in proteomics, such as the development of
mass spectrometry-based multiple reaction monitoring (MRM), allow for the targeted
quantification of numerous high-abundance plasma proteins across a wide range of
concentrations simultaneously [198]. Many of these high-abundance plasma proteins belong to
disease-associated pathways and could be useful biomarkers of disease [16, 191]. Novel
proteomics techniques also provide a more comprehensive view of the plasma proteome,
which may enhance the ability to predict disease risk and evaluate the effects of dietary
exposures [16]. For example, a cross-sectional study on dietary patterns and the plasma
proteome reported that different dietary habits and ethnocultural groups have distinct plasma
proteomic profiles [16]. Such differences in plasma protein concentrations may be predictive of
future cardiometabolic disease risk [16]. Another study on hormonal contraceptive use and the
plasma proteome also identified significant differences in protein concentrations between
users and non-users [191]. Although there are no published data on caffeine intake and the
plasma proteome, one study did show that salivary protein profiles differed significantly
between subjects with different sensitivities to the bitter taste of caffeine [205]. Therefore, it is
likely that individuals consuming different amounts of caffeine also show variations in plasma
40
protein concentrations. Since the rs762551 variant in CYP1A2 has been shown to modify the
association between caffeine and disease risk, it is possible that it also modifies the association
between caffeine intake and plasma proteomic profiles. Accounting for genetic variation in
caffeine metabolism also minimizes the likelihood of any association being due to residual
confounding [158]. This comparison of plasma proteomic profiles between individuals with
different CYP1A2 genotypes consuming different amounts of caffeine may help uncover other
physiological effects of caffeine and identify proteins that may be regulated by caffeine intake.
The objectives of this study were to determine whether different levels of caffeine
intake are associated with different concentrations of 54 high-abundance plasma proteins in an
ethnically diverse population of healthy young adults, and whether CYP1A2 genotype modifies
any associations observed.
2.3 Materials and Methods
2.3.1 Study Population
Subjects were participants of the Toronto Nutrigenomics and Health Study (TNH),
which is a cross-sectional examination of an ethnically diverse group of men and women aged
20-29 years (n=1,639). Subjects were recruited from the University of Toronto between the fall
of 2004 and the fall of 2010. All subjects completed a one-month, 196-item semi-quantitative
Toronto-modified Willet food frequency questionnaire (FFQ) and a general health and lifestyle
questionnaire (GHLQ), and provided a venous blood sample after a 12 hour fast. Women who
were pregnant or breastfeeding, and individuals unable to provide a blood sample were
excluded from the study. Based on self-reported ethnicity, subjects were categorized into 4
41
ethnocultural groups: Caucasians (n=778), East Asians (n=565), South Asians (n=175) and Other
(n=119), as described previously [16]. Written consent was obtained from all subjects, and the
study was approved by the Research Ethics Board at the University of Toronto.
2.3.2 Physical Activity and Anthropometric Measurements
Physical activity, as measured by questionnaire, was expressed as metabolic
equivalent task (MET) hours per week [16]. Anthropometric measures including height and
weight were performed with subjects dressed in light clothing and without shoes as described
previously [16]. Resting systolic blood pressure, diastolic blood pressure and heart rate were
measured as described elsewhere [36].
2.3.3 Biochemical Measurements and Genotyping
Blood samples were collected from subjects after a 12-hour overnight fast and
analyzed at LifeLabs medical laboratory services (Toronto, ON, Canada). Biomarkers of glycemic
control, lipid metabolism, and the systemic inflammatory marker C-reactive protein (CRP) were
measured on-site following standard procedures as described elsewhere [206]. At the time of
participation, subjects were screened for potential acute inflammatory conditions and if such a
condition was found, a two-week recovery period was allowed before drawing blood. The
homeostasis model of insulin resistance (HOMA-IR) and beta-cell function (HOMA-β) were
calculated from previously established formulas [207]. DNA was extracted from fasting whole
blood samples using standard procedures [206]. Genotyping for the candidate CYP1A2
rs762551 polymorphism was completed by real-time PCR using TaqMan® SNP Genotyping
Assays from Applied Biosystems (Foster City, CA) as described previously [36].
42
2.3.4 Plasma Proteomics Measurements
We measured 54 high-abundance plasma proteins with coefficients of variation <15%,
as described previously [16]. In brief, a mass spectrometry-based multiple reaction monitoring
(MRM) assay was designed to measure high-abundance plasma proteins belonging to major
biological pathways including hemostasis, innate immunity, lipid metabolism, amyloid disease,
transmembrane transport, and signal transduction [187, 198, 208, 209]. Protein measurements
were completed at the Genome British Columbia Proteomics Centre at the University of
Victoria (Victoria, BC, Canada).
2.3.5 Statistical Analysis
All statistical analyses were completed using SAS (version 9.2; SAS Institute Inc, Cary,
NC, USA). During the time of study, proteomics analysis was completed for 1,116 out of 1,639
subjects from the TNH study cohort. Current smokers were excluded from the study as
chemicals in cigarette smoke induce CYP1A2 activity and increase caffeine clearance [210].
Furthermore, we excluded 7 subjects because of possible over- (>3,500 kcal/day for women,
>4,000 kcal/day for men) or under-reporting of energy intake (<800 kcal/day), 9 subjects
because of missing genotype data, and 5 subjects because of missing anthropometric or
biochemical data, which left 1,095 subjects in the final study sample. These subjects were
categorized into three levels of caffeine intake (<100 mg/d, 100-200 mg/d, and >200 mg/d).
Subject characteristics were compared across the three levels of caffeine intake using χ2 tests
for categorical variables and analysis of variance (ANOVA) for continuous variables. The
distribution of continuous variables was assessed prior to analysis and when necessary, loge or
square-root transformations were used to improve normality. The Tukey-Kramer procedure
43
was used when examining the differences in means across the three intake groups for all
comparisons. All reported P-values are two sided and considered significant when P<0.05.
Biomarkers of glycemic control and lipid metabolism were also compared amongst the three
intake groups using ANOVA.
A general linear model was used to examine associations between 54 plasma proteins
from the proteomics panel and the three categories of caffeine consumption. P-values from
models using transformed variables are reported, and untransformed mean plasma protein
concentrations and standard errors are reported for ease of interpretation. Covariates included
in the adjusted model (Model 2) were age, sex, ethnocultural group, oral contraceptive use
among women, BMI and energy intake. P-values from both the unadjusted model (Model 1)
and the adjusted model (Model 2) are reported. Significance of differences in means across the
three caffeine intake categories for each protein was determined using the Tukey-Kramer
procedure. The Bonferroni correction for multiple testing was also applied with a significance
level of P<0.0009 (54 tests; α = 0.05; P-value=0.05/54 tests). The same analyses were repeated
and stratified by ethnocultural group.
Interactions were tested between caffeine intake and CYP1A2 genotype on plasma
protein concentrations. For proteins that showed a significant P-value for the interaction term,
the associations between caffeine and those proteins were examined further after stratifying
by CYP1A2 genotype (A/A vs. A/C+C/C).
44
2.4 Results
The study population was divided into 3 groups according to levels of caffeine
consumption measured by the FFQ. Six hundred sixty subjects were in the lowest caffeine
consumption category (<100 mg/d), while 243 subjects and 192 subjects were grouped in the
100-200 mg/d and >200 mg/d intake categories, respectively (Table 2-1). Overall, fasting serum
insulin was significantly higher in subjects consuming <100 mg/d compared to the other two
categories. BMI and energy intake were significantly higher in subjects consuming >200 mg/d of
caffeine compared to the two lower levels of caffeine consumption. Both HOMA-IR and HOMA-
β were significantly higher among subjects consuming <100 mg/d of caffeine when compared
to the other categories of intake.
Initially, none of the 54 plasma proteins analyzed were significantly different between
caffeine intake categories in both the unadjusted and adjusted models (Table 2-2). After testing
for interactions between caffeine intake and CYP1A2 genotype on plasma protein
concentrations, there was a significant interaction only with gelsolin (P=0.04). Therefore,
gelsolin concentrations were compared between caffeine consumption categories after
subjects were stratified by CYP1A2 (rs762551) genotype. After stratification, there were 502
fast metabolizers (A/A) and 593 slow metabolizers (A/C or C/C). Among slow metabolizers,
mean plasma concentrations of gelsolin, were significantly lower for those consuming >200
mg/d caffeine compared to those consuming <100 mg/d. This finding remained significant after
Tukey-Kramer adjustment in Model 1 and Model 2 adjusted for age, sex, ethnocultural group,
BMI, energy intake and oral contraceptive use among women (p<0.004 and p<0.003,
respectively) (Figure 2-1). Significant differences in mean plasma gelsolin concentrations were

45
only observed among slow metabolizers and not among fast metabolizers. The entire study
population was stratified by ethnocultural group but no significant differences in mean protein
concentrations were found for any of the 54 plasma proteins (results not shown).
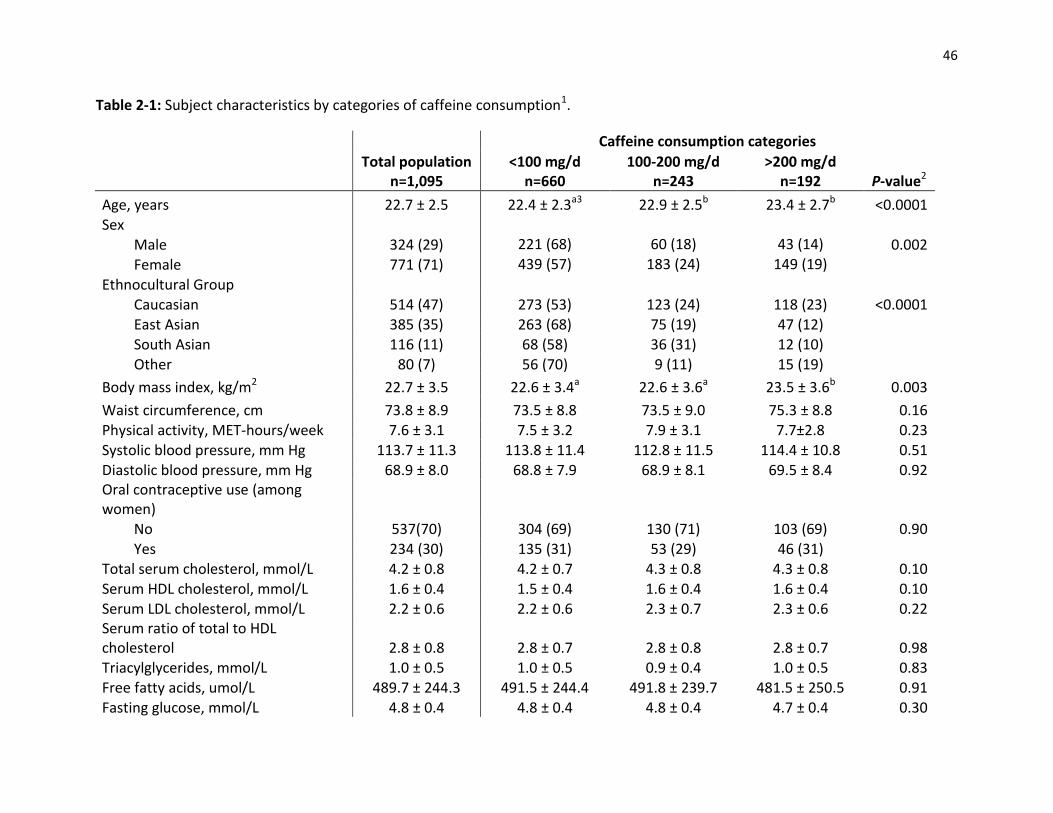
46
Table 2-1: Subject characteristics by categories of caffeine consumption1.
Caffeine consumption categories
Total population
n=1,095 <100 mg/d
n=660 100-200 mg/d
n=243 >200 mg/d
n=192 P-value2
Age, years 22.7 ± 2.5 22.4 ± 2.3a3 22.9 ± 2.5b 23.4 ± 2.7b <0.0001 Sex
Male 324 (29) 221 (68) 60 (18) 43 (14) 0.002
Female 771 (71) 439 (57) 183 (24) 149 (19) Ethnocultural Group
Caucasian 514 (47) 273 (53) 123 (24) 118 (23) <0.0001 East Asian 385 (35) 263 (68) 75 (19) 47 (12)
South Asian 116 (11) 68 (58) 36 (31) 12 (10) Other 80 (7) 56 (70) 9 (11) 15 (19) Body mass index, kg/m2 22.7 ± 3.5 22.6 ± 3.4a 22.6 ± 3.6a 23.5 ± 3.6b 0.003
Waist circumference, cm 73.8 ± 8.9 73.5 ± 8.8 73.5 ± 9.0 75.3 ± 8.8 0.16 Physical activity, MET-hours/week 7.6 ± 3.1 7.5 ± 3.2 7.9 ± 3.1 7.7±2.8 0.23
Systolic blood pressure, mm Hg 113.7 ± 11.3 113.8 ± 11.4 112.8 ± 11.5 114.4 ± 10.8 0.51 Diastolic blood pressure, mm Hg 68.9 ± 8.0 68.8 ± 7.9 68.9 ± 8.1 69.5 ± 8.4 0.92 Oral contraceptive use (among women)
No 537(70) 304 (69) 130 (71) 103 (69) 0.90 Yes 234 (30) 135 (31) 53 (29) 46 (31)
Total serum cholesterol, mmol/L 4.2 ± 0.8 4.2 ± 0.7 4.3 ± 0.8 4.3 ± 0.8 0.10 Serum HDL cholesterol, mmol/L 1.6 ± 0.4 1.5 ± 0.4 1.6 ± 0.4 1.6 ± 0.4 0.10 Serum LDL cholesterol, mmol/L 2.2 ± 0.6 2.2 ± 0.6 2.3 ± 0.7 2.3 ± 0.6 0.22 Serum ratio of total to HDL cholesterol 2.8 ± 0.8 2.8 ± 0.7 2.8 ± 0.8 2.8 ± 0.7 0.98 Triacylglycerides, mmol/L 1.0 ± 0.5 1.0 ± 0.5 0.9 ± 0.4 1.0 ± 0.5 0.83 Free fatty acids, umol/L 489.7 ± 244.3 491.5 ± 244.4 491.8 ± 239.7 481.5 ± 250.5 0.91 Fasting glucose, mmol/L 4.8 ± 0.4 4.8 ± 0.4 4.8 ± 0.4 4.7 ± 0.4 0.30
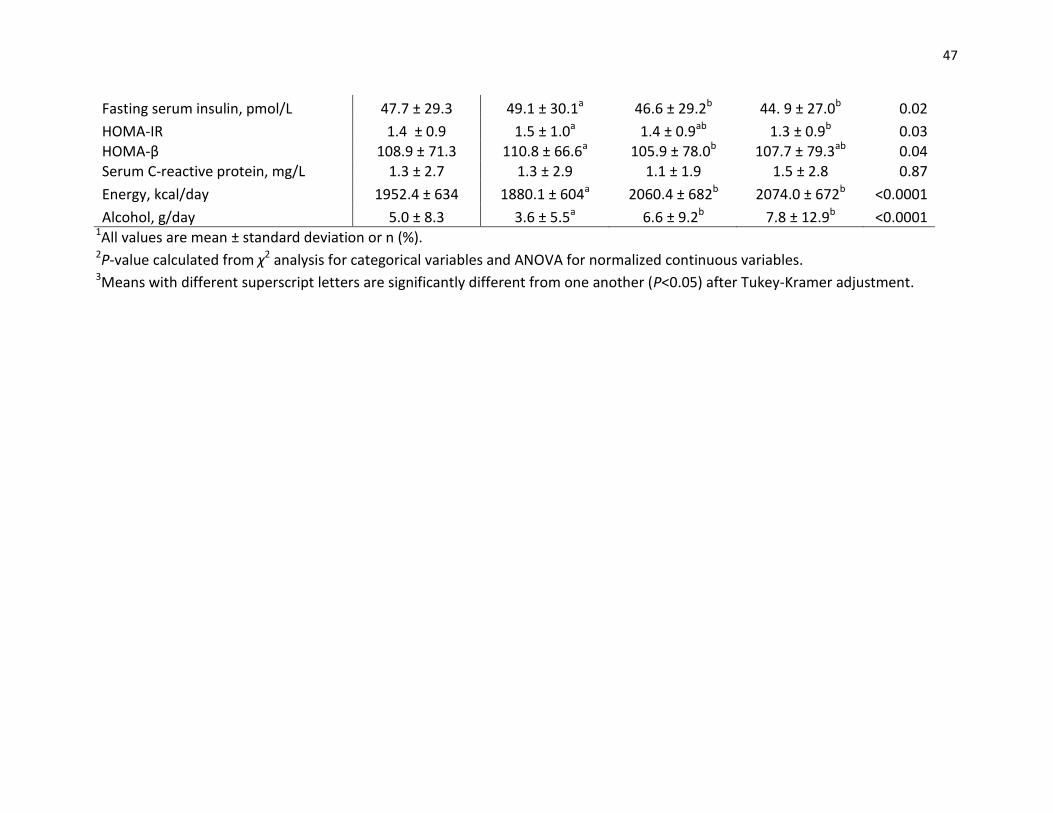
47
Fasting serum insulin, pmol/L 47.7 ± 29.3 49.1 ± 30.1a 46.6 ± 29.2b 44. 9 ± 27.0b 0.02
HOMA-IR 1.4 ± 0.9 1.5 ± 1.0a 1.4 ± 0.9ab 1.3 ± 0.9b 0.03 HOMA-β 108.9 ± 71.3 110.8 ± 66.6a 105.9 ± 78.0b 107.7 ± 79.3ab 0.04 Serum C-reactive protein, mg/L 1.3 ± 2.7 1.3 ± 2.9 1.1 ± 1.9 1.5 ± 2.8 0.87
Energy, kcal/day 1952.4 ± 634 1880.1 ± 604a 2060.4 ± 682b 2074.0 ± 672b <0.0001
Alcohol, g/day 5.0 ± 8.3 3.6 ± 5.5a 6.6 ± 9.2b 7.8 ± 12.9b <0.0001 1All values are mean ± standard deviation or n (%). 2P-value calculated from χ2 analysis for categorical variables and ANOVA for normalized continuous variables. 3Means with different superscript letters are significantly different from one another (P<0.05) after Tukey-Kramer adjustment.
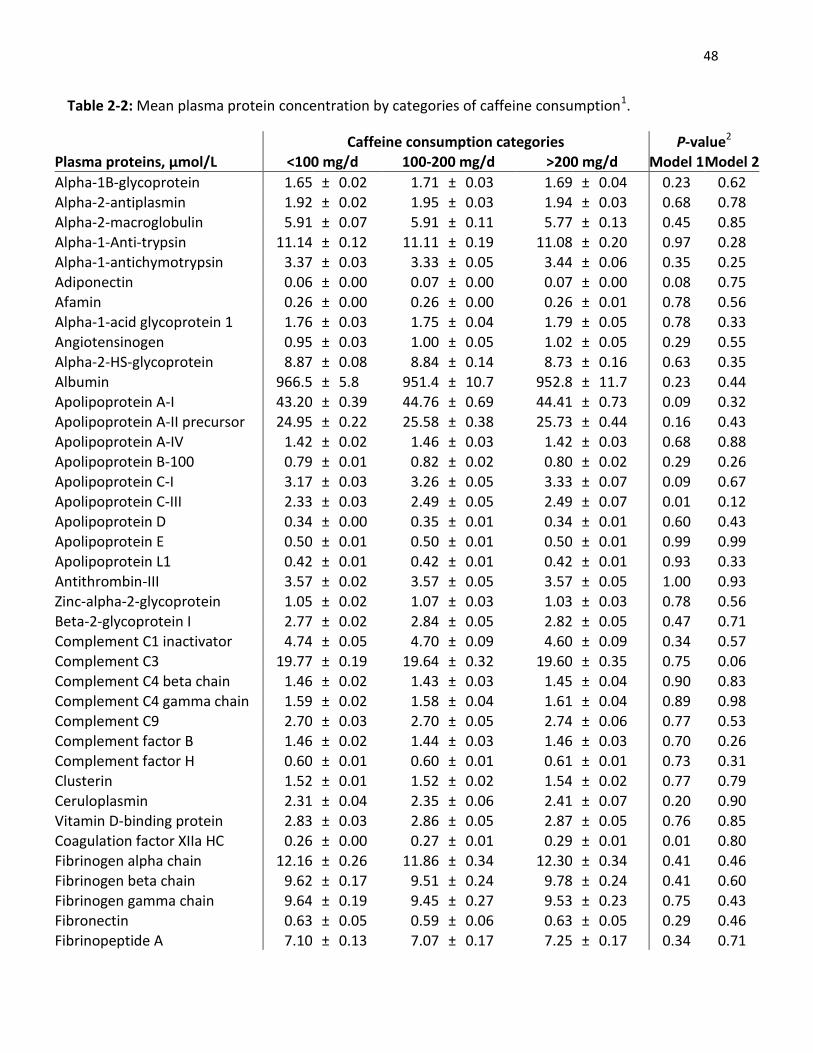
48
Table 2-2: Mean plasma protein concentration by categories of caffeine consumption1.
Caffeine consumption categories P-value2
Plasma proteins, µmol/L <100 mg/d 100-200 mg/d >200 mg/d Model 1 Model 2
Alpha-1B-glycoprotein 1.65 ± 0.02 1.71 ± 0.03 1.69 ± 0.04 0.23 0.62 Alpha-2-antiplasmin 1.92 ± 0.02 1.95 ± 0.03 1.94 ± 0.03 0.68 0.78 Alpha-2-macroglobulin 5.91 ± 0.07 5.91 ± 0.11 5.77 ± 0.13 0.45 0.85 Alpha-1-Anti-trypsin 11.14 ± 0.12 11.11 ± 0.19 11.08 ± 0.20 0.97 0.28 Alpha-1-antichymotrypsin 3.37 ± 0.03 3.33 ± 0.05 3.44 ± 0.06 0.35 0.25 Adiponectin 0.06 ± 0.00 0.07 ± 0.00 0.07 ± 0.00 0.08 0.75 Afamin 0.26 ± 0.00 0.26 ± 0.00 0.26 ± 0.01 0.78 0.56 Alpha-1-acid glycoprotein 1 1.76 ± 0.03 1.75 ± 0.04 1.79 ± 0.05 0.78 0.33
Angiotensinogen 0.95 ± 0.03 1.00 ± 0.05 1.02 ± 0.05 0.29 0.55 Alpha-2-HS-glycoprotein 8.87 ± 0.08 8.84 ± 0.14 8.73 ± 0.16 0.63 0.35
Albumin 966.5 ± 5.8 951.4 ± 10.7 952.8 ± 11.7 0.23 0.44 Apolipoprotein A-I 43.20 ± 0.39 44.76 ± 0.69 44.41 ± 0.73 0.09 0.32 Apolipoprotein A-II precursor 24.95 ± 0.22 25.58 ± 0.38 25.73 ± 0.44 0.16 0.43 Apolipoprotein A-IV 1.42 ± 0.02 1.46 ± 0.03 1.42 ± 0.03 0.68 0.88 Apolipoprotein B-100 0.79 ± 0.01 0.82 ± 0.02 0.80 ± 0.02 0.29 0.26 Apolipoprotein C-I 3.17 ± 0.03 3.26 ± 0.05 3.33 ± 0.07 0.09 0.67 Apolipoprotein C-III 2.33 ± 0.03 2.49 ± 0.05 2.49 ± 0.07 0.01 0.12 Apolipoprotein D 0.34 ± 0.00 0.35 ± 0.01 0.34 ± 0.01 0.60 0.43 Apolipoprotein E 0.50 ± 0.01 0.50 ± 0.01 0.50 ± 0.01 0.99 0.99 Apolipoprotein L1 0.42 ± 0.01 0.42 ± 0.01 0.42 ± 0.01 0.93 0.33
Antithrombin-III 3.57 ± 0.02 3.57 ± 0.05 3.57 ± 0.05 1.00 0.93 Zinc-alpha-2-glycoprotein 1.05 ± 0.02 1.07 ± 0.03 1.03 ± 0.03 0.78 0.56 Beta-2-glycoprotein I 2.77 ± 0.02 2.84 ± 0.05 2.82 ± 0.05 0.47 0.71 Complement C1 inactivator 4.74 ± 0.05 4.70 ± 0.09 4.60 ± 0.09 0.34 0.57 Complement C3 19.77 ± 0.19 19.64 ± 0.32 19.60 ± 0.35 0.75 0.06 Complement C4 beta chain 1.46 ± 0.02 1.43 ± 0.03 1.45 ± 0.04 0.90 0.83 Complement C4 gamma chain 1.59 ± 0.02 1.58 ± 0.04 1.61 ± 0.04 0.89 0.98 Complement C9 2.70 ± 0.03 2.70 ± 0.05 2.74 ± 0.06 0.77 0.53 Complement factor B 1.46 ± 0.02 1.44 ± 0.03 1.46 ± 0.03 0.70 0.26 Complement factor H 0.60 ± 0.01 0.60 ± 0.01 0.61 ± 0.01 0.73 0.31 Clusterin 1.52 ± 0.01 1.52 ± 0.02 1.54 ± 0.02 0.77 0.79
Ceruloplasmin 2.31 ± 0.04 2.35 ± 0.06 2.41 ± 0.07 0.20 0.90 Vitamin D-binding protein 2.83 ± 0.03 2.86 ± 0.05 2.87 ± 0.05 0.76 0.85 Coagulation factor XIIa HC 0.26 ± 0.00 0.27 ± 0.01 0.29 ± 0.01 0.01 0.80 Fibrinogen alpha chain 12.16 ± 0.26 11.86 ± 0.34 12.30 ± 0.34 0.41 0.46 Fibrinogen beta chain 9.62 ± 0.17 9.51 ± 0.24 9.78 ± 0.24 0.41 0.60 Fibrinogen gamma chain 9.64 ± 0.19 9.45 ± 0.27 9.53 ± 0.23 0.75 0.43 Fibronectin 0.63 ± 0.05 0.59 ± 0.06 0.63 ± 0.05 0.29 0.46 Fibrinopeptide A 7.10 ± 0.13 7.07 ± 0.17 7.25 ± 0.17 0.34 0.71
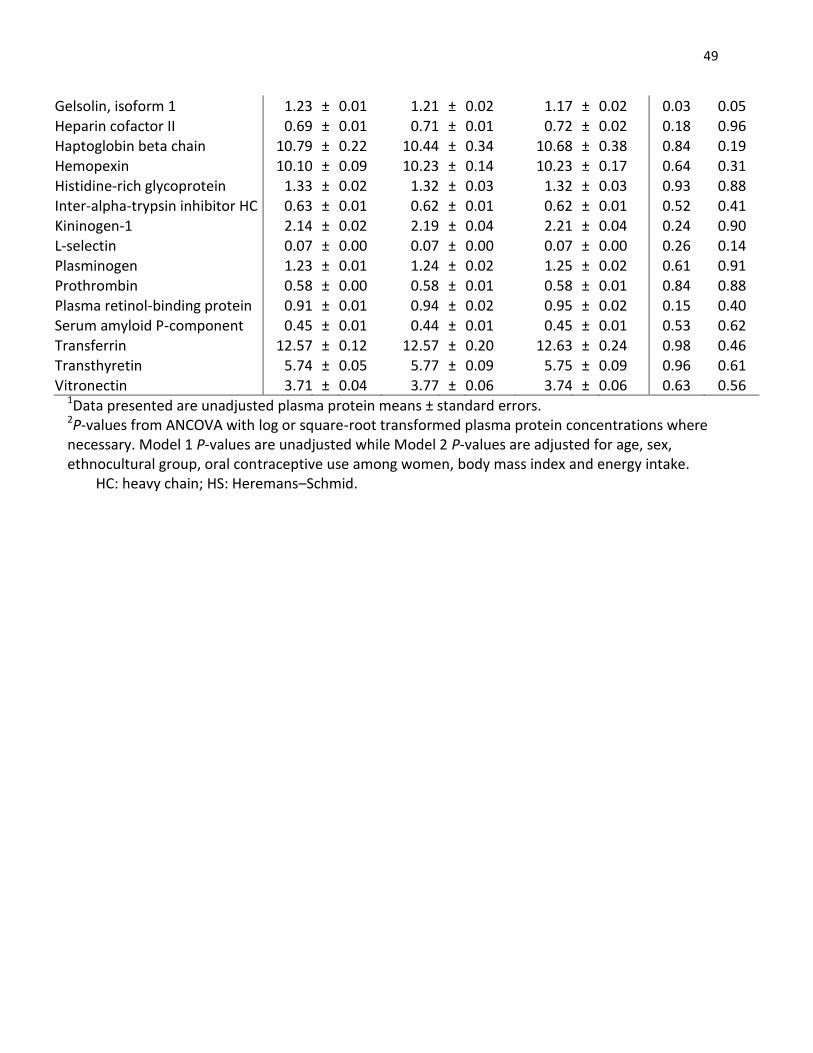
49
Gelsolin, isoform 1 1.23 ± 0.01 1.21 ± 0.02 1.17 ± 0.02 0.03 0.05
Heparin cofactor II 0.69 ± 0.01 0.71 ± 0.01 0.72 ± 0.02 0.18 0.96 Haptoglobin beta chain 10.79 ± 0.22 10.44 ± 0.34 10.68 ± 0.38 0.84 0.19 Hemopexin 10.10 ± 0.09 10.23 ± 0.14 10.23 ± 0.17 0.64 0.31 Histidine-rich glycoprotein 1.33 ± 0.02 1.32 ± 0.03 1.32 ± 0.03 0.93 0.88 Inter-alpha-trypsin inhibitor HC 0.63 ± 0.01 0.62 ± 0.01 0.62 ± 0.01 0.52 0.41 Kininogen-1 2.14 ± 0.02 2.19 ± 0.04 2.21 ± 0.04 0.24 0.90 L-selectin 0.07 ± 0.00 0.07 ± 0.00 0.07 ± 0.00 0.26 0.14 Plasminogen 1.23 ± 0.01 1.24 ± 0.02 1.25 ± 0.02 0.61 0.91 Prothrombin 0.58 ± 0.00 0.58 ± 0.01 0.58 ± 0.01 0.84 0.88 Plasma retinol-binding protein 0.91 ± 0.01 0.94 ± 0.02 0.95 ± 0.02 0.15 0.40 Serum amyloid P-component 0.45 ± 0.01 0.44 ± 0.01 0.45 ± 0.01 0.53 0.62
Transferrin 12.57 ± 0.12 12.57 ± 0.20 12.63 ± 0.24 0.98 0.46 Transthyretin 5.74 ± 0.05 5.77 ± 0.09 5.75 ± 0.09 0.96 0.61 Vitronectin 3.71 ± 0.04 3.77 ± 0.06 3.74 ± 0.06 0.63 0.56
1Data presented are unadjusted plasma protein means ± standard errors. 2P-values from ANCOVA with log or square-root transformed plasma protein concentrations where necessary. Model 1 P-values are unadjusted while Model 2 P-values are adjusted for age, sex, ethnocultural group, oral contraceptive use among women, body mass index and energy intake.
HC: heavy chain; HS: Heremans–Schmid.
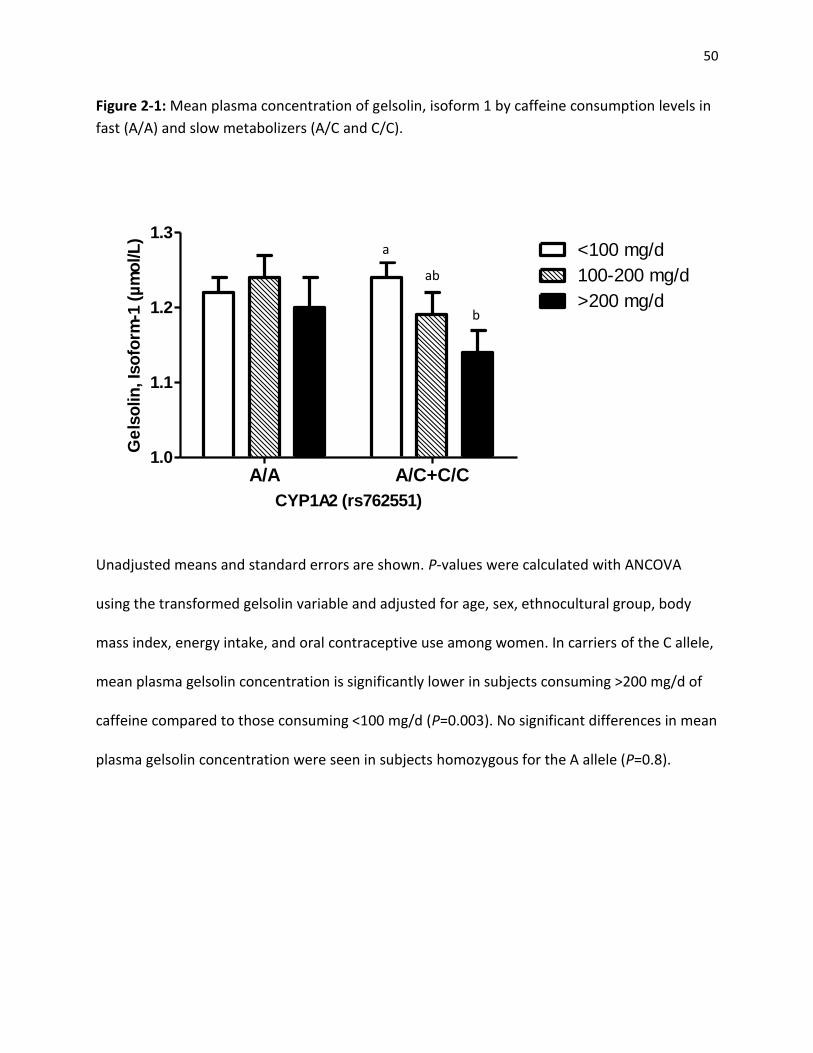
50
Figure 2-1: Mean plasma concentration of gelsolin, isoform 1 by caffeine consumption levels in
fast (A/A) and slow metabolizers (A/C and C/C).
A/A A/C+C/C1.0
1.1
1.2
1.3<100 mg/d
100-200 mg/d
>200 mg/d
CYP1A2 (rs762551)
Ge
lso
lin
, Is
ofo
rm-1
(µ
mo
l/L
)
a
ab
b
Unadjusted means and standard errors are shown. P-values were calculated with ANCOVA
using the transformed gelsolin variable and adjusted for age, sex, ethnocultural group, body
mass index, energy intake, and oral contraceptive use among women. In carriers of the C allele,
mean plasma gelsolin concentration is significantly lower in subjects consuming >200 mg/d of
caffeine compared to those consuming <100 mg/d (P=0.003). No significant differences in mean
plasma gelsolin concentration were seen in subjects homozygous for the A allele (P=0.8).
51
2.5 Discussion
Using a plasma proteomics approach, we undertook this study to examine whether
different levels of caffeine consumption are associated with plasma protein concentrations and
whether genetic variation affecting caffeine metabolism modifies any associations between
caffeine intake and the plasma proteome. The concentrations of 54 plasma proteins involved in
various physiological pathways were measured simultaneously in an ethnically diverse
population of healthy young adults. Initially, we found no significant differences in mean
plasma protein concentrations across the three levels of caffeine intake. However, because
genetic variation in CYP1A2 is associated with differences in caffeine metabolism, we further
stratified our study population by the rs762551 SNP in CYP1A2. We found a significant caffeine
x CYP1A2 interaction on plasma gelsolin concentrations where increased caffeine consumption
was associated with decreased plasma gelsolin only in subjects with the slow metabolizer
genotype.
In the present study population, the amount of caffeine intake differed significantly
across ethnocultural groups. A higher percentage of Caucasian subjects consumed >200 mg/d
of caffeine compared to East Asians, South Asians and others. This consumption pattern is in
agreement with the global trend of caffeine intake. Data from Europe and North America show
that 90% of adults consume caffeine on a daily basis, with an average intake of 227 mg/d [122,
211]. Furthermore, 75% of dietary sources of caffeine come from drinking coffee in the North
American diet [20]. In contrast, the preferred caffeinated beverage in East Asian countries such
as China and Japan is tea, which has a lower caffeine content compared to coffee on a per cup
basis [212].

52
We found no significant associations between caffeine intake and any of the plasma
proteins when the entire study population was analyzed. In order to account for the biologically
effective ‘dose’ of caffeine and any residual confounding, we tested for the caffeine x CYP1A2
interaction, and further stratified our analysis by the rs762551 SNP in CYP1A2. After stratifying
by CYP1A2 genotype, no significant differences in mean plasma protein concentrations were
observed between different levels of caffeine consumption among the fast metabolizers.
However, gelsolin isoform 1 (gelsolin) concentrations decreased significantly with increasing
caffeine intake in the slow metabolizers. In slow metabolizers, caffeine is metabolized less
efficiently and remains in the body for a longer period of time [213]. Therefore, the sustained
effects of caffeine may have contributed to the observed differences in plasma gelsolin
concentration in subjects with the slow metabolizer genotype. This observation in the slow
caffeine metabolizers supports findings from previous studies that some of the cardiovascular
effects of caffeine are modified by CYP1A2 genotype [10, 11].
The association between caffeine intake and gelsolin concentrations may offer insight
into the biological pathways affected by caffeine intake. Gelsolin is a multifunctional actin-
binding protein expressed both extracellularly in the plasma (isoform 1) and intracellularly in
the cytoplasm (isoform 2) [214]. Plasma gelsolin is secreted by most cell types in the body with
a higher amount being produced by smooth, skeletal, and cardiac muscles [215]. This protein is
known to cleave and scavenge circulating actin filaments, which helps to counteract the
potentially harmful effects of actin release during cellular injury [216]. Therefore, plasma
gelsolin has been described as a “debris cleaner” that may limit inflammation and reduce blood
clotting by preventing the polymerization of actin filaments [217]. In addition to its established

53
role as an actin remodelling protein, gelsolin is also involved in numerous physiological
processes [216]. Altered expression of gelsolin is linked to diseases such as amyloidosis [218],
cancer [219], and rheumatoid arthritis [220]. Furthermore, low plasma gelsolin levels are
associated with increased inflammation and poor prognosis of acute illnesses [221]. Therefore,
plasma gelsolin is suggested to be a prognostic biomarker for various health outcomes [222].
Interestingly, plasma gelsolin levels have also been shown to decrease shortly after acute
myocardial infarction [223]. Suhler et al., observed that plasma gelsolin decreased almost by
half of its normal level in several disease states associated with acute cellular injuries such as
myocardial infarction and hepatic failure [223]. A study on gelsolin and various types of heart
disease also showed that gelsolin levels decreased significantly in patients with acute coronary
syndrome [224]. Therefore, the observed decrease in plasma gelsolin concentrations in subjects
consuming the highest amount of caffeine suggests that gelsolin may be involved in pathways
linking caffeine consumption to cardiovascular disease.
There are several limitations to the present study. The study population consisted of
young adults that are generally healthy and are at low risk of chronic disease. Therefore,
plasma proteomic profiles of these subjects may have fewer deviations from normal and
potential biomarkers of disease risk may not be as evident. Because the majority of our study
population were not heavy caffeine consumers, a smaller range was used when defining the
three caffeine consumption categories. Thus, the effect of heavier caffeine consumption (e.g.
>400 mg/d) on plasma protein concentrations may not have been captured by the current
population.

54
To our knowledge, this is the first study to examine the association between caffeine
intake and the plasma proteome. Plasma gelsolin concentrations were inversely associated with
caffeine consumption in carriers of the C allele (slow metabolizer genotype) for rs762551 in
CYP1A2. Our study suggests that plasma gelsolin levels are affected by varying amounts of
caffeine and this association was unmasked after stratifying by CYP1A2 genotype. These
findings also suggest that caffeine may have physiological effects that impact disease-related
pathways involving gelsolin such as cardiovascular diseases, in a genetic subset of the
population with slow caffeine metabolism.
55
Chapter 3: Association between caffeine intake and plasma gelsolin
concentrations in other caffeine-related genes among slow
metabolizers of caffeine.
3.1 Abstract
Consuming higher amounts of caffeine may decrease plasma gelsolin levels; however,
this association was only observed among slow metabolizers of caffeine. The objectives of this
study were to determine whether the association between caffeine intake and plasma gelsolin
levels is more pronounced in slow metabolizers with polymorphisms in the gelsolin gene or
seven other caffeine-related genes. Subjects were from the Toronto Nutrigenomics and Health
Study and only those with the slow metabolizer genotype (CYP1A2 A/C +C/C, n=593) were
analyzed. Subjects were categorized into three groups according to habitual caffeine intake
(<100 mg/d, 100-200 mg/d, and >200 mg/d) and stratified by polymorphisms in the gelsolin
(GSN), aryl-hydrocarbon receptor (AHR), adenosine A2A receptor (ADORA2A), 5-HT2A serotonin
receptor (HTR2A), 2-adrenoceptor (ADRB2), dopamine D2 receptor (DRD2), catechol-O-
methyltransferase (COMT), and CYP1A1/1A2 genes. Overall, gelsolin concentrations were
inversely associated with increased caffeine intake. These associations were significant in
subjects with the GSN GG, AHR CT, CYP1A1/1A2 GG, HTR2A CT, ADRB2 GG, and DRD2 CT
genotypes (P<0.05). These findings suggest that other caffeine-related genes modify the inverse
association between caffeine intake and gelsolin concentrations.
56
3.2 Introduction
In Chapter 2, we observed that initially, caffeine intake showed no significant
association with any of the 54 plasma proteins when the entire study population was examined
as a whole. However, when we stratified subjects by CYP1A2 genotype, plasma gelsolin
concentrations decreased significantly with increased caffeine intake in the slow metabolizers.
One possible explanation for this decrease in gelsolin level could be due to a delay in caffeine
breakdown in those with the slow metabolizer genotype where it is more likely to exert a
biological effect. Since decreased levels of plasma gelsolin have been observed in cohorts with
heart disease [93], it is important to further understand caffeine’s association with this protein.
Within the slow metabolizers, stratification by polymorphisms in the gelsolin gene (GSN) and
other caffeine-related genes may allow us to identify further subgroups that display an even
greater responsiveness of caffeine on plasma gelsolin levels. These exploratory analyses will aid
in the identification of a specific subgroup (based on genotype) in the population that may be
more influenced by caffeine intake.
Previous research shows that genetics play a significant role in modulating one’s
response to caffeine intake. A common A>C single nucleotide polymorphism within CYP1A2, the
gene that codes for the primary enzyme responsible for caffeine metabolism (cytochrome P450
1A2), results in lower enzyme inducibility and impaired caffeine metabolism [10]. Therefore,
those with lower enzyme inducibility are slow metabolizers and tend to experience the effects
of caffeine for a longer period of time compared to fast metabolizers [158]. This difference in
the rate of caffeine metabolism also has health implications (as described in Chapter 2). In
57
addition to CYP1A2, variations in several other caffeine-related genes have been shown to
modify the acute effects, withdrawal symptoms, consumption behaviour, and disease risks
related to caffeine consumption. For example, the rs6968865 SNP in the aryl-hydrocarbon
receptor (AHR) gene has been associated with increased caffeine consumption [225]. AHR is an
inducer of CYP1A1 and CYP1A2, which modifies the rate of caffeine metabolism [96, 226]. A
study suggested that the AHR-T variant may be associated with enhanced CYP1A1 and CYP1A2
activities thereby increasing caffeine clearance, which may allow individuals to consume more
caffeine [225]. Furthermore, sequence variants within the CYP1A1 and CYP1A2 gene regions
have also been associated with caffeine consumption behaviours [225]. Genetic variation in
dopamine (DRD2) and serotonin (HTR2A) receptors may modify the effects of caffeine on
health as well especially for cardiovascular disease risk. Variation in the DRD2 gene has been
associated with blood pressure regulation [227] while polymorphisms in HTR2A have been
implicated in MI and stroke [228].
As caffeine’s main mechanism of action is through the antagonism of adenosine
receptors, genetic variations in the gene coding for the A2A receptor (ADORA2A) have influences
over caffeine consumption behaviours as well. For example, in a Costa Rican population, it was
shown that subjects homozygous for the ADORA2A T allele tend to consume more caffeine than
those who had the CC genotype [35]. In addition to ADORA2, polymorphisms in the 2-
adrenoceptor (ADRB2) and catechol-O-methyltransferase (COMT) have also been associated
with caffeine consumption behaviours and cardiovascular disease risk [36, 228].

58
The current study aims to further understand the association between caffeine intake
and gelsolin concentrations by examining the influence of polymorphisms in the
aforementioned genes on plasma gelsolin levels in slow metabolizers. Only the slow
metabolizers are examined as the association between caffeine and gelsolin was only observed
among this group of subjects. We also hope to identify specific genotypes that may have
influenced the inverse association between caffeine intake and gelsolin concentrations
observed previously.
3.3 Materials and Methods:
3.3.1 Study Population
Refer to Chapter 2 (Pg 48)
3.3.2 Biochemical Measurements and Genotyping
Refer to Chapter 2 (Pg 49)
In addition to genotyping the rs762551 polymorphism within CYP1A2, the rs1560980 SNP of
GSN and the following SNPs from 7 other caffeine-related genes were also genotyped as
described in Chapter 2 (Pg 49): rs4410790 (AHR), rs2470893 (CYP1A1/1A2), rs5751876
(ADORA2A), rs6313 (HTR2A), rs1042713 (ADRB2), rs6277 (DRD2), and rs4680 (COMT).
3.3.3 Plasma Proteomics Measurement – Gelsolin, Isoform 1
Refer to Chapter 2 (Pg 50)
59
3.3.4 Statistical Analysis
All statistical analyses were conducted in SAS (version 9.2; SAS Institute Inc, Cary, NC,
USA). Only subjects with the slow metabolizer genotype (A/C + C/C) as determined in Chapter 2
were included in the current study (n=593). Subjects were stratified by GSN genotype and
plasma gelsolin concentrations were compared between the three levels of caffeine intake
using ANCOVA. To improve normality, gelsolin concentrations were square-root transformed
prior to analysis. However, untransformed mean plasma gelsolin concentrations and standard
errors are reported for ease of interpretation. The Tukey-Kramer procedure was used to
determine the significance of differences in means across caffeine intake levels for each GSN
genotype. P-values shown are two sided with a significance level at P<0.05. Covariates included
in the model were age, sex, ethnocultural group, oral contraceptive use among women, BMI
and energy intake. The same analysis was repeated and stratified by ethnocultural group and
AHR, CYP1A1/1A2, ADORA2A, HTR2A, ADRB2, DRD2 and COMT genotypes. The interactions
between caffeine and ethnocultural group and each of the aforementioned genes were also
tested.
3.4 Results
In slow metabolizers, mean plasma gelsolin concentrations were compared across
three levels of caffeine intake with stratification by GSN genotype and seven other SNPs.
Subject characteristics as outlined in Table 3-1 were consistent with what was observed in
Chapter 2. The majority of subjects consumed caffeine at the lowest level of intake (<100
mg/d). Energy intake increased significantly with increased caffeine intake (P<0.0002). In
60
general, plasma gelsolin concentrations decreased with increased caffeine consumption (Table
3-2, Table 3-3). When taking ethnicity into consideration, our results showed a significant
decrease in plasma gelsolin for Caucasian subjects only (Table 3-2); however, the interaction
between caffeine and ethnocultural group was not significant (P<0.4). The decreasing trend in
plasma gelsolin levels was also significant for the GSN GG, AHR CT, CYP1A1/1A2 GG, HTR2A CT,
ADRB2 GG, and DRD2 CT genotypes (P<0.05); however, no significant interactions were
observed for any of these genes in relation to caffeine on gelsolin concentrations (Table 3-3).

61
Table 3-1: Subject characteristics by categories of caffeine consumption for slow caffeine metabolizers (A/C+CC)1.
Caffeine consumption categories
Total population
n=593 <100 mg/d
n=357 100-200 mg/d
n=146 >200 mg/d
n=90 P-value2
Age, years 22.6 ± 2.5 22.4 ± 2.4a3 22.6 ± 2.4a 23.5 ± 2.6b 0.0006 Sex
Male 189 (32) 128 (68) 35 (18) 26 (14) 0.003
Female 404 (68) 229 (57) 111 (27) 64 (16) Ethnocultural Group
Caucasian 265 (45) 142 (53) 69 (26) 54 (20) 0.0006 East Asian 206 (35) 139 (68) 44 (21) 23 (11)
South Asian 73 (12) 39 (53) 27 (37) 7 (10) Other 49 (8) 37 (76) 6 (12) 6 (12) Body mass index, kg/m2 22.8 ± 3.4 22.7 ± 3.3 22.5 ± 3.7 23.3 ± 2.9 0.11
Waist circumference, cm 74 ± 9.0 74.1 ± 9.1 73.2 ± 9.0 74.9 ± 8.4 0.31 Physical activity, MET-hours/week 7.5 ± 3.0 7.2 ± 3.1 7.9 ± 3.0 7.7±2.8 0.12
Systolic blood pressure, mm Hg 114.0 ± 11.5 114.1 ± 11.6 112.2 ± 11.2 116.2 ± 11.3 0.08 Diastolic blood pressure, mm Hg 68.9 ± 7.9 68.8 ± 7.5 68.7 ± 8.5 69.6 ± 8.4 0.86 Oral contraceptive use (among women)
No 473 (80) 290 (61) 114 (24) 69 (15) 0.53 Yes 120 (20) 67 (56) 32 (27) 21 (17)
Total serum cholesterol, mmol/L 4.2 ± 0.8 4.2 ± 0.7 4.3 ± 0.9 4.3 ± 0.8 0.33 HDL cholesterol, mmol/L 1.6 ± 0.4 1.5 ± 0.4 1.6 ± 0.4 1.6 ± 0.5 0.08 LDL cholesterol, mmol/L 2.2 ± 0.6 2.2 ± 0.6 2.3 ± 0.7 2.3 ± 0.6 0.77
Total to HDL cholesterol ratio 2.8 ± 0.8 2.9 ± 0.7 2.8 ± 0.8 2.8 ± 0.8 0.64 Triglycerides, mmol/L 1.0 ± 0.6 1.0 ± 0.6 0.9 ± 0.5 1.0 ± 0.5 0.64 Free fatty acids, umol/L 494.4 ± 240.4 489.7 ± 241.5 506.9 ± 242.6 492.8 ± 234.4 0.72 Fasting glucose , mmol/L 4.8 ± 0.4 4.8 ± 0.3 4.8 ± 0.4 4.7 ± 0.4 0.23 HOMA-IR 1.4 ± 0.9 1.5 ± 0.9 1.4 ± 0.9 1.3 ± 0.8 0.05
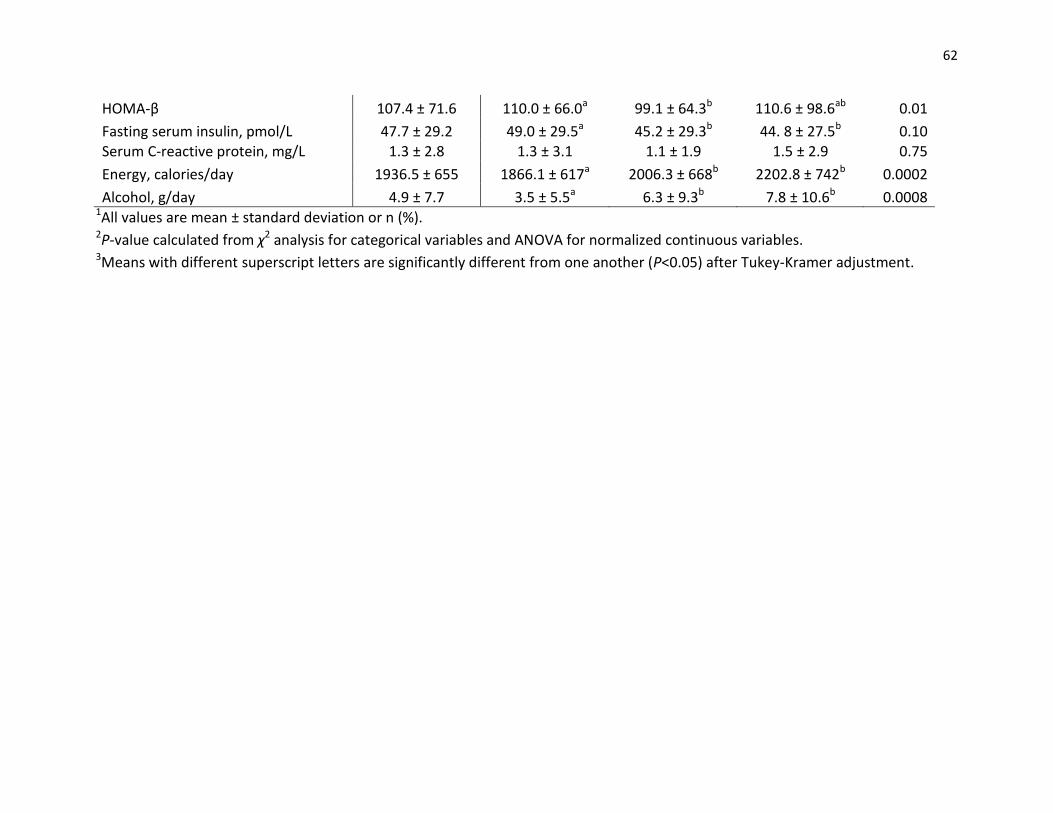
62
HOMA-β 107.4 ± 71.6 110.0 ± 66.0a 99.1 ± 64.3b 110.6 ± 98.6ab 0.01
Fasting serum insulin, pmol/L 47.7 ± 29.2 49.0 ± 29.5a 45.2 ± 29.3b 44. 8 ± 27.5b 0.10 Serum C-reactive protein, mg/L 1.3 ± 2.8 1.3 ± 3.1 1.1 ± 1.9 1.5 ± 2.9 0.75
Energy, calories/day 1936.5 ± 655 1866.1 ± 617a 2006.3 ± 668b 2202.8 ± 742b 0.0002
Alcohol, g/day 4.9 ± 7.7 3.5 ± 5.5a 6.3 ± 9.3b 7.8 ± 10.6b 0.0008 1All values are mean ± standard deviation or n (%). 2P-value calculated from χ2 analysis for categorical variables and ANOVA for normalized continuous variables. 3Means with different superscript letters are significantly different from one another (P<0.05) after Tukey-Kramer adjustment.
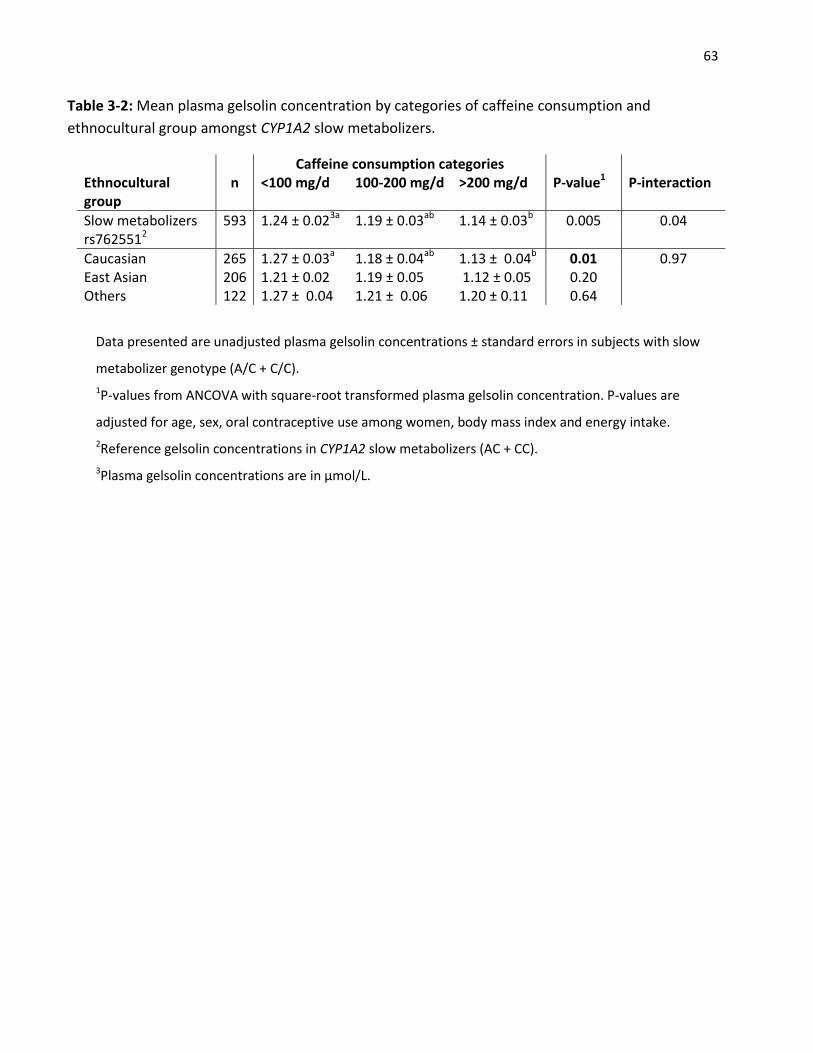
63
Table 3-2: Mean plasma gelsolin concentration by categories of caffeine consumption and
ethnocultural group amongst CYP1A2 slow metabolizers.
Data presented are unadjusted plasma gelsolin concentrations ± standard errors in subjects with slow
metabolizer genotype (A/C + C/C).
1P-values from ANCOVA with square-root transformed plasma gelsolin concentration. P-values are
adjusted for age, sex, oral contraceptive use among women, body mass index and energy intake.
2Reference gelsolin concentrations in CYP1A2 slow metabolizers (AC + CC).
3Plasma gelsolin concentrations are in µmol/L.
Caffeine consumption categories Ethnocultural group
n <100 mg/d 100-200 mg/d >200 mg/d P-value1 P-interaction
Slow metabolizers 593 1.24 ± 0.023a 1.19 ± 0.03ab 1.14 ± 0.03b 0.005 0.04 rs7625512
Caucasian 265 1.27 ± 0.03a 1.18 ± 0.04ab 1.13 ± 0.04b 0.01 0.97 East Asian 206 1.21 ± 0.02 1.19 ± 0.05 1.12 ± 0.05 0.20 Others 122 1.27 ± 0.04 1.21 ± 0.06 1.20 ± 0.11 0.64
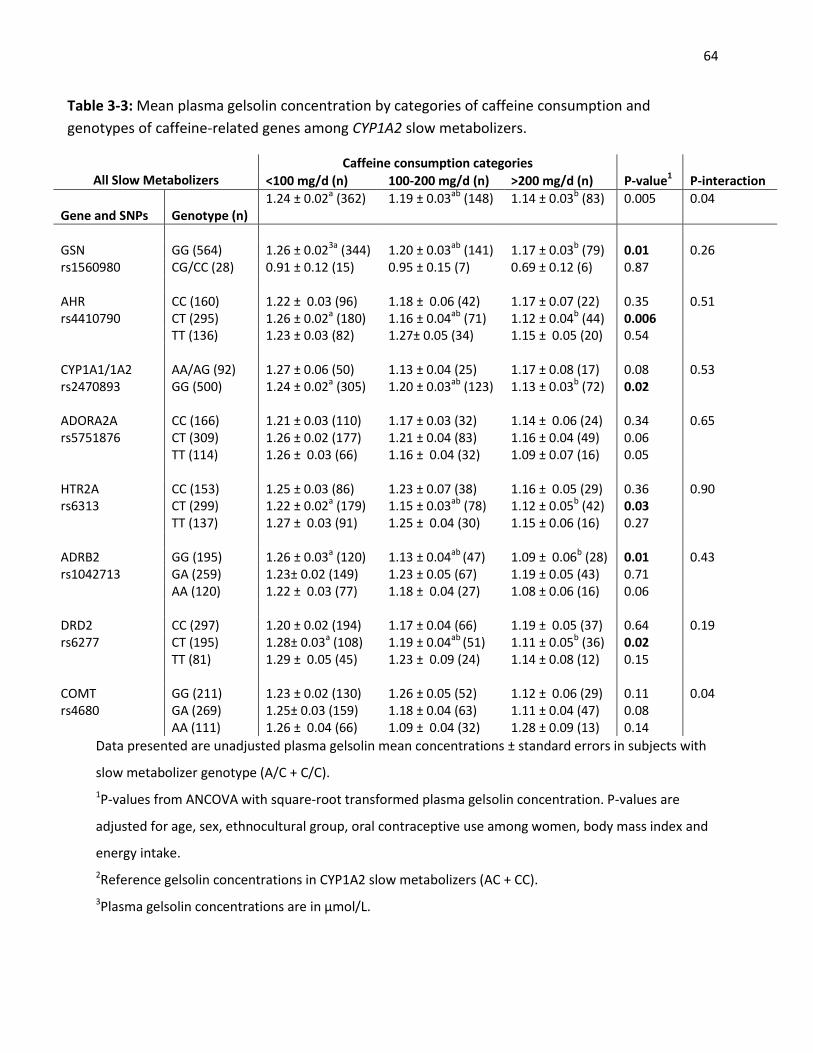
64
Table 3-3: Mean plasma gelsolin concentration by categories of caffeine consumption and
genotypes of caffeine-related genes among CYP1A2 slow metabolizers.
Data presented are unadjusted plasma gelsolin mean concentrations ± standard errors in subjects with
slow metabolizer genotype (A/C + C/C).
1P-values from ANCOVA with square-root transformed plasma gelsolin concentration. P-values are
adjusted for age, sex, ethnocultural group, oral contraceptive use among women, body mass index and
energy intake.
2Reference gelsolin concentrations in CYP1A2 slow metabolizers (AC + CC).
3Plasma gelsolin concentrations are in µmol/L.
All Slow Metabolizers
Caffeine consumption categories
<100 mg/d (n) 100-200 mg/d (n) >200 mg/d (n) P-value1 P-interaction
1.24 ± 0.02a (362) 1.19 ± 0.03ab (148) 1.14 ± 0.03b (83) 0.005 0.04 Gene and SNPs Genotype (n)
GSN GG (564) 1.26 ± 0.023a (344) 1.20 ± 0.03ab (141) 1.17 ± 0.03b (79) 0.01 0.26 rs1560980 CG/CC (28) 0.91 ± 0.12 (15) 0.95 ± 0.15 (7) 0.69 ± 0.12 (6) 0.87 AHR CC (160) 1.22 ± 0.03 (96) 1.18 ± 0.06 (42) 1.17 ± 0.07 (22) 0.35 0.51 rs4410790 CT (295) 1.26 ± 0.02a (180) 1.16 ± 0.04ab (71) 1.12 ± 0.04b (44) 0.006 TT (136) 1.23 ± 0.03 (82) 1.27± 0.05 (34) 1.15 ± 0.05 (20) 0.54 CYP1A1/1A2 AA/AG (92) 1.27 ± 0.06 (50) 1.13 ± 0.04 (25) 1.17 ± 0.08 (17) 0.08 0.53 rs2470893 GG (500) 1.24 ± 0.02a (305) 1.20 ± 0.03ab (123) 1.13 ± 0.03b (72) 0.02 ADORA2A CC (166) 1.21 ± 0.03 (110) 1.17 ± 0.03 (32) 1.14 ± 0.06 (24) 0.34 0.65 rs5751876 CT (309) 1.26 ± 0.02 (177) 1.21 ± 0.04 (83) 1.16 ± 0.04 (49) 0.06 TT (114) 1.26 ± 0.03 (66) 1.16 ± 0.04 (32) 1.09 ± 0.07 (16) 0.05 HTR2A CC (153) 1.25 ± 0.03 (86) 1.23 ± 0.07 (38) 1.16 ± 0.05 (29) 0.36 0.90 rs6313 CT (299) 1.22 ± 0.02a (179) 1.15 ± 0.03ab (78) 1.12 ± 0.05b (42) 0.03 TT (137) 1.27 ± 0.03 (91) 1.25 ± 0.04 (30) 1.15 ± 0.06 (16) 0.27 ADRB2 GG (195) 1.26 ± 0.03a (120) 1.13 ± 0.04ab (47) 1.09 ± 0.06b (28) 0.01 0.43 rs1042713 GA (259) 1.23± 0.02 (149) 1.23 ± 0.05 (67) 1.19 ± 0.05 (43) 0.71 AA (120) 1.22 ± 0.03 (77) 1.18 ± 0.04 (27) 1.08 ± 0.06 (16) 0.06 DRD2 CC (297) 1.20 ± 0.02 (194) 1.17 ± 0.04 (66) 1.19 ± 0.05 (37) 0.64 0.19 rs6277 CT (195) 1.28± 0.03a (108) 1.19 ± 0.04ab (51) 1.11 ± 0.05b (36) 0.02 TT (81) 1.29 ± 0.05 (45) 1.23 ± 0.09 (24) 1.14 ± 0.08 (12) 0.15 COMT GG (211) 1.23 ± 0.02 (130) 1.26 ± 0.05 (52) 1.12 ± 0.06 (29) 0.11 0.04 rs4680 GA (269) 1.25± 0.03 (159) 1.18 ± 0.04 (63) 1.11 ± 0.04 (47) 0.08 AA (111) 1.26 ± 0.04 (66) 1.09 ± 0.04 (32) 1.28 ± 0.09 (13) 0.14
65
3.5 Discussion:
Within slow metabolizers, plasma gelsolin concentrations were stratified by the
rs1560980 SNP in GSN. We expected the association between caffeine and gelsolin to be more
significant in this subgroup of subjects who were slow metabolizers as there was no influence
of caffeine on gelsolin concentrations among fast metabolizers. Subjects homozygous for the G
allele in the GSN gene continued to show decreased plasma gelsolin with increased caffeine
intake and a significant difference was seen between subjects consuming >200 mg/d of caffeine
and those consuming <100 mg/d. No significant differences in plasma gelsolin concentrations
were found in carriers of the C allele; however, this could be due to the low sample size (n=28)
in this subgroup. Although a similar trend in gelsolin concentrations was observed, this
difference in protein concentration between the three levels of caffeine intake was not more
significant than our previous analysis described in Chapter 2. We then stratified our analysis by
ethnocultural group and observed that gelsolin concentrations were inversely associated with
caffeine intake in Caucasians and East Asians, but the association was only significant among
Caucasians. In the present study, East Asians tended to have lower plasma concentrations of
gelsolin compared to Caucasians, which is consistent with results from a previous study on
hormonal contraceptive use and the plasma proteome [191]. Although it is possible that the
association between caffeine consumption and plasma gelsolin is modified by ethnicity, the
interaction between caffeine and ethnocultural group on gelsolin concentrations in the current
analysis was not significant.
66
In the current study, although there were no significant caffeine-gene interactions, we
were still interested in stratifying our subjects by genotype in order to identify the association
between caffeine and gelsolin within SNPs in the AHR, ADORA2A, HTR2A, ADRB2, DRD2, COMT
and CYP1A1-1A2 gene regions. A significant inverse association between caffeine intake and
gelsolin was seen in the heterozygotes (CT genotype) at rs4410790 within the AHR gene. The
aryl-hydrocarbon receptor encoded by AHR is involved in the metabolism of xenobiotics and
the transcriptional regulation of CYP1A1 and CYP1A2 [226, 229]. A genome-wide association
study on habitual caffeine consumption showed that the rs4410790 SNP in AHR is associated
with caffeine intake [96]. Furthermore, a study based on a Costa Rican population found that
heavy caffeine consumers are likely to be carriers of the C allele for the rs4410790 SNP in AHR
[97]. In the current study, although more subjects across all the genotypes seem to be
consuming caffeine at the lowest intake category, the study population and the range of
caffeine intake are very different from those studied in the Costa Rican population. These
differences may have resulted in discrepancies between current findings and those of the Costa
Rican study in regards to AHR’s association with caffeine intake.
In addition to CYP1A2, CYP1A1 also has a role in caffeine metabolism [56]. In the current
study, subjects homozygous for the G allele at rs2470893 within the CYP1A1-1A2 gene region
showed a significant inverse association between caffeine intake and plasma gelsolin
concentrations. Similar to AHR, polymorphisms within the CYP1A1-1A2 gene regions have been
associated with caffeine consumption in GWAS as well [96, 97]. CYP1A1 is co-regulated with
CYP1A2 and encodes the aromatic hydrocarbon hydroxylase enzyme, which is involved in the
metabolism of benzo(a)pyrene found in coffee [230, 231]. A study by Terry et al., suggested
67
that polymorphic variants in CYP1A1 may modify the association between caffeine and ovarian
cancer in women [231]. In the current study, plasma gelsolin concentrations decreased
significantly as caffeine intake increased in subjects homozygous for the G allele in the CYP1A1-
1A2 gene region. Since plasma gelsolin levels are associated with several types of cancer
including ovarian cancer [232], it may be of interest for future research to investigate whether
SNPs within the CYP1A1-1A2 region modify the association between caffeine intake and ovarian
cancer.
Subjects homozygous for the G allele in the ADRB2 gene demonstrated the greatest
range of decrease in gelsolin levels with increased caffeine intake. The 2-adrenoceptor
(ADRB2) is a G-protein coupled receptor that plays a role in mediating the actions of
catecholamines in different tissues [233, 234]. Several polymorphisms have been identified
within ADRB2 including the nonsynonymous Gly16Arg [235].This polymorphism involves a G to
A single nucleotide substitution at position 46 of the ADR2 gene (A46G), and has been
associated with altered receptor function [236]. Studies show that GG homozygotes had
reduced resting ventricular function and attenuated vasodilatation compared to individuals
homozygous for the A allele [237, 238]. Some epidemiological studies on blood pressure and
cardiovascular health also found significant associations between the A46G polymorphism of
ADRB2 and blood pressure regulation. A cross-sectional study by Castellano et al.,[239] noted
that in a subgroup of younger individuals (below 50 years old), GG homozygotes had higher
systolic blood pressure compared to AA homozygotes. More recently, a meta-analysis on
polymorphisms in ADRB2 and the risk of essential hypertension also showed an association
between A46G and blood pressure; however, this association was only significant in a mixed
68
African population [240]. Although there is no evidence or support for a relationship between
ADRB2 A46G and plasma gelsolin levels, it is still interesting to see that within the slow
metabolizers – those that are more prone to the cardiovascular effects caffeine, GG
homozygotes showed the greatest decrease in gelsolin concentrations with increased caffeine
consumption. This observation may have implications for cardiovascular risk in slow
metabolizers and future research is needed. It is also of interest to note that polymorphisms
within ADRB2 have been associated with increased systolic blood pressure in response to
caffeine intake as well [241].
Polymorphisms within HTR2A and DRD2 were also associated with a modest, but
significant decrease in plasma gelsolin concentrations with increased caffeine consumption. 5-
HT2A (encoded by HTR2A), is a serotonin receptor widely expressed throughout the brain [242].
Caffeine intake has been associated with the up-regulation of 5-HT2A in the brain [243, 244],
which increases serotonin release [245]. Therefore, serotonin receptors such as 5-HT2A, are
considered as possible downstream targets of caffeine [243, 244], and may explain caffeine’s
influence on mood and the cardiovascular system. Similar to the other genes mentioned earlier,
several polymorphisms have been identified within the HTR2A gene as well.The most studied
variant of HTR2A is a single nucleotide substitution from C to T (rs6313) at position 102 that
results in a synonymous polymorphism [246, 247]. In addition to its association with
schizophrenia, this T102C polymorphism has also been associated with CVD. For example,
individuals with the TT genotype have been found to have higher platelet aggregation [248,
249], and have been associated with the development of MI [250] as well as the metabolic
syndrome [251]. In contrast, another study looking at the genetic determinants of coffee
69
consumption and risk of MI reported that subjects with the combined -163C allele for CYP1A2
and CC genotype for HTR2A are at a higher risk for MI with increasing consumption of coffee
[228]. The authors suggested that individuals with the slow metabolizer genotype may be at
increased risk of CVD via mechanisms promoting blood pressure increase and the serotonergic
system [228]. However, in the current study, the significant decrease in gelsolin concentration
was only noted in CT heterozygotes and not in either homozygote. This observation is likely due
to the much higher number of subjects with the CT genotype in the study population.
The DRD2 gene codes for the dopamine D2 receptor, which is found in the brain, spinal
cord, and the systemic arteries [252]. D2 receptors co-localize and interact with A2A receptors
such that they can counteract the activation of adenylate cyclase by the A2A receptor [253-255].
Because of these interactions, adenosine A2A receptor antagonists such as caffeine can trigger
the activation of D2 receptors and lead to the potentiation of dopaminergic signalling [256,
257]. Therefore, the stimulatory effects of caffeine on the motor system are attributed to the
interactions between D2 and A2A receptors [258]. In addition, research also suggests that the D2
receptors are associated with the reinforcing effects of caffeine as dopamine is known for its
role in mood and reward [3]. A study on habitual caffeine consumption showed that the C957T
polymorphism (rs6277) in DRD2 is significantly associated with caffeine consumption in slow
metabolizers [228]. Therefore, the author suggested that the dopamine D2 receptor may be
required for producing a stronger reinforcing effect in this sub-group of individuals as slow
caffeine metabolizers experience prolonged exposure to caffeine [228]. In the current study,
there was also a higher frequency of individuals with the C allele who are also slow caffeine
metabolizers. This group of individuals showed a significant decrease in plasma gelsolin with
70
increased caffeine intake. Since gelsolin may play a role in CVD, the combination of a slow
metabolizer genotype and the DRD2 C allele may have implications for CVD risk. However,
there is no published data on the relationship between plasma gelsolin and DRD2. Further
investigation is required for understanding the effects of this polymorphism on gelsolin
concentrations and possibly CVD.
In summary, we observed that within the slow caffeine metabolizers, the overall
association between caffeine intake and plasma gelsolin concentrations remained consistent
across all variants within the seven genes examined. Although some associations were
significant while others were not, the range of difference in plasma gelsolin concentrations was
not more significant than what was observed in the entire population (Chapter 2) and no
significant caffeine x gene interactions were seen for any of the SNPs. These observations are
likely due to the low subject numbers for several genotypes. An uneven distribution of subjects
across the various genotypes presented a challenge for identifying specific subgroups that may
be more influenced by caffeine intake.

71
Chapter 4: Overview and General Discussion
4.1 Overview
The hypotheses of this thesis were that (i) different levels of caffeine intake are
associated with plasma protein concentrations and (ii) these associations may be modified by a
polymorphism in CYP1A2 (rs762551, A>C) or in other caffeine-related genes. The objectives
were to determine whether individuals consuming different amounts of caffeine exhibit
differences in plasma protein concentrations and whether CYP1A2 genotype modifies any of
the associations observed. It was also of interest to see whether polymorphisms in other
caffeine-related genes modify the association between caffeine intake and plasma proteins
(gelsolin) within slow caffeine metabolizers. The summary of the findings from each
experimental chapter is as follows:
Objective 1 (Chapter 2): To determine whether different levels of caffeine intake are associated
with the concentrations of 54 high-abundance plasma proteins and whether the rs762551
CYP1A2 variant modifies any of the associations observed.
Results: Initially, no significant associations were found between caffeine intake and the plasma
proteome. After stratification by CYP1A2 genotype, we saw that among slow caffeine
metabolizers, plasma gelsolin concentrations were significantly lower in the highest category of
caffeine intake. No differences in protein concentrations were observed for fast metabolizers.
72
Objective 2 (Chapter 3): To determine whether polymorphisms in GSN, AHR, CYP1A1/1A2,
ADORA2A, HTR2A, ADRB2, DRD2, and COMT modify the association between caffeine intake
and plasma gelsolin concentrations in slow caffeine metabolizers.
Results: A significant inverse association between caffeine intake and plasma gelsolin
concentrations were seen in slow metabolizers with the GSN GG, AHR CT, CYP1A1/1A2 GG,
HTR2A CT, ADRB2 GG and DRD2 CT genotypes.
The above findings suggest that genetic variation in CYP1A2 plays a role in modifying the
association between caffeine intake and the plasma proteome. Caffeine intake is inversely
associated with plasma gelsolin concentrations, but only among slow metabolizers. As caffeine
metabolism is delayed in slow metabolizers, it is expected that these individuals will be more
influenced by the effects of caffeine. Indeed, previous research showed that with increasing
coffee consumption, subjects with the slow metabolizer genotype were more at risk for
developing MI and hypertension compared to fast metabolizers [10, 11]. In the present study,
plasma gelsolin concentrations were inversely associated with caffeine consumption in slow
metabolizers. Gelsolin is a multi-functional protein and has been implicated in the development
of CVD [216]. Since caffeine intake is associated with cardiovascular outcomes, the observation
that slow metabolizers who consume higher amounts of caffeine have lower plasma gelsolin
concentrations suggests that gelsolin may be involved in pathways linking caffeine to CVD.
73
4.2 Limitations
There are several limitations to be considered when interpreting the results of this
research. First, our study population consisted of generally healthy young adults who are at
lower risk for developing chronic diseases. Their plasma proteomic profiles likely reflect a
healthy range of proteins. Therefore, potential biomarkers of disease risk may have not been
prominent enough for us to capture in the current study. In addition, all serum and plasma
measurements were taken at one point in time, which is unlikely to represent long-term status
of disease risk. Furthermore, other unaccounted factors such as the stage of menstrual cycle,
may also affect the level of certain plasma proteins in female subjects [16].
Our data collection was initiated in 2004 when fewer highly caffeinated products (such
as energy drinks) were available to consumers. As seen from the amount of caffeine
consumption, the majority of our study population consumed caffeine at the lowest level of
intake (<100 mg/d). Consequently, the range of caffeine consumption in our study was
narrower compared to previous studies and may not reflect the effect of heavier caffeine
consumption (>400 mg/d). The majority of our subjects are also self-selected university
students and may not be representative of the overall Canadian population. The smaller sample
of East Asians and South Asians in our study population may have also compromised the
ethnicity-specific analyses in this study by making comparisons between subjects from different
ethnocultural groups more difficult. Therefore, the generalisability of our results may be
limited.
74
The MRM assay used in the current study for quantifying plasma proteins was based on
the measurement of surrogate protein peptides with an assumption of 100% digestion
efficiency. The possibility of incomplete digestion still exists and may contribute to slight
inaccuracies in protein concentrations. However, MRM assays are generally considered very
reproducible, which is supported by its low intra- and interassay variability. Furthermore, to
minimize Type I error resulting from multiple comparisons between caffeine intake and 54
plasma proteins, a post-hoc Bonferroni correction was applied. None of the proteins showed
any significant differences even after CYP1A2 stratification when measured against the
Bonferroni P-value. However, the Bonferroni correction may be overly conservative and may
have inflated the probability of Type II errors [259]. Therefore, a less conservative approach
was taken and the results were interpreted at a significance level of P<0.05 (as obtained from a
Tukey’s post-hoc test).
The cross-sectional nature of the current study also prevents us from drawing any causal
relationship between caffeine intake and the plasma proteome. Caffeine is likely consumed on
a daily basis throughout life in habitual caffeine consumers; therefore, it is important to
examine the impact of long-term caffeine consumption on plasma protein concentrations. The
observed association between caffeine intake and plasma gelsolin concentrations in slow
metabolizers requires further confirmation through prospective and experimental studies.
When slow metabolizers were examined by looking at the association between caffeine
and gelsolin concentrations in other caffeine-related genes, the number of subjects was
unevenly distributed across the three genotypes within each gene. For example, the
75
CYP1A1/1A2 GG+GA and DRD2 TT genotypes had very low subject numbers. Small sample sizes
would have increased the risk of both Type I and Type II errors. Finally, despite adjustment for a
range of covariates in the statistical models and stratifying the study population by CYP1A2
genotype, the possibility of residual confounding still exists.
4.3 Future Directions
The current project has provided insight into the influence of caffeine on the plasma
proteome and supported the modifying effect of CYP1A2 on caffeine and health. The plasma
proteome is very dynamic and varies in response to external as well as intern influences that
occur during development, aging, health and disease [260]. However, despite controversial
findings on caffeine and certain health outcomes, no studies have examined caffeine’s
association with the plasma proteome. Therefore, our study provides a ‘first look’ at caffeine
and its potential relationship with a set of high-abundance plasma proteins, which future
research can be built upon. Taking into consideration some of the limitations of the current
research, it may be important for future studies to look at cohorts that consume caffeine at a
higher level. Since previous research has demonstrated a dose-response relationship between
caffeine and certain biological effects [58, 112], comparing plasma proteomics profiles of
heavier caffeine consumers (>400 mg/d) to those that consume little or no caffeine may be
more reflective of the influence of caffeine on plasma proteins. Alternatively, another approach
to confirm the current finding of an inverse association between caffeine intake and plasma
gelsolin concentrations could be to focus on subjects consuming caffeine at the >200 mg/d
76
category and to see whether plasma gelsolin concentrations continue to decrease with
increasing caffeine intake.
Gelsolin has been implicated in the development of various diseases including CVD
[216]. As caffeine consumption is also associated with CVD, future research is needed to
confirm whether gelsolin plays a role in pathways relating caffeine to CVD. It may be interesting
to compare plasma gelsolin concentrations in habitual caffeine consumers with CVD and those
without the disease. In addition to CVD, studies could look at other health outcomes or diseases
that are associated with both gelsolin and caffeine intake. It is also of importance to note that
studies on the cardiovascular effects of caffeine should always consider and stratify subjects by
CYP1A2 polymorphism to minimize residual confounding.
The exploratory analyses on caffeine-related genes were limited by low subject
numbers with certain genotypes. Larger sample sizes are required to provide more meaningful
results and to lower the chances of committing Type I and Type II errors. Future studies could
exam these caffeine-related genes and determine whether an interaction exists between them
and CYP1A2 genotype and the plasma proteome. Furthermore, studies should also confirm and
expand on the current findings in other cohorts that have a wider range of demographic
differences. A less homogeneous population would improve the generalisability of results and
provide more insight into caffeine’s influence over the plasma proteome in different ethnic
groups. In addition, the current study population is unique as it consists of mainly university
students and a higher proportion of females. Therefore, future studies could also examine the
77
effect of caffeine on plasma proteins in different age groups as the concentration of some
plasma proteins may change during development [261, 262].
In summary, findings from the present research have demonstrated that increased
caffeine intake is associated with decreased plasma gelsolin concentrations; however, this
effect was only unmasked in subjects with the slow metabolizers genotype for CYP1A2. Future
studies are needed to confirm the results of this research and further explore gelsolin’s role in
pathways common to both caffeine intake and disease development.
78
References
1. Wang, Y. and C.T. Ho, Polyphenolic chemistry of tea and coffee: a century of progress. J Agric Food Chem, 2009. 57(18): p. 8109-14.
2. Mohanpuria, P., V. Kumar, and S. Yadav, Tea caffeine: Metabolism, functions, and reduction strategies. Food Science and Biotechnology, 2010. 19(2): p. 275-287.
3. Ferre, S., An update on the mechanisms of the psychostimulant effects of caffeine. J Neurochem, 2008. 105(4): p. 1067-79.
4. Frary, C.D., R.K. Johnson, and M.Q. Wang, Food sources and intakes of caffeine in the diets of persons in the United States. J Am Diet Assoc, 2005. 105(1): p. 110-3.
5. Butt, M.S. and M.T. Sultan, Coffee and its consumption: benefits and risks. Crit Rev Food Sci Nutr, 2011. 51(4): p. 363-73.
6. Mesas, A.E., et al., The effect of coffee on blood pressure and cardiovascular disease in hypertensive individuals: a systematic review and meta-analysis. The American journal of clinical nutrition, 2011. 94(4): p. 1113-1126.
7. Bohn, S.K., et al., Effects of tea and coffee on cardiovascular disease risk. Food Funct, 2012. 8. Wu, J.N., et al., Coffee consumption and risk of coronary heart diseases: a meta-analysis of 21
prospective cohort studies. Int J Cardiol, 2009. 137(3): p. 216-25. 9. Rodenburg, E.M., et al., CYP1A2 and coffee intake and the modifying effect of sex, age, and
smoking. Am J Clin Nutr, 2012. 96(1): p. 182-7. 10. Cornelis, M.C., et al., Coffee, CYP1A2 genotype, and risk of myocardial infarction. JAMA, 2006.
295(10): p. 1135-41. 11. Palatini, P., et al., CYP1A2 genotype modifies the association between coffee intake and the risk
of hypertension. J Hypertens, 2009. 27(8): p. 1594-601. 12. Tan, E.-K., et al., Association between caffeine intake and risk of Parkinson's disease among fast
and slow metabolizers. Pharmacogenetics and Genomics, 2007. 17(11): p. 1001-1005. 13. Kotsopoulos, J., et al., The CYP1A2 genotype modifies the association between coffee
consumption and breast cancer risk among BRCA1 mutation carriers. Cancer Epidemiology Biomarkers & Prevention, 2007. 16(5): p. 912-916.
14. Hallstrom, H., et al., Coffee consumption and CYP1A2 genotype in relation to bone mineral density of the proximal femur in elderly men and women: a cohort study. Nutr Metab (Lond), 2010. 7(1): p. 12.
15. Hüttenhain, R., et al., Perspectives of targeted mass spectrometry for protein biomarker verification. Current opinion in chemical biology, 2009. 13(5): p. 518-525.
16. Garcia-Bailo, B., et al., Dietary patterns and ethnicity are associated with distinct plasma proteomic groups. Am J Clin Nutr, 2012. 95(2): p. 352-61.
17. Mumin, A., et al., Determination and Characterization of Caffeine in Tea, Coffee and Soft Drinks by Solid Phase Extraction and High Performance Liquid Chromatography (SPE – HPLC). Malaysian Journal of Chemistry, 2006. 8(1): p. 045-051.
18. Weinberg, B.A. and B.K. Bealer, The world of caffeine: the science and culture of the world's most popular drug. 2001, New York: Routledge.
19. Spiller, G.A., Caffeine. 1998, Boca Raton, Florida: CRC Press LLC. 20. Nawrot, P., et al., Effects of caffeine on human health. Food Additives and Contaminants, 2003.
20(1): p. 1-30. 21. Smith, B.D., U. Gupta, and B.S. Gupta, eds. Caffeine and activation theory : effects on health and
behavior. 2007, CRC Press/Taylor&Francis: Boca Raton, FL.
79
22. Heckman, M.A., J. Weil, and E. Gonzalez de Mejia, Caffeine (1, 3, 7-trimethylxanthine) in foods: a comprehensive review on consumption, functionality, safety, and regulatory matters. J Food Sci, 2010. 75(3): p. R77-87.
23. Barone, J.J. and H.R. Roberts, Caffeine consumption. Food Chem Toxicol, 1996. 34(1): p. 119-29. 24. Ogawa, N. and H. Ueki, Clinical importance of caffeine dependence and abuse. Psychiatry Clin
Neurosci, 2007. 61(3): p. 263-8. 25. IFIC (2008) Caffeine & Health: Clarifying The Controversies. 26. Lieberman, H.R., R.B. Kanarek, and C. Prasad, Nutritional neuroscience. Nutrition, brain, and
behavior. 2005, Boca Raton: Taylor & Francis. 410 p. 27. Hortons, T. Nutritional information. 2008 November 12, 2009]; Available from:
http://www.timhortons.com/ca/en/menu/menu_info.html ( 28. Starbucks. starbucks beverages. 2009 November 12, 2009]; Available from:
http://www.starbucks.com/retail/nutrition_beverages.asp 29. Cup, S. nutritional information. 2009 November 12, 2009]; Available from:
http://www.secondcup.com/eng/nutrition.php 30. Chin, J.M., et al., Caffeine content of brewed teas. J Anal Toxicol, 2008. 32(8): p. 702-4. 31. McCusker, R.R., B.A. Goldberger, and E.J. Cone, Caffeine content of specialty coffees. J Anal
Toxicol, 2003. 27(7): p. 520-2. 32. Chou, T., Wake up and smell the coffee. Caffeine, coffee, and the medical consequences.
Western Journal of Medicine, 1992. 157(5): p. 544. 33. Gilbert, R.M., Caffeine consumption. Progress in clinical and biological research, 1984. 158: p.
185-213. 34. Brice, C.F. and A.P. Smith, Factors associated with caffeine consumption. Int J Food Sci Nutr,
2002. 53(1): p. 55-64. 35. Cornelis, M.C., A. El-Sohemy, and H. Campos, Genetic polymorphism of the adenosine A2A
receptor is associated with habitual caffeine consumption. American Journal of Clinical Nutrition, 2007. 86(1): p. 240-244.
36. Brathwaite, J.M., L.A. Da Costa, and A. El-Sohemy, Catechol-O-methyltransferase genotype is associated with self-reported increased heart rate following caffeine consumption. Journal of Caffeine Research, 2011. 1(2): p. 123-130.
37. Nehlig, A., Coffee, Tea, Chocolate, and the Brain, A. Nehlig, Editor. 2004, Taylor & Francis. 38. U.S. Department of Agriculture, A.R.S., USDA National Nutrient Database for Standard
Reference, Release 23. . 2010. 39. Blanchard, J. and S. Sawers, The absolute bioavailability of caffeine in man. European journal of
clinical pharmacology, 1983. 24(1): p. 93-98. 40. Arnaud, M., Metabolism of caffeine and other components of coffee. 1993, Raven Press, New
York. 41. Bonati, M., R. Latini, and F. Galletti, Caffeine disposition after oral doses. Clinical Pharmacology
and Therapeutics, 1982. 32(1): p. 98-106. 42. Higaki, K., et al., Mechanistic understanding of time-dependent oral absorption based on gastric
motor activity in humans. Eur J Pharm Biopharm, 2008. 70(1): p. 313-25. 43. Kamimori, G.H., et al., The rate of absorption and relative bioavailability of caffeine administered
in chewing gum versus capsules to normal healthy volunteers. International journal of pharmaceutics, 2002. 234(1): p. 159-167.
44. Arnaud, M.J., Pharmacokinetics and metabolism of natural methylxanthines in animal and man, in Methylxanthines. 2011, Springer. p. 33-91.
45. Arnaud, M.J., Identification, kinetic and quantitative study of [2-14C] and [1-Me-14C]caffeine metabolites in rat's urine by chromatographic separations. Biochem Med, 1976. 16(1): p. 67-76.
80
46. Knutti, R., H. Rothweiler, and C. Schlatter, The effect of pregnancy on the pharmacokinetics of caffeine. Arch Toxicol Suppl, 1982. 5: p. 187-92.
47. Khanna, N.N. and S.M. Somani, Maternal coffee drinking and unusually high concentrations of caffeine in the newborn. J Toxicol Clin Toxicol, 1984. 22(5): p. 473-83.
48. Kot, M. and W.A. Daniel, Caffeine as a marker substrate for testing cytochrome P450 activity in human and rat. Pharmacol Rep, 2008. 60(6): p. 789-97.
49. Lelo, A., et al., Comparative pharmacokinetics of caffeine and its primary demethylated metabolites paraxanthine, theobromine and theophylline in man. British journal of clinical pharmacology, 1986. 22(2): p. 177-182.
50. Lelo, A., et al., Assessment of caffeine exposure: caffeine content of beverages, caffeine intake, and plasma concentrations of methylxanthines. Clin Pharmacol Ther, 1986. 39(1): p. 54-9.
51. Eteng, M., et al., Recent advances in caffeine and theobromine toxicities: a review. Plant foods for human nutrition, 1997. 51(3): p. 231-243.
52. Tarka, S.M., et al., Theobromine kinetics and metabolic disposition. Clinical Pharmacology & Therapeutics, 1983. 34(4): p. 546-555.
53. Kelly, C.J., Effects of theobromine should be considered in future studies. The American journal of clinical nutrition, 2005. 82(2): p. 486-487.
54. Stavric, B., Methylxanthines: toxicity to humans. 1. Theophylline. Food and chemical toxicology, 1988. 26(6): p. 541-565.
55. Mandel, H.G., Update on caffeine consumption, disposition and action. Food Chem Toxicol, 2002. 40(9): p. 1231-4.
56. Thorn, C.F., et al., PharmGKB summary: caffeine pathway. Pharmacogenet Genomics, 2012. 22(5): p. 389-95.
57. Tassaneeyakul, W., et al., Caffeine metabolism by human hepatic cytochromes P450: contributions of 1A2, 2E1 and 3A isoforms. Biochem Pharmacol, 1994. 47(10): p. 1767-76.
58. Kaplan, G.B., et al., Dose-dependent pharmacokinetics and psychomotor effects of caffeine in humans. J Clin Pharmacol, 1997. 37(8): p. 693-703.
59. Benowitz, N.L., Clinical pharmacology of caffeine. Annual Review of Medicine, 1990. 41(1): p. 277-288.
60. Pons, G., et al., Maturation of caffeine N-demethylation in infancy: a study using the 13CO2 breath test. Pediatr Res, 1988. 23(6): p. 632-6.
61. Ou‐Yang, D.S., et al., Phenotypic polymorphism and gender‐related differences of CYP1A2 activity in a Chinese population. British journal of clinical pharmacology, 2000. 49(2): p. 145-151.
62. Patwardhan, R., et al., Impaired elimination of caffeine by oral contraceptive steroids. The Journal of laboratory and clinical medicine, 1980. 95(4): p. 603.
63. Carrillo, J.A. and J. Benitez, CYP1A2 activity, gender and smoking, as variables influencing the toxicity of caffeine. Br J Clin Pharmacol, 1996. 41(6): p. 605-8.
64. Fisher, C.D., et al., Hepatic Cytochrome P450 Enzyme Alterations in Humans with Progressive Stages of Nonalcoholic Fatty Liver Disease. Drug metabolism and disposition, 2009. 37(10): p. 2087-2094.
65. Schweikl, H., et al., Expression of CYP1A1 and CYP1A2 genes in human liver. Pharmacogenetics and Genomics, 1993. 3(5): p. 239-249.
66. Shimada, T., et al., Interindividual variations in human liver cytochrome P-450 enzymes involved in the oxidation of drugs, carcinogens and toxic chemicals: studies with liver microsomes of 30 Japanese and 30 Caucasians. Journal of Pharmacology and Experimental Therapeutics, 1994. 270(1): p. 414-423.
81
67. Sansen, S., et al., Adaptations for the oxidation of polycyclic aromatic hydrocarbons exhibited by the structure of human P450 1A2. Journal of Biological Chemistry, 2007. 282(19): p. 14348-14355.
68. Bertilsson, L., et al., Clozapine disposition covaries with CYP1A2 activity determined by a caffeine test. British journal of clinical pharmacology, 1994. 38(5): p. 471-473.
69. Ring, B.J., et al., Identification of the human cytochromes P450 responsible for the in vitro formation of the major oxidative metabolites of the antipsychotic agent olanzapine. Journal of Pharmacology and Experimental Therapeutics, 1996. 276(2): p. 658-666.
70. Yamazaki, H., et al., Roles of cytochromes P450 1A2 and 3A4 in the oxidation of estradiol and estrone in human liver microsomes. Chemical research in toxicology, 1998. 11(6): p. 659-665.
71. Zaccaro, C., et al., Role of cytochrome P450 1A2 in bilirubin degradation Studies in< i> Cyp1a2</i>(−/−) mutant mice. Biochemical pharmacology, 2001. 61(7): p. 843-849.
72. Eaton, D.L., et al., Role of cytochrome P4501A2 in chemical carcinogenesis: implications for human variability in expression and enzyme activity. Pharmacogenetics and Genomics, 1995. 5(5): p. 259-274.
73. Boobis, A.R., et al., CYP1A2-catalyzed conversion of dietary heterocyclic amines to their proximate carcinogens is their major route of metabolism in humans. Cancer Research, 1994. 54(1): p. 89-94.
74. Gunes, A. and M.-L. Dahl, Variation in CYP1A2 activity and its clinical implications: influence of environmental factors and genetic polymorphisms. Pharmacogenomics, 2008. 9(5): p. 625-637.
75. Zevin, S. and N.L. Benowitz, Drug interactions with tobacco smoking. Clinical pharmacokinetics, 1999. 36(6): p. 425-438.
76. Ma, Q. and A.Y. Lu, CYP1A induction and human risk assessment: an evolving tale of in vitro and in vivo studies. Drug metabolism and disposition, 2007. 35(7): p. 1009-1016.
77. Granfors, M.T., et al., Oral contraceptives containing ethinyl estradiol and gestodene markedly increase plasma concentrations and effects of tizanidine by inhibiting cytochrome P450 1A2. Clin Pharmacol Ther, 2005. 78(4): p. 400-11.
78. Balogh, A., et al., Influence of ethinylestradiol-containing combination oral contraceptives with gestodene or levonorgestrel on caffeine elimination. European journal of clinical pharmacology, 1995. 48(2): p. 161-166.
79. Murray, M., Altered CYP expression and function in response to dietary factors: potential roles in disease pathogenesis. Curr Drug Metab, 2006. 7(1): p. 67-81.
80. Peterson, S., et al., Apiaceous vegetable constituents inhibit human cytochrome P-450 1A2 (hCYP1A2) activity and hCYP1A2-mediated mutagenicity of aflatoxin B1. Food Chem Toxicol, 2006. 44(9): p. 1474-84.
81. Kall, M. and J. Clausen, Dietary effect on mixed function P450 1A2 activity assayed by estimation of caffeine metabolism in man. Human & experimental toxicology, 1995. 14(10): p. 801-807.
82. Astorino, T.A. and D.W. Roberson, Efficacy of acute caffeine ingestion for short-term high-intensity exercise performance: a systematic review. The Journal of Strength & Conditioning Research, 2010. 24(1): p. 257-265.
83. Vistisen, K., H.E. Poulsen, and S. Loft, Foreign compound metabolism capacity in man measured from metabolites of dietary caffeine. Carcinogenesis, 1992. 13(9): p. 1561-1568.
84. Perera, V., A. Gross, and A. McLachlan, Influence of environmental and genetic factors on CYP1A2 activity in individuals of South Asian and European ancestry. Clinical Pharmacology & Therapeutics, 2012. 92(4): p. 511-519.
85. Relling, M.V., et al., Racial and gender differences in N-acetyltransferase, xanthine oxidase, and CYP1A2* activities. Clinical Pharmacology & Therapeutics, 1992. 52(6): p. 643-658.
82
86. Ghotbi, R., et al., Comparisons of CYP1A2 genetic polymorphisms, enzyme activity and the genotype-phenotype relationship in Swedes and Koreans. Eur J Clin Pharmacol, 2007. 63(6): p. 537-46.
87. Rasmussen, B.B., et al., The interindividual differences in the 3-demthylation of caffeine alias CYP1A2 is determined by both genetic and environmental factors. Pharmacogenetics, 2002. 12(6): p. 473-8.
88. Browning, S.L., et al., CYP1A2 is more variable than previously thought: a genomic biography of the gene behind the human drug-metabolizing enzyme. Pharmacogenetics and Genomics, 2010. 20(11): p. 647-664.
89. Jiang, Z., et al., Toward the evaluation of function in genetic variability: characterizing human SNP frequencies and establishing BAC-transgenic mice carrying the human CYP1A1_CYP1A2 locus. Hum Mutat, 2005. 25(2): p. 196-206.
90. Ikeya, K., et al., Human CYP1A2: sequence, gene structure, comparison with the mouse and rat orthologous gene, and differences in liver 1A2 mRNA expression. Mol Endocrinol, 1989. 3(9): p. 1399-408.
91. Yang, A., A.A. Palmer, and H. de Wit, Genetics of caffeine consumption and responses to caffeine. Psychopharmacology (Berl), 2010. 211(3): p. 245-57.
92. Sachse, C., et al., Polymorphisms in the cytochrome P450 CYP1A2 gene (CYP1A2) in colorectal cancer patients and controls: allele frequencies, linkage disequilibrium and influence on caffeine metabolism. Br J Clin Pharmacol, 2003. 55(1): p. 68-76.
93. Sachse, C., et al., Functional significance of a C-->A polymorphism in intron 1 of the cytochrome P450 CYP1A2 gene tested with caffeine. Br J Clin Pharmacol, 1999. 47(4): p. 445-9.
94. Djordjevic, N., et al., Induction of CYP1A2 by heavy coffee consumption is associated with the CYP1A2− 163C> A polymorphism. European journal of clinical pharmacology, 2010. 66(7): p. 697-703.
95. Guessous, I., et al., Caffeine intake and CYP1A2 variants associated with high caffeine intake protect non-smokers from hypertension. Hum Mol Genet, 2012. 21(14): p. 3283-92.
96. Cornelis, M.C., et al., Genome-wide meta-analysis identifies regions on 7p21 (AHR) and 15q24 (CYP1A2) as determinants of habitual caffeine consumption. PLoS genetics, 2011. 7(4): p. e1002033.
97. Josse, A.R., et al., Associations between polymorphisms in the AHR and CYP1A1-CYP1A2 gene regions and habitual caffeine consumption. Am J Clin Nutr, 2012. 96(3): p. 665-71.
98. Wilson, C. and J. Mustafa, eds. Adenosine Receptors in Health and Disease. 2009, Springer: New York.
99. Dunwiddie, T.V. and S.A. Masino, The role and regulation of adenosine in the central nervous system. Annual Review of Neuroscience, 2001. 24(1): p. 31-55.
100. Snyder, S.H., Adenosine as a neuromodulator. Annu Rev Neurosci, 1985. 8: p. 103-24. 101. Daly, J.W., R.F. Bruns, and S.H. Snyder, Adenosine receptors in the central nervous system:
Relationship to the central actions of methylxanthines. Life Sciences, 1981. 28(19): p. 2083-2097. 102. Snyder, S.H., Adenosine receptors and the actions of methylxanthines. Trends in Neurosciences,
1981. 4(C): p. 242-244. 103. Huang, Z.-L., et al., Adenosine A2A, but not A1, receptors mediate the arousal effect of caffeine.
Nature neuroscience, 2005. 8(7): p. 858-859. 104. Fredholm, B.B., et al., Actions of caffeine in the brain with special reference to factors that
contribute to its widespread use. Pharmacol Rev, 1999. 51(1): p. 83-133. 105. Fredholm, B.B., Adenosine, Adenosine Receptors and the Actions of Caffeine*. Pharmacology &
toxicology, 1995. 76(2): p. 93-101.
83
106. Childs, E., et al., Association between ADORA2A and DRD2 polymorphisms and caffeine-induced anxiety. Neuropsychopharmacology, 2008. 33(12): p. 2791-2800.
107. Trotta, E. and G. Freire, Inhibition by caffeine of calcium uptake by brain microsomal vesicles*. Journal of Pharmacy and Pharmacology, 1980. 32(1): p. 791-793.
108. Fredholm, B., Adenosine and central catecholamine neurotransmission. Adenosine: Receptors and modulation of cell function. IRL Press, Oxford, 1985: p. 91-106.
109. Howell, L.L., Comparative effects of caffeine and selective phosphodiesterase inhibitors on respiration and behavior in rhesus monkeys. Journal of Pharmacology and Experimental Therapeutics, 1993. 266(2): p. 894-903.
110. Garrett, B.E. and R.R. Griffiths, The role of dopamine in the behavioral effects of caffeine in animals and humans. Pharmacology Biochemistry and Behavior, 1997. 57(3): p. 533-541.
111. Lorist, M.M. and M. Tops, Caffeine, fatigue, and cognition. Brain Cogn, 2003. 53(1): p. 82-94. 112. Smith, A., Effects of caffeine on human behavior. Food Chem Toxicol, 2002. 40(9): p. 1243-55. 113. Brunye, T.T., et al., Caffeine enhances real-world language processing: evidence from a
proofreading task. J Exp Psychol Appl, 2012. 18(1): p. 95-108. 114. Ker, K., et al., Caffeine for the prevention of injuries and errors in shift workers. Cochrane
Database Syst Rev, 2010. 5. 115. Nehlig, A., Is caffeine a cognitive enhancer? J Alzheimers Dis, 2010. 20 Suppl 1: p. S85-94. 116. Strain, E.C., et al., Caffeine dependence syndrome. JAMA: the journal of the American Medical
Association, 1994. 272(13): p. 1043-1048. 117. Hughes, J.R., et al., Endorsement of DSM-IV dependence criteria among caffeine users. Drug and
Alcohol Dependence, 1998. 118. Lean, M.E. and A. Crozier, Coffee, caffeine and health: what's in your cup? Maturitas, 2012.
72(3): p. 171-2. 119. Juliano, L.M. and R.R. Griffiths, A critical review of caffeine withdrawal: empirical validation of
symptoms and signs, incidence, severity, and associated features. Psychopharmacology (Berl), 2004. 176(1): p. 1-29.
120. Evans, S.M. and R.R. Griffiths, Caffeine withdrawal: A parametric analysis of caffeine dosing conditions. Journal of Pharmacology and Experimental Therapeutics, 1999. 289(1): p. 285-294.
121. James, J.E. and P.J. Rogers, Effects of caffeine on performance and mood: Withdrawal reversal is the most plausible explanation. Psychopharmacology, 2005. 182(1): p. 1-8.
122. Temple, J.L., Caffeine use in children: What we know, what we have left to learn, and why we should worry. Neuroscience and Biobehavioral Reviews, 2009. 33(6): p. 793-806.
123. Magkos, F. and S.A. Kavouras, Caffeine use in sports, pharmacokinetics in man, and cellular mechanisms of action. Critical Reviews in Food Science and Nutrition, 2005. 45(7-8): p. 535-562.
124. Griffiths, R.R. and P.P. Woodson, Reinforcing properties of caffeine: Studies in humans and laboratory animals. Pharmacology Biochemistry and Behavior, 1988. 29(2): p. 419-427.
125. Roehrs, T. and T. Roth, Caffeine: Sleep and daytime sleepiness. Sleep Medicine Reviews, 2008. 12(2): p. 153-62.
126. Nawrot, P., et al., Effects of caffeine on human health. Food Additives & Contaminants, 2003. 20(1): p. 1-30.
127. Fruchart, J.-C., et al., New risk factors for atherosclerosis and patient risk assessment. Circulation, 2004. 109(23 suppl 1): p. III-15-III-19.
128. Krauss, R.M., et al., Dietary guidelines for healthy American adults. A statement for health professionals from the Nutrition Committee, American Heart Association. Circulation, 1996. 94(7): p. 1795-800.
129. Roger, V.L., et al., Heart Disease and Stroke Statistics—2012 Update A Report From the American Heart Association. Circulation, 2012. 125(1): p. e2-e220.
84
130. Greenberg, J.A., G. Chow, and R.C. Ziegelstein, Caffeinated coffee consumption, cardiovascular disease, and heart valve disease in the elderly (from the Framingham Study). American Journal of Cardiology, 2008. 102(11): p. 1502-1508.
131. Andersen, L.F., et al., Consumption of coffee is associated with reduced risk of death attributed to inflammatory and cardiovascular diseases in the Iowa Women's Health Study. American Journal of Clinical Nutrition, 2006. 83(5): p. 1039-1046.
132. Azevedo, A. and H. Barros, Coffee and myocardial infarction: Heterogeneity of an association in Portuguese men. European Journal of Cardiovascular Prevention and Rehabilitation, 2006. 13(2): p. 268-273.
133. Bidel, S., et al., Coffee consumption and risk of total and cardiovascular mortality among patients with type 2 diabetes. Diabetologia, 2006. 49(11): p. 2618-2626.
134. Mostofsky, E., et al., Coffee and acute ischemic stroke onset: The Stroke Onset Study. Neurology, 2010. 75(18): p. 1583-1588.
135. Happonen, P., S. Voutilainen, and J.T. Salonen, Coffee drinking Is dose-dependently related to the risk of acute coronary events in middle-aged men. The Journal of nutrition, 2004. 134(9): p. 2381-6.
136. Hammar, N., et al., Association of boiled and filtered coffee with incidence of first nonfatal myocardial infarction: The SHEEP and the VHEEP study. Journal of Internal Medicine, 2003. 253(6): p. 653-659.
137. Tavani, A., et al., Alcohol, smoking, coffee and risk of non-fatal acute myocardial infarction in Italy. European Journal of Epidemiology, 2002. 17(12): p. 1131-1137.
138. Tofler, O.B., et al., Coffee and coronary heart disease. Heart Lung and Circulation, 2001. 10(3): p. 116-120.
139. Reis, J.P., et al., Coffee, decaffeinated coffee, caffeine, and tea consumption in young adulthood and atherosclerosis later in life: The CARDIA study. Arteriosclerosis, Thrombosis, and Vascular Biology, 2010. 30: p. 2059-2066.
140. Ahmed, H.N., et al., Coffee consumption and risk of heart failure in men: An analysis from the Cohort of Swedish Men. American Heart Journal, 2009. 158(4): p. 667-672.
141. Zhang, W., et al., Coffee consumption and risk of cardiovascular diseases and all-cause mortality among men with type 2 diabetes. Diabetes Care, 2009. 32(6): p. 1043-1045.
142. Rosner, S.A., A. Akesson, and M.J. Stampfer, Coffee consumption and risk of myocardial infarction among older swedish women. American Journal of Epidemiology, 2007. 165(3): p. 288-93.
143. Lopez-Garcia, E., et al., Coffee consumption and coronary heart disease in men and women: A prospective cohort study. Circulation, 2006. 113(17): p. 2045-53.
144. De Koning Gans, J.M., et al., Tea and coffee consumption and cardiovascular morbidity and mortality. Arteriosclerosis, Thrombosis, and Vascular Biology, 2010. 30(8): p. 1665-1671.
145. Panagiotakos, D.B., et al., The J-shaped effect of coffee consumption on the risk of developing acute coronary syndromes: The CARDIO2000 case-control study. Journal of Nutrition, 2003. 133(10): p. 3228-3232.
146. Kleemola, P., P. Jousilahti, and P. Pietinen, Coffee consumption and the risk of coronary heart disease and death. Archives of internal medicine, 2000. 160(22): p. 3393-400.
147. Mineharu, Y., et al., Coffee, green tea, black tea and oolong tea consumption and risk of mortality from cardiovascular disease in Japanese men and women. J Epidemiol Community Health, 2010. In press.
148. Sugiyama, K., et al., Coffee consumption and mortality due to all causes, cardiovascular disease, and cancer in Japanese women. Journal of Nutrition, 2010. 140(5): p. 1007-1013.
85
149. Wang, Y., et al., Coffee consumption and the risk of heart failure in Finnish men and women. Heart, 2010.
150. Nilsson, L.M., et al., Consumption of filtered and boiled coffee and the risk of first acute myocardial infarction; A nested case/referent study. Nutrition, Metabolism & Cardiovascular Diseases, 2009. 20(7): p. 527-535.
151. Van Woudenbergh, G.J., et al., Coffee consumption and coronary calcification: The Rotterdam coronary calcification study. Arteriosclerosis, Thrombosis, and Vascular Biology, 2008. 28(5): p. 1018-1023.
152. Mostofsky, E., et al., Habitual Coffee Consumption and Risk of Heart FailureClinical Perspective A Dose-Response Meta-Analysis. Circulation: Heart Failure, 2012. 5(4): p. 401-405.
153. Sofi, F., et al., Coffee consumption and risk of coronary heart disease: a meta-analysis. Nutr Metab Cardiovasc Dis, 2007. 17(3): p. 209-23.
154. Baylin, A., et al., Transient exposure to coffee as a trigger of a first nonfatal myocardial infarction. Epidemiology, 2006. 17(5): p. 506-511.
155. Šemerl, J.S. and K. Šelb, Coffee and alcohol consumption as triggering factors for sudden cardiac death: Case-crossover study. Croatian Medical Journal, 2004. 45(6): p. 775-780.
156. Boggs, D., et al., Coffee, tea, and alcohol intake in relation to risk of type 2 diabetes in African American women. American Journal of Clinical Nutrition, 2010. 92(4): p. 960-966.
157. Oba, S., et al., Consumption of coffee, green tea, oolong tea, black tea, chocolate snacks and the caffeine content in relation to risk of diabetes in Japanese men and women. British Journal of Nutrition, 2010. 103(3): p. 453-459.
158. Cahill, L., and A. El-Sohemy, Nutrigenomics: A Possible Road to Personalized Nutrition, in Comprehensive Biotechnology, M. Moo-Young, Editor. 2011, Elsevier. p. 703-712.
159. Ross, G.W., et al., Association of coffee and caffeine intake with the risk of Parkinson disease. JAMA: the journal of the American Medical Association, 2000. 283(20): p. 2674-2679.
160. Tan, E.-K., et al., Dose-dependent protective effect of coffee, tea, and smoking in Parkinson's disease: a study in ethnic Chinese. Journal of the neurological sciences, 2003. 216(1): p. 163-167.
161. Sääksjärvi, K., et al., Prospective study of coffee consumption and risk of Parkinson's disease. European Journal of Clinical Nutrition, 2007. 62(7): p. 908-915.
162. Prediger, R.D., Effects of caffeine in Parkinson's disease: from neuroprotection to the management of motor and non-motor symptoms. Journal of Alzheimer's Disease, 2010. 20: p. 205-220.
163. Ascherio, A., et al., Prospective study of caffeine consumption and risk of Parkinson's disease in men and women. Annals of neurology, 2001. 50(1): p. 56-63.
164. Popat, R.A., et al., Coffee, ADORA2A, and CYP1A2: the caffeine connection in Parkinson’s disease. European Journal of Neurology, 2011. 18(5): p. 756-765.
165. Facheris, M.F., et al., Coffee, caffeine-related genes, and Parkinson's disease: A case–control study. Movement Disorders, 2008. 23(14): p. 2033-2040.
166. Baker, J.A., et al., Consumption of coffee, but not black tea, is associated with decreased risk of premenopausal breast cancer. The Journal of nutrition, 2006. 136(1): p. 166-171.
167. Vatten, L., K. Solvoll, and E. Løken, Coffee consumption and the risk of breast cancer. A prospective study of 14,593 Norwegian women. British journal of cancer, 1990. 62(2): p. 267.
168. Li, J., et al., Coffee consumption modifies risk of estrogen-receptor negative breast cancer. Breast Cancer Res, 2011. 13(3): p. R49.
169. Folsom, A.R., et al., No association between caffeine intake and postmenopausal breast cancer incidence in the Iowa Women's Health Study. American Journal of Epidemiology, 1993. 138(6): p. 380-383.
86
170. Ishitani, K., et al., Caffeine consumption and the risk of breast cancer in a large prospective cohort of women. Archives of internal medicine, 2008. 168(18): p. 2022.
171. Ritchie, M.D., et al., Multifactor-dimensionality reduction reveals high-order interactions among estrogen-metabolism genes in sporadic breast cancer. American journal of human genetics, 2001. 69(1): p. 138.
172. Wolfrom, D. and C. Welsch, Caffeine and the development of normal, benign and carcinomatous human breast tissues: a relationship? Journal of medicine, 1990. 21(5): p. 225.
173. Terry, P.D., A.B. Miller, and T.E. Rohan, Cigarette smoking and breast cancer risk: a long latency period? Int J Cancer, 2002. 100(6): p. 723-8.
174. Elenbaas, B., et al., Human breast cancer cells generated by oncogenic transformation of primary mammary epithelial cells. Genes & development, 2001. 15(1): p. 50-65.
175. Hong, C.-C., et al., Cytochrome P450 1A2 (CYP1A2) activity and risk factors for breast cancer: a cross-sectional study. Breast Cancer Res, 2004. 6(4): p. R352-R365.
176. Jernström, H., et al., Coffee intake and CYP1A2* 1F genotype predict breast volume in young women: implications for breast cancer. British journal of cancer, 2008. 99(9): p. 1534-1538.
177. Kato, I., et al., A nested case-control study of mammographic patterns, breast volume, and breast cancer (New York City, NY, United States). Cancer Causes Control, 1995. 6(5): p. 431-8.
178. Kusano, A.S., et al., A prospective study of breast size and premenopausal breast cancer incidence. Int J Cancer, 2006. 118(8): p. 2031-4.
179. Lowcock, E.C., et al., High Coffee Intake, but Not Caffeine, is Associated with Reduced Estrogen Receptor Negative and Postmenopausal Breast Cancer Risk with No Effect Modification by CYP1A2 Genotype. Nutrition and cancer, 2013. 65(3): p. 398-409.
180. Huxley, R., et al., Coffee, decaffeinated coffee, and tea consumption in relation to incident type 2 diabetes mellitus: a systematic review with meta-analysis. Arch Intern Med, 2009. 169(22): p. 2053-63.
181. Floegel, A., et al., Coffee consumption and risk of chronic disease in the European Prospective Investigation into Cancer and Nutrition (EPIC)–Germany study. The American journal of clinical nutrition, 2012. 95(4): p. 901-908.
182. Greenberg, J.A., D.R. Owen, and A. Geliebter, Decaffeinated coffee and glucose metabolism in young men. Diabetes Care, 2010. 33(2): p. 278-280.
183. Wang, J., et al., Proteomics and its role in nutrition research. The Journal of nutrition, 2006. 136(7): p. 1759-1762.
184. de Roos, B. and H.J. McArdle, Proteomics as a tool for the modelling of biological processes and biomarker development in nutrition research. British Journal of Nutrition, 2008. 99(S3): p. S66-S71.
185. Delles, C., U. Neisius, and D.M. Carty, Proteomics in hypertension and other cardiovascular diseases. Ann Med, 2012. 44 Suppl 1: p. S55-64.
186. Fuchs, D., et al., Proteomics in nutrition research: principles, technologies and applications. British Journal of Nutrition, 2005. 94(03): p. 302-314.
187. Anderson, L., Candidate‐based proteomics in the search for biomarkers of cardiovascular disease. The Journal of physiology, 2005. 563(1): p. 23-60.
188. Shen, Y., et al., Characterization of the human blood plasma proteome. Proteomics, 2005. 5(15): p. 4034-45.
189. de Roos, B., et al., Response of apolipoprotein E* 3-Leiden transgenic mice to dietary fatty acids: combining liver proteomics with physiological data. The FASEB journal, 2005. 19(7): p. 813-815.
190. Mora, S., et al., Association of physical activity and body mass index with novel and traditional cardiovascular biomarkers in women. JAMA, 2006. 295(12): p. 1412-9.
87
191. Josse, A.R., et al., Novel effects of hormonal contraceptive use on the plasma proteome. PLoS One, 2012. 7(9): p. e45162.
192. Da Costa, L.A., et al., Association between the plasma proteome and serum ascorbic acid concentrations in humans. J Nutr Biochem, 2012.
193. Da Costa, L.A., et al., Association between the plasma proteome and plasma alpha-tocopherol concentrations in humans. J Nutr Biochem, 2013. 24(1): p. 396-400.
194. Wintergerst, E.S., S. Maggini, and D.H. Hornig, Contribution of selected vitamins and trace elements to immune function. Ann Nutr Metab, 2007. 51(4): p. 301-23.
195. Qin, X.J. and B.X. Ling, Proteomic studies in breast cancer (Review). Oncol Lett, 2012. 3(4): p. 735-743.
196. Barnes, S. and H. Kim, Nutriproteomics: identifying the molecular targets of nutritive and non-nutritive components of the diet. Journal of biochemistry and molecular biology, 2004. 37(1): p. 59-74.
197. Kenyon, G.L., et al., Defining the Mandate of Proteomics in the Post-Genomics Era: Workshop Report© 2002 National Academy of Sciences, Washington, DC, USA. Reprinted with permission from the National Academies Press for the National Academy of Sciences. All rights reserved. The original report may be viewed online at http://www. nap. edu/catalog/10209. html. Molecular & Cellular Proteomics, 2002. 1(10): p. 763-780.
198. Kuzyk, M.A., et al., Multiple reaction monitoring-based, multiplexed, absolute quantitation of 45 proteins in human plasma. Mol Cell Proteomics, 2009. 8(8): p. 1860-77.
199. Keshishian, H., et al., Quantitative, multiplexed assays for low abundance proteins in plasma by targeted mass spectrometry and stable isotope dilution. Molecular & Cellular Proteomics, 2007. 6(12): p. 2212-2229.
200. Addona, T.A., et al., Multi-site assessment of the precision and reproducibility of multiple reaction monitoring–based measurements of proteins in plasma. Nature biotechnology, 2009. 27(7): p. 633-641.
201. Bohn, S.K., et al., Effects of tea and coffee on cardiovascular disease risk. Food Funct, 2012. 3(6): p. 575-91.
202. Liu, R., et al., Caffeine intake, smoking, and risk of Parkinson disease in men and women. Am J Epidemiol, 2012. 175(11): p. 1200-7.
203. Li, X.J., et al., Coffee consumption and risk of breast cancer: an up-to-date meta-analysis. PLoS One, 2013. 8(1): p. e52681.
204. Braem, M.G., et al., Coffee and tea consumption and the risk of ovarian cancer: a prospective cohort study and updated meta-analysis. Am J Clin Nutr, 2012. 95(5): p. 1172-81.
205. Dsamou, M., et al., Salivary protein profiles and sensitivity to the bitter taste of caffeine. Chem Senses, 2012. 37(1): p. 87-95.
206. Cahill, L., P.N. Corey, and A. El-Sohemy, Vitamin C deficiency in a population of young Canadian adults. Am J Epidemiol, 2009. 170(4): p. 464-71.
207. Matthews, D.R., et al., Homeostasis model assessment: insulin resistance and beta-cell function from fasting plasma glucose and insulin concentrations in man. Diabetologia, 1985. 28(7): p. 412-9.
208. DeKosky, S.T., et al., Plasma and cerebrospinal fluid alpha1-antichymotrypsin levels in Alzheimer's disease: correlation with cognitive impairment. Ann Neurol, 2003. 53(1): p. 81-90.
209. Polanski, M. and N.L. Anderson, A list of candidate cancer biomarkers for targeted proteomics. Biomark Insights, 2007. 1: p. 1-48.
210. Schreiber, G.B., et al., Confounders contributing to the reported associations of coffee or caffeine with disease. Prev Med, 1988. 17(3): p. 295-309.
88
211. Reissig, C.J., E.C. Strain, and R.R. Griffiths, Caffeinated energy drinks--a growing problem. Drug Alcohol Depend, 2009. 99(1-3): p. 1-10.
212. Heckman, M.A., J. Weil, and E.G.d. Mejia, Caffeine (1, 3, 7-trimethylxanthine) in Foods: A Comprehensive Review on Consumption, Functionality, Safety, and Regulatory Matters. Journal of Food Science, 2010. 75(3): p. R77-R87.
213. Cornelis, M.C. and A. El-Sohemy, Coffee, caffeine, and coronary heart disease. Curr Opin Lipidol, 2007. 18(1): p. 13-9.
214. Silacci, P., et al., Gelsolin superfamily proteins: key regulators of cellular functions. Cell Mol Life Sci, 2004. 61(19-20): p. 2614-23.
215. Kwiatkowski, D.J., et al., Muscle is the major source of plasma gelsolin. J Biol Chem, 1988. 263(17): p. 8239-43.
216. Li, G.H., et al., Multifunctional roles of gelsolin in health and diseases. Medicinal research reviews, 2012. 32(5): p. 999-1025.
217. Le, H.T., et al., The protective effects of plasma gelsolin on stroke outcome in rats. Experimental & translational stroke medicine, 2011. 3(1): p. 1-9.
218. Solomon, J.P., et al., Gelsolin amyloidosis: genetics, biochemistry, pathology and possible strategies for therapeutic intervention. Crit Rev Biochem Mol Biol, 2012. 47(3): p. 282-96.
219. Kwiatkowski, D.J., Functions of gelsolin: motility, signaling, apoptosis, cancer. Curr Opin Cell Biol, 1999. 11(1): p. 103-8.
220. Osborn, T.M., et al., Decreased levels of the gelsolin plasma isoform in patients with rheumatoid arthritis. Arthritis Res Ther, 2008. 10(5): p. R117.
221. DiNubile, M.J., Plasma gelsolin as a biomarker of inflammation. Arthritis Res Ther, 2008. 10(6): p. 124.
222. Peddada, N., et al., Plasma gelsolin: a general prognostic marker of health. Med Hypotheses, 2012. 78(2): p. 203-10.
223. Suhler, E., et al., Decreased plasma gelsolin concentrations in acute liver failure, myocardial infarction, septic shock, and myonecrosis. Crit Care Med, 1997. 25(4): p. 594-8.
224. Yue, L., et al., Correlation between platelet gelsolin level and different types of coronary heart disease. Heart, 2011. 97(Suppl 3): p. A137-A137.
225. Sulem, P., et al., Sequence variants at CYP1A1–CYP1A2 and AHR associate with coffee consumption. Human molecular genetics, 2011. 20(10): p. 2071-2077.
226. Nukaya, M., S. Moran, and C.A. Bradfield, The role of the dioxin-responsive element cluster between the Cyp1a1 and Cyp1a2 loci in aryl hydrocarbon receptor biology. Proceedings of the National Academy of Sciences, 2009. 106(12): p. 4923-4928.
227. Rosmond, R., et al., Polymorphism in exon 6 of the dopamine D (2) receptor gene (DRD2) is associated with elevated blood pressure and personality disorders in men. Journal of human hypertension, 2001. 15(8): p. 553.
228. Da Costa, L.A., Genetic Modifiers of Caffeine Consumption and Risk of Myocardial Infarction. 2011, University of Toronto.
229. Nukaya, M. and C.A. Bradfield, Conserved genomic structure of the Cyp1a1 and Cyp1a2 loci and their dioxin responsive elements cluster. Biochem Pharmacol, 2009. 77(4): p. 654-9.
230. Amin, N., et al., Genome-wide association analysis of coffee drinking suggests association with CYP1A1/CYP1A2 and NRCAM. Mol Psychiatry, 2012. 17(11): p. 1116-29.
231. Terry, K.L., et al., Interaction between CYP1A1 polymorphic variants and dietary exposures influencing ovarian cancer risk. Cancer Epidemiol Biomarkers Prev, 2003. 12(3): p. 187-90.
232. Noske, A., et al., Loss of Gelsolin expression in human ovarian carcinomas. Eur J Cancer, 2005. 41(3): p. 461-9.

89
233. Grandy, S.A., et al., Overexpression of human beta2-adrenergic receptors increases gain of excitation-contraction coupling in mouse ventricular myocytes. Am J Physiol Heart Circ Physiol, 2004. 287(3): p. H1029-38.
234. Wang, H., et al., Beta-2 adrenergic receptor gene (ADRB2) polymorphism and risk for lung adenocarcinoma: A case–control study in a Chinese population. Cancer letters, 2006. 240(2): p. 297-305.
235. Taylor, D.R., beta-Adrenergic receptor polymorphisms: relationship to the beta-agonist controversy and clinical implications. Expert Opin Pharmacother, 2007. 8(18): p. 3195-203.
236. Leineweber, K., et al., Beta-adrenoceptor polymorphisms. Naunyn Schmiedebergs Arch Pharmacol, 2004. 369(1): p. 1-22.
237. Snyder, E.M., et al., Genotype Related Differences in A2 Adrenergic Receptor Density and Cardiac Function. Medicine & Science in Sports & exercise: Official Journal of the American College of Sports Medicine, 2006. 38(5): p. 882-886.
238. Tang, W., et al., The Arg16Gly polymorphism of the β2-adrenergic receptor and left ventricular systolic function&ast. American journal of hypertension, 2003. 16(11): p. 945-951.
239. Castellano, M., et al., β2-Adrenergic receptor gene polymorphism, age, and cardiovascular phenotypes. Hypertension, 2003. 41(2): p. 361-367.
240. Lou, Y., et al., A46G and C79G polymorphisms in the β2-adrenergic receptor gene (ADRB2) and essential hypertension risk: a meta-analysis. Hypertension Research, 2010. 33(11): p. 1114-1123.
241. Renda, G., et al., Genetic determinants of blood pressure responses to caffeine drinking. The American journal of clinical nutrition, 2012. 95(1): p. 241-248.
242. Naughton, M., J.B. Mulrooney, and B.E. Leonard, A review of the role of serotonin receptors in psychiatric disorders. Human Psychopharmacology, 2000. 15: p. 397-415.
243. Shi, D. and J.W. Daly, Chronic effects of xanthines on levels of central receptors in mice. Cellular and Molecular Neurobiology, 1999. 19(6): p. 719-732.
244. Shi, D., et al., Chronic caffeine alters the density of adenosine, adrenergic, cholinergic, GABA, and serotonin receptors and calcium channels in mouse brain. Cellular and Molecular Neurobiology, 1993. 13(3): p. 247-261.
245. Okada, M., et al., Differential effects of adenosine receptor subtypes on release and reuptake of hippocampal serotonin. European Journal of Neuroscience, 1999. 11(1): p. 1-9.
246. Erdmann, J., et al., Systematic screening for mutations in the human serotonin-2A (5-HT2A) receptor gene: Identification of two naturally occurring receptor variants and association analysis in schizophrenia. Human Genetics, 1996. 97(5): p. 614-619.
247. Abdolmaleky, H.M., et al., Meta-analysis of association between the T102C polymorphism of the 5HT2a receptor gene and schizophrenia. Schizophrenia Research, 2004. 67(1): p. 53-62.
248. Nilsson, T., et al., Characterisation of 5-HT receptors in human coronary arteries by molecular and pharmacological techniques. European Journal of Pharmacology, 1999. 372(1): p. 49-56.
249. Côté, F., et al., Recent advances in understanding serotonin regulation of cardiovascular function. Trends in Molecular Medicine, 2004. 10(5): p. 232-238.
250. Yamada, S., et al., T102C polymorphism of the serotonin (5-HT) 2A receptor gene in patients with non-fatal acute myocardial infarction. Atherosclerosis, 2000. 150(1): p. 143-148.
251. Halder, I., et al., Serotonin receptor 2A (HTR2A) gene polymorphisms are associated with blood pressure, central adiposity, and the metabolic syndrome. Metabolic Syndrome and Related Disorders, 2007. 5(4): p. 323-330.
252. Amenta, F., F. Ferrante, and A. Ricci, Pharmacological characterisation and autoradiographic localisation of dopamine receptor subtypes in the cardiovascular system and in the kidney. Hypertension Research - Clinical and Experimental, 1995. 18(SUPPL. 1).
90
253. Hillion, J., et al., Coaggregation, cointernalization, and codesensitization of adenosine A2A receptors and dopamine D2 receptors. Journal of Biological Chemistry, 2002. 277(20): p. 18091-18097.
254. Salim, H., et al., Activation of adenosine A1 and A2A receptors modulates dopamine D2 receptor-induced responses in stably transfected human neuroblastoma cells. Journal of Neurochemistry, 2000. 74(1): p. 432-439.
255. Kull, B., et al., Reciprocal interactions between adenosine A2A and dopamine D2 receptors in Chinese hamster ovary cells co-transfected with the two receptors. Biochemical Pharmacology, 1999. 58(6): p. 1035-1045.
256. Ferré, S., et al., An update on adenosine A2A-dopamine D2 receptor interactions: Implications for the function of G protein-coupled receptors. Current Pharmaceutical Design, 2008. 14(15): p. 1468-1474.
257. Cauli, O. and M. Morelli, Caffeine and the dopaminergic system. Behavioural Pharmacology, 2005. 16(2): p. 63-77.
258. Xie, X., V. Ramkumar, and L.A. Toth, Adenosine and dopamine receptor interactions in striatum and caffeine-induced behavioral activation. Comparative Medicine, 2007. 57(6): p. 538-545.
259. Perneger, T.V., What's wrong with Bonferroni adjustments. BMJ, 1998. 316(7139): p. 1236-8. 260. Horgan, R., et al., An overview of proteomic and metabolomic technologies and their application
to pregnancy research. BJOG: An International Journal of Obstetrics & Gynaecology, 2009. 116(2): p. 173-181.
261. Knežević, A., et al., Effects of aging, body mass index, plasma lipid profiles, and smoking on human plasma N-glycans. Glycobiology, 2010. 20(8): p. 959-969.
262. Breese, C.R., R.L. Ingram, and W.E. Sonntag, Influence of age and long-term dietary restriction on plasma insulin-like growth factor-1 (IGF-1), IGF-1 gene expression, and IGF-1 binding proteins. Journal of gerontology, 1991. 46(5): p. B180-B187.