cal academy talk, march 9, 2017
TRANSCRIPT
SF, March 9, 2017
Connecting natural infrastructure science to
sustainability of coastal populations:
example of coral reefs
Borja. G. Reguero, PhD
M.W. Beck, S. Narayan, J. Raepple
K. McLeod, F. Secaira

With …

1. TNC & CRR
2. What is “natural” infrastructure?
3. How we assess Risk & the Economics of Adaptation
4. Coral reefs as natural infrastructure. Example 1. Making the case
5. Coral reefs as natural infrastructure. Example 2. Restoration
1. Conclusions, open questions, future research

TNC
K. McLeod & M.W. Beck

Coastal Funding for Conservation & Infrastructure (10 Yrs)
Why?we spend nearly 30 times more on (re)building coastal gray infrastructure around the world than we do on coastal conservation (green infrastructure).
Blog post McCreless and Beck (2017)
1-3%?

How?

o Applications
o Science
o Outreach
Risk Reduction
Climate Adaptation Conservation
And Environmental
Goals
New Priorities and
Actions
o Innovative financing
What?

EcoDRR
EbAEcosystem-basedAdaptation
Ecosystem-based Disaster Risk Reduction

1. TNC & CRR
2. What is “natural” infrastructure?
3. How we assess Risk & the Economics of Adaptation
4. Coral reefs as natural infrastructure. Example 1. Making the case
5. Coral reefs as natural infrastructure. Example 2. Restoration
1. Conclusions, open questions, future research


12
Coastal Engineering with Natural Infrastructure: Example
UC SANTA CRUZ | THE NATURE CONSERVANCY

How much do we need to raise our defenses?
Opportunity:
Can we Use NNBD cover this “protection deficit”?

Eco-engineering: Connections
1. Risk deficit requires all options.
2. New Era of Sustainable Development: Stronger global interest and demand
then ever before (SFDRR 2015-2030, SDGs, UNFCCC, Adaptation Fund,
UNISDR, etc.).
3. Tremendous infrastructure upgrading globally.
4. Environmental degradation increases Risk
Opportune time for cross-disciplinary integration (planners, ecologists,
engineers) with multiple objectives/outcomes.

15
Coastal Engineering Typologies
UC SANTA CRUZ | THE NATURE CONSERVANCY
Traditional Grey Infrastructure
Wave Attenuation Physical Protection
Nature-Based Approaches
Wave Attenuation Physical Protection
Beach & Dune Systems, Island Barriers
Short
Waves
Long
Waves
Reefs (Coral/Oyster)
Coastal Vegetation Coastal Vegetation• Saltmarshes / Wetlands
• Mangroves
• Seagrasses / Kelp
• Coastal Forests

1. TNC & CRR
2. What is “natural” infrastructure?
3. How we assess Risk & the Economics of Adaptation
4. Coral reefs as natural infrastructure. Example 1. Making the case
5. Coral reefs as natural infrastructure. Example 2. Restoration
1. Conclusions, open questions, future research

17UC SANTA CRUZ | THE NATURE CONSERVANCY
Reefs
Wind-Waves
• Global coral reefs
• Mexico Quintana Roo Mesoamerican
Reef
• USA territories – High Res (ongoing)
• Puerto Morelos – High Res (ongoing)
Coastal Vegetation: Wetland &
Mangroves
Storm Surge
• US-Sandy (Lloyd’s, RMS)
• Philippines Mangroves (World Bank-
WAVES; ongoing)
• Global Mangroves (ongoing)
• Gulf of Mexico
• US Mexico – Quintana Roo (ongoing)
• Reef and Wetland restoration cases
http://oceanwealth.org
http://maps.coastalresilience.org
Project Portfolio (2014+)
Dollar-value of existing ecosystems for RR
Dollar-value of “New Green” for RR

18UC SANTA CRUZ | THE NATURE CONSERVANCY
Economics of Coastal AdaptationQuantification Framework
Hazard Socioec. Exposure Damages
• How strong?
• How frequent?• How well built? • Where?
• What?
• How many?
RISK
Future?Future?
ADAPTATION
Attenuate hazard Modify Damage
functionDistribution of
assets
Ad
ap
tati
on
to
Cli
ma
te
Ch
an
ge
Be
ne
fit/
Co
s
Benefit (Net present value of damages averted)

Reguero et al (in review)
Ex. US Gulf CoastRisk and Drivers
High economic growth

Economics of Coastal AdaptationGulf of Mexico Example – Cost : Benefit Analysis
20UC SANTA CRUZ | THE NATURE CONSERVANCY
Valuation
Total Climate Risk $162.2bn. Values for the Year 2030 (assuming low economic pathway; 2% disc rate)
Source Reguero, Beck, Bresch, et al (2016)
Reguero et al (in review)

Connecting Risk to social aspects
How risk changes when we consider Social Vulnerability?

1. TNC & CRR
2. What is “natural” infrastructure?
3. How we assess Risk & the Economics of Adaptation
4. Coral reefs as natural infrastructure. Example 1.
Making the case
5. Coral reefs as natural infrastructure. Example 2. Restoration
1. Conclusions, open questions, future research

Mesoamerican Reef in Mexico
Pta. Cancun
Pto. Morelos

Reefs in coastal protection
Lowe and Falter (2015)

25UC SANTA CRUZ | THE NATURE CONSERVANCY
Mapping Ocean WealthQuantification Framework
Hazard Socioec. Exposure Damages
• How strong?
• How frequent?• How well built? • Where?
• What?
• How many?
RISK
1. Role of the Ecosystem in coastal
protection
2. Loss of Ecosystem
26UC SANTA CRUZ | THE NATURE CONSERVANCY
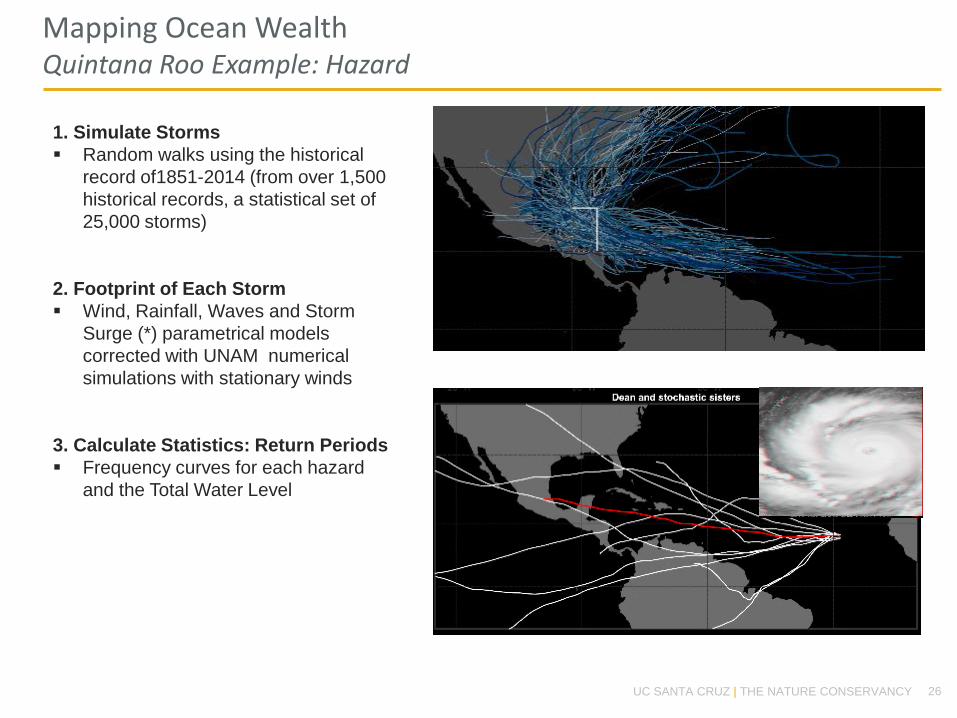
Mapping Ocean WealthQuintana Roo Example: Hazard
1. Simulate Storms
Random walks using the historical
record of1851-2014 (from over 1,500
historical records, a statistical set of
25,000 storms)
2. Footprint of Each Storm
Wind, Rainfall, Waves and Storm
Surge (*) parametrical models
corrected with UNAM numerical
simulations with stationary winds
3. Calculate Statistics: Return Periods
Frequency curves for each hazard
and the Total Water Level

27UC SANTA CRUZ | THE NATURE CONSERVANCY
Mapping Ocean WealthQuintana Roo Example: Exposure
1. Population (present and future)
2. Built Capital (residential, industrial, services & Government)
3. Hotels
28UC SANTA CRUZ | THE NATURE CONSERVANCY
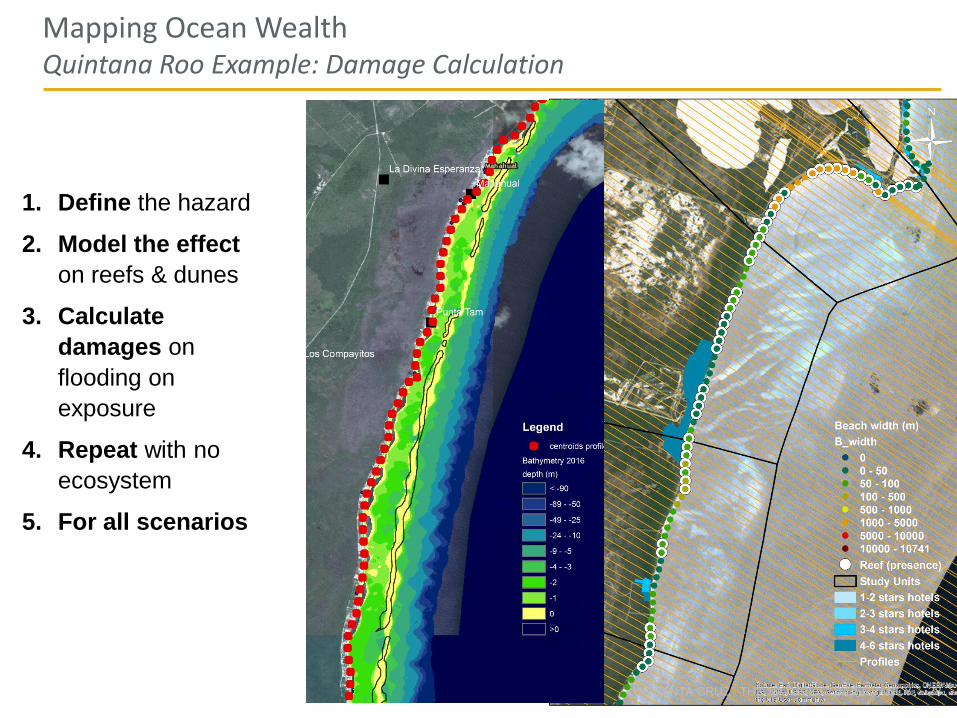
Mapping Ocean WealthQuintana Roo Example: Damage Calculation
1. Define the hazard
2. Model the effect
on reefs & dunes
3. Calculate
damages on
flooding on
exposure
4. Repeat with no
ecosystem
5. For all scenarios

v
v
1 m
v
1 m
Modeling Reef Loss
Loss in
(1) geometry and
(2) friction
Biodiversity?

30
Mapping Ocean WealthQuintana Roo Example: Risk
58 89
160
282 337
424
15
23
31
20
30
35 25%26%
19%
7%9… 8%
0%
5%
10%
15%
20%
25%
30%
-
50
100
150
200
250
300
350
400
450
500
10 25 50 100 175 250
Pe
rce
nta
ge
of
cu
rre
nt
ris
k
Mil
l U
SD
Return Periods (yr)
with reef no reef Percentage of change
Value of Reef
• Benefit for 1-in-25 yr loss = 23 mill $ (+47.9 mill$)
• AEB= 3.2 mill $/yr (+6.7 mill $/yr)
Emily
(2005)
Dean
(2007)
Wilma
(2005)

Not only damages
“Identification of
areas of influence
of the reef”
WD4R

RegionalO(500km) O(50 km) O(5 km)
LocalO(50km)
RestorationO(5km)
Asess value of the
infrastructure
Design a functional
solution

1. TNC & CRR
2. What is “natural” infrastructure?
3. How we assess Risk & the Economics of Adaptation
4. Coral reefs as natural infrastructure. Example 1. Making the case
5. Coral reefs as natural infrastructure. Example 2.
Restoration
1. Conclusions, open questions, future research


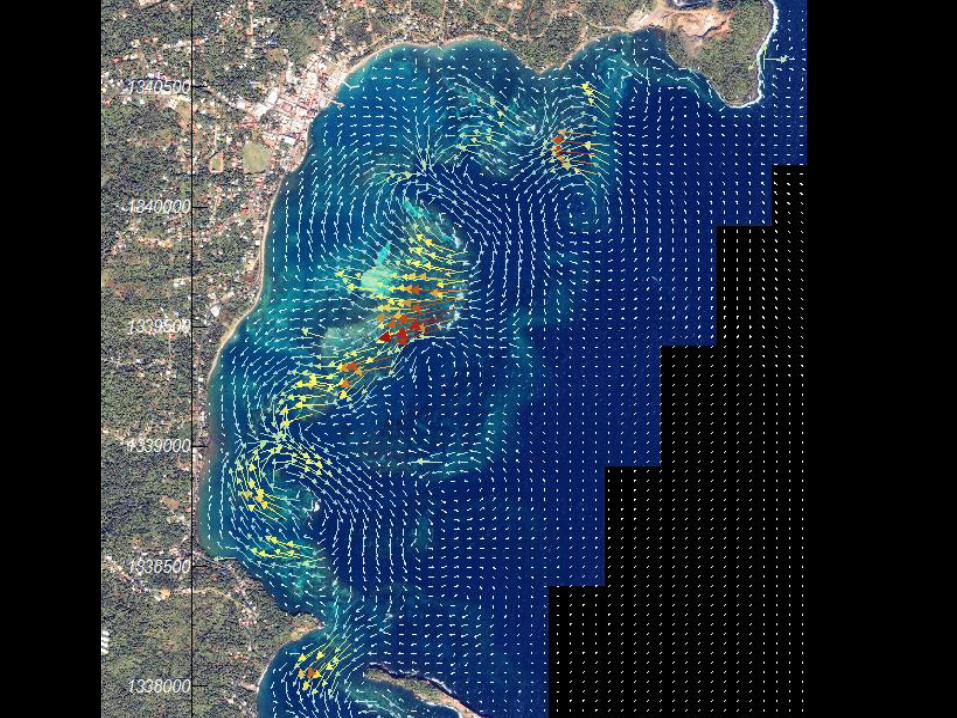
Current & sediment tranport
Mangrove Lost
1. Movement of sediment SW for a period of 30 yr (confirmed by locals &
Field inspection (28 Jan.) and local reporting
The Coastal Problem

37
How the reefs work in the bay
Waves

Hsu and Evans (1989); Gonzalez and Medina (2001);Hsu et al (2010)
An unrecognized role in stabilizing the shoreline

1.Lower Energy
2.Less tangential to shoreLikely outer reef storm
damage & erosion led to:
DEGRADATION COASTAL PROBLEMS!

Reefs for coastal protection

Navigating the barge
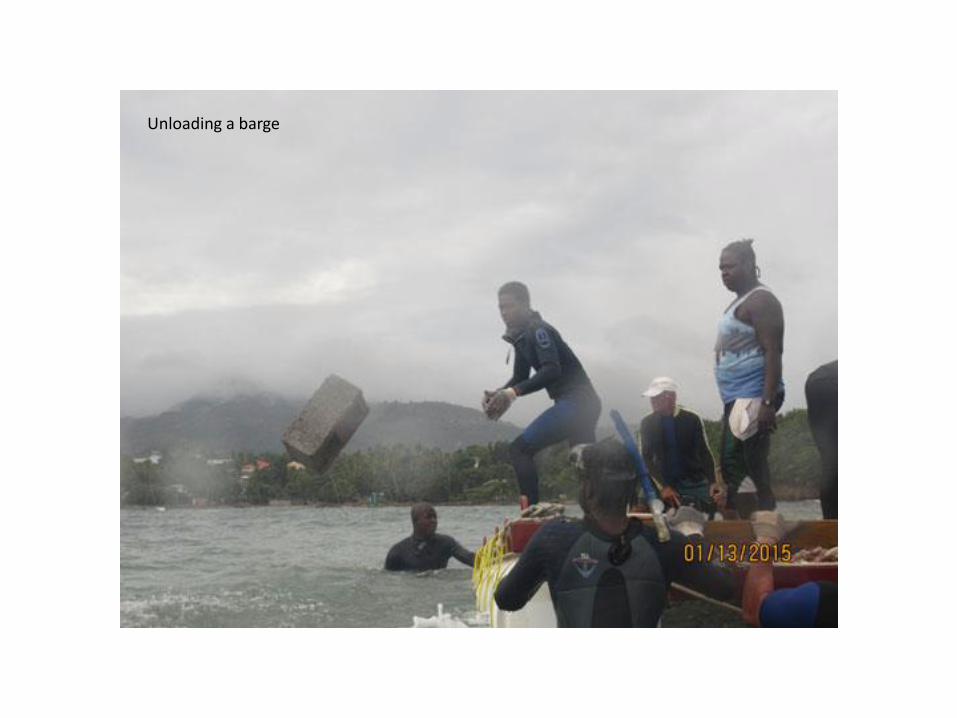
Unloading a barge

Divers carrying and packing the baskets

The reef at low tide

2-tier pilot submerged breakwater structure (this one with blocks) with corals from the nursery placed along their sides

Fish usage is high, and
continues to attract
attention from the local
fishers
2016
2017 – in 2 weeks…
Coral transplants have stabilized or
the rate of loss has decreased


Conclusions
• Ecosystems have an economic (and social) value as natural infrastructure
• We are able to model the (i) hydrodynamics and the (ii) economics of ecosystems
• But, we need to connect ecosystem health to people-value (e.g. environmental degradation increases risk)
• And we need pilot studies to design innovative approaches
• There are also significant challenges…. (shift in planning, regulatory framework, knowledge gaps, financing, etc).

v
vQ1. Damage to the reef (i.e. fragility curves for ecosystems?, when do they break/fail?)
Q2. How biodiversity (a functional ecosystem) is connected to the ecosystem services (e.g. coastal protection)?
Q3. What hydrodynamic conditions are better for reef survival?(e.g. waves and currents water Temperature?)
Open Questions for reefs

Contact Borja G. Reguero Email
UC SANTA CRUZ | THE NATURE CONSERVANCY
Thank youGracias