calcification–carbonation method for cleaner alumina production and co2 utilization
TRANSCRIPT
Calcification–Carbonation Method for Cleaner AluminaProduction and CO2 Utilization
GUOZHI LU,1,2 TING-AN ZHANG,1,3 XIAOFENG ZHU,1 YAN LIU,1
YANXIU WANG,1 FANGFANG GUO,1 QIUYUE ZHAO,1
and CHAOZHEN ZHENG1
1.—Key Laboratory of Ecological Utilization of Multi-metal Intergrown Ores of Ministry of Edu-cation, Northeastern University, Shenyang 110819, People’s Republic of China. 2.—e-mail:[email protected]. 3.—e-mail: [email protected]
In this study, a calcification–carbonation method is proposed to change theequilibrium structure of red mud produced from the Bayer process. Thethermodynamics of both calcification and carbonation processes has beenelucidated. In addition, the non-isothermal kinetics involved in the calcifica-tion process and the effects of different parameters on the hydrogarnet syn-thesis and carbonation decomposition are experimentally investigated usingpure reagents. The results indicate that through a two-step carbonationtreatment of calcified slag by the new method, the mass ratio of alumina tosilica (A/S) of the modified red mud has decreased to 0.44 and the Na2Ocontent drops to 0.12 wt.% at the carbonation temperature of 120�C under theCO2 pressure of 1.2 MPa. The newly modified red mud could be directly usedin the cement industry.
INTRODUCTION
In 2013, global primary aluminum productionreached more than 50 million tons, and aluminaproduction reached over 100 million tons, approxi-mately 40% of which was from mainland China. Asa result, the production of red mud surpassed 50million tons, which was accompanied by more than35 million tons of CO2 emission.1
Currently, more than 90% of the global alumina isproduced by the Bayer process.2 In this process,most of the aluminum in bauxite is converted intothe sodium aluminate in the solution, and the sili-con phase such as kaolinite is converted into hy-drated sodium aluminosilicate in the red mud.3,4
The reaction of the digestion process is as follows:5
Al2O3 �mH2Oþ 2NaOH ¼ 2NaAlðOHÞ4þ ð3�mÞH2O m ¼ 1 or 3ð Þ
(1)
AlOOHþ Al2Si2O5ðOHÞ4 þNaOH! Na2O � Al2O3
� zSiO2 � nH2O z ¼ 1:7 � 2ð Þ(2)
The equilibrium structure of the red mudproduced by the Bayer process is Na2OÆAl2O3ÆxSiO2ÆnH2O (x = 1.7–2), and the theoreticalalumina-to-silica ratio (A/S) is 1 (A/S for most ofthe actual red mud is 1.3–1.4), and the sodium-oxide-to-silica ratio (N/S) is 0.608.6 There are twoinherent problems when low-grade bauxite is usedin the Bayer process: First, when treating bauxitewith a low aluminum-to-silicon ratio, the yield ofalumina is low; second, a large amount of red mud isdischarged with high alkali content (more than4 wt.%). If red mud is treated only by dealkaliza-tion, the valuable elements such as aluminum in itcannot be effectively recycled.7
The lack of high-quality bauxite has become acritical issue for the sustainable development of thealumina industry.8 More than 70% of China’sbauxite has low A/S, which is less than 79 andthat of bauxite from Australia and Guinea is higherthan 10.
Compared with the Bayer process, the sinteringprocess dealing with middle- and low-grade bauxiteresources has certain advantages for aluminumrecovery efficiency and the equilibrium structure ofred mud is more favorable for utilization.10,11
JOM, Vol. 66, No. 9, 2014
DOI: 10.1007/s11837-014-1090-0� 2014 The Minerals, Metals & Materials Society
1616 (Published online August 15, 2014)

Although the sintering method has certain advan-tages, the energy consumption is much higher thanin the Bayer process, and the energy consumption ofthe sintering process for 1 ton of alumina products isabout 30 GJ,12 which is about 2.5 times that of theBayer process.
Therefore, to realize cleaner production of aluminaand utilization of red mud to the fullest capacity, theequilibrium structure of red mud should be changedwith a low-energy consumption process.
In this article, we report on the calcification–car-bonation method, which aims at changing the equi-librium phase of red mud into 2CaOÆSiO2 and CaCO3
by the hydrometallurgical process. During the cal-cification process, silicon-containing (in bauxite orred mud) phases are transformed into hydrogarnet,which subsequently changes into Al(OH)3, 2CaOÆ-SiO2, and CaCO3 through the carbonation process byCO2. Since Al(OH)3 will be digested by alkali whenthe digestion temperature is lower than 100�C, theremaining phases are the modified red mud com-posed of CaOÆSiO2 and CaCO3. Moreover, the ther-modynamics of the calcification and carbonationprocess has been analyzed; non-isothermal kineticsin the calcification process, the effects of differentparameters on the hydrogarnet synthesis, and thecarbonation decomposition process are investigatedby experiment using pure reagents as well.
EXPERIMENTAL
The reagents in the experiment are as follows:CO2 (Purity > 99%); CaO, Na2SiO3Æ9H2O, NaOHand Al(OH)3 (Sinopharm Chemical Reagent Co. Ltd,Shanghai, People’s Republic of China).
The calcification and carbonation experiment wascarried out in a WHFS-1 autoclave. The mother liquid(prepared by NaOH and Al(OH)3), lime, and otherreagents were placed into the autoclave together, andthe temperature of the autoclave was raised to thepredetermined value then held for 30–120 min. Afterdigestion, the temperature of the autoclave waslowed to below 100�C. The digested slurry was sepa-rated into solid and liquid parts by filtration.
The x-ray diffraction (XRD) test was carried outby D8 advance (Bruker, German) using a Cu targetwith a step of 0.0095� for a scanning spectrum of10�–90�.
The differential scanning calorimeter (DSC) ana-lysis was carried out by a 204HP pressure differ-ential scanning calorimeter (Netzsch, German) from25�C to 300�C at a heating rate of 10�C/min.
THERMODYNAMIC ANALYSIS
The main reactions of the process are as follows:For the calcification process:
ð2�xÞAl2O3 �H2O + 6CaO + xAl2O3 � 2SiO2
� 2H2O + (10 - 5xÞH2O
¼ 2 3CaO � Al2O3 � xSiO2 � ð6�2xÞH2O½ � ð3Þ
For the carbonation process:
3CaO � Al2O3 � xSiO2 � ð6� 2xÞH2Oþ ð3� 2xÞCO2
¼ xCa2SiO4 þ ð3� 2xÞCaCO3 þ 2AlðOHÞ3þ ð3� 2xÞH2O ð4Þ
Thermodynamics Analysis of CalcificationProcess
The relationship between hydrogarnet’s (3CaOÆAl2O3ÆxSiO2Æ(6 � 2x)H2O) thermodynamic data andthe saturation coefficient of SiO2 can be calculatedwith the following formulas:
DS0298 ¼ 409:6� 23:4x J=mol Kð Þ (5)
�DG0298 ¼ 5015:7þ 417:4x kJ=molð Þ (6)
C0p ¼ a� 8xþ bT � 10�3 J=mol Kð Þ (7)
In the heat capacity formula, a and b are empir-ical coefficients with values of 385.0 and 232.88,respectively. The expressions of average heatcapacity are as follows:13–15
C0p
���
T
298¼ 1
T � 298
Z T
298
C0pdT
¼ 1
T � 298
Z T
298
ð385:0� 8xþ 232:88T
�10�3TÞdT
¼ 1
T � 298385:0� 8xð Þ T � 298ð Þ þ 116:44½
�10�3 � ðT2 � 2982Þ�
¼ 385:0� 8xð Þ þ 116:44� 10�3
� T þ 298ð Þ J/mol Kð Þ ð8Þ
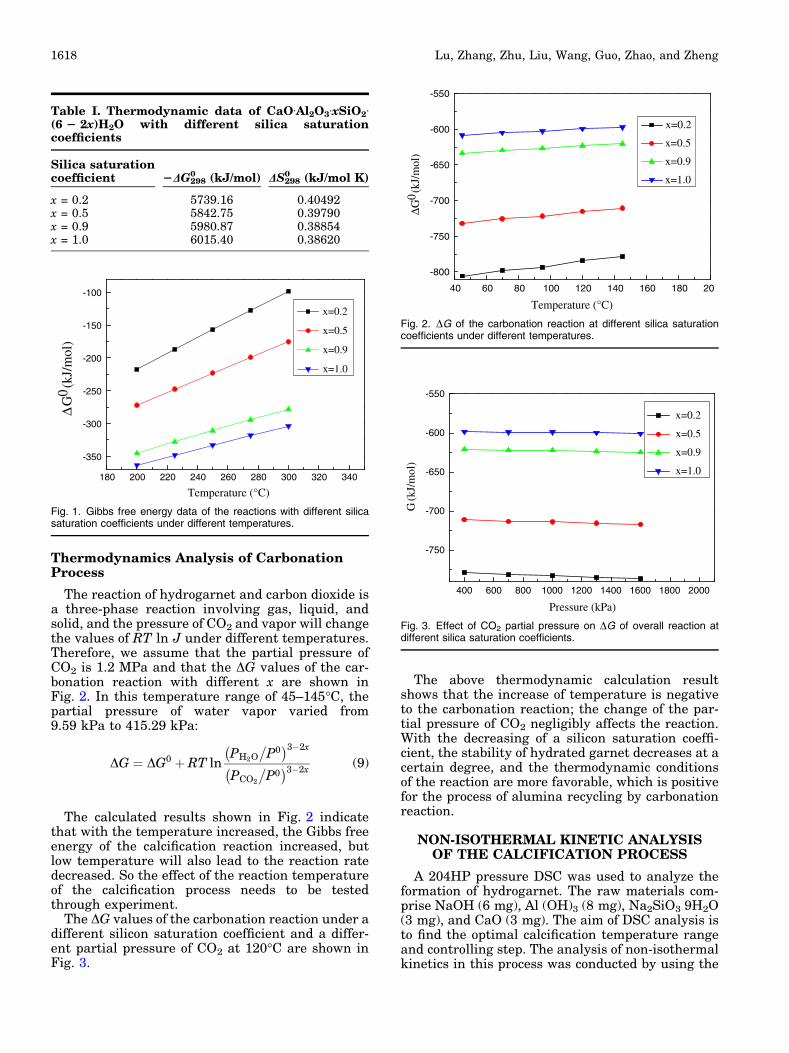
The calculated thermodynamic data of 3CaOÆAl2O3ÆxSiO2Æ(6 � 2x)H2O with different silica satu-ration coefficients are listed in Table I.
The DG0 values of a calcification reaction under adifferent temperature and a different silicon satu-ration coefficient are shown in Fig. 1.
The calculation results shown in Fig. 1 demon-strate that the Gibbs free energy of the calcificationreaction is lower than 0 in the temperature range200–300�C. With the increase of reaction tempera-ture and the decrease of silica saturation coefficient,the Gibbs free energy of the reaction is increased inthe temperature range.
Calcification–Carbonation Method for Cleaner Alumina Production and CO2 Utilization 1617
Thermodynamics Analysis of CarbonationProcess
The reaction of hydrogarnet and carbon dioxide isa three-phase reaction involving gas, liquid, andsolid, and the pressure of CO2 and vapor will changethe values of RT ln J under different temperatures.Therefore, we assume that the partial pressure ofCO2 is 1.2 MPa and that the DG values of the car-bonation reaction with different x are shown inFig. 2. In this temperature range of 45–145�C, thepartial pressure of water vapor varied from9.59 kPa to 415.29 kPa:
DG ¼ DG0 þ RT lnPH2O
�
P0� �3�2x
PCO2
�
P0� �3�2x
(9)
The calculated results shown in Fig. 2 indicatethat with the temperature increased, the Gibbs freeenergy of the calcification reaction increased, butlow temperature will also lead to the reaction ratedecreased. So the effect of the reaction temperatureof the calcification process needs to be testedthrough experiment.
The DG values of the carbonation reaction under adifferent silicon saturation coefficient and a differ-ent partial pressure of CO2 at 120�C are shown inFig. 3.
The above thermodynamic calculation resultshows that the increase of temperature is negativeto the carbonation reaction; the change of the par-tial pressure of CO2 negligibly affects the reaction.With the decreasing of a silicon saturation coeffi-cient, the stability of hydrated garnet decreases at acertain degree, and the thermodynamic conditionsof the reaction are more favorable, which is positivefor the process of alumina recycling by carbonationreaction.
NON-ISOTHERMAL KINETIC ANALYSISOF THE CALCIFICATION PROCESS
A 204HP pressure DSC was used to analyze theformation of hydrogarnet. The raw materials com-prise NaOH (6 mg), Al (OH)3 (8 mg), Na2SiO3 9H2O(3 mg), and CaO (3 mg). The aim of DSC analysis isto find the optimal calcification temperature rangeand controlling step. The analysis of non-isothermalkinetics in this process was conducted by using the
Table I. Thermodynamic data of CaOÆAl2O3ÆxSiO2Æ(6 2 2x)H2O with different silica saturationcoefficients
Silica saturationcoefficient 2DG298
0 (kJ/mol) DS2980 (kJ/mol K)
x = 0.2 5739.16 0.40492x = 0.5 5842.75 0.39790x = 0.9 5980.87 0.38854x = 1.0 6015.40 0.38620
180 200 220 240 260 280 300 320 340
-350
-300
-250
-200
-150
-100
Temperature (°C)
Δ G
0 (kJ
/mol
)
x=0.2
x=0.5
x=0.9
x=1.0
Fig. 1. Gibbs free energy data of the reactions with different silicasaturation coefficients under different temperatures.
40 60 80 100 120 140 160 180 20
-800
-750
-700
-650
-600
-550
ΔG0 (
kJ/m
ol)
Temperature (°C)
x=0.2
x=0.5
x=0.9
x=1.0
Fig. 2. DG of the carbonation reaction at different silica saturationcoefficients under different temperatures.
400 600 800 1000 1200 1400 1600 1800 2000
-750
-700
-650
-600
-550
Pressure (kPa)
G (k
J/m
ol)
x=0.2
x=0.5
x=0.9
x=1.0
Fig. 3. Effect of CO2 partial pressure on DG of overall reaction atdifferent silica saturation coefficients.
Lu, Zhang, Zhu, Liu, Wang, Guo, Zhao, and Zheng1618
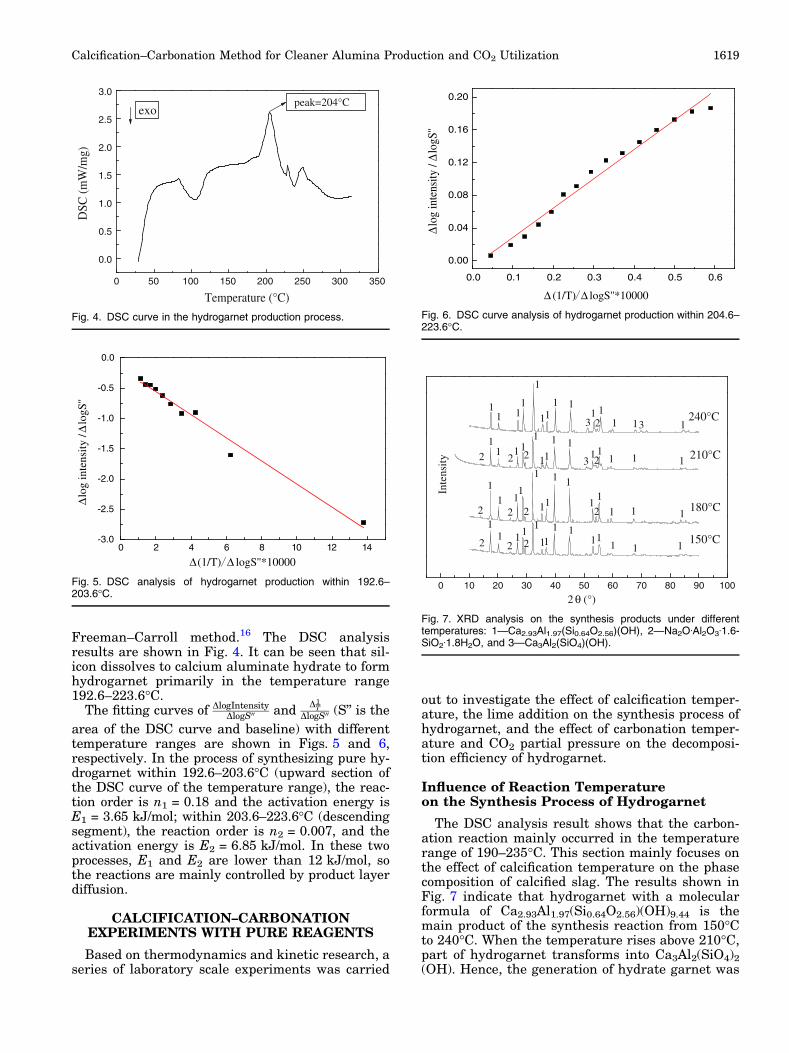
Freeman–Carroll method.16 The DSC analysisresults are shown in Fig. 4. It can be seen that sil-icon dissolves to calcium aluminate hydrate to formhydrogarnet primarily in the temperature range192.6–223.6�C.
The fitting curves of DlogIntensityDlogS00 and
D1T
DlogS00 (S’’ is the
area of the DSC curve and baseline) with differenttemperature ranges are shown in Figs. 5 and 6,respectively. In the process of synthesizing pure hy-drogarnet within 192.6–203.6�C (upward section ofthe DSC curve of the temperature range), the reac-tion order is n1 = 0.18 and the activation energy isE1 = 3.65 kJ/mol; within 203.6–223.6�C (descendingsegment), the reaction order is n2 = 0.007, and theactivation energy is E2 = 6.85 kJ/mol. In these twoprocesses, E1 and E2 are lower than 12 kJ/mol, sothe reactions are mainly controlled by product layerdiffusion.
CALCIFICATION–CARBONATIONEXPERIMENTS WITH PURE REAGENTS
Based on thermodynamics and kinetic research, aseries of laboratory scale experiments was carried
out to investigate the effect of calcification temper-ature, the lime addition on the synthesis process ofhydrogarnet, and the effect of carbonation temper-ature and CO2 partial pressure on the decomposi-tion efficiency of hydrogarnet.
Influence of Reaction Temperatureon the Synthesis Process of Hydrogarnet
The DSC analysis result shows that the carbon-ation reaction mainly occurred in the temperaturerange of 190–235�C. This section mainly focuses onthe effect of calcification temperature on the phasecomposition of calcified slag. The results shown inFig. 7 indicate that hydrogarnet with a molecularformula of Ca2.93Al1.97(Si0.64O2.56)(OH)9.44 is themain product of the synthesis reaction from 150�Cto 240�C. When the temperature rises above 210�C,part of hydrogarnet transforms into Ca3Al2(SiO4)2
(OH). Hence, the generation of hydrate garnet was
0 50 100 150 200 250 300 350
0.0
0.5
1.0
1.5
2.0
2.5
3.0
Temperature (°C)
exo
DSC
(mW
/mg)
peak=204°C
Fig. 4. DSC curve in the hydrogarnet production process.
0 2 4 6 8 10 12 14-3.0
-2.5
-2.0
-1.5
-1.0
-0.5
0.0
Δ (1/T) Δ logS''*10000
Δ lo
g in
tens
ity /
Δ lo
gS''
Fig. 5. DSC analysis of hydrogarnet production within 192.6–203.6�C.
0.0 0.1 0.2 0.3 0.4 0.5 0.6
0.00
0.04
0.08
0.12
0.16
0.20
Δ (1/T) Δ logS''*10000
Δ log
inte
nsity
/ Δ l
ogS'
'
Fig. 6. DSC curve analysis of hydrogarnet production within 204.6–223.6�C.
0 10 20 30 40 50 60 70 80 90 100
33
32
2
2
2
2
2
2
2
22
2
2
11111
1111
1111
1111
11
11
11
1
111
1
1
11
1
111
11
11
1111
1
111
1111
1
111
1 240°C
210°C
180°C
Inte
nsity
2 θ (°)
150°C
Fig. 7. XRD analysis on the synthesis products under differenttemperatures: 1—Ca2.93Al1.97(Si0.64O2.56)(OH), 2—Na2OÆAl2O3Æ1.6-SiO2Æ1.8H2O, and 3—Ca3Al2(SiO4)(OH).
Calcification–Carbonation Method for Cleaner Alumina Production and CO2 Utilization 1619
considered to be the process of (SiO4)4� instead ofthe OH� of the calcium silicate hydrate 3CaOÆAl2O3Æ6H2O, and composed of (OH)4
4� tetrahe-dron.17,18 With increasing temperature, a silicaconcentration of the hydrogarnet increases, whichresulted in a greater saturation coefficient x of silicain hydrogarnet.19,20 In addition, sodium siliconslag disappears completely at 240�C, which indi-cates that the replacement of calcium and sodiumin sodium silicon slag needs to be under hightemperature.
Influence of the Lime Additionon the Synthesis Process of Hydrogarnet
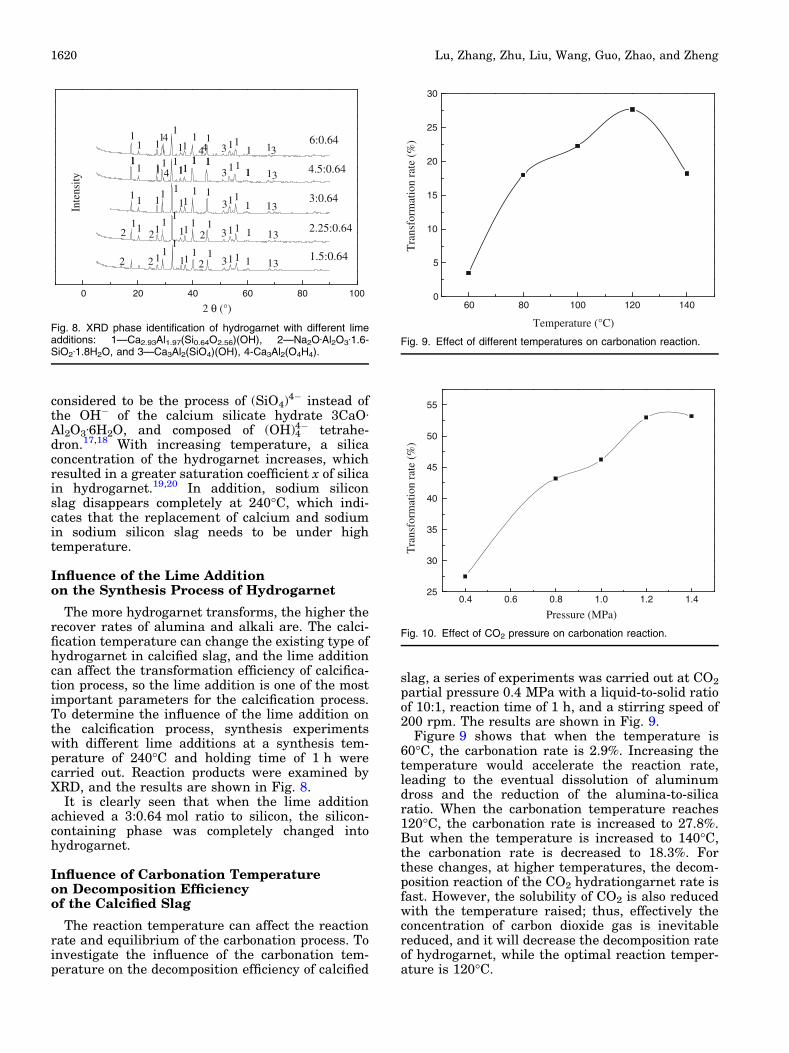
The more hydrogarnet transforms, the higher therecover rates of alumina and alkali are. The calci-fication temperature can change the existing type ofhydrogarnet in calcified slag, and the lime additioncan affect the transformation efficiency of calcifica-tion process, so the lime addition is one of the mostimportant parameters for the calcification process.To determine the influence of the lime addition onthe calcification process, synthesis experimentswith different lime additions at a synthesis tem-perature of 240�C and holding time of 1 h werecarried out. Reaction products were examined byXRD, and the results are shown in Fig. 8.
It is clearly seen that when the lime additionachieved a 3:0.64 mol ratio to silicon, the silicon-containing phase was completely changed intohydrogarnet.
Influence of Carbonation Temperatureon Decomposition Efficiencyof the Calcified Slag
The reaction temperature can affect the reactionrate and equilibrium of the carbonation process. Toinvestigate the influence of the carbonation tem-perature on the decomposition efficiency of calcified
slag, a series of experiments was carried out at CO2
partial pressure 0.4 MPa with a liquid-to-solid ratioof 10:1, reaction time of 1 h, and a stirring speed of200 rpm. The results are shown in Fig. 9.
Figure 9 shows that when the temperature is60�C, the carbonation rate is 2.9%. Increasing thetemperature would accelerate the reaction rate,leading to the eventual dissolution of aluminumdross and the reduction of the alumina-to-silicaratio. When the carbonation temperature reaches120�C, the carbonation rate is increased to 27.8%.But when the temperature is increased to 140�C,the carbonation rate is decreased to 18.3%. Forthese changes, at higher temperatures, the decom-position reaction of the CO2 hydrationgarnet rate isfast. However, the solubility of CO2 is also reducedwith the temperature raised; thus, effectively theconcentration of carbon dioxide gas is inevitablereduced, and it will decrease the decomposition rateof hydrogarnet, while the optimal reaction temper-ature is 120�C.
0 20 40 60 80 100
1 6:0.64
4.5:0.64
3:0.64
2.25:0.64
44
4
4
1
3 3111111
11
11
11
2
22
2
21
Inte
nsity
2 θ (°)
1.5:0.64
3 31111
1111
1111
3 3111111
111
111
111
1111
13 3111
1111
11
111
3 311111111
11
12
Fig. 8. XRD phase identification of hydrogarnet with different limeadditions: 1—Ca2.93Al1.97(Si0.64O2.56)(OH), 2—Na2OÆAl2O3Æ1.6-SiO2Æ1.8H2O, and 3—Ca3Al2(SiO4)(OH), 4-Ca3Al2(O4H4).
60 80 100 120 1400
5
10
15
20
25
30
Temperature (°C)
Tra
nsfo
rmat
ion
rate
(%
)
Fig. 9. Effect of different temperatures on carbonation reaction.
0.4 0.6 0.8 1.0 1.2 1.425
30
35
40
45
50
55T
rans
form
atio
n ra
te (
%)
Pressure (MPa)
Fig. 10. Effect of CO2 pressure on carbonation reaction.
Lu, Zhang, Zhu, Liu, Wang, Guo, Zhao, and Zheng1620
Influence of CO2 Partial Pressureon Decomposition Efficiencyof Calcified Slag
The effects of varying CO2 pressure on the car-bonation decomposition process have been investi-gated at 120�C with a liquid-to-solid ratio of 10:1.
Figure 10 shows that when CO2 partial pressurechanges from 0.4 MPa to 1.2 MPa, the hydrogarnetdecomposition rate increases from 27.8% to 53.0%.As the carbon dioxide partial pressure increases, thetransport speed of the CO2 phase to the liquid phaseincreases as well; thus, the carbonation reactionrate is greatly improved. Additionally, increasingthe partial pressure of carbon dioxide, according toHenry’s law, the solubility of carbon dioxide insolution will be enhanced as well, thereby increas-ing the probability reaction with hydrogarnet par-ticles, promoting the rate of chemical reactions.However, a further increase of the partial pressureonly slightly increases the transformation rate from53.0% to 53.7%. Therefore, a most suitable partialpressure of CO2 is 1.2 MPa.
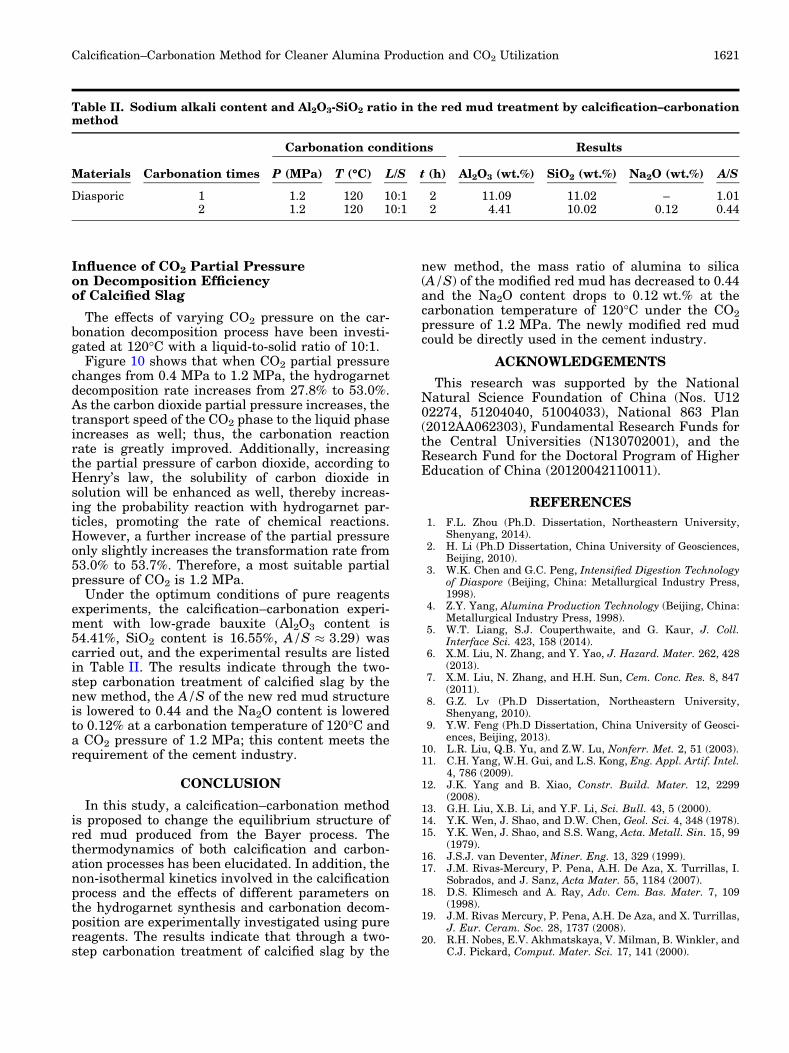
Under the optimum conditions of pure reagentsexperiments, the calcification–carbonation experi-ment with low-grade bauxite (Al2O3 content is54.41%, SiO2 content is 16.55%, A/S � 3.29) wascarried out, and the experimental results are listedin Table II. The results indicate through the two-step carbonation treatment of calcified slag by thenew method, the A/S of the new red mud structureis lowered to 0.44 and the Na2O content is loweredto 0.12% at a carbonation temperature of 120�C anda CO2 pressure of 1.2 MPa; this content meets therequirement of the cement industry.
CONCLUSION
In this study, a calcification–carbonation methodis proposed to change the equilibrium structure ofred mud produced from the Bayer process. Thethermodynamics of both calcification and carbon-ation processes has been elucidated. In addition, thenon-isothermal kinetics involved in the calcificationprocess and the effects of different parameters onthe hydrogarnet synthesis and carbonation decom-position are experimentally investigated using purereagents. The results indicate that through a two-step carbonation treatment of calcified slag by the
new method, the mass ratio of alumina to silica(A/S) of the modified red mud has decreased to 0.44and the Na2O content drops to 0.12 wt.% at thecarbonation temperature of 120�C under the CO2
pressure of 1.2 MPa. The newly modified red mudcould be directly used in the cement industry.
ACKNOWLEDGEMENTS
This research was supported by the NationalNatural Science Foundation of China (Nos. U1202274, 51204040, 51004033), National 863 Plan(2012AA062303), Fundamental Research Funds forthe Central Universities (N130702001), and theResearch Fund for the Doctoral Program of HigherEducation of China (20120042110011).
REFERENCES
1. F.L. Zhou (Ph.D. Dissertation, Northeastern University,Shenyang, 2014).
2. H. Li (Ph.D Dissertation, China University of Geosciences,Beijing, 2010).
3. W.K. Chen and G.C. Peng, Intensified Digestion Technologyof Diaspore (Beijing, China: Metallurgical Industry Press,1998).
4. Z.Y. Yang, Alumina Production Technology (Beijing, China:Metallurgical Industry Press, 1998).
5. W.T. Liang, S.J. Couperthwaite, and G. Kaur, J. Coll.Interface Sci. 423, 158 (2014).
6. X.M. Liu, N. Zhang, and Y. Yao, J. Hazard. Mater. 262, 428(2013).
7. X.M. Liu, N. Zhang, and H.H. Sun, Cem. Conc. Res. 8, 847(2011).
8. G.Z. Lv (Ph.D Dissertation, Northeastern University,Shenyang, 2010).
9. Y.W. Feng (Ph.D Dissertation, China University of Geosci-ences, Beijing, 2013).
10. L.R. Liu, Q.B. Yu, and Z.W. Lu, Nonferr. Met. 2, 51 (2003).11. C.H. Yang, W.H. Gui, and L.S. Kong, Eng. Appl. Artif. Intel.
4, 786 (2009).12. J.K. Yang and B. Xiao, Constr. Build. Mater. 12, 2299
(2008).13. G.H. Liu, X.B. Li, and Y.F. Li, Sci. Bull. 43, 5 (2000).14. Y.K. Wen, J. Shao, and D.W. Chen, Geol. Sci. 4, 348 (1978).15. Y.K. Wen, J. Shao, and S.S. Wang, Acta. Metall. Sin. 15, 99
(1979).16. J.S.J. van Deventer, Miner. Eng. 13, 329 (1999).17. J.M. Rivas-Mercury, P. Pena, A.H. De Aza, X. Turrillas, I.
Sobrados, and J. Sanz, Acta Mater. 55, 1184 (2007).18. D.S. Klimesch and A. Ray, Adv. Cem. Bas. Mater. 7, 109
(1998).19. J.M. Rivas Mercury, P. Pena, A.H. De Aza, and X. Turrillas,
J. Eur. Ceram. Soc. 28, 1737 (2008).20. R.H. Nobes, E.V. Akhmatskaya, V. Milman, B. Winkler, and
C.J. Pickard, Comput. Mater. Sci. 17, 141 (2000).
Table II. Sodium alkali content and Al2O3-SiO2 ratio in the red mud treatment by calcification–carbonationmethod
Materials Carbonation times
Carbonation conditions Results
P (MPa) T (�C) L/S t (h) Al2O3 (wt.%) SiO2 (wt.%) Na2O (wt.%) A/S
Diasporic 1 1.2 120 10:1 2 11.09 11.02 – 1.012 1.2 120 10:1 2 4.41 10.02 0.12 0.44
Calcification–Carbonation Method for Cleaner Alumina Production and CO2 Utilization 1621