calcium-dependent dynamics of cadherin …...calcium-dependent dynamics of cadherin interactions at...
TRANSCRIPT

Calcium-dependent dynamics of cadherin interactionsat cell–cell junctionsSally A. Kima,1, Chin-Yin Taia,1,2, Lee-Peng Moka, Eric A. Mossera, and Erin M. Schumana,b,3
aDivision of Biology, California Institute of Technology, Pasadena, CA 91125; and bMax Planck Institute for Brain Research, D-60528 Frankfurt am Main,Germany
Edited* by Barry H. Honig, Columbia University/Howard Hughes Medical Institute, New York, NY, and approved May 2, 2011 (received for review December17, 2010)
Cadherins play a key role in the dynamics of cell–cell contactformation and remodeling of junctions and tissues. Cadherin–cadherin interactions are gated by extracellular Ca2+, whichserves to rigidify the cadherin extracellular domains and promotetrans junctional interactions. Here we describe the direct visuali-zation and quantification of spatiotemporal dynamics of N-cad-herin interactions across intercellular junctions in living cells usinga genetically encodable FRET reporter system. Direct measurementsof transjunctional cadherin interactions revealed a sudden, but par-tial, loss of homophilic interactions (τ = 1.17 ± 0.06 s−1) upon che-lation of extracellular Ca2+. A cadherin mutant with reducedadhesive activity (W2A) exhibited a faster, more substantial lossof homophilic interactions (τ = 0.86 ± 0.02 s−1), suggesting twotypes of native cadherin interactions—one that is rapidly modu-lated by changes in extracellular Ca2+ and another with relativelystable adhesive activity that is Ca2+ independent. The Ca2+-sensitivedynamics of cadherin interactions were transmitted to the cell in-terior where β-catenin translocated to N-cadherin at the junction inboth cells. These data indicate that cadherins can rapidly conveydynamic information about the extracellular environment to bothcells that comprise a junction.
cell adhesion | fluorescence resonance energy transfer | trans binding
The junctions between cells are populated with a variety of celladhesion molecules that drive the recognition, assembly, and
dynamics of cell–cell interactions. Parsing the distinct functions ofdifferent adhesion molecules has been challenging, in part due toa paucity of truly revealing in vivo assays. Among cell adhesionmolecule families, the classic cadherins exhibit a unique depen-dence on extracellular Ca2+ to rigidify the extracellular domainsand enable trans junctional homophilic interactions. Three Ca2+
ions bind with different affinities to each of the pockets betweencadherin extracellular domains (1, 2). The affinity of the variousCa2+ binding sites is in the micromolar to millimolar range (3–8),suggesting the possibility that cadherins can respond dynamicallyto changes in junctional Ca2+ levels, and by virtue of physicalinteractions with cytoplasmic molecules, signal information aboutthe junctional status to the cell interior.3D reconstructions of desmosomes by cryoelectron tomogra-
phy reveal cadherins interact across intercellular interfaces (9,10), and crystallographic data of several cadherin domains (4, 11,12) implicate the first two extracellular repeats (ECs 1 and 2) ascritical for homophilic interactions. Previous studies have in-dicated the importance of a highly conserved tryptophan residue(Trp2), present in the first EC domain, for cadherin-dependentadhesion (2, 12). This tryptophan inserts into the hydrophobicpocket of the partner N-cadherin (Ncad) molecule to form astrand-swapped dimeric structure (11, 12). Mutation of Trp2 toan alanine residue (W2A) prevents strand swapping (13) andresults in a loss of adhesive function (2, 14, 15). Although ex-tensive work has elucidated the structure (4, 9–14), biochemistry(2, 16) and single-molecule characterization (15, 17) of cadherinadhesion, relatively little is known about these interactions andtheir dynamics in living cells.
In this work we develop a genetically encoded fluorescencereporter system that enables the visualization and quantificationof spatiotemporal dynamics of N-cadherin interactions acrossintercellular junctions in live cells. We show that N-cadherinmolecules exhibit a sudden, partial loss of interaction upon rapidremoval of extracellular Ca2+. In comparison, a variant witha point mutation (W2A) that substantially decreases adhesiveactivity exhibited a faster, more substantial loss with Ca2+ che-lation, These data reveal a much greater structural change due toCa2+ depletion in the absence of the Trp2-hydrophobic pocketinteraction of EC1 and suggest a cadherin–cadherin interactionin the wild-type protein that is Ca2+ independent but Trp2 de-pendent. Furthermore, β-catenin, an intracellular binding part-ner of N-cadherin that mediates the association of cadherins withthe actin cytoskeleton, translocates to the junction in both cellsupon Ca2+ removal. We postulate that the rapid Ca2+ sensingproperty of cadherin molecules may coordinate adhesion andallow for both cells to access information about junctional statussimultaneously and signal this information to the cell interior.
Results and DiscussionTo examine the spatiotemporal dynamics of cadherin interac-tions, we designed a genetically encodable intermolecular FRET-based reporter system that exploits the physical interaction ofcadherins at junctions and uses Cerulean fluorescent protein (FP)as the FRET donor (18) and Venus FP as the FRET acceptor(19) (Fig. 1A). The dimensions of each cadherin EC are known tobe ∼45 Å long × 25 Å diameter. Based on this, we hypothesizedthat Cerulean and Venus (∼42 Å in length × 24 Å diameterbarrel) (20) inserted within the first two distal EC domains wouldbe within the calculated Förster distance (R0 = 54 Å for Ceruleanand Venus) (21) and efficiently report cadherin interactionsacross junctions (Fig. 1A).To insert a GFP into the compact extracellular domain of
N-cadherin without affecting its function, we performed an invitro transposition screen to isolate functional clones (22). Wescreened 509 colonies and found four clones that had GFPinserted in the distal extracellular region (from the N terminus ofthe first EC to the C terminus of the second EC). From thisscreen, we chose a clone with GFP inserted in one of the solvent-exposed helices in extracellular domain 2 (FP-Ncad; Fig. 1B)(2) that had the brightest expression at cell–cell contacts. We
Author contributions: S.A.K., C.-Y.T., L.-P.M., E.A.M., and E.M.S. designed research; S.A.K.,C.-Y.T., and L.-P.M. performed research; S.A.K., C.-Y.T., and L.-P.M. contributed newreagents/analytic tools; S.A.K., C.Y.T., and L.-P.M. analyzed data; and S.A.K. and E.M.S.wrote the paper.
The authors declare no conflict of interest.
*This Direct Submission article had a prearranged editor.1S.A.K. and C.-Y.T. contributed equally to this work.2Present address: Institute of Molecular Biology, Academica Sinica, Nankang, Taipei 115,Taiwan, Republic of China.
3To whom correspondence should be addressed. E-mail: [email protected].
This article contains supporting information online at www.pnas.org/lookup/suppl/doi:10.1073/pnas.1019003108/-/DCSupplemental.
www.pnas.org/cgi/doi/10.1073/pnas.1019003108 PNAS | June 14, 2011 | vol. 108 | no. 24 | 9857–9862
CELL
BIOLO
GY

replaced the GFP with Cerulean or Venus and then transfectedtwo separate populations of COS-7 cells with either Cerulean(C-Ncad) or Venus cadherin (V-Ncad). Later, individual pop-ulations or mixed populations were plated to examine the junc-tional localization. Junctions comprising either a single cadherin-fluorescent species (C-Ncad or V-Ncad) or mixed junctions(C-Ncad and V-Ncad) exhibited the appropriate membrane lo-calization of cadherin molecules at cell–cell interfaces, similar toendogenous cadherin (Fig. 1C).We next examined whether our fluorescently labeled cadherin
fusion proteins retained Ca2+-dependent adhesion with similarCa2+ binding properties to wild-type cadherin. L-cells that lackendogenous cadherins have been used extensively for cadherin-dependent adhesion function assays (23, 24). In L-cells stablytransfected with either unlabeled wild-type Ncad or V-Ncad,comparable levels of total cadherin were expressed in each cellline with the majority of expression on the cell surface (Figs. S1and S2). We assessed Ca2+-dependent cell aggregation of thesestable lines using a quantitative short-term aggregation assay.V-Ncad conferred Ca2+-dependent adhesion to L cells similarto wild-type Ncad within a physiologically relevant Ca2+ con-centration range (Fig. 1 D and E and Fig. S3). In contrast, theuntransfected L-cells showed no detectable aggregation underany conditions, as expected. Furthermore, fluorescently labeledcadherin fusion proteins interacted with their intracellular bindingprotein, β-catenin, as detected by immunoprecipitation and im-munoblotting (Fig. S4). These results indicate that the fluorescentN-cadherin protein fusions exhibit features similar to endogenous
N-cadherins, including membrane localization, Ca2+-dependentadhesion, and interaction with β-catenin.To assess the molecular interaction of cadherins under basal
conditions in living cells, we performed acceptor bleach FRETexperiments on junctions of adjacent transfected COS-7 cellsexpressing either V-Ncad or C-Ncad fusion proteins (Fig. 2A).Following acceptor bleaching of V-Ncad at well-defined two-color junctions, donor dequenching of C-Ncad was observed(Fig. 2A), indicating that the fluorescent molecules from the twodifferent cell membranes were well within the distance requiredfor FRET. The average FRET efficiency (34.1 ± 2.32%; mean ±SEM; n = 10; Fig. 2E) for the wild-type Ncad interactions inliving cells most likely represents the molecules in a strand-swapped trans dimer configuration (13). Because FRET is dis-tance dependent, we examined the spatial limits for transjunc-tional FRET using a different clone with an insertion site betweenEC5 and the transmembrane domain found in our transpositionscreen (Fig. 2F, red arrow, referred to as FPprox-Ncad). AlthoughFPprox-Ncad localized to cell–cell contacts (Fig. 2B), the averageFRET efficiency was markedly less than FP-Ncad (6.6 ± 1.01%;mean ± SEM; n = 10; Fig. 2E), as expected from the relativelyremote positions of the fluorophores (Fig. 2F). As a control,measurements in well-defined single-color junctions of cellsexpressing V-Ncad or C-Ncad alone indicated no evidence ofphotoconversion of Venus into a Cerulean-like species as pre-viously reported (25). In additional analyses we were able toquantify and qualitatively map the Ncad interactions assessed byFRET within live cellular contacts, revealing an apparent spa-tial heterogeneity of Ncad binding within junctions with small
Fig. 1. Design and characterization of N-cadherin FRET reporter. (A) Schematic of N-cadherin–N-cadherin interactions at cell–cell junctions monitored byFRET. Light blue ovals represent the five EC domains; the inserted fluorescent protein, Venus (yellow) or Cerulean (cyan), is located in the EC2 domain.Dynamic interactions of cadherins monitored by FRET result in intensity changes of each fluorescent protein. (B) Domain structure of fluorescent proteininsertion site in N-cadherin (gray, signal peptide; light blue, EC domains; dark blue, transmembrane domain; blue arrow, FP insertion site). Amino acidnumbers are indicated below the bar. (C) N-cadherin fusion proteins. Cerulean (Left), Venus (Center Left), and Cerulean/Venus (Center Right) localize to themembrane and form cell–cell contacts similar to the localization of endogenous Ncad (Right) in COS-7 cells. (Scale bar: 10 μm.) (D) L-cells expressing Ncad or V-Ncad constructs show robust cell aggregation under high Ca2+ (1 mM Ca2+). (Scale bar: 50 μm.) (E) Ncad and V-Ncad stable cell lines show similar and increasingaggregation with increasing extracellular Ca2+ concentrations. No statistically significant differences (Student t test; P < 0.05) were seen at higher Ca2+
concentrations (300–1,000 μM). Error bars indicate ± SEM for n = 3–4 for each condition. Untransfected L-cells showed no aggregation under any conditions.
9858 | www.pnas.org/cgi/doi/10.1073/pnas.1019003108 Kim et al.

(<1–2 μm) regions showing much stronger FRET than adjacentareas (Fig. 2D).An important amino acid responsible for cadherin–cadherin
adhesion is the highly conserved Trp2, present in the first ECdomain, which inserts into the hydrophobic pocket of the partnerN-cadherin molecule (2, 3, 12). Mutation of Trp2 to an alanineresidue (W2A) prevents strand-swapping and results in sub-stantially reduced cadherin homophilic interactions (2, 3). Sim-ilar to N-cadherin (FP-Ncad) expression in L cells, FP-W2Aexhibited membrane localization but with less of the total cel-lular surface area comprising contacts with neighboring cells(Figs. S1 and S2). The V-W2A cell line exhibited modest ag-gregation but only at higher Ca2+ concentrations (Student t test;P < 0.05; Figs. S3 and S5), reflecting a markedly weaker bindingand confirming similar previous findings (13, 15). Expression ofFP-W2A in COS-7 cells, which also possess endogenous cad-herins, allowed us to assess the nature of the relationship of FP-W2A cadherins at intact junctions. Although reduced adhesionwas observed in L-cells expressing FP-W2A, FP-W2A cadherinmutants exhibited a higher average FRET efficiency (47.3 ±2.30%; mean ± SEM, n = 10; Fig. 2E) compared with FP-Ncad(Student t test; P < 0.001), indicating that the W2A moleculesare closer together than wild-type NCad. These data are con-sistent with recent structural data comparing wild-type and W2Adimeric configurations, in which the wild-type trans dimer in a
strand-swapped configuration was found to have a markedlywider angle between paired EC1-2 domains compared with theW2A mutant (13). Due to the placement of our label within theEC2 domain, our FRET measurements directly demonstratethese structural differences in living cell–cell junctions (Fig. 2F).Electron microscopic observations of purified E-cadherin EC
domains indicate a progressive rigidification of the modular rod-like structure as the Ca2+ concentration is increased from <50μM to >1 mM (4). In vivo, the average basal extracellular Ca2+
concentration is 1.5–2 mM (26), well within the range wherecadherins engage in trans interactions. To test directly whethera change in extracellular Ca2+ can be detected by cadherins, wecontinuously monitored FRET at two-color N-cadherin (FP-NCad) junctions in live cells before and after the chelation ofextracellular Ca2+ (via the addition of EGTA; Fig. 3 A and B,Upper). The rapid addition of EGTA allowed us to evaluatedynamic changes in the molecular geometry of the labeled cad-herins and couple the consequences to signaling. Addition ofEGTA triggered a rapid and substantial loss of FRET efficiency(Fig. 3D and Fig. S6), resulting from simultaneous and reciprocalchanges in C-Ncad and V-Ncad fluorescence intensities. Emis-sion spectra before and after Ca2+ chelator addition indicated adecrease in the Venus emission signal near 530 nm and a corre-sponding increase in the Cerulean emission signal near 497 nm(Fig. 3C). In control measurements, single-color junctions showed
Fig. 2. Detecting N-cadherin interactions under basal conditions across cell–cell junctions. A representative example of a cell–cell junction of two adjacenttransfected COS-7 cells expressing (A) V-Ncad or C-Ncad, (B) Vprox-Ncad or Cprox-Ncad, and (C) V-W2A or C-W2A fusion proteins under basal high Ca2+ con-ditions (1.8 mM Ca2+). The acceptor (Venus fusion protein) was bleached within the ROI (red box); images were acquired before and after bleaching (see D forcolor look-up table). (Scale bars: images, 10 μm; corresponding ROIs, 1 μm.) (D) Quantitative spatial FRET maps for each of the examples shown in A–C,respectively, show the heterogeneity of cadherin interactions at cell–cell contact. (Scale bar: same as for corresponding ROIs in C.) (E) Average FRET effi-ciencies for WT, W2A, and WTprox N-cadherin junctions. Error bars indicate ± SEM for n = 10 cells each. (F) N-cadherin domain structure indicating the W2Amutation (green; FP-W2A), and distal (blue; FP-Ncad) and proximal (red; FPprox-Ncad) insertion sites for FRET reporter constructs.
Kim et al. PNAS | June 14, 2011 | vol. 108 | no. 24 | 9859
CELL
BIOLO
GY

no significant changes in fluorescence intensity upon extracellularCa2+ chelation (Fig. S7). The reduction in cadherin–cadherin in-teraction at these junctions exhibited kinetics that was well fit bya single exponential (τ =1.17 ± 0.06 s−1, mean ± SEM; n = 17;Fig. 3D). In the continued presence of EGTA, the FRET loss atFP-Ncad junctions reached steady-state and remained stable forthe duration of the experiment (Fig. 3 and Fig. S6). Another Ca2+
chelator, BAPTA, also elicited similar results.Given the residual cadherin–cadherin interaction that ap-
peared Ca2+ insensitive in the above experiment, we consideredthe possibility that the molecularly distinct adhesive interfaceconferred by the Trp2 residue might provide structural stabilitythat maintains some cadherin proximity in the absence of Ca2+.To address this, we examined the behavior of the FP-W2Acadherin mutants following a rapid reduction in Ca2+. Uponchelation of Ca2+, FP-W2A junctions exhibited significantlyfaster kinetics (τ= 0.86 ± 0.02 s−1; mean ± SEM; n= 17; Fig. 3Fand Fig. S8) and a substantially greater decrease in FRETcompared with FP-Ncad junctions (FRET change for FP-Ncad:14.43 ± 1.33%, FP-W2A: 57.36 ± 2.13%; n = 17 each; P <0.0001; Fig. 3E). The estimated change in intermolecular dis-tance between FP-W2A before and after the addition of EGTAwas much larger than for the FP-NCad.
Taken together, our data reveal a much greater structuralchange due to Ca2+ depletion in the absence of the Trp2-hydrophobic pocket interaction of EC1 and indicate a cadherin–cadherin interaction in the wild-type molecule that is Ca2+ in-dependent. These findings may represent (i) a mixed populationof dynamic molecules, some which unbind, similar to the W2Adimer configuration, and others that exhibit stable, EGTA-resistant interactions (represented by the remaining residualFRET efficiency); (ii) a population that converts to a differentstable state (following EGTA treatment) where the fluorophoresmove to a less favorable FRET orientation; or (iii) a combina-tion of all of the above. The current data does not allow us todetermine which of these interpretations is correct, but futureresearch will provide more insight into these different states ofwild-type N-cadherin interactions upon unbinding.The homophilic nature of cadherin associations allows, in
principle, for the transmission of information to the interior ofboth cells that comprise a junction. To monitor whether a changein signaling can be invoked by extracellular Ca2+ dynamics andthe loss of cadherin interactions, we examined the dynamics ofβ-catenin, an intracellular binding partner of N-cadherin thatregulates the interaction of cadherins with the actin cytoskeleton(27). COS-7 cells were transfected with a β-catenin–GFP con-struct, and two neighboring cells were imaged before and after
Fig. 3. N-cadherin interactions across junctions exhibit a rapidsensitivity to extracellular Ca2+ changes. (A) Images of COS-7cells expressing either FP-Ncad or FP-W2A fluorescent fusionproteins of the FRET reporter. ROIs (red boxes) were chosenencompassing well-defined junctions for faster acquisition.ROIs were colorized according to the emission ratio of V-Ncad:C-Ncad fluorescence intensity (V/C ratio). (Scale bar: 10 μm.) (B)Quantitation of Ca2+-dependent cadherin FRET changes overtime. ROIs (red boxes in A) at two-color junctions were imagedbefore and after the addition of the Ca2+ chelator, EGTA (20mM final), at 15 s (gray arrow). The fluorescence intensity ofeach channel was normalized to the average baseline (yellowfor V-Ncad and cyan for C-Ncad) and plotted together with theV/C ratio as a measure of FRET (red). (C) Representative emis-sion spectra of a two-color FP-Ncad junction before and afterEGTA treatment. (D and F) Kinetics of the FRET decrease uponCa2+ removal. EGTAwas added at 15 s (see gray arrow; FP-Ncad(D) and FP-W2A (F); n = 17 each; mean ± SEM). Data were fitwith a single exponential decay curve (red). (E) Summary of themagnitude of FRET changes upon Ca2+ depletion in FP-Ncadand FP-W2A junctions (n = 17 each; P < 0.0001).
9860 | www.pnas.org/cgi/doi/10.1073/pnas.1019003108 Kim et al.

chelation of extracellular Ca2+. Upon addition of EGTA, a bi-directional translocation of β-catenin–GFP to cell–cell contactswas observed (immediate onset upon treatment; τ = 4.38 ±0.25 s; mean ± SEM; n = 7; Fig. 4 A and D). This increase inβ-catenin–GFP fluorescence at the junction was associated witha concomitant decrease in cytosolic fluorescence in both cellsduring Ca2+ removal (Fig. 4C). When the same experiment wasperformed in L-cells that lack endogenous cadherins, β-cateninfailed to translocate to the junction (Fig. 4B), indicating that thejunctional translocation is cadherin dependent. The fast mem-brane translocation of β-catenin upon Ca2+ chelation indicatesthat information about the extracellular milieu can be rapidlytransmitted to the cytoplasm. The recruitment of β-catenin to thejunctional membrane likely represents a compensatory mecha-nism to stabilize cadherin interactions affected by Ca2+ chela-tion. It has been shown previously that catenins can directlyinfluence the adhesive state of cadherins (28).Our results show that cadherin molecules localized at junc-
tions in living cells adopt structurally distinct conformations andcan sense changes in extracellular Ca2+ on a rapid timescale. TheFRET measured via fluorophores associated with EC2 providesevidence in living cells for recently described cadherin–cadherinstructural interactions comparing wild-type and W2A dimericconfigurations (13, 15). The W2A mutant described as the “ini-tial encounter complex” (13) or “X-dimer” (17) has been pro-posed to be an important intermediate step in the assemblyand disassembly of strand-swapped dimers. A recently publishedpaper suggests that the X-dimer may not be an essential stepin cadherin assembly at cell–cell contacts but instead is likelya critical transition stage for the release of cadherins fromjunctions (29). In our experiments we found that the W2A mu-tant was able to form weak adhesive complexes and possessedrapid dissociation kinetics, consistent with it being an in-termediate step in disassembly of strand-swapped dimers.Furthermore, we show that underlying a dynamic Ca2+-
dependent change is a residual, EGTA-insensitive component to
the wild-type cadherin–cadherin interactions found at cell junc-tions. The dissociation rate of strand-swapped dimers at cell–cellcontacts in vivo may be slower than dissociation kinetics mea-sured in vitro because in vivo dimers are likely reinforced by cisinteractions (30, 31). A similar Ca2+-independent stability hasbeen described using cross-linking techniques for lateral dimers(32, 33). Previous work examining cadherin dynamics (34) andthe Ca2+ dependence of cadherin interactions (35) demon-strated changes with a much longer latency (minutes or hours,rather than seconds) than we have observed here. Our data in-dicate that extracellular Ca2+ fluctuations result in a rapid reg-ulation of cadherin interactions, and that these dynamics caninvoke changes in intracellular signaling.The presence of Ca2+-permeable channels and pumps, as well
as a large extra/intracellular Ca2+ concentration gradient, sug-gests that the extracellular ionic environment is dynamic. Indeed,extracellular Ca2+ fluctuations have been documented in bone(36), cardiac muscle (37), and neuronal synapses (38, 39). Ofparticular interest is the neuronal synapse where fluctuations ofextracellular Ca2+ have been described and characterized. Sim-ulations of active synaptic clefts (26, 40) predict that duringsynaptic activity, Ca2+ concentrations in the cleft drop into therange where local synaptic and/or perisynaptic cadherins wouldlose transinteractions (∼0.8–1 mM). In addition, experimentalmeasurements in the synaptic cleft during high-frequency stim-ulation have shown that Ca2+ concentration may drop to as lowas 0.3–0.8 mM (41, 42), and Ca2+-dependent inhibition of cad-herin function has been observed during synaptic plasticity (43).Biophysical measurements of purified cadherin extracellulardomains, using laser tweezers, showed that an extracellular dropin Ca2+ from 1.5 to 0.8 mM is predicted to decrease binding ofN-cadherin by ∼40%, whereas a further drop to 0.3 mM wouldresult in a reduction of binding by 85% (44). Thus, the Ca2+
dependence of cadherin interactions seems to be appropriatelytuned to monitor physiological fluctuations of Ca2+ concen-trations. The rapid Ca2+ sensing property of cadherin molecules
Fig. 4. Extracellular Ca2+ chelation results in a translo-cation of β-catenin to the membrane. β-catenin-GFP isexpressed in two neighboring cells in either COS-7 cellswith endogenous N-cadherin (A) or in L-cells in the ab-sence of N-cadherin (B). Cells were imaged every 1 s beforeand after the addition of the Ca2+ chelator EGTA at 30 s (Aand B Upper). An ROI (red box) of the junctions (A and BRight) shows pre- and post-EGTA treatment and is pseu-docolored according to fluorescence intensity (see C forcolor look-up table). (Scale bars: images, 5 μm; corre-sponding ROIs, 2 μm.) β-catenin–GFP fluorescence intensitychanges in the ROIs were normalized to baseline andplotted over time (A and B Lower). (C) Kymographshowing β-catenin–GFP fluctuations at the junction andneighboring cytosol over time. The one-pixel line scan(marked by the two red arrowheads in A) was colorized,and the summary graph indicated a corresponding drop inthe cytosol near the junction. (D) Kinetics of the β-catenin–GFP fluorescence change upon Ca2+ removal. EGTA wasadded at 30 s (n = 7; mean ± SEM). Data were fit witha Boltzmann function (red).
Kim et al. PNAS | June 14, 2011 | vol. 108 | no. 24 | 9861
CELL
BIOLO
GY
that we document here may coordinate adhesion and signalingacross cell–cell junctions, allowing both cells that comprise ajunction access to the same information at the same time.
Materials and MethodsFRET Constructs. To generate a functional N-cadherin fusion protein withGFP, we used the bacterial transposon-mediated random insertion tech-nique (22) (SI Materials and Methods). From our screen, we chose one par-ticular clone with GFP inserted in the extracellular domain (EC2) of cadherinbecause of its close proximity to the adhesion site at the tip as well as abrighter expression on the membrane and at cell–cell junctions in HEK293cells. For FRET measurements, the GFP was replaced by Venus and Cerulean.Methods for immunoprecipitation and immunofluorescence have been de-scribed previously (45) (SI Materials and Methods).
FRET Imaging. Spectral imaging (12-bit, 512 × 512) was accomplished usinga LSM510 Meta confocal laser scanning microscope with a 40× 1.3 N.A. oilimmersion plan apochromat objective lens (Carl Zeiss MicroImaging, Inc.).A 458-nm argon ion laser was used for excitation. Emitted light was col-lected over a spectrum of wavelengths between 463 and 580 nm withband widths of 10.7 nm (21). Acceptor bleach FRET was performed by
continuous bleaching with the 514-nm laser (100% power, 2,000 iter-ations) within a chosen ROI. To resolve faster kinetics for time-lapseratiometric FRET measurements, continuous fast scans (100 ms) of smallerfields of view were used to monitor FRET changes. Because of the signif-icant overlap in the emission spectra of Cerulean and Venus, the fluores-cence contribution of each fluorophore at each pixel was separated usinga linear unmixing algorithm based on the spectral signatures of Ceruleanand Venus created from reference lambda stack images of single-color celljunctions on the same day (21). The mean fluorescence intensity wasmeasured for each fluorophore, and the FRET efficiency was expressedas the emission ratio of Venus:Cerulean. Full methods are provided inSI Materials and Methods.
ACKNOWLEDGMENTS. We thank Anh Pham for assistance and the Bensonand Piston laboratories for providing the pCXN2-Ncad and mCeruleanconstructs. We also thank members of the Schuman laboratory, particularlyHwan-Ching Tai and Young Yoon, for helpful discussions, and DavidSprinzak, Michael Sutton, Stephanie Bunse, Kaushiki Menon, and especiallyKai Zinn, for critical comments on the manuscript. This work was funded bythe National Institutes of Health and the Howard Hughes Medical Institute(E.M.S.). S.A.K. was a Damon Runyon Fellow supported by Damon RunyonCancer Research Foundation Grant DRG-1908-06.
1. Nagar B, Overduin M, Ikura M, Rini JM (1996) Structural basis of calcium-inducedE-cadherin rigidification and dimerization. Nature 380:360–364.
2. Tamura K, ShanWS, HendricksonWA, Colman DR, Shapiro L (1998) Structure-functionanalysis of cell adhesion by neural (N-) cadherin. Neuron 20:1153–1163.
3. Chitaev NA, Troyanovsky SM (1998) Adhesive but not lateral E-cadherin complexesrequire calcium and catenins for their formation. J Cell Biol 142:837–846.
4. Pertz O, et al. (1999) A new crystal structure, Ca2+ dependence and mutational analysisreveal molecular details of E-cadherin homoassociation. EMBO J 18:1738–1747.
5. Koch AW, Pokutta S, Lustig A, Engel J (1997) Calcium binding and homoassociation ofE-cadherin domains. Biochemistry 36:7697–7705.
6. Pokutta S, Herrenknecht K, Kemler R, Engel J (1994) Conformational changes of therecombinant extracellular domain of E-cadherin upon calcium binding. Eur J Biochem223:1019–1026.
7. Alattia JR, et al. (1997) Lateral self-assembly of E-cadherin directed by cooperativecalcium binding. FEBS Lett 417:405–408.
8. Prasad A, Pedigo S (2005) Calcium-dependent stability studies of domains 1 and 2 ofepithelial cadherin. Biochemistry 44:13692–13701.
9. Al-Amoudi A, Díez DC, Betts MJ, Frangakis AS (2007) The molecular architecture ofcadherins in native epidermal desmosomes. Nature 450:832–837.
10. He W, Cowin P, Stokes DL (2003) Untangling desmosomal knots with electrontomography. Science 302:109–113.
11. Boggon TJ, et al. (2002) C-cadherin ectodomain structure and implications for celladhesion mechanisms. Science 296:1308–1313.
12. Shapiro L, et al. (1995) Structural basis of cell–cell adhesion by cadherins. Nature 374:327–337.
13. Harrison OJ, et al. (2010) Two-step adhesive binding by classical cadherins. Nat StructMol Biol 17:348–357.
14. Overduin M, et al. (1995) Solution structure of the epithelial cadherin domainresponsible for selective cell adhesion. Science 267:386–389.
15. Sivasankar S, Zhang Y, Nelson WJ, Chu S (2009) Characterizing the initial encountercomplex in cadherin adhesion. Structure 17:1075–1081.
16. Kitagawa M, et al. (2000) Mutation analysis of cadherin-4 reveals amino acid residuesof EC1 important for the structure and function. Biochem Biophys Res Commun 271:358–363.
17. Zhang Y, Sivasankar S, Nelson WJ, Chu S (2009) Resolving cadherin interactions andbinding cooperativity at the single-molecule level. Proc Natl Acad Sci USA 106:109–114.
18. Rizzo MA, Springer GH, Granada B, Piston DW (2004) An improved cyan fluorescentprotein variant useful for FRET. Nat Biotechnol 22:445–449.
19. Nagai T, et al. (2002) A variant of yellow fluorescent protein with fast and efficientmaturation for cell-biological applications. Nat Biotechnol 20:87–90.
20. Ormö M, et al. (1996) Crystal structure of the Aequorea victoria green fluorescentprotein. Science 273:1392–1395.
21. Rizzo MA, Springer G, Segawa K, Zipfel WR, Piston DW (2006) Optimization ofpairings and detection conditions for measurement of FRET between cyan and yellowfluorescent proteins. Microsc Microanal 12:238–254.
22. Sheridan DL, et al. (2002) A new way to rapidly create functional, fluorescent fusionproteins: Random insertion of GFP with an in vitro transposition reaction. BMCNeurosci 3:7.
23. Nagafuchi A, Takeichi M (1989) Transmembrane control of cadherin-mediated celladhesion: A 94 kDa protein functionally associated with a specific region of thecytoplasmic domain of E-cadherin. Cell Regul 1:37–44.
24. Alattia JR, Tong KI, Takeichi M, Ikura M (2002) Cadherins. Methods Mol Biol 172:199–210.
25. Valentin G, et al. (2005) Photoconversion of YFP into a CFP-like species duringacceptor photobleaching FRET experiments. Nat Methods 2:801.
26. Egelman DM, Montague PR (1999) Calcium dynamics in the extracellular space of
mammalian neural tissue. Biophys J 76:1856–1867.27. Drees F, Pokutta S, Yamada S, Nelson WJ, Weis WI (2005) Alpha-catenin is a molecular
switch that binds E-cadherin-beta-catenin and regulates actin-filament assembly. Cell
123:903–915.28. Gumbiner BM (2005) Regulation of cadherin-mediated adhesion in morphogenesis.
Nat Rev Mol Cell Biol 6:622–634.29. Hong S, Troyanovsky RB, Troyanovsky SM (2011) Cadherin exits the junction by
switching its adhesive bond. J Cell Biol 192:1073–1083.30. Harrison OJ, et al. (2011) The extracellular architecture of adherens junctions revealed
by crystal structures of type I cadherins. Structure 19:244–256.31. Wu Y, et al. (2010) Cooperativity between trans and cis interactions in cadherin-
mediated junction formation. Proc Natl Acad Sci USA 107:17592–17597.32. Troyanovsky RB, Laur O, Troyanovsky SM (2007) Stable and unstable cadherin dimers:
Mechanisms of formation and roles in cell adhesion. Mol Biol Cell 18:4343–4352.33. Troyanovsky RB, Sokolov E, Troyanovsky SM (2003) Adhesive and lateral E-cadherin
dimers are mediated by the same interface. Mol Cell Biol 23:7965–7972.34. Adams CL, Chen YT, Smith SJ, Nelson WJ (1998) Mechanisms of epithelial cell–cell
adhesion and cell compaction revealed by high-resolution tracking of E-cadherin-
green fluorescent protein. J Cell Biol 142:1105–1119.35. Rothen-Rutishauser B, Riesen FK, Braun A, Günthert M, Wunderli-Allenspach H (2002)
Dynamics of tight and adherens junctions under EGTA treatment. J Membr Biol 188:151–162.
36. Dvorak MM, et al. (2004) Physiological changes in extracellular calcium concentration
directly control osteoblast function in the absence of calciotropic hormones. Proc NatlAcad Sci USA 101:5140–5145.
37. Cleemann L, Pizarro G, Morad M (1984) Optical measurements of extracellularcalcium depletion during a single heartbeat. Science 226:174–177.
38. Pumain R, Heinemann U (1985) Stimulus- and amino acid-induced calcium and
potassium changes in rat neocortex. J Neurophysiol 53:1–16.39. Rusakov DA, Fine A (2003) Extracellular Ca2+ depletion contributes to fast activity-
dependent modulation of synaptic transmission in the brain. Neuron 37:287–297.40. Wiest MC, Eagleman DM, King RD, Montague PR (2000) Dendritic spikes and their
influence on extracellular calcium signaling. J Neurophysiol 83:1329–1337.41. Benninger C, Kadis J, Prince DA (1980) Extracellular calcium and potassium changes in
hippocampal slices. Brain Res 187:165–182.42. Nicholson C, ten Bruggencate G, Stöckle H, Steinberg R (1978) Calcium and potassium
changes in extracellular microenvironment of cat cerebellar cortex. J Neurophysiol 41:1026–1039.
43. Tang L, Hung CP, Schuman EM (1998) A role for the cadherin family of cell adhesionmolecules in hippocampal long-term potentiation. Neuron 20:1165–1175.
44. Baumgartner W, Golenhofen N, Grundhöfer N, Wiegand J, Drenckhahn D (2003) Ca2+
dependency of N-cadherin function probed by laser tweezer and atomic forcemicroscopy. J Neurosci 23:11008–11014.
45. Tai CY, Mysore SP, Chiu C, Schuman EM (2007) Activity-regulated N-cadherinendocytosis. Neuron 54:771–785.
9862 | www.pnas.org/cgi/doi/10.1073/pnas.1019003108 Kim et al.

Supporting InformationKim et al. 10.1073/pnas.1019003108SI Materials and MethodsTransposon-Mediated in Vitro Transposition and Molecular Cloning.Transposon-mediated in vitro transposition. Mouse N-cadherin cDNAin a mammalian expression vector (pCXN2-Ncad) was usedas the target for in vitro transposition (1). The procedure wascarried out as described previously with some modifications (2).In brief, from an in vitro transposition screen of 509 colonies, weidentified 23 clones with the correctly inserted GFP using colonyPCR. This method allowed for screening of hundreds of colonieswithout DNA amplification and purification. Three 5′-end pri-mers were designed to cover the entire N-cadherin coding regionand one 3′-end primer within GFP. To reduce the number ofreactions on a first pass, approximately five colonies were pooledin one reaction for rapid elimination of those colonies that failedto produce a positive result. During the transposition, a stopcodon was inserted between the GFP and kanamycin-resistantgene, which created a truncatedN-cadherin GFP fusion. A simplerestriction enzyme (SmaI) digest followed by self-ligation andbacterial transformation restored the full length N-cadherin withintramolecular GFP insertion. All 23 candidates were restored tothe full-length N-cadherin with GFP insertion. After the fullrestoration procedure, all clones were transiently transfected intoa cultured mammalian cell line (HEK293 cells) for direct visu-alization of GFP fluorescence to determine if the fusion proteinwas in-frame and had good junctional localization. When thefluorescence was visualized in intact transfected cells, 10 clonesexhibited localization at the cell–cell contacts, the expected lo-cation for a functional cadherin protein. These clones were thensubjected to DNA sequencing to identify the exact site of in-sertion—six of 10 clones had GFP inserted in the extracellulardomain of N-cadherin.Two cloneswere chosen from the screen for FRETexperiments,
one in which GFP was inserted near EC2 (FP-NCad) and one inwhich GFP was inserted near the plasma membrane (FPprox-NCad). In the FP-Ncad clone a few extra amino acids wereintroduced by the transposon, along with a flanking restrictionenzyme site, AscI, on both sides of the GFP (MLRYRILS-LSLIHIWRA-GFP-GRARADVYKRQILS-QAPSTPSP; in bold:original N-cadherin sequence; bold italic: repeated N-cadherinsequence; normal: extra amino acids introduced by the transposon;underlined: abbreviation for green fluorescent protein). The in-sertion was at amino acid position 311. In the FPprox-Ncad clonea few extra amino acids were also introduced by the transposon,along with a flanking restriction enzyme site, AscI (NGDCTDVD-LSLIHIWRA-GFP-GRARADVYKRQDVD-RIVGAG; in bold:original N-cadherin sequence; bold italic: repeated N-cadherinsequence; normal: extra amino acids introduced by the transposon;underlined: abbreviation for GFP). The insertion was at aa 714.The GFP was replaced with Venus and Cerulean in the fusionproteins of both constructs.Molecular cloning. The entire coding region of the N-cadherin fu-sion protein (EcoRI-XmnI) was moved to a different expressionvector, pcDNA3.1Zeo(−) (Invitrogen), and a Kozak consensussequence (CGCCACC) with a XbaI site was introduced in frontof the start codon of the N-cadherin protein by PCR. A fragmentof N-cadherin containing the W2A mutation was synthesized(GenScript) and used to replace the corresponding WT fragmentin each of the FRET pair constructs (W2A-Ncad). All constructswere verified by DNA sequencing. The construction of the β-catenin–GFP plasmid was described previously (3).
Cell Culture and Transfections. Cell culture.L- and COS-7 cells (ATCC)were maintained in DMEM supplemented with 10% FBS andsodium pyruvate (Invitrogen) in a humidified 5% CO2 incubatorat 37 °C.Transfections for FRET experiments. For FRET experiments, COS-7cells were transiently transfected in suspension using eitherFuGENE6 (Roche Applied Science) or Lipofectamine 2000(Invitrogen), as described by the manufacturer, in a six-well plate.Twenty-four hours posttransfection, cells were washed threetimes and then dissociated from the surface by incubating cellswith 1 mL of D-PBS + 1.5 mM EDTA at 37 °C for 5 min. Equalnumbers of Venus and Cerulean N-cadherin–expressing cellswere plated on 35-mm glass-bottomed dishes (MatTek Corp.)that were pretreated with phenol red-free Matrigel. After re-covery overnight, cells were switched into phenol red-free mediasupplemented with 2 or 5 mM Ca2+ for 24 h before imaging toreduce autofluorescence.β-Catenin transfections. Transient transfections for β-catenin–GFPin COS-7 cells using Lipofectamine 2000 were performed as de-scribed by the manufacturer (Invitrogen). Cells were incubated for24 h or less before imaging experiments.
Immunoprecipitation. Adherent COS-7 cells were transientlytransfected using Lipofectamine 2000 (Invitrogen) as describedby the manufacturer in a six-well plate. Forty-eight hours after theaddition of the DNA/liposome mixture, cells were washed threetimes with ice-cold PBS-MC (PBS, 1 mM MgCl2, 0.1 mM CaCl2)and lysed with Nonidet P-40 lysis buffer [1% Nonidet P-40, 150mM NaCl, 50 mM Tris·HCl (pH 8.0)] with freshly added pro-tease inhibitor mixture (Roche). Cells were incubated on ice for20 min and centrifuged for 15 min at 4 °C. The centrifuged ex-tracts were mixed with lysis buffer-washed Protein G beads(Pierce) coupled to an anti-GFP antibody or rabbit IgG andincubated at 4 °C overnight with gentle rotation. Beads werewashed three times with lysis buffer at room temperature for10 min per wash and boiled in 5× SDS/PAGE sample buffer for5 min. The eluate and 2% of the supernatant were resolved bya 5–15% SDS/PAGE and transferred onto polyvinylidene fluo-ride membrane (BioRad). Immunoblotting was performed witheither β-catenin or N-cadherin antibodies.
Generation of N-Cadherin Stable Cell Lines. L-cell transfections. Togenerate stable lines, L-cells were transfected using 0.5 μg DNAwith 1.5 μL FuGENE 6 transfection reagent and 0.5 μL Com-biMag (Oz Biosciences) in a 24-well plate. DNA/FuGENEcomplexes were formed as described by the manufacturer beforethe addition of CombiMag beads. After a 20-min incubation atroom temperature, complete media was added to the DNA/FuGENE/CombiMag mix. After the complete mix was appliedto the cells, the 24-well plate was placed on a magnetic plate.The magnetic plate was removed after 20 min in the incubator.L-cell stable line production. After 24 h, cells were trypsinized, di-luted, and plated in a six-well plate in media supplemented with800 μg/mL Geneticin (Invitrogen) for selection. After 7–10 d,individual colonies were observed in the transfected well.Fresh Geneticin-containing media was exchanged every otherday for 1.5 wk. Colonies were then trypsinized and transferredto a new six-well plate for another 2–4 d or until the celldensity reached 50–70%. Monoclonal selection was achievedby diluting cells to 2 cells/mL and plating at 100 μL per well ina 96-well plate.
Kim et al. www.pnas.org/cgi/content/short/1019003108 1 of 8

Stable line screening.Wells containing colonies derived from a singlecell were selected and expanded into a 24-well plate. Protein ex-pression levels were determined by immunoblotting with an anti–N-cadherin antibody (BD Biosciences). Colonies expressinghigh total protein levels were further screened for protein lo-calization by direct fluorescence of the genetically encoded tagor immunofluorescence for untagged constructs usinga LSM510 Meta confocal laser scanning microscope with a 40×1.3 N.A. oil immersion plan apochromat objective lens (CarlZeiss MicroImaging, Inc.). Cell lines expressing high proteinlevels at the cell membrane were selected for experiments.Methods for immunoblotting and immunofluorescence havebeen described previously (4).
Quantitative Short-Term L-Cell Aggregation Assay. Short-term L-cellaggregation assay. L-cell aggregation assays were accomplishedas previously described with some modifications (5). N-cadherinstable cell lines were passaged into T-75 flasks until 85–95%confluence was obtained. All flasks were washed three times with10 mL of prewarmed Hepes buffer, Ca2+ and Mg2+ free(HCMF) + 5 mM CaCl2 [HCMF, in mM: 137 NaCl, 5.4 KCl,0.34 Na2HPO4, 0.1% glucose, 10 Hepes (pH 7.4)], and each flaskwas incubated in 5 mL of HCMF + 5 mM CaCl2 containing0.001% trypsin at 37 °C for 15 min. Trypsinization was termi-nated by the addition of a stop solution (0.02% soybean trypsininhibitor, 10 ng/mL DNase I, 10 mM MgCl2). Trypsinized cellsuspensions were transferred into 15-mL conical tubes andcentrifuged at 4 °C for 5 min. Pelleted cells were washed threetimes with 10 mL of ice-cold HCMF. Each cell suspension wasthen resuspended in growth media at 2 × 10⁶ cells/mL. To pre-vent adhesion of the cells to the bottom surface, 24-well plateswere precoated with 200 μL of 1% agarose. Aggregation assayswere carried out in a humidified 5% CO2 incubator at 37 °C atvarying Ca2+ concentrations, with a total of 1 × 10⁶ cells per well.No agitation was applied to minimize the shear force to avoidbreaking apart weak interactions. After 1 h, aggregation wasterminated by placing the cells on ice and adding an equal volumeof 8% formaldehyde solution.Quantitation of aggregation assay. Aggregates were transferred to anAccuvette (containing 22mL Isoton IIDiluent; BeckmanCoulter)with a precut P1000 pipette tip. Particles volume was quantitatedusing a Multisizer3 Coulter Counter (Beckman Coulter) using a280-mmaperture andvolumetric controlmode (2mL total assayedvolume). Data were analyzed using particle volume without co-incidence correction. Populations of cells were expressed bynormalized cumulative distributions of percent volume and me-dian particle volume.Imaging of aggregation assay. The entire contents of one wellwas plated into a new 24-well plate without agar. Images of cellaggregates were acquired using a LSM510 Meta confocallaser scanning microscope with a 10× 0.3 N.A. Plan-Neofluarobjective lens (Carl Zeiss MicroImaging, Inc.) and 488-nmargon ion laser excitation for differential interference contrast(DIC) imaging.
FRET Imaging and Analysis. FRET spectral imaging. Spectral imaging(12-bit, 512 × 512) was accomplished using a LSM510 Meta con-focal laser scanning microscope with a 40× 1.3 N.A. oil immersionplan apochromat objective lens (Carl Zeiss MicroImaging, Inc.). A458-nm argon ion laser was used for excitation. Emitted light wascollected over a spectrum of wavelengths between 463 and 580 nm,with band widths of 10.7 nm (6). Because of the significant overlapin the emission spectra of Cerulean and Venus, the fluorescencecontribution of each fluorophore at each pixel was separated usinga linear unmixing algorithm based on the spectral signatures ofCerulean and Venus created from reference lambda stack imagesof single-color cell junctions on the same day (6).
Acceptor bleach FRET. Acceptor bleach FRET was performed bycontinuous bleaching with the 514-nm laser (100% power, 2,000iterations) within a chosen ROI. In general, Venus was photo-bleached greater than 70–80% in the ROI. Acceptor bleach FRETexperiments were performed in Hepes buffered saline [HBS; inmM: 119 NaCl, 5 KCl, 2 CaCl2, 2 MgCl2, 30 glucose, 10 Hepes (pH7.4)].Acceptor bleach FRET analysis. Out-of-focus images were discardedbefore analysis. Before analysis, all images were backgroundsubtracted and smoothed (ImageJ). Within the bleached ROI,adherens junctions were straightened and cropped to include onlythe regions with a colocalized FRET reporter signal. Custom-written macros and the FRETcalc v3.0 plug-in for ImageJ wereused to assemble and quantify FRET efficiencies. When possiblewithin the same image, single-color junctions (Venus/Venus andCerulean/Cerulean) and nonbleached areas on the same junctionas the ROI were used as a negative control and showed zero ornegative FRET changes. Settings for the FRETcalc v3.0 plug-in(bleach threshold = 0–100%; donor and acceptor thresholds = 1pixel and FRET threshold = −100–100%). Output includedanalysis of all pixels and spatial FRET maps, which were pseu-docolored on an 8-bit scale, where 0 corresponds to 0% FRET,128–50% FRET, and 255–100% FRET.The FRET efficiency, E, is inversely proportional to the sixth
power of the donor-acceptor distance, R:
E ¼ R60=ðR6
0 þ R6Þ; [1]
where R0 is the Forster distance (54 Å for the Cerulean/Venuspair) (7).For acceptor bleach FRET experiments, FRET efficiencies
were calculated using Eq. 2:
E ¼ ðFCerPost −FCerPreÞ=FCerPost [2]
Time-lapse ratiometric FRET and analysis.To resolve faster kinetics fortime-lapse ratiometric FRET measurements, continuous fastscans (100–250 ms) of smaller ROIs were used to monitor FRETchanges. The mean fluorescence intensity was measured for eachfluorophore, and the FRET efficiency was expressed as theemission ratio of Venus:Cerulean. Ratiometric spectral FRETexperiments were performed in HibernateA low-fluorescencemedia with freshly added SCAVEGR (BrainBits LLC) to mini-mize photobleaching. The Ca2+ chelator EGTA (final concen-tration 20 mM; Sigma) or 1,2-bis(o-aminophenoxy)ethane-N,N,N′,N′-tetraacetic acid (BAPTA; final concentration 20 mM; In-vitrogen) was manually added as a small volume of concentratedstock solution after 15 s of baseline imaging. For all experiments,the entire aliquot of EGTA or BAPTA was added within 1–2 sclose to the cells of interest. Cerulean fluorescence exhibiteda rapid photobleaching component upon acquisition of the firstfew images. Therefore, for normalization purposes, the baselinewas averaged 10 s before the addition of EGTA.
β-Catenin Live-Cell Imaging Experiments. Live-cell imaging. Forβ-catenin–GFP experiments, images were acquired using aLSM510 Meta confocal laser scanning microscope with a 40× 1.3N.A. oil immersion plan apochromat objective lens (Carl ZeissMicroImaging, Inc.) and 488-nm argon ion laser excitation. Thesame EGTA treatment was applied to two neighboring cells withsimilar levels of modest expression after 30 s of baseline (1 s perframe) with some signal fluctuation observed due to z-axis drift.Only images with minimal drift in focus were analyzed. For
Kim et al. www.pnas.org/cgi/content/short/1019003108 2 of 8
normalization, the baseline was averaged 10 s before the addi-tion of EGTA.
Reagents. Antibodies. Anti-GFP, β-catenin, N-cadherin, and controlrabbit IgG antibodies were purchased from Invitrogen, Zymed, BDTransduction Lab, and Jackson ImmunoResearch, respectively.Chemicals and other reagents. All chemicals were purchased fromMallinckrodt Chemicals with the exception of Hepes and BAPTA
(Invitrogen); trypsin (Worthington); soybean trypsin inhibitorand DNase I (Sigma); formaldehyde (Polysciences Inc.); andIsoton II (Beckman Coulter).
Image Analysis and Processing. Analysis. All postacquisition pro-cessing and analyses were carried out with the combination ofZeiss AIM or ZEN software and ImageJ. Statistics were carriedout using Excel (Microsoft) or Origin (OriginLab).
1. ShanWS, et al. (2000) Functional cis-heterodimers of N- and R-cadherins. J Cell Biol 148:579–590.
2. Sheridan DL, et al. (2002) A new way to rapidly create functional, fluorescent fusionproteins: Random insertion of GFP with an in vitro transposition reaction. BMCNeurosci 3:7.
3. Murase S, Mosser E, Schuman EM (2002) Depolarization drives beta-Catenin into neuronalspines promoting changes in synaptic structure and function. Neuron 35:91–105.
4. Tai CY, Mysore SP, Chiu C, Schuman EM (2007) Activity-regulated N-cadherinendocytosis. Neuron 54:771–785.
5. Takeichi M, Nakagawa S (2001) Cadherin-dependent cell–cell adhesion. Curr ProtocCell Biol, 10.1002/0471143030.cb0903s00.
6. Rizzo MA, Springer G, Segawa K, Zipfel WR, Piston DW (2006) Optimization of pairingsand detection conditions for measurement of FRET between cyan and yellowfluorescent proteins. Microsc Microanal 12:238–254.
7. Forster T (1948) Intermolecular energy migration and fluorescence. Ann Phys, 437:55–75(Translated from German).
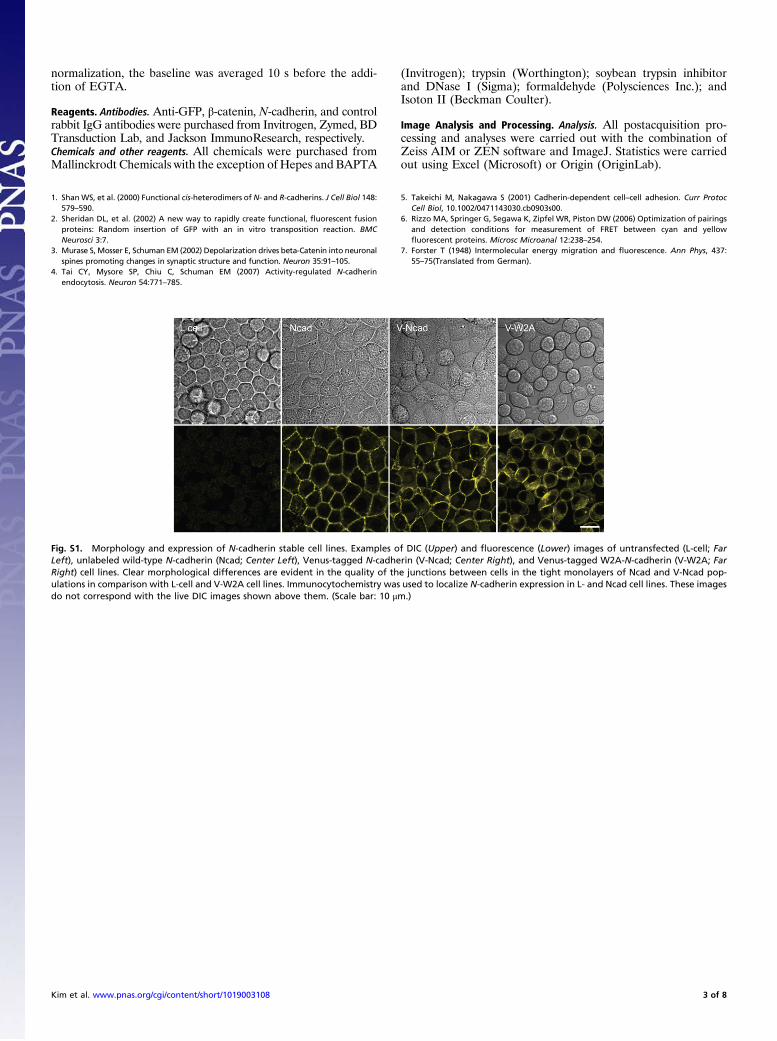
Fig. S1. Morphology and expression of N-cadherin stable cell lines. Examples of DIC (Upper) and fluorescence (Lower) images of untransfected (L-cell; FarLeft), unlabeled wild-type N-cadherin (Ncad; Center Left), Venus-tagged N-cadherin (V-Ncad; Center Right), and Venus-tagged W2A-N-cadherin (V-W2A; FarRight) cell lines. Clear morphological differences are evident in the quality of the junctions between cells in the tight monolayers of Ncad and V-Ncad pop-ulations in comparison with L-cell and V-W2A cell lines. Immunocytochemistry was used to localize N-cadherin expression in L- and Ncad cell lines. These imagesdo not correspond with the live DIC images shown above them. (Scale bar: 10 μm.)
Kim et al. www.pnas.org/cgi/content/short/1019003108 3 of 8

Fig. S3. Ca2+-dependent aggregation of N-cadherin stable lines. Average normalized cumulative distributions (solid lines) of percent volume with two SD(dotted lines) of (A) L-, (B) Ncad, (C) V-W2A, and (D) V-Ncad cell lines measured at varying Ca2+ concentrations after 60 min. Dashed horizontal lines (black)indicate the median values, and the gray shaded region indicates mean volume for a single cell ± SEM. Both Ncad and V-Ncad populations showed increasingaggregation with higher Ca2+ concentration. In contrast, the untransfected L-cell line showed no aggregation and the V-W2A stable line showed some ag-gregation at higher Ca2+ concentrations.
Fig. S2. Relative quantification of N-cadherin in stable cell lines. (A) Whole-cell lysates from untransfected (L-cell), unlabeled wild-type N-cadherin (Ncad),Venus-tagged N-cadherin (V-Ncad), and Venus-tagged W2A-N-cadherin (V-W2A) cell lines were resolved by SDS/PAGE and immunoblotted using antibodiesagainst N-cadherin and GFP, which also recognizes Venus. The V-W2A cell line showed a band of Venus protein uncoupled from N-cadherin. When probing forGFP, the band at ∼60 kDa is nonspecific and appears in all cell lines. (B) A double band of tagged N-cadherin (∼150 kDa) was resolved for both V-Ncad andV-W2A cell lines using both antibodies, in which the upper band corresponds to the immature form of the N-cadherin fusion protein (including the leaderpeptide and propeptide sequences), and the lower band corresponds to the mature full-length N-cadherin plus Venus (27 kDa). (C) For determining relativeprotein levels, GAPDH was used as a loading control (A Lower), and relative quantification of the mature full-length N-cadherin (B) was accomplished usingdensitometry. Similar quantification was found for V-Ncad and V-W2A probing for GFP.
Kim et al. www.pnas.org/cgi/content/short/1019003108 4 of 8

Fig. S4. β- Catenin interacts with the N-cadherin fusion proteins. COS-7 cells were transiently transfected with GFP, V-Ncad, or C-Ncad, and whole-cell lysateswere harvested. Each fusion protein (GFP, V-Ncad, or C-Ncad) was immunoprecipitated using an anti-GFP antibody. The supernatant before the immuno-precipitation (Sup), the pull-down of the IgG beads alone (IgG), and the IgG beads with anti-GFP antibody (anti-GFP) were resolved by SDS/PAGE (5–15%)followed by immunoblotting using anti–β-catenin and anti–N-cadherin antibodies. After immunoprecipitation with an anti-GFP antibody, bound β-catenin wasdetected for V-Ncad and C-Ncad by immunoblotting with an anti–β-catenin antibody. No bands were seen with the IgG beads alone. A lower band was seen forN-cadherin because COS-7 cells possess endogenous N-cadherin (*).
Fig. S5. Venus/W2A/N-cadherin stable cell line in a Ca2+-dependent aggregation assay. (A) After 60 min, V-W2A shows slight aggregation in the presence ofCa2+ (2 mM). (B) The Ca2+ titration curve for V-W2A has been added to the bar graph for the other cell lines (Fig. 1E) for comparison. V-W2A shows modestaggregation at higher Ca2+ concentrations compared with untransfected L-cells.
Kim et al. www.pnas.org/cgi/content/short/1019003108 5 of 8

Fig. S6. Examples of changes in FP-Ncad interactions upon Ca2+ chelation. (A) Images of COS-7 cells expressing FP-Ncad FRET constructs. ROIs (red box) at two-color junctions were selected and imaged every 100–250 ms. (B) Quantitation of C-Ncad (cyan) and V-Ncad (yellow) fluorescence intensity changes with Ca2+
chelation. Baseline was defined as the average between 10 and 15 s, and all values were normalized to the baseline. Specific changes are seen as the twofluorescence intensities of the reporter anticorrelated upon the addition of EGTA (20 mM final; same condition for all rows) at 15 s. (C) Ca2+-dependent FRETchanges over time. Emission ratiometric spectral FRET (V-Ncad/C-Ncad; red) reflected loss of interactions due to the removal of Ca2+. (Scale bar: 10 μm.)
Kim et al. www.pnas.org/cgi/content/short/1019003108 6 of 8

Fig. S7. Control measurements for FRET experiments. (A) For single-color junctions, COS-7 cells were transfected with either V-Ncad (Upper) or C-Ncad(Lower). ROIs (red box) at single-color junctions were selected and imaged approximately every 100 ms. (B) Normalized traces of C-Ncad and V-Ncad averagefluorescence intensity showed no change in either case upon Ca2+ chelation (20 mM EGTA added at 15 s as marked by the red dotted line). (Scale bar: 10 μm.)
Kim et al. www.pnas.org/cgi/content/short/1019003108 7 of 8

Fig. S8. Examples of changes in FP-W2A interactions upon Ca2+ chelation. (A) Images of COS-7 cells expressing the W2A variant of the N-cadherin FRETreporter. ROIs (red box) of two-color junctions were selected and imaged every 100–250 ms. (B) Quantitation of C-W2A (cyan) and V-W2A (yellow) fluorescenceintensity changes with Ca2+ chelation. Baseline was defined as the average between 10 and 15 s, and all values were normalized to the baseline. Specificchanges were seen as the two fluoresence intensities of the reporter anticorrelated upon the addition of EGTA (20 mM final; same condition for all rows) at15 s. (C) Ca2+-dependent FRET changes over time. Emission ratiometric spectral FRET (V-W2A/C-W2A; red) reflected loss of interactions due to the removal ofCa2+. (Scale bar: 10 μm.)
Kim et al. www.pnas.org/cgi/content/short/1019003108 8 of 8