california agricultural resource directory 2006 · 2015. 9. 27. · california agricultural...
TRANSCRIPT

California Department of Food and Agriculture
CowboysCowboysCowboysWest
CowboysCowboysWest
CowboysWest
CowboysOF THE
Protectors of Animal Agriculture
Guardians of the New WestWhere the Old West Meets High Tech
California Agricultural Resource Directory 2006California Agricultural
Resource Directory 2006California Agricultural
Verify ”Verify ”Keeping Our Milk
Safe and Nutritious
Verify ”“ Trust
Verify ”Verify ”BUT
BadPrevent, Detect and Respond
BadGoodGood
THE
Prevent, Detect Bird Flu
BadBadTHE
Bird FluBird FluAND THE


California Agricultural Resource Directory 2006
Letter by Governor Arnold Schwarzenegger
Foreword by A.G. Kawamura, Secretary
Published by California Department of Food and Agriculture
Cowboys of the West Protectors of Animal Agriculture
The Good, the Bad, and the Bird Flu: Prevent, Detect and Respond
“Trust, but Verify.” Keeping Our Milk Safe and Nutritious
Guardians of the New West Where the Old West Meets High Tech

GovernorArnold Schwarzenegger
California Department of Food and AgricultureA.G. Kawamura, SecretaryVacant, UndersecretaryValerie Brown, Deputy SecretaryNancy Lungren, Deputy SecretaryKim Myrman, Deputy SecretaryDavid Pegos, Assistant SecretaryEric Stein, Deputy SecretaryDr. Richard Breitmeyer, State VeterinarianJohn Dyer, General CounselRobert Tse, Director, Trade PolicyBob Wynn, Statewide Coordinator, Pierce's Disease Control Program
John Connell, Director, Plant Health and Pest Prevention ServicesNate Dechoretz, Director, Inspection ServicesGeorge Deese, Director, Administrative ServicesDavood Ghods, Chief Information Offi cer, Planning and Information TechnologyDennis Johannes, Director, Measurement StandardsKelly Krug, Director, Marketing ServicesHelen Lopez, Executive Director, California State Board of Food and AcrucultureSteve Lyle, Director, Public AffairsSteve Shaffer, Director, Agricultural and Environmental StewardshipMike Treacy, Director, Fairs and ExpositionsDr. Annette Whiteford, Director, Animal Health and Food Safety ServicesEd Williams, County/State Liaison
National Agricultural Statistics ServiceCalifornia Field Offi ceVic Tolomeo, DirectorJack Rutz, Deputy DirectorSarah Hoffman, Deputy Director
Agricultural Export StatisticsUC Davis, Agricultural Issues CenterUSDA, Federal-State Market Improvement Program
EditorApril Geary Izumi
Contributors and ResearchersKaren Dapper, Josh Eddy, Doug Flohr, Candace Gates, Jonnalee Henderson, Jeff Hillard, Alicia Lin, Bob Losa, Steve Lyle, Vince Maysee, Jack Rutz, Holly Taylor, Rosemary Tremblay, Jennifer Van Court, Cordia Weems, Susan Young
Production AssistanceJulia BlantonSakawrat KitkuakulErika WhiteZachary Young
Printed with PermissionPage 8: Levi Rosser, Flying U Rodeo Co.Page 10: Dr. Annette Whiteford at Mulas Dairy Co.Page 13: Dr. Dennis Wilson, Program Manager, CDFAPage 15: Randy Strain, Brand Inspector, CDFA
DesignVisual CommunicationHareLine Graphics
PrintingGraphic FocusAmerican Lithographers
PhotographyHenry Khoo, A.P.A.
Photo AcknowledgmentsEd Williams
California Agricultural Resource Directory 2006California Department of Food and AgricultureOffi ce of Public Affairs1220 N StreetSacramento, CA 95814Phone (916) 654-0462; Fax (916) 657-4240All rights reserved. Printed in the U.S.A. 2007.
phot
o by
Pat
Grif
fi n/S
iskiyo
u Co
.

Dear Friends,
California’s agricultural history is a story of our residents’ characteristic hard work and optimism. In 1773, there were only 204 head of cattle in the state, most of them on mission land. Determined efforts in those early years produced growth and success, and by 1800, the cattle count rose to 187,000. This great increase was not an anomaly; it foreshadowed our state’s tremendous agricultural future. Today, California’s modern cattle farms and ranches are teeming with up to 6 million head. In all, California agriculture produces 400 crops and $32 billion in direct farm sales, which constitutes a signifi cant part of our state’s dynamic economy. I am proud that the spirit of ingenuity that helped to shape the foundations of California agriculture continues to guide our state’s farmers and ranchers today. However, with success, come challenges. California agriculture is threatened by old foes such as severe weather and by new ones such as bovine spongiform encephalopathy, avian infl uenza and other diseases and pests. Through the California Department of Food and Agriculture, we are working to protect our vast plant and animal industries from these threats. Our state’s army of inspectors, scientists and health and safety offi cials are battling everything from criminals to microbes to ensure the safety of our food supply. This year’s California Agricultural Resource Directory describes our protection and safety efforts in many areas — from using DNA technology to stop cattle rustlers to utilizing the latest advancements in dairy inspection and virus tracking. My administration is committed to building on the successful legacy of California’s agricultural pioneers by improving the safety of our farm
and ranch products, expanding our markets and encouraging balanced environmental stewardship. With your help, we will be successful in these endeavors and lead our state’s agricultural industry into a bright and prosperous future. I encourage you to use this resource directory to learn more about our state’s agricultural industries and the people and organizations that are crucial to their success.
Sincerely,
Arnold Schwarzenegger
A LETTER FROM GOVERNOR ARNOLD SCHWARZENEGGER

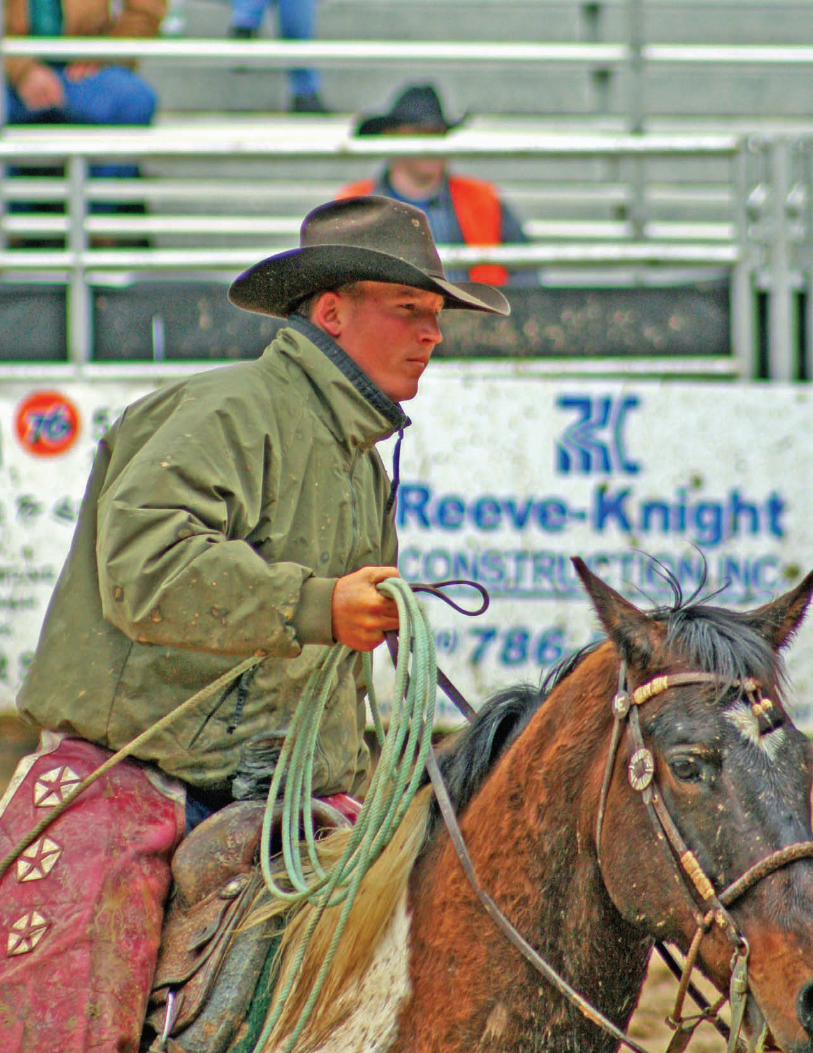
In this year’s California Agricultural Resource Directory, we celebrate the spirit of the American Old West and the farming and ranching pioneers who worked this land. Today, as fourth- and fi fth-generation farming families forge ahead with new concepts and innovations, they are implementing their own unique vision that will ensure a vibrant agricultural economy for our state. California now produces more than 400 commodities — and behind every commodity is a face and a story. For instance, who can think of cattle without thinking of the fi ercely independent cowboy? This caretaker of our working landscapes has embodied the entrepreneurial spirit and devotion to a kind of husbandry we rarely see anymore. The cowboy of yore was the only thing standing between his herd or fl ock and a host of predators, both human and animal. Over the years and down to the present day, the number of predators that endanger our state’s agricultural commodities has grown to include viruses and insects, in addition to old-fashioned cattle rustlers.
Today’s modern cowboys use old world experience and new world technology to get the job done. Scientists, technicians and fi eld inspectors, many of whom are employed by the California Department of Food and Agriculture, assist them in their fi ght against would-be predators. To highlight the importance of animal health and food safety, we have devoted this publication to a closer look at our Animal Health and Food Safety Services Division. Established in 1899 as the Offi ce of the State Veterinarian to protect animals from contagious and infectious diseases, the division now protects California’s livestock and foods of animal origin from a wide range of threats. This directory also contains the most recent information and data on the performance and output of agriculture in California. As the statistics and fi gures demonstrate, California’s farmers and ranchers are real visionaries who have succeeded in developing new and better ways to produce food and fi ber of the highest quality and with the greatest care for the environment. As you use this resource directory to learn more about the impressive performance of California agriculture, I hope you’ll also make time to discover more about the men and women who both provide and protect your food, fi ber, fuel and shelter. These are the people of California agriculture, and we are proud that our future is in their hands.
A.G. KawamuraA.G. KawamuraSECRETARY
FOREWORD

TABLE OF CONTENTS
A Reason for Thanks ................................................................................................................... 7
Cowboys of the West ...................................................................................................................Cowboys of the West ...................................................................................................................Cowboys of the West 9
The Good, the Bad, and the Bird Flu .................................................................................. 13
“Trust, but Verify.” ..................................................................................................................... 14
Guardians of the New West ....................................................................................................Guardians of the New West ....................................................................................................Guardians of the New West 15
Agricultural Statistical Review ...............................................................................................Agricultural Statistical Review ...............................................................................................Agricultural Statistical Review 17Overview ......................................................................................................................................Overview ......................................................................................................................................Overview 17California Farm Facts .................................................................................................................. 19California’s Top Commodities .................................................................................................... 19Leading Counties ........................................................................................................................ 19Weather Highlights for 2005 ...................................................................................................... 20Global Marketplace ..................................................................................................................... 22
County Statistical Data .............................................................................................................County Statistical Data .............................................................................................................County Statistical Data 32Notes to the County Data ........................................................................................................... 32California Timber Industry .........................................................................................................California Timber Industry .........................................................................................................California Timber Industry 33County Agricultural Commissioners’ Reports ........................................................................... 33
Field Crops .................................................................................................................................... 40
Floriculture ................................................................................................................................... 61
Fruit and Nut Crops .................................................................................................................. 66
Grape Crush .................................................................................................................................Grape Crush .................................................................................................................................Grape Crush 88Summary of Grape Tonnages and Prices ................................................................................... 88Leading Grape Varieties and Districts ....................................................................................... 89
Livestock and Dairy ....................................................................................................................Livestock and Dairy ....................................................................................................................Livestock and Dairy 93
Vegetable and Melon Crops ..................................................................................................114
California Agricultural Exports ............................................................................................124Methodology ..............................................................................................................................Methodology ..............................................................................................................................Methodology 125
California Agricultural Directory ........................................................................................California Agricultural Directory ........................................................................................California Agricultural Directory 134California Department of Food and Agriculture .....................................................................135Agricultural Publications ...........................................................................................................139California Advisory Boards and Commissions .........................................................................141California Agricultural Organizations ......................................................................................143California Fair Network ............................................................................................................California Fair Network ............................................................................................................California Fair Network 150Certifi ed Farmers’ Market Associations ...................................................................................152County Agricultural Commissioners ........................................................................................154County Sealers of Weights & Measures ...................................................................................156County Farm Bureaus ...............................................................................................................156Farm Labor Organizations .......................................................................................................158National Agricultural Organizations ........................................................................................159Selected Government Agencies ................................................................................................163State Departments of Food and Agriculture ............................................................................165University Agricultural Programs .............................................................................................167Water and Natural Resources ...................................................................................................171
California Department of Food and AgricultureExecutive Team .........................................................................................................................Executive Team .........................................................................................................................Executive Team 172
USDA-NASS, California Field Offi ce Request FormUSDA-NASS, California Field Offi ce Request Form ..................................................USDA-NASS, California Field Offi ce Request Form ..................................................USDA-NASS, California Field Offi ce Request Form 175

California’s Gross Cash Receipts, 2005 ..................................................................... 17
Milk Cash Receipts, 1996–2005 ................................................................................. 17
Almond Cash Receipts, 1996–2005 ........................................................................... 17
Grape Cash Receipts, 1996–2005 .............................................................................. 18
California’s Top 20 Commodities, 2003–2005 .......................................................... 18
California’s Top 10 Agricultural Counties, 2004-2005 ............................................. 19
Top 5 Agricultural States in Cash Receipts, 2005 ..................................................... 20
Crop and Livestock Commodities in which California Leads the Nation .............. 20
California’s Top 20 Agricultural Exports, 2004–2005 ............................................... 22
California’s Top 10 Agricultural Export Markets, 2005 ............................................ 22
Cash Income by Commodity Groups, 2003–2005 ................................................... 23
Farm Income Indicators, 2001–2005 ......................................................................... 24
Commodity Rank, Acreage, Production,
Value and Leading Producing Counties, 2005 ..................................................... 25
Commodity Rank, Value and Leading Producing Counties, 2005 .......................... 28
California’s Farm Numbers and Size, 1950-2005 ..................................................... 28
Unit Conversion Factors ............................................................................................ 28
County Rank, Total Value of Production and
Leading Commodities, 2004–2005 ....................................................................... 29
Seasonal Rainfall with Comparisons to Normal, 2005 – 2006 .................................. 30
California’s Fruit and Vegetable Crop Seasons ......................................................... 31
Notable Changes in County Ranks and Percentages of the State Total, 2005 ........ 32
Leading Timber Counties, 2005 ................................................................................ 33
County Rank by Gross Value of Agricultural Production, 2004 – 2005 ................... 34
Leading Commodities for Gross Value of Agricultural
Production by County, 2005 ................................................................................. 35
Commodity Rank and Leading Counties by
Gross Value of Agricultural Production, 2005 ..................................................... 39
Field Crop Acreage, Production and Value, 1996–2005 .......................................... 42
Field Crop Monthly Average Prices Received, 1996–2005 ...................................... 48
Barley Acreage, Yield and Production by County, 2004 – 2005 ................................ 50
Dry Edible Bean Acreage,
Yield and Production by County, 2004 – 2005 ...................................................... 51
Corn for Grain Acreage,
Yield and Production by County, 2004 – 2005 ...................................................... 52
Corn for Silage Acreage,
Yield and Production by County, 2004 – 2005 ...................................................... 53
American Pima Cotton Acreage,
Yield and Production by County, 2004 – 2005 ...................................................... 54
Upland Cotton Acreage,
Yield and Production by County, 2004 – 2005 ...................................................... 55
Oat Acreage, Yield and Production by County, 2004 – 2005 .................................... 56
Rice Acreage, Yield and Production by County, 2004 – 2005 ................................... 57
Sorghum Acreage, Yield and Production by County, 2004 – 2005 ........................... 58
Sugar Beet Acreage, Yield and Production by County, 2004 – 2005 ........................ 59
All Wheat Acreage, Yield and Production by County, 2004 – 2005 ......................... 60
Floriculture Production and Value, 2004 .................................................................. 62
Floriculture Production and Value, 2005 .................................................................. 64
Berry Acreage, Production and Value, 1996 – 2005 .................................................. 68
Strawberry Monthly and Season Average Prices
for Fresh Market Sales, 1996–2005 ...................................................................... 68
Citrus Acreage, Production and Value, 1996 – 2005 ................................................. 69
Citrus Sales by Utilization and Value Per Carton, 1996 – 2005 ............................... 70
Citrus Monthly and Season Average Prices, 1996 – 2005 ......................................... 71
Drying Ratio – Tons of Green Fruit Required to Produce One Dried Ton ........... 73
Non-Citrus Fruit Acreage, Production and Value, 1996–2005 ................................ 74
Non-Citrus Fruit Utilized Production
and Average Grower Return, 1996–2005 ............................................................. 78
Non-Citrus Fruit Unutilized Production, 1996 – 2005 ............................................ 84
Nut Acreage, Production and Value, 1996 – 2005 ..................................................... 86
Raisin Production and Average Grower Return, 1996 – 2005 .................................. 87
Grape Crush Tonnage and Price, 1988–2005 ........................................................... 89
Grape Crush Totals by Type and Variety, 2004 – 2005 ............................................. 90
Grape Variety Synonyms ............................................................................................ 92
Bee Colonies, Honey Production and Value, 1996 – 2005 ........................................ 95
Livestock, Dairy, Poultry and Apiary Cash Income, 2004–2005 ............................. 95
Milk Cows and Production by State, 2005 ............................................................... 96
Milk Cows, Dairies and Cows Per Dairy
by County and Region, 2004 – 2005 ...................................................................... 97
Commercial Milk Production by County and Month, 2005 .................................... 98
Beef Cow Operations and Inventory, Percentage by Size Groups, 1996 – 2005 ... 100
Cattle Operations and Inventory, Percentage by Size Groups, 1996 – 2005 ......... 100
Cattle and Calves Average Prices Received, 1996 – 2005 ........................................ 101
Cattle and Calves Marketed from Feedlots, 1996 – 2005 ........................................ 101
Cattle and Calves Slaughtered Under
Federal and State Inspections, 1996–2005 ......................................................... 102
Average Live Weights of Cattle and Calves
Slaughtered Under Federal and State Inspections, 1996–2005 ........................ 102
Cattle by Class as of January 1, 1997–2006 ............................................................. 103
Cattle Inventory, Supply and Disposition, 1996–2005 ........................................... 103
Manufactured Dairy Products, 2000–2005 ............................................................. 104
Milk Cow Average Prices Received, 1996-2005 ..................................................... 104
Milk Cows Calved, Milk Production and Value, 1996 – 2005 ................................ 105
Milk Cow Operations and Inventory by Size Groups, 1996 – 2005 ....................... 105
Grazing Fee Annual Average Rates, 1996 – 2005 .................................................... 106
Layers and Egg Production, 2004 – 2005 ................................................................ 106
Broiler Production and Value, 1996 – 2005 ............................................................. 106
Egg Production and Value, 1996 – 2005 .................................................................. 107
Turkey Production and Value, 1996 – 2005 ............................................................. 107
Hogs and Pigs by Class as of December 1, 1996–2005 .......................................... 107
Sows Farrowed and Pig Crop, 1996 – 2005 ............................................................. 108
Hogs and Pigs Inventory, Supply and Disposition, 1996 – 2005 ............................ 108
Hogs and Pigs Slaughtered Under Federal and State Inspections, 1996 – 2005 ... 108
Average Live Weights of Hogs and Pigs
Slaughtered Under Federal and State Inspections, 1996 – 2005 ........................ 109
Sheep and Lambs by Class as of January 1, 1997– 2006 ......................................... 109
Sheep and Lambs Shorn, Wool Production and Value, 1996 – 2005 ..................... 109
Sheep and Lambs Inventory, Supply and Disposition, 1996 – 2005 ....................... 110
Sheep and Lambs Average Prices Received, 1996 – 2005 ....................................... 110
Livestock Production and Income, 1996 – 2005 ...................................................... 111
Livestock Inventory by Class and County, January 1, 2005 – 2006 ....................... 112
Vegetable and Melon Acreage, Production and Value, 1996 – 2005 ...................... 115
Processing Vegetable Acreage, Production and Value, 1996–2005 ........................ 121
Processing Tomatoes by County, 2005 .................................................................... 121
Vegetable and Melon Monthly Average Prices Received, 1996 – 2005 .................. 122
Agricultural Commodity Export Values and Rankings, 2004 – 2005 ..................... 126
California Share of U.S. Agricultural Exports, 2004 – 2005 ................................... 127
Major California Agricultural Exports to the Top 15 Destinations, 2005 ............. 128
Major California Agricultural Exports to the European Union, 2005 .................. 130
Major Destinations for California Agricultural Exports, 2005 ............................... 131
Ratio of California Farm Quantity Exported
to Farm Quantity Produced, 2005 ...................................................................... 133
LIST OF TABLES

By John Greber
As I sit here on this cold, dark night,I watch the lightning strike wide and light up the sky.
I pulls my hat down low and my jacket collar up,as I hear the boys on the crew sigh.
I grumbles to myself about the storm that’s blowin’ overhead, waiting to cover the Earth with a downpour of rain.
I shuffl es to check the trap and get back to my bedroll,as fast as these ol’ frozen feet will go without much pain.
I know tomorrow will be a long, wet rideas we make our circle to check and move some cattle.
I’ll get some bacon and sourdough biscuits to start my morning for daybreak, then get right in the saddle.
But for now I peacefully lay back on my bedroll and relax, I hear the cattle bawl, and the coyotes call, as I stare up into the night.
We are blessed with horses to ride, and cattle to tend with pride.
So before I fall asleep I give thanks for this life, and remember all my cowboy friends who have passed over the great divide.
Our cowboy poet, John Greber, is a third-generation cowboy who works on his family’s cattle and hog ranch in Elk Grove, California. Mr. Greber is also a horseback riding instructor and horse trainer.
ThanksReasonReason
AFOR
8 California Agricultural Resource Directory 2006
Agricultural Statistical Review

California Agricultural Resource Directory 2006 9
To this day, the myths, legends and tall tales about the American cowboy stir the
imaginations of people around the world. The cowboy, that iconic fi gure of the Old West, still conjures up images of brave, hardworking and fi ercely independent characters on horseback, who by day herded cattle on the open range under a blistering sun and at night huddled around a warm campfi re under the stars. Originally known in California as buckaroos, cowboys of the Old West pursued a demanding, sometimes dangerous, occupation. It was a calling that required guts, stamina and a hard-won respect for livestock. Fearless wranglers, courageous cowhands and stalwart sheriffs inhabited this rugged terrain and helped protect and defend a country and a way of life against ever-present threats from man and nature. Though these old timers have long ago “gone to pasture,” many of the same threats to livestock and livelihood that they struggled against are still present today. Disease, natural disasters, cattle rustling and economic hardships still exact a toll on animal agriculture. On a daily basis, veterinarians with the California Department of Food and Agriculture’s Animal Health and Food Safety Services Division take up their regulatory reins to protect and defend the welfare of California’s livestock and poultry industry from all threats, foreign and domestic. As public servants, these professionals care as deeply about the values of the Old West as the cowboys who fi rst lived by them.
WestWestWestOF THEWestWestOF THE THE THEWest THEWest
Cowboys
These veterinarians, along with the division’s researchers, scientists and inspectors, work tirelessly to ensure the preservation and continuation of animal agriculture here in the West.
Call to Serve: Heroes of TodayThe Animal Health and Food Safety Services Division dates its origins back to the creation of the Offi ce of the State Veterinarian in 1899, established to protect the health of all domestic animals of the state from contagious and infectious diseases. Today the state veterinarian oversees the division and has authority to establish quarantines, recalls or other regulations necessary to protect California’s livestock and foods of animal origin. “Having grown up on a poultry ranch, and having been a practicing veterinarian before joining the department, I can relate to the challenges that business owners face,” said Dr. Richard Breitmeyer, California’s State Veterinarian. “I enjoy working with all segments of the livestock and poultry industries; they are progressive and want to understand the science behind the issues and what they need to do. In my experiences, the industry has always stepped up and done the right thing.” Protecting a state as diverse and vast as California is no easy task, but the division’s leadership, partnered with industry support and the eyes and ears of private veterinarians, has led the state safely through many threats to animal and human health, including anthrax, foot-and-mouth disease, West Nile virus, tuberculosis, bovine spongiform encephalopathy and exotic Newcastle disease.
Protectors of Animal AgricultureBY JONNALEE HENDERSON
phot
o by
Ed
Will
iam
s/Pl
acer
Co.

10 California Agricultural Resource Directory 2006
They also closely monitor more than two million animals imported into California each year and encourage stewardship of agricultural lands and the environment. “I’m proud that we consistently make decisions based on science, and we strive to maintain an understanding of the latest developments,” said Dr. Annette Whiteford, Director of the Animal Health and Food Safety Services Division. “We look at all of the livestock in the state as our herd, and we try to maximize the health of that population.”
A West without Borders: Today’s Challenges and OpportunitiesGlobalization has changed the world dramatically since the days of the Old West. People, products and food travel the world in unprecedented numbers and at historic speeds. Traveling with them are a myriad of disease-causing microorganisms. Avian infl uenza is a prime example of a disease threat. The Animal Health Branch has never seen a disease spread as far and as fast.
“There are benefi ts to becoming part of a global world, such as increased market opportunities, but if we don’t maintain our domestic food supply we will become more dependent on other sources, like we are with our energy supply,” said Dr. Whiteford. In addition to globalization, another challenge results from the fact that less than 2 percent of the American population live or work on farms. As California’s population becomes increasingly urbanized, communicating the threats of animal diseases becomes more of a challenge, especially since 60 percent of human diseases come from animals. Viruses that have gained recent widespread attention, such as avian infl uenza in poultry, have highlighted the urgent need to educate and alert the public regarding the human and environmental threats of animal disease.
Protecting Our PoultryExotic Newcastle DiseaseCalifornia’s vulnerability to new diseases was highlighted in
2003 when an outbreak of exotic Newcastle disease initiated the largest multi-agency animal-health-emergency response ever undertaken in the United States. Federal and state agencies spent more than $150 million in emergency funding to eradicate the highly contagious and deadly virus affecting poultry and other birds. During the outbreak, California’s quarantine zone covered 46,000 square miles. The response taskforce involved 6,200 onsite employees and resulted in more than 18,000 properties quarantined. A total of three million birds were destroyed. As a result of these efforts, the disease was controlled east of the Tehachapi Mountains and away from some of the state’s top poultry producing counties. The quick and effective control of exotic Newcastle disease would not have occurred without the cooperation of those affected: farmers, ranchers and communities. “Animal owners in California refl ect the cultural diversity found throughout the state, which means that we must be able to communicate in a language and manner that is understood by each individual in order to gain their trust and cooperation,” said Dr. Whiteford. The importance of reaching each impacted owner or community member on a personal level continues to be a key part of disease control strategy. Community support, science-based policy, industry cooperation and effective communication have allowed the Animal Health and Food Safety Services Division to quickly track and
phot
o by
Ed
Will
iam
s/So
nom
a Co
.

California Agricultural Resource Directory 2006 11
eradicate outbreaks of salmonella, tuberculosis and a myriad of other potentially devastating diseases and viruses. This experience has also prepared the division for present and future threats, such as avian infl uenza.
Avian Infl uenzaBy the end of 2006, a devastating strain of avian infl uenza, a disease of birds, had ravaged poultry production in Asia, the Middle East, parts of Europe and vast regions of Africa. To date, more than 200 million chickens and ducks have been destroyed as the disease moved into previously unexposed populations. While the ease at which this new virus moves between animals is alarming, experience indicates that, so far, the virus does not transmit easily from poultry to humans and that human cases of infection are rare. Should avian infl uenza reach California poultry, then a cooperative interagency effort — with the California Department of Food and Agriculture
acting as the lead agency — will act immediately to control the disease before it spreads throughout domestic poultry.
Protecting Our Dairy ProductsThe Animal Health and Food Safety Services Division not only protects our state’s livestock, but also food products made from livestock. Inspectors in the division’s Milk and Dairy Food Safety Branch, in cooperation with county-approved milk inspection services, routinely visit all 2,043 of the state’s dairies to ensure that milking parlors and milk rooms are operated and maintained according to sanitation requirements. They also inspect milk tanker trucks and every milk processing plant to ensure that pasteurizers meet strict standards, machinery is being properly cleaned and sanitized, and that everything is operating in a sanitary manner. The branch also responds to consumer complaints and works with the California Department of Health Services to investigate any
food-borne outbreak that might be connected to a dairy product. These rigorous dairy sanitation and food safety standards help to give California’s consumers full confi dence that every glass of milk they drink is safe and nutritious. “It’s professionally satisfying to work for a branch that has responsibility for the single largest agricultural commodity in California,” said Dr. Stephen Beam, Chief of the Milk and Dairy Food Safety Branch. “I really marvel at the level of commitment and technical expertise exercised each day by our staff as they work alongside industry to make sure that the state’s dairy products are as safe as they can be.”
Guardians of the New WestWhen horse and cattle theft and overall crime became an increasing problem, pioneers of the Old West turned to members of their own community to enforce order. Today, leaders in the Animal Health and Food Safety Services Division, in coordination with local sheriffs, respond immediately to any dangers that threaten California’s public and animal health. In many ways they are the guardians of the New West. For example, in 1971 when drug use in show horses became prominent, the horse industry requested drug testing at all shows, and the division’s Animal Health Branch immediately responded. The branch now tests more than 488,000 horses annually to ensure the integrity and sustainability of an industry that produces goods and services valued at $4.1 billion. The division’s Livestock Identifi cation Branch also protects the state’s livestock from theft
Cowboys of the West

Cowboys of the West
and loss. Because cattle have always been valuable, they have been stolen and sold as an easy way to make an illegal buck. The intent of the livestock identifi cation program and the animal branding identifi cation system is to quickly recover stolen or stray cattle and protect humans and animals from devastating diseases. Rather than relying solely on hot-iron brands as an identifi cation system, the cowboys of today also use laptops, bar coding technology, electronically transmitted brands and radio frequency identifi cation tagging to track animals effi ciently and quickly. Instead of fl ipping through bulky brand books, at the click of a mouse each animal brand is available not only by owner, but also by individual animal. Technology like this helped recover 1,338 lost or stolen cattle and calves last year, which were cumulatively valued at more than $1 million.
Career CowboysBright, motivated people are needed to carry the state’s livestock industry safely and strategically into the 21st century. State Veterinarian Dr. Richard Breitmeyer said it best: “With global animal disease, rapid movement of products and animals, and challenges with agroterrorism, there are many new and diverse opportunities for careers in animal health.” More than merely a career, animal health is a calling for anyone who enjoys ranching or farming and who wants to do something positive for the public good. “It’s one of the jobs you can do and know you are making a difference,” said Dr. Whiteford. “When I travel around California, I am always impressed with the abundance of food we can produce.” Just as the cowboys of old guarded this nation’s cattle, so too the Animal Health and Food Safety Services Division upholds the safety and integrity of the state’s livestock. Moreover, through foresight and planning, the division heads off the bad guys at the pass — whether viruses or thieves — before they adversely affect the public and environment.
A Diverse Mission to Serve Animal Health and Food Safety
Animal agriculture is a critical part of California’s and the nation’s food supply. No wonder then that both presidential directive and the state’s Food and Ag-ricultural Code seek to protect this key resource against the ravages of disease and food contamination. On the forefront of this battle is the Animal Health and Food Safety Services Division of the California Department of Food and Agriculture. It carries out this essential mission through its four branches and the California Animal Health and Food Safety Laboratory System.
Animal Health BranchThe Animal Health Branch is the state’s professional veterinary medical unit. It safeguards livestock populations, consumers and California’s economy from catastrophic animal diseases, other health-related or agricultural problems. The branch handles diseases that require statewide coordinated resources and are not controllable on an individual animal or herd basis. By implement-ing programs that protect California’s livestock industries and consumers, the branch helps to ensure the availability, affordability and wholesomeness of our food supply.
Milk and Dairy Food Safety BranchCalifornia’s dairy sector provides 21 percent of the nation’s milk supply and leads the nation in production with more than $5.2 billion in farm sales. Most of California’s milk production is used in the manufacture of dairy products, including cheese, butter, nonfat dry milk, ice cream and yogurt. Oversight by the state’s Milk and Dairy Food Safety Branch ensures state, national and international consumers that our milk, milk products and milk-like products are safe and wholesome, meet applicable microbiological and compositional requirements, and are properly labeled.
Bureau of Livestock Identifi cationThe state’s brand registration and inspection program protects cattle owners in California against loss of animals by theft or straying. The branch’s program consists of several components: registration of cattle, horse, burro and sheep brands; inspection of cattle for lawful possession prior to movement, sale or slaughter; and assistance to local law enforcement with investigations and prosecutions involving cattle theft. This program is entirely fi nanced through brand registration and inspection fees paid by cattle owners.
Meat and Poultry Inspection BranchThe Meat and Poultry Inspection Branch works to protect consumers in four primary areas. First, by assuring that livestock and poultry products (from produc-tion facilities not inspected by USDA) are wholesome, unadulterated and properly labeled. Second, by assuring that meat and poultry tissue not intended for hu-man consumption is kept out of human food channels. Third, by assuring that pet foods are processed from acceptable meat and poultry sources. And, fourth, by assuring that used kitchen grease is properly disposed or recycled.
California Animal Health and Food Safety Laboratory SystemThis system of fi ve laboratories throughout California provides quality diagnos-tic support to the state’s animal agriculture industries. It functions as a major part of California’s disease-warning system. Administered by the School of Veterinary Medicine at UC Davis, it was established as a partnership between the California Department of Food and Agriculture, UC Davis, California’s veterinarians and animal agriculture. Chief among the lab’s critical objectives is to protect public health with rapid and reliable diagnoses of animal diseases that affect humans.
Visit www.cdfa.ca.gov/ahfss to learn more about California’s animal agriculture and food safety programs.
12 California Agricultural Resource Directory 2006

A lot can be said about bird fl u — but one of the more informed and respected voices belongs to Dr. Dennis Wilson. Dr. Wilson melds both the interests of an academic researcher with the real-world outlook of the practitioner. This is evidenced by his Ph.D. in comparative pathology and his DVM. Dr. Wilson uses this expertise in veterinary epidemiology to make sure that commercial poultry and all of California’s animal agriculture are protected from disease. “The job is far from boring,” said Dr. Wilson who heads the department’s Emergency Preparedness and Support Unit. The key to the unit’s success is Dr. Wilson’s long-standing reputation for engaging critical collaborators with specifi c expertise to develop and implement solutions. “Prevent, detect and respond” is the mantra of Dr. Wilson’s team, working together with industry and government agencies at all levels to protect the animal legacy of the West. This is no easy task. From the introduction of foreign animal diseases to natural disasters and the possibilities of a terrorist attack on the food supply — it may seem like the plot of a Hollywood movie — but it is a reality for Dr. Wilson and his team of experts. To tackle these challenges, the program primarily works in the areas of emergency preparedness and detection.preparedness and detection.
Preparedness is a complex scientifi c process that involves developing precautions and procedures to prevent animal health disasters. The program supports efforts to educate companies, producers and consumers to reduce the opportunity for a disease or virus to spread. With preparedness comes the need for detection, which is implemented through animal surveillance on a regular basis throughout the state. “Surveillance allows us to detect the spark before it becomes a fi re,” said Dr. Wilson, “allowing quick response to the incident through our partnerships and being there to assist in recovery after the emergency is over.” In the case of bird fl u, Dr. Wilson has some concern, particularly over the confusion between bird fl u and pandemic fl u. The infl uenza virus has many fl u. The infl uenza virus has many
strains and some viruses tend to affect one group of species more than another. “There are strains of the infl uenza virus that primarily affect birds and these are generally referred to as avian infl uenza viruses or even bird fl u,” said Dr. Wilson, “and these viruses usually do not affect people.” However, while bird fl u and pandemic fl u are not the same thing, all infl uenza viruses have the capacity to change. There is concern that the avian infl uenza circulating in Asia could evolve into a strain that spreads from person to person, thereby starting a pandemic. “Because infl uenza viruses mutate easily and even share genes among strains, they can adapt and jump species,” said Dr. Wilson, “but this strain of avian virus has not made this adaptation.”
BIRD FLUBIRD FLU continued on page 16continued on page 16
The Good, the Bad, and the Bird Flu:Prevent, Detect and Respond
BY JOSH EDDY
California Agricultural Resource Directory 2006 13
PROFILE

During the climactic years of the Cold War, president and former California governor Ronald Reagan suggested that agreements with the Soviets should be guided by the Russian proverb: “Trust, but verify.” (“Doveryai, no proveryai”) This sensible principle for missile reduction applies equally well to other security issues, including milk safety. Indeed, the fi eld staff of the department’s Milk and Dairy Food Safety Branch operates by this motto. Since inspectors cannot be on-site at dairy production facilities 24/7, they work with plant owners and managers to promote conformance with state laws and regulations, to protect public health and assure consumers that only pure and wholesome dairy products are sold.
The oversight responsibilities of this branch are huge and wide-ranging. For example, each time a parent buys a child an ice cream cone on a hot summer’s day, that youngster’s health is partly dependent on sanitary conformance inspections performed by branch staff on more than 4,000 soft-serve ice cream facilities. Without this safety verifi cation of ice cream equipment, a sweet treat could become a not-so-sweet health risk. Beside ice cream facilities, branch staff inspects nearly 900 dairy farms, more than 1,200 bulk milk tankers and more than 500 milk processing plants. Branch specialists are responsible for the inspection and testing, every 90 days, of nearly 400 pasteurizer units statewide to ensure their proper operation and safety controls.
Growing Challenges with a Growing Industry The sheer size of California dairy production makes oversight particularly challenging. Over the past two decades dairy cow numbers have increased dramatically, making California the largest dairy state in the nation. California milk production is 21 percent of the nation’s total and cheese production has more than doubled over the past decade. Daily, California’s dairies produce about 12 million gallons of milk. More than 99 percent of this is processed in-state into various products, which are then sold around the world. As the only staff in state government with the necessary expertise to perform comprehensive inspections of production and processing technologies, Milk and Dairy Food Safety specialists are involved directly in the review of engineering and construction plans for dairy farms and milk plants. They examine computerized pasteurization control systems, milk evaporators, dryers, water supplies, plant-wide control networks, robotic systems and more.
Agency PartnershipsThe scale, scope and complexity of California’s dairy industry requires interagency efforts to maintain oversight. Branch professionals
“Trust, but Verify.” Keeping Our Milk Safe and Nutritious
BY JEFF HILLARD
TRUST continued on page 16continued on page 16
14 California Agricultural Resource Directory 2006
PROFILE

The Old West depicted by Hollywood is burnished in our collective consciousness. Rolling hills of and green and gold. Dusty towns of rickety wood. Brilliant sunsets. Hard-charging people. In the real west, some of those people owned cattle and — to prevent theft and otherwise help identify their animals — found it helpful to label them. Best way to do that was a brand. And more than a century later, even though technology has advanced to include DNA testing for animal ID, the old-school technique of branding is still widely used. “We see more animals branded than anything else,” said Greg Lawley, Branch Chief of the California Department of Food and Agriculture’s Bureau of Livestock Identifi cation, which is charged with registering and tracking brands in California. “Branding remains a popular and colorful method of identifi cation in our state.” Branding occurs much the same way it always has, with irons featuring custom designs. Ranch owners register their designs with the bureau, which compiles them in a brand book used by inspectors to place lost cattle, settle ownership disputes and solve thefts. Unfortunately, there is plenty of work to do on that front. Hundreds of head are stolen every year. There are 23,600 registered brands in California, brought forth by ranches famous and obscure. The oldest active
brand is registered to the Hearst Corporation and dates back to 1917 — the same year state government began tracking brands. Prior to that, the tracking was county-by-county. The statewide program gave investigators greater resources to hunt down rustlers. But branding isn’t fool proof. Not every livestock owner uses a brand. And, in cases of theft, it is not uncommon to see a second brand placed over the original. So modern brand inspectors need other methods to help prove ownership, and that’s where technological advances like DNA testing are important. Many people have become familiar with DNA testing from crime shows on television. Murder, assault and robbery cases that have been cold for years are now being solved and punishment is fi nally being meted out to wrongdoers. DNA technology wrongdoers. DNA technology
has not only revolutionized crime fi ghting in cases where the victims are humans, but has also given law enforcement agencies an effective weapon to battle ever-present and increasingly clever cattle rustlers. “DNA testing has helped us solve several signifi cant cases,” said CDFA senior brand investigator John Suther. “The fi rst time we used the technique, all it took was a single hair from the tail of a calf. We matched it with the DNA of the calf’s mother, and we solved the case. It is a great resource for us.” And since then, DNA technology has been useful in other complex cases. For example, in April 2006, Bureau of Livestock Identifi cation agents participated in a raid in Riverdale, in Fresno County, where suspects were raising Holstein calves from stolen cattle. Once again, hair
GUARDIANS continued on page 16continued on page 16
Guardians of the New West
Where the Old West Meets High Tech
BY STEVE LYLE
California Agricultural Resource Directory 2006 15
PROFILE

work with allied county, state and federal agencies to enhance the regulation of milk and dairy foods. Under a cooperative state and federal public health program, the branch administers regulatory actions required for Grade-A milk products shipped in interstate commerce. Under this program, staff conducts certifi cation ratings of dairy farms, milk processors and manufacturers of single-service dairy containers.
Investigations and Enforcement “Trust, but verify” carries an implied further action: enforcement. Once violations are verifi ed, enforcement of statutes and regulations must then be carried out. Although most of
the activities involve compliance, the branch uses law enforcement when consumer safety is compromised. Government exists to serve its citizens, and ensuring public safety is one of its primary services. Few things are more important and fundamental to public safety and well being than protecting the food supply. The Milk and Dairy Food Safety Branch seeks to ensure
that California's dairies and milk processors operate in compliance with consumer protection laws and regulations. This compliance is built on both trust and oversight verifi cation provided by branch inspectors in the fi eld. Because of the dedication, commitment and hard work of these safety soldiers, consumers can enjoy California dairy products knowing they are tasty, nutritious and safe.
Bird fl u continues to circulate in many places in the world, so its entry into the United States and California is possible. “Remember, the current strain has only been shown to infect
people under very specifi c conditions,” said Dr. Wilson. “If the virus arrives into California, between the way that commercial poultry are raised and the measures put in place to monitor for disease, eating poultry products will continue to be safe.” Through the dedication and professionalism of individuals like Dr. Wilson the future looks bright for California agriculture.
samples from the animals gave lab technicians at the Veterinary Genetics Laboratory at UC Davis what they needed to produce DNA data that led to the animals’ return to their rightful owners. So DNA testing is a place where the Old West meets high tech and, to date, it has been a productive partnership. While the ruddy and hale Californians of old might not completely understand that people in lab coats fi ght crime as effectively as the local marshal, they would certainly appreciate the results. And, in keeping pace with the latest technology, the Bureau of Livestock Identifi cation works to use all the tools available to track and protect California’s sizeable livestock herds.
TRUST continued from page 14
GUARDIANS continued from page 15BIRD FLU continued from page 13
16 California Agricultural Resource Directory 2006
PROFILE

California Agricultural Resource Directory 2006 17
California’s Gross Cash Receipts, 2005
Field Crops$3.09
Greenhouse, Nursery & Floriculture$3.44
Fruits & Nuts$10.47
Vegetables & Melons$6.25
Livestock & Poultry$8.45
OverviewCalifornia farm and ranch producers received a record high $31.71 billion in 2005, up fractionally from the revised 2004 revenue number of $31.68 billion. The 2004 revenue number was originally estimated at $31.8 billion; however, values for 2004 have been revised based on updated information received throughout 2005 for both commodity production and average prices. Although the 2005 tally remained virtually the same as 2004, major changes were apparent for individual commodities. Cash receipts for wine grapes rose 38 percent to $2.2 billion. This increase was realized on the heels of the largest grape crush in the state’s history
0
1
2
3
4
5
6
20051996 1997 1998 1999 2000 2001 2002 2003 2004
5.22
3.71 3.63
4.14 4.09
3.70
4.63
4.03
5.37
3.83
Milk Cash Receipts, 1996–2005
0
0.5
1
1.5
2
2.5
20051996 1997 1998 1999 2000 2001 2002 2003 2004
2.34
1.021.16
0.70 0.69 0.67 0.74
1.60
2.20
1.20
Almond Cash Receipts, 1996–2005
AgriculturalAgriculturalStatistical Review
phot
o by
Ed
Will
iam
s/M
onte
rey
Co.

18 California Agricultural Resource Directory 2006
Agricultural Statistical Review
along with prices that remained stable. Other large increases in cash receipts were shown for Pima cotton, up 237 percent; grapefruit, up 92 percent; and Valencia oranges, up 53 percent. Meanwhile, most vegetable crops showed smaller cash receipts. The value of egg marketings declined 37 percent to its lowest mark since 1962.
California’s agricultural sector remained No. 1 in the nation for 2005, with 13.3 percent of the U.S. value, up slightly from 13.2 percent of the national total the previous year. The state’s farm revenues were more than the combined totals of Texas and Iowa, at No. 2 and No. 3 respectively. California’s dairy sector, which leads the nation in production, showed a 3 percent decline in value, to $5.22 billion, because of lower prices paid to producers for milk. The Golden State has produced 20 percent to 21 percent of the U.S. milk supply since 2001. Most of California’s milk production is used in the manufacture of dairy products: cheese, butter, nonfat dry milk, ice cream and yogurt. California’s agricultural abundance includes 400 different commodities. Among these, the state produces about half of U.S.-grown fruits, nuts and vegetables. Many crops are solely produced in California.
0
0.5
1
1.5
2
2.5
3
3.5
1996 1997 1998 1999 2000 2001 2002 2003 2004 2005
3.17
2.19
2.88
2.43
2.692.83
2.67
2.33
2.762.56
Grape Cash Receipts, 1996–2005
California’s Top 20 Commodities, 2003–2005
Commodity Value and Rank
2003 2004 2005
Milk and Cream 4,027,837 (1) 5,365,992 (1) 5,223,062 (1)Grapes, All 2,324,650 (3) 2,764,534 (2) 3,165,715 (2)Nursery and Greenhouse Products 2,437,174 (2) 2,297,363 (3) 2,433,346 (3)Almonds 1,600,144 (5) 2,189,005 (4) 2,337,140 (4)Cattle and Calves 1,555,908 (6) 1,633,740 (6) 1,740,198 (5)Lettuce, All 2,250,067 (4) 1,748,826 (5) 1,687,733 (6)Hay, All 852,425 (10) 1,045,885 (9) 1,150,613 (7)Strawberries, All 1,172,537 (7) 1,205,513 (7) 1,110,174 (8)Floriculture 997,396 (8) 1,012,795 (10) 983,768 (9)Tomatoes, All 895,394 (9) 1,180,357 (8) 941,928 (10)Chickens, All 536,854 (13) 714,376 (12) 714,788 (11)Cotton, All 753,355 (11) 732,502 (11) 633,695 (12)Oranges, All 465,712 (14) 556,015 (14) 603,594 (13)Pistachios 145,180 (32) 464,980 (15) 577,320 (14)Walnuts 378,160 (17) 451,750 (16) 539,600 (15)Broccoli 575,224 (12) 587,117 (13) 513,758 (16)Carrots, All 427,465 (15) 451,359 (17) 455,207 (17)Rice 405,974 (16) 372,571 (19) 407,778 (18)Peaches, All 247,230 (23) 251,254 (23) 279,987 (19)Lemons 262,040 (20) 240,640 (25) 277,991 (20)

California Agricultural Resource Directory 2006 19
Agricultural Statistical Review
Notable Increases in Cash Receipts:Cotton, Pima ...........................................237%Garlic .........................................................36%Grapefruit ..................................................Grapefruit ..................................................Grapefruit 92%Grapes, Wine .............................................38%Honey ........................................................Honey ........................................................Honey 42%Nectarines ..................................................40%Olives .........................................................31%Oranges, Valencia ......................................53%Peaches, Freestone ....................................43%Pistachios ...................................................24%Plums .........................................................24%Potatoes, Sweet ..........................................Potatoes, Sweet ..........................................Potatoes, Sweet 29%
Notable Decreases in Cash Receipts:Artichokes ..................................................47%Eggs ...........................................................37%Honeydew ..................................................Honeydew ..................................................Honeydew 37%Saffl ower ....................................................42%Spinach, Fresh ...........................................43%Watermelon ...............................................42%
California Farm FactsCalifornians operated 76,500 farms and ranches in 2005; this is less than 4 percent of the national total. The average California operation had $414,000 in farm sales, compared with the U.S. average of $114,000 per farm. In 2005, California’s land devoted to farming and ranching totaled 26.2 million acres. The average farm size was 345 acres, compared with the U.S. average of 444 acres.
California’s Top CommoditiesCalifornia’s top 20 crop and livestock commodities accounted for 81 percent of the state’s cash farm receipts. Eight commodities exceeded $1 billion in value. Milk remained the No. 1 commodity in 2005, followed by grapes, and nursery and greenhouse products.
Leading CountiesCalifornia has some of the most agriculturally productive counties in the nation. According to the 2002 Census of Agriculture’s ranking of market value of agricultural products sold, nine of the nation’s top 10, and 12 of the top 20 producing counties are in California.
California’s Top 10 Agricultural Counties, 2004–2005
County Total Value and Rank Leading Commodities
2004 2005
Fresno 4,604,139 (1) 4,640,166 (1) Grapes, Almonds, Milk, Tomatoes, Cattle and CalvesTulare 4,037,351 (2) 4,360,854 (2) Milk, Oranges, Cattle and Calves, Grapes, Alfalfa Hay and SilageKern 3,213,846 (3) 3,546,925 (3) Almonds and By-products, Grapes, Milk, Citrus, PistachiosMonterey 3,090,000 (4) 3,273,000 (4) Lettuce, Strawberries, Wine Grapes, Spinach, BroccoliMerced 2,365,494 (5) 2,388,058 (5) Milk, Chickens, Almond Meats, Cattle and Calves, Sweet PotatoesStanislaus 1,978,434 (6) 1,977,596 (6) Milk, Almonds, Cattle and Calves, Chickens, WalnutsSan Joaquin 1,613,037 (7) 1,743,294 (7) Milk, Grapes, Almond Meats, Tomatoes, English WalnutsSan Diego 1,461,769 (8) 1,531,307 (8) Foliage Plants, Woody Ornamentals, Avocados, Bedding Plants, Cut FlowersKings 1,292,090 (10) 1,407,091 (9) Milk, Cotton, Cattle and Calves, Pistachios, AlfalfaImperial 1,187,254 (11) 1,286,066 (10) Cattle, Alfalfa, Leaf and Head Lettuce, Carrots, Livestock
phot
os b
y Ed
Will
iam
s/Hu
mbo
ldt C
o. a
nd N
apa
Co.

20 California Agricultural Resource Directory 2006
Agricultural Statistical Review
In 2005, Fresno, with $4.64 billion in agricultural value, remained the No. 1 county in the nation, followed by Tulare and Kern. Thirteen counties recorded more than $1 billion in agricultural value according to their county agricultural commissioner crop reports.
Weather Highlights for 2005January started with a strong upper level low-pressure system, which brought heavy rains to the North Coast and Southern California. Where weather conditions allowed, farmers applied herbicides and pesticides, pruned and shredded, and harvested their winter crops. Later in the month, upper-level high pressure displaced low pressure, bringing a warming trend. The strong high pressure resulted in record high temperatures in Southern
California. Fieldwork recovered from heavy rainfall in the previous weeks, but fog slowed harvest activities in many areas. Weather in February was unstable. Dry conditions with temperatures warming to above normal continued from the end of January. Ample soil moisture and moderate temperatures provided excellent growing conditions. Then winter storms, following a low pressure, dropped rainfall statewide. Despite the rain, spring harvest continued to progress well. March and April recorded considerable amounts of precipitation. Mild to moderate rain allowed fruit and nut crops to bloom well. After a week of warm and dry conditions due to a strong high-pressure ridge, most regions began to experience a more active precipitation pattern. In April, a weak high pressure brought a short period of warm and dry weather. A strong winter-like storm approached from Alaska, followed by numerous Pacifi c storms, which brought widespread rain and mountain snow in Northern California. Constant precipitation brought by storms provided an excellent condition for plants to bloom. Apricots and cherries were being thinned, and buds were swelling in many
Top 5 Agricultural States in Cash Receipts, 2005
State Rank Total Value
California 1 31.7Texas 2 16.4Iowa 3 14.6Nebraska 4 11.5Kansas 5 10.0
Crop and Livestock Commodities in which California Leads the Nation
Almonds Dates Lettuce, Leaf PistachiosApricots Eggplant Lettuce, Romaine PlumsArtichokes Escarole/Endive Melons, Cantaloupe Plums, DriedAsparagus Figs Melons, Honeydew PomegranatesAvocados Flowers, Bulbs Milk RaspberriesBeans, Dry Baby Lima Flowers, Cut Milk Goats Rice, SweetBeans, Dry Large Lima Flowers, Potted Plants Nectarines Saffl owerBeans, Green Lima Garlic Nursery, Bedding Plants Seed, AlfalfaBedding/Garden Plants Grapes, Raisins Nursery Crops Seed, Bermuda GrassBee Colonies Grapes, Table Olives Seed, Ladino CloverBoysenberries Grapes, Wine Onions, Dry Seed, Sudan GrassBroccoli Greens, Mustard Onions, Green Seed, Vegetable and FlowerBrussels Sprouts Hay, Alfalfa Parsley SpinachCabbage, Chinese Herbs Passion Fruit SquashCabbage, Fresh Market Honey Peaches, Clingstone StrawberriesCarrots Jojoba Peaches, Freestone Tomatoes, ProcessingCaulifl ower Kale Pears, Bartlett TurnipsCelery Kiwifruit Peas, Chinese Vegetables, GreenhouseChicory Kumquats Peppers, Bell Vegetables, OrientalCotton, Amercian Pima Lemons Persimmons WalnutsDaikon Lettuce, Head Pigeons and Squabs

California Agricultural Resource Directory 2006 21
Agricultural Statistical Review
orange and apple orchards. However, alfalfa cuttings were hampered and cotton planting was limited due to heavy rainfall. Planting activities resumed as fi elds dried out. High pressure developed across the state in early May and brought mostly sunny skies and warmer conditions. A Pacifi c storm moved across California and brought mild late season precipitation. As the low-pressure system weakened, a high-pressure ridge dominated the rest of the month with only a few sprinklings of rain. Warm, dry weather benefi ted fi eld crops and stimulated vegetable growth. Temperatures fl uctuated in June with infl uence from both high and low pressures. Unseasonably strong low pressure developed and replaced the earlier high pressure, brought cooler temperature and above normal June precipitation. As rangelands continued to dry, the amount of dry grass was the largest in many years and benefi ted many cattle producers. July began with cooler than normal temperatures due to residual effects from a previous low-pressure system. Temperatures slowly climbed up as heat waves swept into California. High-pressure centers were concentrated over the southwest desert and eastern Pacifi c. Short periods of increased humidity did not help lower the overall temperatures. Strong high pressure remained the dominant weather feature in August. A low-pressure system and several thunderstorms brought some relief from the heat waves. High pressure began to rebuild as the low weakened. Preparation for harvest continued in orchards and vineyards. Livestock were moved to irrigated pastures, and some needed supplemental feeding as
hot weather decreased rangeland qualities. Rice and cotton fi elds thrived in the summer heat, but some vegetable and fruit crops were damaged by sunburn. September was mainly dry. An upper level low-pressure trough pushed a dry cold front across Northern California, bringing an onshore fl ow to the state and gusty southwest winds to the higher elevations. Dry weather also led to red fl ag warnings in some areas. A series of low-pressure systems then brought small weather turbulence and some rainfall. October weather showed a typical fall pattern. Upper-level low pressure pushed into the West Coast and spread a few showers. Indian summer conditions dominated the Central Valley, with daytime high temperatures at 10 degrees above normal. Heavy rains in Imperial Valley halted cotton harvest and caused disruption to lambs on pastures. Temperatures started to warm up again as the storms exited. A series of Pacifi c cold fronts pushed through Northern California in the beginning of November, bringing the fi rst signifi cant mountain snow of the season. Rainfall concentrated in the Sacramento Valley, and mountain snow in northern Sierra was heavy enough to impact transportation. High-pressure ridges settled over the West Coast through the end of the month, bringing mostly warm and dry conditions to California. December began with clear and dry conditions with mostly sunny skies. Widespread fog formed
photo by Ed Williams/Placer Co.

22 California Agricultural Resource Directory 2006
Agricultural Statistical Review
across the Central Valley. A series of Pacifi c storms brought record amounts of rain to some Central Valley locations and heavy snow to central and northern Sierra Nevada. While stormy weather kept northern coasts damp, Southern California remained mostly dry and mild. The rains, however, signifi cantly boosted new grass growth on winter pastures. Dormant season activities were underway for most crops.
Global MarketplaceThe year 2005 set a new record for California’s agricultural exports, surpassing $9 billion for the fi rst time. This represents a 13 percent increase over 2004 and a 24 percent increase over 2003. California exports agricultural products to almost 150 countries, but the 10 principal destinations accounted for 72 percent of the 2005 export value. The leading four destinations — European Union, Canada, Japan and Mexico — accounted for 56 percent of total exports. For three years, the European Union has been the key destination for California agricultural exports, accounting for 22 percent of the 2005export value. Principal commodities shipped to the European Union are almonds, wine and pistachios.
California’s Top 20 Agricultural Exports, 2004–2005 1
Commodity Rank 2004 2005 Percent ChangeExport Value Export Value 2004/2005
Almonds 1 1,369,687 1,840,912 34Cotton 2 631,892 699,042 11Wine 3 683,788 575,306 -16Dairy and Products 4 439,916 563,362 28Table Grapes 5 453,862 539,941 19Oranges, Fresh and Juice 6 345,194 365,029 6Rice 7 280,305 319,796 14Walnuts 8 240,506 318,451 32Pistachios 9 178,965 299,496 67Tomatoes, Processed 10 250,263 263,010 5Lettuce 11 188,317 237,022 26Strawberries 12 204,018 233,363 14Raisins 13 195,099 209,130 7Peaches and Nectarines 14 123,284 127,021 3Hay 15 109,199 108,986 —Dried Plums 16 130,105 107,735 -17Broccoli 17 98,945 104,049 5Beef and Products 18 80,071 99,681 24Lemons 19 77,375 86,367 12Carrots 20 78,398 82,418 5
California’s Top 10 Agricultural Export Markets, 2005
Rank Country Export Value
Leading Exports
1 European Union 2,015 Almonds, Wine, Pistachios2 Canada 1,756 Lettuce, Strawberries, Table Grapes3 Japan 940 Rice, Almonds, Hay 4 Mexico 591 Dairy and Products, Table Grapes, Cotton 5 China/Hong Kong 569 Cotton; Table Grapes; Oranges, Fresh and Juice6 Korea 282 Oranges, Fresh and Juice; Almonds; Cotton7 Taiwan 228 Cotton, Peaches and Nectarines, Table Grapes8 India 175 Almonds, Cotton, Table Grapes9 Turkey 124 Cotton, Rice, Almonds
10 Indonesia 98 Cotton, Dairy and Products, Table Grapes
Even though the major market for California agricultural production is still the rest of the nation, foreign markets have become relatively more important in the past six years. In 1999, only 16 percent of local production was being shipped to overseas markets, whereas in 2005 this fi gure was 22 percent. Clearly, California agriculture is enjoyed around the world.

California Agricultural Resource Directory 2006 23
Agricultural Statistical Review
Cash Income by Commodity Groups, 2003–2005 1
FIELD CROPSAlfalfa Seed 11,442 18,673 24,900Barley 7,088 11,230 8,890Beans, Dry 57,331 46,182 45,201Corn for Grain 51,008 53,015 37,790Cotton Lint 825,211 477,780 763,231Cottonseed 88,853 86,614 73,109Grain, Sorghum 2,314 2,450 2,246Hay, All 543,952 608,808 702,599Oats 3,463 2,270 1,686Oil Crops 27,799 23,142 17,186Potatoes (Excl. Sweet) 233,188 229,686 197,998Potatoes, Sweet 80,892 80,500 103,545Rice 311,794 334,391 363,964Sugar Beets 77,381 75,611 75,611Wheat 108,396 147,405 96,707Other Seed Crops 138,372 146,113 144,734Other Field Crops 411,769 419,228 429,524TOTAL 2,980,253 2,763,098 3,088,921Percent of Gross Cash Income 10.0 8.0 9.1
FRUIT AND NUT CROPSAlmonds 1,600,144 2,189,005 2,337,140Apples 88,913 73,084 51,630Apricots 29,221 28,575 33,930Avocados 365,371 374,761 280,213Berries, Bushberries 146,050 209,007 223,882Berries, Strawberries 1,172,537 1,205,513 1,110,174Cherries 106,883 123,156 84,751Dates 27,881 23,086 21,337Figs 15,373 20,214 22,122Grapefruit 68,636 67,597 129,515Grapes 2,325,103 2,764,941 3,167,059Kiwifruit 20,472 19,977 23,326Lemons 218,171 271,456 319,416Nectarines 119,028 86,184 120,456Olives 48,262 60,630 79,520Oranges, Navel and Miscellaneous 289,608 418,254 362,834Oranges, Valencia 130,672 142,444 218,232Peaches, Clingstone 108,484 141,494 122,129Peaches, Freestone 138,746 109,760 157,048Pears 63,350 80,432 79,790Pecans 5,254 7,735 7,020Pistachios 145,180 464,980 577,320Plums 87,362 74,347 92,463Plums, Dried 131,680 121,042 80,775Tangerines 37,457 47,733 47,296Walnuts 378,160 451,750 539,600Other Fruits and Nuts 164,754 270,768 180,505TOTAL 8,032,752 9,847,924 10,469,484Percent of Gross Cash Income 26.9 28.4 31.0
CHRISTMAS TREESTOTAL 7,975 8,089 9,300Percent of Gross Cash Income – – –
NURSERY, GREENHOUSE AND FLORICULTURETOTAL 3,449,943 3,566,954 3,439,170Percent of Gross Cash Income 11.5 10.3 10.2
VEGETABLE CROPSArtichokes 75,701 72,023 37,884Asparagus 111,996 167,790 119,016Beans, Snap, Fresh 32,306 45,424 41,340Broccoli, All 575,224 587,117 513,758Cabbage 84,240 100,368 70,291Carrots, All 427,465 451,359 455,207Caulifl ower 192,210 166,009 154,377Celery 241,324 273,576 256,141Corn, Sweet 118,047 137,323 109,041Cucumbers, Fresh 26,640 45,060 29,684Garlic 146,038 129,658 176,325Lettuce 1,932,486 1,426,844 1,470,152Melons, Cantaloupe 184,877 182,160 132,600Melons, Honeydew 64,750 69,703 44,213Melons, Watermelon 67,954 70,119 40,768Mushrooms, Agaricus 176,987 172,500 172,040Onions 231,604 318,838 274,754Peppers, Chili 36,999 43,742 38,942Peppers, Green 185,097 238,979 167,999Pumpkins 15,190 21,481 14,355Spinach, All 178,584 198,039 114,772Squash 33,241 45,973 31,513Tomatoes, Fresh 366,180 510,384 369,768Tomatoes, Processing 529,214 669,973 572,160Other Vegetable Crops 874,024 795,165 838,901TOTAL 6,908,378 6,939,607 6,246,001Percent of Gross Cash Income 23.1 20.0 18.5
LIVESTOCK, POULTRY AND PRODUCTSAquaculture 12,412 12,612 13,385Cattle and Calves 1,555,908 1,633,740 1,740,198Chickens, All 537,029 714,602 714,788Eggs 282,458 287,392 181,655Hogs 27,605 39,855 35,796Honey 44,702 17,726 25,200Milk and Cream 4,027,837 5,365,992 5,223,062Sheep and Lambs 68,861 57,612 56,135Turkeys 150,718 169,937 174,911Wool and Mohair 2,765 2,822 2,531Other Livestock and Poultry 289,015 247,330 286,149TOTAL 6,999,311 8,549,620 8,453,806Percent of Gross Cash Income 23.4 24.7 25.0
TOTAL CASH INCOME FROM MARKETINGS2
TOTAL 28,378,609 31,675,294 31,706,683
FARM RELATED INCOME3
TOTAL 1,536,368 2,965,699 2,081,859Percent of Gross Cash Income 5.1 8.6 6.2
GROSS CASH INCOME FROM FARMINGTOTAL 29,914,980 34,640,992 33,788,542
Source of Income2003 2004 2005
Source of Income2003 2004 2005

24 California Agricultural Resource Directory 2006
Agricultural Statistical Review
Farm Income Indicators, 2001–2005 1
Item 2001 2002 2003 2004 2005
Value of Crop Production 18,950,442 20,473,123 21,109,199 23,612,725 22,932,081 Food grains 352,569 356,918 420,190 481,796 460,671 Feed crops 668,847 634,278 607,824 677,774 753,211 Cotton 676,782 598,175 914,064 564,394 836,340 Oil crops 28,315 18,906 27,799 23,142 17,186 Fruits and tree nuts 7,111,606 7,784,410 8,032,752 9,847,924 10,469,484 Vegetables 6,143,010 6,786,347 7,092,746 7,114,149 6,412,091 All other crops 3,924,446 4,175,363 4,283,924 4,416,494 4,303,892 Home consumption 12,403 9,549 6,843 5,566 6,008 Value of inventory adjustment 2 32,464 109,177 (276,943) 481,486 (326,802)
Value of Livestock Production 7,397,839 6,321,169 6,942,670 8,723,264 8,575,235 Meat animals 1,433,448 1,302,336 1,652,372 1,731,207 1,832,127 Dairy products 4,625,431 3,832,501 4,027,837 5,365,992 5,223,062 Poultry and eggs 1,035,870 870,483 1,025,816 1,234,156 1,127,941 Miscellaneous livestock 262,082 264,894 293,286 218,265 257,439 Home consumption 1,736 2,192 2,146 3,441 8,388 Value of inventory adjustment 2 39,272 48,763 (58,787) 170,203 126,278
Revenues from Services and Forestry 1,845,768 1,651,751 1,863,110 2,305,003 2,267,987 Machine hire and custom work 296,129 314,588 338,896 584,518 465,008 Forest products sold 7,801 8,163 7,851 7,438 7,200 Other farm income 673,978 442,620 505,809 597,054 626,405 Gross imputed rental value of farm dwellings 867,860 886,380 1,010,554 1,115,993 1,169,374
Value of Agricultural Sector Production 28,194,049 28,446,043 29,914,980 34,640,992 33,788,542
less: Purchased Inputs 15,304,067 14,643,314 13,949,565 15,028,376 15,944,345
Farm Origin 4,023,520 3,956,304 3,732,343 4,341,890 4,559,006 Feed purchased 2,527,528 2,562,445 2,240,001 2,779,997 2,799,999 Livestock and poultry purchased 619,786 533,549 622,344 711,891 779,006 Seed purchased 876,206 860,310 869,998 850,002 980,001
Manufactured Inputs 3,260,957 3,028,028 2,890,206 3,035,412 3,690,815 Fertilizers and lime 826,768 760,680 800,003 829,999 1,062,458 Pesticides 1,031,682 944,037 980,003 949,997 1,180,000 Petroleum fuel and oils 550,944 544,295 541,215 639,510 919,622 Electricity 851,563 779,016 568,985 615,906 528,735
Other Purchased Inputs 8,019,590 7,658,982 7,327,016 7,651,074 7,694,524 Repair and maintenance of capital items 795,343 754,001 791,668 1,008,553 913,378 Machine hire and custom work 707,713 923,778 839,043 770,547 681,606 Marketing, storage and transportation expenses 2,132,059 1,889,496 1,786,459 1,565,736 2,205,064 Contract labor 1,635,114 1,425,365 1,578,079 1,467,593 1,528,215 Miscellaneous expenses 2,749,361 2,666,342 2,331,767 2,838,645 2,366,261
plus: Net Government Transactions 223,392 76,114 115,341 (183,942) (41,338)
+ Direct Government payments 882,216 645,973 735,277 478,157 703,296 - Motor vehicle registration and licensing fees 43,505 29,296 59,938 72,098 54,638 - Property taxes 615,319 540,563 559,998 590,001 689,996
Gross Value Added 13,113,374 13,878,843 16,080,756 19,428,674 17,802,859
less: Capital Consumption 1,059,546 1,076,993 1,103,910 1,185,801 1,234,857
Net Value Added 12,053,828 12,801,850 14,976,846 18,242,873 16,568,002
less: Payments to Stakeholders 6,821,364 6,559,891 6,894,181 7,038,467 7,449,783 Employee compensation (total hired labor) 4,927,743 4,692,655 4,771,924 5,132,410 5,491,789 Net rent received by non-operator landlords 554,568 547,492 839,190 588,827 429,318 Real estate and non-real estate interest 1,339,053 1,319,744 1,283,067 1,317,230 1,528,676
Net Farm Income 5,232,464 6,241,959 8,082,665 11,204,406 9,118,219

California Agricultural Resource Directory 2006 25
Agricultural Statistical Review
Commodity Rank, Acreage, Production, Value and Leading Producing Counties, 2005
Commodity U.S. Rank 1
CA Share of U.S. Prod.
Area Harvested
Short Tons (2,000 Lbs.)
Total Value 2
California ––– Rank –––
2004 2005
Harvest Season Leading Counties 3
VEGETABLE AND MELON CROPSTotal Value – $6,184,499,000Artichokes 4 1 99 7.3 42.0 37,884 45 57 Continuous Monterey, Riverside, San Benito, San Mateo
Asparagus 1 58 29.0 52.2 119,016 32 35 Feb. 15-June 30 San Joaquin, Monterey, Fresno, Sacramento, Imperial
Beans, Fresh Market Snap
4 12 6.5 32.5 41,340 55 54 Apr. 20-Dec. 15 San Diego, Santa Clara, Tulare, San Mateo
Broccoli 1 92 122.0 915.0 513,758 13 16 Continuous Monterey, Santa Barbara, Imperial, San Luis Obispo, Fresno
Cabbage, Fresh Market 1 19 13.3 232.8 70,291 39 47 Continuous Monterey, Ventura, San Luis Obispo, Imperial, Santa Barbara
Carrots 1 67 71.1 1,165.2 455,207 17 17 Continuous Imperial, Riverside, Monterey
Caulifl ower 1 83 31.9 269.8 154,377 33 31 Continuous Monterey, Santa Barbara, Imperial, San Luis Obispo, Riverside
Celery 1 94 25.4 901.7 256,141 22 22 Continuous Ventura, Monterey, Santa Barbara, San Benito, San Luis Obispo
Corn, Fresh Market Sweet 2 18 25.3 246.7 109,041 34 37 May 1-Dec. 10 Fresno, Imperial, Contra Costa, Riverside, San Joaquin
Cucumbers, Fresh Market 3 12 4.6 62.1 29,684 56 61 Mar. 20-Nov. 30 San Joaquin, San Diego, Tulare, Ventura, San Bernardino
Garlic 4 1 86 24.5 200.0 176,325 37 27 Apr. 1-Sept. 15 Fresno, Kern, Kings, Mono, Santa Clara
Lettuce, Head 1 76 131.0 2,358.0 749,844 – – Continuous Monterey, Fresno, Imperial, Santa barbara, San Luis Obispo
Lettuce, Leaf 1 86 55.0 660.0 417,120 – – Continuous Monterey, Imperial, Fresno, Santa Barbara, Santa Cruz
Lettuce, Romaine 1 73 63.0 866.2 303,188 – – Continuous Monterey, San Benito, Riverside, Ventura, Santa Clara
Lettuce, All – – 249.0 3,884.2 1,470,152 5 6 – Monterey, Imperial, Fresno, Santa Barbara, San Benito,
Melons, Cantaloupe 1 60 51.0 663.0 132,600 29 32 May 15-Nov. 30 Fresno, Imperial, Merced, Riverside, Stanislaus
Melons, Honeydew 1 75 17.9 170.0 44,213 49 53 June 1-Nov. 30 Fresno, Riverside, Sutter, Imperial, Yolo
Melons, Watermelon 2 17 13.0 318.5 40,768 48 55 May 25-Oct. 15 Fresno, San Joaquin, Kern, Riverside, Imperial
Mushrooms, Agaricus 2 14 0.5 59.3 172,465 30 29 Continuous Monterey, Santa Clara, San Diego, San Mateo
Onions, All 1 34 43.8 1,003.4 195,221 26 25 Apr. 1-Oct. 31 Fresno, Imperial, Los Angeles, Kern, San Benito
Peppers, Bell 1 48 23.0 345.0 185,948 – – July 1-Dec. 10 Riverside, Fresno, Kern, Ventura, San Benito
Peppers, Chili 2 27 5.9 69.4 38,942 – – – Santa Clara, San Benito
Peppers, All – – 28.9 414.4 224,890 20 23 – –
Pumpkins 2 15 5.5 79.8 14,355 62 67 Sept. 1-Oct. 31 San Joaquin, Sacramento, Ventura, San Mateo, Stanislaus
Spinach, Fresh Market 1 75 31.0 263.5 106,454 – – Continuous Monterey, Santa Barbara
Spinach, Processing 1 63 6.0 77.3 8,318 – – Continuous –
Spinach, All – – 37.0 340.8 114,772 27 36 Continuous Monterey, Imperial, San Benito, Riverside, Ventura
Squash 1 20 7.5 82.0 31,513 54 60 – Fresno, Santa Barbara, San Diego, Monterey, San Luis Obispo
Tomatoes, Fresh Market 2 30 42.6 596.4 369,768 – – May 15-Dec. 31 Fresno, Merced, San Diego, San Joaquin, Stanislaus
Tomatoes, Processing 1 94 264.0 9,600.0 572,160 – – June 20-Nov. 10 Fresno, San Joaquin, Yolo, Kings, Colusa
Tomatoes, All – – 306.6 10,196.4 941,928 8 10 – –
Other Vegetables and Melons
– – 172.0 3,239.4 838,558 – – – –

26 California Agricultural Resource Directory 2006
Agricultural Statistical Review
Commodity Rank, Acreage, Production, Value and Leading Producing Counties, 2005
Commodity U.S. Rank 1
CA Share of U.S. Prod.
Area Harvested
Short Tons (2,000 Lbs.)
Total Value 2
California ––– Rank –––
2004 2005
Harvest Season Leading Counties 3
FRUIT AND NUT CROPSTotal Value – $10,478,549,000
Almonds (Shelled) 4 1 99 580.0 915.0 2,337,140 4 4 Aug. 1-Oct. 31 Kern, Stanislaus, Fresno, Merced, Madera
Apples 5 4 25.0 177.5 74,718 53 46 July 15-Oct. 30 San Joaquin, Kern, Santa Cruz, Fresno, Stanislaus
Apricots 1 92 14.5 75.5 33,930 60 59 May 1-July 15 Stanislaus, Fresno, Kern, San Joaquin, Kings
Avocados 1 84 62.0 151.0 276,330 18 21 Continuous San Diego, Ventura, Riverside, Santa Barbara, San Luis Obispo
Berries, Blueberries 7 4 1.8 4.6 40,583 N/A 56 – San Joaquin
Berries, Boysenberries 1 55 0.3 1.4 3,724 72 72 June 1-July 15 –
Berries, Raspberries 1 50 3.0 41.2 164,175 28 30 June 1-Oct. 31 Santa Cruz, Ventura, Monterey
Berries, Fresh Market Strawberries
1 87 – 791.2 977,985 – – – Monterey, Ventura, Santa Barbara, San Luis Obispo, Sacramento
Berries, Processing Strawberries
1 93 – 237.8 132,189 – – – Ventura, Santa Barbara, San Diego, Monterey
Berries, All Strawberries
1 89 34.3 1,029.0 1,110,174 7 8 Feb. 20-Nov. 15 Monterey, Ventura, Santa Barbara, Santa Cruz, Orange
Cherries, Sweet 2 21 27.0 52.7 84,751 38 43 May 20-June 25 San Joaquin, Fresno, Tulare, Kern, Stanislaus
Dates 4 1 82 5.3 16.0 20,960 61 65 Oct. 1-Dec. 15 Riverside, Imperial
Figs 4 1 99 12.3 50.9 22,122 63 64 June 10-Sept. 15 Madera, Merced
Grapefruit, All 3 23 12.0 204.4 98,732 47 40 Nov. 1-July 31 Riverside, Tulare, Kern, San Diego, Imperial
Grapes, Raisin – – 240.0 2,306.0 567,140 – – May 15-Nov. 15 Fresno, Madera, Tulare, Kern, Kings
Grapes, Table – – 83.0 867.0 383,910 – – May 25-Dec. 15 Kern, Tulare, Fresno, Riverside, Madera
Grapes, Wine – – 477.0 3,805.0 2,214,665 – – Aug. 5-Dec. 15 Napa, Sonoma, San Joaquin, Monterey, Fresno
Grapes, All 1 89 800.0 6,978.0 3,165,715 2 2 – Fresno, Napa, Kern, Sonoma, Tulare
Kiwifruit 4 1 97 4.5 37.2 23,326 64 63 Oct. 1-May 31 Tulare, Butte, Yuba, Fresno, Kern
Lemons 1 89 44.0 779.0 277,991 25 20 Aug. 1-July 31 Ventura, Riverside, Tulare, Kern, Santa Barbara
Nectarines 1 95 36.5 239.0 120,456 40 34 June 10-Sept. 5 Fresno, Tulare, Kings, Kern, Madera
Olives 4 1 100 32.0 142.0 79,511 51 45 Sept. 25-Mar. 15 Tulare, Tehama, Glenn, Madera, Fresno
Oranges, Navel and Misc. – 35 133.0 1,650.0 431,904 – – Nov. 1-Aug.31 Tulare, Kern, Fresno, Riverside, San Bernardino
Oranges, Valencia – 20 49.0 768.8 171,690 – – Nov. 1-June 15 Tulare, Kern, Ventura, Fresno, Riverside
Oranges, All 2 29 182.0 2,418.8 603,594 14 13 – Tulare, Kern, Fresno, Ventura, Riverside
Peaches, Clingstone 1 100 30.4 484.0 122,939 – – July 15-Sept. 15 Stanislaus, Sutter, Yuba, Merced, Butte
Peaches, Freestone 1 55 36.0 385.0 157,048 – – May 10-Sept. 15 Fresno, Tulare, Kings, Stanislaus, Merced
Peaches, All 1 73 66.4 869.0 279,987 23 19 – Fresno, Tulare, Stanislaus, Kings, Sutter
Pears, All 2 24 16.0 202.0 79,790 42 44 Aug. 5-Oct. 5 Fresno, Sacramento, Lake, Mendocino, Tulare
Pecans 8 1 2.6 2.0 7,020 70 71 Sept. 1-Nov. 30 Tulare
Pistachios 4 1 96 105.0 283.0 577,320 15 14 Sept. 15-Dec. 10 Kern, Fresno, Tulare, Kings, Madera
Plums 1 95 36.0 171.0 92,463 44 41 May 25-Aug. 20 Fresno, Tulare, Kern, Kings, Madera
Plums, Dried 4 1 99 67.0 90.0 130,500 46 33 Aug. 15-Oct. 10 Sutter, Tehama, Glenn, Fresno, Tulare
Tangerines, Mandarins, Tangelos, and Tangors
2 37 13.0 108.0 53,432 59 51 Nov. 1-May 15 Kern, Tulare, Riverside, San Diego, Ventura
Walnuts 4 1 99 215.0 355.0 539,600 16 15 Sept. 5-Nov. 10 San Joaquin, Tulare, Stanislaus, Butte, Sutter
Other Fruits and Nuts – – – – 180,505 – – – –
Commodity Rank, Acreage, Production, Value and Leading Producimg Counties, 2005 continued

California Agricultural Resource Directory 2006 27
Agricultural Statistical Review
Commodity Rank, Acreage, Production, Value and Leading Producing Counties, 2005
Commodity U.S. Rank 1
CA Share of U.S. Prod.
Area Harvested
Short Tons (2,000 Lbs.)
Total Value 2
California ––– Rank –––
2004 2005
Harvest Season Leading Counties 3
FIELD AND SEED CROPSTotal Value – $3,483,176,000Barley 9 2 60.0 90.7 9,941 68 69 May 15-Oct. 1 San Luis Obispo, Fresno, Siskiyou, Glenn, Monterey
Beans, Dry 7 5 65.0 69.2 55,954 57 50 Aug. 20-Nov. 15 Stanislaus, Fresno, San Joaquin, Sutter, Colusa
Cotton Lint, All 5 7 657.0 389.5 625,450 11 12 Oct. 1-Jan. 1 Fresno, Kings, Kern, Merced, Tulare
Cottonseed 5 7 – 594.0 85,848 36 42 – Kings, Fresno, Kern, Merced, Tulare
Grain, Corn 30 – 110.0 529.8 52,030 50 52 Sept. 1-Dec. 1 San Joaquin, Sacramento, Glenn, Merced, Solano
Grain, Sorghum 16 – 10.0 25.2 1,915 74 75 – Tulare, Sacramento, Sutter
Hay, Alfalfa and Other 2 6 1,550.0 8,935.0 1,140,883 9 7 Mar. 1-Nov. 5 Kern, Tulare, Imperial, Merced, Fresno
Oats 16 1 20.0 24.0 1,950 71 74 June 15-Oct. 1 Siskiyou, Sonoma, Sacramento, Lassen, Modoc
Potatoes (Excl. Sweet) 9 4 42.9 756.2 202,351 24 24 Continuous Kern, San Joaquin, Modoc, Imperial, Riverside
Potatoes, Sweet 2 22 11.7 175.5 103,545 41 39 July 15-Nov. 15 Merced, Stanislaus
Rice 5,6 2 17 526.0 1,941.8 407,778 19 18 Sept. 1-Nov. 30 Colusa, Sutter, Butte, Glenn, Yolo
Sugar Beets 5,6 5 6 44.1 1,715.0 64,999 43 48 Apr. 1-Dec. 10 Imperial, Fresno, Kern, Merced, Kings
Wheat, All 17 1 369.0 844.7 104,458 35 38 May 20-Sept. 1 Kern, Fresno, Imperial, Tulare, Kings
Oil Crops 7 – – 94.0 76.6 17,186 66 66 – –
Other Field Crops – – – – 599,158 – – – –
NURSERY, GREENHOUSE AND FLORICULTURE CROPSTotal Value – $3,426,414,000Nursery Products 4,6,8 1 20 – – 2,433,346 3 3 Continuous San Diego, Orange, Riverside, Monterey, Ventura
Flowers and Foliage 9 1 – – – 983,768 10 9 Continuous San Diego, Santa Barbara, Monterey, San Luis Obispo, Ventura
Christmas Trees – – – – 9,300 69 70 Nov. 1-Dec. 24 El Dorado, San Diego, Orange, Santa Clara, San Bernardino
Commodity Rank, Acreage, Production, Value and Leading Producing Counties, 2005 continued
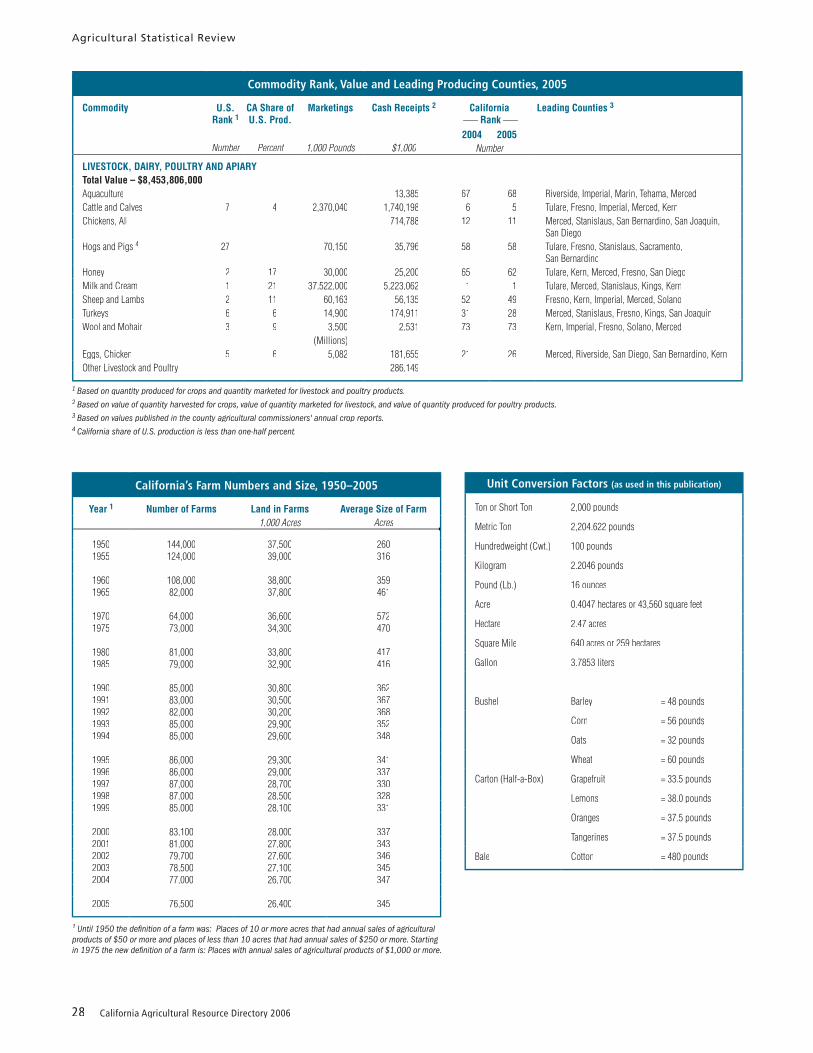
28 California Agricultural Resource Directory 2006
Agricultural Statistical Review
Unit Conversion Factors (as used in this publication)
Ton or Short Ton 2,000 pounds
Metric Ton 2,204.622 pounds
Hundredweight (Cwt.) 100 pounds
Kilogram 2.2046 pounds
Pound (Lb.) 16 ounces
Acre 0.4047 hectares or 43,560 square feet
Hectare 2.47 acres
Square Mile 640 acres or 259 hectares
Gallon 3.7853 liters
Bushel Barley = 48 pounds
Corn = 56 pounds
Oats = 32 pounds
Wheat = 60 pounds
Carton (Half-a-Box) Grapefruit = 33.5 pounds
Lemons = 38.0 pounds
Oranges = 37.5 pounds
Tangerines = 37.5 pounds
Bale Cotton = 480 pounds
Commodity Rank, Value and Leading Producing Counties, 2005
Commodity U.S. Rank 1
CA Share of U.S. Prod.
Marketings Cash Receipts 2 California ––– Rank –––
2004 2005
Leading Counties 3
LIVESTOCK, DAIRY, POULTRY AND APIARYTotal Value – $8,453,806,000Aquaculture – – – 13,385 67 68 Riverside, Imperial, Marin, Tehama, MercedCattle and Calves 7 4 2,370,040 1,740,198 6 5 Tulare, Fresno, Imperial, Merced, KernChickens, All – – – 714,788 12 11 Merced, Stanislaus, San Bernardino, San Joaquin,
San DiegoHogs and Pigs 4 27 – 70,150 35,796 58 58 Tulare, Fresno, Stanislaus, Sacramento,
San BernardinoHoney 2 17 30,000 25,200 65 62 Tulare, Kern, Merced, Fresno, San DiegoMilk and Cream 1 21 37,522,000 5,223,062 1 1 Tulare, Merced, Stanislaus, Kings, KernSheep and Lambs 2 11 60,163 56,135 52 49 Fresno, Kern, Imperial, Merced, SolanoTurkeys 6 6 14,900 174,911 31 28 Merced, Stanislaus, Fresno, Kings, San JoaquinWool and Mohair 3 9 3,500 2,531 73 73 Kern, Imperial, Fresno, Solano, Merced
(Millions)Eggs, Chicken 5 6 5,082 181,655 21 26 Merced, Riverside, San Diego, San Bernardino, Kern Other Livestock and Poultry – – – 286,149 – – –
California’s Farm Numbers and Size, 1950–2005
Year 1 Number of Farms Land in Farms Average Size of Farm
1950 144,000 37,500 2601955 124,000 39,000 316
1960 108,000 38,800 3591965 82,000 37,800 461
1970 64,000 36,600 5721975 73,000 34,300 470
1980 81,000 33,800 4171985 79,000 32,900 416
1990 85,000 30,800 3621991 83,000 30,500 3671992 82,000 30,200 3681993 85,000 29,900 3521994 85,000 29,600 348
1995 86,000 29,300 3411996 86,000 29,000 3371997 87,000 28,700 3301998 87,000 28,500 3281999 85,000 28,100 331
2000 83,100 28,000 3372001 81,000 27,800 3432002 79,700 27,600 3462003 78,500 27,100 3452004 77,000 26,700 347
2005 76,500 26,400 345

California Agricultural Resource Directory 2006 29
Agricultural Statistical Review
County Rank, Total Value of Production and Leading Commodities, 2004–2005 1
––– Rank –––2004 2005
County Total Value Leading Commodities
1 1 Fresno 4,640,166 Grapes, Almonds, Milk, Tomatoes, Cattle and Calves2 2 Tulare 4,360,854 Milk, Oranges, Cattle and Calves, Grapes, Alfalfa Hay and Silage3 3 Kern 3,546,925 Almonds and By-products, Grapes, Milk, Citrus, Pistachios4 4 Monterey 3,273,000 Lettuce, Strawberries, Wine Grapes, Spinach, Broccoli5 5 Merced 2,388,058 Milk, Chickens, Almond Meats, Cattle and Calves, Sweet Potatoes6 6 Stanislaus 1,977,596 Milk, Almonds, Cattle and Calves, Chickens, Walnuts7 7 San Joaquin 1,743,294 Milk, Grapes, Almond Meats, Tomatoes, English Walnuts8 8 San Diego 1,531,307 Foliage Plants, Woody Ornamentals, Avocados, Bedding Plants, Cut Flowers
10 9 Kings 1,407,091 Milk, Cotton, Cattle and Calves, Pistachios, Alfalfa11 10 Imperial 1,286,066 Cattle, Alfalfa, Leaf and Head Lettuce, Carrots, Livestock9 11 Ventura 1,253,048 Strawberries, Nursery Stock, Lemons, Celery, Tomatoes
12 12 Riverside 1,168,537 Milk, Woody Ornamentals, Table Grapes, Bell Peppers, Grapefruit13 13 Madera 1,105,044 Almond Nuts and Hulls, Grapes, Milk, Pistachios, Replacement Heifers14 14 Santa Barbara 997,600 Strawberries, Wine Grapes, Broccoli, Head and Leaf Lettuce, Caulifl ower17 15 Sonoma 637,769 Wine Grapes, Milk, Livestock and Poultry, Cattle and Calves, Nursery Ornamentals16 16 San Luis Obispo 597,169 Wine Grapes, Cattle and Calves, Broccoli, Vegetable Transplants, Strawberries15 17 San Bernardino 565,100 Milk, Eggs, Replacement Heifers, Trees and Shrubs, Cattle and Calves (Meat)19 18 Napa 548,206 Wine Grapes, Nursery Products, Cattle and Calves, Livestock Products, Olives22 19 Butte 432,028 Almonds, Rice, Walnuts, Nursery Stock, Clingstone Peaches18 20 Santa Cruz 411,956 Strawberries, Raspberries, Leaf and Head Lettuce, Landscape Plants, Vegetable Crops, Leaf Lettuce21 21 Glenn 393,736 Almonds, Milling Rice, Milk, English Walnuts, Cattle and Calves20 22 Colusa 392,677 Rice, Almond Meats, Processing Tomatoes, Cattle and Calves, English Walnuts24 23 Sacramento 348,885 Wine Grapes, Milk, Nursery Products, Bartlett Pears, Cattle and Calves23 24 Yolo 332,228 Tomatoes, Wine Grapes, Alfalfa Hay, Almonds, Rice26 25 Orange 312,336 Woody Ornamentals, Strawberries, Potted Plants, Flower Propagative Materials, Avocados25 26 Sutter 298,599 Rice, Walnuts, Peaches, Dried Plums, Almonds27 27 Los Angeles 277,844 Ornamental Trees and Shrubs, Bedding Plants, Dry Onions, Root Vegetables, Orchard Fruit28 28 San Benito 268,846 Baby, Romaine and Leaf Lettuce; Nursery Stock; Vegetable and Row Crops; Wine Grapes; Bell Peppers29 29 Santa Clara 250,530 Nursery Crops, Mushrooms, Bell Peppers, Cut Flowers, Steers and Heifers30 30 Solano 238,690 Nursery Stock, Cattle and Calves, Alfalfa, Processing Tomatoes, Walnuts32 31 Tehama 172,466 English Walnuts, Almonds, Dried Plums, Olives, Milk31 32 San Mateo 158,397 Ornamental Nursery Stock, Potted Foliage Plants, Potted Orchids, Brussels Sprouts, Potted Poinsettia33 33 Siskiyou 147,639 Alfalfa Hay, Strawberry Plants, Fed Heifers and Steers, Irrigated Pasture, Irish Potatoes35 34 Yuba 132,654 Rice, Clingstone Peaches, Walnuts, Cattle and Calves, Milk34 35 Humboldt 126,807 Nursery Products, Milk, Cattle and Calves, Energy Biomass, Range and Irrigated Pasture36 36 Mendocino 120,018 Wine Grapes, Bartlett Pears, Cattle and Calves, Field Crops, Milk38 37 Modoc 88,406 Alfalfa Hay, Cattle and Calves, Irish Potatoes, Vegetable Crops, Irrigated and Range Pasture37 38 Contra Costa 86,938 Bedding Plants, Sweet Corn, Cattle and Calves, Grapes, Vegetable Crops41 39 Shasta 84,209 Stocker and Feeder Cattle, Strawberry Plants, Other Hay, Beef Cows, Range and Irrigated Pasture39 40 Lake 61,514 Wine Grapes, Bartlett Pears, Nursery Products, Cattle and Calves, English Walnuts40 41 Placer 59,803 Cattle and Calves, Milling Rice, Irrigated and Range Pasture, Strawberries, Tangerines and Mandarins42 42 Marin 52,823 Milk, Cattle and Calves, Range Pasture, Fish, Livestock43 43 Lassen 51,751 Hay, Livestock, Strawberry Plants, Pasture, Mint45 44 Alameda 43,951 Woody Ornamentals, Wine Grapes, Cattle and Calves, Range Pasture, Nursery Products44 45 Del Norte 43,166 Cows, Milk, Lily Bulbs, Woody Ornamentals, Nursery Products46 46 Amador 28,355 Wine Grapes, Calves, Range Pasture, Livestock, Fruits and Nuts49 47 Mariposa 27,084 Cattle and Calves, Range Pasture, Poultry, Livestock and Poultry Products, Fruits and Nuts47 48 Mono 26,944 Alfalfa Hay, Stocker and Feeder Cattle, Steers, Heifers, Cows48 49 El Dorado 26,100 Cattle and Calves, Wine Grapes, Range Pasture, Apples, Christmas Trees and Cut Greens50 50 Tuolumne 25,713 Livestock, Cattle and Calves, Range Pasture, Firewood, Bees51 51 Plumas 21,282 Stocker and Feeder Cattle; Alfalfa and Wild Hay; Irrigated, Forage and Range Pasture; Beef Cows52 52 Calaveras 19,738 Cattle and Calves, Poultry, Wine Grapes, Walnuts, Nursery Products53 53 Inyo 16,614 Steers, Turf, Heifers, Alfalfa Hay, Cows54 54 Nevada 9,313 Fed Heifers and Steers, Irrigated and Range Pasture, Wine Grapes, Milk Cows, Fruit and Nut Crops55 55 Sierra 6,449 Stockers and Feeders, All Pasture, All Hay, Beef Cows, Fruit and Nut Crops56 56 Alpine 4,431 Cattle and Calves, Range and Irrigated Pasture, Other Hay57 57 Trinity 2 2,320 Cattle and Calves, Range and Irrigated Pasture, Wine Grapes, Fruit and Nut Crops, Grain and Other Hay58 58 San Francisco 2 1,925 Vegetable Crops, Cut Flowers

30 California Agricultural Resource Directory 2006
Agricultural Statistical Review
Seasonal Rainfall with Comparisons to Normal, 2005 – 2006
Stations –––––––––––––– 2004–2005 –––––––––––––– –––––––––––––– 2005–2006 –––––––––––––– Normal Annual RainfallPrecipitation
July 1 to June 29Percent of Normal Precipitation
July 1 to July 2Percent of Normal
North CoastEureka 46.94 125 59.54 159 37.53Ukiah 29.76 105 51.07 135 37.96Santa Rosa 37.95 125 45.67 151 30.30
Central CoastSan Francisco Airport 27.24 138 26.05 132 19.70San Jose 24.95 173 22.91 159 14.42Livermore Tele – – – – 14.21Salinas Airport 19.66 158 15.34 123 12.44Monterey FAA 15.49 83 13.91 74 18.72King City 18.91 165 15.05 132 11.44Paso Robles Airport 22.50 161 14.48 104 13.95
Sacramento ValleyRedding 38.76 116 45.37 136 33.30Red Bluff FSS 27.44 123 30.30 136 22.29Chico AFS 30.57 116 31.59 120 26.32Marysville 23.12 110 31.18 148 21.04Sacramento Airport 22.01 126 23.46 134 17.52
San Joaquin ValleyStockton WSO 18.49 133 16.67 119 13.95Fresno 15.95 150 14.58 146 10.00Bakersfi eld 9.20 161 6.85 120 5.72
South CoastSanta Maria Airport 19.55 158 17.28 140 12.36Santa Barbara 31.46 194 17.64 109 16.25Oxnard – – – – 14.38Los Angeles 37.25 252 13.19 89 14.77Riverside 21.16 221 7.38 77 9.58San Diego Airport 22.51 227 6.06 61 9.90
Southeastern InteriorBishop 10.26 191 7.91 147 5.37Lancaster 17.50 253 6.47 93 6.92Daggett Airport 8.63 220 1.34 34 3.93Thermal Airport 7.96 252 2.35 74 3.16Blythe 6.63 184 2.85 79 3.60Imperial 5.13 187 1.89 69 2.75
Cascade-SierraAlturas 15.07 125 16.48 137 12.01Mt. Shasta 48.68 121 62.08 168 37.02Blue Canyon 65.24 97 90.45 135 67.04Yosemite Valley 23.92 65 46.04 124 37.05

California Agricultural Resource Directory 2006 31
Agricultural Statistical Review
Vegetables
Artichokes
Asparagus
Avocados
Beans, Dry
Beans, Snap
Broccoli
Brussel Sprouts
Cabbage
Carrots
Cauliflower
Celery
Corn
Cucumbers
Garlic
Lettuce
Mushrooms
Onions
Peppers, Green
Potatoes
Potatoes, Sweet
Spinach
Squash
Tomatoes
Fruits
Apples
Apricots
Boysenberries
Cherries
Dates
Figs
Grapefruit
Grapes
Kiwifruit
Lemons
Melon, Cantaloupe
Melon, Honeydew
Olallieberries
Oranges, Navel
Oranges, Valencia
Peaches
Pears
Plums
Plums, Dried
Strawberries
Tangerines
Tangelos
Watermelons
JanuaryFebruary
MarchApril May June
July AugustSeptember
OctoberNovember
December
Pomegranates
California’s Fruit and Vegetable Crop Seasons

32 California Agricultural Resource Directory 2006
California’s counties reported an increase of 5.1 percent in the value of their agricultural production for 2005. Thirteen counties reported a value of production in excess of $1.1 billion. Fresno continued as the leading county with an agricultural production value of $4.64 billion, a slight increase of 0.8 percent from the 2004 value. Tulare County was second in value of production with $4.36 billion, which is 8 percent above 2004. Kern’s agricultural production increased 10.4 percent to $3.55 billion.
Notes to the County DataThe gross value of production published in this report includes all farm production, whether sold into usual marketing channels or used on the
farm where produced. Values placed on pasture and range feed are included, and fresh fruit and vegetable crop values are based on the free-on-board (f.o.b.) packed price. Values are recorded for all products grown during the calendar year, regardless of when they are marketed. The county agricultural commissioners’ reports also provide statistics on a broader range of commodities than estimates prepared by other agencies. Because of these concepts, the state total for gross dollar values summarized in this report differs from the cash receipts to farmers estimated by USDA’s National Agricultural Statistics Service, California Field Offi ce. The larger total value reported by the agricultural commissioners results from different defi nitions
CountyCountyStatistical Data
Notable Changes in County Ranks and Percentages of the State Total, 2005
Rank Commodity Changes in County Rankings
1 Milk and Cream Tulare leads with more than 27 percent of the state total2 Grapes, All Fresno leads, followed closely by Napa and Kern3 Nursery Products San Diego continues to lead with more than 19 percent of the total4 Almonds Kern leads with 20 percent, followed by Stanislaus5 Cattle and Calves Tulare is No. 1, followed by Fresno and Imperial6 Lettuce Monterey still leads with 60 percent7 Strawberries Monterey and Ventura lead with more than 60 percent of the total8 Oranges Tulare leads with more than half of the total9 Alfalfa Hay Kern leads the way, followed by Tulare and Imperial
10 Flowers and Foliage San Diego has more than 52 percent of the total11 Chickens Merced and Stanislaus lead the state with more than 60 percent12 Cotton Fresno still leads with 34 percent, followed by Kings13 Pistachios Kern is No. 1, followed by Fresno and Tulare14 Walnuts, English San Joaquin leads, followed closely by Tulare and Stanislaus15 Tomatoes, Processing Fresno leads with nearly 42 percent, followed by San Joaquin and Yolo

California Agricultural Resource Directory 2006 33
County Statistical Data
used in estimating total value of production rather than cash receipts to producers. Some counties are now including timber as a part of their crop report, following the pattern set by the County Agricultural Commissioners’ Association. Since it is not comparable to earlier county summaries, timber has not been made a part of the main tables of this summary. Total value reported by the counties, including timber, is 0.2 percent more than the $38.6 billion recorded in the table “County Rank by Gross Value of Agricultural Production, 2004 – 2005” on page 34.
California Timber IndustryCalifornia has more forestland than any state except Alaska. Nearly two-billion-board-feet (equivalent to 132,000 homes) of commercial lumber are produced from California’s private and public timberlands each year, making the Golden State the third largest producer of wood products in the nation. California’s abundant forests could provide nearly 100 percent of the state’s demand for wood.
County Agricultural Commissioners’ ReportsCopies of individual county agricultural commissioners’ reports may be requested directly from each county agricultural commissioner’s offi ce. USDA’s National Agricultural Statistics Service, California Field Offi ce publications are also available free-of-charge at www.nass.usda.gov/ca.
Leading Timber Counties, 2005
Timber Rank County Timber Volume Total Agricultural Value (Including Timber)
Timber Value Timber Percentage of Total Agricultural Value
1 Humboldt 390,333 320,170 193,363 60.42 Mendocino 120,841 173,932 53,914 31.03 Siskiyou 207,726 195,206 47,567 24.44 Shasta 170,690 127,678 43,469 34.45 Plumas 107,817 47,669 26,387 55.4
photo by Ed Williams/San Benito Co.

34 California Agricultural Resource Directory 2006
County Statistical Data
County Rank by Gross Value of Agricultural Production, 2004–2005 1
County Rank Without Timber Rank With Timber
2004 2005 Percent Change
Timber Value
2004 2005 Percent Change
Fresno 4,604,139 (1) 4,640,166 (1) 0.8 2,345 4,605,557 (1) 4,642,511 (1) 0.8Tulare 4,037,351 (2) 4,360,854 (2) 8.0 1,880 4,039,520 (2) 4,362,734 (2) 8.0Kern 3,213,846 (3) 3,546,925 (3) 10.4 163 3,213,846 (3) 3,547,088 (3) 10.4Monterey 3,090,000 (4) 3,273,000 (4) 5.9 4 3,090,004 (4) 3,273,004 (4) 5.9Merced 2,365,494 (5) 2,388,058 (5) 1.0 7 2,365,501 (5) 2,388,065 (5) 1.0Stanislaus 1,978,434 (6) 1,977,596 (6) – – 1,978,434 (6) 1,977,596 (6) –San Joaquin 1,613,037 (7) 1,743,294 (7) 8.1 9 1,613,045 (7) 1,743,303 (7) 8.1San Diego 1,461,769 (8) 1,531,307 (8) 4.8 8 1,461,780 (8) 1,531,315 (8) 4.8Kings 1,292,090 (10) 1,407,091 (9) 8.9 – 1,292,090 (10) 1,407,091 (9) 8.9Imperial 1,187,254 (11) 1,286,066 (10) 8.3 – 1,187,254 (11) 1,286,066 (10) 8.3Ventura 1,387,004 (9) 1,253,048 (11) -9.7 62 1,387,075 (9) 1,253,110 (11) -9.7Riverside 1,131,605 (12) 1,168,537 (12) 3.3 9 1,131,605 (12) 1,168,546 (12) 3.3Madera 1,074,193 (13) 1,105,044 (13) 2.9 486 1,074,678 (13) 1,105,530 (13) 2.9Santa Barbara 905,388 (14) 997,600 (14) 10.2 – 905,388 (14) 997,600 (14) 10.2Sonoma 526,690 (17) 637,769 (15) 21.1 4,984 532,439 (17) 642,753 (15) 20.7San Luis Obispo 544,398 (16) 597,169 (16) 9.7 14 544,410 (16) 597,183 (16) 9.7San Bernardino 687,829 (15) 565,100 (17) -17.8 1 687,838 (15) 565,101 (17) -17.8Napa 357,215 (19) 548,206 (18) 53.5 415 357,242 (20) 548,621 (18) 53.6Butte 342,542 (22) 432,028 (19) 26.1 7,662 357,574 (19) 439,690 (19) 23.0Santa Cruz 442,261 (18) 411,956 (20) -6.9 6,158 448,072 (18) 418,114 (20) -6.7Glenn 347,957 (21) 393,736 (21) 13.2 476 348,088 (22) 394,212 (21) 13.3Colusa 351,604 (20) 392,677 (22) 11.7 – 351,604 (21) 392,677 (22) 11.7Sacramento 324,168 (24) 348,885 (23) 7.6 46 324,220 (24) 348,931 (23) 7.6Yolo 338,128 (23) 332,228 (24) -1.7 – 338,128 (23) 332,228 (24) -1.7Orange 293,563 (26) 312,336 (25) 6.4 30 293,592 (27) 312,366 (26) 6.4Sutter 299,556 (25) 298,599 (26) -0.3 – 299,556 (25) 298,599 (27) -0.3Los Angeles 281,917 (27) 277,844 (27) -1.4 82 281,929 (28) 277,926 (28) -1.4San Benito 266,007 (28) 268,846 (28) 1.1 – 266,007 (29) 268,846 (29) 1.1Santa Clara 258,289 (29) 250,530 (29) -3.0 1,753 258,360 (30) 252,283 (30) -2.4Solano 211,230 (30) 238,690 (30) 13.0 18 211,248 (31) 238,708 (31) 13.0Tehama 138,358 (32) 172,466 (31) 24.7 18,072 146,141 (35) 190,538 (33) 30.4San Mateo 179,957 (31) 158,397 (32) -12.0 3,659 181,760 (33) 162,056 (35) -10.8Siskiyou 130,385 (33) 147,639 (33) 13.2 47,567 181,950 (32) 195,206 (32) 7.3Yuba 125,366 (35) 132,654 (34) 5.8 4,215 135,403 (36) 136,869 (36) 1.1Humboldt 126,285 (34) 126,807 (35) 0.4 193,363 295,407 (26) 320,170 (25) 8.4Mendocino 107,410 (36) 120,018 (36) 11.7 53,914 148,405 (34) 173,932 (34) 17.2Modoc 71,021 (38) 88,406 (37) 24.5 8,480 77,128 (39) 96,886 (38) 25.6Contra Costa 88,110 (37) 86,938 (38) -1.3 – 88,148 (38) 86,938 (39) -1.4Shasta 59,623 (41) 84,209 (39) 41.2 43,469 89,451 (37) 127,678 (37) 42.7Lake 61,454 (39) 61,514 (40) 0.1 30 61,517 (41) 61,544 (42) –Placer 60,434 (40) 59,803 (41) -1.0 11,514 70,647 (40) 71,317 (40) 0.9Marin 54,898 (42) 52,823 (42) -3.8 – 54,898 (43) 52,823 (44) -3.8Lassen 44,706 (43) 51,751 (43) 15.8 15,299 60,522 (42) 67,050 (41) 10.8Alameda 40,194 (45) 43,951 (44) 9.3 2 40,204 (47) 43,953 (46) 9.3Del Norte 40,608 (44) 43,166 (45) 6.3 11,186 53,726 (44) 54,352 (43) 1.2Amador 30,362 (46) 28,355 (46) -6.6 14,771 32,144 (49) 43,126 (47) 34.2Mariposa 24,447 (49) 27,084 (47) 10.8 1,250 25,159 (53) 28,334 (50) 12.6Mono 26,303 (47) 26,944 (48) 2.4 28 26,347 (51) 26,972 (51) 2.4El Dorado 25,874 (48) 26,100 (49) 0.9 16,798 49,207 (46) 42,898 (48) -12.8Tuolumne 23,586 (50) 25,713 (50) 9.0 9,544 28,624 (50) 35,257 (49) 23.2Plumas 20,751 (51) 21,282 (51) 2.6 26,387 52,024 (45) 47,669 (45) -8.4Calaveras 20,011 (52) 19,738 (52) -1.4 3,864 32,977 (48) 23,602 (53) -28.4Inyo 14,441 (53) 16,614 (53) 15.0 – 14,441 (55) 16,614 (55) 15.0Nevada 8,663 (54) 9,313 (54) 7.5 8,808 17,438 (54) 18,121 (54) 3.9Sierra 6,268 (55) 6,449 (55) 2.9 6,379 11,577 (56) 12,828 (56) 10.8Alpine 4,237 (56) 4,431 (56) 4.6 – 4,237 (57) 4,431 (57) 4.6Trinity 2 2,320 (57) 2,320 (57) – 21,730 25,589 (52) 24,050 (52) -6.0San Francisco 2 1,925 (58) 1,925 (58) – – 1,925 (58) 1,925 (58) –
Grand Total 36,752,955 38,631,995 5.1 546,941 37,253,080 39,178,936 5.2

California Agricultural Resource Directory 2006 35
County Statistical Data
Leading Commodities for Gross Value of Agricultural Production by County, 2005 1
ALAMEDA1 Woody Ornamentals 18,1332 Grapes, Wine 8,5523 Cattle and Calves 8,5504 Pasture, Range 3,3385 Nursery Products 2,9326 Hay, Other 1,0487 Vegetable Crops 6838 Hay, Alfalfa 4779 Livestock 145
10 Field Crops 65
ALPINE1 Cattle and Calves 2,8,162 Pasture, Range 1,4763 Pasture, Irrigated 1384 Hay, Other 25 – –6 – –7 – –8 – –9 – –
10 – –
AMADOR1 Grapes, Wine 23.2942 Calves 9,4433 Pasture, Range 2,5094 Livestock 7115 Fruits and Nuts 5416 Hay, Grain 3997 Hay, Alfalfa 3128 Nursery, F. Propg. Materials 2759 Vegetable Crops 182
10 Sheep and Lambs 178
BUTTE1 Almonds 187,3912 Rice 86,0853 Walnuts 76,6914 Nursery Stock 11,0995 Peaches, Clingstone 10,1076 Cattle and Calves 8,9997 Plums, Dried 7,3108 Kiwifruit 6,7419 Fruit and Nut Crops 4,708
10 Field Crops 4,665
CALAVERAS1 Cattle and Calves 9,8282 Poultry 1,6253 Grapes, Wine 1,5604 Walnuts 5465 Nursery Products 4436 Vegetable Crops 2007 Christmas Trees 1608 Sheep and Lambs 959 Olives 64
10 Apples 61
COLUSA1 Rice 124,9632 Almond Meats 121,9683 Tomatoes, Processing 42,8184 Cattle and Calves 13,2575 Walnuts, English 11,6936 Seed, Rice 7,7857 Seed, Onion 6,848 Hay, Alfalfa 5,0519 Seed, Cucumber 4,710
10 Beans, Dry 3,833
CONTRA COSTA1 Plants, Bedding 19,5002 Corn, Sweet 14,4003 Cattle and Calves 11,3004 Grapes 7,9005 Vegetable Crops 4,3006 Pasture, Range 3,8007 Tomatoes, All 3,5008 Corn, Field 2,3009 Hay, Alfalfa 2,300
10 Walnuts 1,900
DEL NORTE1 Cows 10,9352 Milk, Market 8,1913 Lily Bulbs 5,8274 Woody Ornamentals 4,2285 Nursery Products 3,7406 Milk, Manufacturing 3,3467 Calves 3,1048 Livestock Products 9889 Firewood 744
10 Pasture, Irrigated 702
EL DORADO1 Cattle and Calves 6,6432 Grapes, Wine 4,9403 Pasture, Range 3,4324 Apples, All 3,2845 Christmas Trees and Cut Greens 3,1326 Nursery Products 1,8007 Livestock 1,1008 Peaches 5379 Plums 299
10 Goats and Kids 272
FRESNO1 Grapes 554,5512 Almonds 469,8203 Milk 334,3834 Tomatoes 328,0775 Cattle and Calves 319,6866 Cotton 284,8547 Poultry 280,0608 Peaches 183,6789 Nectarines 173,946
10 Oranges 157,239
GLENN1 Almonds, All 134,5412 Rice, Milling 76,5583 Milk, Market 47,7614 Walnuts, English 24,6765 Cattle and Calves 20,1096 Plums, Dried 14,3427 Hay, Alfalfa 7,9748 Grapes 7,8229 Olives 7,353
10 Corn, Grain 5,297
HUMBOLDT1 Nursery Products 43,4612 Milk, Market 29,1443 Cattle and Calves 19,8604 Milk, Manufacturing 12,8655 Biomas, Energy 5,5926 Pasture, Range 4,7007 Livestock 3,7178 Pasture, Irrigated 3,0969 Silage 945
10 Vegetable Crops 920
IMPERIAL1 Cattle 283,4402 Alfalfa 111,7123 Lettuce, Leaf 110,8764 Carrots 83,3775 Lettuce 77,0366 Livestock 59,1787 Broccoli 58,6368 Onions 49,7259 Sugar Beets 45,620
10 Hay, Sudan Grass 35,451
INYO1 Steers 3,1762 Turf 3,1043 Heifers 2,4374 Hay, Alfalfa 2,3605 Cows 1,8156 Stockers and Feeders 1,2257 Hay, Other 5408 Honey 5259 Pasture, Range 468
10 Pasture, Irrigated 425
KERN1 Almonds and By-products 594,3782 Grapes, All 536,5713 Milk, All 421,5644 Citrus, All 354,7005 Pistachios 314,3526 Carrots, All 209,1627 Cattle and Calves 200,9668 Hay, Alfalfa 160,0599 Cotton and Cottonseed 140,519
10 Potatoes, All 96,342

36 California Agricultural Resource Directory 2006
County Statistical Data
Leading Commodities for Gross Value of Agricultural Production by County, 2004aLeading Commodities for Gross Value of Agricultural Production by County, 2005 1 continued
KINGS1 Milk, All 455,8972 Cotton, All 249,7413 Cattle and Calves 178,2954 Pistachios 84,3485 Alfalfa 54,1406 Tomatoes, Processing 49,4697 Silage, Corn 45,2428 Peaches, All 36,0479 Almonds 28,550
10 Walnuts 26,960
LAKE1 Grapes, Wine 38,1492 Pears, Bartlett 11,5973 Nursery Products 3,6444 Cattle and Calves 2,6195 Walnuts, English 1,4466 Field Crops 1,3987 Pears, Asian 8698 Pasture, Range 6309 Pears 398
10 Pasture, Irrigated 240
LASSEN1 Hay, All 24,3372 Livestock 14,6323 Plants, Strawberry 6,4754 Pasture 2,7575 Mint 1,0326 Nursery, Field Crops 1,0007 Seed, Garlic 4328 Wheat 3969 Aftermath 306
10 – –
LOS ANGELES1 Trees and Shrubs, Ornamental 107,8662 Plants, Bedding 30,6313 Onions, Dry 28,8664 Vegetables, Root 18,0005 Orchard Fruit 17,4556 Hay, Alfalfa 8,8587 Dairy and Livestock 7,3198 Ground Covers 6,7319 Plants, Indoor Flowering 5,283
10 Plants, Indoor Foliage 4,331
MADERA1 Almond Nuts and Hulls 269,1032 Grapes 230,5523 Milk 195,3704 Pistachios 76,3375 Heifers, Replacement 54,7746 Alfalfa 40,2657 Cattle and Calves 35,1868 Nursery Stock 34,5859 Poultry 16,979
10 Cotton, Lint and Seed 15,409
MARIN1 Milk, Market 31,2152 Cattle and Calves 7,7363 Pasture, Range 4,4664 Fish 3,2655 Livestock 1,9486 Vegetable Crops 1,1737 Sheep and Lambs 9488 Nursery Products 6899 Silage 475
10 Hay, Grain 292
MARIPOSA1 Cattle and Calves 15,9382 Pasture, Range 6,7563 Poultry, All 1,4864 Livestock and Poultry Products 1,4835 Fruits and Nuts 2826 Sheep and Lambs 2207 Livestock 1958 Field Crops 1949 Grapes, Wine 142
10 – –
MENDOCINO1 Grapes, Wine 72,5582 Pears, Bartlett 10,1693 Cattle and Calves 9,1624 Field Crops 4,7505 Milk, Market 4,1396 Nursery Products 3,7527 Pasture, Forage 3,4448 Livestock Products 2,4009 Fruit and Nut Crops 1,800
10 Pasture, Range 1,661
MERCED1 Milk, All 711,8872 Chickens 299,6853 Almond Meats 292,9954 Cattle and Calves 271,5215 Potatoes, Sweet 91,2136 Tomatoes, All 90,9527 Hay, Alfalfa 89,3158 Eggs, Chicken 75,2799 Cotton, Lint 62,564
10 Silage, Corn 57,098
MODOC1 Hay, Alfalfa 25,4002 Cattle and Calves 22,4403 Potatoes, Irish 14,6484 Vegetable Crops 5,1055 Pasture, Irrigated 4,0006 Pasture, Range 3,0247 Wheat, All 2,9488 Hay, Wild 2,6259 Hay, Grain 2,554
10 Onions 2,443
MONO1 Hay, Alfalfa 6,8642 Stockers and Feeders 5,6003 Steers 4,3564 Heifers 3,4185 Cows 2,2506 Pasture, Irrigated 1,4257 Sheep and Lambs 1,2488 Hay, Other 9249 Garlic, All 415
10 Bulls 244
MONTEREY1 Lettuce, Romaine 416,3292 Strawberries 385,7313 Lettuce, Head 311,8134 Grapes, Wine 254,6155 Lettuce, Leaf 176,2586 Spinach 164,7997 Salad Greens 164,4628 Broccoli 156,1319 Spring Mix 132,277
10 Vegetable Crops 104,958
NAPA1 Grapes, Wine 540,8002 Nursery Products 3,2263 Cattle and Calves 2,2424 Livestock Products 4765 Olives 4146 Strawberries 3317 Pasture, Range 2468 Vegetable Crops 1809 Sheep and Lambs 166
10 Hay, Grain 50
NEVADA1 Heifers and Steers, Fed 2,8152 Pasture, Irrigated 1,8483 Grapes, Wine 1,6864 Pasture, Range 1,0455 Milk Cows 6146 Fruit and Nut Crops 5007 Nursery Products 4018 Sheep and lambs 2219 Livestock 99
10 Livestock Products 85
ORANGE1 Woody Ornamentals 195,4682 Strawberries 43,4523 Plants, Potted 30,6664 Nursery, Fl. Propg. Materials 12,1935 Avocados 7,2606 Peppers, Bell 7,1327 Beans, Fresh 6,0658 Flowers, Cut 7539 Vegetable Crops 644
10 Christmas Trees and Cut Greens 530

California Agricultural Resource Directory 2006 37
County Statistical Data
Leading Commodities for Gross Value of Agricultural Production by County, 2004a
PLACER1 Cattle and Calves 13,2302 Rice, Milling 11,8243 Pasture, Irrigated 2,2504 Pasture, Range 1,8205 Strawberries 6606 Tangerines and Mandarins 6587 Sheep and Lambs 5378 Vegetable Crops 5009 Grapes, Wine 403
10 Hay, Grain 317
PLUMAS1 Stockers and Feeders 116032 Hay, Alfalfa 3,8163 Pasture, Irrigated 2,4504 Hay, Wild 1,2295 Pasture, Forage 1,0406 Beef Cows 4207 Fruit and Nut Crops 2508 Pasture, Range 1959 Hay, Grain 145
10 Livestock 135
RIVERSIDE1 Milk, Market 181,4342 Woody Ornamentals 158,3803 Grapes, Table 100,1044 Peppers, Bell 72,9025 Grapefruit, All 64,0186 Hay, Alfalfa 499,9157 Avocados 45,2338 Eggs, Chicken 43,8919 Lemons, All 41,802
10 Turf 36,615
SACRAMENTO1 Grapes, Wine 108,1372 Milk, Market 51,2103 Nursery Products 36,5444 Pears, Bartlett 19,4495 Cattle and Calves 18,7276 Vegetable Crops 17,2047 Poultry 14,2088 Corn, Grain 11,2159 Livestock 11,066
10 Hay, Alfalfa 9,298
SAN BENITO1 Lettuce, Baby 35,7872 Nursery Stock 33,5533 Vegetable and Row Crops 23,0734 Grapes, Wine 19,9805 Peppers, Bell 19,4856 Cattle 16,5027 Lettuce, Romaine 16,3008 Spinach 14,7839 Onions, Dry 12,331
10 Lettuce, Iceberg 10,835
SAN BERNARDINO1 Milk 342,8972 Eggs 31,0803 Heifers, Replacement 28,4294 Trees and Shrubs 24,7105 Cattle and Calves (Meat) 19,2106 Alfalfa, All 13,6687 Oranges, 11,6038 Indoor Decoratives 7,7689 Bok Choi 6,820
10 Chickens (Meat) 2,923
SAN DIEGO1 Plants, Foliage 311,0502 Woody Ornamentals 287,5863 Avocados 251,4524 Plants, Bedding 215,3665 Flowers, Cut 64,9556 Tomatoes, Fresh 59,7297 Poinsettias, Potted 38,1278 Eggs, Chicken 34,2149 Strawberries, Fresh 22.112
10 Vegetable Crops 21,663
SAN FRANCISCO1 Vegetable Crops 1,3512 Flowers, Cut 5743 – –4 – –5 – –6 – –7 – –8 – –9 – –
10 – –
SAN JOAQUIN1 Milk, All 314,5652 Grapes, All 289,7443 Almond Meats 166,5804 Tomatoes, All 103,5515 Walnuts, English 97,6286 Cherries, All 91,8227 Cattle and Calves 91,0578 Hay, All 69,5699 Woody Ornamentals 61,945
10 Asparagus 59,220
SAN LUIS OBISPO1 Grapes, Wine 194,3732 Cattle and Calves 53,0713 Broccoli 50,0624 Vegetable Transplants 30,1785 Strawberries 29,3676 Flowers, Cut Greenhouse 28,2407 Indoor Decoratives 25,1688 Lettuce, Head 23,1789 Vegetables, Oriental 15,741
10 Lettuce, Leaf 14,755
SAN MATEO1 Nursery Stock, Ornamental 22,5692 Plants, Potted Foliage 15,4463 Orchids, Potted 10,2974 Brussels Sprouts 5,4935 Poinsettia, Potted 3,7966 Lilies, Potted 3,6807 Snapdragons 3,3398 Herbaceous Perennials 2,7179 Lilies, Cut 2,303
10 Cuttings and Liners 1,509
SANTA BARBARA1 Strawberries 202,6172 Grapes, Wine 160,3653 Broccoli 112,6914 Lettuce, Head 59,1915 Caulifl ower 39,2886 Cattle 30,7927 Avocados 29,0188 Celery 27,4549 Lettuce, Leaf 23,976
10 Lemons 19,212
SANTA CLARA1 Nursery Crops 86,2782 Mushrooms 58,0813 Peppers, Bell 9,1424 Flowers, Cut 8,6395 Steers and Heifers 8,3066 Grapes, Wine 7,3007 Lettuce, Leaf 6,0158 Onions, Dry 5,1369 Tomatoes, Fresh 4,514
10 Cherries 4,323
SANTA CRUZ1 Strawberries 128,6722 Raspberries 112,3693 Plants, Landscape 29,2264 Vegetable Crops 18,7255 Lettuce, Leaf 18,7066 Flowers, Indoor Cut 14,3137 Lettuce, Head 14,0878 Plants, Other 13,0809 Berries, Misc. 11,895
10 Apples 9,068
SHASTA1 Stockers and Feeders 12,3282 Plants, Strawberry 9,1463 Hay, Other 7,2404 Beef Cows 3,5135 Pasture, Range 3,4756 Hay, Alfalfa 3,4027 Pasture, Irrigated 3,3008 Rice, Wild 2,8069 Livestock 2,586
10 Nursery Products 2,477
Leading Commodities for Gross Value of Agricultural Production by County, 2005 1 continued

38 California Agricultural Resource Directory 2006
County Statistical Data
Leading Commodities for Gross Value of Agricultural Production by County, 2004aLeading Commodities for Gross Value of Agricultural Production by County, 2005 1 continued
SIERRA1 Stockers and Feeders 3,8172 Pasture, Irrigated 8013 Hay, Alfalfa 7104 Pasture, Forage 4005 Hay, Wild 3746 Beef Cows 1227 Hay, Grain 978 Pasture, Range 729 Fruit and Nut Crops 35
10 Livestock 20
SISKIYOU1 Hay, Alfalfa 37,4302 Plants, Strawberry 37,0583 Heifers and Steers, Fed 16,1604 Pasture, Irrigated 9,3765 Potatoes, Irish 6,4706 Cows 5,4607 Wheat, All 4,4858 Onions 4,4259 Milk, Market 4,416
10 Hay, Other 3,664
SOLANO1 Nursery Stock 50,0182 Cattle and Calves 27,2033 Alfalfa 26,6034 Tomatoes, Processing 19,1125 Walnuts 16,4676 Milk, Market 12,5587 Grapes, Wine 11,7088 Seeds, Sunfl ower 6,8839 Almonds 5,262
10 Sheep and Lambs 4,992
SONOMA1 Grapes, Wine 430,5642 Milk, Market 90,9163 Livestock and Poultry 40,4594 Cattle and Calves 12,0335 Nursery Ornamentals 10,5756 Nursery Production 9,7177 Livestock and Poultry Products 9,1978 Apples, All 6,9299 Vegetable Crops 6,680
10 Plants, Bedding 4,303
STANISLAUS1 Milk, All 546,8482 Almonds 473,0433 Cattle and Calves 196,2534 Chickens, All 161,4805 Walnuts 80,3096 Silage, All 59,9287 Peaches, All 46,2738 Alfalfa 43,9539 Fruits and Nuts, Deciduous 40,760
10 Turkeys, All 38,762
SUTTER1 Rice 98,5202 Walnuts 52,3183 Peaches 27,8834 Plums, Dried 18,9455 Almonds 12,0526 Nursery Products 11,0587 Cattle and Calves 10,2488 Tomatoes 9,3289 Melons 8,411
10 Hay, Alfalfa 5,228
TEHAMA1 Walnuts, English 38,4882 Almonds, All 33,5613 Plums, Dried 16,8624 Olives 12,8055 Milk, Manufacturing 8,7176 Stockers and Feeders 8,5147 Pasture, Range 8,3708 Milk, Market 7,9669 Heifers and Steers, Fed 3,995
10 Fruit and Nut Crops 3,228
TRINITY1 Cattle and Calves 9662 Pasture, Range 7363 Grapes, Wine 2374 Pasture, Irrigated 1785 Fruit and Nut Crops 1006 Hay, Grain 497 Nursery Products 288 Hay, Other 259 Christmas Trees and Cut Greens 1
10 – –
TULARE1 Milk 1,476,0112 Oranges, All 582,6573 Cattle and Calves 514,0174 Grapes 399,9745 Hay and Silage, Alfalfa 144,3046 Grain and Silage, Corn 102,7217 Pistachios 97,1708 Plums 95,5849 Walnuts 94,526
10 Almond Meat and Hulls 90,862
TUOLUMNE1 Livestock 14,1552 Cattle and Calves 6,1973 Pasture, Range 2,7004 Firewood 1,3215 Bees 4206 Fruit and Nut Crops 3077 Sheep and Lambs 1768 Pasture, Irrigated 1689 Hay, Other 142
10 Livestock Products 90
VENTURA1 Strawberries 328,5672 Nursery Stocks 213,6613 Lemons 179,2284 Celery 114,7595 Tomatoes 74,9886 Avocados 54,8037 Raspberries 54,4308 Flowers, Cut 51,7519 Oranges, Valencia 23,248
10 Peppers 23,053
YOLO1 Tomatoes 68,2602 Grapes, Wine 41,9673 Hay, Alfalfa 36,2424 Almonds 30,9765 Rice 28,2486 Walnuts 21,7487 Seed Crops 21,4138 Organic Crops 13,9149 Cattle and Calves 12,412
10 Wheat 7,238
YUBA1 Rice 27,8502 Peaches, Clingstone 22,9883 Walnut 21,6054 Cattle and Calves 12,6545 Milk 9,8186 Plums, Dried 9,3467 Almonds, All 3,9868 Kiwifruit 3,8189 Pasture, All 3,715
10 – –

California Agricultural Resource Directory 2006 39
County Statistical Data
Commodity Rank and Leading Counties by Gross Value of Agricultural Production, 2005 1
Commodity –––– State –––– –––––––––––––––––––– Five Leading Counties by Rank and Percentage of State Total ––––––-––––––––––––––
Rank Value 1 2 3 4 5
Milk and Cream 1 5,341,046 Tulare 27.6 Merced 13.3 Stanislaus 10.2 Kings 8.5 Kern 7.9Grapes, All 2 4,145,551 Fresno 13.4 Napa 13.0 Kern 12.9 Sonoma 10.4 Tulare 9.6Nursery Products 2 3 3,016,241 San Diego 19.3 Orange 7.9 Riverside 7.4 Monterey 7.2 Ventura 7.1Almonds 4 2,869,152 Kern 20.0 Stanislaus 16.5 Fresno 15.8 Merced 10.2 Madera 9.1Cattle and Calves, All 5 2,824,656 Tulare 18.2 Fresno 11.3 Imperial 10.0 Merced 9.6 Kern 7.1Lettuce 6 1,728,375 Monterey 60.0 Imperial 12.0 Fresno 10.4 Santa Barbara 4.8 San Benito 4.3Strawberries 7 1,170,574 Monterey 33.4 Ventura 28.1 Santa Barbara 17.3 Santa Cruz 11.0 Orange 3.7Oranges 8 1,087,910 Tulare 53.6 Kern 24.5 Fresno 14.5 Ventura 2.7 Riverside 1.6Hay, Alfalfa 9 1,050,239 Kern 15.2 Tulare 13.3 Imperial 10.6 Merced 8.5 Fresno 8.2Flowers and Foliage 3 10 775,505 San Diego 52.5 Santa Barbara 12.5 Monterey 7.7 San Luis Obispo 6.9 Ventura 6.7Chickens 11 741,988 Merced 40.4 Stanislaus 21.8 San Bernardino 0.7 San Joaquin 0.5 San Diego 0.1Cotton Lint 12 731,762 Fresno 34.2 Kings 28.6 Kern 15.6 Merced 8.5 Tulare 7.3Pistachios 13 716,962 Kern 43.8 Fresno 18.1 Tulare 13.6 Kings 11.8 Madera 10.6Walnuts, English 14 610,415 San Joaquin 16.0 Tulare 15.5 Stanislaus 13.2 Butte 12.6 Sutter 8.6Tomatoes, Processing 15 588,388 Fresno 41.8 San Joaquin 12.0 Yolo 11.6 Kings 8.4 Colusa 7.3Broccoli 16 529,442 Monterey 40.9 Santa Barbara 21.3 Imperial 11.1 San Luis Obispo 9.5 Fresno 8.6Silage, All 17 487,165 Tulare 29.8 Merced 15.4 Stanislaus 12.3 Kings 11.9 San Joaquin 8.3Peaches, All 18 474,753 Fresno 38.7 Tulare 16.5 Stanislaus 9.7 Kings 7.6 Sutter 5.9Rice (Excl. Seed) 19 467,625 Colusa 26.7 Sutter 19.9 Butte 18.4 Glenn 16.4 Yolo 6.0Avocados 20 398,090 San Diego 63.2 Ventura 13.8 Riverside 11.4 Santa Barbara 7.3 San Luis Obispo 2.0Carrots 21 361,687 Imperial 23.1 Riverside 5.2 Monterey 4.6 – – – –Lemons 22 340,469 Ventura 52.6 Riverside 12.3 Tulare 10.2 Kern 8.3 Santa Barbara 5.6Nectarines 23 295,602 Fresno 58.8 Tulare 29.6 Kings 6.7 Kern 1.4 Madera 0.7Onions 24 290,216 Fresno 47.3 Imperial 17.1 Los Angeles 9.9 Kern 5.8 San Benito 4.2Tomatoes, Fresh Market 25 276,332 Fresno 29.6 Merced 23.9 San Diego 21.6 San Joaquin 11.9 Stanislaus 3.8Celery 26 270,119 Ventura 42.5 Monterey 38.6 Santa Barbara 10.2 San Benito 3.0 San Luis Obispo 2.7Spinach 27 258,282 Monterey 72.9 Imperial 7.7 San Benito 5.7 Riverside 3.6 Ventura 3.0Eggs, Chicken 28 256,650 Merced 30.2 Riverside 17.1 San Diego 13.3 San Bernardino 12.1 Kern 7.2Plums 29 248,879 Fresno 50.1 Tulare 38.4 Kern 5.2 Kings 4.1 Madera 1.2Peppers, Bell 30 237,399 Riverside 30.7 Fresno 14.6 Kern 14.0 Ventura 9.7 San Benito 8.2Caulifl ower 31 195,370 Monterey 47.8 Santa Barbara 20.1 Imperial 9.3 San Luis Obispo 6.1 Riverside 4.0Raspberries 32 194,694 Santa Cruz 57.7 Ventura 28.0 Monterey 13.7 – – – –Cherries 33 182,184 San Joaquin 50.4 Fresno 13.4 Tulare 9.7 Kern 9.1 Stanislaus 8.5Salad Greens, Misc. 34 179,772 Monterey 91.5 Imperial 7.3 – – – – – –Pasture and Range, Other 35 174,148 Merced 7.0 Monterey 6.1 San Luis Obispo 5.9 Stanislaus 5.7 Kern 5.3Cantaloupe 36 168,104 Fresno 68.2 Imperial 19.8 Merced 5.5 Riverside 2.7 Stanislaus 2.0Potatoes (Incl. Seed) 37 161,962 Kern 59.5 San Joaquin 10.4 Modoc 9.0 Imperial 5.7 Riverside 4.6Turkeys 38 158,250 Merced 25.0 Stanislaus 24.5 Fresno 22.8 Kings 13.7 San Joaquin 5.1Mushrooms 39 155,495 Monterey 42.4 Santa Clara 37.4 San Diego 10.6 San Mateo 0.4 – –Garlic 40 136,787 Fresno 87.2 Kern 7.2 Kings 2.9 Mono 0.3 Santa Clara 0.2Wheat (Excl. Seed) 41 133,200 Kern 22.4 Fresno 13.3 Imperial 11.0 Tulare 10.0 Kings 6.7Asparagus 42 128,941 San Joaquin 45.9 Monterey 18.0 Fresno 11.3 Sacramento 5.9 Imperial 5.3Cottonseed 43 124,462 Kings 32.2 Fresno 27.1 Kern 21.0 Merced 7.3 Tulare 7.3Apples 44 111,525 San Joaquin 32.6 Kern 19.5 Santa Cruz 8.1 Fresno 7.9 Stanislaus 7.2Plums, Dried 45 110,978 Sutter 17.1 Tehama 15.2 Glenn 12.9 Fresno 10.1 Tulare 9.1Pasture, Irrigated 46 103,015 Tulare 13.9 Stanislaus 9.4 Siskiyou 9.1 Merced 8.1 Fresno 4.9Potatoes, Sweet 47 96,531 Merced 94.5 Stanislaus 5.5 – – – – – –Corn, Sweet 48 94,875 Fresno 33.5 Imperial 22.5 Contra Costa 15.2 Riverside 9.8 San Joaquin 9.4Tangerines 49 93,929 Kern 44.0 Tulare 42.0 Riverside 8.3 San Diego 2.3 Ventura 1.9Pears 50 92,216 Fresno 32.1 Sacramento 21.1 Lake 14.0 Mendocino 12.7 Tulare 5.8Grapefruit 51 90,778 Riverside 70.5 Tulare 11.1 Kern 8.7 San Diego 4.4 Imperial 4.3Watermelon 52 81,979 Fresno 26.7 San Joaquin 20.7 Kern 17.9 Riverside 14.6 Imperial 9.9Sugar Beets 53 72,828 Imperial 62.6 Fresno 17.9 Kern 9.4 Merced 6.5 Kings 2.3Artichokes 54 70,419 Monterey 77.6 Riverside 8.2 San Benito 2.6 San Mateo 0.8 – –Sheep and Lambs 55 67,326 Fresno 18.2 Kern 13.7 Imperial 12.1 Merced 7.6 Solano 7.4Cabbage 56 65,914 Monterey 38.5 Ventura 17.4 San Luis Obispo 11.1 Imperial 10.0 Santa Barbara 9.8Hay, Grain 57 65,717 Kern 16.0 Merced 15.2 Stanislaus 13.0 Solano 4.3 San Luis Obispo 4.0Olives 58 63,735 Tulare 51.3 Tehama 20.1 Glenn 11.5 Madera 8.4 Fresno 3.3Corn for Grain 59 60,749 San Joaquin 39.7 Sacramento 18.5 Glenn 8.7 Merced 6.6 Solano 5.2Beans, Dry 60 59,769 Stanislaus 20.0 Fresno 10.6 San Joaquin 8.3 Sutter 7.7 Colusa 6.4Vegetable and Vinecrop Seeds 61 57,972 Colusa 36.9 Fresno 10.4 Sutter 8.4 Yolo 8.1 Imperial 6.5Dates 62 51,921 Riverside 66.1 Imperial 33.9 – – – – – –Apricots 63 50,761 Stanislaus 33.2 Fresno 25.9 Kern 12.8 San Joaquin 7.3 Kings 6.8Hay, Sudan 64 47,580 Imperial 74.5 Solano 8.9 Tulare 6.1 Merced 3.2 Stanislaus 2.3Honeydew 65 43,701 Fresno 35.4 Riverside 22.4 Sutter 19.0 Imperial 8.4 Yolo 8.1Kiwifruit 66 40,592 Tulare 58.1 Butte 16.6 Yuba 9.4 Fresno 6.9 Kern 4.5Hogs and Pigs 67 38,237 Tulare 66.7 Fresno 19.4 Stanislaus 6.3 Sacramento 1.2 San Bernardino 1.0Honey 68 35,295 Tulare 52.2 Kern 11.9 Merced 7.6 Fresno 6.5 San Diego 6.0Blueberries 69 33,881 San Joaquin 8.4 – – – – – – – –Peas, Green 70 26,939 Monterey 94.7 San Mateo 2.7 – – – – – –

40 California Agricultural Resource Directory 2006
excellent, 45 percent fair, and only 2 percent rated poorly. Price of Upland cotton was $0.60 per pound, up 16 percent from 2004, but 19 percent lower than 2003. Planted acreage signifi cantly decreased 23 percent. The production decline caused the total value of Upland cotton to drop to $306.7 million from $443.3 million in 2004 and $534.6 million in 2003. California growers planted 229,000 acres of American Pima cotton, up 15,000 from 2004. The price of American Pima cotton also increased 35 percent to $1.19 per pound, generating $318.7 million. Rice is one of the major fi eld crops in California with 528,000 acres planted in 2005. Medium-grain rice contributed about 90 percent of the total rice production and acreage. Rice planting was pushed back a week behind normal due to rainfall. Both long-grain and short-grain rice experienced lower yields, but slightly higher production. Medium-grain rice had 465,000 acres successfully planted. Along with a 14 percent decline in yield, medium-grain rice production decreased 26 percent to slightly less than 35,000 thousand hundredweight (cwt). Due to supply defi ciencies, the overall price jumped 43 percent from 2004, pushing an increase in production value.
California fi eld crops experienced less than ideal weather in 2005. Many crops were damaged by excessive amounts of rain in the spring and heat waves in the summer. Beans and hay experienced slight increases in value, whereas oats and wheat values were considerably lower than 2004. California is the leading state in alfalfa hay production and consumption. In 2005, California produced 6.9 million tons of alfalfa hay, generating $952.2 million, the highest value among all Golden State fi eld crops. A series of storms brought heavy rains to California during the fall planting season. Some areas recorded record high March precipitation. Rainfall not only delayed planting and harvesting activities, but also potentially lowered alfalfa hay quality. Production dropped 6 percent from 2004, but the 17 percent price per ton increase made up the loss in production and pushed a 9.8 percent increase in production value. Other hay recorded a slight increase in yield and price, and values increased 11 percent to $198.4 million. Snowfall in the Sierra Nevada provided suffi cient irrigation water for crops. However, heavy rains and below normal soil temperatures delayed cotton planting through early May. As warm and dry weather returned later in May, crop planting progressed more rapidly. By mid-June, crop condition was rated 53 percent good-to-
FieldCrops
photo by Ed Williams/San Joaquin Co.

California Agricultural Resource Directory 2006 41
Field Crops
It was a good year for dry edible bean production. All major beans, except blackeye, leapt in production. Lima beans increased 29 percent from 2004. Chickpeas almost doubled its production. All dry beans generated $56 million in value, up 32 percent from 2004, the second highest percentage increase among major fi eld crops. Despite the good signs in 2005, there has been a declining trend in overall bean production. Wheat production took a heavy hit from the unstable weather in 2005. A total of 570,000 acres was planted and 369,000 were harvested; both numbers are the lowest in the past 10 years. Overall, production declined 22 percent and value dropped 23 percent. Winter wheat declined in acreage and yield but increased in price, leaving total production value down 21 percent from 2004. Durum wheat production was down 27 percent to 196,650 tons. Price of durum wheat did not increase because of lower supply; on the contrary, it declined 8 percent. As a result, value was slashed 33 percent from 2004. Sweet potatoes generated $103.5 million of value, a 29 percent increase from 2004.
Notable Increases in Value:Beans, All Dry Edible ................................32%Corn for Silage ..........................................22%Hay, All ......................................................10%Potatoes, Sweet ..........................................Potatoes, Sweet ..........................................Potatoes, Sweet 29%Rice, All .......................................................9%
Signifi cant Decreases in Value:Corn for Grain ..........................................25%Cottonseed .................................................37%Oats ............................................................54%Wheat, All ..................................................23%

42 California Agricultural Resource Directory 2006
Field Crops
Field Crop Acreage, Production and Value, 1996–2005
Crop Crop Year Planted Harvested Yield Per Acre Production Value Per Unit Total Value
BARLEY 1 Acres Acres Tons Tons $/Ton $1,0001996 250,000 190,000 1.44 273,600 153.75 42,0661997 230,000 150,000 1.37 205,200 114.58 23,5131998 170,000 125,000 1.44 180,000 97.08 17,4751999 140,000 100,000 1.54 153,600 97.50 14,9762000 130,000 95,000 1.63 155,040 98.75 15,3102001 160,000 110,000 1.27 139,920 98.33 13,7592002 130,000 75,000 1.70 127,800 103.75 13,2592003 100,000 58,000 1.54 89,088 115.42 10,2822004 110,000 75,000 1.44 108,000 110.42 11,9252005 100,000 60,000 1.51 90,720 109.58 9,941
BEANS, BLACKEYE DRY 2,3 Acres Acres Pounds Cwt. $/Cwt. $1,0001996 24,000 23,000 2,220 511,000 – –1997 30,000 29,000 2,400 695,000 – –1998 33,000 31,000 1,840 570,000 – –1999 39,500 38,500 2,010 775,000 – –2000 15,300 15,300 2,160 330,000 – –2001 12,000 12,000 2,420 290,000 – –2002 12,600 12,400 2,520 313,000 – –2003 16,500 16,100 2,450 395,000 – –2004 10,500 10,300 2,490 256,000 – –2005 9,000 8,900 2,210 197,000 – –
BEANS, GARBANZO DRY 2,3 Acres Acres Pounds Cwt. $/Cwt. $1,0001996 25,000 23,000 1,530 352,000 – –1997 9,000 9,000 1,670 150,000 – –1998 5,000 5,000 1,600 80,000 – –1999 16,500 16,500 1,730 285,000 – –2000 24,500 23,500 1,460 343,000 – –2001 29,000 27,000 1,270 342,000 – –2002 18,500 18,000 1,600 288,000 – –2003 9,700 9,400 900 85,000 – –2004 6,100 5,800 1,980 115,000 – –2005 10,000 9,700 2,370 230,000 – –
BEANS, DARK RED KIDNEY DRY 2,3 Acres Acres Pounds Cwt. $/Cwt. $1,0001996 5,000 5,000 1,640 82,000 – –1997 5,000 5,000 1,800 90,000 – –1998 5,500 5,500 850 47,000 – –1999 3,500 3,500 1,310 46,000 – –2000 6,000 6,000 1,370 82,000 – –2001 2,500 2,500 1,600 40,000 – –2002 2,500 2,500 1,640 41,000 – –2003 900 900 1,780 16,000 – –2004 1,200 1,100 1,820 20,000 – –2005 1,200 1,200 1,830 22,000 – –
BEANS, LIGHT RED KIDNEY DRY 2,3 Acres Acres Pounds Cwt. $/Cwt. $1,0001996 10,000 10,000 1,870 187,000 – –1997 10,000 10,000 1,980 198,000 – –1998 9,500 8,500 1,380 117,000 – –1999 8,000 8,000 1,510 121,000 – –2000 11,000 11,000 1,480 163,000 – –2001 6,200 6,200 1,450 90,000 – –2002 6,000 6,000 1,270 76,000 – –2003 5,000 4,900 1,390 68,000 – –2004 4,600 4,000 1,080 43,000 – –2005 3,500 3,500 1,630 57,000 – –
BEANS, BABY LIMA DRY 2,3 Acres Acres Pounds Cwt. $/Cwt. $1,0001996 24,000 23,000 2,250 517,000 – –1997 37,000 36,000 2,510 902,000 – –1998 13,000 12,000 1,700 204,000 – –1999 27,000 26,000 2,380 620,000 – –2000 24,500 23,500 2,310 542,000 – –2001 12,200 11,500 2,040 235,000 – –2002 21,500 21,000 2,390 501,000 – –2003 14,500 14,100 2,300 325,000 – –2004 11,300 10,900 2,450 267,000 – –2005 16,700 16,400 2,370 389,000 – –

California Agricultural Resource Directory 2006 43
Field Crops
Field Crop Acreage, Production and Value, 1996–2005
Crop Crop Year Planted Harvested Yield Per Acre Production Value Per Unit Total Value
BEANS, LARGE LIMA DRY 2,3 Acres Acres Pounds Cwt. $/Cwt. $1,0001996 21,000 20,000 1,970 394,000 – –1997 30,000 29,000 2,480 718,000 – –1998 26,000 25,000 1,250 312,000 – –1999 25,000 24,000 1,800 433,000 – –2000 20,500 19,500 2,240 437,000 – –2001 14,800 14,500 2,250 326,000 – –2002 19,000 18,200 1,840 334,000 – –2003 19,600 19,000 1,940 369,000 – –2004 15,100 14,600 2,100 307,000 – –2005 15,100 15,000 2,350 352,000 – –
BEANS, PINK DRY 2,3 Acres Acres Pounds Cwt. $/Cwt. $1,0001996 8,000 8,000 1,560 125,000 – –1997 4,000 4,000 1,550 62,000 – –1998 5,500 5,500 1,070 59,000 – –1999 2,000 2,000 1,150 23,000 – –2000 700 700 860 6,000 – –2001 – – – – – –2002 – – – – – –2003 900 900 1,000 9,000 – –2004 300 300 1,330 4,000 – –2005 300 300 1,000 3,000 – –
BEANS, OTHER DRY 2,3,4 Acres Acres Pounds Cwt. $/Cwt. $1,0001996 11,000 11,000 1,430 157,000 – –1997 6,000 6,000 1,920 115,000 – –1998 7,500 7,500 1,270 95,000 – –1999 10,000 10,000 1,180 118,000 – –2000 8,000 8,000 1,430 114,000 – –2001 9,800 9,800 1,460 143,000 – –2002 10,200 9,200 2,020 186,000 – –2003 7,500 7,300 1,030 75,000 – –2004 8,000 7,700 1,390 107,000 – –2005 8,700 8,500 1,350 115,000 – –
BEANS, ALL DRY EDIBLE 4 Acres Acres Pounds Cwt. $/Cwt. $1,0001996 128,000 123,000 1,890 2,325,000 38.50 89,5131997 135,000 132,000 2,270 3,000,000 29.40 88,2001998 110,000 105,000 1,480 1,554,000 36.10 56,0991999 135,000 132,000 1,860 2,455,000 27.00 66,2852000 115,000 112,000 1,840 2,059,000 26.80 55,1812001 88,000 85,000 1,760 1,496,000 31.20 46,6752002 92,000 89,000 1,980 1,762,000 33.30 58,6752003 77,000 75,000 1,840 1,380,000 35.30 48,7142004 60,000 57,000 2,020 1,152,000 36.90 42,5092005 66,000 65,000 2,130 1,385,000 40.40 55,954
CORN FOR GRAIN 5 Acres Acres Tons Tons $/Ton $1,0001996 500,000 220,000 4.48 985,600 120.36 118,6241997 585,000 265,000 4.76 1,261,400 108.93 137,4031998 600,000 245,000 4.48 1,097,600 95.00 104,2721999 525,000 185,000 4.76 880,600 89.29 78,6252000 540,000 205,000 4.76 975,800 87.14 85,0342001 480,000 160,000 4.76 761,600 87.50 66,6402002 545,000 150,000 4.76 714,000 97.50 69,6152003 530,000 140,000 4.48 627,200 103.57 64,9602004 540,000 150,000 4.90 735,000 94.64 69,5632005 540,000 110,000 4.82 529,760 98.21 52,030
CORN FOR SILAGE 3 Acres Acres Tons Tons $/Ton $1,0001996 – 275,000 25.00 6,875,000 21.78 149,7381997 – 315,000 26.00 8,190,000 21.04 172,3181998 – 350,000 25.00 8,750,000 20.09 175,7881999 – 335,000 26.00 8,710,000 18.30 159,3932000 – 330,000 26.00 8,580,000 17.09 161,3902001 – 315,000 26.00 8,190,000 21.75 178,1332002 – 390,000 26.00 10,140,000 21.91 222,1672003 – 385,000 26.00 10,010,000 21.70 217,2172004 – 385,000 26.00 10,010,000 24.31 243,3432005 – 425,000 26.00 11,050,000 26.85 296,693
Field Crop Acreage, Production and Value, 1996–2005 continued

44 California Agricultural Resource Directory 2006
Field Crops
Field Crop Acreage, Production and Value, 1996–2005
Crop Crop Year Planted Harvested Yield Per Acre Production Value Per Unit Total Value
COTTON, AMERICAN-PIMA 6 Acres Acres Pounds Bales ¢/Lb. $1,0001996 165,000 164,000 1,098 375,000 107.0 192,6001997 185,000 184,000 1,141 437,200 102.0 214,0531998 200,000 180,000 941 352,800 92.3 156,3051999 240,000 239,000 1,210 602,700 85.1 246,1912000 145,000 144,000 1,154 346,300 101.0 167,8862001 240,000 239,000 1,283 639,000 85.6 262,5522002 210,000 209,000 1,386 603,300 86.0 249,0422003 150,000 149,000 1,194 370,500 123.0 218,7432004 215,000 214,000 1,532 683,000 88.2 289,1552005 230,000 229,000 1,170 558,000 119.0 318,730
COTTON, UPLAND 6 Acres Acres Pounds Bales ¢/Lb. $1,0001996 1,000,000 995,000 1,153 2,390,000 76.5 877,6081997 880,000 875,000 1,202 2,191,000 73.2 769,8301998 650,000 620,000 887 1,146,000 67.8 372,9541999 610,000 605,000 1,254 1,580,000 56.2 426,2212000 775,000 770,000 1,378 2,210,000 52.0 551,6162001 630,000 625,000 1,359 1,770,000 41.6 353,4342002 480,000 477,000 1,469 1,460,000 57.3 401,5582003 550,000 545,000 1,317 1,495,000 74.5 534,6122004 560,000 557,000 1,543 1,790,000 51.6 443,3472005 430,000 428,000 1,194 1,065,000 60.0 306,720
COTTON, ALL 6 Acres Acres Pounds Bales ¢/Lb. $1,0001996 1,165,000 1,159,000 1,145 2,765,000 80.6 1,070,2081997 1,065,000 1,059,000 1,191 2,628,200 78.0 983,8831998 850,000 800,000 899 1,498,800 73.6 529,2591999 850,000 844,000 1,241 2,182,700 64.2 672,4122000 920,000 914,000 1,342 2,556,300 58.6 719,5022001 870,000 864,000 1,338 2,409,000 53.3 615,9862002 690,000 686,000 1,444 2,063,300 65.7 650,6002003 700,000 694,000 1,290 1,865,500 84.1 753,3552004 775,000 771,000 1,540 2,473,000 61.7 732,5022005 660,000 657,000 1,186 1,623,000 80.3 625,450
COTTONSEED 3 Acres Acres Tons Tons $/Ton $1,0001996 – – – 1,020,000 176.00 179,5201997 – – – 942,000 174.00 163,9081998 – – – 544,000 177.00 96,2881999 – – – 799,000 137.00 109,4632000 – – – 909,000 139.00 126,3512001 – – – 849,000 142.00 120,5582002 – – – 731,000 138.00 100,8782003 – – – 680,000 152.00 103,3602004 – – – 902,000 150.00 135,3002005 – – – 594,000 146.00 86,724
FORAGE, ALFALFA 3,7,8 Acres Acres Tons Tons $/Ton $1,0002005 – 1,010,000 7.19 7,262,000 – –
FORAGE, ALL 3,7,9 Acres Acres Tons Tons $/Ton $1,0002005 – 1,715,000 6.01 10,308,000 – –
HAY, ALFALFA 3 Acres Acres Tons Tons $/Ton $1,0001996 – 940,000 7.00 6,580,000 110.00 723,8001997 – 950,000 7.20 6,840,000 119.00 813,9601998 – 1,050,000 6.60 6,930,000 98.00 679,1401999 – 1,050,000 6.90 7,245,000 90.00 652,0502000 – 1,020,000 7.00 7,140,000 92.00 656,8802001 – 1,010,000 7.00 7,070,000 119.00 841,3302002 – 1,160,000 6.90 8,004,000 98.00 784,3902003 – 1,090,000 7.00 7,630,000 93.00 709,5902004 – 1,050,000 7.00 7,350,000 118.00 867,3002005 – 1,000,000 6.90 6,900,000 136.00 938,400
HAY, OTHER 3 Acres Acres Tons Tons $/Ton $1,0001996 – 510,000 2.80 1,428,000 82.00 117,0961997 – 560,000 2.80 1,568,000 98.00 153,6641998 – 580,000 2.80 1,624,000 68.00 110,4321999 – 530,000 2.90 1,537,000 75.00 115,2752000 – 520,000 2.80 1,456,000 78.50 114,296
Field Crop Acreage, Production and Value, 1996–2005 continued

California Agricultural Resource Directory 2006 45
Field Crops
Field Crop Acreage, Production and Value, 1996–2005
Crop Crop Year Planted Harvested Yield Per Acre Production Value Per Unit Total Value
HAY, OTHER 3 (CONTINUED) Acres Acres Tons Tons $/Ton $1,0002001 – 550,000 3.10 1,705,000 93.50 159,4182002 – 590,000 3.00 1,770,000 79.50 140,7152003 – 530,000 3.50 1,855,000 77.00 142,8352004 – 550,000 3.40 1,870,000 95.50 178,5852005 – 550,000 3.70 2,035,000 99.50 202,483
HAY, ALL 3,10 Acres Acres Tons Tons $/Ton $1,0001996 – 1,450,000 5.52 8,008,000 108.00 840,8961997 – 1,510,000 5.57 8,408,000 117.00 967,6241998 – 1,630,000 5.25 8,554,000 96.00 789,5721999 – 1,580,000 5.56 8,782,000 89.00 767,3252000 – 1,540,000 5.58 8,596,000 90.50 771,1762001 – 1,560,000 5.63 8,775,000 115.00 1,000,7482002 – 1,750,000 5.59 9,774,000 95.50 925,1072003 – 1,620,000 5.85 9,485,000 90.50 852,4252004 – 1,600,000 5.76 9,220,000 115.00 1,045,8852005 – 1,550,000 5.76 8,935,000 128.00 1,140,883
HAYLAGE AND GREENCHOP, ALFALFA 3,7,11 Acres Acres Tons Tons $/Ton $1,0002005 – 95,000 7.70 732,000 – –
HAYLAGE AND GREENCHOP, ALL 3,7,12 Acres Acres Tons Tons $/Ton $1,0002005 – 260,000 10.68 2,778,000 – –
OATS 1 Acres Acres Tons Tons $/Ton $1,0001996 300,000 30,000 1.20 36,000 138.75 4,9951997 350,000 30,000 1.28 38,400 123.75 4,7521998 320,000 30,000 1.20 36,000 85.00 3,0601999 275,000 25,000 1.36 34,000 93.75 3,1882000 220,000 25,000 1.20 30,000 96.88 2,9062001 260,000 25,000 0.96 24,000 140.63 3,3752002 260,000 32,000 1.31 41,984 181.25 7,6102003 260,000 35,000 1.28 44,800 125.00 5,6002004 240,000 25,000 1.36 34,000 125.00 4,2502005 270,000 20,000 1.20 24,000 81.25 1,950
POTATOES, WINTER Acres Acres Cwt. Cwt. $/Cwt. $1,0001996 5,700 5,700 250 1,425,000 21.10 30,0681997 6,600 6,600 235 1,551,000 18.10 28,0731998 7,000 7,000 220 1,540,000 22.40 34,4961999 8,500 8,500 260 2,210,000 22.60 49,9462000 9,000 9,000 320 2,880,000 17.00 48,9602001 9,000 9,000 310 2,790,000 19.70 54,9632002 9,000 9,000 270 2,430,000 24.00 58,3202003 8,500 8,500 310 2,635,000 26.70 70,3552004 13,000 13,000 250 3,250,000 22.70 73,7752005 14,000 14,000 250 3,500,000 19.10 66,850
POTATOES, SPRING Acres Acres Cwt. Cwt. $/Cwt. $1,0001996 20,100 20,100 375 7,538,000 13.00 97,9941997 20,700 20,700 390 8,073,000 9.85 79,5191998 18,500 18,500 335 6,198,000 10.50 65,0791999 19,000 19,000 400 7,600,000 10.50 79,8002000 18,800 18,800 395 7,426,000 12.20 90,5972001 15,500 15,500 390 6,045,000 12.40 74,9582002 19,000 19,000 405 7,695,000 19.80 152,3612003 19,000 19,000 440 8,360,000 12.60 105,3362004 17,500 17,500 475 8,313,000 13.40 111,3942005 15,100 15,100 405 6,116,000 13.00 79,508
POTATOES, SUMMER Acres Acres Cwt. Cwt. $/Cwt. $1,0001996 5,800 5,800 360 2,088,000 14.60 30,4851997 5,900 5,900 360 2,124,000 14.50 30,7981998 6,200 6,100 355 2,166,000 11.90 25,7751999 6,700 6,700 360 2,412,000 12.80 30,8742000 7,500 7,500 355 2,663,000 18.10 48,2002001 8,000 8,000 355 2,840,000 15.40 43,7362002 7,300 7,300 360 2,628,000 19.10 50,1952003 7,500 7,200 385 2,772,000 16.40 45,4612004 7,000 7,000 350 2,450,000 14.50 35,5252005 6,200 6,200 355 2,201,000 14.40 31,694
Field Crop Acreage, Production and Value, 1996–2005 continued

46 California Agricultural Resource Directory 2006
Field Crops
Field Crop Acreage, Production and Value, 1996–2005
Crop Crop Year Planted Harvested Yield Per Acre Production Value Per Unit Total Value
POTATOES, FALL Acres Acres Cwt. Cwt. $/Cwt. $1,0001996 11,500 11,500 400 4,600,000 4.80 22,0801997 10,500 10,500 400 4,200,000 8.10 34,0201998 10,300 10,300 360 3,708,000 8.40 31,1471999 9,000 9,000 445 4,005,000 7.35 29,4372000 8,700 8,700 430 3,741,000 5.80 21,6982001 3,400 3,400 445 1,513,000 8.25 12,4822002 8,300 8,300 520 4,316,000 8.45 36,4702003 8,300 8,300 425 3,528,000 9.20 32,4582004 7,600 7,600 480 3,648,000 7.95 29,0022005 7,600 7,600 435 3,306,000 7.35 24,299
POTATOES, ALL Acres Acres Cwt. Cwt. $/Cwt. $1,000(EXCLUDING 1996 43,100 43,100 363 15,651,000 11.70 180,627 SWEET) 1997 43,700 43,700 365 15,948,000 10.90 172,410
1998 42,000 41,900 325 13,612,000 11.60 156,4971999 43,200 43,200 376 16,227,000 11.80 190,0572000 44,000 44,000 380 16,710,000 12.50 209,4552001 35,900 35,900 367 13,188,000 14.20 186,1392002 43,600 43,600 391 17,069,000 17.50 297,3462003 43,300 43,000 402 17,295,000 14.80 253,6102004 45,100 45,100 392 17,661,000 14.30 249,6962005 42,900 42,900 353 15,123,000 13.50 202,351
POTATOES, SWEET Acres Acres Cwt. Cwt. $/Cwt. $1,0001996 9,600 9,600 225 2,160,000 26.10 56,3761997 9,700 9,700 205 1,989,000 28.00 55,6921998 9,700 9,700 220 2,134,000 25.80 55,0571999 10,000 10,000 240 2,400,000 28.80 69,1202000 10,500 10,500 250 2,625,000 24.10 63,2632001 10,000 10,000 230 2,300,000 26.90 61,8702002 10,400 10,400 280 2,912,000 23.10 67,2672003 10,700 10,700 300 3,210,000 25.20 80,8922004 11,500 11,500 280 3,220,000 25.00 80,5002005 11,700 11,700 300 3,510,000 29.50 103,545
RICE, LONG 3 Acres Acres Cwt. Cwt. $/Cwt. $1,0001996 5,000 5,000 72.00 360,000 – –1997 9,000 9,000 77.00 693,000 – –1998 9,000 9,000 59.70 537,000 – –1999 5,000 5,000 68.00 340,000 – –2000 9,000 9,000 71.00 639,000 – –2001 13,000 13,000 77.00 1,001,000 – –2002 7,000 7,000 64.00 448,000 – –2003 7,000 7,000 69.00 483,000 – –2004 7,000 7,000 73.00 511,000 – –2005 9,000 9,000 71.00 639,000 – –
RICE, MEDIUM 3 Acres Acres Cwt. Cwt. $/Cwt. $1,0001996 484,000 482,000 75.00 36,150,000 – –1997 493,000 491,000 82.60 40,557,000 – –1998 420,000 418,000 69.90 29,218,000 – –1999 455,000 450,000 73.00 32,850,000 – –2000 507,000 505,000 80.00 40,400,000 – –2001 435,000 433,000 83.00 35,939,000 – –2002 500,000 495,000 83.00 41,085,000 – –2003 460,000 458,000 78.40 35,907,000 – –2004 540,000 535,000 88.00 47,080,000 – –2005 465,000 463,000 75.50 34,957,000 – –
RICE, SHORT 3,13 Acres Acres Cwt. Cwt. $/Cwt. $1,0001996 13,000 13,000 73.00 949,000 – –1997 16,000 16,000 81.00 1,296,000 – –1998 31,000 31,000 52.60 1,631,000 – –1999 50,000 50,000 70.00 3,500,000 – –2000 34,000 34,000 73.00 2,482,000 – –2001 25,000 25,000 62.00 1,550,000 – –2002 26,000 26,000 56.00 1,456,000 – –2003 42,000 42,000 63.00 2,646,000 – –2004 48,000 48,000 66.00 3,168,000 – –2005 54,000 54,000 60.00 3,240,000 – –
Field Crop Acreage, Production and Value, 1996–2005 continued

California Agricultural Resource Directory 2006 47
Field Crops
Field Crop Acreage, Production and Value, 1996–2005
Crop Crop Year Planted Harvested Yield Per Acre Production Value Per Unit Total Value
RICE, ALL 13,14 Acres Acres Cwt. Cwt. $/Cwt. $1,0001996 502,000 500,000 74.90 37,459,000 7.91 296,3011997 518,000 516,000 82.50 42,546,000 7.95 338,2411998 460,000 458,000 68.50 31,386,000 9.19 288,4371999 510,000 505,000 72.70 36,690,000 6.97 255,7292000 550,000 548,000 79.40 43,521,000 4.99 217,1702001 473,000 471,000 81.70 38,490,000 5.28 203,2272002 533,000 528,000 81.40 42,989,000 6.32 271,6902003 509,000 507,000 77.00 39,036,000 10.40 405,9742004 595,000 590,000 86.00 50,759,000 7.34 372,5712005 528,000 526,000 73.80 38,836,000 10.50 407,778
SAFFLOWER 7 Acres Acres Pounds Cwt. $/Cwt. $1,0002005 51,000 50,000 2,000 1,000,000 11.30 11,300
SORGHUM FOR GRAIN 5,15 Acres Acres Tons Tons $/Ton $1,0002000 12,000 8,000 2.10 16,800 82.20 1,3812001 10,000 7,000 2.52 17,600 87.60 1,5452002 17,000 11,000 2.24 24,600 92.80 2,2872003 18,000 10,000 2.52 25,200 93.00 2,3442004 28,000 12,000 2.52 30,240 84.00 2,5402005 26,000 10,000 2.52 25,200 76.00 1,915
SORGHUM FOR SILAGE 3,15 Acres Acres Tons Tons $/Ton $1,0002000 – 4,000 15.00 60,000 – –2001 – 3,000 20.00 60,000 – –2002 – 6,000 17.00 102,000 – –2003 – 8,000 18.00 144,000 – –2004 – 16,000 15.00 240,000 – –2005 – 16,000 18.00 288,000 – –
SUGAR BEETS 16 Acres Acres Tons Tons $/Ton $1,0001996 84,000 82,000 29.50 2,419,000 43.00 104,0171997 101,000 99,000 30.00 2,970,000 40.60 120,5821998 101,000 99,000 27.50 2,723,000 39.80 108,3751999 110,000 108,000 32.00 3,456,000 36.80 127,1812000 98,000 92,500 34.00 3,145,000 30.40 95,6082001 46,600 44,700 35.70 1,596,000 33.40 53,3062002 50,200 49,500 39.60 1,960,000 39.40 77,2242003 50,800 50,100 39.10 1,959,000 39.50 77,3812004 49,100 48,900 40.80 1,995,000 37.90 75,6112005 44,400 44,100 38.90 1,715,000 37.90 64,999
WHEAT, WINTER 1 Acres Acres Tons Tons $/Ton $1,000(EXCLUDING DURUM) 1996 640,000 550,000 2.07 1,138,500 163.33 185,955
1997 510,000 400,000 2.10 840,000 123.67 103,8801998 500,000 380,000 1.80 684,000 98.67 67,4881999 500,000 370,000 2.34 865,800 91.67 79,3652000 535,000 390,000 2.10 819,000 89.00 72,8912001 530,000 380,000 2.10 798,000 97.67 77,9382002 530,000 300,000 2.28 684,000 115.67 79,1162003 740,000 410,000 1.83 750,300 114.00 85,5342004 560,000 320,000 2.55 816,000 118.00 96,2282005 495,000 300,000 2.16 648,000 120.33 77,976
WHEAT, DURUM Acres Acres Tons Tons $/Ton $1,0001996 140,000 138,000 3.00 414,000 171.33 70,9321997 145,000 144,000 2.85 410,400 142.67 58,5501998 180,000 175,000 2.70 472,500 127.67 60,3231999 90,000 85,000 3.15 267,800 123.33 33,0232000 100,000 97,000 3.00 291,000 106.33 30,9432001 85,000 81,000 3.15 255,200 128.97 32,9142002 95,000 90,000 3.00 270,000 132.00 35,6402003 130,000 115,000 3.00 345,000 150.33 51,8652004 120,000 100,000 2.70 270,000 145.67 39,3302005 75,000 69,000 2.85 196,650 134.67 26,482
Field Crop Acreage, Production and Value, 1996–2005 continued

48 California Agricultural Resource Directory 2006
Field Crops
Field Crop Monthly Average Prices Received, 1996–2005
Crop Crop Year Jan. Feb. Mar. April May June July Aug. Sept. Oct. Nov. Dec.
BARLEY 1 $/Ton1996 137.00 164.00 173.00 168.00 167.00 172.00 160.00 157.00 143.00 – 127.00 –1997 128.00 – 126.00 – 128.00 121.00 – 121.00 – – – –1998 118.00 117.00 115.00 – – – 101.00 – – – – –1999 – – – – 89.00 88.00 95.00 93.00 98.00 90.00 105.00 –2000 93.80 102.00 103.00 99.00 101.00 103.00 101.00 96.00 – – – –2001 – – – – – 100.00 94.00 91.00 91.00 101.00 – 95.002002 – – – – – – – – – – – –2003 – – – – – 117.00 113.00 110.00 – 126.00 – –2004 – – – – – 115.00 118.00 – – – – –2005 – – – – – – – 95.00 – – – –
BEANS, DRY EDIBLE 1 $/Cwt.1996 34.10 34.60 34.30 34.70 35.30 36.20 36.30 36.90 37.20 36.10 37.70 38.701997 38.90 39.60 39.50 39.40 39.60 38.70 39.10 37.80 31.10 30.00 29.70 29.601998 29.10 28.60 28.10 28.60 27.80 28.60 30.40 31.20 31.20 31.30 31.90 37.801999 39.40 39.80 39.40 38.90 37.60 36.20 36.20 34.50 29.30 27.60 27.20 27.602000 27.10 26.80 26.70 27.00 26.40 26.60 26.00 25.80 27.20 27.10 27.20 26.602001 26.90 26.90 26.60 26.80 26.80 26.30 26.30 27.00 27.20 28.60 31.50 31.202002 31.80 31.60 32.70 32.20 32.30 31.90 32.40 33.40 32.50 31.70 31.60 32.602003 32.50 32.60 36.30 35.00 35.40 35.70 34.20 29.60 32.00 41.10 35.20 35.602004 35.00 32.50 36.30 34.80 31.10 34.50 35.80 36.30 35.80 38.70 36.80 38.402005 40.70 37.00 37.20 37.90 35.50 39.80 35.10 – – 37.80 46.40 44.80
COTTON LINT, UPLAND 1 ¢/Lb.1996 84.70 83.80 85.20 86.30 80.60 82.10 80.00 77.00 77.60 75.60 77.00 77.501997 76.60 77.60 77.40 73.70 75.50 74.50 74.30 68.40 – 76.90 74.70 69.701998 73.40 71.30 71.30 68.60 71.50 77.50 – 71.80 68.80 69.70 73.70 73.301999 68.40 58.50 56.50 56.40 – 55.20 49.70 51.40 – 55.20 52.90 58.202000 – 57.90 – – 58.70 – – – 66.10 64.90 69.00 68.202001 57.80 57.40 – 39.60 39.70 36.50 37.10 – 47.90 – 35.10 53.302002 39.40 – – – – – – – – 51.80 55.60 –2003 – 58.40 59.10 – – – – – 68.60 78.20 76.10 75.002004 69.60 72.60 70.30 68.20 – – – – – – 53.50 51.502005 51.10 49.80 – – 51.70 – – – 54.60 60.60 57.30 67.90
Field Crop Acreage, Production and Value, 1996–2005
Crop Crop Year Planted Harvested Yield Per Acre Production Value Per Unit Total Value
WHEAT, ALL 1 Acres Acres Tons Tons $/Ton $1,0001996 780,000 688,000 2.26 1,552,500 165.47 256,8871997 655,000 544,000 2.30 1,250,400 127.33 162,4301998 680,000 555,000 2.09 1,156,500 100.67 127,8111999 590,000 455,000 2.49 1,133,600 94.67 112,3882000 635,000 487,000 2.28 1,110,000 94.00 103,8342001 615,000 461,000 2.28 1,053,200 103.67 110,8522002 625,000 390,000 2.45 954,000 120.33 114,7562003 870,000 525,000 2.09 1,095,300 118.00 137,3992004 680,000 420,000 2.59 1,086,000 126.67 135,6182005 570,000 369,000 2.29 844,650 124.67 104,458
1 Area planted includes preceding fall. 2 Production is on a clean basis. 3 Missing data has not been published due to the estimate being discontinued, not estimated, or not available. 4 Includes varieties not listed separately. Excludes beans grown for garden seed. 5 Planted acreage is for all purposes. 6 Cotton bales are 480 lbs. net-weight. 7 Estimates began in 2005. 8 All alfalfa forage production is the sum of alfalfa harvested as dry hay and alfalfa haylage and greenchop production after converting it to a dry equivalent basis. 9 All forage production is the sum of the following dry equivalents: alfalfa hay and all other hay harvested as dry hay, alfalfa haylage and greenchop, all other hay haylage and greenchop; after converting alfalfa and all other haylage and greenchop to a dry equivalent basis.10 Estimated marketings of alfalfa and other hay used as weights to calculate all hay price for 1996–2005.11 Includes only alfalfa and alfalfa mixtures that were harvested as haylage or greenchop (green weight). Alfalfa harvested as dry hay is not included.12 Includes all types of forage harvested as haylage or greenchop (green weight). Forage harvested as dry hay and corn and sorghum silage/greenchop are not included.13 Sweet rice acreage has been included since the 2003 crop year, but not previous years.14 Excludes wild rice.15 Estimates began in 2000.16 Relates to year of intended harvest for fall planted beets in central California and to year of planting for overwintered beets in central and Southern California.
Field Crop Acreage, Production and Value, 1996–2005 continued

California Agricultural Resource Directory 2006 49
Field Crops
Field Crop Monthly Average Prices Received, 1996–2005
Crop Crop Year Jan. Feb. Mar. April May June July Aug. Sept. Oct. Nov. Dec.
COTTONSEED 1,2 $/Ton1996 – – – – – – – – – 175.00 – 174.001997 189.00 – – – – – – – – 171.00 175.00 177.001998 – – – – – – – – – 135.00 175.00 179.001999 180.00 199.00 – – – – – – – 149.00 141.00 135.002000 116.00 137.00 – – – – – – – 145.00 140.00 134.002001 136.00 143.00 – – – – – – – 146.00 141.00 145.002002 132.00 137.00 – – – – – – – 150.00 142.00 132.002003 – – – – – – – – – 184.00 158.00 153.002004 – 150.00 – – – – – – – 161.00 144.00 155.002005 145.00 – – – – – – – – 169.00 149.00 136.00
HAY, ALFALFA (BALED) $/Ton1996 100.00 104.00 98.00 108.00 104.00 104.00 100.00 101.00 106.00 111.00 112.00 118.001997 126.00 133.00 127.00 132.00 131.00 125.00 117.00 113.00 113.00 121.00 125.00 119.001998 120.00 121.00 115.00 130.00 107.00 102.00 99.00 99.00 93.00 96.00 89.00 79.001999 79.00 102.00 109.00 101.00 104.00 97.00 87.00 81.00 78.00 85.00 85.00 86.002000 85.00 94.00 99.00 96.00 91.00 81.00 76.00 81.00 89.00 97.00 97.00 97.002001 102.00 103.00 111.00 130.00 121.00 114.00 111.00 113.00 125.00 123.00 128.00 124.002002 113.00 122.00 126.00 121.00 116.00 101.00 95.00 90.00 92.00 98.00 101.00 95.002003 99.00 102.00 99.00 99.00 97.00 90.00 85.00 86.00 88.00 94.00 98.00 89.002004 89.00 97.00 105.00 126.00 122.00 115.00 109.00 109.00 113.00 119.00 122.00 119.002005 121.00 131.00 133.00 141.00 144.00 134.00 134.00 131.00 135.00 139.00 142.00 138.00
HAY, ALL (BALED) $/Ton1996 103.00 96.00 105.00 99.00 102.00 103.00 98.00 100.00 104.00 110.00 110.00 117.001997 124.00 132.00 126.00 128.00 128.00 122.00 115.00 111.00 113.00 110.00 123.00 118.001998 118.00 120.00 113.00 129.00 103.00 100.00 99.00 97.00 91.00 92.00 86.00 79.001999 76.00 100.00 103.00 98.00 103.00 96.00 85.00 82.00 78.00 84.00 82.00 83.002000 83.00 88.00 98.00 96.00 90.00 81.00 77.00 81.00 87.00 93.00 95.00 94.002001 100.00 100.00 110.00 128.00 116.00 112.00 108.00 110.00 121.00 117.00 117.00 115.002002 111.00 119.00 123.00 119.00 115.00 98.00 92.00 88.00 89.00 94.00 95.00 94.002003 98.00 100.00 99.00 98.00 94.00 88.00 84.00 85.00 86.00 90.00 93.00 85.002004 88.00 95.00 103.00 121.00 118.00 112.00 108.00 107.00 110.00 115.00 117.00 114.002005 116.00 125.00 127.00 135.00 136.00 128.00 130.00 126.00 130.00 132.00 135.00 131.00
POTATOES $/Cwt.1996 12.20 12.00 14.00 13.90 11.20 13.10 13.10 11.00 14.90 11.20 9.80 7.951997 8.45 8.65 9.90 11.40 8.10 9.95 10.20 13.50 14.70 13.80 8.20 13.401998 11.00 12.30 17.20 15.30 10.90 10.30 9.90 10.90 12.00 10.70 10.50 8.851999 16.70 16.30 12.90 20.20 7.35 11.50 11.30 12.30 16.50 7.95 10.40 12.902000 12.10 11.90 12.20 14.00 10.80 11.10 14.60 17.40 16.80 8.00 10.80 14.602001 15.60 16.00 7.35 6.90 12.10 11.10 12.60 16.00 15.10 11.00 12.70 17.002002 17.20 19.70 15.30 25.00 24.10 18.40 18.80 18.80 20.50 9.95 15.80 18.202003 18.40 15.80 16.20 19.90 14.60 11.40 12.90 17.10 14.70 9.85 12.40 14.302004 15.60 17.30 21.10 21.00 14.20 12.40 13.20 14.30 15.00 9.20 8.65 10.302005 14.40 15.20 15.50 16.80 12.80 12.40 13.30 14.40 14.40 8.30 9.80 9.35
WHEAT, ALL 1 $/Ton1996 167.00 175.00 188.00 188.00 185.00 179.00 160.00 160.00 159.00 147.00 144.00 140.001997 161.00 146.00 151.00 145.00 140.00 134.00 – – 124.00 131.00 – –1998 – – 104.00 104.00 124.00 99.60 – – – – – –1999 96.70 100.00 98.70 104.00 93.00 – – – 106.00 – – –2000 – 85.00 86.70 – – – – – – – – –2001 – – – – – – – – – – – –2002 – – – – – 118.00 – – – – – –2003 – – – – – 125.00 113.00 115.00 113.00 111.00 118.00 120.002004 – 122.00 – 131.00 133.00 139.00 125.00 – – 107.00 – –2005 – – – – 121.00 115.00 – – – – 95.30 112.00
Field Crop Monthly Average Prices Received, 1996–2005 continued
1 Missing data was not published due to insuffi cient sales to establish a price or the price was not published to avoid possible disclosure.2 Season runs from August to February.

50 California Agricultural Resource Directory 2006
Field Crops
Barley Acreage, Yield and Production by County, 2004 – 2005
County –––––––––––––––––––––– 2004 ––––––––––––––––––––––– ––––––––––––––––––––––– 2005 ––––––––––––––––––––––Planted Harvested Yield/Acre Production Planted Harvested Yield/Acre Production
Acres Acres Tons Tons Acres Acres Tons Tons
Del Norte – – – – – – – – Humboldt – – – – – – – – Mendocino – – – – – – – – District 10 Total – – – – – – – – Shasta – – – – – – – – Siskiyou 12,400 7,600 1.97 15,000 7,600 5,400 2.25 12,168 Trinity – – – – – – – – Other Counties 1 200 100 1.68 168 200 – – – District 20 Total 12,600 7,700 1.97 15,168 7,800 5,400 2.25 12,168 Lassen – – – – – – – – Modoc 7,000 3,900 2.50 9,744 4,500 1,400 2.55 3,576 Plumas – – – – – – – – Other Counties 1 400 200 2.16 432 300 – – – District 30 Total 7,400 4,100 2.48 10,176 4,800 1,400 2.55 3,576 Alameda 800 200 1.08 216 1,100 400 1.20 480 Contra Costa – – – – – – – – Lake – – – – 400 – – – Marin – – – – – – – – Monterey 9,100 7,100 0.66 4,656 7,400 3,600 0.83 3,000 Napa – – – – – – – – San Benito 1,600 800 0.63 504 1,600 800 0.90 720 San Francisco – – – – – – – – San Luis Obispo 20,300 12,700 0.74 9,456 18,600 16,200 0.97 15,792 San Mateo – – – – – – – – Santa Clara – – – – 400 – – – Santa Cruz – – – – – – – – Sonoma – – – – – – – – Other Counties 1 300 100 1.20 120 200 – – – District 40 Total 32,100 20,900 0.72 14,952 29,700 21,000 0.95 19,992 Butte – – – – – – – – Colusa 500 400 1.80 720 – – – – Glenn 7,500 6,600 1.80 11,904 5,800 3,200 2.06 6,600 Sacramento 1,700 1,500 1.57 2,352 2,200 1,400 2.06 2,880 Solano 6,800 6,200 1.09 6,768 3,200 2,600 1.24 3,216 Sutter – – – – – – – – Tehama 900 800 1.11 888 1,300 1,000 0.91 912 Yolo 1,400 1,300 1.42 1,848 1,300 800 1.71 1,368 Yuba – – – – – – – – Other Counties 1 300 – – – 400 – – – District 50 Total 19,100 16,800 1.46 24,480 14,200 9,000 1.66 14,976 Fresno 8,900 6,700 1.93 12,912 15,000 8,000 1.96 15,648 Kern 6,700 3,900 1.45 5,640 5,600 3,300 1.49 4,920 Kings 4,800 3,900 1.96 7,632 3,200 2,000 1.86 3,720 Madera 2,900 2,400 2.00 4,800 3,200 1,000 2.04 2,040 Merced 4,400 3,800 1.77 6,744 4,800 3,800 1.79 6,792 San Joaquin 1,300 900 1.49 1,344 1,400 800 1.77 1,416 Stanislaus 500 300 1.12 336 900 400 2.04 816 Tulare 1,700 1,200 1.02 1,224 2,400 1,400 1.61 2,256 District 51 Total 31,200 23,100 1.76 40,632 36,500 20,700 1.82 37,608 Alpine – – – – – – – – Amador – – – – – – – – Calaveras – – – – – – – – El Dorado – – – – – – – – Inyo – – – – – – – – Mariposa – – – – – – – – Mono – – – – – – – – Nevada – – – – – – – – Placer – – – – – – – – Sierra – – – – – – – – Tuolumne – – – – – – – – District 60 Total – – – – – – – – Imperial – – – – – – – – Los Angeles 2,700 1,100 1.07 1,176 2,000 900 0.85 768 Orange – – – – – – – – Riverside 3,500 1,000 0.98 984 1,800 1,000 0.84 840 San Bernardino – – – – 1,000 200 2.04 408 San Diego – – – – 1,000 – – – Santa Barbara 900 200 1.44 288 700 200 1.08 216 Ventura – – – – – – – – Other Counties 1 500 100 1.44 144 500 200 0.84 168 District 80 Total 7,600 2,400 1.08 2,592 7,000 2,500 0.96 2,400
STATE 110,000 75,000 1.44 108,000 100,000 60,000 1.51 90,720
1 Includes one or more counties within a district that normally has less than 200 acres planted.

California Agricultural Resource Directory 2006 51
Field Crops
Dry Edible Bean Acreage, Yield and Production by County, 2004 – 2005
County ––––––––––––––––––––– 2004 –––––––––––––––––––––––– ––––––––––––––––––––––– 2005 ––––––––––––––––––––––Planted Harvested Yield/Acre Production Planted Harvested Yield/Acre Production
Acres Acres Pounds Cwt. Acres Acres Pounds Cwt.
Del Norte – – – – – – – – Humboldt – – – – – – – – Mendocino – – – – – – – – District 10 Total – – – – – – – – Shasta – – – – – – – – Siskiyou – – – – – – – – Trinity – – – – – – – – District 20 Total – – – – – – – – Lassen – – – – – – – – Modoc – – – – – – – – Plumas – – – – – – – – District 30 Total – – – – – – – – Alameda – – – – – – – – Contra Costa – – – – – – – – Lake – – – – – – – – Marin – – – – – – – – Monterey – – – – 1,200 1,200 3,500 42,000 Napa – – – – – – – – San Benito – – – – – – – – San Francisco – – – – – – – – San Luis Obispo 300 300 1,667 5,000 – – – – San Mateo – – – – – – – – Santa Clara – – – – – – – – Santa Cruz – – – – – – – – Sonoma – – – – – – – – Other Counties 1 600 600 1,500 9,000 300 300 1,333 4,000 District 40 Total 900 900 1,556 14,000 1,500 1,500 3,067 46,000 Butte 600 600 2,000 12,000 800 800 2,250 18,000 Colusa 5,600 5,300 1,755 93,000 5,900 5,800 1,759 102,000 Glenn 3,800 3,600 1,778 64,000 2,900 2,900 1,862 54,000 Sacramento – – – – 400 400 2,000 8,000 Solano 3,700 3,500 2,029 71,000 3,500 3,400 2,029 69,000 Sutter 7,300 7,000 1,743 122,000 7,000 6,900 1,986 137,000 Tehama 700 700 1,571 11,000 500 500 2,000 10,000 Yolo 2,200 2,000 1,800 36,000 2,300 2,200 1,727 38,000 Yuba – – – – – – – – Other Counties 1 600 600 1,500 9,000 200 200 2,000 4,000 District 50 Total 24,500 23,300 1,794 418,000 23,500 23,100 1,905 440,000 Fresno 2,800 2,700 2,111 57,000 7,400 7,300 2,233 163,000 Kern 1,400 1,400 2,500 35,000 2,700 2,700 2,037 55,000 Kings 3,700 3,400 1,353 46,000 2,600 2,600 2,885 75,000 Madera 500 500 2,600 13,000 400 400 1,750 7,000 Merced 2,200 2,000 2,100 42,000 2,600 2,600 1,923 50,000 San Joaquin 7,800 7,400 2,270 168,000 6,400 6,300 2,302 145,000 Stanislaus 8,200 7,800 2,615 204,000 11,100 10,900 2,303 251,000 Tulare 5,000 4,800 2,521 121,000 2,400 2,300 2,217 51,000 District 51 Total 31,600 30,000 2,287 686,000 35,600 35,100 2,271 797,000 Alpine – – – – – – – – Amador – – – – – – – – Calaveras – – – – – – – – El Dorado – – – – – – – – Inyo – – – – – – – – Mariposa – – – – – – – – Mono – – – – – – – – Nevada – – – – – – – – Placer – – – – – – – – Sierra – – – – – – – – Tuolumne – – – – – – – – District 60 Total – – – – – – – – Imperial – – – – – – – – Los Angeles – – – – – – – – Orange 800 700 1,429 10,000 1,300 1,300 2,615 34,000 Riverside – – – – – – – – San Bernardino – – – – – – – – San Diego – – – – – – – – Santa Barbara 2,100 2,000 1,150 23,000 3,900 3,800 1,658 63,000 Ventura – – – – – – – – Other Counties 1 100 100 1,000 1,000 200 200 2,500 5,000 District 80 Total 3,000 2,800 1,214 34,000 5,400 5,300 1,925 102,000
STATE 60,000 57,000 2,020 1,152,000 66,000 65,000 2,130 1,385,000
1 Includes one or more counties within a district that normally has less than 200 acres planted.

52 California Agricultural Resource Directory 2006
Field Crops
1 Includes corn planted for all purposes.2 Includes one or more counties within a district that normally has less than 200 acres planted.3 Includes counties from one or more districts that normally have less than 200 acres planted.
Corn for Grain Acreage, Yield and Production by County, 2004 – 2005
County –––––––––––––––––––––– 2004 ––––––––––––––––––––– –––––––––––––––––––––– 2005 –––––––––––––––––––––
Planted 1 Harvested Yield/Acre Production Planted 1 Harvested Yield/Acre ProductionAcres Acres Tons Tons Acres Acres Tons Tons
Del Norte – – – – – – – – Humboldt 1,000 300 2.33 700 800 – – – Mendocino – – – – – – – – District 10 Total 1,000 300 2.33 700 800 – – – Shasta – – – – – – – – Siskiyou – – – – – – – – Trinity – – – – – – – – District 20 Total – – – – – – – – Lassen – – – – – – – – Modoc – – – – – – – – Plumas – – – – – – – – District 30 Total – – – – – – – – Alameda – – – – – – – – Contra Costa 6,000 5,700 4.22 24,080 5,300 4,900 4.10 20,076 Lake – – – – – – – – Marin – – – – – – – – Monterey – – – – – – – – Napa – – – – – – – – San Benito – – – – – – – – San Francisco – – – – – – – – San Luis Obispo – – – – – – – – San Mateo – – – – – – – – Santa Clara – – – – – – – – Santa Cruz – – – – – – – – Sonoma – – – – – – – – Other Counties 2 500 500 3.92 1,960 – – – – District 40 Total 6,500 6,200 4.20 26,040 5,300 4,900 4.10 20,076 Butte 800 800 5.95 4,760 500 200 5.88 1,176 Colusa 3,000 3,000 6.02 18,060 1,500 1,400 5.20 7,280 Glenn 16,400 12,000 5.70 68,432 12,000 6,700 5.93 39,732 Sacramento 32,500 29,000 4.45 128,912 35,000 28,000 4.41 123,564 Solano 11,400 10,400 5.41 56,308 5,000 4,500 5.12 23,016 Sutter 6,400 6,200 5.85 36,260 3,000 2,900 5.12 14,840 Tehama 1,500 800 5.92 4,732 1,400 1,100 5.27 5,796 Yolo 12,000 12,000 5.24 62,860 3,900 3,600 4.98 17,920 Yuba 1,000 800 5.50 4,396 1,000 300 5.23 1,568 District 50 Total 85,000 75,000 5.13 384,720 63,300 48,700 4.82 234,892 Fresno 31,500 3,500 5.50 19,236 33,000 3,800 4.84 18,396 Kern 37,000 300 5.13 1,540 35,000 – – – Kings 49,500 3,300 5.16 17,024 61,300 2,900 5.07 14,700 Madera 20,000 2,500 4.80 12,012 21,000 1,100 4.84 5,320 Merced 76,000 10,000 4.84 48,412 77,000 7,800 4.83 37,688 San Joaquin 68,000 44,000 4.54 199,920 64,000 34,000 4.80 163,212 Stanislaus 51,000 1,000 4.76 4,760 53,000 2,300 5.33 12,264 Tulare 109,000 2,400 5.62 13,496 120,000 3,900 5.17 20,160 District 51 Total 442,000 67,000 4.72 316,400 464,300 55,800 4.87 271,740 Alpine – – – – – – – – Amador – – – – – – – – Calaveras – – – – – – – – El Dorado – – – – – – – – Inyo – – – – – – – – Mariposa – – – – – – – – Mono – – – – – – – – Nevada – – – – – – – – Placer – – – – 500 – – – Sierra – – – – – – – – Tuolumne – – – – – – – – District 60 Total – – – – 500 – – – Imperial 500 300 4.57 1,372 1,200 300 5.41 1,624 Los Angeles – – – – – – – – Orange – – – – – – – – Riverside 1,500 – – – 1,700 – – – San Bernardino 800 – – – 900 – – – San Diego – – – – – – – – Santa Barbara – – – – 500 – – – Ventura – – – – – – – – Other Counties 2 700 200 5.04 1,008 – – – – District 80 Total 3,500 500 4.76 2,380 4,300 300 5.41 1,624 Other Districts 3 2,000 1,000 4.76 4,760 1,500 300 4.76 1,428
STATE 540,000 150,000 4.90 735,000 540,000 110,000 4.82 529,760

California Agricultural Resource Directory 2006 53
Field Crops
Corn for Silage Acreage, Yield and Production by County, 2004 – 2005
County –––––––––––––––––––––– 2004 ––––––––––––––––––––– –––––––––––––––––––––– 2005 –––––––––––––––––––––Planted 1 Harvested Yield/Acre Production Planted 1 Harvested Yield/Acre Production
Acres Acres Tons Tons Acres Acres Tons Tons
Del Norte – – – – – – – – Humboldt 1,000 700 21.40 15,000 800 800 18.75 15,000 Mendocino – – – – – – – – District 10 Total 1,000 700 21.40 15,000 800 800 18.75 15,000 Shasta – – – – – – – – Siskiyou – – – – – – – – Trinity – – – – – – – – District 20 Total – – – – – – – – Lassen – – – – – – – – Modoc – – – – – – – – Plumas – – – – – – – – District 30 Total – – – – – – – – Alameda – – – – – – – – Contra Costa 6,000 300 20.00 6,000 5,300 400 17.50 7,000 Lake – – – – – – – – Marin – – – – – – – – Monterey – – – – – – – – Napa – – – – – – – – San Benito – – – – – – – – San Francisco – – – – – – – – San Luis Obispo – – – – – – – – San Mateo – – – – – – – – Santa Clara – – – – – – – – Santa Cruz – – – – – – – – Sonoma – – – – – – – – Other Counties 2 500 – – – – – – – District 40 Total 6,500 300 20.00 6,000 5,300 400 17.50 7,000 Butte 800 – – – 500 300 23.33 7,000 Colusa 3,000 – – – 1,500 – – – Glenn 16,400 3,900 25.10 98,000 12,000 4,700 27.02 127,000 Sacramento 32,500 3,400 25.00 85,000 35,000 6,900 25.36 175,000 Solano 11,400 600 25.00 15,000 5,000 500 22.00 11,000 Sutter 6,400 200 25.00 5,000 3,000 – – – Tehama 1,500 700 30.00 21,000 1,400 300 26.67 8,000 Yolo 12,000 – – – 3,900 300 30.00 9,000 Yuba 1,000 200 30.00 6,000 1,000 700 28.57 20,000 District 50 Total 85,000 9,000 25.60 230,000 63,300 13,800 26.01 359,000 Fresno 31,500 27,500 24.50 674,000 33,000 28,700 24.63 707,000 Kern 37,000 36,700 24.30 893,000 35,000 35,000 22.77 797,000 Kings 49,500 46,000 25.30 1,163,000 61,300 58,000 25.66 1,488,000 Madera 20,000 17,500 26.10 456,000 21,000 19,900 25.88 515,000 Merced 76,000 64,500 25.90 1,669,000 77,000 67,800 25.37 1,720,000 San Joaquin 68,000 22,800 27.10 617,000 64,000 29,000 27.59 800,000 Stanislaus 51,000 49,500 27.80 1,375,000 53,000 50,300 27.79 1,398,000 Tulare 109,000 106,500 26.50 2,818,000 120,000 115,800 26.94 3,120,000 District 51 Total 442,000 371,000 26.10 9,665,000 464,300 404,500 26.07 10,545,000 Alpine – – – – – – – – Amador – – – – – – – – Calaveras – – – – – – – – El Dorado – – – – – – – – Inyo – – – – – – – – Mariposa – – – – – – – – Mono – – – – – – – – Nevada – – – – – – – – Placer – – – – 500 400 25.00 10,000 Sierra – – – – – – – – Tuolumne – – – – – – – – District 60 Total – – – – 500 400 25.00 10,000 Imperial 500 200 20.00 4,000 1,200 900 21.11 19,000 Los Angeles – – – – – – – – Orange – – – – – – – – Riverside 1,500 1,500 24.70 37,000 1,700 1,700 21.76 37,000 San Bernardino 800 800 21.30 17,000 900 900 21.11 19,000 San Diego – – – – – – – – Santa Barbara – – – – 500 400 20.00 8,000 Ventura – – – – – – – – Other Counties 2 700 500 20.00 10,000 – – – – District 80 Total 3,500 3,000 22.70 68,000 4,300 3,900 21.28 83,000 Other Districts 3 2,000 1,000 26.00 26,000 1,500 1,200 25.83 31,000
STATE 540,000 385,000 26.00 10,010,000 540,000 425,000 26.00 11,050,000
1 Includes corn planted for all purposes.2 Includes one or more counties within a district that normally has less than 200 acres planted.3 Includes counties from one or more districts that normally have less than 200 acres planted.

54 California Agricultural Resource Directory 2006
Field Crops
American Pima Cotton Acreage, Yield and Production by County, 2004 – 2005
County –––––––––––––––––––––– 2004 ––––––––––––––––––––––– –––––––––––––––––––––– 2005 –––––––––––––––––––––––Planted Harvested Yield/Acre Production Planted Harvested Yield/Acre Production
Acres Acres Pounds Bales Acres Acres Pounds Bales
Del Norte – – – – – – – – Humboldt – – – – – – – – Mendocino – – – – – – – – District 10 Total – – – – – – – – Shasta – – – – – – – – Siskiyou – – – – – – – – Trinity – – – – – – – – District 20 Total – – – – – – – – Lassen – – – – – – – – Modoc – – – – – – – – Plumas – – – – – – – – District 30 Total – – – – – – – – Alameda – – – – – – – – Contra Costa – – – – – – – – Lake – – – – – – – – Marin – – – – – – – – Monterey – – – – – – – – Napa – – – – – – – – San Benito – – – – – – – – San Francisco – – – – – – – – San Luis Obispo – – – – – – – – San Mateo – – – – – – – – Santa Clara – – – – – – – – Santa Cruz – – – – – – – – Sonoma – – – – – – – – District 40 Total – – – – – – – – Butte – – – – – – – – Colusa – – – – – – – – Glenn – – – – – – – – Sacramento – – – – – – – – Solano – – – – – – – – Sutter – – – – – – – – Tehama – – – – – – – – Yolo – – – – – – – – Yuba – – – – – – – – District 50 Total – – – – – – – – Fresno 82,900 82,500 1,543 265,200 88,300 88,000 1,222 224,000 Kern 40,600 40,400 1,536 129,300 40,200 40,000 1,183 98,600 Kings 88,400 88,000 1,530 280,500 94,500 94,000 1,113 218,000 Madera – – – – – – – – Merced 1,500 1,500 1,216 3,800 1,500 1,500 1,120 3,500 San Joaquin – – – – – – – – Stanislaus – – – – – – – – Tulare 1,000 1,000 1,296 2,700 4,600 4,600 1,252 12,000 Other Counties 1 600 600 1,200 1,500 900 900 1,013 1,900 District 51 Total 215,000 214,000 1,532 683,000 230,000 229,000 1,170 558,000 Alpine – – – – – – – – Amador – – – – – – – – Calaveras – – – – – – – – El Dorado – – – – – – – – Inyo – – – – – – – – Mariposa – – – – – – – – Mono – – – – – – – – Nevada – – – – – – – – Placer – – – – – – – – Sierra – – – – – – – – Tuolumne – – – – – – – – District 60 Total – – – – – – – – Imperial – – – – – – – – Los Angeles – – – – – – – – Orange – – – – – – – – Riverside – – – – – – – – San Bernardino – – – – – – – – San Diego – – – – – – – – Santa Barbara – – – – – – – – Ventura – – – – – – – – District 80 Total – – – – – – – – STATE 215,000 214,000 1,532 683,000 230,000 229,000 1,170 558,000
1 Includes one or more counties within a district that normally has less than 500 acres planted

California Agricultural Resource Directory 2006 55
Field Crops
Upland Cotton Acreage, Yield and Production by County, 2004 – 2005
County –––––––––––––––––––––– 2004 ––––––––––––––––––––––– –––––––––––––––––––––– 2005 –––––––––––––––––––––––Planted Harvested Yield/Acre Production Planted Harvested Yield/Acre Production
Acres Acres Pounds Bales Acres Acres Pounds Bales
Del Norte – – – – – – – – Humboldt – – – – – – – – Mendocino – – – – – – – – District 10 Total – – – – – – – – Shasta – – – – – – – – Siskiyou – – – – – – – – Trinity – – – – – – – – District 20 Total – – – – – – – – Lassen – – – – – – – – Modoc – – – – – – – – Plumas – – – – – – – – District 30 Total – – – – – – – – Alameda – – – – – – – – Contra Costa – – – – – – – – Lake – – – – – – – – Marin – – – – – – – – Monterey – – – – – – – – Napa – – – – – – – – San Benito – – – – – – – – San Francisco – – – – – – – – San Luis Obispo – – – – – – – – San Mateo – – – – – – – – Santa Clara – – – – – – – – Santa Cruz – – – – – – – – Sonoma – – – – – – – – District 40 Total – – – – – – – – Butte – – – – – – – – Colusa 4,600 4,500 1,397 13,100 3,200 3,200 1,125 7,500 Glenn 2,300 2,200 1,484 6,800 2,700 2,700 1,156 6,500 Sacramento – – – – – – – – Solano – – – – – – – – Sutter 1,100 1,100 1,178 2,700 1,100 1,100 1,309 3,000 Tehama – – – – – – – – Yolo – – – – – – – – Yuba – – – – – – – – District 50 Total 8,000 7,800 1,391 22,600 7,000 7,000 1,166 17,000 Fresno 165,000 164,400 1,588 544,000 117,000 116,500 1,178 286,000 Kern 99,300 98,900 1,504 309,800 84,000 83,600 1,166 203,000 Kings 99,500 99,100 1,436 296,500 70,300 70,000 1,149 167,500 Madera 18,100 17,600 1,402 51,400 16,500 16,400 1,156 39,500 Merced 71,600 71,300 1,573 233,700 64,500 64,200 1,215 162,500 San Joaquin – – – – – – – – Stanislaus – – – – – – – – Tulare 65,300 65,000 1,591 215,400 48,500 48,300 1,242 125,000 Other Counties 1 200 200 1,200 500 200 200 1,200 500 District 51 Total 519,000 516,500 1,535 1,651,300 401,000 399,200 1,183 984,000 Alpine – – – – – – – – Amador – – – – – – – – Calaveras – – – – – – – – El Dorado – – – – – – – – Inyo – – – – – – – – Mariposa – – – – – – – – Mono – – – – – – – – Nevada – – – – – – – – Placer – – – – – – – – Sierra – – – – – – – – Tuolumne – – – – – – – – District 60 Total – – – – – – – – Imperial 12,000 11,800 1,562 38,400 10,000 9,900 1,455 30,000 Los Angeles – – – – – – – – Orange – – – – – – – – Riverside 20,100 20,000 1,800 75,000 11,500 11,400 1,385 32,900 San Bernardino 900 900 1,440 2,700 500 500 1,056 1,100 San Diego – – – – – Santa Barbara – – – – – – Ventura – – – – – – District 80 Total 33,000 32,700 1,704 116,100 22,000 21,800 1,409 64,000 STATE 560,000 557,000 1,543 1,790,000 430,000 428,000 1,194 1,065,000
1 Includes one or more counties within a district that normally has less than 500 acres planted.

56 California Agricultural Resource Directory 2006
Field Crops
Oat Acreage, Yield and Production by County, 2004 – 2005
County –––––––––––––––––––––– 2004 –––––––––––––––––––––– –––––––––––––––––––––– 2005 ––––––––––––––––––––––Planted Harvested Yield/Acre Production Planted Harvested Yield/Acre Production
Acres Acres Tons Tons Acres Acres Tons Tons
Del Norte – – – – 300 – – – Humboldt 500 – – – 200 – – – Mendocino 500 – – – 500 – – – District 10 Total 1,000 – – – 1,000 – – – Shasta 400 – – – 400 – – – Siskiyou 2,500 1,400 1.47 2,064 2,600 1,000 1.92 1,920 Trinity – – – – – – – – Other Counties 1 100 100 0.96 96 – – – – District 20 Total 3,000 1,500 1.44 2,160 3,000 1,000 1.92 1,920 Lassen 1,400 – – – 500 – – – Modoc 1,200 500 1.60 800 1,200 500 1.92 960 Plumas 400 – – – 300 – – – District 30 Total 3,000 500 1.60 800 2,000 500 1.92 960 Alameda 500 – – – 400 – – – Contra Costa – – – – 400 – – – Lake – – – – 600 200 1.04 208 Marin 600 – – – 900 – – – Monterey 900 400 1.12 448 1,000 – – – Napa – – – – – – – – San Benito 2,400 1,600 1.19 1,904 2,600 1,200 1.20 1,440 San Francisco – – – – – – – – San Luis Obispo 4,400 1,300 0.89 1,152 5,700 1,000 0.98 976 San Mateo 600 – – – 500 – – – Santa Clara 1,200 400 0.96 384 1,800 200 0.96 192 Santa Cruz – – – – – – – – Sonoma 7,600 1,700 1.08 1,840 9,000 1,800 1.03 1,856 Other Counties 1 800 600 0.96 576 100 100 0.96 96 District 40 Total 19,000 6,000 1.05 6,304 23,000 4,500 1.06 4,768 Butte 500 – – – 300 – – – Colusa 700 400 1.44 576 2,100 200 1.36 272 Glenn 3,700 200 0.96 192 3,600 200 1.20 240 Sacramento 2,500 100 0.80 80 2,800 – – – Solano 2,800 300 1.44 432 3,100 300 1.17 352 Sutter 1,100 400 1.28 512 800 300 1.39 416 Tehama 1,700 – – – 1,800 – – – Yolo 6,600 400 1.44 576 6,200 – – – Yuba 400 200 0.96 192 300 – – – District 50 Total 20,000 2,000 1.28 2,560 21,000 1,000 1.28 1,280 Fresno 10,600 1,000 1.58 1,584 11,200 1,500 1.17 1,760 Kern 7,500 700 1.60 1,120 8,500 1,000 1.09 1,088 Kings 5,000 200 1.28 256 10,000 500 1.22 608 Madera 9,100 800 1.60 1,280 11,000 600 1.33 800 Merced 60,800 4,000 1.50 5,984 65,500 4,000 1.12 4,480 San Joaquin 20,000 1,500 1.54 2,304 27,300 1,000 1.14 1,136 Stanislaus 50,000 2,100 1.46 3,056 52,600 1,200 1.11 1,328 Tulare 18,000 2,200 1.70 3,744 23,900 2,700 1.26 3,392 District 51 Total 181,000 12,500 1.55 19,328 210,000 12,500 1.17 14,592 Alpine – – – – – – – – Amador 800 – – – 300 – – – Calaveras – – – – 300 – – – El Dorado – – – – – – – – Inyo – – – – – – – – Mariposa – – – – – – – – Mono – – – – – – – – Nevada – – – – – – – – Placer 600 – – – 900 – – – Sierra – – – – – – – – Tuolumne – – – – – – – – Other Counties 1 1,600 500 1.22 608 500 500 0.96 480 District 60 Total 3,000 500 1.22 608 2,000 500 0.96 480 Imperial 4,000 1,000 1.12 1,120 3,000 – – – Los Angeles – – – – – – – – Orange – – – – – – – – Riverside 2,600 400 1.06 424 2,000 – – – San Bernardino – – – – – – – – San Diego 1,000 – – – 1,500 – – – Santa Barbara 1,300 500 1.18 592 800 – – – Ventura 800 – – – 500 – – – Other Counties 1 300 100 1.04 104 200 – – – District 80 Total 10,000 2,000 1.12 2,240 8,000 – – – STATE 240,000 25,000 1.36 34,000 270,000 20,000 1.20 24,000
1 Includes one or more counties within a district that normally has less than 200 acres planted.

California Agricultural Resource Directory 2006 57
Field Crops
Rice Acreage, Yield and Production by County, 2004 – 2005
County –––––––––––––––––––––– 2004 –––––––––––––––––––––– –––––––––––––––––––––– 2005 ––––––––––––––––––––––Planted Harvested Yield/Acre Production Planted Harvested Yield/Acre Production
Acres Acres Pounds Cwt. Acres Acres Pounds Cwt.
Del Norte – – – – – – – – Humboldt – – – – – – – – Mendocino – – – – – – – – District 10 Total – – – – – – – – Shasta – – – – – – – – Siskiyou – – – – – – – – Trinity – – – – – – – – District 20 Total – – – – – – – – Lassen – – – – – – – – Modoc – – – – – – – – Plumas – – – – – – – – District 30 Total – – – – – – – – Alameda – – – – – – – – Contra Costa – – – – – – – – Lake – – – – – – – – Marin – – – – – – – – Monterey – – – – – – – – Napa – – – – – – – – San Benito – – – – – – – – San Francisco – – – – – – – – San Luis Obispo – – – – – – – – San Mateo – – – – – – – – Santa Clara – – – – – – – – Santa Cruz – – – – – – – – Sonoma – – – – – – – – District 40 Total – – – – – – – – Butte 105,800 104,500 8,813 9,210,000 96,800 96,400 7,848 7,565,000 Colusa 156,400 155,000 8,619 13,360,000 145,600 145,000 7,161 10,384,000 Glenn 90,300 89,600 8,711 7,805,000 87,100 86,800 7,167 6,221,000 Sacramento 9,600 9,500 9,021 857,000 7,900 7,800 7,641 596,000 Solano – – – – – – – – Sutter 124,000 123,000 8,737 10,746,000 101,800 101,400 7,502 7,607,000 Tehama 700 700 6,000 42,000 800 800 5,125 41,000 Yolo 41,900 41,600 8,161 3,395,000 29,200 29,100 7,691 2,238,000 Yuba 34,300 34,100 8,349 2,847,000 33,300 33,200 7,166 2,379,000 District 50 Total 563,000 558,000 8,649 48,262,000 502,500 500,500 7,399 37,031,000 Fresno 4,800 4,800 7,000 336,000 4,800 4,800 7,188 345,000 Kern – – – – – – – – Kings – – – – – – – – Madera – – – – – – – – Merced 4,300 4,300 8,605 370,000 4,000 4,000 7,625 305,000 San Joaquin 5,900 5,900 8,508 502,000 3,700 3,700 7,703 285,000 Stanislaus 2,300 2,300 8,609 198,000 1,000 1,000 7,700 77,000 Tulare – – – – – – – – District 51 Total 17,300 17,300 8,127 1,406,000 13,500 13,500 7,496 1,012,000 Alpine – – – – – – – – Amador – – – – – – – – Calaveras – – – – – – – – El Dorado – – – – – – – – Inyo – – – – – – – – Mariposa – – – – – – – – Mono – – – – – – – – Nevada – – – – – – – – Placer 14,700 14,700 7,422 1,091,000 12,000 12,000 6,608 793,000 Sierra – – – – – – – – Tuolumne – – – – – – – – District 60 Total 14,700 14,700 7,422 1,091,000 12,000 12,000 6,608 793,000 Imperial – – – – – – – – Los Angeles – – – – – – – – Orange – – – – – – – – Riverside – – – – – – – – San Bernardino – – – – – – – – San Diego – – – – – – – – Santa Barbara – – – – – – – – Ventura – – – – – – – – District 80 Total – – – – – – – – STATE 595,000 590,000 8,600 50,759,000 528,000 526,000 7,380 38,836,000

58 California Agricultural Resource Directory 2006
Field Crops
Sorghum Acreage, Yield and Production by County, 2004 – 2005
County –––––––––––––––––––––– 2004 –––––––––––––––––––––– –––––––––––––––––––––– 2005 ––––––––––––––––––––––
Planted Harvested Yield/Acre Production Planted Harvested Yield/Acre ProductionAcres Acres Tons Tons Acres Acres Tons Tons
Del Norte – – – – – – – – Humboldt – – – – – – – – Mendocino – – – – – – – – District 10 Total – – – – – – – – Shasta – – – – – – – – Siskiyou – – – – – – – – Trinity – – – – – – – – District 20 Total – – – – – – – – Lassen – – – – – – – – Modoc – – – – – – – – Plumas – – – – – – – – District 30 Total – – – – – – – – Alameda – – – – – – – – Contra Costa – – – – – – – – Lake – – – – – – – – Marin – – – – – – – – Monterey – – – – – – – – Napa – – – – – – – – San Benito – – – – – – – – San Francisco – – – – – – – – San Luis Obispo – – – – – – – – San Mateo – – – – – – – – Santa Clara – – – – – – – – Santa Cruz – – – – – – – – Sonoma – – – – – – – – District 40 Total – – – – – – – – Butte – – – – – – – – Colusa 400 400 2.59 1,036 – – – – Glenn – – – – – – – – Sacramento 1,300 1,100 2.44 2,688 2,000 2,000 2.31 4,620 Solano 600 600 2.85 1,708 700 700 2.68 1,876 Sutter 700 600 2.43 1,456 900 900 2.49 2,240 Tehama – – – – – – – – Yolo 1,300 1,200 2.82 3,388 500 500 2.52 1,260 Yuba – – – – – – – – Other Counties 1 – – – – 600 600 2.52 1,512 District 50 Total 4,500 4,100 2.64 10,836 4,700 4,700 2.45 11,508 Fresno – – – – 1,700 – – – Kern 7,300 2,700 2.43 6,552 4,800 1,000 2.41 2,408 Kings 2,500 500 2.35 1,176 3,300 500 2.46 1,232 Madera – – – – 100 – – – Merced 4,200 200 2.66 532 200 – – – San Joaquin 500 400 2.52 1,008 900 500 2.63 1,316 Stanislaus 900 – – – 500 – – – Tulare 5,800 3,300 2.46 8,120 7,900 3,000 2.66 7,980 District 51 Total 22,000 7,500 2.45 18,396 19,400 5,000 2.59 12,936 Alpine – – – – – – – – Amador – – – – – – – – Calaveras – – – – – – – – El Dorado – – – – – – – – Inyo – – – – – – – – Mariposa – – – – – – – – Mono – – – – – – – – Nevada – – – – – – – – Placer – – – – – – – – Sierra – – – – – – – – Tuolumne – – – – – – – – District 60 Total – – – – – – – – Imperial – – – – – – – – Los Angeles – – – – – – – – Orange – – – – – – – – Riverside – – – – 300 – – – San Bernardino – – – – 400 – – – San Diego – – – – – – – – Santa Barbara – – – – – – – – Ventura – – – – – – – – District 80 Total 700 200 2.52 504 700 – – – Other Districts 2 800 200 2.52 504 1,200 300 2.52 756
STATE 28,000 12,000 2.52 30,240 26,000 10,000 2.52 25,200
1 Includes one or more counties within a district that normally has less than 400 acres planted.2 Includes counties from one or more districts that normally have less than 400 acres planted.

California Agricultural Resource Directory 2006 59
Field Crops
Sugar Beet Acreage, Yield and Production by County, 2004 – 2005
County –––––––––––––––––––––– 2004 –––––––––––––––––––––– –––––––––––––––––––––– 2005 ––––––––––––––––––––––
Planted Harvested Yield/Acre Production Sucrose Planted Harvested Yield/Acre Production Sucrose
Acres Acres Tons Tons Percent Acres Acres Tons Tons Percent
Del Norte – – – – – – – – – – Humboldt – – – – – – – – – – Mendocino – – – – – – – – – – District 10 Total – – – – – – – – – – Shasta – – – – – – – – – – Siskiyou – – – – – – – – – – Trinity – – – – – – – – – – District 20 Total – – – – – – – – – – Lassen – – – – – – – – – – Modoc – – – – – – – – – – Plumas – – – – – – – – – – District 30 Total – – – – – – – – – – Alameda – – – – – – – – – – Contra Costa – – – – – – – – – – Lake – – – – – – – – – – Marin – – – – – – – – – – Monterey – – – – – – – – – – Napa – – – – – – – – – – San Benito – – – – – – – – – – San Francisco – – – – – – – – – – San Luis Obispo – – – – – – – – – – San Mateo – – – – – – – – – – Santa Clara – – – – – – – – – – Santa Cruz – – – – – – – – – – Sonoma – – – – – – – – – – District 40 Total – – – – – – – – – – Butte – – – – – – – – – – Colusa – – – – – – – – – – Glenn – – – – – – – – – – Sacramento – – – – – – – – – – Solano – – – – – – – – – – Sutter – – – – – – – – – – Tehama – – – – – – – – – – Yolo – – – – – – – – – – Yuba – – – – – – – – – – District 50 Total – – – – – – – – – – Fresno 11,900 11,900 39.5 470,000 14.87 11,000 10,700 35.0 375,000 14.62 Kern 4,800 4,800 36.7 176,000 15.48 4,700 4,700 40.6 191,000 14.07 Kings 1,300 1,300 38.5 50,000 14.46 800 800 28.8 23,000 15.22 Madera – – – – – – – – – – Merced 3,700 3,700 37.0 137,000 14.82 3,600 3,600 32.2 116,000 16 San Joaquin – – – – – – – – – – Stanislaus – – – – – – – – – – Tulare 600 600 46.7 28,000 14.02 – – – – – Other Counties 1 800 800 30.0 24,000 15.03 900 900 31.1 28,000 15.01 District 51 Total 23,100 23,100 38.3 885,000 14.94 21,000 20,700 35.4 733,000 14.73 Alpine – – – – – – – – – – Amador – – – – – – – – – – Calaveras – – – – – – – – – – El Dorado – – – – – – – – – – Inyo – – – – – – – – – – Mariposa – – – – – – – – – – Mono – – – – – – – – – – Nevada – – – – – – – – – – Placer – – – – – – – – – – Sierra – – – – – – – – – – Tuolumne – – – – – – – – – – District 60 Total – – – – – – – – – – Imperial 26,000 25,800 43.0 1,110,000 16.53 23,400 23,400 42.0 982,000 16.5 Los Angeles – – – – – – – – – – Orange – – – – – – – – – – Riverside – – – – – – – – – – San Bernardino – – – – – – – – – – San Diego – – – – – – – – – – Santa Barbara – – – – – – – – – – Ventura – – – – – – – – – – District 80 Total 26,000 25,800 43.0 1,110,000 16.53 23,400 23,400 42.0 982,000 16.5 STATE 49,100 48,900 40.8 1,995,000 15.82 44,400 44,100 38.9 1,715,000 15.74
1 Includes one or more counties within a district that normally has less than 300 acres planted.

60 California Agricultural Resource Directory 2006
Field Crops
All Wheat Acreage, Yield and Production by County, 2004 – 2005
County –––––––––––––––––––––– 2004 –––––––––––––––––––––– –––––––––––––––––––––– 2005 ––––––––––––––––––––––
Planted Harvested Yield/Acre Production Planted Harvested Yield/Acre Production
Acres Acres Tons Tons Acres Acres Tons Tons
Del Norte – – – – – – – – Humboldt – – – – – – – – Mendocino – – – – – – – – District 10 Total – – – – – – – – Shasta 1,000 500 2.70 1,350 – – – – Siskiyou 14,000 10,500 2.96 31,050 13,000 11,000 2.67 29,370 Trinity – – – – – – – – District 20 Total 15,000 11,000 2.95 32,400 13,000 11,000 2.67 29,370 Lassen 3,500 1,500 1.34 2,010 3,000 2,200 1.50 3,300 Modoc 11,500 8,500 2.98 25,290 11,000 6,800 2.45 16,650 Plumas – – – – – – – – District 30 Total 15,000 10,000 2.73 27,300 14,000 9,000 2.22 19,950 Alameda 1,000 500 1.20 600 500 500 1.20 600 Contra Costa 3,500 1,600 1.43 2,280 1,500 1,500 1.48 2,220 Lake – – – – – – – – Marin – – – – – – – – Monterey – – – – – – – – Napa – – – – – – – – San Benito 2,500 1,400 1.29 1,800 2,000 1,500 1.36 2,040 San Francisco – – – – – – – – San Luis Obispo 3,000 1,900 1.31 2,490 2,000 1,500 1.24 1,860 San Mateo – – – – – – – – Santa Clara – – – – – – – – Santa Cruz – – – – – – – – Sonoma – – – – – – – – Other Counties 1 1,000 600 1.05 630 500 – – – District 40 Total 11,000 6,000 1.30 7,800 6,500 5,000 1.34 6,720 Butte 2,000 1,000 1.50 1,500 1,000 500 1.68 840 Colusa 27,000 25,000 2.58 64,500 24,000 23,600 2.32 54,720 Glenn 7,000 5,500 2.76 15,150 5,000 2,500 2.24 5,610 Sacramento 10,000 7,500 2.40 18,000 7,000 4,800 2.01 9,660 Solano 21,000 19,800 2.55 50,490 19,000 17,900 2.10 37,560 Sutter 13,000 12,000 1.99 23,820 13,500 13,100 2.06 27,030 Tehama 1,500 800 1.99 1,590 1,000 500 1.74 870 Yolo 45,000 42,000 2.45 102,750 38,000 37,100 2.19 81,390 Yuba 500 400 2.63 1,050 500 – – – District 50 Total 127,000 114,000 2.45 278,850 109,000 100,000 2.18 217,680 Fresno 70,000 51,000 2.99 152,250 63,000 49,400 2.44 120,330 Kern 57,000 33,000 2.52 83,100 53,000 34,000 2.14 72,600 Kings 96,000 56,000 2.84 159,000 81,000 56,800 2.43 137,910 Madera 23,000 7,000 2.08 14,550 23,500 6,500 1.83 11,910 Merced 29,000 10,000 2.43 24,300 22,500 8,800 1.59 14,010 San Joaquin 36,000 23,000 2.44 56,040 22,000 13,300 2.51 33,360 Stanislaus 7,000 2,000 2.43 4,860 3,500 1,000 2.07 2,070 Tulare 104,000 25,000 2.76 69,000 104,000 26,700 1.95 51,960 District 51 Total 422,000 207,000 2.72 563,100 372,500 196,500 2.26 444,150 Alpine – – – – – – – – Amador – – – – – – – – Calaveras – – – – – – – – El Dorado – – – – – – – – Inyo – – – – – – – – Mariposa – – – – – – – – Mono – – – – – – – – Nevada – – – – – – – – Placer 2,500 1,900 1.22 2,310 – – – – Sierra – – – – – – – – Tuolumne – – – – – – – – Other Counties 1 500 100 0.90 90 1,000 – – – District 60 Total 3,000 2,000 1.20 2,400 1,000 – – – Imperial 53,000 47,000 2.55 120,000 33,500 33,000 2.95 97,470 Los Angeles – – – – – – – – Orange – – – – – – – – Riverside 33,000 22,500 2.35 52,890 20,000 14,500 2.02 29,310 San Bernardino – – – – – – – – San Diego – – – – – – – – Santa Barbara – – – – – – – – Ventura – – – – – – – – Other Counties 1 1,000 500 2.52 1,260 500 – – – District 80 Total 87,000 70,000 2.49 174,150 54,000 47,500 2.67 126,780 STATE 680,000 420,000 2.59 1,086,000 570,000 369,000 2.29 844,650
1 Includes one or more counties within a district that normally has less than 500 acres planted.

California Agricultural Resource Directory 2006 61
accounted for about 40 percent of imported cut fl owers at a value of $274.7 million. Of cut roses, a new record of 88 percent was attributed to imports. The number of U.S. cut fl ower producers has fallen the past two decades as cheaper imports made their way into the market. Average annual sales of cut fl ower growers, however, have steadily increased. This can be attributed to fewer growers putting more effort into growing high-value cut fl owers. Consequently, cut fl ower sales per grower have experienced an upward trend. Nationally, sales of potted fl owering plants grew a modest 1 percent to about $809 million in 2005. California led the nation in sales of potted fl owering plants in 2005 with a value of $199.3 million. This was 25 percent of total U.S. value and more than twice Florida’s sales of $94.6 million. Poinsettias, orchids and fl orist chrysanthemums remained the top sellers, though a survey of the largest producers showed that sales for poinsettias were down 2 percent from 2004. Orchids were the fastest growing in terms of sales of all potted fl owering plants, more than tripling sales of a decade ago. Chrysanthemum sales also increased from 2004. California also grew the most poinsettias and orchids, with poinsettias averaging $4.10 per pot and orchids averaging $8 per pot nationwide.
The U.S. value of fl oriculture crops rose 1 percent in 2005 for a total of $5.36 billion. Floriculture crops include bedding plants, fl owering plants, foliage plants, cut cultivated greens and cut fl owers. California led the nation in fl oriculture sales with $1.02 billion and was the only state to exceed $1 billion. The runner-up, Florida, had a wholesale value of $976 million in 2005. However, the number of growers in California in 2005 was 820, as compared with 907 in Florida. California and Florida accounted for 37 percent of the 36-state total value. The top fi ve states (California, Florida, Michigan, Texas and New York) accounted for 53 percent of the total value. According to the USDA Economic Research Service, total domestic use of fl oriculture crops was $6.17 billion in 2005; of that fi gure, fl oriculture imports accounted for 14.1 percent. This means that, on average, $56 of wholesale fl oriculture crops were sold to each U.S. household. Imported fl oriculture crops were fi erce competitors for U.S. producers. All domestic fl oriculture crops had increased sales, except for cut fl owers, which suffered most from foreign competition. California led the country with 73 percent of total cut fl ower sales in 2005. Of the more than $1 billion in domestic sales of cut fl owers nationwide, $709 million were from imports. Roses
Floriculture
phot
o by
Ed
Will
iam
s/Sa
n M
ateo
Co.

62 California Agricultural Resource Directory 2006
Floriculture Production and Value, 2004 1
KindNumber of Producers
–––––––––––––––––––– Sales –––––––––––––––––– Wholesale Price 2
Value of Sales at WholesaleUnit Number Sold Wholesale
1,000 Percent Dollars $1,000
CUT FLOWERS 294,116Alstroemeria 32 Stems 8,593 98 0.20 1,736
Carnations, Standard 15 Stems 7,965 81 0.17 1,330
Chrysanthemums, Pompon 32 Bunches 14,162 99 1.31 18,552
Delphinium and Larkspur 54 Stems 32,359 100 0.24 7,637
Gerbera Daisy 30 Stems 94,449 98 0.30 28,146
Iris 38 Stems 73,697 100 0.23 17,245
Lilies, All 50 Stems 103,557 100 0.61 63,170
Lisianthus 34 Stems 11,634 99 0.45 5,247
Orchids, All 12 Blooms 5,346 99 0.71 3,785
Roses, All 35 Stems 76,892 98 0.37 28,758
Snapdragons 49 Spikes 40,467 99 0.25 10,279
Tulips 35 Stems 52,502 100 0.41 21,578
Other Cut Flowers 148 – – 99 – 86,653
POTTED FLOWERING PLANTS 196,921African Violets 20 Pots 1,558 100 1.39 2,164
Finished Florist Azaleas 28 Pots 887 99 5.80 5,141
Chrysanthemums, Florist 28 Pots 6,614 100 1.89 12,507
Lilies, Easter 27 Pots 1,124 100 4.32 4,859
Orchids 45 Pots 6,699 96 7.63 51,111
Poinsettias 87 Pots 7,679 95 4.42 33,910
Roses, Florist 21 Pots 2,894 100 2.42 7,003
Spring Flowering Bulbs 37 Pots 2,496 100 2.78 6,938
Other Potted Flowering Plants 84 Pots 21,524 97 3.40 73,288
FOLIAGE PLANTS FOR INDOOR OR PATIO USE 103,698Hanging Baskets 60 Baskets 4,099 100 3.59 14,715
Potted Foliage 101 – – 99 – 88,983
ANNUAL BEDDING/GARDEN PLANTS 336,447Flats
Begonias 49 Flats 412 77 9.28 3,823
Geraniums, Cutting 17 Flats 139 92 10.06 1,398
Geraniums, Seed 15 Flats 67 98 10.40 697
Impatiens 64 Flats 1,468 99 9.61 14,107
Impatiens, New Guinea 16 Flats 99 84 10.37 1,027
Marigolds 60 Flats 1,129 98 10.13 11,437
Pansy/Viola 68 Flats 1,805 98 9.90 17,870
Petunias 66 Flats 1,630 98 9.97 16,251
Other Flowering and Foliar 68 Flats 7,716 99 10.60 81,790
Vegetable Type 47 Flats 1,186 99 10.26 12,168
Potted
Begonias 52 Pots 2,391 76 1.03 2,471
Geraniums, Cutting 49 Pots 6,766 99 1.67 11,301
Geraniums, Seed 20 Pots 467 100 1.37 642
Impatiens 50 Pots 6,005 91 0.95 5,716
Impatiens, New Guinea 48 Pots 1,409 99 1.72 2,427
Marigolds 36 Pots 1,965 95 0.82 1,608
Pansy/Viola 40 Pots 4,304 94 0.74 3,192
Petunias 39 Pots 3,618 95 0.85 3,067
Other Flowering and Foliar 61 Pots 34,263 98 1.35 46,317
Vegetable Type 39 Pots 7,578 99 1.03 7,792
Floriculture

California Agricultural Resource Directory 2006 63
Floriculture Production and Value, 2004 1 continuedFloriculture Production and Value, 2004 1
KindNumber of Producers
–––––––––––––––––––– Sales –––––––––––––––––– Wholesale Price 2
Value of Sales at WholesaleUnit Number Sold Wholesale
1,000 Percent Dollars $1,000
Hanging BasketsBegonias 22 Baskets 43 81 7.76 334Geraniums, Cutting 32 Baskets 415 99 6.80 2,822Geraniums, Seed 3 Baskets 5 58 8.56 43Impatiens 18 Baskets 65 98 6.15 400Impatiens, New Guinea 24 Baskets 66 98 6.72 444Petunias 16 Baskets 42 97 5.68 239Other Flowering 32 Baskets 726 99 7.83 5,685
Herbaceous Perennials 3 –Chrysanthemums, Hardy/Garden 44 Pots 6,790 100 1.11 7,504Hosta 26 Pots 152 92 3.53 536Other 104 Pots 32,342 98 2.67 73,331
TOTAL CUT CULTIVATED GREENS 4 40 – – – – –
PROPAGATIVE (UNFINISHED) 81,613Cut Flowers – – – – – 5,645Potted Flowering Plants – – – – – 14,858Bedding/Garden Plants – – – – – 48,614Herbaceous Perennial Plants – – – – – 1,471Foliage Plants – – – – – 10,950
TOTAL ALL PLANTS – – – – – 1,012,795
1 The total covered growing area of 116,293,000 square feet consisted of the following: 24,745,000 square feet of shade and temporary cover; 13,627,000 square feet of glass; 28,981,000 square feet of fi berglass and other rigid greenhouses; 48,940,000 square feet of fi lm plastic (single/multi) greenhouses; and 9,020 acres of open ground.2 For potted plants, price represents a weighted average for plants sold in pots less than 5 inches and in pots 5 inches or more.3 Pot price is a weighted average of all pots to avoid disclosure of individual operations.4 Total includes Leatherleaf Ferns, which are not published to avoid disclosure of individual operations.
Floriculture
Floriculture Production and Value, 2004 1 continued

64 California Agricultural Resource Directory 2006
Floriculture Production and Value, 2005 1
KindNumber of Producers
––––––––––––––––––– Sales –––––––––––––––––– Wholesale Price 2
Value of Sales at WholesaleUnit Number Sold Wholesale
1,000 Percent Dollars $1,000
CUT FLOWERS 288,820
Alstroemeria 26 Stems 4,879 99 0.23 1,142
Carnations, Standard 13 Stems 8,071 98 0.20 1,582
Chrysanthemums, Pompon 23 Bunches 12,001 100 1.39 16,681
Delphinium and Larkspur 48 Stems 28,595 100 0.22 6,177
Gerbera Daisy 30 Stems 101,318 100 0.30 30,193
Iris 38 Stems 74,588 100 0.23 17,081
Lilies, All 46 Stems 101,202 100 0.65 65,478
Lisianthus 32 Stems 11,323 100 0.39 4,371
Orchids, All 15 Blooms 5,172 99 0.60 3,098
Roses, All 34 Stems 80,220 99 0.36 29,280
Snapdragons 42 Spikes 39,092 99 0.25 9,578
Tulips – Stems – – – –
Other Cut Flowers 133 – – 99 – 104,159
POTTED FLOWERING PLANTS 199,253
African Violets 16 Pots 1,341 100 1.60 2,144
Finished Florist Azaleas 19 Pots 639 99 4.80 3,065
Chrysanthemums, Florist 21 Pots 4,835 100 3.25 15,726
Lilies, Easter 27 Pots 1,091 100 3.95 4,306
Orchids 44 Pots 7,780 98 8.08 62,880
Poinsettias 78 Pots 7,366 95 4.19 30,889
Roses, Florist – Pots – – – –
Spring Flowering Bulbs 30 Pots 2,223 100 2.79 6,204
Other Potted Flowering Plants 69 Pots 19,484 97 3.52 74,039
FOLIAGE PLANTS FOR INDOOR OR PATIO USE 109,351Hanging Baskets 62 Baskets 3,987 100 3.49 13,915
Potted Foliage 106 – – 98 – 95,436
ANNUAL BEDDING/GARDEN PLANTS 319,231
Flats
Begonias 49 Flats 451 81 9.34 4,212
Geraniums, Cutting 20 Flats 111 96 9.60 1,066
Geraniums, Seed 13 Flats 58 93 10.24 594
Impatiens 64 Flats 1,387 99 9.60 13,315
Impatiens, New Guinea 10 Flats 46 99 9.74 448
Marigolds 59 Flats 1,084 99 10.17 11,024
Pansy/Viola 57 Flats 1,657 99 9.71 16,089
Petunias 60 Flats 1,453 99 9.99 14,515
Other Flowering and Foliar 61 Flats 6,102 99 11.06 67,488
Vegetable Type 48 Flats 1,259 100 10.61 13,358
Potted
Begonias 51 Pots 2,572 82 1.04 2,686
Geraniums, Cutting 49 Pots 7,080 99 1.65 11,662
Geraniums, Seed 18 Pots 303 99 1.14 345
Impatiens 56 Pots 6,712 92 0.93 6,260
Impatiens, New Guinea 43 Pots 1,229 99 1.83 2,250
Marigolds 43 Pots 1,856 95 0.82 1,528
Pansy/Viola 47 Pots 4,614 95 0.82 3,770
Petunias 44 Pots 3,550 96 0.95 3,371
Other Flowering and Foliar 61 Pots 32,075 98 1.45 46,452
Vegetable Type 50 Pots 7,829 99 1.14 8,911
Floriculture

California Agricultural Resource Directory 2006 65
Floriculture Production and Value, 2005 1
KindNumber of Producers
––––––––––––––––––– Sales –––––––––––––––––– Wholesale Price 2
Value of Sales at WholesaleUnit Number Sold Wholesale
1,000 Percent Dollars $1,000
Hanging Baskets
Begonias 19 Baskets 38 86 7.35 279
Geraniums, Cutting 27 Baskets 219 99 7.09 1,553
Geraniums, Seed – Baskets – – – –
Impatiens 21 Baskets 60 99 6.62 397
Impatiens, New Guinea 20 Baskets 50 99 6.79 340
Pansy/Viola 5 Baskets 2 100 6.44 13
Petunias 20 Baskets 39 99 7.00 273
Other Flowering 32 Baskets 929 100 7.90 7,339
Herbaceous Perennials 3
Chrysanthemums, Hardy/Garden 45 Pots 6,695 100 1.13 7,536
Hosta 25 Pots 117 92 3.42 400
Other 93 Pots 28,405 97 2.53 71,727
TOTAL CUT CULTIVATED GREENS 4 – – – – – –
PROPAGATIVE (UNFINISHED) 67,113Cut Flowers – – – – – 4,065
Potted Flowering Plants – – – – – 13,968
Bedding/Garden Plants – – – – – 43,578
Herbaceous Perennial Plants – – – – – 1,819
Foliage Plants – – – – – 3,673
TOTAL ALL PLANTS – – – – – 983,768.00
Floriculture Production and Value, 2005 1 continued
1 The total covered growing area of 116,281,000 square feet consisted of the following: 23,340,000 square feet of shade and temporary cover; 13,105,000 square feet of glass; 29,274,000 square feet of fi berglass and other rigid greenhouses; 50,562,000 square feet of fi lm plastic (single/multi) greenhouses; and 7,789 acres of open ground.2 For potted plants, price represents a weighted average for plants sold in pots less than 5 inches and in pots 5 inches or more.3 Pot price is a weighted average of all pots to avoid disclosure of individual operations.4 Total includes Leatherleaf Ferns, which are not published to avoid disclosure of individual operations.
Floriculture

66 California Agricultural Resource Directory 2006
Signifi cant Increases in Production:Grapes, Wine .............................................35%Kiwifruit .....................................................Kiwifruit .....................................................Kiwifruit 39%Olives .........................................................32%Oranges, Valencia ......................................86%Plums, Dried ..............................................88%Tangerines ..................................................32%
Notable Decreases in Production:Apricots ......................................................20%Avocados ....................................................30%Cherries, Sweet ..........................................Cherries, Sweet ..........................................Cherries, Sweet 28%Peaches, Freestone ....................................12%Pears, All ....................................................25%Pistachios ...................................................18%
California accounts for 49 percent of the national fruit and nut production and 65 percent of the national value of fruit and nut crops. In 2005, the state produced 15.2 million tons of fruits and nuts, 15 percent more than in 2004. The state’s total production value in 2005 was $10.5 billion, up 9 percent from 2004. Grapes continue to be the top-valued fruit and nut crop with $3.17 billion, increasing 15 percent from the previous year. Crops with record production in 2005 were wine grapes, table grapes, pecans, strawberries, tangerines and walnuts. Califor-nia accounted for nearly all the national production of almonds, fi gs, raisin grapes, olives, Clingstone peaches, persimmons, dried plums, pomegranates and walnuts.
Fruit andNut Crops
phot
o by
Ed
Will
iam
s/ M
erce
d Co
.

California Agricultural Resource Directory 2006 67
Fruit and Nut Crops
The year started with heavy rain, which con-tinued to produce record amounts of precipitation through March and April. The mild to moderate rain allowed fruit and nut crops to bloom well. May already showed signs of summer, with daytime temperatures reaching the 80s in Northern California, while highs in Southern California hit the 90s. The seasonal cycle of irrigation and cultivation continued in grape vineyards and nut orchards. The rest of the summer was hot and dry, with temperatures slowly reaching the 100s in some areas. Almond, raisin grape, table grape, wine grape and pomegranate harvests were in full swing by late summer. October weather showed a typical fall pattern. Grapefruit harvest was delayed due to poor maturity in some areas and Navel orange harvest was delayed due to rains. The year ended with a series of Pacifi c storms that brought record amounts of rain to some Central Valley locations and heavy snow to central and northern Sierra Nevada. According to the USDA Economic Research Service, per capita tree nut (shelled basis) consump-tion in the U.S. for 2004–05 was 3.58 pounds, a 5 percent increase from 2003–04. Almond per capita consumption decreased by 12 percent in 2004–05, from 1.12 pounds to 0.99 pounds. Walnut use in-creased 8 percent, from 0.50 pounds to 0.54 pounds. Pistachios experienced a 47 percent increase in per capita consumption, up to 0.28 pounds per person for 2004–05.
All citrus consumption decreased by 7 percent in 2004–05, to 99.09 pounds per person. Per capita orange consumption dropped 5 percent in 2004–05, but lemons went up by 8 percent to 7.26 pounds. Fresh grape consumption went up by 2 percent in 2004–05, from 7.65 pounds per person to 7.78. Strawberry for fresh consumption increased 3 percent, while the peach and nectarine per capita for fresh consumption decreased by 1 percent.
photos by Ed Williams/Yuba Co.

68 California Agricultural Resource Directory 2006
Fruit and Nut Crops
Berry Acreage, Production and Value, 1996–2005
Crop Crop Year Harvested Yield Per Acre Production Value Per Unit 1 Total ValueAcres Cwt. Cwt. $/Cwt. $1,000
BLUEBERRIES 22005 1,800 51 91,000 446.00 40,583
BOYSENBERRIES1996 270 89 24,000 93.70 2,2481997 270 91 25,000 66.70 1,6421998 250 70 18,000 79.20 1,3861999 300 93 28,000 82.40 2,3082000 260 96 25,000 82.40 2,0612001 230 83 19,000 81.60 1,5502002 210 81 17,000 81.60 1,3882003 200 60 12,000 89.10 1,0692004 300 100 30,000 120.00 3,6002005 310 90 28,000 133.00 3,724
RASPBERRIES1996 1,800 83 149,000 171.00 25,5201997 1,700 85 145,000 139.00 20,2251998 1,700 87 148,000 192.00 28,4701999 1,800 116 208,000 147.00 30,6042000 2,000 113 226,000 190.00 42,9402001 2,300 109 250,000 166.00 41,5002002 2,400 122 292,000 140.00 40,8512003 3,000 205 615,000 208.00 127,9202004 4,100 220 900,000 209.00 188,1002005 4,200 196 825,000 199.00 164,175
STRAWBERRIES, FRESH MARKET1996 – – 9,989,000 52.50 524,4231997 – – 9,618,000 61.40 590,5451998 – – 9,086,000 68.70 624,2081999 – – 10,603,000 72.50 768,7182000 – – 11,518,000 61.40 707,2052001 – – 10,338,000 70.60 729,8632002 – – 11,779,000 67.40 793,9052003 – – 14,377,000 72.80 1,046,6462004 – – 14,830,000 73.30 1,087,0392005 – – 15,825,000 61.80 977,985
STRAWBERRIES, PROCESSING1996 – – 3,619,000 16.70 60,4371997 – – 3,716,000 25.80 95,8731998 – – 4,466,000 29.70 132,6401999 – – 4,748,000 31.20 148,1382000 – – 4,214,000 22.10 93,1292001 – – 3,390,000 28.50 96,6152002 – – 4,318,000 31.90 137,7442003 – – 4,715,000 26.70 125,8912004 – – 4,758,000 24.90 118,4742005 – – 4,755,000 27.80 132,189
STRAWBERRIES, ALL1996 25,200 540 13,608,000 43.00 584,8601997 22,600 590 13,334,000 51.50 686,4181998 24,200 560 13,552,000 55.80 756,8481999 25,800 595 15,351,000 59.70 916,8562000 27,600 570 15,732,000 50.90 800,3342001 26,400 520 13,728,000 60.20 826,4782002 28,500 565 16,097,000 57.90 931,6492003 29,600 645 19,092,000 61.40 1,172,5372004 33,200 590 19,588,000 61.50 1,205,5132005 34,300 600 20,580,000 53.90 1,110,174
1 The processed value is based on equivalent returns at the processing plant door. The fresh market value is at the point of fi rst sale.2 Estimates began in 2005.
Strawberry Monthly and Season Average Prices for Fresh Market Sales, 1996–2005 1
Crop Year
Jan. Feb. Mar. April May June July Aug. Sept. Oct. Nov. Dec. Season Average
––––––––––––––––––––––––––––––––––––––––––––––––––––– $/Cwt. –––––––––––––––––––––––––––––––––––––––––––––––––––––
1996 – 80.30 76.70 38.50 45.60 65.00 44.10 54.80 61.50 40.70 – – 52.501997 116.00 98.30 85.80 42.70 54.30 74.80 56.20 53.10 67.50 69.80 – – 61.401998 120.00 147.00 86.50 67.50 67.40 54.60 56.30 65.00 59.00 80.20 116.00 – 68.701999 167.00 148.00 125.00 88.20 61.00 62.60 57.90 66.20 58.30 45.60 79.00 – 72.502000 95.80 107.00 75.70 68.90 46.10 58.20 56.80 49.60 62.20 95.40 – – 61.402001 153.00 125.00 96.10 75.70 51.60 61.50 68.70 87.40 78.10 80.70 96.40 – 70.602002 185.00 133.00 96.70 60.00 63.40 57.30 53.10 82.60 58.40 68.40 108.00 – 67.402003 105.00 92.70 71.30 69.50 64.20 58.20 66.60 68.10 86.80 100.00 165.00 – 72.802004 150.00 141.00 68.40 52.40 64.50 66.30 59.50 76.90 99.10 100.00 190.00 182.00 73.302005 128.00 120.00 58.10 44.60 54.90 56.40 50.60 65.40 84.30 85.00 102.00 85.00 61.80
1 Prices are average received at point of fi rst sale.

California Agricultural Resource Directory 2006 69
Fruit and Nut Crops
Citrus Acreage, Production and Value, 1996–2005
Crop Crop Year Bearing Non-Bearing 1 Yield Per Acre
Production Value Per Unit 2
Total Value
Acres Acres Cartons Cartons $/Carton $1,000
GRAPEFRUIT, ALL(Net weight per carton: 33.5 pounds) 95-96 18,800 – 862 16,200,000 3.29 53,277
96-97 18,000 – 912 16,400,000 3.21 52,67997-98 16,800 1,800 952 16,000,000 4.21 67,33098-99 16,600 – 880 14,600,000 5.37 78,30999-00 16,600 – 868 14,400,000 4.09 58,79800-01 15,400 – 818 12,600,000 4.39 55,24201-02 14,000 161 842 11,800,000 4.03 47,48502-03 13,000 – 862 11,200,000 5.77 64,59603-04 12,500 391 928 11,600,000 5.08 58,92004-05 12,000 816 1,017 12,200,000 8.09 98,732
LEMONS(Net weight per carton: 38 pounds) 95-96 46,400 – 906 42,000,000 5.20 218,544
96-97 47,400 – 954 45,200,000 6.07 274,12597-98 48,700 6,500 862 42,000,000 5.16 216,65998-99 49,000 – 662 32,400,000 6.39 207,09899-00 49,500 – 768 38,000,000 6.68 253,87600-01 50,500 – 896 45,200,000 4.71 212,72501-02 51,000 2,430 718 36,600,000 7.84 287,02602-03 47,000 – 1,021 48,000,000 5.46 262,04003-04 45,000 3,358 800 36,000,000 6.81 245,28204-05 44,000 3,287 932 41,000,000 6.78 277,991
ORANGES, NAVEL AND MISC.(Net weight per carton: 37.5 pounds) 95-96 121,000 – 628 76,000,000 3.68 279,300
96-97 124,000 – 646 80,000,000 4.68 373,89097-98 129,000 8,300 682 88,000,000 4.42 388,87098-99 130,000 – 324 42,000,000 5.23 219,64099-00 128,000 – 626 80,000,000 3.28 262,16000-01 130,000 – 546 71,000,000 4.99 354,32001-02 130,000 7,499 492 64,000,000 6.44 412,30502-03 129,500 – 649 84,000,000 3.99 335,04003-04 131,000 9,243 603 79,000,000 5.30 418,77304-05 133,000 11,888 662 88,000,000 4.91 431,904
ORANGES, VALENCIA(Net weight per carton: 37.5 pounds) 95-96 75,000 – 533 40,000,000 5.26 210,190
96-97 76,000 – 632 48,000,000 4.39 210,37097-98 73,200 4,800 684 50,000,000 4.52 225,74098-99 73,500 – 408 30,000,000 6.14 184,21099-00 71,000 – 676 48,000,000 1.74 83,49400-01 68,000 – 558 38,000,000 4.22 160,14001-02 65,000 1,080 600 39,000,000 3.76 146,53802-03 60,000 – 667 40,000,000 3.27 130,67203-04 53,000 443 415 22,000,000 6.24 137,24204-05 49,000 402 837 41,000,000 4.19 171,690
ORANGES, ALL(Net weight per carton: 37.5 pounds) 95-96 196,000 – 592 116,000,000 4.22 489,490
96-97 200,000 – 640 128,000,000 4.57 584,26097-98 202,200 13,100 682 138,000,000 4.46 614,61098-99 203,500 – 354 72,000,000 5.61 403,85099-00 199,000 – 644 128,000,000 2.70 345,65400-01 198,000 – 550 109,000,000 4.72 514,46001-02 195,000 8,579 528 103,000,000 5.43 558,84302-03 189,500 – 654 124,000,000 3.76 465,71203-04 184,000 9,686 549 101,000,000 5.51 556,01504-05 182,000 12,290 709 129,000,000 4.68 603,594
TANGERINESINCLUDING MANDARINS AND 95-96 8,800 – 590 5,200,000 5.42 28,184HYBRIDS, TANGELOS AND TANGORS 96-97 8,700 – 598 5,200,000 7.56 39,298(Net weight per carton: 37.5 pounds) 97-98 8,800 1,900 546 4,800,000 5.74 27,530
98-99 8,600 – 348 3,000,000 7.34 22,02399-00 8,800 – 568 5,000,000 5.55 27,75900-01 9,000 – 488 4,400,000 7.08 31,13701-02 9,500 2,794 464 4,400,000 8.83 38,82102-03 9,700 – 577 5,600,000 7.90 44,20203-04 10,500 7,691 419 4,400,000 7.55 33,22204-05 13,000 11,834 446 5,800,000 9.21 53,432
1 Non-bearing shown only in year when acreage surveys were conducted.2 Equivalent packinghouse door returns.

70 California Agricultural Resource Directory 2006
Fruit and Nut Crops
Citrus Sales by Utilization and Value Per Carton, 1996–2005
Crop Crop Year ––––––– All Sales ––––––– –––––– Fresh Market –––––– –––––– Processing ––––––
Quantity Value 1 Quantity Value 1 Quantity Value 1
1,000 Cartons $/Carton 1,000 Cartons $/Carton 1,000 Cartons $/Carton
GRAPEFRUIT, ALL(Net weight per carton: 33.5 pounds) 95-96 16,200 3.29 12,000 4.48 4,200 (0.12)
96-97 16,400 3.21 12,120 4.38 4,280 (0.10)97-98 16,000 4.21 11,088 6.13 4,912 (0.13)98-99 14,600 5.37 13,276 5.91 1,324 (0.07)99-00 14,400 4.09 12,400 4.80 2,000 (0.33)00-01 12,600 4.39 10,800 5.14 1,800 (0.12)01-02 11,800 4.03 10,200 4.68 1,600 (0.13)02-03 11,200 5.77 9,800 6.61 1,400 (0.13)03-04 11,600 5.08 10,200 5.80 1,400 (0.14)04-05 12,200 8.09 10,800 9.16 1,400 (0.14)
LEMONS(Net weight per carton: 38 pounds) 95-96 42,000 5.20 21,600 9.23 20,400 0.94
96-97 45,200 6.06 23,080 10.43 22,120 1.51 97-98 42,000 5.16 19,840 9.58 22,160 1.20 98-99 32,400 6.39 19,570 10.33 12,830 0.38 99-00 38,000 6.68 23,200 10.49 14,800 0.71 00-01 45,200 4.70 23,020 9.00 22,180 0.25 01-02 36,600 7.84 25,040 11.41 11,560 0.13 02-03 48,000 5.46 26,200 9.91 21,800 0.11 03-04 36,000 6.81 24,400 10.01 11,600 0.10 04-05 41,000 6.78 23,600 11.71 17,400 0.09
ORANGES, NAVEL AND MISC.(Net weight per carton: 37.5 pounds) 95-96 76,000 3.68 58,000 4.89 18,000 (0.24)
96-97 80,000 4.68 69,000 5.39 11,000 0.18 97-98 88,000 4.42 73,000 5.29 15,000 0.18 98-99 42,000 5.23 23,000 9.41 19,000 0.18 99-00 80,000 3.28 62,000 4.24 18,000 (0.04)00-01 71,000 4.99 61,000 5.82 10,000 (0.07)01-02 64,000 6.44 55,800 7.40 8,200 (0.08)02-03 84,000 3.99 68,000 4.88 16,000 0.20 03-04 79,000 5.30 68,600 6.08 10,400 0.20 04-05 88,000 4.91 67,400 6.35 20,600 0.19
ORANGES, VALENCIA(Net weight per carton: 37.5 pounds) 95-96 40,000 5.26 31,000 6.85 9,000 (0.24)
96-97 48,000 4.39 34,000 5.65 14,000 1.31 97-98 50,000 4.52 38,000 5.50 12,000 1.40 98-99 30,000 6.14 16,000 10.21 14,000 1.50 99-00 48,000 1.74 25,400 3.35 22,600 (0.07)00-01 38,000 4.22 31,000 5.08 7,000 0.38 01-02 39,000 3.76 32,700 4.41 6,300 0.37 02-03 40,000 3.27 31,600 4.09 8,400 0.17 03-04 22,000 6.24 20,400 6.72 1,600 0.16 04-05 41,000 4.19 31,000 5.49 10,000 0.16
ORANGES, ALL(Net weight per carton: 37.5 pounds) 95-96 116,000 4.22 89,000 5.58 27,000 (0.24)
96-97 128,000 4.57 103,000 5.48 25,000 0.81 97-98 138,000 4.46 111,000 5.36 27,000 0.72 98-99 72,000 5.61 39,000 9.74 33,000 0.74 99-00 128,000 2.70 87,400 3.98 40,600 (0.06)00-01 109,000 4.72 92,000 5.57 17,000 0.12 01-02 103,000 5.43 88,500 6.30 14,500 0.12 02-03 124,000 3.76 99,600 4.63 24,400 0.19 03-04 101,000 5.51 89,000 6.22 12,000 0.19 04-05 129,000 4.68 98,400 6.08 30,600 0.18
TANGERINESINCLUDING MANDARINS AND 95-96 5,200 5.42 3,600 7.90 1,600 (0.16)HYBRIDS, TANGELOS AND TANGORS 96-97 5,200 7.56 4,240 9.30 960 (0.14)(Net weight per carton: 37.5 pounds) 97-98 4,800 5.74 3,296 8.35 1,504 0.01
98-99 3,000 7.34 2,126 10.16 874 0.50 99-00 5,000 5.55 3,400 8.20 1,600 (0.07)00-01 4,400 7.08 3,420 9.13 980 (0.09)01-02 4,400 8.83 3,940 9.81 460 0.37 02-03 5,600 7.90 4,900 8.99 700 0.22 03-04 4,400 7.55 3,878 8.55 522 0.16 04-05 5,800 9.21 4,952 10.76 846 0.15
1 Equivalent packinghouse door returns.

California Agricultural Resource Directory 2006 71
Fruit and Nut Crops
Citrus Monthly and Season Average Prices, 1996–2005
Crop Crop Year
Nov. Dec. Jan. Feb. Mar. April May June July Aug. Sept. Oct. Season Average–––––––––––––––––––––––––––––––––––––––––––––––––––––– $/Carton ––––––––––––––––––––––––––––––––––––––––––––––––
GRAPEFRUIT, ALL
Fresh Sales 95-96 7.28 4.93 4.18 3.63 3.23 3.38 4.88 3.98 3.33 5.63 7.08 7.08 4.48 96-97 6.83 6.38 5.28 4.13 3.48 3.43 3.73 4.58 4.63 4.23 4.23 3.33 4.38 97-98 3.48 4.73 4.63 3.58 3.88 4.38 5.13 5.58 6.23 7.23 9.22 9.22 6.13 98-99 7.91 7.36 7.56 5.66 4.51 4.16 6.21 7.36 6.46 4.66 3.16 4.81 5.91 99-00 6.90 6.50 6.25 5.25 4.35 3.45 4.05 5.10 4.65 4.50 4.70 5.40 4.80 00-01 5.99 5.79 5.69 4.74 4.89 4.54 5.79 5.44 4.94 4.69 5.09 4.84 5.14 01-02 5.38 5.53 5.38 5.08 2.98 3.53 4.68 4.98 5.03 4.88 4.18 4.43 4.68 02-03 7.26 7.21 5.91 5.21 3.81 5.26 6.96 7.81 6.56 6.01 9.06 7.41 6.61 03-04 5.75 5.05 5.15 4.45 2.90 4.05 5.60 5.65 5.25 5.45 8.70 6.95 5.80 04-05 7.96 6.71 7.41 6.86 6.21 10.51 10.66 10.51 9.76 8.71 10.76 8.76 9.16
Processing 95-96 (0.11) (0.11) (0.11) (0.11) (0.11) (0.11) (0.11) (0.11) (0.11) (0.11) (0.14) (0.14) (0.12)96-97 (0.13) (0.13) 0.09 0.10 (0.10) (0.18) (0.15) (0.09) (0.07) 0.01 (0.12) (0.20) (0.10)97-98 (0.13) (0.13) (0.13) (0.13) (0.13) (0.13) (0.13) (0.13) (0.13) (0.13) (0.15) (0.15) (0.13)98-99 (0.08) (0.16) (0.05) (0.08) (0.16) (0.16) (0.10) (0.03) (0.03) (0.03) (0.03) (0.03) (0.07)99-00 (0.33) (0.33) (0.33) (0.33) (0.33) (0.33) (0.33) (0.33) (0.33) (0.33) (0.33) (0.33) (0.33)00-01 (0.12) (0.12) (0.12) (0.12) (0.12) (0.12) (0.12) (0.12) (0.12) (0.12) (0.12) (0.12) (0.12)01-02 (0.13) (0.13) (0.13) (0.13) (0.13) (0.13) (0.13) (0.13) (0.13) (0.13) (0.13) (0.13) (0.13)02-03 (0.13) (0.13) (0.13) (0.13) (0.13) (0.13) (0.13) (0.13) (0.13) (0.13) (0.13) (0.13) (0.13)03-04 (0.14) (0.14) (0.14) (0.14) (0.14) (0.14) (0.14) (0.14) (0.14) (0.14) (0.14) (0.14) (0.14)04-05 (0.14) (0.14) (0.14) (0.14) (0.14) (0.14) (0.14) (0.14) (0.14) (0.14) (0.14) (0.14) (0.14)
All Sales 95-96 6.07 4.65 3.23 2.96 2.29 2.21 3.66 3.24 2.52 3.16 4.98 6.00 3.29 96-97 6.40 5.70 4.36 3.18 2.28 2.11 1.98 3.37 4.37 2.88 2.75 1.85 3.21 97-98 2.96 4.12 4.05 2.79 2.66 2.58 2.62 3.31 4.34 5.43 7.78 7.96 4.21 98-99 6.90 6.52 6.64 4.63 3.79 2.97 6.06 7.04 5.97 4.14 2.90 3.62 5.37 99-00 5.93 6.01 5.62 4.85 4.19 3.31 3.57 4.37 3.87 3.40 4.17 4.53 4.09 00-01 5.05 5.30 5.06 4.33 4.69 4.35 5.09 4.68 4.14 3.58 4.53 4.07 4.39 01-02 4.54 5.17 4.83 4.83 2.89 3.41 4.12 4.29 4.25 3.75 3.73 3.74 4.03 02-03 6.11 6.69 5.35 4.95 3.67 5.10 6.13 6.74 5.55 4.65 8.06 6.22 5.77 03-04 4.88 4.71 4.66 4.31 2.73 3.93 4.94 4.88 4.48 4.29 7.88 5.91 5.08 04-05 6.69 6.20 6.67 6.56 5.79 10.16 9.38 9.07 8.32 6.87 9.79 7.58 8.10
Crop Crop Year
Aug. Sept. Oct. Nov. Dec. Jan. Feb. Mar. April May June July Season Average–––––––––––––––––––––––––––––––––––––––––––––––––––––– $/Carton ––––––––––––––––––––––––––––––––––––––––––––––––
LEMONS, ALL
Fresh Sales 95-96 17.43 15.33 11.53 7.78 6.08 5.48 4.88 5.58 7.48 9.83 13.33 15.83 9.23 96-97 14.58 13.48 11.03 9.98 8.68 7.08 5.58 5.28 6.93 11.68 16.73 19.88 10.43 97-98 20.73 18.33 11.88 6.78 5.48 4.83 4.53 5.63 7.08 9.68 14.73 18.08 9.58 98-99 16.68 13.43 14.18 11.03 8.58 10.28 7.38 7.13 8.68 10.33 13.08 15.28 10.33 99-00 14.69 15.24 13.14 10.59 11.69 11.44 8.89 8.94 7.59 7.14 10.89 13.94 10.49 00-01 14.30 30.10 7.50 5.85 5.70 5.25 5.20 6.35 8.75 9.65 10.55 13.40 9.00 01-02 15.26 13.61 14.24 12.11 10.43 9.38 8.40 7.99 9.21 10.66 13.11 13.66 11.41 02-03 14.81 14.66 13.06 10.91 8.56 7.11 4.96 4.91 8.16 10.31 11.26 11.46 9.91 03-04 11.41 9.46 7.71 7.76 7.21 6.61 7.56 9.46 10.76 11.11 12.31 13.06 10.01 04-05 12.76 12.46 11.46 10.86 11.01 10.91 10.36 10.11 11.46 16.95 13.26 12.86 11.71
Processing 95-96 0.94 0.94 0.94 0.94 0.94 0.94 0.94 0.94 0.94 0.94 0.94 0.94 0.94 96-97 1.51 1.51 1.51 1.51 1.51 1.51 1.51 1.51 1.51 1.51 1.51 1.51 1.51 97-98 1.51 1.51 1.51 1.23 1.23 1.23 1.23 1.13 1.13 1.13 1.13 1.13 1.20 98-99 1.10 1.10 1.10 0.34 0.34 0.34 0.34 0.34 0.34 0.34 0.34 0.34 0.39 99-00 0.71 0.71 0.71 0.71 0.71 0.71 0.71 0.71 0.71 0.71 0.71 0.71 0.71 00-01 0.70 0.70 0.70 0.16 0.16 0.16 0.16 0.16 0.16 0.16 0.16 0.16 0.25 01-02 0.15 0.15 0.15 0.12 0.12 0.12 0.12 0.12 0.12 0.12 0.12 0.12 0.13 02-03 0.11 0.11 0.11 0.11 0.11 0.11 0.11 0.11 0.11 0.11 0.11 0.11 0.11 03-04 0.10 0.10 0.10 0.10 0.10 0.10 0.10 0.10 0.10 0.10 0.10 0.10 0.10 04-05 0.09 0.09 0.09 0.09 0.09 0.09 0.09 0.09 0.09 0.09 0.09 0.09 0.09
All Sales 95-96 11.38 9.64 6.83 4.80 3.60 2.87 2.74 3.16 4.26 5.36 7.52 8.58 5.20 96-97 9.44 8.90 6.72 5.91 5.19 3.99 2.74 2.81 4.46 9.49 14.39 16.54 6.06 97-98 13.65 11.12 7.11 4.17 3.30 2.84 2.71 2.69 3.24 5.26 10.05 13.49 5.16 98-99 13.49 10.70 11.68 8.03 5.35 5.62 4.39 4.58 4.99 5.91 7.01 8.85 6.39 99-00 10.50 11.95 9.70 7.51 7.85 7.74 6.86 6.34 4.77 3.84 5.44 7.97 6.68 00-01 8.77 6.51 4.17 3.05 2.91 2.42 2.45 2.76 3.90 4.77 6.58 9.98 4.71 01-02 11.32 9.81 11.67 9.57 6.76 5.55 4.39 5.03 6.33 7.38 9.84 10.95 7.84 02-03 12.27 11.32 9.49 7.09 5.45 3.91 2.73 2.46 4.45 4.86 5.02 5.25 5.46 03-04 8.75 7.37 5.63 5.06 4.09 3.53 4.48 5.93 7.10 8.46 9.71 9.58 6.82 04-05 11.54 11.13 10.02 7.74 6.84 6.56 5.73 5.01 5.43 4.69 9.04 7.98 6.78

72 California Agricultural Resource Directory 2006
Fruit and Nut Crops
Citrus Monthly and Season Average Prices, 1996–2005
Crop Crop Year
Nov. Dec. Jan. Feb. Mar. April May June July Aug. Sept. Oct. Season Average–––––––––––––––––––––––––––––––––––––––––––––––––––––– $/Carton ––––––––––––––––––––––––––––––––––––––––––––––––
ORANGES, NAVEL AND MISC.
Fresh Sales 95-96 – 6.99 4.54 4.24 3.79 5.04 5.84 7.79 – – – – 4.89 96-97 10.29 6.24 5.19 5.09 4.69 4.79 5.69 7.94 – – – – 5.39 97-98 6.24 5.34 4.99 4.44 4.44 4.99 6.69 7.14 8.14 – – – 5.29 98-99 – 7.71 7.31 11.41 10.56 10.31 13.81 13.36 – – – – 9.41 99-00 – 6.94 4.74 4.29 3.69 3.64 3.49 4.24 6.39 – – – 4.24 00-01 6.97 5.52 4.97 4.77 5.02 6.32 7.62 8.67 9.42 – – – 5.82 01-02 – 9.70 8.10 7.55 6.90 6.45 7.25 8.55 – – – – 7.40 02-03 – 6.73 5.33 4.03 3.28 4.38 5.48 6.18 7.58 6.43 – – 4.88 03-04 – 7.28 6.18 5.43 5.48 6.28 6.18 6.48 7.73 – – – 6.08 04-05 12.25 7.70 6.40 5.95 5.65 5.75 6.45 6.90 6.85 – – – 6.35
Processing 95-96 – (0.24) (0.24) (0.24) (0.24) (0.24) (0.24) (0.24) – – – – (0.24)96-97 (0.14) (0.14) (0.14) (0.04) 0.30 0.32 0.32 0.33 – – – – 0.18 97-98 (0.14) (0.14) (0.14) (0.02) 0.10 0.33 0.33 0.33 0.33 – – – 0.18 98-99 – 0.23 0.31 0.42 0.12 (0.10) (0.12) 0.03 – – – – 0.18 99-00 – (0.04) (0.04) (0.04) (0.04) (0.04) (0.04) (0.04) (0.04) – – – (0.04)00-01 (0.07) (0.07) (0.07) (0.07) (0.07) (0.07) (0.07) (0.07) (0.07) – – – (0.07)01-02 – (0.08) (0.08) (0.08) (0.08) (0.08) (0.08) (0.08) – – – – (0.08)02-03 – 0.20 0.20 0.20 0.20 0.20 0.20 0.20 0.20 0.20 – – 0.20 03-04 – 0.20 0.20 0.20 0.20 0.20 0.20 0.20 0.20 – – – 0.20 04-05 – 0.19 0.19 0.19 0.19 0.19 0.19 0.19 0.19 – – – 0.19
All Sales 95-96 – 6.16 4.02 3.46 2.80 3.43 3.82 5.50 – – – – 3.68 96-97 7.97 5.43 4.66 4.58 4.06 4.13 4.72 6.80 – – – – 4.68 97-98 5.24 4.79 4.42 3.83 3.77 3.98 5.39 5.37 6.69 – – – 4.42 98-99 – 6.56 6.10 3.65 5.49 4.93 6.61 6.69 – – – – 5.23 99-00 – 5.76 4.12 3.73 3.03 2.78 2.50 2.73 3.78 – – – 3.28 00-01 4.63 4.66 4.41 4.31 4.44 5.30 6.12 7.13 9.42 – – – 4.99 01-02 – 8.73 7.17 7.03 6.17 5.41 5.84 7.32 – – – – 6.44 02-03 – 5.98 4.92 3.48 2.70 3.41 4.24 4.72 5.47 4.36 – – 3.99 03-04 – 6.43 5.77 4.94 4.91 5.45 4.90 5.10 6.89 – – – 5.30 04-05 12.25 6.74 5.55 4.95 4.49 4.31 4.29 4.67 4.63 – – – 4.91
Crop Crop Year
Feb. Mar. April May June July Aug. Sept. Oct. Nov. Dec. Jan. Season Average––––––––––––––––––––––––––––––––––––––––––––––––– $/Carton ––––––––––––––––––––––––––––––––––––––––––––––––
ORANGES, VALENCIA
Fresh Sales 95-96 – 6.65 6.00 5.65 5.55 6.55 7.70 10.60 8.75 – – – 6.85 96-97 6.35 6.35 5.40 5.20 5.25 5.45 6.30 6.40 5.75 – – – 5.65 97-98 4.60 5.85 6.60 6.45 5.95 5.20 4.60 5.05 5.50 6.55 – – 5.50 98-99 12.56 11.76 11.76 12.01 10.76 9.21 8.61 10.36 10.01 7.61 – – 10.21 99-00 – 4.65 4.55 4.00 3.75 3.20 2.95 3.10 2.50 – – – 3.35 00-01 5.53 5.73 6.08 5.63 4.88 4.33 4.48 5.38 4.83 – – – 5.08 01-02 7.61 5.81 4.96 4.36 3.91 3.76 4.31 4.36 4.51 – – – 4.41 02-03 5.04 4.79 5.19 4.54 3.79 3.69 4.04 3.69 3.64 – – – 4.09 03-04 4.77 5.87 5.37 5.72 6.37 6.02 6.72 8.92 11.47 – – – 6.72 04-05 6.39 6.44 6.39 5.99 5.64 4.84 4.64 5.29 5.14 – – – 5.49
Processing 95-96 (0.24) (0.24) (0.24) (0.24) (0.24) (0.24) (0.24) (0.24) (0.24) – – – (0.24)96-97 1.02 0.67 0.54 0.63 0.76 1.44 1.69 1.70 1.63 – – – 1.31 97-98 0.98 0.98 0.68 1.27 1.55 1.55 1.55 1.78 0.92 0.76 – – 1.40 98-99 1.53 2.32 0.96 1.16 1.56 1.56 1.56 1.56 1.56 1.56 – – 1.50 99-00 – (0.07) (0.07) (0.07) (0.07) (0.07) (0.07) (0.07) (0.07) – – – (0.07)00-01 – 0.38 0.38 0.38 0.38 0.38 0.38 0.38 0.38 – – – 0.38 01-02 0.37 0.37 0.37 0.37 0.37 0.37 0.37 0.37 0.37 – – – 0.37 02-03 – 0.17 0.17 0.17 0.17 0.17 0.17 0.17 0.17 – – – 0.17 03-04 – 0.16 0.16 0.16 0.16 0.16 0.16 – – – – – 0.16 04-05 – 0.15 0.15 0.15 0.15 0.15 0.15 0.15 0.15 – – – 0.15
All Sales 95-96 – 5.93 4.79 4.77 4.11 4.63 5.50 7.89 6.24 – – – 5.26 96-97 5.02 5.04 4.56 4.42 4.01 4.28 4.77 4.62 4.04 – – – 4.39 97-98 3.21 4.23 5.19 5.60 5.07 4.43 3.82 4.06 4.26 5.69 – – 4.52 98-99 9.55 10.18 8.81 7.47 6.97 5.42 4.46 6.11 5.84 5.59 – – 6.14 99-00 – 3.86 3.93 3.19 2.63 1.66 1.33 1.30 0.87 – – – 1.74 00-01 5.53 5.42 5.49 4.99 4.04 3.49 3.68 4.27 3.62 – – – 4.22 01-02 6.41 4.82 3.94 3.66 3.27 3.26 3.84 3.86 3.89 – – – 3.76 02-03 5.04 4.33 4.88 4.15 3.35 2.99 3.08 2.72 2.14 – – – 3.27 03-04 4.77 5.30 4.85 5.35 5.71 5.37 6.33 8.92 11.47 – – – 6.24 04-05 6.39 5.60 5.35 5.46 5.07 4.28 3.10 3.37 2.81 – – – 4.19
Citrus Monthly and Season Average Prices, 1996–2005 continued
Oct. Nov. Dec. Jan. Feb. Mar. April May June July Aug. Sept.

California Agricultural Resource Directory 2006 73
Fruit and Nut Crops
Citrus Monthly and Season Average Prices, 1996–2005
Crop Crop Year
Nov. Dec. Jan. Feb. Mar. April May June July Aug. Sept. Oct. Season Average–––––––––––––––––––––––––––––––––––––––––––––––––––––– $/Carton ––––––––––––––––––––––––––––––––––––––––––––––––
TANGERINES
Fresh Sales 95-96 14.45 9.80 7.10 5.40 6.10 6.95 6.85 6.15 – – – – 7.90 96-97 15.00 10.65 8.45 9.35 8.25 7.05 8.05 6.90 – – – – 9.30 97-98 15.45 10.25 8.85 8.00 7.00 7.10 6.35 (0.25) (0.40) – – – 8.35 98-99 13.51 11.71 10.16 9.76 8.56 8.91 1.96 – – – – – 10.16 99-00 18.10 12.50 8.30 7.20 6.25 7.95 7.75 6.55 – – – – 8.20 00-01 15.53 10.58 8.28 7.63 9.48 11.03 3.98 – – – – – 9.13 01-02 16.91 10.76 8.26 10.41 10.01 9.26 9.86 10.46 – – – – 9.81 02-03 14.94 11.89 9.69 8.99 7.74 7.89 9.24 8.69 – – – – 8.99 03-04 17.05 12.55 10.60 9.15 7.60 8.05 8.50 (1.76) – – – – 8.55 04-05 17.31 14.11 12.11 9.66 9.66 9.66 11.31 9.56 – – – – 10.76
Processing 95-96 – (0.16) (0.16) (0.16) (0.16) (0.16) (0.16) (0.16) – – – – (0.16)96-97 (0.14) (0.14) (0.14) (0.14) (0.14) (0.14) (0.14) – – – – – (0.14)97-98 (0.14) (0.14) (0.14) (0.04) 0.10 0.33 0.33 0.33 0.33 – – – 0.01 98-99 0.21 0.21 0.69 0.73 0.69 0.35 (0.17) – – – – – 0.50 99-00 (0.07) (0.07) (0.07) (0.07) (0.07) (0.07) (0.07) (0.07) – – – – (0.07)00-01 (0.09) (0.09) (0.09) (0.09) (0.09) (0.09) (0.09) – – – – – (0.09)01-02 0.37 0.37 0.37 0.37 0.37 0.37 0.37 – – – – – 0.37 02-03 – 0.36 0.36 0.36 0.17 0.17 0.17 0.17 – – – – 0.22 03-04 – 0.16 0.16 0.16 0.16 0.16 0.16 – – – – – 0.16 04-05 0.15 0.15 0.15 0.15 0.15 0.15 0.15 – – – – – 0.15
All Sales 95-96 14.45 8.66 6.19 3.72 3.19 3.11 3.34 4.04 – – – – 5.42 96-97 12.47 8.56 6.69 7.85 6.50 5.71 7.30 6.90 – – – – 7.56 97-98 10.00 7.01 5.26 5.32 5.43 5.41 4.63 (0.09) (0.17) – – – 5.74 98-99 9.88 8.54 7.57 6.86 6.24 5.89 1.59 – – – – – 7.34 99-00 13.56 8.03 6.24 5.38 4.45 4.94 4.92 3.52 – – – – 5.55 00-01 10.23 8.20 6.12 5.71 6.96 9.05 3.59 – – – – – 7.08 01-02 15.26 8.94 7.99 9.51 8.84 7.90 9.04 10.46 – – – – 8.83 02-03 14.94 10.93 8.97 8.33 6.69 6.70 7.45 7.88 – – – – 7.90 03-04 17.05 11.39 9.28 8.04 6.65 7.00 7.73 (1.76) – – – – 7.55 04-05 16.71 12.21 11.30 7.98 8.05 8.08 10.79 9.56 – – – – 9.21
Citrus Monthly and Season Average Prices, 1996–2005 continued
Drying Ratio – Tons of Green Fruit Required to Produce One Dried Ton
Year Apricots Figs Grapes, Raisin Grapes, Table Peaches, Freestone Pears, Bartlett Plums, Dried
1996 6.90 3.00 4.20 – 9.60 7.00 3.20 1997 6.90 3.00 4.15 – 9.00 6.75 3.06 1998 7.20 3.00 4.70 – 8.06 6.91 3.20 1999 1 3.00 4.17 – 8.49 6.93 2.90 2000 7.14 3.00 4.43 – 9.33 6.67 3.11 2001 7.32 3.00 4.15 – 10.07 6.00 2.80 2002 7.14 3.00 4.30 4.44 9.31 6.52 3.02 2003 7.56 3.00 4.54 4.52 9.49 6.56 3.19 2004 7.24 3.00 3.99 3.94 11.95 6.45 2.94 2005 8.46 3.00 4.80 4.86 10.95 6.75 3.05
1 Not available.
Oct. Nov. Dec. Jan. Feb. Mar. April May June July Aug. Sept.

74 California Agricultural Resource Directory 2006
Fruit and Nut Crops
Non-Citrus Fruit Acreage, Production and Value, 1996–2005
Crop Crop Year
Bearing Non-Bearing 1 Yield Per Acre Production Value Per Unit 2 Total ValueAcres Acres Tons Tons $/Ton $1,000
APPLES 1996 38,000 – 12.50 475,000 332.00 158,0501997 38,500 – 12.50 481,000 338.00 162,6551998 37,000 – 11.60 430,000 308.00 132,4901999 36,000 – 12.50 448,000 316.00 141,7642000 33,000 – 8.65 285,000 328.00 83,4302001 30,000 – 8.65 260,000 314.00 77,1102002 28,000 – 8.40 235,000 408.00 93,8402003 28,000 – 8.04 225,000 355.00 78,1902004 26,000 – 6.83 177,500 298.00 52,9752005 25,000 – 7.10 177,500 421.00 74,718
APRICOTS 1996 20,200 – 3.76 76,000 403.00 30,6631997 20,000 – 6.60 132,000 308.00 37,6731998 20,000 – 5.65 113,000 311.00 31,8951999 19,000 – 4.47 85,000 361.00 30,7032000 19,000 – 4.74 90,000 329.00 26,6792001 18,000 – 4.28 77,000 319.00 22,3302002 16,000 – 5.31 85,000 306.00 22,9642003 16,500 – 5.61 92,500 316.00 29,2212004 16,000 – 5.88 94,000 334.00 28,5752005 14,500 – 5.21 75,500 481.00 33,930
AVOCADOS 95-96 61,100 – 2.80 171,000 1,370.00 234,83196-97 59,900 – 2.79 167,000 1,560.00 260,16297-98 59,900 – 2.57 154,000 1,710.00 263,47398-99 59,400 – 2.29 136,000 2,400.00 327,00299-00 59,000 – 2.73 161,000 2,110.00 339,59400-01 59,000 – 3.61 213,000 1,480.00 315,84201-02 58,500 – 3.42 200,000 1,790.00 358,00002-03 59,500 – 2.82 168,000 2,170.00 364,56003-04 60,500 – 3.57 216,000 1,760.00 380,16004-05 62,000 – 2.44 151,000 1,830.00 276,330
CHERRIES, SWEET 1996 16,500 – 1.49 24,600 1,850.00 45,4301997 17,000 – 2.89 49,200 1,290.00 63,3751998 17,500 – 0.87 15,200 1,550.00 23,5121999 18,500 – 4.38 81,000 866.00 68,8662000 20,000 – 2.35 47,000 1,570.00 71,5642001 22,000 – 2.51 55,300 1,560.00 79,8142002 24,000 – 2.31 55,500 1,740.00 93,3152003 25,000 – 2.62 65,600 1,670.00 106,8832004 26,000 – 2.81 73,000 1,750.00 123,1562005 27,000 – 1.95 52,700 1,740.00 84,751
DATES 1996 4,680 – 4.91 23,000 1,090.00 25,0701997 4,800 – 4.38 21,000 1,100.00 23,1001998 5,000 – 4.98 24,900 1,220.00 30,3781999 5,100 – 4.35 22,200 1,240.00 27,5282000 5,000 – 3.48 17,400 1,230.00 21,4022001 4,900 – 4.02 19,700 1,360.00 26,7922002 4,800 – 5.04 24,200 1,550.00 37,5102003 5,200 – 3.46 18,000 1,380.00 24,8402004 5,500 – 3.13 17,200 1,310.00 22,5322005 5,300 – 3.02 16,000 1,310.00 20,960
FIGS 1996 15,400 – 2.95 45,500 283.00 12,8941997 16,400 – 3.51 57,500 265.00 15,2091998 16,600 – 3.11 51,600 222.00 11,4451999 15,100 – 3.13 47,300 268.00 12,6852000 15,900 – 3.52 55,900 272.00 15,2262001 14,600 – 2.81 41,000 366.00 15,0122002 13,500 – 3.94 53,200 340.00 18,0872003 13,000 – 3.73 48,500 317.00 15,3732004 12,800 – 3.99 51,100 396.00 20,2142005 12,300 – 4.14 50,900 435.00 22,122

California Agricultural Resource Directory 2006 75
Fruit and Nut Crops
Non-Citrus Fruit Acreage, Production and Value, 1996–2005
Crop Crop Year
Bearing Non-Bearing 1 Yield Per Acre Production Value Per Unit 2 Total ValueAcres Acres Tons Tons $/Ton $1,000
GRAPES, RAISIN 3,4 1996 270,000 7,800 8.12 2,192,000 281.00 614,9401997 270,000 5,300 10.70 2,883,000 262.00 756,4051998 275,000 6,000 7.55 2,077,000 291.00 604,0361999 279,000 7,000 7.61 2,122,000 321.00 680,8642000 280,000 7,000 10.40 2,921,000 166.00 485,1392001 235,000 7,000 9.43 2,215,000 186.00 411,2962002 246,000 6,000 11.40 2,804,000 152.00 425,8382003 255,000 5,000 8.71 2,220,000 170.00 374,1672004 244,000 4,000 8.35 2,038,000 306.00 624,6002005 240,000 6,000 9.61 2,306,000 246.00 567,140
GRAPES, TABLE 1996 80,000 14,800 7.40 592,000 650.00 384,5051997 81,000 13,100 10.20 825,000 448.00 369,4201998 83,000 15,000 7.75 643,000 499.00 320,6931999 87,000 13,000 8.71 758,000 552.00 418,4972000 89,000 11,000 8.70 774,000 565.00 437,4482001 88,000 10,000 8.10 713,000 610.00 435,1772002 88,000 9,000 8.44 743,000 616.00 457,6282003 85,000 8,000 8.61 732,000 601.00 407,6072004 83,000 9,000 9.28 770,000 695.00 535,0092005 83,000 10,000 10.40 867,000 443.00 383,910
GRAPES, WINE 1996 350,000 76,200 6.36 2,225,000 536.00 1,192,1851997 374,000 78,300 7.86 2,940,000 598.00 1,756,9351998 385,000 122,000 6.68 2,570,000 581.00 1,491,9081999 424,000 130,000 6.28 2,662,000 585.00 1,556,4052000 458,000 110,000 7.34 3,364,000 567.00 1,908,6492001 480,000 90,000 6.36 3,051,000 597.00 1,820,1062002 486,000 70,000 6.48 3,149,000 535.00 1,683,4522003 479,000 50,000 6.07 2,909,000 530.00 1,542,8762004 473,000 40,000 5.95 2,815,000 570.00 1,604,9252005 477,000 45,000 7.98 3,805,000 582.00 2,214,665
GRAPES, ALL 3,5 1996 700,000 98,800 7.16 5,009,000 438.00 2,191,6301997 725,000 96,700 9.17 6,648,000 434.00 2,882,7601998 743,000 143,000 7.12 5,290,000 457.00 2,416,6371999 790,000 150,000 7.02 5,542,000 479.00 2,655,7662000 827,000 128,000 8.54 7,059,000 401.00 2,831,2362001 803,000 107,000 7.45 5,979,000 446.00 2,666,5792002 820,000 85,000 8.17 6,696,000 383.00 2,566,9182003 819,000 63,000 7.16 5,861,000 402.00 2,324,6502004 800,000 53,000 7.03 5,623,000 492.00 2,764,5342005 800,000 61,000 8.72 6,978,000 454.00 3,165,715
KIWIFRUIT 1996 5,700 – 5.53 31,500 470.00 13,1571997 5,300 – 6.60 35,000 518.00 16,4831998 5,300 – 6.91 36,600 744.00 24,5441999 5,300 – 5.09 27,000 634.00 15,2152000 5,300 – 6.42 34,000 455.00 13,8882001 4,900 – 5.27 25,800 667.00 15,3402002 4,500 – 5.80 26,100 783.00 18,0972003 4,500 – 5.64 25,400 853.00 20,4722004 4,500 – 5.93 26,700 809.00 19,9772005 4,500 – 8.27 37,200 644.00 23,326
NECTARINES 1996 35,000 – 7.06 247,000 474.00 116,9771997 36,000 – 7.33 264,000 375.00 98,8951998 35,500 – 6.31 224,000 471.00 105,4661999 35,500 – 7.72 274,000 411.00 112,4972000 35,500 – 7.52 267,000 398.00 106,2562001 36,500 – 7.53 275,000 464.00 127,6422002 36,500 – 8.22 300,000 382.00 114,6002003 36,500 – 7.48 273,000 436.00 119,0282004 36,500 – 7.37 269,000 342.00 86,1842005 36,500 – 6.55 239,000 504.00 120,456
Non-Citrus Fruit Acreage, Production and Value, 1996–2005 continued

76 California Agricultural Resource Directory 2006
Fruit and Nut Crops
Non-Citrus Fruit Acreage, Production and Value, 1996–2005
Crop Crop Year
Bearing Non-Bearing 1 Yield Per Acre Production Value Per Unit 2 Total ValueAcres Acres Tons Tons $/Ton $1,000
OLIVES 1996 33,700 – 4.93 166,000 617.00 102,3641997 35,300 – 2.95 104,000 642.00 66,8011998 35,300 – 2.55 90,000 459.00 41,3311999 35,300 – 4.02 142,000 387.00 55,0112000 36,000 – 1.47 53,000 656.00 34,7432001 36,000 – 3.72 134,000 672.00 90,0962002 36,000 – 2.86 103,000 573.00 58,9832003 36,000 – 3.28 118,000 409.00 48,2892004 32,000 – 3.36 107,500 564.00 60,6432005 32,000 – 4.44 142,000 560.00 79,511
PEACHES, CLINGSTONE 1996 31,000 – 17.70 546,500 220.00 114,5101997 31,000 – 18.50 574,000 260.00 143,0001998 30,400 – 17.20 522,500 220.00 112,8621999 29,800 – 17.75 529,500 226.00 115,7402000 28,200 – 18.90 532,000 250.00 127,1252001 28,800 – 16.60 476,000 244.00 110,0442002 31,000 – 18.20 562,000 247.00 132,6392003 31,000 – 17.30 536,000 215.00 108,4842004 32,000 – 16.80 539,000 263.00 141,4942005 30,400 – 15.90 484,000 254.00 122,939
PEACHES, FREESTONE 1996 34,300 – 9.90 337,000 434.00 146,3061997 35,200 – 10.50 369,500 244.00 89,9371998 36,000 – 9.45 340,500 314.00 107,1551999 36,500 – 10.45 381,500 320.00 122,4202000 37,000 – 10.70 395,500 314.00 124,4842001 37,000 – 10.50 387,500 352.00 136,6992002 37,000 – 10.80 398,000 348.00 138,3692003 37,000 – 11.20 413,000 336.00 138,7462004 37,000 – 11.80 436,000 281.00 109,7602005 36,000 – 10.70 385,000 408.00 157,048
PEACHES, ALL 1996 65,300 – 13.60 883,500 304.00 260,8161997 66,200 – 14.30 943,500 254.00 232,9371998 66,400 – 13.00 863,000 257.00 220,0171999 66,300 – 13.70 911,000 266.00 238,1602000 65,200 – 14.20 927,500 278.00 251,6092001 65,800 – 13.10 863,500 294.00 246,7432002 68,000 – 14.10 960,000 290.00 271,0082003 68,000 – 14.00 949,000 269.00 247,2302004 69,000 – 14.10 975,000 270.00 251,2542005 66,400 – 13.10 869,000 322.00 279,987
PEARS, BARTLETT 1996 17,500 – 16.40 287,000 267.00 76,5941997 15,600 – 18.10 282,000 263.00 74,0541998 15,000 – 18.50 277,000 246.00 68,1211999 15,000 – 20.70 311,000 208.00 64,6762000 15,000 – 18.80 282,000 201.00 53,6132001 14,000 – 19.60 275,000 255.00 61,2022002 13,500 – 17.20 232,000 242.00 56,1202003 13,000 – 16.70 217,000 216.00 46,8502004 13,000 – 17.20 223,000 252.00 56,2882005 12,000 – 13.80 166,000 297.00 49,334
PEARS, OTHER 1996 4,500 – 6.67 30,000 500.00 15,0001997 4,400 – 6.82 30,000 371.00 11,1301998 5,000 – 10.00 50,000 436.00 21,8001999 4,900 – 12.00 58,800 295.00 17,3462000 5,100 – 11.00 56,100 437.00 24,5162001 4,600 – 12.00 55,200 369.00 20,3692002 4,300 – 12.00 51,600 405.00 20,8982003 4,300 – 12.80 55,000 300.00 16,5262004 4,000 – 12.00 48,000 503.00 24,1442005 4,000 – 9.00 36,000 846.00 30,456
Non-Citrus Fruit Acreage, Production and Value, 1996–2005 continued

California Agricultural Resource Directory 2006 77
Fruit and Nut Crops
Non-Citrus Fruit Acreage, Production and Value, 1996–2005
Crop Crop Year
Bearing Non-Bearing 1 Yield Per Acre Production Value Per Unit 2 Total ValueAcres Acres Tons Tons $/Ton $1,000
PEARS, ALL 1996 22,000 – 14.40 317,000 289.00 91,5941997 20,000 – 15.60 312,000 273.00 85,1841998 20,000 – 16.40 327,000 275.00 89,9211999 19,900 – 18.60 369,800 222.00 82,0222000 20,100 – 16.80 338,100 242.00 78,1292001 18,600 – 17.80 330,200 276.00 81,5712002 17,800 – 15.90 283,600 272.00 77,0182003 17,300 – 15.70 272,000 233.00 63,3762004 17,000 – 15.90 271,000 297.00 80,4322005 16,000 – 12.60 202,000 395.00 79,790
PLUMS 1996 42,600 – 5.35 228,000 420.00 95,8311997 42,000 – 5.86 246,000 312.00 76,8251998 42,000 – 4.48 188,000 529.00 99,3881999 40,000 – 4.90 196,000 419.00 82,0412000 38,000 – 5.18 197,000 442.00 87,1152001 37,000 – 5.68 210,000 306.00 64,3622002 36,000 – 5.58 201,000 386.00 77,5862003 36,000 – 5.81 209,000 418.00 87,3622004 36,000 – 4.33 156,000 516.00 74,3472005 36,000 – 4.75 171,000 541.00 92,463
PLUMS, DRIED 5 1996 85,000 23,700 2.62 223,000 839.00 187,0971997 82,000 21,300 2.61 214,000 883.00 181,0151998 83,000 26,000 1.30 108,000 764.00 78,6921999 83,000 22,000 2.14 178,000 861.00 142,0652000 86,000 15,000 2.55 219,000 770.00 154,7702001 86,000 11,000 1.74 150,000 726.00 98,0102002 74,000 9,000 2.32 172,000 810.00 132,0302003 72,000 8,000 2.51 181,000 772.00 129,6962004 70,000 7,000 0.70 49,000 1,500.00 72,0002005 67,000 7,500 1.34 90,000 1,500.00 130,500
MISCELLANEOUS 1996 27,000 – – 164,000 – 81,872FRUITS AND NUTS 6 1997 38,000 – – 277,000 – 144,664
1998 35,000 – – 218,000 – 113,0241999 40,000 – – 233,000 – 135,3932000 49,000 – – 315,000 – 143,4462001 49,000 – – 282,000 – 144,1102002 55,000 – – 333,000 – 178,5272003 50,000 – – 200,000 – 166,0102004 38,000 – – 209,000 – 151,1122005 42,000 – – 262,000 – 180,505
1 Non-bearing shown only in year when acreage surveys were conducted.2 Return at processing plant door or packinghouse door.3 Acres of raisin-type grapes enrolled in the California Raisin Industry Diversion (RID) program were: 1996-2000 – zero; 2001 – 41,000; 2002 – 27,000; 2003-2005 – zero. These acres were deducted from bearing acres before calculating yield.4 Raisin-type production is the fresh equivalent of dried and not dried.5 Acreage by county, variety and year of planting for 2005 are available upon request.6 These crops are almond hulls, apricot-plum crosses (aprium, plumcot, pluots), black walnuts, chayotes, cherimoyas, chestnuts, feijoas, guavas, jojobas, jujubes, kumquats, limes, loquats, Macadamia nuts, persimmons, pomegranates, prickly pears, quince, citrus byproducts and orchard biomass.
Non-Citrus Fruit Acreage, Production and Value, 1996–2005 continued

78 California Agricultural Resource Directory 2006
Fruit and Nut Crops
Non-Citrus Fruit Utilized Production and Average Grower Return, 1996–2005
Crop Crop Year
Utilized Production
––––––– Fresh Market ––––––– Processing–––––––– Total –––––––– ––––––– Canned –––––––
Quantity Value Quantity Value Quantity ValueTons Tons $/Ton Tons $/Ton Tons $/Ton
APPLES 1 1996 475,000 175,000 646.00 300,000 150.00 48,500 184.001997 481,000 187,500 664.00 293,500 130.00 37,500 144.001998 430,000 200,000 544.00 230,000 103.00 10,000 144.001999 448,000 210,000 496.00 238,000 158.00 20,000 148.002000 255,000 130,000 486.00 125,000 162.00 3,000 152.002001 245,000 110,000 458.00 135,000 198.00 8,500 146.002002 230,000 115,000 606.00 115,000 210.00 11,000 208.002003 220,000 110,000 532.00 110,000 179.00 8,000 142.002004 177,500 82,500 452.00 95,000 165.00 –2005 177,500 80,000 756.00 97,500 146.00 – –
APRICOTS 2 1996 76,000 10,500 1,080.00 65,500 295.00 20,000 320.001997 122,400 20,900 467.00 101,500 276.00 46,700 320.001998 102,600 18,500 533.00 84,100 262.00 40,700 330.001999 85,000 – – – – – –2000 81,000 21,000 459.00 60,000 288.00 32,000 322.002001 70,000 14,000 551.00 56,000 260.00 31,000 292.002002 75,000 14,000 490.00 61,000 271.00 30,500 286.002003 92,500 22,000 492.00 70,500 264.00 30,000 298.002004 85,500 17,900 538.00 67,600 283.00 – –2005 70,500 18,500 1,090.00 52,000 271.00 23,500 285.00
AVOCADOS 3 95-96 171,000 169,500 1,380.00 1,500 – – –96-97 167,000 165,000 1,570.00 2,000 – – –97-98 154,000 154,000 1,710.00 – – – –98-99 136,000 136,000 2,400.00 – – – –99-00 161,000 161,000 2,110.00 – – – –00-01 213,000 213,000 1,480.00 – – – –01-02 200,000 200,000 1,790.00 – – – –02-03 168,000 168,000 2,170.00 – – – –03-04 216,000 216,000 1,760.00 – – – –04-05 151,000 151,000 1,830.00 – – – –
CHERRIES, SWEET 4 1996 24,600 16,000 2,540.00 8,600 557.00 – –1997 49,200 31,600 1,570.00 17,600 782.00 – –1998 15,200 7,500 2,330.00 7,700 784.00 – –1999 79,500 54,200 1,040.00 25,300 494.00 – –2000 45,700 29,600 2,180.00 16,100 437.00 – –2001 51,100 41,300 1,840.00 9,800 390.00 – –2002 53,700 43,300 2,090.00 10,400 271.00 – –2003 63,900 51,600 1,980.00 12,300 383.00 – –2004 70,300 57,700 2,020.00 12,600 524.00 – –2005 48,600 35,600 2,210.00 13,000 467.00 – –
DATES 1996 23,000 23,000 1,090.00 – – – –1997 21,000 21,000 1,100.00 – – – –1998 24,900 24,900 1,220.00 – – – –1999 22,200 22,200 1,240.00 – – – –2000 17,400 17,400 1,230.00 – – – –2001 19,700 19,700 1,360.00 – – – –2002 24,200 24,200 1,550.00 – – – –2003 18,000 18,000 1,380.00 – – – –2004 17,200 17,200 1,310.00 – – – –2005 16,000 16,000 1,310.00 – – – –
FIGS 5 1996 45,500 2,000 – 43,500 – – –1997 57,500 2,000 – 55,500 – – –1998 51,600 1,100 – 50,500 – – –1999 47,300 1,600 – 45,700 – – –2000 55,900 4,000 – 51,900 – – –2001 41,000 2,000 – 39,000 – – –2002 53,200 2,250 – 50,950 – – –2003 48,500 2,900 – 45,600 – – –2004 51,100 4,300 – 46,800 – – –2005 50,900 4,700 – 46,200 – – –

California Agricultural Resource Directory 2006 79
Fruit and Nut Crops
Crop Crop Year
Processing, continued––– Juice or Crushed ––– ––––––– Frozen –––––– –– Dried (Fresh Basis) –– ––––– Dried Basis –––––Quantity Value Quantity Value Quantity Value Quantity Value
Tons $/Ton Tons $/Ton Tons $/Ton Tons $/Ton
APPLES 1 1996 209,000 137.00 – – – – – –1997 181,000 106.00 – – – – – –1998 160,000 88.00 – – – – – –1999 200,000 154.00 – – – – – –2000 112,500 156.00 – – – – – –2001 109,000 209.00 – – – – – –2002 99,000 213.00 – – – – – –2003 95,000 178.00 – – – – – –2004 85,000 164.00 – – – – – –2005 90,000 149.00 – – – – – –
APRICOTS 2 1996 21,500 245.00 9,000 310.00 15,000 325.00 2,170 2,240.001997 27,700 190.00 15,100 300.00 12,000 262.00 1,740 1,810.001998 24,000 125.00 10,400 315.00 9,000 258.00 1,250 1,860.001999 – – – – – – – –2000 10,000 169.00 10,000 298.00 8,000 260.00 1,120 1,860.002001 9,000 102.00 9,000 308.00 6,000 268.00 820 1,960.002002 7,000 158.00 10,500 299.00 8,000 223.00 1,120 1,590.002003 9,200 210.00 11,000 313.00 6,800 233.00 900 1,760.002004 – – 9,700 308.00 11,800 269.00 1,630 1,950.002005 – – – – 11,500 244.00 1,360 2,060.00
AVOCADOS 3 95-96 – – – – – – – –96-97 – – – – – – – –97-98 – – – – – – – –98-99 – – – – – – – –99-00 – – – – – – – –00-01 – – – – – – – –01-02 – – – – – – – –02-03 – – – – – – – –03-04 – – – – – – – –04-05 – – – – – – – –
CHERRIES, SWEET 4 1996 – – – – – – – –1997 – – – – – – – –1998 – – – – – – – –1999 – – – – – – – –2000 – – – – – – – –2001 – – – – – – – –2002 – – – – – – – –2003 – – – – – – – –2004 – – – – – – – –2005 – – – – – – – –
DATES 1996 – – – – – – – –1997 – – – – – – – –1998 – – – – – – – –1999 – – – – – – – –2000 – – – – – – – –2001 – – – – – – – –2002 – – – – – – – –2003 – – – – – – – –2004 – – – – – – – –2005 – – – – – – – –
FIGS 5 1996 – – – – 43,500 258.00 14,500 774.001997 – – – – 55,500 233.00 18,500 699.001998 – – – – 49,800 194.00 16,600 581.001999 – – – – 45,300 227.00 15,100 680.002000 – – – – 51,900 224.00 17,300 672.002001 – – – – 39,000 308.00 13,000 924.002002 – – – – 50,700 301.00 16,900 902.002003 – – – – 45,600 276.00 15,200 828.002004 – – – – 46,800 299.00 15,900 944.002005 – – – – 46,200 286.00 15,400 857.00

80 California Agricultural Resource Directory 2006
Fruit and Nut Crops
Crop Crop Year
Utilized Production
––––––– Fresh Market ––––––– Processing–––––––– Total –––––––– ––––––– Canned –––––––
Quantity Value Quantity Value Quantity ValueTons Tons $/Ton Tons $/Ton Tons $/Ton
GRAPES, RAISIN 6 1996 2,192,000 230,000 669.00 1,962,000 235.00 36,000 267.001997 2,883,000 275,000 759.00 2,608,000 210.00 44,000 268.001998 2,077,000 230,000 715.00 1,847,000 238.00 36,000 270.001999 2,122,000 240,000 704.00 1,882,000 272.00 35,000 270.002000 2,921,000 230,000 600.00 2,691,000 129.00 32,000 270.002001 2,215,000 217,000 680.00 1,998,000 132.00 29,000 270.002002 2,804,000 264,000 750.00 2,540,000 89.70 31,000 270.002003 2,199,000 172,000 760.00 2,027,000 120.00 27,000 280.002004 2,038,000 192,000 730.00 1,838,000 259.00 25,000 300.002005 2,306,000 213,000 808.00 2,093,000 189.00 – –
GRAPES, TABLE 1996 592,000 465,000 775.00 127,000 190.00 – –1997 825,000 595,000 554.00 230,000 173.00 – –1998 643,000 489,000 607.00 154,000 155.00 – –1999 758,000 583,000 659.00 175,000 196.00 – –2000 774,000 613,000 680.00 161,000 128.00 – –2001 713,000 587,000 720.00 126,000 99.50 – –2002 743,000 662,000 680.00 81,000 92.20 – –2003 678,000 575,000 690.00 103,000 105.00 – –2004 770,000 644,000 790.00 126,000 210.00 – –2005 867,000 725,000 500.00 142,000 151.00 – –
GRAPES, WINE 1996 2,225,000 45,000 333.00 2,180,000 540.00 – –1997 2,940,000 45,000 250.00 2,895,000 603.00 – –1998 2,570,000 42,000 250.00 2,528,000 586.00 – –1999 2,662,000 45,000 275.00 2,617,000 590.00 – –2000 3,364,000 45,000 300.00 3,319,000 571.00 – –2001 3,051,000 45,000 300.00 3,006,000 601.00 – –2002 3,149,000 45,000 300.00 3,104,000 538.00 – –2003 2,909,000 45,000 300.00 2,864,000 534.00 – –2004 2,815,000 40,000 510.00 2,775,000 571.00 – –2005 3,805,000 50,000 510.00 3,755,000 583.00 – –
GRAPES, ALL 6 1996 5,009,000 740,000 715.00 4,269,000 389.00 36,000 267.001997 6,648,000 915,000 601.00 5,733,000 407.00 44,000 268.001998 5,290,000 761,000 620.00 4,529,000 429.00 36,000 270.001999 5,542,000 868,000 652.00 4,674,000 447.00 35,000 270.002000 7,059,000 888,000 640.00 6,171,000 367.00 32,000 270.002001 5,979,000 849,000 688.00 5,130,000 406.00 29,000 270.002002 6,696,000 971,000 681.00 5,725,000 333.00 31,000 270.002003 5,786,000 792,000 683.00 4,994,000 357.00 27,000 280.002004 5,623,000 876,000 764.00 4,747,000 441.00 25,000 300.002005 6,978,000 988,000 567.00 5,990,000 435.00 – –
KIWIFRUIT 7 1996 28,000 26,100 – 1,900 – – –1997 31,800 31,300 – 500 – – –1998 33,000 32,000 – 1,000 – – –1999 24,000 23,100 – 900 – – –2000 30,500 28,500 – 2,000 – – –2001 23,000 22,200 – 800 – – –2002 23,100 22,300 – 800 – – –2003 24,000 22,000 – 2,000 – – –2004 24,700 22,500 – 2,200 – – –2005 36,200 34,200 – 2,000 – – –
NECTARINES 7 1996 247,000 239,800 – 7,200 – – –1997 264,000 258,500 – 5,500 – – –1998 224,000 207,600 – 16,400 – – –1999 274,000 256,300 – 17,700 – – –2000 267,000 260,700 – 6,300 – – –2001 275,000 265,400 – 9,600 – – –2002 300,000 300,000 382.00 – – – –2003 273,000 273,000 436.00 – – – –2004 252,000 252,000 342.00 – – – –2005 239,000 239,000 504.00 – – – –
Non-Citrus Fruit Utilized Production and Average Grower Return, 1995–2004Non-Citrus Fruit Utilized Production and Average Grower Return, 1996–2005 continued

California Agricultural Resource Directory 2006 81
Fruit and Nut Crops
Crop Crop Year
Processing, continued––– Juice or Crushed ––– ––––––– Frozen –––––– –– Dried (Fresh Basis) –– ––––– Dried Basis –––––Quantity Value Quantity Value Quantity Value Quantity Value
Tons $/Ton Tons $/Ton Tons $/Ton Tons $/Ton
GRAPES, RAISIN 6 1996 618,000 191.00 – – 1,308,000 255.00 311,500 1,070.001997 786,000 185.00 – – 1,778,000 219.00 428,500 908.001998 507,000 164.00 – – 1,304,000 266.00 277,400 1,250.001999 420,000 200.00 – – 1,427,000 293.00 342,300 1,220.002000 513,000 125.00 – – 2,146,000 128.00 484,500 569.002001 262,000 85.70 – – 1,707,000 137.00 411,300 570.002002 622,000 75.50 – – 1,887,000 91.40 438,900 393.002003 422,000 95.10 – – 1,578,000 124.00 347,700 563.002004 727,000 200.00 – – 1,094,000 303.00 274,000 1,210.002005 468,000 164.00 – – 1,625,000 196.00 338,600 940.00
GRAPES, TABLE 1996 117,000 188.00 – – 10,000 210.00 2,400 880.001997 212,000 169.00 – – 18,000 220.00 4,300 914.001998 136,000 150.00 – – 18,000 197.00 3,800 933.001999 150,000 187.00 – – 25,000 247.00 6,000 1,030.002000 120,000 118.00 – – 41,000 157.00 9,200 700.002001 101,000 87.20 – – 25,000 149.00 5,800 644.002002 61,000 80.50 – – 20,000 128.00 4,500 568.002003 84,000 91.40 – – 19,000 167.00 4,200 757.002004 113,000 199.00 – – 13,000 289.00 3,300 1,140.002005 106,000 212.00 – – 36,000 238.00 7,400 1,160.00
GRAPES, WINE 1996 2,180,000 540.00 – – – – – –1997 2,895,000 603.00 – – – – – –1998 2,528,000 586.00 – – – – – –1999 2,617,000 590.00 – – – – – –2000 3,319,000 571.00 – – – – – –2001 3,006,000 601.00 – – – – – –2002 3,104,000 538.00 – – – – – –2003 2,864,000 534.00 – – – – – –2004 2,775,000 571.00 – – – – – –2005 3,755,000 583.00 – – – – – –
GRAPES, ALL 6 1996 2,915,000 452.00 – – 1,318,000 255.00 313,900 1,070.001997 3,893,000 495.00 – – 1,796,000 219.00 432,800 908.001998 3,171,000 500.00 – – 1,322,000 265.00 281,200 1,250.001999 3,187,000 520.00 – – 1,452,000 292.00 348,300 1,220.002000 3,952,000 499.00 – – 2,187,000 129.00 493,700 571.002001 3,369,000 546.00 – – 1,732,000 137.00 417,100 571.002002 3,787,000 455.00 – – 1,907,000 91.80 443,400 395.002003 3,370,000 468.00 – – 1,597,000 125.00 351,900 565.002004 3,615,000 485.00 – – 1,107,000 303.00 277,300 1,209.002005 4,329,000 526.00 – – 1,661,000 197.00 346,000 945.00
KIWIFRUIT 7 1996 – – – – – – – –1997 – – – – – – – –1998 – – – – – – – –1999 – – – – – – – –2000 – – – – – – – –2001 – – – – – – – –2002 – – – – – – – –2003 – – – – – – – –2004 – – – – – – – –2005 – – – – – – – –
NECTARINES 7 1996 – – – – – – – –1997 – – – – – – – –1998 – – – – – – – –1999 – – – – – – – –2000 – – – – – – – –2001 – – – – – – – –2002 – – – – – – – –2003 – – – – – – – –2004 – – – – – – – –2005 – – – – – – – –

82 California Agricultural Resource Directory 2006
Fruit and Nut Crops
Non-Citrus Fruit Utilized Production and Average Grower Return, 1995-2004Non-Citrus Fruit Utilized Production and Average Grower Return, 1996–2005 continued
Crop Crop Year
Utilized Production
––––––– Fresh Market ––––––– Processing–––––––– Total –––––––– ––––––– Canned –––––––
Quantity Value Quantity Value Quantity ValueTons Tons $/Ton Tons $/Ton Tons $/Ton
OLIVES 1996 166,000 500 500.00 165,500 617.00 123,000 745.001997 104,000 500 500.00 103,500 643.00 82,200 760.001998 90,000 500 500.00 89,500 459.00 64,200 590.001999 142,000 500 500.00 141,500 387.00 86,000 513.002000 53,000 500 500.00 52,500 657.00 41,400 769.002001 134,000 500 500.00 133,500 673.00 109,700 770.002002 103,000 500 500.00 102,500 573.00 82,800 662.002003 118,000 500 500.00 117,500 409.00 96,000 458.002004 107,500 500 500.00 107,000 564.00 74,400 701.002005 142,000 500 500.00 141,500 560.00 100,000 661.00
PEACHES, CLINGSTONE 8 1996 520,500 – – 520,500 219.00 480,500 220.001997 550,000 – – 550,000 260.00 529,000 264.001998 515,350 – – 515,350 219.00 469,500 230.001999 514,400 – – 514,400 225.00 476,200 232.002000 508,500 – – 508,500 250.00 486,950 251.002001 451,000 – – 451,000 244.00 435,100 244.002002 537,000 – – 537,000 247.00 511,500 244.002003 505,500 – – 505,500 215.00 478,500 217.002004 539,000 – – 539,000 263.00 505,000 270.002005 484,000 – – 484,000 254.00 459,000 256.00
PEACHES, FREESTONE 9,10 1996 337,000 229,350 560.00 107,650 166.00 9,100 204.001997 369,500 249,050 276.00 120,450 194.00 10,650 246.001998 340,500 215,800 396.00 124,700 186.00 12,750 215.001999 381,500 254,150 396.00 127,350 185.00 10,800 216.002000 395,500 269,000 380.00 126,500 187.00 – –2001 387,500 269,000 428.00 118,500 200.00 – –2002 398,000 277,850 418.00 120,150 203.00 – –2003 413,000 282,300 406.00 130,700 185.00 – –2004 390,000 259,000 341.00 131,000 164.00 – –2005 385,000 252,000 540.00 133,000 158.00 – –
PEACHES, ALL 8,9,10,11 1996 857,500 229,350 560.00 628,150 210.00 489,600 220.001997 919,500 249,050 276.00 670,450 248.00 539,650 264.001998 855,850 215,800 396.00 640,050 213.00 482,250 230.001999 895,900 254,150 396.00 641,750 217.00 487,000 232.002000 904,000 269,000 380.00 635,000 237.00 486,950 251.002001 838,500 269,000 428.00 569,500 235.00 435,100 244.002002 935,000 277,850 418.00 657,150 239.00 511,500 244.002003 918,500 282,300 406.00 636,200 209.00 478,500 217.002004 929,000 259,000 341.00 670,000 244.00 505,000 270.002005 869,000 252,000 540.00 617,000 233.00 459,000 256.00
PEARS, BARTLETT 8,11 1996 287,000 77,000 362.00 210,000 232.00 – –1997 282,000 68,000 318.00 214,000 247.00 – –1998 277,000 53,000 309.00 224,000 231.00 – –1999 311,000 84,000 143.00 227,000 232.00 – –2000 267,000 81,000 159.00 186,000 219.00 – –2001 240,000 67,000 317.00 173,000 231.00 – –2002 232,000 69,000 270.00 163,000 230.00 – –2003 217,000 62,000 190.00 155,000 226.00 – –2004 223,000 68,000 261.00 155,000 251.00 – –2005 166,000 47,000 424.00 119,000 247.00 – –
PEARS, OTHER 7 1996 30,000 – – – – – –1997 30,000 – – – – – –1998 50,000 – – – – – –1999 58,800 – – – – – –2000 56,100 – – – – – –2001 55,200 – – – – – –2002 51,600 – – – – – –2003 55,000 – – – – – –2004 48,000 – – – – – –2005 36,000 – – – – – –

California Agricultural Resource Directory 2006 83
Fruit and Nut Crops
Crop Crop Year
Processing, continued––– Juice or Crushed ––– ––––––– Frozen –––––– –– Dried (Fresh Basis) –– ––––– Dried Basis –––––Quantity Value Quantity Value Quantity Value Quantity Value
Tons $/Ton Tons $/Ton Tons $/Ton Tons $/Ton
Limited UndersizeOLIVES 1996 7,000 11.00 29,000 355.00 6,500 11.00 – –
1997 3,600 11.00 10,200 386.00 7,500 11.00 – –1998 4,100 11.00 12,800 240.00 8,400 11.00 – –1999 5,000 200.00 36,500 259.00 14,000 11.00 – –2000 3,000 300.00 5,100 333.00 3,000 11.00 – –2001 3,000 300.00 15,300 287.00 5,500 6.00 – –2002 6,000 240.00 9,900 249.00 3,800 8.00 – –2003 7,500 238.00 10,500 215.00 3,500 8.00 – –2004 11,500 361.00 16,100 252.00 5,000 6.00 – –2005 14,000 527.00 21,200 271.00 6,300 6.00 – –
PEACHES, CLINGSTONE 8 1996 – – – – – – – –1997 – – – – – – – –1998 – – – – – – – –1999 – – – – – – – –2000 – – – – – – – –2001 – – – – – – – –2002 – – – – – – – –2003 – – – – – – – –2004 – – – – – – – –2005 – – – – – – – –
PEACHES, FREESTONE 9,10 1996 – – 77,850 186.00 16,350 78.00 1,700 726.001997 – – 89,450 190.00 17,050 68.00 1,894 612.001998 – – 81,900 200.00 12,500 67.50 1,551 544.501999 – – 87,100 201.00 15,700 73.00 1,849 620.002000 – – 92,650 200.00 12,600 78.00 1,350 728.002001 – – 86,000 214.00 14,600 51.00 1,450 514.002002 – – 91,100 205.00 14,200 49.00 1,525 456.002003 – – 95,950 211.00 10,150 47.00 1,070 446.002004 – – 86,600 211.00 10,400 32.00 870 382.002005 – – 82,800 202.00 12,700 46.00 1,160 504.00
PEACHES, ALL 8,9,10,11 1996 – – 77,850 186.00 16,350 78.00 1,700 726.001997 – – 89,450 190.00 17,050 68.00 1,894 612.001998 – – 81,900 200.00 12,500 67.50 1,551 544.501999 – – 87,100 201.00 15,700 73.00 1,849 620.002000 – – 92,650 200.00 12,600 78.00 1,350 728.002001 – – 86,000 214.00 14,600 51.00 1,450 514.002002 – – 91,100 205.00 14,200 49.00 1,525 456.002003 – – 95,950 211.00 10,150 47.00 1,070 446.002004 – – 86,600 211.00 10,400 32.00 870 382.002005 – – 82,800 202.00 12,700 46.00 1,160 504.00
PEARS, BARTLETT 8,11 1996 – – – – 4,900 184.00 700 1,290.001997 – – – – 5,400 151.00 800 1,020.001998 – – – – 7,600 217.00 1,100 1,500.001999 – – – – 7,000 150.00 1,010 1,040.002000 – – – – 4,000 136.00 600 909.002001 – – – – 3,000 202.00 500 1,210.002002 – – – – 3,000 202.00 460 1,315.002003 – – – – 4,000 206.00 610 1,350.002004 – – – – 4,000 160.00 620 1,030.002005 – – – – 2,700 240.00 400 1,620.00
PEARS, OTHER 7 1996 – – – – – – – –1997 – – – – – – – –1998 – – – – – – – –1999 – – – – – – – –2000 – – – – – – – –2001 – – – – – – – –2002 – – – – – – – –2003 – – – – – – – –2004 – – – – – – – –2005 – – – – – – – –

84 California Agricultural Resource Directory 2006
Fruit and Nut Crops
Crop Crop Year
Utilized Production
––––––– Fresh Market ––––––– Processing–––––––– Total –––––––– ––––––– Canned –––––––
Quantity Value Quantity Value Quantity ValueTons Tons $/Ton Tons $/Ton Tons $/Ton
PEARS, ALL 7 1996 317,000 – – – – – –1997 312,000 – – – – – –1998 327,000 – – – – – –1999 369,800 – – – – – –2000 323,100 – – – – – –2001 295,200 – – – – – –2002 283,600 – – – – – –2003 272,000 – – – – – –2004 271,000 – – – – – –2005 202,000 – – – – – –
PLUMS 7 1996 228,000 – – – – – –1997 246,000 – – – – – –1998 188,000 – – – – – –1999 196,000 – – – – – –2000 197,000 – – – – – –2001 210,000 – – – – – –2002 201,000 – – – – – –2003 209,000 – – – – – –2004 144,000 – – – – – –2005 171,000 – – – – – –
PLUMS, DRIED 1996 223,000 – – 223,000 839.00 – –1997 205,000 – – 205,000 883.00 – –1998 103,000 – – 103,000 764.00 – –1999 165,000 – – 165,000 861.00 – –2000 201,000 – – 201,000 770.00 – –2001 135,000 – – 135,000 726.00 – –2002 163,000 – – 163,000 810.00 – –2003 168,000 – – 168,000 772.00 – –2004 48,000 – – 48,000 1,500.00 – –2005 87,000 – – 87,000 1,500.00 – –
Non-Citrus Fruit Utilized Production and Average Grower Return, 1995-2004Non-Citrus Fruit Utilized Production and Average Grower Return, 1996–2005 continued
Non-Citrus Fruit Unutilized Production, 1996–2005
Crop 1996 1997 1998 1999 2000 2001 2002 2003 2004 2005
Unharvested Tons
Apples – – – – 30,000 15,000 – – – –Apricots – 9,600 10,400 – 9,000 7,000 10,000 – 8,500 5,000Grapes – – – – – – – 75,000 – –Nectarines – – – – – – – – 2,000 –Peaches, Freestone – – – – – – – – 2,000 –Pears, Bartlett – – – – 15,000 35,000 – – – –Plums – – – – – 4,000 – – 1,000 –
Unsold Harvested Tons
Apples – – – – – – 5,000 5,000 – –Cherries, Sweet – – – 1,500 1,300 4,200 1,800 1,700 2,700 4,100Kiwifruit 3,500 3,200 3,600 3,000 3,500 2,800 3,000 1,400 2,000 1,000Nectarines – – – – – – – – 15,000 –Peaches, Clingstone 26,000 24,000 7,150 15,100 23,500 2,500 25,000 30,500 – –Peaches, Freestone – – – – – – – – 44,000 –Plums – – – – – – – – 11,000 –Plums, Dried – 9,000 5,000 13,000 18,000 11,000 9,000 13,000 1,000 3,000

California Agricultural Resource Directory 2006 85
Fruit and Nut Crops
Crop Crop Year
Processing, continued––– Juice or Crushed ––– ––––––– Frozen –––––– –– Dried (Fresh Basis) –– ––––– Dried Basis –––––Quantity Value Quantity Value Quantity Value Quantity Value
Tons $/Ton Tons $/Ton Tons $/Ton Tons $/Ton
PEARS, ALL 7 1996 – – – – – – – –1997 – – – – – – – –1998 – – – – – – – –1999 – – – – – – – –2000 – – – – – – – –2001 – – – – – – – –2002 – – – – – – – –2003 – – – – – – – –2004 – – – – – – – –2005 – – – – – – – –
PLUMS 7 1996 – – – – – – – –1997 – – – – – – – –1998 – – – – – – – –1999 – – – – – – – –2000 – – – – – – – –2001 – – – – – – – –2002 – – – – – – – –2003 – – – – – – – –2004 – – – – – – – –2005 – – – – – – – –
PLUMS, DRIED 1996 – – – – 704,000 262.00 223,000 839.001997 – – – – 627,300 289.00 205,000 883.001998 – – – – 329,600 239.00 103,000 764.001999 – – – – 478,500 297.00 165,000 861.002000 – – – – 625,100 248.00 201,000 770.002001 – – – – 378,000 259.00 135,000 726.002002 – – – – 492,000 268.00 163,000 810.002003 – – – – 536,000 242.00 168,000 772.002004 – – – – 141,000 511.00 48,000 1,500.002005 – – – – 265,000 492.00 87,000 1,500.00
1 Dried and frozen fruit included in total processed to avoid possible disclosure.2 Data for 1999 not published to avoid possible disclosure.3 Processed fruit included in fresh market total to avoid possible disclosure.4 Total processed includes canned, crushed, frozen and brined.5 Prices for processing and fresh totals were not published to avoid possible disclosure. Small quantities processed included in fresh to avoid possible disclosure.6 Includes substandard raisins diverted to other uses.7 Processed and fresh fruit not published to avoid possible disclosure, but included in total utilized.8 Processed mostly canned, but includes other small quantities not published separately to avoid possible disclosure.9 Quantity and value include dried, but price excludes dried.10 Not published separately to avoid possible disclosure.11 Total processing value per ton excludes dried processing.

86 California Agricultural Resource Directory 2006
Fruit and Nut Crops
Nut Acreage, Production and Value, 1996–2005
Crop Crop Year
Bearing Non-Bearing 1
Yield Per Acre
––––––––––––– Production ––––––––––––––– Value Per Unit
Total ValueMarketable
In-ShellShelling Stock Total
Acres Acres Pounds 1,000 Pounds 1,000 Pounds 1,000 Pounds $/Pound $1,000
ALMONDS 2,3 1996 428,000 72,400 1,190 – – 510,000 2.08 1,018,368
(Shelled Basis) 1997 442,000 63,000 1,720 – – 759,000 1.56 1,160,640
1998 460,000 113,000 1,130 – – 520,000 1.41 703,590
1999 485,000 105,000 1,720 – – 833,000 0.86 687,742
2000 510,000 95,000 1,380 – – 703,000 0.97 666,487
2001 530,000 70,000 1,570 – – 830,000 0.91 740,012
2002 545,000 60,000 2,000 – – 1,090,000 1.11 1,200,687
2003 550,000 60,000 1,890 – – 1,040,000 1.57 1,600,144
2004 570,000 70,000 1,760 – – 1,005,000 2.21 2,189,005
2005 580,000 100,000 1,580 – – 915,000 2.60 2,337,140
PECANS 1996 2,500 – 520 – – 1,300 0.83 1,079
(In-shell Basis) 1997 2,600 – 962 – – 3,000 1.32 3,960
1998 2,600 – 654 – – 1,700 1.66 2,822
1999 2,600 – 731 – – 1,900 1.27 2,413
2000 2,600 – 1,310 – – 3,400 1.52 5,168
2001 2,600 – 1,420 – – 3,700 0.81 2,997
2002 2,600 – 1,460 – – 3,800 1.27 4,826
2003 2,600 – 1,420 – – 3,700 1.42 5,254
2004 2,600 – 1,350 – – 3,500 2.21 7,735
2005 2,600 – 1,500 – – 3,900 1.80 7,020
PISTACHIOS 1996 64,300 17,100 1,630 85,000 20,000 105,000 1.16 121,800
1997 65,400 17,000 2,750 137,000 43,000 180,000 1.13 203,400
1998 68,000 19,300 2,760 138,000 50,000 188,000 1.03 193,640
1999 71,000 21,000 1,730 105,000 18,000 123,000 1.33 163,590
2000 74,600 21,700 3,260 190,000 53,000 243,000 1.01 245,430
2001 78,000 23,500 2,060 126,500 34,500 161,000 1.01 162,610
2002 83,000 23,000 3,650 242,000 61,000 303,000 1.10 333,300
2003 88,000 23,000 1,350 90,000 29,000 119,000 1.22 145,180
2004 93,000 15,000 3,730 254,000 93,000 347,000 1.34 464,980
2005 105,000 – 2,700 215,000 68,000 283,000 2.04 577,320
WALNUTS 3 Acres Acres Tons Tons Tons Tons $/Ton $1,000 (In-shell Basis) 1996 192,000 23,200 1.08 – – 208,000 1,580.00 328,640
1997 193,000 20,900 1.39 – – 269,000 1,430.00 384,670
1998 198,000 29,000 1.15 – – 227,000 1,050.00 238,350
1999 197,000 30,000 1.44 – – 283,000 886.00 250,738
2000 200,000 31,000 1.20 – – 239,000 1,240.00 296,360
2001 204,000 29,000 1.50 – – 305,000 1,120.00 341,600
2002 210,000 27,000 1.34 – – 282,000 1,170.00 329,940
2003 213,000 27,000 1.53 – – 326,000 1,160.00 378,160
2004 214,000 – 1.52 – – 325,000 1,390.00 451,750
2005 215,000 26,000 1.65 – – 355,000 1,520.00 539,600
1 Non-bearing shown only in year when acreage survey conducted.2 Values are based on the edible portion of the crop only. Included in production are inedible quantities of no value: 1996 – 20.4 million pounds, 1997 – 15.0 million pounds, 1998 – 21.0 million pounds, 1999 – 33.3 million pounds, 2000 – 15.9 million pounds, 2001 – 16.8 million pounds, 2002 – 8.3 million pounds, 2003 – 20.8 million pounds, 2004 – 14.5 million pounds, 2005 – 16.1 million pounds.3 Data for 2005 acreage by county, variety and year of planting available upon request.

California Agricultural Resource Directory 2006 87
Fruit and Nut Crops
Raisin Production and Average Grower Return, 1996-2005
Raisins 1 Crop Year All Varieties Naturally Dried Dehydrated, All TypesThompson
SeedlessMuscats Oleate 2 Sultanas Zante
Currant
PRODUCTION Tons
1996 311,500 272,100 130 810 140 4,520 33,800
1997 428,500 382,500 80 1,100 200 4,820 39,800
1998 277,400 240,500 30 580 120 3,770 32,400
1999 342,300 300,000 10 270 120 3,700 38,200
2000 484,500 437,000 60 3,700 140 4,800 38,800
2001 411,300 378,000 50 6,500 150 4,200 22,400
2002 438,900 388,000 40 18,390 90 4,390 28,030
2003 347,700 297,020 20 – 80 3,030 27,580
2004 274,000 245,300 – – 30 3,500 25,190
2005 348,600 321,140 – – 75 3,800 23,530
AVERAGE GROWER RETURN $/Ton
1996 1,070.00 1,050.00 1,000.00 943.00 823.00 1,180.00 1,250.00
1997 908.00 881.00 1,000.00 1,100.00 842.00 658.00 1,190.00
1998 1,250.00 1,240.00 700.00 1,280.00 818.00 994.00 1,360.00
1999 1,220.00 1,210.00 702.00 1,240.00 919.00 596.00 1,400.00
2000 569.00 564.00 533.00 855.00 590.00 831.00 852.00
2001 570.00 534.00 572.00 814.00 531.00 1,019.00 1,021.00
2002 393.00 360.00 628.00 429.00 504.00 807.00 773.00
2003 563.00 528.00 515.00 – 495.00 992.00 887.00
2004 1,210.00 1,190.00 – – 880.00 1,420.00 1,430.00
2005 1,000.00 960.00 – – 1,040.00 1,390.00 1,410.00
1 Excludes raisins produced from table-type grapes.2 Miscellaneous seedless grapes with Oleate applied.

88 California Agricultural Resource Directory 2006
Beginning with the 1999 season, the Grape Crush Report includes the total number of tons crushed for concentrate production. In determining tonnage, each processor was required to report the estimated equivalent tons of grapes crushed for con-centrate. For the 2005 season, this total was 550,296 tons, approximately 13 percent of the 2005 grape crush total. This report provides only the aggregate fi gure for grapes crushed for concentrate produc-tion and does not include information by district, type or variety. California grape growers received prices in 2005 for raisin and table grapes that were, on average, below the 2004 prices. While the prices received for red and white wine grapes were, on average, above the 2004 prices. The 2005 average price of all vari-eties was $533.04, up 11 percent from 2004.
The Final Grape Crush Report includes all grape tonnage crushed during the 2005 season. Details of the crushed tonnage, degrees Brix, and weighted average prices were reported by grape type and variety, as well as by grape pricing districts. The 17 districts refer to the area in which the grapes were grown as defi ned in administrative code.
Summary of Grape Tonnages and PricesThe 2005 crush totaled 4,330,064 tons, up 20 percent from the 2004 crush of 3,615,278 tons. Red wine varieties accounted for the largest share of all grapes crushed, at 2,235,170 tons, up 36 percent from 2004. The 2005 white wine variety crush to-taled 1,521,221 tons, up 34 percent from 2004. Tons crushed of raisin-type varieties totaled 467,483, down 36 percent from 2004, while tons crushed of table-type varieties totaled 106,190, down 6 percent from 2004.
GrapeGrapeCrush
phot
o by
Ed
Will
iam
s/So
nom
a Co
.

California Agricultural Resource Directory 2006 89
Grape Crush
Average Prices for the 2005 Crop by Type: 1
Red wine grapes .......... $633.60, up 1 percent
White wine grapes ...... $506.90, up 4 percent
Raisin grapes ............... $164.25, down 18 percent
Table grapes ................ $121.36, down 39 percent
1 These price levels have not been adjusted for infl ation.
Leading Grape Varieties and DistrictsIn 2005, Chardonnay accounted for the largest percentage of crush volume with 17.1 percent. Cabernet Sauvignon accounted for the second lead-ing percentage of crush with 12.5 percent of the total. The next eight highest percentages of grapes
crushed were all wine varieties, with the exception of Thompson Seedless. Grapes produced in District 4 (Napa County) re-ceived the highest average price of $2,986.78 per ton, up 2 percent from 2004. District 3 (Sonoma and Marin counties) received the second highest return of $1,871.44, virtually unchanged from 2004. The 2005 Chardonnay price of $714.38 was up 3 percent from 2004, while the 2005 Cabernet Sauvignon price of $937.23 was down 4 percent from 2004. The 2005 average price for Merlot was $729.28, down 9 percent from 2004, while the Zinfandel average price of $472.31 was down less than 1 percent from 2004.
Grape Crush Tonnage and Price, 1988–2005
Crop Year ––––– Raisin Type ––––– ––––– Table Type ––––– ––– Red Wine Type ––– ––– White Wine Type ––– –––––– All Types ––––––
1,000 Tons $/Ton 1,000 Tons $/Ton 1,000 Tons $/Ton 1,000 Tons $/Ton 1,000 Tons $/Ton
1988 415 116 312 131 760 409 1,356 238 2,843 2531989 370 132 211 128 872 410 1,272 297 2,725 2971990 268 126 170 127 804 355 1,331 277 2,573 2761991 284 150 157 141 840 383 1,289 319 2,570 3101992 785 182 217 170 888 438 1,209 364 3,099 3251993 452 152 137 147 979 430 1,327 316 2,895 3231994 239 118 123 136 936 462 1,242 317 2,540 3441995 432 164 170 162 1,052 515 1,175 351 2,829 3721996 618 191 117 188 1,079 611 1,094 469 2,908 4521997 786 185 212 169 1,461 656 1,433 546 3,891 4971998 506 164 135 150 1,333 643 1,194 521 3,169 5021999 419 200 149 187 1,422 649 1,195 518 3,185 5252000 513 125 120 118 1,816 628 1,503 500 3,951 5042001 262 86 101 87 1,706 680 1,300 491 3,368 5552002 622 76 61 80 1,817 614 1,288 432 3,787 4622003 422 95 84 91 1,634 609 1,230 429 3,370 4712004 727 200 113 199 1,639 627 1,136 487 3,615 4822005 467 164 106 121 2,235 634 1,521 507 4,330 533
Source: USDA’s National Agricultural Statistics Service, California Field Offi ce.

90 California Agricultural Resource Directory 2006
Grape Crush
Grape Crush Totals by Type and Variety, 2004–2005
Type and Variety ––––– Total Tons –––––Crushed
–– Average Brix –– Crushed
–––––– Total Tons ––––––Purchased
–––– Average Brix –––– Purchased
––– Weighted Average –––Dollars Per Ton
2005 2004 2005 2004 2005 2004 2005 2004 2005 2004
RAISIN GRAPESDiamond Muscat 6.5 – 20.2 – 6.5 – 20.2 – 200.00 –Dovine 1,468.8 3,693.6 20.4 20.6 1,462.0 3,652.8 20.4 20.6 177.19 200.00Fiesta 15,094.0 45,626.0 21.4 22.4 15,043.6 45,448.1 21.4 22.4 178.84 199.74Selma Pete 876.4 – 21.6 – 874.7 – 21.6 – 185.54 –Sultana 5.1 – 22.2 – 5.0 – 22.4 – 180.00 –Thompson Seedless 442,578.1 677,626.2 21.0 20.9 350,852.4 606,038.9 21.0 20.8 163.51 199.86Other Raisin 1 7,454.5 – 22.5 – 144.9 – 23.1 – 184.00 –
Total Raisin 467,483.4 726,945.8 21.0 21.0 368,389.1 655,139.8 21.0 20.9 164.25 199.86
TABLE GRAPESAutumn Royal 2,031.7 2,104.9 19.1 19.8 215.8 578.7 20.1 20.0 135.20 200.00Autumn Seedless – 14.0 – 21.2 – – – – – –Beauty Seedless * – 19.0 – 23.0 – – – – – –Black Emerald 35.8 – 27.1 – 35.8 – 27.1 – 185.00 –Black Monukka 468.9 242.6 21.1 23.2 467.5 241.7 21.1 23.2 200.45 198.84Calmeria 761.7 698.0 19.9 19.6 58.5 152.7 17.9 19.6 116.35 200.00Cardinal 222.1 7.0 20.9 22.7 – – – – – –Christmas Rose 403.7 528.2 22.1 21.6 – 324.2 – 21.5 – 200.00Crimson Seedless * 10,282.7 14,575.1 20.2 20.2 124.1 7,578.7 20.1 20.3 138.45 200.00Dawn Seedless 13.2 – 21.0 – – – – – – –Early Sweet 608.6 5.3 20.2 22.0 – – – – – –Emerald Seedless * 2,013.8 1,662.7 19.9 20.1 157.5 749.5 22.1 20.1 141.05 200.00Emperor 631.4 270.3 18.6 18.9 – 59.8 – 18.9 – 200.00Exotic 1,343.7 11.8 20.1 24.8 50.6 – 19.3 – 159.20 –Fantasy Seedless 41.9 12.5 21.7 22.6 – 6.5 – 22.6 – 200.00Flame Seedless * 21,648.9 13,491.4 22.3 21.6 11,772.9 7,882.0 22.0 21.1 177.48 200.00Flame Tokay 1,331.4 1,710.8 18.3 18.1 1,327.5 1,706.4 18.3 18.1 153.15 194.04Italia * 461.1 325.9 20.8 22.7 – 97.5 – 22.7 – 200.00Jade Seedless 1,615.5 – 19.5 – – – – – – –Malaga * 994.7 495.3 19.4 21.9 546.1 353.9 20.2 22.6 160.60 200.00Marroo Seedless 98.1 – 21.9 – 97.8 – 21.9 – 175.23 –Perlette 301.2 32.5 20.1 21.8 136.8 – 20.8 – 159.20 –Princess * 1,816.7 1,277.7 21.5 22.2 216.8 314.5 22.0 22.3 182.40 200.00Queen 124.5 209.2 20.4 21.5 – – – – – –Red Globe * 25,506.4 19,442.4 20.0 20.8 4,250.8 7,178.8 21.0 21.2 120.69 200.00Ribier 716.9 259.3 19.0 20.1 – 1.6 – 20.5 – 200.00Rouge 2,405.4 2,835.8 19.1 19.5 – 5.7 – 25.0 – 473.68Ruby Seedless * 8,531.1 5,105.7 21.3 22.8 3,665.3 2,118.3 22.2 22.8 157.07 200.00Packinghouse Culls 125.6 397.5 21.8 22.4 – 397.5 – 22.5 – 250.00Other Table 1 21,653.1 47,656.1 20.7 21.0 19,989.7 40,079.9 20.9 21.2 75.09 197.14
Total Table 106,189.8 113,391.0 20.7 20.9 43,113.5 69,827.9 21.2 21.1 121.36 198.52
WINE GRAPES (WHITE)Arneis 85.9 70.5 23.3 23.4 76.6 60.0 23.0 23.4 1,933.10 2,077.82Burger * 53,087.0 47,348.9 15.2 16.2 49,427.1 44,168.1 15.2 16.3 175.25 177.95Chardonnay * 742,582.6 524,732.1 23.5 24.1 513,163.8 379,838.2 23.4 24.0 714.38 693.77Chasselas Dore 38.6 – 23.9 – 2.1 – 22.3 – 1,300.00 –Chenin Blanc 94,828.2 84,566.1 19.7 20.5 88,518.4 78,938.4 19.6 20.4 249.36 234.20Cortese 21.4 26.4 23.2 24.5 3.4 2.6 20.0 22.5 1,000.00 1,000.00Emerald Riesling 1,892.5 1,883.8 22.2 22.1 1,892.5 1,883.8 22.2 22.1 331.04 309.71Flora 43.7 38.8 22.6 22.7 39.5 35.4 22.5 22.5 1,945.74 1,950.00Folle Blanche 15.6 12.4 21.1 23.3 – – – – – –French Colombard 305,170.7 251,004.5 20.0 20.7 300,985.4 219,607.8 20.0 20.7 219.98 201.41Gewurztraminer 9,773.8 7,668.9 23.6 24.0 6,211.8 5,348.9 23.8 23.9 858.75 877.97Gray Riesling * 100.8 135.0 21.5 20.5 37.5 59.9 22.3 19.5 1,179.54 1,077.19Grenache Blanc 112.1 89.5 24.9 24.1 78.8 61.5 25.3 24.0 1,358.24 1,634.21Kerner 2.0 2.4 23.7 23.2 – – – – – –Malvasia Bianca * 12,719.4 8,924.4 19.2 19.7 9,441.2 6,542.4 19.1 19.9 336.30 329.50Marsanne 388.4 323.7 24.0 24.0 268.3 212.4 24.0 23.8 1,297.00 1,141.33Melon 18.8 11.1 22.6 24.7 18.7 11.1 22.6 24.7 1,969.71 2,170.30Montonico 13.5 10.1 19.0 19.5 13.5 10.0 19.0 19.5 400.00 400.00Moscato Gaillo * 3.4 3.9 23.6 22.2 3.4 3.9 23.6 22.2 1,170.59 1,200.00Muscat Blanc * 7,577.9 5,045.6 23.5 24.4 5,833.0 4,231.6 23.2 23.1 648.82 626.59Muscat Orange 1,371.4 961.1 22.8 24.6 1,193.8 836.7 22.7 23.7 604.35 605.76Muscat of Alexandria 52,693.9 33,212.1 21.9 23.1 48,912.2 30,677.0 21.9 23.2 277.30 319.30Palomino * 3,590.2 3,315.5 19.8 20.9 3,558.4 3,271.9 19.8 21.0 221.77 206.08

California Agricultural Resource Directory 2006 91
Grape Crush
Grape Crush Totals by Type and Variety, 2004–2005
Type and Variety ––––– Total Tons –––––Crushed
–– Average Brix –– Crushed
–––––– Total Tons ––––––Purchased
–––– Average Brix –––– Purchased
––– Weighted Average –––Dollars Per Ton
2005 2004 2005 2004 2005 2004 2005 2004 2005 2004
WINE GRAPES (WHITE) continuedPinot Blanc 1,710.3 1,509.1 23.5 23.3 881.9 823.9 23.3 23.3 1,317.20 1,260.59Pinot Gris * 66,092.3 48,280.0 22.4 22.7 56,999.9 41,060.9 22.5 22.5 567.60 596.02Roussanne 853.3 818.1 24.1 24.5 487.7 375.4 24.3 24.9 1,658.71 1,775.33Sauvignon Blanc 117,043.8 78,805.8 22.2 22.9 92,761.1 65,123.1 22.1 22.8 705.44 691.69Sauvignon Musque 702.5 415.4 23.3 24.0 427.4 269.0 23.4 24.1 1,513.64 1,528.91Sauvignon Vert * 7.6 8.3 22.8 23.0 7.6 8.3 22.8 23.0 1,800.00 1,814.46Scheurebe 17.2 11.1 23.0 23.5 – – – – – –Semillon 9,569.5 7,814.4 21.5 22.4 8,298.4 6,762.3 21.4 22.2 556.43 573.52St. Emilion * 32.3 16.4 24.4 22.4 2.3 4.9 25.0 22.4 713.04 571.43Sylvaner 19.4 12.8 21.9 21.9 – – – – – –Symphony 7,408.2 8,214.0 22.7 22.9 7,354.0 8,135.3 22.7 22.9 345.07 344.98Tocai Friulano 319.1 226.6 20.9 21.4 305.6 209.9 20.8 21.3 595.71 713.93Triplett Blanc 52.9 – 19.8 – 52.6 – 19.8 – 200.00 –Verdelho 139.1 52.2 23.3 24.7 112.7 30.5 23.2 23.5 996.45 1,000.33Vernaccia 52.7 51.0 22.8 23.2 45.7 46.3 22.8 23.2 1,810.93 1,806.87Viognier 14,520.6 9,076.3 25.2 25.6 11,119.5 6,901.2 24.8 25.1 767.55 699.20White Riesling * 12,895.5 9,224.7 22.8 22.3 8,793.7 6,035.4 22.8 22.1 965.28 926.55Other White 1 3,653.1 2,317.8 21.7 23.4 1,136.9 2,196.0 21.8 23.5 303.26 285.45
Total White 1,521,221.2 1,136,240.8 22.0 22.5 1,218,466.4 913,784.0 21.7 22.2 506.90 487.47
WINE GRAPES (RED)Aglianico 101.9 67.9 24.6 23.9 81.4 40.4 24.5 23.5 1,274.49 1,382.19Aleatico 31.8 35.9 28.2 27.5 31.6 35.7 28.4 27.5 1,973.45 1,984.69Alicante Bouschet * 4,010.9 3,025.2 21.9 23.4 3,826.4 2,972.8 21.9 23.4 344.53 390.83Alvarelhao 50.4 50.7 24.4 24.8 31.7 26.3 24.3 25.0 1,064.41 1,041.26Barbera 78,579.0 54,370.8 23.1 23.9 76,598.1 51,396.2 23.1 23.9 256.71 258.34Blaufraenkisch * 16.5 6.4 24.3 25.6 – – – – – –Cabernet Franc 19,084.0 15,411.8 25.1 25.3 14,141.1 11,256.7 25.0 25.4 1,180.40 1,169.44Cabernet Sauvignon 542,351.3 360,166.0 24.7 25.3 405,734.0 277,886.4 24.6 25.3 937.23 977.56Carignane 22,611.0 22,136.4 22.9 24.1 22,023.6 21,628.8 22.9 24.2 328.89 292.94Carmenere 10.7 14.9 24.1 24.6 3.4 8.4 24.1 24.1 1,164.27 1,502.97Carmine 14.0 10.7 23.2 22.2 12.2 8.0 23.0 23.0 600.00 600.00Carnelian 11,452.7 8,020.9 23.5 24.9 11,078.0 4,860.2 23.5 25.0 227.37 212.03Centurian 2,634.2 1,846.6 22.9 22.8 1,792.7 1,152.2 23.3 22.9 213.07 246.40Charbono 362.4 394.4 22.4 23.3 185.6 364.3 22.4 24.1 1,738.28 1,464.28Cinsaut * 622.9 669.9 22.8 24.1 549.0 595.6 22.8 24.1 556.60 576.19Counoise 153.9 105.6 23.5 22.6 89.7 50.0 23.5 22.6 1,375.84 1,397.45De Chaunac 0.3 0.1 20.1 20.1 – 0.1 – 20.1 – 2,000.00Dolcetto 390.7 318.0 24.2 24.1 274.5 254.1 24.1 23.9 1,610.55 1,874.63Dornfelder 453.2 200.6 24.9 26.1 443.1 194.0 24.9 24.1 300.00 300.00Early Burgundy 22.2 15.3 24.7 24.3 15.8 10.2 24.9 24.3 1,327.85 482.35Freisa 66.5 60.6 25.0 24.3 55.1 54.1 25.0 24.6 2,504.40 1,946.88Gamay (Napa) * 3,532.0 2,695.0 21.4 22.0 3,221.0 2,418.6 21.4 21.9 469.64 477.80Gamay Beaujolais 0.2 57.3 27.7 21.0 – 57.0 – 20.9 – 292.15Graciano 27.7 19.4 25.6 24.7 1.5 – 23.8 – 800.00 –Grand Noir 2.1 1.5 23.5 25.0 2.1 1.5 23.5 25.0 1,300.00 1,500.00Grenache * 73,036.5 75,663.1 21.3 21.2 71,419.4 74,131.4 21.2 21.1 250.99 232.68Grignolino 39.3 19.6 23.0 23.7 1.5 – 23.0 – 1,000.00 –Lagrein 194.3 94.2 23.8 25.5 186.4 93.5 23.7 25.5 831.05 752.83Malbec 8,380.7 4,740.3 23.8 24.4 6,140.4 3,594.8 23.6 24.3 793.80 772.02Marechal Foch * 0.1 0.5 23.0 24.6 0.1 0.1 23.0 23.0 2,000.00 2,000.00Mataro * 2,275.8 1,894.8 24.7 24.6 1,693.5 1,307.3 24.7 25.0 1,344.20 1,337.78Merlot 423,776.8 292,256.4 24.4 24.9 327,656.0 235,972.3 24.3 24.9 729.28 799.37Meunier * 701.0 596.8 20.7 20.5 371.1 309.6 19.7 20.1 1,930.13 1,868.57Mission 10,619.8 8,455.6 23.0 24.5 10,515.9 8,378.0 23.0 24.5 179.55 178.55Montepulciano 186.2 115.8 23.0 25.4 148.8 91.2 23.8 25.5 1,089.32 1,503.09Muscat Hamburg * 240.9 123.0 25.2 27.8 224.3 101.9 24.6 28.1 718.62 713.25Nebbiolo 364.1 260.9 24.4 24.3 275.7 153.1 24.5 24.5 1,933.99 2,552.53Negrette * 23.9 12.9 25.2 25.5 15.5 7.9 24.8 24.7 1,522.46 1,291.28Negroamaro 18.9 3.7 24.0 25.2 18.9 3.7 24.0 25.2 1,455.56 1,410.81Nero D’Avola * 36.2 2.4 23.1 24.4 33.4 2.4 23.7 24.4 950.00 1,500.00Peloursin 3.6 2.1 24.4 25.0 – – – – – –Perelli 101 9.4 6.9 21.3 20.0 8.7 6.4 21.3 19.8 1,200.00 2,000.00Petit Verdot 8,731.6 5,851.3 24.5 24.8 5,609.5 3,876.9 24.4 24.5 1,187.20 1,173.11Petite Sirah 43,625.8 28,569.9 24.4 25.6 32,946.4 21,864.9 24.4 25.5 901.20 934.38Pfeffer Cabernet 8.4 8.2 25.0 26.1 6.2 5.3 24.6 26.0 690.32 1,000.00
Grape Crush Totals by Type and Variety, 2004–2005 continued

92 California Agricultural Resource Directory 2006
Grape Crush
Grape Crush Totals by Type and Variety, 2004–2005
Type and Variety ––––– Total Tons –––––Crushed
–– Average Brix –– Crushed
–––––– Total Tons ––––––Purchased
–––– Average Brix –––– Purchased
––– Weighted Average –––Dollars Per Ton
2005 2004 2005 2004 2005 2004 2005 2004 2005 2004
Pinot Noir 94,918.2 70,067.9 24.6 25.1 56,358.9 42,187.0 24.6 25.1 1,751.26 1,620.14Pinotage 66.3 53.4 25.1 26.3 20.4 15.2 25.0 25.6 1,487.10 1,330.43Primitivo 1,241.7 837.4 24.0 24.7 885.7 639.4 23.7 24.5 891.00 797.72Refosco * 630.9 638.4 24.2 23.5 575.3 612.8 24.3 23.4 362.37 357.37Royalty 1,752.2 1,438.1 23.7 24.0 1,736.9 1,426.2 23.7 24.0 207.44 192.77Rubired * 170,154.1 158,435.6 23.3 23.6 164,669.4 153,591.1 23.5 23.6 220.79 209.93Ruby Cabernet 77,569.4 74,672.0 23.7 24.4 76,835.9 69,222.9 23.6 24.4 255.99 247.92Sagrantino 24.1 – 22.6 – 24.1 – 22.0 – 1,193.98 –Salvador 2,173.2 2,329.9 24.5 23.1 2,156.5 2,327.9 24.5 23.1 225.00 199.01Sangiovese * 15,155.5 9,975.5 22.7 23.9 11,433.3 7,068.1 22.1 23.5 586.53 693.36Souzao 374.7 363.6 23.1 25.0 182.3 167.1 24.0 26.0 778.98 745.96Syrah * 147,435.7 101,245.7 24.7 25.3 100,865.1 74,172.5 24.7 25.1 670.28 666.75Tannat 2,215.0 2,280.8 24.7 26.6 1,490.7 1,779.5 24.7 26.9 413.28 362.99Tempranillo * 4,074.2 2,899.6 23.5 24.6 3,037.8 2,305.9 23.4 24.6 527.55 528.49Teroldego 167.0 140.4 25.5 24.8 132.9 117.2 25.6 25.1 1,533.85 1,573.64Tinta Barroca 1.6 0.9 23.6 27.7 – – – – – –Tinta Cao 94.0 105.7 24.7 25.8 48.8 72.3 24.4 25.5 1,217.10 920.36Tinta Madeira 44.7 76.5 25.4 24.8 44.3 75.7 25.4 24.8 701.68 588.78Touriga Francesca 14.3 21.6 24.4 24.9 11.5 18.3 24.5 25.6 903.21 909.02Touriga Nacional * 438.3 374.5 23.9 24.3 323.2 263.3 24.0 24.2 769.30 738.73Trousseau * 19.0 23.8 25.6 26.3 8.1 14.8 25.8 25.5 1,114.57 936.03Zinfandel 448,230.2 321,898.7 20.1 20.8 418,336.1 302,361.1 19.9 20.6 472.31 473.56Other Red 1 9,519.7 2,439.8 22.4 23.0 7,674.5 1,629.2 22.7 23.0 224.20 528.55
Total Red 2,235,169.8 1,638,700.1 23.3 23.8 1,844,315.0 1,385,239.8 23.1 23.6 633.60 626.72
TOTAL WINE 3,756,391.0 2,774,940.9 22.8 23.3 3,062,781.4 2,299,023.8 22.5 23.1 583.20 571.37
TOTAL ALL VARIETIES 4,330,064.2 3,615,277.7 22.6 22.8 3,474,284.0 3,023,991.5 22.3 22.6 533.04 482.28
Grape Crush Totals by Type and Variety, 2004–2005 continued
* Synonyms for variety names are shown below.1 Other categories include minor and mixed varieties.
Grape Variety Synonyms
Alicante Bouschet – AlicanteBeauty Seedless – Black BeautyBlaufraenkisch – LembergerBurger – MonbadonChardonnay – Pinot Chardonnay, Chardonnay MusqueCinsaut – Black Malvoisie, Black MalvasiaCrimson Seedless – Red CrimsonEmerald Seedless – Black SeedlessFlame Seedless – Red FlameGamay (Napa) – Gamay, ValdiguieGray Riesling – Trousseau GrisGrenache – Grenache NoirItalia – Muscat ItaliaMalaga – White Malaga
Malvasia Bianca – Vennentino, VermintinoMarechal Foch – FochMataro – MourvedreMeunier – Pinot MeunierMoscato Gaillo – Muscat YellowMuscat Blanc – Muscat Canelli, Muscat Blanc A Petits GrainsMuscat Hamburg – Black MuscatNegrette – Pinot St. GeorgeNero D’Avola – CalabresePalomino – Golden ChasselasPinot Gris – Pinot GrigioPrincess – MelissaRed Globe – Rose Ito
Refosco – MondeuseRubired – TintoriaRuby Seedless – King RubySangiovese – Sangioveto, BrunelloSauvignon Vert – MuscadelleSt. Emilion – Ugni Blanc, TrebbianoSyrah – French Syrah, Shiraz, Syrah NoirTempranillo – Tinta Roriz, ValdepenasTouriga Nacional – TourigaTrousseau – BastardoWhite Riesling – Johannisberg Riesling, Riesling

California Agricultural Resource Directory 2006 93
California relocating outside the state. Additionally, the number of dairy replacement heifers shipped into California in 2005 was below the numbers seen in the 2000 to 2002 period. This can be attributed in part to the ban on imports from Canada. In contrast, the beef cow inventory in California in 2005 took a different course and declined 20-thousand head from the previous year. This continued a downward trend that began in the mid-1990s. Unlike the dairy industry, which is composed of mainly confi nement operations, beef cows graze on pastures. Competition from other crops, urban growth and higher costs of production compared to many other states is taking a toll on beef cow numbers in California. Unlike the national beef cow inventory, which expanded for the second consecu-tive year in 2005, it appeared that California was not participating in the build-up phase of the U.S. beef cattle cycle.
California’s total cash receipts from livestock and livestock products were $8.45 billion in 2005; this is a 1 percent drop from 2004. Milk, cattle and chickens remained the state’s leading commodi-ties, generating more than 90 percent of livestock receipts for the year. Production value of eggs dropped 37 percent from 2004 to $182 million, the commodity’s lowest value since 1962. While both the dairy and beef cattle industries in California had profi table years in 2005, cow inventory trends were on different tracks. Dairy cow numbers in California expanded 30-thousand head above 2004. While this year-to-year growth was less than in the 2000 to 2002 period, the month-to-month growth in cow numbers was consistent much of the year. Reasons for the slower annual growth in dairy cow numbers from pervious years were varied, but they include increased challenges in obtaining permits to build new dairies and restrictions on expanding existing dairies; a growing number of environmental regulations in California; dairies that were sold the past two years in national dairy herd retirement programs; and dairies from Southern
Livestockand Dairy
phot
o by
Ed
Will
iam
s/Yu
ba C
o.

94 California Agricultural Resource Directory 2006
Livestock and Dairy
California surpassed Wisconsin in milk production in 1994 and is closing the gap in cheese production. Milk is the No. 1 agricultural commod-ity in California. Major dairy counties usually rank high in agricultural sales in the state. The top fi ve counties in agricultural sales are Fresno, Tulare, Kern, Monterey and Merced. Other than Monterey, these counties are major producers of dairy prod-ucts, cattle and calves. Tulare ranked No. 1 in milk and cream production, followed by Merced, Stan-islaus, Kings and Kern. Milk production climbed steadily over the past few years. At the same time, the structure of the industry changed, as has the way milk is used. Many dairies have merged; big dairies have grown larger while some smaller dairies have left the industry. More milk is produced on fewer farms and handled by fewer dairy fi rms each year. As milk production continues to grow, new uses of milk have developed. There are three general uses of milk: fl uid milk for consumers, cheese, and other dairy products. Fluid milk had the biggest proportion of milk use three decades ago. Modest increases in fl uid milk consumption have paled in comparison with the dramatic growth in cheese production over the past 30 years. Cheese produc-tion now takes up the biggest proportion of milk produced each year. Domestic cheese consump-
tion has not increased as rapidly as production, resulting in a higher percentage of milk products exported to other countries. Honey had the greatest percent increase in val-ue among livestock products in 2005 at 42 percent; however, the industry is barely recovering from the huge drop in production from the previous year. Honey production in 2003 was 32.2 million pounds, but in 2004 this number dropped to 17.6 million pounds due to a decline in the yield per colony. As a result, production value in 2004 was only 40 percent of 2003’s fi gure. The industry recovered in 2005 and yield per colony was the highest in the past
photo by Ed Williams/Merced Co.

California Agricultural Resource Directory 2006 95
Livestock and Dairy
fi ve years. Even though the price was 84 cents per pound, 17 cents lower than 2004 and 55 cents below 2003, the 2004 value of production climbed back to $25.2 million. Cash receipts for cattle and calves show an increasing trend in the past six years, reaching $1.74 billion in 2005. Price was the main reason for this increase. Even though there was no signifi cant change in cattle and calves production, prices rose steadily over the six-year period. The other red meat species, hogs and pigs, declined 10 percent, and sheep and lambs fell 3 percent in value despite increasing prices.
Livestock, Dairy, Poultry and Apiary Cash Income, 2004 – 2005
Source of Income 2004 2005 Percent Change$1,000 $1,000
Aquaculture 12,612 13,385 6Chickens, All 714,602 714,788 –Cattle and Calves 1,633,740 1,740,198 7Eggs, Chicken 287,392 181,655 -37Hogs and Pigs 39,855 35,796 -10Honey 17,726 25,200 42Milk and Cream 5,365,992 5,223,062 -3Sheep and Lambs 57,612 56,135 -3Turkeys 169,937 174,911 -3Wool and Mohair 2,822 2,531 -10Other Livestock 185,105 229,562 24Other Poultry 62,225 56,587 -9
TOTAL 8,549,620 8,453,806 -1
Bee Colonies, Honey Production and Value, 1996 – 2005 1
Year Bee Colonies Yield Per Colony Production Average Price Per Unit 2 Total Value1,000 Pounds 1,000 Pounds ¢/Lb. $1,000
1996 390 70 27,300 84 22,9321997 420 75 31,500 70 22,0501998 450 83 37,350 62 23,1571999 465 60 27,900 55 15,3452000 440 70 30,800 59 18,1722001 460 61 28,060 69 19,3612002 470 50 23,500 132 31,0202003 480 67 32,160 139 44,7022004 390 45 17,550 101 17,7262005 400 75 30,000 84 25,200
1 Producers with fi ve or more colonies.2 Prices weighted by sales.
photo by Ed Williams/Humboldt Co.

96 California Agricultural Resource Directory 2006
Livestock and Dairy
Milk Cows and Production by State, 2005
State –––– Total Production on Farms –––– Milk Cows on Farms 1
Average MilkProduction Per
Cow
Number ofLicensedDairies
Rank inProduction
Percent ofUnited States
ProductionMilk Change
from 2004 Million Pounds Percent 1,000 Pounds Percent
Alabama 224 -8.6 16 14,000 90 43 0.1Alaska 14 -7.5 1 12,273 10 50 0.0Arizona 3,742 2.6 163 22,957 140 13 2.1Arkansas 297 -8.0 22 13,500 210 40 0.2California 37,564 3.0 1,755 21,404 1,970 1 21.2Colorado 2,348 7.5 104 22,577 170 16 1.3Connecticut 384 -2.0 20 19,200 170 36 0.2Delaware 131 2.8 7 17,716 90 46 0.1Florida 2,271 0.8 137 16,577 180 19 1.3Georgia 1,398 -1.3 81 17,259 320 25 0.8
Hawaii 70 -13.5 5 12,889 5 48 0.0Idaho 10,161 11.7 455 22,332 725 5 5.7Illinois 1,958 -1.0 104 18,827 1,155 20 1.1Indiana 3,166 4.6 156 20,295 1,830 14 1.8Iowa 4,020 4.4 194 20,722 2,370 12 2.3Kansas 2,276 2.7 111 20,505 460 18 1.3Kentucky 1,371 -3.6 106 12,934 1,335 26 0.8Louisiana 433 -9.6 35 12,371 280 35 0.2Maine 595 -2.8 33 18,030 370 32 0.3Maryland 1,161 -0.1 72 16,125 655 28 0.7
Massachusetts 290 -2.0 17 17,059 200 41 0.2Michigan 6,735 6.4 311 21,656 2,590 8 3.8Minnesota 8,195 1.1 453 18,091 5,530 6 4.6Mississippi 381 0.5 25 15,240 230 37 0.2Missouri 1,875 1.5 117 16,026 1,780 21 1.1Montana 372 6.9 19 19,579 120 38 0.2Nebraska 1,077 2.7 60 17,950 405 30 0.6Nevada 542 6.5 25 21,680 30 33 0.3New Hampshire 302 -0.3 16 18,875 140 39 0.2New Jersey 192 -4.0 12 16,000 120 45 0.1
New Mexico 6,951 3.2 328 21,192 170 7 3.9New York 12,078 3.7 648 18,639 6,430 3 6.8North Carolina 1,005 -0.1 54 18,611 365 31 0.6North Dakota 527 0.2 33 15,970 360 34 0.3Ohio 4,743 4.0 270 17,567 3,610 11 2.7Oklahoma 1,236 -2.1 75 16,480 380 27 0.7Oregon 2,284 0.6 121 18,876 330 17 1.3Pennsylvania 10,503 4.4 561 18,722 8,700 4 5.9Rhode Island 19 -4.6 1 18,700 20 49 0.0South Carolina 290 1.0 18 16,111 110 42 0.2
South Dakota 1,437 6.7 81 17,741 650 24 0.8Tennessee 1,102 -4.6 70 15,743 710 29 0.6Texas 6,442 7.2 320 20,131 780 9 3.6Utah 1,661 3.2 88 18,875 345 23 0.9Vermont 2,641 1.8 143 18,469 1,230 15 1.5Virginia 1,784 3.1 105 16,990 815 22 1.0Washington 5,608 3.5 241 23,270 610 10 3.2West Virginia 194 0.0 13 14,923 130 44 0.1Wisconsin 22,866 3.5 1,236 18,500 15,100 2 12.9Wyoming 74 17.2 5 14,860 30 47 0.0
UNITED STATES 2 176,989 3.5 9,041 19,576 64,555
1 Average number during year, excluding heifers that have not freshened.2 State totals may not add to U.S. totals because of rounding.
Source: CDFA “California Dairy Statistics & Trends 2005,” using data provided by USDA National Agricultural Statistics Service, California Field Offi ce.

California Agricultural Resource Directory 2006 97
Livestock and Dairy
Milk Cows, Dairies and Cows Per Dairy by County and Region, 2004 – 2005
County and Region 1 ––––––––––––Annual Average 2004––––––––––––– ––––––––––––Annual Average 2005–––––––––––––
Numberof Cows
Number of Dairies 2
AverageNumber
Cows/Dairy
Numberof Cows 3
Number of Dairies 2
AverageNumber
Cows/Dairy
Butte 661 3 220 529 3 176 Contra Costa 4
Del Norte 3,047 10 305 3,238 10 324 Fresno 95,577 117 817 112,600 118 954 Glenn 18,404 60 266 17,696 45 393 Humboldt 16,138 92 175 16,147 91 177 Kern 121,147 51 2,375 138,281 55 2,514 Kings 5 149,484 165 986 155,238 165 941 Madera 63,934 57 1,020 67,173 57 1,178 Marin 10,265 29 354 10,127 29 349 Mendocino 4 2 1 Merced 237,854 317 750 239,786 327 733 Monterey 1,607 4 402 1,402 3 467 Placer 4 1 1 Sacramento 17,764 48 370 17,228 42 410 San Benito 842 3 281 837 3 279 San Joaquin 103,619 148 700 105,393 141 747 Santa Clara 4 2 2 Santa Cruz 4 1 1 Shasta 4 105 3 35 2 Siskiyou 1,606 5 321 1,425 4 356 Solano 4,068 5 814 4,083 5 817 Sonoma 30,660 82 374 29,590 75 395 Stanislaus 178,420 311 574 183,762 307 599 Sutter 4 1 1 Tehama 4,514 23 196 5,426 18 301 Tulare 442,853 334 1,326 451,093 334 1,351 Yolo 2,043 3 681 2,044 3 681 Yuba 3,278 4 820 3,328 4 832
NORTHERN CALIFORNIA 1,511,201 1,882 810 1,569,693 1,848 849
Imperial 4,528 3 1,509 5,108 3 1,703 Los Angeles 4 2 2 Riverside 67,573 55 1,229 59,973 45 1,333 San Bernardino 131,675 154 855 114,171 136 839 San Diego 5,397 8 675 4,392 6 732 San Luis Obispo 4 1 1 Santa Barbara 4 2 2
SOUTHERN CALIFORNIA 213,416 225 949 187,968 195 964
STATE 1,724,617 2,107 825 1,757,661 2,043 860
1 Counties omitted have no reported milk production.2 Data from CDFA Milk and Dairy Food Safety Branch.3 Number of cows for 2005 increased by 33,044 from the previous year.4 Not published, but included in total.5 Kings County number of cows for 2004 revised from 162,656 to 149,484.

98 California Agricultural Resource Directory 2006
Livestock and Dairy
County and Region 2 January February March April May June July August September October November December Total
––––––––––––––––––––––––––––––––––––––––––––––––– Pounds –––––––––––––––––––––––––––––––––––––––––––––––
Butte 967,821 905,416 1,050,663 1,016,676 1,014,865 958,691
Colusa 3
Contra Costa 3
Del Norte 3,910,659 3,469,016 4,196,437 4,632,869 5,146,312 4,823,863
Fresno 191,092,981 173,703,956 202,669,298 201,279,339 208,490,423 202,930,855
Glenn 33,063,488 30,038,364 33,743,763 32,869,241 33,372,490 32,058,599
Humboldt 21,413,627 19,876,141 24,012,159 24,875,633 27,584,637 27,908,518
Kern 246,636,248 230,604,103 262,531,933 259,843,904 262,564,632 249,271,337
Kings 268,013,730 248,735,644 283,054,494 276,978,989 285,525,227 275,132,455
Madera 112,449,200 103,862,932 119,151,152 119,081,994 125,275,465 121,463,592
Marin 17,818,533 16,354,094 18,286,366 17,874,235 18,517,895 17,759,667
Mendocino 3
Merced 413,138,710 383,026,163 431,339,562 424,208,224 442,168,932 430,355,577
Monterey 2,811,447 2,605,484 2,399,882 2,403,694 2,459,400 2,456,540
Placer 3
Sacramento 32,021,878 29,181,742 32,731,199 31,681,753 33,167,641 32,948,813
San Benito 1,522,182 1,402,365 1,545,659 1,521,112 1,584,902 1,538,237
San Joaquin 183,954,910 169,467,034 194,445,664 186,802,190 195,786,266 188,273,512
Santa Clara 3
Santa Cruz 3
Shasta 3
Siskiyou 2,415,267 2,224,887 2,525,240 2,480,511 2,636,059 2,623,188
Solano 7,476,839 6,646,335 7,386,402 7,259,711 7,481,933 7,152,582
Sonoma 52,433,393 48,389,325 53,172,837 51,781,140 54,000,391 51,983,770
Stanislaus 316,330,406 291,642,309 327,468,119 322,607,061 339,330,900 332,250,876
Sutter 3
Tehama 7,969,436 8,673,748 9,774,953 9,748,532 10,210,253 9,679,759
Tulare 808,329,838 746,536,558 846,306,171 836,670,031 852,622,724 828,290,049
Yolo 3,875,322 3,534,718 3,958,637 3,797,381 3,764,129 3,410,405
Yuba 6,395,540 6,004,391 6,660,873 6,350,494 6,355,950 5,962,306
NORTHERN CALIFORNIA 2,739,953,557 2,532,145,289 2,874,260,500 2,831,679,577 2,925,323,511 2,834,946,745 2,788,700,257 2,824,611,032 2,759,074,570 2,828,215,874 2,745,836,008 2,862,079,261 33,546,826,181
Imperial 7,013,878 7,218,303 8,632,539 8,989,510 9,456,298 8,743,442
Los Angeles 3
Riverside 108,492,971 98,268,951 107,598,347 107,204,430 110,427,600 108,010,229
San Bernardino 205,518,204 193,176,089 217,301,918 219,638,736 225,838,222 209,605,189
San Diego 7,976,812 7,367,125 8,148,626 8,346,562 8,750,934 8,215,438
San Luis Obispo 3
Santa Barbara 3
SOUTHERN CALIFORNIA 336,177,710 312,786,769 349,041,343 351,860,420 362,777,596 342,642,279 333,462,407 328,386,615 319,929,479 318,573,839 303,421,843 315,562,258 3,974,622,558
STATE 3,076,131,267 2,844,932,058 3,223,301,843 3,183,539,997 3,288,101,107 3,177,589,024 3,122,162,664 3,152,997,647 3,079,004,049 3,146,789,713 3,049,257,851 3,177,641,519 37,521,448,739
Commercial Milk Production by County and Month, 2005 1
1 Includes total milk sold. Excludes milk left on ranch.2 Counties omitted have no reported milk production.3 Not published, but included in total.

California Agricultural Resource Directory 2006 99
Livestock and Dairy
County and Region 2 January February March April May June July August September October November December Total
––––––––––––––––––––––––––––––––––––––––––––––––––––– Pounds –––––––––––––––––––––––––––––––––––––––––––––––––––––––––––––––––––
947,779 927,372 877,760 881,000 828,425 841,604 11,218,072
5,028,931 4,855,159 5,049,703 4,803,994 4,278,814 4,427,937 54,623,694
199,853,061 202,522,450 197,772,240 204,694,623 198,319,797 206,968,259 2,390,297,282
29,959,691 30,831,524 30,026,834 30,576,309 28,638,197 30,126,070 375,304,570
27,430,819 25,965,023 23,036,694 22,814,972 20,102,348 19,415,908 284,436,479
242,766,465 246,169,751 238,870,092 247,799,856 245,568,049 260,524,825 2,993,151,195
269,210,898 275,436,183 271,413,804 279,309,259 273,093,569 287,626,842 3,293,531,094
120,762,071 123,215,831 119,982,939 122,125,193 117,691,763 119,540,485 1,424,602,617
18,322,595 18,296,048 16,878,475 17,486,600 17,040,945 18,132,335 212,767,788
429,600,332 433,613,417 420,339,372 431,158,390 416,445,665 429,978,986 5,085,373,330
2,546,713 2,517,769 2,395,114 2,410,273 2,327,482 2,400,562 29,734,360
32,566,118 32,314,932 27,580,078 27,612,369 26,417,351 27,147,929 365,371,803
1,559,533 1,437,543 1,398,618 1,454,563 1,370,785 1,418,616 17,754,115
187,303,834 191,385,586 183,863,168 186,261,188 180,269,754 187,349,409 2,235,162,515
2,734,019 2,680,594 2,531,672 2,581,592 2,368,548 2,416,971 30,218,548
7,240,373 7,504,290 7,162,509 7,139,989 6,934,225 7,212,730 86,597,918
53,268,809 53,168,226 50,813,671 51,680,744 49,727,895 51,300,615 621,720,816
335,499,739 336,637,634 321,639,261 328,172,868 317,500,785 328,132,094 3,897,212,052
9,919,190 10,251,346 10,208,865 9,864,415 9,351,968 9,427,550 115,080,015
798,025,006 810,210,245 813,290,169 835,333,742 813,719,752 853,036,717 9,842,371,002
3,188,002 3,471,552 3,497,845 3,487,929 3,484,928 3,877,552 43,348,400
5,446,145 5,564,653 5,323,086 5,427,264 5,424,611 5,666,358 70,581,671
NORTHERN CALIFORNIA 2,739,953,557 2,532,145,289 2,874,260,500 2,831,679,577 2,925,323,511 2,834,946,745 2,788,700,257 2,824,611,032 2,759,074,570 2,828,215,874 2,745,836,008 2,862,079,261 33,546,826,181
8,051,662 6,888,432 7,228,360 7,537,822 7,729,192 8,326,636 95,816,074
106,207,847 106,169,351 105,951,291 106,042,944 101,248,112 105,815,997 1,271,438,070
203,205,203 198,844,171 190,605,781 189,494,591 180,497,656 186,733,445 2,420,459,205
7,692,731 7,942,295 7,740,810 7,199,671 6,741,676 6,987,841 93,110,521
SOUTHERN CALIFORNIA 336,177,710 312,786,769 349,041,343 351,860,420 362,777,596 342,642,279 333,462,407 328,386,615 319,929,479 318,573,839 303,421,843 315,562,258 3,974,622,558
STATE 3,076,131,267 2,844,932,058 3,223,301,843 3,183,539,997 3,288,101,107 3,177,589,024 3,122,162,664 3,152,997,647 3,079,004,049 3,146,789,713 3,049,257,851 3,177,641,519 37,521,448,739

100 California Agricultural Resource Directory 2006
Livestock and Dairy
Beef Cow Operations and Inventory, Percentage by Size Groups, 1996 – 2005
Year –––––––––– 1–99 Head –––––––––– ––––––––– 100–499 Head ––––––––– –––––––––– 500+ Head ––––––––
Operations Inventory Operations Inventory Operations InventoryPercent of Total
1996 86.0 24.0 12.0 43.0 2.0 33.01997 85.8 24.0 12.2 42.0 2.0 34.01998 85.5 23.0 12.4 43.0 2.1 34.01999 85.3 22.0 12.6 43.0 2.1 35.02000 85.2 21.0 12.7 44.0 2.1 35.02001 85.1 21.0 12.6 45.0 2.3 34.02002 84.1 19.0 13.6 45.0 2.3 36.02003 84.3 19.0 13.3 46.0 2.4 35.02004 84.3 18.0 13.0 45.0 2.6 37.02005 84.3 20.0 13.0 44.0 2.6 36.0
Cattle Operations and Inventory, Percentage by Size Groups, 1996 – 2005
Year ––––––– 1–99 Head ––––––– ––––––– 100–499 Head ––––––– ––––––– 500–999 Head ––––––– ––––––– 1,000+ Head –––––––
Operations Inventory Operations Inventory Operations Inventory Operations InventoryPercent of Total
1996 75.0 6.0 15.4 19.0 5.0 19.0 4.6 56.01997 75.8 6.5 14.6 17.5 4.6 16.0 5.0 60.01998 75.2 6.0 14.8 16.0 4.8 17.0 5.2 61.01999 75.2 6.0 14.8 16.0 4.8 17.0 5.2 61.02000 75.0 6.0 14.5 15.0 5.0 16.0 5.5 63.02001 74.3 6.0 14.8 15.0 5.2 15.0 5.7 64.02002 73.5 5.5 15.0 14.5 5.5 15.0 6.0 65.02003 72.2 5.0 15.6 13.0 5.6 14.0 6.7 68.02004 71.8 4.5 14.7 11.5 5.9 14.0 7.6 70.02005 71.8 4.5 14.7 10.5 5.9 13.0 7.6 72.0

California Agricultural Resource Directory 2006 101
Livestock and Dairy
Cattle and Calves Average Prices Received, 1996 – 2005
Year Jan. Feb. Mar. April May June July Aug. Sept. Oct. Nov. Dec. Annual Average
$/Cwt.
ALL BEEF CATTLE 11996 42.20 41.20 40.90 38.20 38.20 41.80 43.60 45.10 44.50 43.80 43.60 44.10 42.401997 43.30 46.30 48.90 49.00 51.90 50.30 49.50 51.30 49.10 48.90 49.30 47.70 48.801998 48.40 48.50 49.80 50.30 51.20 49.90 47.00 47.20 45.80 46.00 46.00 44.50 47.801999 45.80 47.20 48.60 48.50 48.80 49.70 49.20 49.70 48.60 48.30 48.40 48.50 49.002000 48.10 48.90 49.50 52.50 52.00 51.80 51.10 50.80 48.10 48.10 49.40 50.80 50.002001 54.10 55.90 58.10 58.20 56.90 57.10 55.50 55.20 51.20 49.80 47.90 47.40 53.902002 48.20 51.90 55.50 52.70 51.70 51.50 50.50 49.40 49.50 47.80 49.10 52.10 50.802003 55.00 56.70 56.80 59.40 61.00 58.50 61.50 62.80 64.80 67.40 69.70 70.70 62.002004 62.40 60.80 66.00 70.40 72.90 73.30 75.20 72.30 69.60 67.80 65.40 68.50 68.702005 69.10 69.00 72.70 76.70 76.40 73.70 70.00 67.50 67.80 66.00 66.70 70.70 70.40
BEEF STEERS AND HEIFERS 21996 52.00 49.50 49.50 46.00 44.50 51.00 53.00 55.00 56.00 56.00 57.00 58.00 52.501997 58.50 61.00 63.00 62.00 64.00 62.50 61.50 64.00 64.00 64.50 66.00 64.50 63.101998 65.00 63.50 64.00 64.00 64.00 62.00 60.00 59.00 58.00 60.00 61.00 60.00 61.501999 61.50 62.50 64.00 63.00 62.50 64.50 63.00 64.00 64.50 67.00 68.00 67.00 64.302000 67.00 67.50 69.00 72.00 71.00 70.00 68.50 67.00 67.00 70.00 73.00 76.00 69.802001 78.00 78.00 79.50 79.50 77.00 76.00 73.00 72.00 71.00 69.00 66.50 66.00 74.102002 69.00 72.00 73.00 68.00 67.00 65.50 65.00 65.00 67.00 66.50 71.00 74.50 68.402003 77.50 78.50 76.00 78.50 78.50 77.00 76.50 81.00 88.50 96.00 97.50 94.50 83.202004 82.00 80.00 85.50 87.00 90.50 93.30 93.50 90.00 88.00 89.00 88.80 90.80 88.302005 91.20 90.20 92.60 94.30 92.20 88.20 85.40 85.10 89.30 92.10 94.80 95.60 90.80
BEEF COWS 31996 31.50 31.50 30.00 29.00 29.50 29.50 32.00 33.00 31.00 30.00 29.00 29.00 30.401997 28.00 31.00 33.00 35.00 36.50 34.00 36.00 37.00 33.00 32.00 32.00 31.50 33.101998 32.50 33.50 34.50 35.50 35.50 34.50 33.00 34.50 33.50 30.00 29.50 30.30 32.901999 33.50 34.60 35.40 35.70 36.20 35.50 36.50 36.00 34.50 33.00 33.00 34.00 34.802000 35.50 36.50 36.50 36.50 37.00 37.50 37.50 37.50 35.00 33.50 35.00 34.00 35.902001 37.50 40.50 42.00 41.50 40.50 41.00 40.00 42.00 38.50 37.00 35.50 35.00 38.902002 36.00 39.00 40.50 38.00 37.00 37.00 36.50 35.00 34.00 32.50 32.50 34.50 35.902003 35.00 36.50 39.00 39.50 42.00 38.50 44.50 44.50 42.00 42.00 44.00 46.00 41.102004 42.00 41.50 44.00 48.50 48.60 48.80 53.70 52.30 49.70 47.50 44.60 46.10 47.202005 46.90 47.80 49.40 54.30 55.50 54.50 51.20 49.10 47.90 43.80 42.80 44.80 48.50
CALVES 41996 62.50 59.00 61.00 54.00 51.00 51.00 53.00 56.00 55.00 54.00 55.00 56.00 55.701997 59.00 65.00 68.00 67.00 71.00 69.00 71.00 71.00 71.00 70.00 67.00 69.00 68.101998 72.00 74.00 73.00 75.00 73.50 70.00 68.00 68.00 63.50 70.00 72.50 73.30 70.901999 77.50 81.00 79.00 76.00 74.00 75.50 76.00 76.50 81.50 80.00 83.50 87.50 79.102000 91.00 96.00 97.50 94.50 92.00 90.50 93.00 90.50 91.50 93.00 95.00 93.00 93.002001 98.00 95.50 98.00 99.50 95.00 91.00 94.00 94.00 90.00 89.00 90.00 94.00 94.102002 91.00 93.50 93.50 85.00 84.50 80.00 77.50 79.00 79.00 79.50 88.00 95.00 85.402003 93.00 91.00 92.00 95.00 94.00 93.00 93.00 97.00 99.00 100.00 101.00 109.00 96.602004 109.00 101.00 110.00 115.00 107.00 110.00 112.00 108.00 112.00 113.00 120.00 120.00 111.002005 123.00 118.00 121.00 127.00 128.00 121.00 117.00 109.00 114.00 121.00 124.00 128.00 121.00
1 Steers and heifers over 500 pounds (including fed cattle) and slaughter cows.2 Steers and heifers (all qualities) over 500 pounds (including fed cattle).3 Beef cows and cull dairy cows sold for slaughter.4 Steers and heifers (all qualities) under 500 pounds
Cattle and Calves Marketed from Feedlots, 1996 – 2005
Year January – March April – June July – September October – December Annual Total
1,000 Head
1996 145 140 135 145 5651997 135 150 140 145 5701998 140 125 145 160 5701999 145 150 153 142 5902000 153 154 151 150 6082001 161 151 149 145 6062002 162 186 160 163 6712003 181 192 187 161 7212004 183 192 179 174 7282005 187 184 173 163 707

102 California Agricultural Resource Directory 2006
Livestock and Dairy
Cattle and Calves Slaughtered Under Federal and State Inspections, 1996–2005
Year Jan. Feb. Mar. April May June July Aug. Sept. Oct. Nov. Dec. Annual Total 1
1,000 Head
CATTLE1996 88 77 78 81 87 84 85 87 81 94 87 88 1,0171997 95 75 82 86 84 83 88 84 84 93 81 95 1,0301998 90 79 83 84 80 86 86 87 88 88 83 87 1,0191999 81 74 86 82 79 86 81 85 83 86 86 87 9972000 83 81 92 75 86 89 81 92 87 94 93 86 1,0382001 92 77 89 82 89 91 89 96 85 99 90 83 1,0622002 102 90 97 107 111 108 114 116 110 120 109 111 1,2942003 119 103 110 115 119 119 121 115 121 123 104 113 1,3802004 111 101 112 104 103 113 107 114 114 108 111 120 1,3182005 120 100 117 104 107 119 108 120 111 114 121 121 1,362
CALVES1996 21 24 24 23 25 24 27 25 21 20 17 18 2691997 22 17 16 15 12 15 17 17 17 15 15 20 2001998 19 17 16 14 12 15 22 19 16 14 13 16 1911999 15 14 16 11 10 13 16 17 16 13 11 12 1642000 12 11 12 8 10 11 10 11 10 10 9 8 1212001 9 8 8 8 8 8 9 10 9 10 10 9 1052002 10 9 9 10 10 9 12 11 10 10 10 12 1212003 13 12 11 10 11 11 13 11 11 10 9 11 1322004 9 9 10 7 7 8 8 9 8 8 8 8 992005 9 9 10 7 7 7 7 7 7 6 6 5 86
1 Totals may not equal sum of parts due to rounding.
Average Live Weights of Cattle and Calves Slaughtered Under Federal and State Inspections, 1996–2005
Year Jan. Feb. Mar. April May June July Aug. Sept. Oct. Nov. Dec. Annual Average
Pounds
CATTLE1996 1,244 1,240 1,233 1,224 1,225 1,224 1,229 1,200 1,219 1,219 1,222 1,224 1,2251997 1,224 1,203 1,244 1,238 1,240 1,235 1,245 1,244 1,253 1,263 1,264 1,243 1,2421998 1,245 1,243 1,217 1,224 1,240 1,248 1,237 1,237 1,245 1,250 1,275 1,267 1,2441999 1,292 1,271 1,275 1,259 1,246 1,241 1,231 1,248 1,250 1,251 1,261 1,251 1,2562000 1,257 1,237 1,230 1,238 1,244 1,240 1,233 1,233 1,247 1,244 1,231 1,264 1,2412001 1,269 1,259 1,249 1,269 1,266 1,238 1,257 1,262 1,270 1,279 1,313 1,303 1,2692002 1,305 1,295 1,308 1,290 1,312 1,294 1,273 1,269 1,280 1,288 1,275 1,286 1,2892003 1,275 1,280 1,278 1,280 1,290 1,280 1,268 1,256 1,256 1,284 1,283 1,264 1,2742004 1,274 1,266 1,307 1,296 1,301 1,308 1,315 1,326 1,334 1,342 1,343 1,341 1,3132005 1,316 1,302 1,294 1,307 1,325 1,330 1,329 1,324 1,333 1,358 1,360 1,382 1,331
CALVES1996 363 348 359 367 357 362 357 350 321 330 328 321 3481997 324 334 351 349 352 374 356 350 346 352 336 256 3381998 248 240 148 113 115 119 115 119 121 122 131 128 1461999 123 126 135 149 149 162 134 130 136 146 163 155 1412000 166 154 153 160 192 179 164 149 152 156 160 153 1622001 153 157 157 157 149 156 160 159 157 185 173 180 1622002 166 171 163 152 143 133 130 123 138 152 141 140 1452003 126 133 143 166 190 187 177 187 190 190 200 222 1752004 213 209 177 143 149 140 135 133 138 141 141 139 1562005 134 134 127 174 172 174 156 143 145 169 168 192 154

California Agricultural Resource Directory 2006 103
Livestock and Dairy
Cattle by Class as of January 1, 1997–2006
Year –––––– Cows That Have Calved –––––– –––––––––– Heifers 500+ Lbs. –––––––––– –––––––––––– Other Cattle ––––––––––––– All Cattle and CalvesBeef Dairy All Cow Replacements Other Heifers Calves Under
500 Lbs.Bulls 500+
Lbs.Steers 500+
Lbs.Beef Milk1,000 Head
1997 820 1,380 2,200 150 660 170 980 70 670 4,900
1998 820 1,400 2,220 145 670 165 990 65 645 4,900
1999 810 1,440 2,250 145 720 190 1,060 70 665 5,100
2000 790 1,490 2,280 145 720 175 1,050 70 660 5,100
2001 780 1,560 2,340 140 750 170 1,050 70 630 5,150
2002 760 1,620 2,380 135 770 170 1,040 65 640 5,200
2003 740 1,670 2,410 130 790 170 1,070 65 615 5,250
2004 720 1,700 2,420 125 730 170 1,050 65 640 5,200
2005 720 1,740 2,460 130 760 190 1,120 70 670 5,400
2006 700 1,770 2,470 120 790 180 1,220 75 645 5,500
Cattle Inventory, Supply and Disposition, 1996–2005
Year Beginning Inventory January 1
Calf Crop Inshipments –––– Marketings 1 –––– Farm Slaughter Cattle and Calves 2
–––––– Deaths ––––– Ending Inventory January 1
Cattle Calves Cattle Calves
1,000 Head
1996 4,850 1,860 820 2,064 312 20 90 144 4,900
1997 4,900 1,880 785 2,167 261 22 90 125 4,900
1998 4,900 1,920 600 1,855 201 19 95 150 5,100
1999 5,100 1,950 700 2,119 282 19 85 145 5,100
2000 5,100 1,980 700 2,013 362 15 90 150 5,150
2001 5,150 1,990 750 2,054 387 14 90 145 5,200
2002 5,200 2,040 700 1,934 502 14 90 150 5,250
2003 5,250 2,050 670 2,013 502 15 90 150 5,200
2004 5,200 2,070 750 1,886 472 12 95 155 5,400
2005 5,400 2,080 730 1,923 507 15 100 165 5,500
1 Includes custom slaughter for use on farms where produced, but excludes inter-farm sales.2 Excludes custom slaughter for farmers at commercial establishments.

104 California Agricultural Resource Directory 2006
Livestock and Dairy
Manufactured Dairy Products, 2000–2005
Commodity 2000 2001 2002 2003 2004 2005 1
1,000 PoundsBUTTER 360,013 341,103 379,462 363,833 385,969 407,872
ALL CHEESE TOTAL 2 1,496,653 1,643,334 1,722,211 1,830,927 1,992,820 2,136,780 American Cheese Total 3 641,662 745,391 785,436 789,629 828,974 854,704 Cheddar 461,691 539,221 561,567 523,716 538,318 522,624 Monterey, Jack and Other 179,971 206,170 223,869 265,913 290,656 332,080 Italian Cheese Total 725,572 772,827 789,833 886,650 995,234 1,088,664 Mozzarella 634,006 675,623 697,751 791,981 887,774 966,893 Other Italian 91,566 97,204 92,082 94,669 107,460 121,771 Hispanic Cheese 65,252 70,636 78,691 82,306 89,076 96,347 All Other Cheese 37,781 24,423 42,861 48,043 50,442 58,754
CREAMED AND LOW FAT COTTAGE CHEESE TOTAL 100,769 98,410 96,416 96,645 99,333 99,878 Creamed 33,496 31,690 31,086 31,288 31,523 31,228 Low Fat 4 67,273 66,720 65,330 65,357 67,810 68,650
CURD COTTAGE CHEESE TOTAL 48,684 40,258 41,758 39,892 41,924 43,799
YOGURT, PLAIN AND FLAVORED 257,211 264,304 454,483 479,226 454,302 511,990
MILK, NONFAT DRY FOR HUMAN CONSUMPTION 692,954 694,459 758,985 738,303 742,741 506,452
MILK, UNSWEETENED CONDENSED SKIM 522,391 468,728 505,092 480,473 493,000 575,811
1,000 GallonsICE CREAM 5 137,534 143,525 130,419 133,531 127,354 138,957
LOW FAT ICE CREAM TOTAL 6 31,355 26,859 22,336 29,321 28,411 24,066 Hard 8,038 4,965 6,922 6,039 2,582 2,529 Soft 23,317 21,894 15,414 23,282 25,829 21,537
MILK SHERBET 7,299 7,000 7,929 6,851 6,687 7,163WATER ICES 5,011 3,001 3,557 2,447 7 7
1 Preliminary 2005 data.2 Excludes cottage cheese.3 Includes Cheddar, Colby, washed curd, stirred curd, Monterey and Jack.4 Includes low-fat and nonfat cottage cheese. Fat content is less than 4 percent.5 Contains minimum milk-fat content of 10 percent and not less than 4.5 pounds per gallon.6 Includes hard, soft-serve, freezer-made milkshake, and freezer-made “milk drink.” Contains less than 10 percent milk-fat required for ice cream.7 Not shown when fewer than three plants reported or individual plant operations could be disclosed.7 Not shown when fewer than three plants reported or individual plant operations could be disclosed.7
Milk Cow Average Prices Received, 1996–2005 1
Year January April July October Annual AverageDollars Per Head
1996 1,190 1,190 1,230 1,280 1,2201997 1,230 1,250 1,240 1,240 1,2401998 1,220 1,260 1,290 1,310 1,2701999 1,340 1,340 1,360 1,470 1,3802000 1,480 1,500 1,500 1,480 1,4902001 1,480 1,480 1,650 1,850 1,6202002 1,800 1,900 1,800 1,450 1,7402003 1,380 1,250 1,230 1,350 1,3002004 1,350 1,550 1,700 1,650 1,5602005 1,600 1,750 1,800 1,950 1,780
1 For dairy herd replacement.

California Agricultural Resource Directory 2006 105
Livestock and Dairy
Milk Cows Calved, Milk Production and Value, 1996 – 2005
Year –– Milk Cows and Heifers Calved –– –––– Production Per Milk Cow –––– ––––– Production on Farms –––––– Value Per Unit Total Value 1
January 1 Annual Average Milk Milk Fat Milk Milk Fat
1,000 Head 1,000 Head Pounds Pounds Million Pounds Million Pounds $/Cwt. $1,000
1996 1,320 1,349 19,161 701 25,848 946 14.39 3,714,624
1997 1,380 1,391 19,829 722 27,582 1,004 13.17 3,629,762
1998 1,400 1,420 19,451 714 27,620 1,014 15.01 4,138,857
1999 1,440 1,465 20,781 761 30,444 1,114 13.45 4,088,935
2000 1,490 1,526 21,130 778 32,245 1,187 11.50 3,704,035
2001 1,560 1,589 20,904 771 33,217 1,226 13.94 4,625,431
2002 1,620 1,648 21,277 785 35,065 1,294 10.94 3,832,501
2003 1,670 1,688 20,993 770 35,437 1,301 11.38 4,032,731
2004 1,700 1,725 21,139 776 36,465 1,338 14.73 5,371,295
2005 1,740 1,755 21,404 786 37,564 1,379 13.92 5,228,909
1 Milk valued at averaged returns per 100 pounds in combined marketings of milk and cream. Includes value of milk fed to calves.
Milk Cow Operations and Inventory by Size Groups, 1996–2005
Year –––– 1 – 49 Head –––– –––– 50 – 99 Head –––– ––– 100 – 199 Head –––– –––– 200+ Head 1 –––– ––– 200 – 499 Head ––– ––––– 500+ Head –––––
Operations Inventory Operations Inventory Operations Inventory Operations Inventory Operations Inventory Operations Inventory
Number Percent Number Percent Number Percent Number Percent Number Percent Number Percent
1996 670 0.4 130 0.8 300 3.8 1,800 95.0 – – – –
1997 590 0.4 120 0.7 290 3.4 1,800 95.5 750 16.5 1,050 79.0
1998 510 0.4 110 0.7 270 3.4 1,810 95.5 750 17.5 1,060 78.0
1999 450 0.3 70 0.4 250 3.3 1,830 96.0 730 17.0 1,100 79.0
2000 370 0.3 70 0.3 230 2.9 1,830 96.5 730 16.5 1,100 80.0
2001 370 0.3 80 0.3 250 2.4 1,800 97.0 700 15.0 1,100 82.0
2002 380 0.3 80 0.3 200 1.9 1,740 97.5 640 13.5 1,100 84.0
2003 390 0.3 80 0.3 210 1.9 1,720 97.5 620 12.5 1,100 85.0
2004 365 0.2 80 0.3 180 1.5 1,675 98.0 575 12.0 1,100 86.0
2005 390 0.2 80 0.3 180 1.5 1,650 98.0 550 11.0 1,100 87.0
1 Starting in 1997, the 200+ Head class was broken out into 200+ Head, 200-499 Head, and 500+ Head classes.

106 California Agricultural Resource Directory 2006
Livestock and Dairy
Grazing Fee Annual Average Rates, 1996 – 2005 1
Year Per Animal Unit 2 Cow-Calf Per Head
Dollars Per Month
1996 10.10 12.20 11.901997 10.60 13.00 12.001998 11.50 14.50 12.901999 12.10 15.00 12.502000 12.30 15.50 12.702001 13.00 16.00 13.502002 12.80 16.50 14.002003 13.50 17.50 14.302004 14.50 19.50 15.502005 15.40 20.50 17.00
1 The average rates are estimates (rates over $10.00 are rounded to the nearest dime) based on survey indications of monthly lease rates for private, non-irrigated grazing land from the January Agricultural Survey.2 Includes animal unit plus cow-calf rates. Cow-calf rate converted to animal unit (AUM) using (1 aum=cow-calf *0.833).
Layers and Egg Production, 2004 – 2005
Month ––––– Average Number of Layers ––––– –– Average Number of Eggs Per 100 Layers –– ––––––– Total Egg Production –––––––
2004 2005 2005/2004 2004 2005 2005/2004 2004 2005 2005/20041,000 1,000 Percent Number Number Percent Millions Millions Percent
December 1 20,769 19,611 94 2,244 2,295 102 466 450 97January 20,442 19,611 96 2,172 2,239 103 444 439 99February 20,416 19,655 96 2,077 2,020 97 424 397 94March 20,398 19,957 98 2,245 2,230 99 458 445 97April 20,110 19,444 97 2,138 2,155 101 430 419 97May 20,014 18,920 95 2,203 2,225 101 441 421 95June 20,171 18,801 93 2,152 2,170 101 434 408 94July 20,298 18,938 93 2,232 2,234 100 453 423 93August 20,127 19,260 96 2,266 2,186 96 456 421 92September 19,953 19,134 96 2,210 2,132 96 441 408 93October 20,118 19,201 95 2,291 2,219 97 461 426 92November 19,847 19,495 98 2,237 2,180 97 444 425 96
Average/Total 20,222 19,336 96 2,206 2,190 99 5,352 5,082 95
1 December of previous year.
Broiler Production and Value, 1996 – 2005 1
Year Broilers Average Live Weight Meat Produced Value Per Unit 2 Total Value 3
1,000 Head Pounds 1,000 Pounds ¢/Lb. $1,000
1996 234,200 5.0 1,171,000 39.0 456,6901997 237,300 5.0 1,210,200 39.0 471,9781998 – – – – –1999 – – – – –2000 – – – – –2001 – – – – –2002 – – – – –2003 – – – – –2004 – – – – –2005 – – – – –
1 Data not published since 1998 to avoid disclosure of individual operations.2 Live weight equivalent price.3 Gross income including home consumption.

California Agricultural Resource Directory 2006 107
Livestock and Dairy
Egg Production and Value, 1996 – 2005 1
Year Eggs Value Per Unit 2 Total Value
Millions ¢/Doz. $1,000
1996 6,569 67.1 367,3171997 6,663 62.1 344,8101998 6,608 56.1 309,0191999 6,606 47.9 263,6632000 6,319 45.3 238,7962001 6,082 47.1 238,9512002 6,257 39.2 204,2322003 5,439 62.3 282,4582004 5,352 64.4 287,3922005 5,082 42.9 181,655
1 Data covers the 12-month period of December 1 (of the previous year) through November 30.2 Average of all eggs, including hatching eggs.
Turkey Production and Value, 1996 – 2005
Year Turkeys Meat Produced 1 Value Per Unit 2 Total Value
1,000 Head 1,000 Pounds ¢/Lb. $1,000
1996 22,500 492,750 45.0 221,7381997 21,000 480,900 42.0 201,9781998 19,000 442,700 41.0 181,5071999 17,500 428,750 45.0 192,9382000 18,000 439,200 48.0 210,8162001 18,700 450,670 47.0 211,8152002 17,700 438,960 36.0 158,0262003 17,300 418,660 36.0 150,7182004 15,700 414,480 41.0 169,9372005 14,900 406,770 43.0 174,911
1 Includes home consumption.2 Live weight equivalent price.
Hogs and Pigs by Class as of December 1, 1996–2005
Year ––––––– Hogs and Pigs ––––––– –––––––––––––––––––––––––––––––– Market Hogs ––––––––––––––––––––––––––––––––
All Breeding Under 60 Pounds
60-119 Pounds 120-179 Pounds
180 Pounds and Over
Total
1,000 Head
1996 210 27 57 51 40 35 1831997 210 27 60 45 45 33 1831998 210 27 70 50 40 23 1831999 190 25 55 50 35 25 1652000 150 20 32 43 45 10 1302001 110 20 35 25 11 19 902002 150 22 39 32 29 28 1282003 135 20 35 25 28 27 1152004 140 20 32 32 26 30 1202005 145 20 40 35 25 25 125

108 California Agricultural Resource Directory 2006
Livestock and Dairy
Sows Farrowed and Pig Crop, 1996 – 2005
Year –––––––––––––––––––––––––––––––– December–November ––––––––––––––––––––––––––––––––
Sows Farrowed Pig Crop Pigs Per Litter1,000 Head 1,000 Head Number
1996 42 390 9.31997 45 416 9.21998 44 404 9.21999 43 399 9.32000 40 371 9.32001 27 239 8.92002 35 304 8.72003 34 321 9.42004 39 352 9.02005 32 306 9.6
Hogs and Pigs Inventory, Supply and Disposition, 1996 – 2005
Year Beginning Inventory December 1
(Previous Year)
Pig Crop (Dec.-Nov.)
Inshipments 1 Marketings 2 Farm Slaughter 3
Deaths Ending Inventory December 1
1,000 Head
1996 240 390 30 383 22 45 2101997 210 416 51 400 15 52 2101998 210 404 40 377 12 55 2101999 210 399 40 391 8 60 1902000 190 371 45 374 7 75 1502001 150 239 30 278 6 25 1102002 110 304 45 284 5 20 1502003 150 321 45 352 5 24 1352004 135 352 40 350 7 30 1402005 140 306 42 309 7 27 145
1 For feeding or breeding, excludes stock brought in for immediate slaughter.2 Includes custom slaughter for use on farms where produced and state out-shipments, but excludes inter-farm sales.3 Excludes custom slaughter for farmers at commercial establishments.
Hogs and Pigs Slaughtered Under Federal and State Inspections, 1996 – 2005
Year Jan. Feb. Mar. April May June July Aug. Sept. Oct. Nov. Dec. Annual Total 1
1,000 Head
1996 176 168 165 171 165 151 164 173 162 182 158 183 2,0171997 172 152 160 159 155 154 160 156 161 171 149 190 1,9371998 183 155 169 173 170 180 188 190 207 204 189 205 2,2121999 208 188 203 204 193 190 191 192 199 193 188 202 2,3502000 193 180 202 175 195 189 173 201 183 205 186 195 2,2782001 205 172 196 186 191 179 182 205 184 219 218 231 2,3672002 208 176 186 196 204 185 208 214 206 232 187 228 2,4292003 216 179 194 198 200 197 206 199 199 216 194 234 2,4322004 228 180 220 213 184 215 207 215 224 204 210 222 2,5202005 208 194 220 208 207 219 203 234 219 209 224 236 2,580
1 Totals may not equal sum of parts due to rounding.

California Agricultural Resource Directory 2006 109
Livestock and Dairy
Average Live Weights of Hogs and Pigs Slaughtered Under Federal and State Inspections, 1996 – 2005
Year Jan. Feb. Mar. April May June July Aug. Sept. Oct. Nov. Dec. Annual Average
Pounds
1996 219 216 217 216 217 214 215 213 212 216 216 214 2151997 212 212 214 214 216 211 208 206 209 212 216 212 2121998 210 215 215 210 213 208 208 207 211 211 213 210 2111999 216 212 214 217 215 212 213 210 208 214 216 218 2142000 219 213 219 217 218 215 213 216 218 223 222 220 2182001 217 220 223 224 221 221 222 222 223 228 229 230 2242002 229 225 231 234 239 236 229 226 230 234 236 238 2322003 237 238 240 241 241 235 230 230 236 240 242 243 2382004 241 244 249 246 246 243 239 237 238 243 249 246 2432005 243 241 246 243 241 239 234 232 236 242 244 242 240
Sheep and Lambs by Class as of January 1, 1997– 2006
Year All Sheep Sheep and Lambs On Feed for Market
–––––––––––––––––––––––––––– Stock Sheep –––––––––––––––––––––––––––––
Ewes 1 Yr.+ Replacement Lambs Wethers and Rams 1 Yr.+
Total
1,000 Head
1997 880 455 360 50 15 4251998 800 410 345 35 10 3901999 830 440 330 45 15 3902000 810 440 310 45 15 3702001 805 435 310 45 15 3702002 755 405 290 45 15 3502003 730 380 290 50 10 3502004 680 355 275 40 10 3252005 670 345 275 40 10 3252006 650 325 270 45 10 325
Sheep and Lambs Shorn, Wool Production and Value, 1996 – 2005
Year Sheep and Lambs Shorn
–––––––––––– Production –––––––––––– Value Per Unit Total Value
Per Animal Total
1,000 Head Pounds 1,000 Pounds $/Lb. $1,000
1996 580 7.6 4,380 0.67 2,9351997 470 8.1 3,800 0.79 3,0021998 490 7.6 3,700 0.61 2,2571999 480 7.7 3,700 0.35 1,2952000 510 7.4 3,750 0.29 1,0882001 480 7.3 3,500 0.35 1,2252002 510 7.1 3,600 0.45 1,6202003 500 7.0 3,500 0.79 2,7652004 480 7.1 3,400 0.82 2,7882005 500 7.0 3,500 0.70 2,450

110 California Agricultural Resource Directory 2006
Livestock and Dairy
Sheep and Lambs Inventory, Supply and Disposition, 1996 – 2005
Year Beginning Inventory
January 1 1
Lamb Crop Inshipments ––––– Marketings 2 ––––– Farm Slaughter Sheep and
Lambs
–––––– Deaths –––––– Ending Inventory
January 1 1Sheep Lambs Sheep Lambs
1,000 Head
1996 920 330 435 40 722 5 24 14 8801997 880 320 365 57 667 5 22 14 8001998 800 310 313 50 501 5 24 13 8301999 830 290 360 70 562 5 19 14 8102000 810 300 355 47 578 5 17 13 8052001 805 280 305 60 538 5 19 13 7552002 755 280 320 51 538 5 18 13 7302003 730 260 330 61 545 5 18 11 6802004 680 260 245 39 445 5 15 11 6702005 670 250 195 39 395 5 15 11 650
1 Totals include new crop lambs.2 Includes custom slaughter for use on farms where produced, but excludes inter-farm sales within the state.
Sheep and Lambs Average Prices Received, 1996–2005
Year Jan. Feb. Mar. April May June July Aug. Sept. Oct. Nov. Dec. Annual Average 1
$/Cwt.
SHEEP
1996 30.00 31.00 29.00 27.00 25.00 24.50 26.50 27.50 24.50 28.50 28.50 34.00 26.701997 35.00 37.00 37.00 37.00 30.00 33.00 32.00 36.00 30.00 34.00 35.00 37.00 33.801998 35.50 33.00 36.50 35.50 30.00 32.00 29.00 29.00 27.50 26.50 25.50 28.50 30.501999 28.50 30.00 33.00 31.50 29.00 24.50 26.00 29.50 28.00 27.00 27.00 33.50 28.702000 30.00 31.50 37.50 36.00 31.50 28.00 31.00 31.50 28.50 30.50 31.50 34.00 31.502001 40.50 38.00 39.50 31.50 31.00 26.50 29.50 31.50 28.50 26.50 24.00 31.50 30.202002 30.00 30.00 31.00 27.50 27.00 22.00 26.00 29.50 30.50 25.50 34.00 36.50 27.102003 37.00 37.50 32.00 32.00 30.00 29.00 28.00 29.50 32.50 36.00 40.50 42.50 31.302004 36.00 43.00 43.00 35.00 32.50 28.00 28.50 30.50 35.00 36.50 36.50 42.50 32.202005 46.50 45.00 43.00 40.50 48.00 40.00 37.00 40.00 35.00 36.50 42.00 48.00 41.00
LAMBS
1996 79.50 84.00 85.50 86.00 89.00 98.00 100.00 94.00 90.00 90.00 84.00 88.00 89.401997 92.00 98.00 99.00 97.00 94.00 91.00 87.00 90.00 89.00 86.50 84.50 85.00 91.601998 81.50 78.00 71.00 69.00 63.00 90.00 84.00 79.00 78.00 71.00 64.00 66.00 74.801999 68.00 68.50 66.00 68.00 83.00 81.00 75.50 80.00 77.50 73.00 74.00 77.00 74.802000 72.00 72.00 80.00 81.00 91.00 90.00 87.00 83.00 79.00 75.00 70.00 68.00 79.102001 69.00 78.00 80.00 78.00 76.50 72.00 68.00 60.00 56.00 51.50 50.00 57.00 67.302002 60.50 63.50 63.00 61.00 62.00 72.50 75.00 73.50 74.50 74.50 77.00 79.00 69.402003 82.00 86.00 90.50 90.00 91.00 92.00 85.00 83.00 88.50 89.00 87.50 87.00 88.002004 89.00 93.00 96.00 91.00 91.50 94.00 89.00 86.00 87.50 86.50 86.50 90.50 90.402005 100.00 101.00 103.00 99.00 103.00 104.00 101.00 96.00 97.50 93.50 93.50 89.50 98.90
1 Average weighted by amount sold each month.

California Agricultural Resource Directory 2006 111
Livestock and Dairy
Livestock Production and Income, 1996 – 2005
Year Production 1 Marketings 2 –––– Average Price ––––Per 100 Pounds
Value of Production
Cash Receipts 3,4
Value of Home Consumption
Gross Income
1,000 Pounds 1,000 Pounds Dollars Dollars $1,000 $1,000 $1,000 $1,000
ALL LIVESTOCK1996 1,872,910 2,588,462 – – 762,188 1,158,997 11,067 1,170,0641997 2,075,249 2,728,265 – – 988,026 1,385,084 12,803 1,397,8871998 1,973,218 2,320,992 – – 912,020 1,125,422 11,266 1,136,6881999 2,098,832 2,618,759 – – 923,619 1,309,130 11,798 1,320,9282000 2,046,485 2,521,311 – – 901,048 1,315,788 10,341 1,326,1292001 2,095,317 2,579,469 – – 1,001,269 1,433,448 10,371 1,443,8192002 1,946,475 2,471,910 – – 901,666 1,302,336 10,294 1,312,6302003 2,109,123 2,591,214 – – 1,214,171 1,652,374 13,056 1,665,4302004 2,106,527 2,444,366 – – 1,344,345 1,731,207 12,210 1,743,4172005 2,048,394 2,500,353 – – 1,285,597 1,832,129 13,232 1,845,361
CATTLE AND CALVES (Cattle) (Calves)1996 1,736,019 2,410,790 42.40 55.70 673,737 1,033,513 7,856 1,041,3691997 1,936,801 2,550,150 48.80 68.10 895,678 1,257,018 10,205 1,267,2231998 1,849,594 2,171,350 47.80 70.90 851,681 1,048,300 9,509 1,057,8091999 1,972,129 2,454,890 49.00 79.10 861,952 1,223,123 10,240 1,233,3632000 1,923,165 2,359,040 50.00 93.00 831,338 1,218,220 8,614 1,226,8342001 1,992,529 2,438,240 53.90 94.10 945,595 1,354,452 8,734 1,363,1862002 1,832,884 2,330,200 50.80 85.40 848,133 1,228,722 8,947 1,237,6692003 1,987,446 2,431,400 62.00 96.60 1,148,018 1,555,908 11,112 1,567,0202004 1,982,875 2,297,050 68.70 111.00 1,267,226 1,633,740 10,110 1,643,8502005 1,940,454 2,370,040 70.40 121.00 1,213,383 1,740,198 11,029 1,751,227
SHEEP AND LAMBS (Sheep) (Lambs)1996 59,076 97,247 26.70 89.40 48,011 83,589 975 84,5641997 56,292 93,750 33.80 91.60 47,840 81,505 954 82,4591998 48,291 70,777 30.50 74.80 34,863 49,989 798 50,7871999 48,438 81,924 28.70 74.80 34,313 56,953 783 57,7362000 50,705 82,346 31.50 79.10 37,912 62,005 813 62,8182001 50,049 82,129 30.20 67.30 32,101 52,143 712 52,8552002 48,524 79,240 27.10 69.40 31,843 51,968 710 52,6782003 49,707 83,779 31.30 88.00 40,848 68,861 934 69,7952004 45,285 67,326 32.20 90.40 38,504 57,612 968 58,5802005 41,554 60,163 41.00 98.90 38,701 56,135 1,058 57,193
HOGS AND PIGS (Hogs and Pigs)1996 77,815 80,425 52.00 – 40,440 41,895 2,236 44,1311997 82,156 84,365 54.70 – 44,508 46,561 1,644 48,2051998 75,333 78,865 34.00 – 25,476 27,133 959 28,0921999 78,265 81,945 35.10 – 27,354 29,054 775 29,8292000 72,615 79,925 44.10 – 31,798 35,563 914 36,4772001 52,739 59,100 44.90 – 23,573 26,853 925 27,7782002 65,067 62,470 34.20 – 21,690 21,646 637 22,2832003 71,970 76,035 35.70 – 25,305 27,605 1,010 28,6152004 78,367 79,990 49.50 – 38,615 39,855 1,132 40,9872005 66,386 70,150 50.70 – 33,513 35,796 1,145 36,941
1 Live weight; adjustments made for changes in inventory and for in-shipments. 2 Live weight; excludes custom slaughter for use on farms where produced and inter-farm sales within the state.3 Receipts from marketing and sale of farm slaughter.4 Hogs and pigs receipts for 1996 include allowance for higher average price of state in-shipments and out-shipments of feeder pigs.

112 California Agricultural Resource Directory 2006
Livestock and Dairy
Livestock Inventory by Class and County, January 1, 2005 – 2006
County ––––––––––––––––––––– 2005 ––––––––––––––––––––– ––––––––––––––––––––– 2006 –––––––––––––––––––––
All Cattle Beef Cows Milk Cows All Cattle Beef Cows Milk Cows
Del Norte 11,000 1,000 3,000 12,000 1,000 3,300
Humboldt 62,000 20,000 16,100 55,000 20,000 16,200
Mendocino 21,000 10,000 – 18,000 10,000 –
District 10 Total 94,000 31,000 19,100 85,000 31,000 19,500
Shasta 32,000 16,000 – 36,000 18,000 –
Siskiyou 64,000 33,000 1,600 60,000 33,000 1,400
Trinity 5,000 3,000 – 4,000 3,000 –
District 20 Total 101,000 52,000 1,600 100,000 54,000 1,400
Lassen 49,000 27,000 – 44,000 25,000 –
Modoc 73,000 44,000 – 67,000 46,000 –
Plumas 14,000 6,000 – 14,000 6,000 –
District 30 Total 136,000 77,000 – 125,000 77,000 –
Alameda 19,000 9,000 – 16,000 8,000 –
Contra Costa 18,000 7,000 – 16,000 7,000 –
Lake 8,000 5,000 – 7,000 4,000 –
Marin 34,000 10,000 10,300 32,000 9,000 10,200
Monterey 72,000 24,000 1,600 67,000 24,000 1,400
Napa 8,000 4,000 – 7,000 4,000 –
San Benito 40,000 15,000 900 38,000 18,000 900
San Francisco – – – – – –
San Luis Obispo 80,000 35,000 – 77,000 36,000 –
San Mateo 3,000 1,000 – 3,000 1,000 –
Santa Clara 23,000 11,000 – 21,000 11,000 –
Santa Cruz 3,000 1,000 – 3,000 1,000 –
Sonoma 80,000 13,000 30,500 73,000 12,000 29,600
District 40 Total 388,000 135,000 43,300 360,000 135,000 42,100
Butte 22,000 9,000 700 18,000 8,000 500
Colusa 20,000 11,000 – 15,000 10,000 –
Glenn 67,000 18,000 18,400 60,000 16,000 17,900
Sacramento 69,000 17,000 17,800 61,000 15,000 17,400
Solano 51,000 17,000 4,100 46,000 16,000 4,100
Sutter 11,000 5,000 – 10,000 6,000 –
Tehama 70,000 28,000 4,500 61,000 27,000 5,500
Yolo 20,000 8,000 2,000 18,000 7,000 2,000
Yuba 38,000 7,000 3,300 31,000 8,000 3,400
District 50 Total 368,000 120,000 50,800 320,000 113,000 50,800
Fresno 413,000 22,000 96,000 490,000 20,000 113,000
Kern 300,000 34,000 121,000 310,000 32,000 139,000
Kings 282,000 5,000 163,000 285,000 8,000 156,000
Madera 156,000 14,000 64,000 160,000 14,000 68,000
Merced 480,000 27,000 238,000 500,000 24,000 241,000
San Joaquin 220,000 18,000 104,000 245,000 16,000 106,000
Stanislaus 430,000 39,000 178,000 445,000 38,000 185,000
Tulare 919,000 29,000 443,000 970,000 24,000 454,000
District 51 Total 3,200,000 188,000 1,407,000 3,405,000 176,000 1,462,000

California Agricultural Resource Directory 2006 113
Livestock and Dairy
Livestock Inventory by Class and County, January 1, 2005 – 2006
County ––––––––––––––––––––– 2005 ––––––––––––––––––––– ––––––––––––––––––––– 2006 –––––––––––––––––––––
All Cattle Beef Cows Milk Cows All Cattle Beef Cows Milk Cows
Alpine 2,000 2,000 – 2,000 2,000 –
Amador 19,000 11,000 – 19,000 10,000 –
Calaveras 27,000 13,000 – 21,000 12,000 –
El Dorado 8,000 4,000 – 8,000 4,000 –
Inyo 18,000 10,000 – 16,000 10,000 –
Mariposa 21,000 11,000 – 22,000 12,000 –
Mono 6,000 3,000 – 6,000 4,000 –
Nevada 5,000 3,000 – 5,000 3,000 –
Placer 20,000 9,000 – 16,000 8,000 –
Sierra 6,000 3,000 – 7,000 3,000 –
Tuolumne 14,000 8,000 – 13,000 9,000 –
District 60 Total 146,000 77,000 – 135,000 77,000 –
Imperial 448,000 1,000 4,500 504,000 1,000 5,200
Los Angeles 5,000 1,000 – 5,000 1,000 –
Orange 1,000 700 – 1,000 1,000 –
Riverside 169,000 4,300 68,000 146,000 4,000 60,700
San Bernardino 262,000 3,000 132,000 245,000 3,000 115,500
San Diego 27,000 6,000 5,400 24,000 5,000 4,400
Santa Barbara 45,000 20,000 – 38,000 18,000 –
Ventura 10,000 4,000 – 7,000 4,000 –
District 80 Total 967,000 40,000 209,900 970,000 37,000 185,800
Other Districts 1 – – 8,300 – – 8,400
STATE 5,400,000 720,000 1,740,000 5,500,000 700,000 1,770,000
Livestock Inventory by Class and County, January 1, 2005 – 2006 continued
1 Includes counties from one or more districts to avoid disclosure of individual operations.

114 California Agricultural Resource Directory 2006
Notable Increases in Production:Cucumbers ..........................................................15%Peppers, Chili .......................................................7%Pumpkins ............................................................14%Spinach, Fresh Market .......................................Spinach, Fresh Market .......................................Spinach, Fresh Market 15%
Signifi cant Decreases in Production:Cabbage, Fresh Market ......................................Cabbage, Fresh Market ......................................Cabbage, Fresh Market 17%Melons, All ..........................................................17%Tomatoes, All ......................................................26%Tomatoes, Processing .........................................Tomatoes, Processing .........................................Tomatoes, Processing 18%
At the beginning of January, wet conditions slowed activity in many vegetable fi elds. Where conditions permitted, vegetable planting proceeded. March brought warmer temperatures, which stimulated vigorous growth in many vegetable fi elds. April’s cool temperatures slowed vegetable development, and wet fi elds hindered fi eld activities. Spring vegetable plantings were two weeks late in some locations due to the persistent rain. The beginning of summer brought cool temperatures, slowing vegetable development statewide. As the summer continued, however, above normal temperatures reduced production and damaged some vegetables. Growers took advantage of the mild, warm weather later in August and began preparation for planting some crops while continuing to harvest others. October began with normal weather patterns, which were encouraging to the vegetable growers. The end of the year brought moderate weather that favored growth and development of vegetable seedlings.
California continued to be the leading fresh market state, accounting for 40.8 percent of the harvested area, 62.8 percent of the production, and 55.8 percent of the value. The total value of California’s 2005 fresh and processing vegetable and melon production was $6.18 billion, down from last year’s revised total of $6.86 billion. All lettuce is still the leading vegetable crop in value of production at $1.47 billion followed by tomatoes at $942 million. Carrots, garlic, head lettuce, leaf lettuce and summer storage onions were among the crops showing increased values of production. Artichokes, asparagus, broccoli, caulifl ower and celery were among the crops experiencing declines in value. According to the USDA Economic Research Service, per capita use of fresh vegetables and melons in the United States decreased slightly to 174 pounds in 2005. Consumption increased for asparagus, sweet corn, all melons, leaf and romaine lettuce, and all tomatoes. Declined use was seen for snap beans, broccoli, cabbage, carrots, cucumbers, head lettuce, onions, green peas and all potatoes. Per capita consumption of U.S. processing vegetables increased 2 percent to 124 pounds. Consumption of freezing vegetables decreased 1 percent to 20.7 pounds, but use of canning vegetables increased 3 percent to 103.3 pounds.
Vegetableand Melon Crops
phot
o by
Ed
Will
iam
s/Ke
rn C
o.

California Agricultural Resource Directory 2006 115
Vegetable and Melon Crops
Vegetable and Melon Acreage, Production and Value, 1996 – 2005
Crop Crop Year Harvested Yield Per Acre Production Value Per Unit 1 Total ValueAcres Cwt. Cwt. $/Cwt. $1,000
ARTICHOKES 1996 8,900 100 890,000 73.50 65,4161997 9,300 100 930,000 79.50 73,9101998 9,700 90 873,000 70.60 61,6331999 9,800 115 1,125,000 67.00 75,3952000 8,800 115 1,012,000 60.30 61,0212001 8,000 125 1,000,000 58.60 58,5592002 8,200 115 943,000 71.50 67,4252003 7,200 140 1,008,000 75.10 75,7012004 7,500 110 825,000 88.10 72,6832005 7,300 115 840,000 45.10 37,884
ASPARAGUS 1996 29,000 26 754,000 85.80 64,6911997 30,100 27 813,000 115.00 93,2241998 32,200 26 837,000 138.00 115,2701999 33,800 33 1,115,000 142.00 158,3302000 37,000 32 1,184,000 122.00 144,4482001 35,000 30 1,050,000 156.00 163,8002002 34,000 30 1,020,000 114.00 116,2802003 27,000 34 918,000 122.00 111,9962004 34,000 35 1,190,000 141.00 167,7902005 29,000 36 1,044,000 114.00 119,016
BEANS, FRESH MARKET SNAP 1996 7,800 90 702,000 47.80 33,5661997 4,500 100 450,000 52.00 23,4001998 4,700 95 447,000 67.80 30,3071999 5,100 95 485,000 58.90 28,5672000 5,500 100 550,000 56.00 30,8002001 5,400 80 432,000 64.40 27,8212002 6,500 100 650,000 62.60 40,6902003 5,800 100 580,000 55.70 32,3062004 6,800 100 680,000 66.80 45,4242005 6,500 100 650,000 63.60 41,340
BROCCOLI 1996 122,000 120 14,640,000 26.60 388,7531997 119,000 130 15,470,000 27.90 431,3011998 121,000 130 15,730,000 28.90 454,3831999 130,000 140 18,200,000 23.80 432,9732000 133,000 140 18,620,000 30.90 575,3492001 122,000 140 17,080,000 25.70 439,3872002 118,500 140 16,590,000 29.30 486,1922003 120,000 150 18,000,000 32.00 575,2242004 122,000 150 18,300,000 32.10 587,1172005 122,000 150 18,300,000 28.10 513,758
BRUSSELS SPROUTS 2 1996 3,800 180 684,000 29.40 20,1201997 3,200 160 512,000 41.40 21,1801998 3,200 160 512,000 41.00 20,9851999 3,200 180 576,000 37.20 21,4192000 2,600 180 468,000 34.40 16,1152001 2,200 180 396,000 36.50 14,471
CABBAGE, FRESH MARKET 1996 10,000 350 3,500,000 12.60 44,1001997 13,800 340 4,692,000 14.90 69,9111998 14,000 330 4,620,000 16.50 76,2301999 12,500 320 4,000,000 13.40 53,6002000 11,900 370 4,403,000 13.10 57,6792001 10,900 380 4,142,000 13.80 57,1602002 11,600 400 4,640,000 14.00 64,9602003 13,500 390 5,265,000 16.00 84,2402004 13,600 410 5,576,000 18.00 100,3682005 13,300 350 4,655,000 15.10 70,291

116 California Agricultural Resource Directory 2006
Vegetable and Melon Crops
Vegetable and Melon Acreage, Production and Value, 1995–2004 continuedVegetable and Melon Acreage, Production and Value, 1996 – 2005
Crop Crop Year Harvested Yield Per Acre Production Value Per Unit 1 Total ValueAcres Cwt. Cwt. $/Cwt. $1,000
CARROTS, FRESH MARKET 1996 85,700 300 25,710,000 13.60 349,6561997 83,200 360 29,998,000 13.00 389,9741998 69,000 285 19,665,000 11.40 224,1811999 70,000 285 19,950,000 17.20 343,1402000 69,000 285 19,665,000 13.30 261,5452001 69,000 290 20,010,000 18.10 362,1812002 69,000 290 20,010,000 20.30 406,2032003 68,000 300 20,400,000 20.40 416,1602004 66,500 305 20,283,000 21.50 436,0852005 67,000 305 20,435,000 21.70 443,440
CARROTS, PROCESSING 1996 4,300 670 2,880,200 3.02 8,6981997 2,700 641 1,730,000 3.28 5,6661998 4,500 628 2,826,000 3.35 9,4531999 4,400 623 2,739,000 3.61 9,8772000 4,900 600 2,940,000 4.07 11,9662001 3,300 586 1,934,000 4.52 8,7502002 2,100 574 1,205,000 5.40 6,5092003 3,500 646 2,261,000 5.00 11,3052004 4,300 640 2,752,000 5.55 15,2742005 4,100 700 2,870,000 4.10 11,767
CAULIFLOWER 1996 41,500 152 6,310,000 32.30 203,4991997 37,500 154 5,790,000 31.40 181,8291998 39,000 150 5,850,000 31.20 182,6501999 41,000 155 6,355,000 27.30 173,7252000 38,000 160 6,080,000 30.30 184,3122001 36,500 155 5,658,000 28.00 158,5452002 35,500 150 5,325,000 29.40 156,6492003 34,000 160 5,440,000 35.30 192,2102004 32,000 175 5,600,000 29.60 166,0092005 31,900 170 5,396,000 28.60 154,377
CELERY 1996 24,500 700 17,150,000 10.60 181,6061997 24,000 695 16,680,000 14.80 247,3711998 24,500 680 16,666,000 11.60 193,2561999 25,000 700 17,500,000 12.00 209,9402000 24,000 720 17,280,000 18.80 324,8502001 25,500 695 17,723,000 14.40 255,8412002 25,000 710 17,750,000 12.70 225,4052003 25,300 715 18,090,000 13.30 241,3242004 25,700 710 18,247,000 15.00 273,5762005 25,400 710 18,034,000 14.20 256,141
CORN, FRESH MARKET SWEET 1996 24,100 155 3,736,000 17.60 65,7541997 27,000 145 3,915,000 17.20 67,3381998 32,000 175 5,600,000 15.80 88,4801999 26,000 165 4,290,000 16.10 69,0692000 24,000 165 3,960,000 18.70 74,0522001 22,000 170 3,740,000 22.30 83,4022002 26,000 175 4,550,000 19.40 88,2702003 28,500 190 5,415,000 21.80 118,0472004 24,500 190 4,655,000 29.50 137,3232005 25,300 195 4,934,000 22.10 109,041
CUCUMBERS, FRESH MARKET 1996 6,000 330 1,980,000 28.20 55,8361997 6,300 315 1,985,000 24.70 49,0301998 6,000 320 1,920,000 30.90 59,3281999 6,500 310 2,015,000 26.80 54,0022000 4,500 285 1,283,000 28.50 36,5662001 4,700 240 1,128,000 30.00 33,8402002 4,300 240 1,032,000 27.80 28,6902003 4,000 200 800,000 33.30 26,6402004 4,400 245 1,078,000 41.80 45,0602005 4,600 270 1,242,000 23.90 29,684
Vegetable and Melon Acreage, Production and Value, 1996 – 2005 continued

California Agricultural Resource Directory 2006 117
Vegetable and Melon Crops
Vegetable and Melon Acreage, Production and Value, 1995–2004 continuedVegetable and Melon Acreage, Production and Value, 1996 – 2005
Crop Crop Year Harvested Yield Per Acre Production Value Per Unit 1 Total ValueAcres Cwt. Cwt. $/Cwt. $1,000
EGGPLANT 3 2000 1,600 205 328,000 27.50 9,0202001 1,400 235 329,000 24.50 8,061
ESCAROLE AND ENDIVE 3 2000 2,400 160 384,000 36.70 14,0932001 2,400 150 360,000 35.50 12,780
GARLIC 1996 35,000 175 6,125,000 32.10 196,3331997 33,000 170 5,610,000 47.90 268,7761998 38,000 145 5,510,000 37.70 207,5111999 40,000 185 7,400,000 29.60 218,9472000 29,000 165 4,785,000 29.40 140,4472001 30,000 170 5,100,000 31.50 160,4202002 27,000 175 4,725,000 29.60 140,0562003 29,000 185 5,365,000 27.20 146,0382004 26,000 180 4,680,000 27.70 129,6582005 24,500 165 4,000,000 44.10 176,325
GREENS, COLLARD 3 2000 700 190 133,000 36.00 4,7882001 700 170 119,000 38.80 4,617
GREENS, KALE 3 2000 2,000 215 430,000 33.20 14,2762001 1,800 190 342,000 28.70 9,815
GREENS, MUSTARD 3 2000 3,200 170 544,000 36.80 20,0192001 3,400 140 476,000 36.90 17,564
LETTUCE, HEAD 1996 150,500 290 43,645,000 15.40 672,1331997 141,000 350 49,350,000 19.40 957,3901998 135,000 315 42,525,000 16.30 693,1581999 140,000 380 53,200,000 13.70 728,8402000 130,000 390 50,700,000 18.80 953,1602001 128,000 380 48,640,000 18.50 899,8402002 130,000 380 49,400,000 14.90 736,0602003 132,000 375 49,500,000 21.00 1,039,5002004 131,000 370 48,470,000 15.10 731,8972005 131,000 360 47,160,000 15.90 749,844
LETTUCE, LEAF 1996 36,000 210 7,560,000 25.10 189,7561997 42,000 205 8,660,000 28.30 245,3851998 38,000 215 8,170,000 30.50 249,1851999 41,000 220 9,020,000 23.80 214,6762000 43,000 235 10,105,000 29.60 299,1082001 44,000 215 9,460,000 24.90 235,5542002 46,000 240 11,040,000 27.70 305,8082003 49,000 230 11,270,000 31.80 358,3862004 54,000 235 12,690,000 28.30 359,1272005 55,000 240 13,200,000 31.60 417,120
LETTUCE, ROMAINE 1996 23,500 275 6,463,000 18.60 120,2121997 25,000 280 7,000,000 19.20 134,4001998 25,000 280 7,000,000 21.60 151,2001999 30,000 315 9,450,000 18.00 170,1002000 35,000 315 11,025,000 20.10 221,6032001 39,000 280 10,920,000 17.50 191,1002002 45,000 315 14,175,000 19.50 276,4132003 60,000 300 18,000,000 29.70 534,6002004 58,000 300 17,400,000 19.30 335,8202005 63,000 275 17,325,000 17.50 303,188
Vegetable and Melon Acreage, Production and Value, 1996 – 2005 continued

118 California Agricultural Resource Directory 2006
Vegetable and Melon Crops
Vegetable and Melon Acreage, Production and Value, 1995–2004 continuedVegetable and Melon Acreage, Production and Value, 1996 – 2005
Crop Crop Year Harvested Yield Per Acre Production Value Per Unit 1 Total ValueAcres Cwt. Cwt. $/Cwt. $1,000
MELONS, CANTALOUPE 1996 59,000 220 12,980,000 17.90 232,3421997 62,300 210 13,083,000 17.70 231,5691998 58,000 220 12,760,000 17.10 218,1961999 61,000 210 12,810,000 17.30 221,6132000 57,500 230 13,225,000 17.10 226,1482001 54,500 245 13,353,000 18.90 252,3722002 52,000 250 13,000,000 16.70 217,1002003 49,000 245 12,005,000 15.40 184,8772004 48,000 275 13,200,000 13.80 182,1602005 51,000 260 13,260,000 10.00 132,600
MELONS, HONEYDEW 1996 20,300 170 3,451,000 16.50 56,9421997 20,500 180 3,690,000 18.50 68,2651998 19,000 190 3,610,000 19.30 69,6731999 20,500 180 3,690,000 21.10 77,8592000 20,000 185 3,700,000 18.60 68,8202001 20,000 185 3,700,000 19.70 72,8902002 20,400 185 3,774,000 16.80 63,4032003 18,500 200 3,700,000 17.50 64,7502004 17,900 220 3,938,000 17.70 69,7032005 17,900 190 3,401,000 13.00 44,213
MELONS, WATERMELON 1996 17,100 440 7,524,000 10.50 79,0021997 17,000 460 7,820,000 10.90 85,2831998 15,000 450 6,750,000 12.30 83,0251999 14,700 430 6,321,000 9.80 61,9462000 12,300 535 6,581,000 11.70 76,9982001 11,800 530 6,254,000 10.90 68,1692002 11,500 510 5,865,000 12.70 74,4862003 11,700 480 5,616,000 12.10 67,9542004 13,500 490 6,615,000 10.60 70,1192005 13,000 490 6,370,000 6.40 40,768
MUSHROOMS, AGARICUS 95-96 503 2,682 1,349,000 104.00 140,79696-97 514 2,549 1,310,000 109.00 142,64297-98 529 2,461 1,302,000 119.00 155,55498-99 563 2,377 1,338,000 119.00 158,63899-00 548 2,412 1,322,000 122.00 161,61200-01 526 2,456 1,292,000 126.00 162,98801-02 524 2,460 1,289,000 134.00 172,16802-03 520 2,456 1,277,000 133.00 170,23403-04 490 2,520 1,235,000 140.00 172,94304-05 471 2,518 1,186,000 145.00 172,465
ONIONS, SPRING 1996 9,600 385 3,696,000 9.80 36,2211997 9,600 450 4,320,000 14.30 61,7761998 9,100 445 4,050,000 14.10 57,1051999 7,300 440 3,212,000 11.90 38,2232000 6,800 435 2,958,000 10.60 31,3352001 6,200 430 2,666,000 13.50 35,9912002 5,700 475 2,708,000 14.20 38,4542003 7,500 490 3,675,000 22.90 84,1582004 7,100 505 3,586,000 15.10 54,1492005 7,300 475 3,468,000 12.40 43,003
ONIONS, SUMMER STORAGE 4 1996 33,500 430 14,405,000 7.70 108,8601997 31,300 440 13,772,000 7.80 105,8291998 37,700 415 15,646,000 9.71 149,4391999 39,000 435 16,965,000 7.53 125,9362000 34,000 445 15,130,000 7.98 118,6842001 29,800 405 12,069,000 7.26 85,7482002 28,200 410 11,562,000 7.27 82,2382003 35,000 420 14,700,000 7.54 108,9042004 30,000 440 13,200,000 7.46 96,6202005 27,800 425 11,815,000 8.55 101,018
Vegetable and Melon Acreage, Production and Value, 1996 – 2005 continued

California Agricultural Resource Directory 2006 119
Vegetable and Melon Crops
Vegetable and Melon Acreage, Production and Value, 1995–2004 continuedVegetable and Melon Acreage, Production and Value, 1996 – 2005
Crop Crop Year Harvested Yield Per Acre Production Value Per Unit 1 Total ValueAcres Cwt. Cwt. $/Cwt. $1,000
ONIONS, SUMMER NON-STORAGE 5 2000 6,200 395 2,449,000 12.00 29,3882001 7,000 450 3,150,000 13.50 42,5252002 6,600 480 3,168,000 12.90 40,8672003 7,500 530 3,975,000 13.70 54,4582004 8,400 560 4,704,000 13.20 62,0932005 8,700 550 4,785,000 10.70 51,200
ONIONS, PROCESSING 6 1998 – – 9,327,000 6.55 61,0921999 – – 12,550,000 6.55 82,2032000 – – 10,580,000 6.30 66,6542001 – – 9,125,000 5.50 50,1882002 – – 8,602,000 5.30 45,5912003 – – 10,800,000 5.18 55,9442004 – – 9,090,000 5.13 46,6322005 – – 7,900,000 7.14 56,406
PEPPERS, BELL 1996 25,500 300 7,650,000 22.70 173,5061997 21,000 300 6,300,000 24.60 155,0401998 22,000 285 6,270,000 27.20 170,3741999 22,500 330 7,425,000 29.80 220,9972000 21,000 300 6,300,000 27.30 171,7882001 22,000 325 7,150,000 25.50 182,3432002 19,000 370 7,030,000 28.50 200,6182003 18,500 390 7,215,000 28.60 206,6062004 19,000 400 7,600,000 34.20 259,6082005 23,000 300 6,900,000 26.90 185,948
PEPPERS, CHILI 7 2000 4,800 230 1,104,000 35.60 39,2702001 4,400 225 990,000 36.80 36,4032002 4,700 230 1,081,000 38.40 41,4632003 4,800 230 1,104,000 33.50 36,9992004 5,300 245 1,299,000 33.70 43,7422005 5,900 235 1,387,000 28.10 38,942
PUMPKINS 5 2000 5,900 305 1,800,000 10.60 19,0802001 6,100 240 1,464,000 11.20 16,3972002 5,500 280 1,540,000 11.50 17,7102003 4,900 250 1,225,000 12.40 15,1902004 5,200 270 1,404,000 15.30 21,4812005 5,500 290 1,595,000 9.00 14,355
RADISHES 3 2000 1,500 250 375,000 26.00 9,7502001 1,600 230 368,000 24.50 9,016
SPINACH, FRESH MARKET 1996 9,000 150 1,350,000 30.90 41,7151997 15,200 175 2,660,000 31.20 82,9921998 15,000 160 2,400,000 35.40 84,9601999 17,000 150 2,550,000 31.40 80,0702000 17,000 180 3,060,000 30.70 93,9422001 15,000 155 2,325,000 32.60 75,7952002 21,000 155 3,255,000 34.60 112,6232003 26,000 160 4,160,000 40.70 169,3122004 27,000 170 4,590,000 40.90 187,7312005 31,000 170 5,270,000 20.20 106,454
SPINACH, PROCESSING 8 2002 7,300 204 1,489,000 595.00 8,8612003 10,600 159 1,688,000 549.00 9,2722004 7,800 224 1,747,000 590.00 10,3082005 6,000 258 1,546,000 540.00 8,318
Vegetable and Melon Acreage, Production and Value, 1996 – 2005 continued

120 California Agricultural Resource Directory 2006
Vegetable and Melon Crops
Vegetable and Melon Acreage, Production and Value, 1995–2004 continuedVegetable and Melon Acreage, Production and Value, 1996 – 2005
Crop Crop Year Harvested Yield Per Acre Production Value Per Unit 1 Total ValueAcres Cwt. Cwt. $/Cwt. $1,000
SQUASH 5 2000 8,300 180 1,494,000 20.00 29,9512001 8,000 190 1,520,000 18.50 28,0602002 7,900 190 1,501,000 20.90 31,3842003 7,500 195 1,463,000 22.70 33,2412004 7,500 210 1,575,000 29.20 45,9732005 7,500 220 1,639,000 19.20 31,513
TOMATOES, FRESH MARKET 1996 37,400 280 10,472,000 24.80 259,7061997 34,000 285 9,860,000 26.50 261,6301998 43,000 240 10,320,000 33.10 341,5921999 47,000 260 12,220,000 22.30 272,5062000 44,000 290 12,760,000 29.80 380,2482001 42,000 270 11,340,000 24.90 282,3662002 40,000 315 12,600,000 25.30 318,7802003 34,000 300 10,200,000 35.90 366,1802004 42,000 310 13,020,000 39.20 510,3842005 42,600 280 11,928,000 31.00 369,768
MISCELLANEOUS VEGETABLES 1996 252,000 – 88,363,000 – 979,673AND MELONS, FRESH MARKET 1997 177,000 – 62,697,000 – 816,125AND PROCESSING 9 1998 229,000 – 74,867,000 – 957,122
1999 228,000 – 85,107,000 – 951,5202000 194,000 – 73,063,000 – 920,2152001 212,000 – 74,688,000 – 960,7802002 330,000 – 121,694,000 – 1,406,1132003 190,000 – 62,952,000 – 889,2412004 172,000 – 64,897,000 – 817,2902005 195,000 – 68,886,000 – 852,913
1 The processed price is based on equivalent returns at the processing plant door. The fresh market price is at the point of fi rst sale.2 Estimates discontinued in 2002.3 Estimates began in 2000 and discontinued in 2002.4 Includes fresh and processed. Production includes quantity harvested, but not marketed because of loss during storage (shrinkage): 1995 – 266,000 cwt.; 1996 – 292,000 cwt.; 1997 -- 278,000 cwt.; 1998 to 2005 – 250,000 cwt. Storage loss amounts are excluded when computing total value. Includes some quantities not marketed and excluded in computing value.5 Estimates began in 2000.6 Estimates began in 1998. Included in summer storage onions.7 Estimates began in 1929, but were reinitiated in 2000 after being discontinued for nine years.8 Estimates began in 2002.9 Miscellaneous vegetables and melons include: Green lima beans for processing, oriental vegetables, green peas, etc. The crops added in 2000 and discontinued in 2002 are excluded from the 2000 and 2001 miscellaneous totals.
Vegetable and Melon Acreage, Production and Value, 1996 – 2005 continued

California Agricultural Resource Directory 2006 121
Vegetable and Melon Crops
Processing Vegetable Acreage, Production and Value, 1996–2005
Crop Crop Year Harvested Yield Per Acre Production –––––––– Value Per Unit ––––––– Total Value
First Delivery Point
Processing Plant Door
Acres Tons Tons $/Ton $/Ton $1,000
TOMATOES, PROCESSING 1996 313,000 34.05 10,658,741 53.50 61.10 651,2491997 260,000 35.93 9,342,309 50.85 59.50 555,8671998 280,000 31.76 8,892,800 54.65 64.20 570,9181999 329,000 37.20 12,239,300 59.85 70.50 862,8712000 271,000 37.96 10,286,500 50.75 58.60 602,7892001 254,000 34.02 8,640,140 49.40 57.50 496,8082002 291,000 37.99 11,056,000 50.30 56.80 627,9812003 274,000 33.77 9,252,000 50.20 57.20 529,2142004 281,000 41.54 11,672,000 50.20 57.40 669,9732005 264,000 36.36 9,600,000 51.30 59.60 572,160
CUCUMBERS, PICKLES 1 1996 6,200 7.00 43,400 – 370.00 16,0581997 4,200 7.19 30,200 – 296.00 8,9391998 4,500 6.56 29,520 – 235.00 6,937
1 Data for 1999-2005 not published to avoid disclosure of individual operations.
Processing Tomatoes by County, 2005
County –––––––––––––––––––––––––––––––––– Contracted and Open Market ––––––––––––––––––––––––––––––––
Area Planted Area Harvested Yield Per Acre Production 1
Acres Acres Tons Tons
Colusa 20,100 19,900 34.78 692,200Fresno 97,000 96,800 38.85 3,760,300Kings 22,600 21,300 40.61 865,000Madera 1,700 1,700 31.82 54,100Merced 14,500 14,200 29.02 412,100Sacramento 2,300 2,300 31.52 72,500San Joaquin 32,400 32,400 35.23 1,141,400Solano 10,500 10,300 32.37 333,400Stanislaus 11,000 10,600 35.17 372,800Sutter 5,300 5,200 35.54 184,800Yolo 37,500 37,200 34.19 1,272,000Other Counties 2 12,100 12,100 36.31 439,400
State Total 267,000 264,000 36.36 9,600,000
1 On the basis of paid-for-tonnage purchased from growers as reported by processors, dockage was not included.2 Counties combined to avoid disclosure of individual operations include Contra Costa, Glenn, Kern, San Benito, Santa Barbara and Tulare.

122 California Agricultural Resource Directory 2006
Vegetable and Melon Crops
Vegetable and Melon Monthly Average Prices Received, 1996 – 2005 1
Crop Crop Year
Jan. Feb. Mar. April May June July Aug. Sept. Oct. Nov. Dec.$/Cwt.
ASPARAGUS 1996 84.50 84.50 87.90 85.30 85.70 81.10 80.00 – – – – –1997 161.00 140.00 116.00 109.00 92.40 154.00 – – – – – –1998 179.00 158.00 144.00 134.00 123.00 164.00 234.00 211.00 199.00 152.00 148.00 –1999 141.00 119.00 178.00 128.00 123.00 158.00 214.00 – – – – –2000 147.00 99.70 98.60 139.00 134.00 172.00 206.00 205.00 – – – –2001 219.00 256.00 147.00 150.00 133.00 177.00 176.00 145.00 – 137.00 129.00 –2002 218.00 162.00 119.00 99.80 119.00 129.00 146.00 – – – – –2003 98.90 96.30 104.00 144.00 118.00 147.00 189.00 132.00 166.00 145.00 128.00 –2004 – 271.00 121.00 142.00 140.00 145.00 231.00 218.00 204.00 201.00 – –2005 – – 95.90 128.00 101.00 134.00 155.00 162.00 175.00 175.00 – –
BEANS, FRESH 2003 – – – 116.00 70.90 61.40 36.40 50.70 46.80 65.40 62.50 61.20MARKET SNAP 2 2004 – – – 66.90 49.10 40.30 46.50 63.50 65.30 102.00 85.90 44.60
2005 – – – 103.00 84.10 56.40 52.90 70.50 73.40 51.50 78.70 67.80
BROCCOLI 1996 34.60 22.00 30.90 25.20 28.20 30.60 24.10 24.10 23.90 24.30 37.90 40.001997 36.80 27.80 25.90 24.20 23.10 30.30 27.50 23.30 31.20 40.70 27.00 30.201998 33.80 26.80 30.70 40.70 27.10 29.60 23.30 27.60 29.20 32.80 25.90 24.001999 27.70 20.10 21.70 20.30 18.60 23.10 18.70 27.40 29.30 23.00 21.70 39.502000 22.50 20.30 25.90 23.30 44.30 30.00 31.50 25.20 27.70 34.10 56.00 34.402001 22.80 32.30 23.80 27.00 25.50 27.00 23.60 27.10 22.90 24.20 21.60 55.102002 53.40 44.90 33.80 24.00 20.80 28.40 27.00 29.60 40.60 24.00 32.20 25.202003 25.10 29.20 27.90 27.10 29.70 24.60 27.00 29.80 49.10 38.90 42.80 52.202004 33.40 28.30 21.30 24.00 27.20 28.70 24.20 29.70 57.00 43.90 44.20 37.902005 22.20 33.30 42.50 39.70 22.40 39.70 22.40 30.50 27.70 22.40 20.90 22.00
CARROTS 1996 12.50 13.70 15.90 15.70 11.60 11.00 10.40 14.10 12.50 12.50 13.80 14.001997 14.90 14.60 13.30 12.50 12.50 12.60 12.50 12.50 12.50 12.50 12.30 16.901998 12.50 12.70 12.70 12.00 11.40 11.50 10.60 10.40 10.20 10.60 11.30 11.001999 16.10 19.60 21.20 26.30 24.80 21.80 15.50 12.40 10.40 11.10 11.20 11.402000 9.49 11.60 11.80 12.30 13.40 14.60 15.40 14.20 14.30 14.80 15.30 15.602001 15.90 16.70 17.30 17.30 17.30 18.60 20.70 19.10 16.70 19.30 19.30 19.302002 19.30 19.70 21.10 21.20 21.20 21.50 20.50 20.20 20.20 19.90 19.60 19.502003 19.30 19.10 18.70 19.40 19.90 19.90 19.90 20.80 22.00 21.50 22.90 24.302004 24.50 24.90 24.60 24.20 24.90 22.50 20.20 18.50 18.00 17.90 18.10 17.002005 20.30 21.00 21.00 21.10 21.20 21.30 21.80 22.80 23.00 23.30 23.10 22.00
CAULIFLOWER 1996 35.20 36.10 52.80 37.00 37.70 35.70 24.30 26.80 22.60 28.70 36.20 38.001997 29.60 33.80 32.60 27.70 20.70 31.20 38.90 22.90 34.50 49.30 27.60 28.901998 35.10 44.00 49.50 43.80 35.50 26.40 23.20 25.30 31.30 23.60 33.70 35.801999 29.40 29.40 37.60 45.80 23.40 25.50 19.30 24.80 20.30 20.00 34.50 54.302000 22.90 30.10 31.10 34.60 46.00 31.20 37.20 24.00 24.80 21.60 65.30 28.102001 25.70 35.20 22.80 47.30 26.30 37.40 24.80 24.70 23.50 21.60 21.50 56.102002 53.40 44.90 33.80 24.00 20.80 28.40 27.00 29.60 40.60 24.00 32.20 25.202003 24.70 30.40 30.80 27.60 39.50 46.30 27.40 24.90 40.40 25.80 57.00 75.502004 28.10 41.80 23.80 23.50 28.80 46.20 27.50 26.00 31.00 32.20 26.60 35.102005 26.60 35.10 50.80 36.60 29.70 38.10 25.60 31.50 28.50 19.70 24.30 42.30
CELERY 1996 7.90 8.50 12.20 11.60 8.90 11.50 11.10 9.20 10.80 9.30 12.80 13.001997 16.20 16.20 12.30 10.50 15.40 9.89 19.00 16.40 14.00 13.40 18.40 19.101998 11.20 11.40 16.40 13.80 15.40 12.40 9.99 9.39 9.80 9.91 11.90 14.001999 9.51 8.47 8.35 10.20 12.80 18.30 13.80 9.81 9.77 8.48 12.80 17.202000 19.20 16.00 12.90 21.20 25.60 29.10 18.60 20.70 15.20 12.80 19.40 21.502001 14.60 15.00 15.80 19.10 24.00 33.70 13.10 8.15 8.04 7.46 8.64 9.622002 10.10 19.50 23.50 18.60 12.30 9.37 10.10 9.94 10.60 9.34 14.10 10.202003 8.29 11.80 12.60 17.00 11.00 9.34 12.10 10.70 12.20 15.70 20.60 15.302004 20.80 24.40 13.90 15.60 15.00 13.80 11.10 8.51 10.40 14.60 18.10 13.402005 12.90 22.90 28.40 20.80 15.50 9.62 9.47 9.12 11.50 11.40 13.10 10.70
CORN, SWEET 1996 – – – 21.50 17.10 16.20 16.70 16.10 19.50 19.20 19.40 25.001997 – – – 20.30 18.80 14.90 15.80 14.90 16.50 18.20 19.80 19.701998 – – – 33.60 20.00 14.80 12.60 11.00 15.20 26.20 27.30 17.301999 – – – – 19.30 14.60 13.90 15.80 12.10 17.60 25.10 –2000 – – – 21.90 14.30 18.80 15.50 19.20 26.90 16.30 20.80 –2001 – – – 28.60 29.40 18.90 18.00 18.50 24.00 26.50 23.20 20.502002 – – – 29.60 25.00 19.40 19.00 15.70 19.50 17.40 19.00 16.702003 – – – 27.50 21.00 23.20 17.60 16.60 22.20 24.10 31.60 43.402004 – – – 32.20 24.50 25.60 22.10 28.30 32.10 47.10 46.70 36.802005 – – – 30.10 24.90 26.20 16.00 16.90 25.50 25.50 37.30 21.20
CUCUMBERS, 1997 25.00 25.00 25.00 26.30 22.30 19.20 23.70 34.20 26.00 24.80 22.90 14.90FRESH MARKET 3 1998 – – – – 33.30 34.80 22.80 28.80 32.90 31.00 38.50 33.60
1999 – – – – 18.80 19.30 28.80 30.10 30.80 34.40 24.00 –2000 – – – – 23.90 28.00 35.00 28.50 28.10 33.10 28.80 –2001 – – – – 21.50 38.60 26.10 32.50 34.60 26.00 22.20 –2002 – – – – – 31.30 28.80 25.20 21.70 28.30 35.90 –2003 – – – – – 45.20 23.70 26.70 37.00 39.30 25.60 –2004 – – – – 19.30 29.70 32.10 58.70 58.70 43.90 – –2005 – – – – 11.00 17.00 18.40 33.60 33.60 25.10 70.40 –

California Agricultural Resource Directory 2006 123
Vegetable and Melon Crops
Vegetable and Melon Monthly Average Prices Received, 1996 – 2005 1
Crop Crop Year
Jan. Feb. Mar. April May June July Aug. Sept. Oct. Nov. Dec.$/Cwt.
MELONS, 1997 – – – – 20.20 16.50 14.70 15.20 21.50 24.90 21.80 18.50CANTALOUPE 4 1998 – – – – 27.10 15.90 18.60 11.80 15.50 19.00 16.00 –
1999 – – – – 23.90 15.90 12.80 13.50 15.90 17.70 19.40 –2000 – – – – 16.70 16.80 14.30 12.30 19.00 24.00 23.20 35.102001 – – – – 27.30 13.20 14.50 17.20 13.50 16.50 20.00 23.702002 – – – – 21.80 12.60 14.50 10.80 14.80 21.30 16.50 20.002003 – – – – 17.60 14.10 14.30 15.80 14.40 15.20 27.70 19.802004 – – – – 15.70 12.00 10.50 14.30 15.40 13.80 22.00 33.802005 – – – – 13.90 12.90 9.10 7.50 10.90 11.80 21.20 11.00
MELONS, 1996 – – – – 15.90 19.80 13.60 13.40 16.70 22.40 21.00 20.00HONEYDEW 5 1997 – – – – 28.50 21.00 14.40 12.60 22.70 31.90 21.20 18.00
1998 – – – – 25.20 23.00 22.30 15.00 13.00 15.00 17.80 16.001999 – – – – – 22.60 16.60 16.00 20.20 28.50 20.70 –2000 – – – – 18.70 17.30 17.00 13.80 21.60 24.80 22.20 –2001 – – – – 30.70 19.00 18.30 17.90 16.10 14.80 20.40 –2002 – – – – 22.40 17.30 19.50 12.30 11.60 17.10 13.90 15.202003 – – – – 37.00 21.30 20.40 12.40 17.30 18.10 18.00 21.502004 – – – – 18.40 17.90 14.90 19.20 17.70 18.30 26.40 29.00
LETTUCE, HEAD 1996 17.80 9.26 17.20 13.30 13.20 15.10 12.70 23.60 13.60 15.60 23.50 25.001997 15.20 10.00 13.80 15.80 10.50 14.70 17.00 22.80 22.30 35.10 26.90 32.501998 19.40 11.30 16.60 28.10 14.70 11.40 15.40 16.20 14.00 21.30 10.60 12.501999 11.10 15.50 37.60 20.80 14.00 11.40 12.50 11.90 13.00 13.00 10.80 17.502000 15.00 10.00 12.40 23.30 23.50 13.40 15.00 19.20 29.40 16.10 18.00 12.202001 14.50 24.10 15.00 21.90 18.50 12.00 16.40 26.90 26.20 11.30 10.90 29.602002 29.00 43.10 80.60 13.60 9.97 10.50 11.30 14.60 14.30 13.30 11.60 11.702003 12.60 11.60 10.10 14.20 21.20 32.20 11.90 21.50 23.90 26.30 31.70 21.302004 12.80 20.60 11.50 14.90 10.50 13.30 10.70 17.10 15.20 24.10 14.90 13.402005 11.70 12.80 34.20 30.30 13.90 17.30 11.00 13.50 12.70 12.40 10.20 18.10
ONIONS, SPRING 1996 – – – 10.70 9.60 9.90 9.50 – – – – –1997 – – – 16.60 12.60 15.50 14.10 – – – – –1998 – – – 15.90 14.40 13.40 20.20 – – – – –1999 – – – 10.80 11.30 11.80 13.10 – – – – –2000 – – – 12.50 9.12 10.00 13.10 – – – – –2001 – – – 16.30 13.00 12.70 14.50 – – – – –2002 – – – 13.70 13.70 15.00 14.20 – – – – –2003 – – – 38.60 29.80 20.00 15.10 – – – – –2004 – – – 16.00 16.10 14.50 14.40 – – – – –2005 – – – 12.40 12.80 11.90 – – – – – –
ONIONS, 1996 15.90 15.80 16.00 – – – 9.50 10.00 13.10 15.60 12.70 17.50SUMMER STORAGE 1997 19.60 14.60 – – – – 14.10 14.20 11.20 9.90 12.40 16.20
1998 17.00 21.00 23.00 – – – 20.20 13.50 13.40 12.20 13.80 16.501999 17.50 16.70 12.80 – – – 11.20 10.70 10.10 9.22 9.28 –2000 – – – – – – 13.00 11.10 12.20 12.90 14.10 16.302001 – – – – – – 14.50 12.60 12.80 12.60 11.90 11.902002 11.60 11.20 11.20 – – – 14.20 12.50 11.00 11.30 11.40 12.102003 18.70 22.70 33.40 – – – 15.10 12.00 13.10 15.10 11.20 18.502004 21.50 21.00 21.40 – – – 14.70 12.10 12.30 10.90 11.80 11.302005 11.30 11.20 10.90 – – – 10.70 10.20 12.10 14.40 17.00 16.80
TOMATOES 1996 – – – – – 26.80 23.50 20.60 22.40 27.60 31.60 –1997 – – – – 36.90 27.30 25.40 25.40 23.20 23.30 41.10 –1998 – – – – 29.20 25.70 43.10 20.40 26.60 43.10 37.60 –1999 – – – – 26.10 27.80 20.30 22.50 25.30 18.90 23.40 30.702000 – – – – 25.10 24.50 21.80 31.30 27.80 40.40 38.40 38.402001 – – – – 35.30 24.00 24.70 26.20 19.60 26.60 28.40 –2002 – – – – – 27.30 24.80 22.50 21.30 25.90 38.40 –2003 – – – – – 49.00 37.80 46.20 33.70 29.50 30.50 29.102004 – – – – – 17.30 19.90 34.60 36.00 64.90 89.00 –2005 – – – – – 32.20 25.60 23.30 39.60 35.80 30.10 –
Vegetable and Melon Monthly Average Prices Received, 1996 – 2005 1 continued
1 Prices are for fresh market vegetables at point of fi rst sale.2 Snap bean program began in 2003.3 Estimates began in 1997.4 Cantaloupe program began in 1997.5 Estimates discontinued in 2005.

124 California Agricultural Resource Directory 2006
California exports agricultural products to almost 150 countries, but the 10 principal destinations accounted for 72 percent of the 2005 export value. The leading four destinations — European Union, Canada, Japan and Mexico — accounted for 56 percent of total exports. For three years, the European Union has been the key destination for California agricultural exports, accounting for 22 percent of the 2005 export value. Principal commodities shipped to the European Union are almonds, wine and pistachios. Even though the major market for California agricultural production is still the rest of the nation, foreign markets have become relatively more important in the past six years. In 1999, only 16 percent of local production was being shipped to foreign markets, whereas in 2005 this fi gure was 22 percent. Clearly, California agriculture is enjoyed around the world.
The year 2005 set a new record for California agricultural exports, surpassing $9 billion for the fi rst time. This represents a 13 percent increase over 2004 and a 24 percent increase over 2003. The export value of California’s top 55 commodities increased by 15 percent from 2004 to 2005. In 2005, 42 of the top 50 principal products increased in value, while 12 products decreased in value, and only one remained almost unchanged. California’s top 10 agricultural exports increased by 19 percent in 2005. This is despite drops in exports of wine and dried plums, each falling by more than 15 percent. Almonds have been the top export commodity for several years. The almond crop showed a 34 percent increase in export value in 2005, most of which is explained by higher supply. Almonds, pistachios and walnuts were in the top 10 exported commodities. These three nut varieties are also within the top four exports to the European Union, with a combined net export value of more than $1.5 billion.
CaliforniaAgricultural Exports
phot
o by
Ed
Will
iam
s/Su
tter C
o.

California Agricultural Resource Directory 2006 125
California Agricultural Exports
MethodologyCalifornia’s agricultural export statistics are developed by the Agricultural Issues Center (AIC) at UC Davis in consultation with the California Department of Food and Agriculture. Data to compute agricultural exports are derived from offi cial government sources, published industry sources, and unpublished information from government and industry. Export quantities and values for U.S. and California port districts are from the Department of Commerce trade data posted on the United States International Trade Commission online database (http://dataweb.usitc.gov). Canadian import (value) data are from Strategis, Canada’s online database (http://strategis.ic.gc.ca/engdoc/main.html). If the California export price is not available for a particular product, the Agricultural Issues Center uses the U.S. average export price for that commodity in order to provide a dollar value. Production quantities and values are from various USDA sources, such as the National Agricultural Statistics Service, Economic Research Service and Agricultural Marketing Service. Agricultural Issues Center export estimates differ from other sources, such as those of the USDA’s Economic Research Service (ERS), on methodological issues. The ERS estimates are based on a state’s share of production of the exported commodity. It is assumed that, for any particular commodity, a state’s share of U.S. production equals that state’s share of U.S. exports. Other sources use port data, without direct links to where the product originated. The AIC export fi gures correspond to commodities produced within the state. Products that originated in another state and were exported via California ports are not included in these statistics.
In most cases the fi nal AIC report presents the export data at the individual commodity level. For instance, exports of a given fruit in fresh, canned and dried forms are added up and listed under the name of the fruit, although the estimation of fresh fruit exports may differ from the methodology used for canned and dried fruit. The ratio of quantity exported to quantity produced is given on a farm weight basis. That means, for example, that wine is converted back into fresh grapes. Standard conversion factors published by the USDA and Food and Agriculture Organization of the United Nations are applied. For the 2005 report, the Agricultural Issues Center followed the same methodology applied in 2004 and 2003, with the exception of lemons and pears. Some of the previously published fi gures for 2004 and 2003 were reviewed and adjusted, based on new information obtained from various sources. The methodology for lemons changed slightly in 2005. AIC now uses California’s share of U.S. lemon production and multiplies this by U.S. total exports obtained from the U.S. International Trade Commission to calculate California export of lemons. For pears, AIC now uses a combination of Canadian import data of fresh pears from California, data from the U.S. International Trade Commission and data obtained from the California Pear Advisory Board.
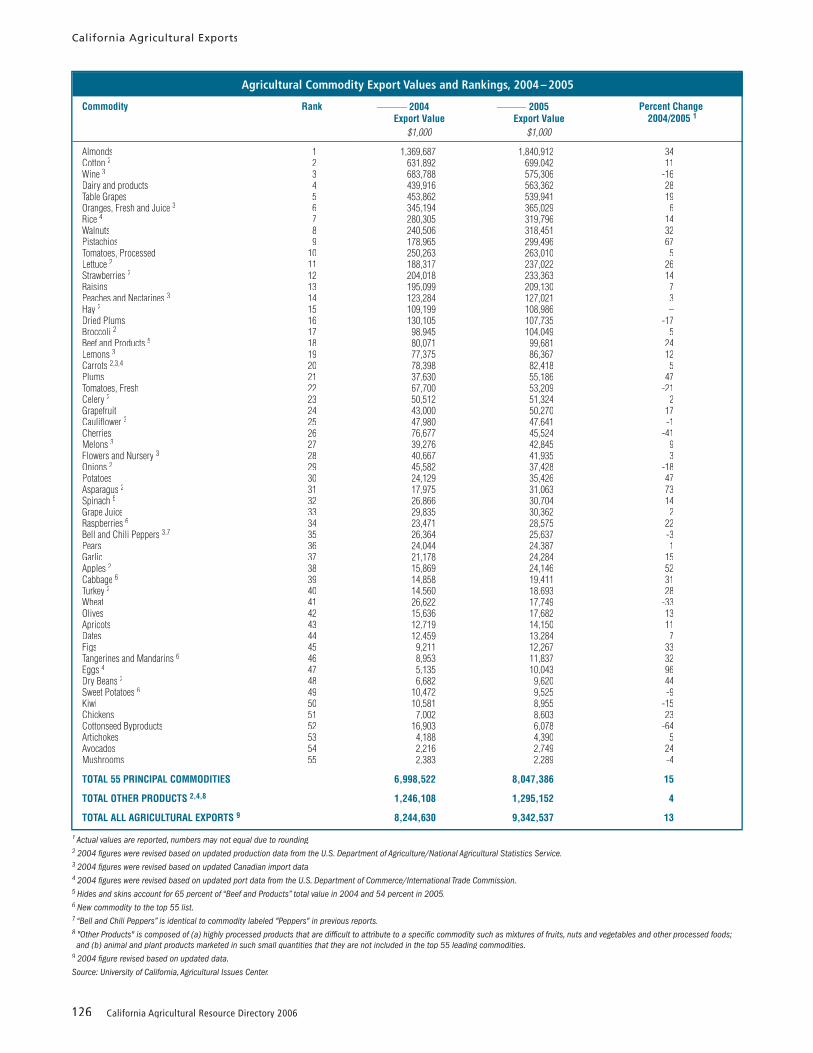
126 California Agricultural Resource Directory 2006
California Agricultural Exports
Agricultural Commodity Export Values and Rankings, 2004 – 2005
Commodity Rank –––––– 2004 ––––––Export Value
–––––– 2005 ––––––Export Value
Percent Change 2004/2005 1
$1,000 $1,000
Almonds 1 1,369,687 1,840,912 34Cotton 2 2 631,892 699,042 11Wine 3 3 683,788 575,306 -16Dairy and products 4 439,916 563,362 28Table Grapes 5 453,862 539,941 19Oranges, Fresh and Juice 3 6 345,194 365,029 6Rice 4 7 280,305 319,796 14Walnuts 8 240,506 318,451 32Pistachios 9 178,965 299,496 67Tomatoes, Processed 10 250,263 263,010 5Lettuce 2 11 188,317 237,022 26Strawberries 2 12 204,018 233,363 14Raisins 13 195,099 209,130 7Peaches and Nectarines 3 14 123,284 127,021 3Hay 2 15 109,199 108,986 –Dried Plums 16 130,105 107,735 -17Broccoli 2 17 98,945 104,049 5Beef and Products 5 18 80,071 99,681 24Lemons 3 19 77,375 86,367 12Carrots 2,3,4 20 78,398 82,418 5Plums 21 37,630 55,186 47Tomatoes, Fresh 22 67,700 53,209 -21Celery 2 23 50,512 51,324 2Grapefruit 24 43,000 50,270 17Caulifl ower 3 25 47,980 47,641 -1Cherries 26 76,677 45,524 -41Melons 3 27 39,276 42,845 9Flowers and Nursery 3 28 40,667 41,935 3Onions 2 29 45,582 37,428 -18Potatoes 30 24,129 35,426 47Asparagus 2 31 17,975 31,063 73Spinach 6 32 26,866 30,704 14Grape Juice 33 29,835 30,362 2Raspberries 6 34 23,471 28,575 22Bell and Chili Peppers 3,7 35 26,364 25,637 -3Pears 36 24,044 24,387 1Garlic 37 21,178 24,284 15Apples 2 38 15,869 24,146 52Cabbage 6 39 14,858 19,411 31Turkey 2 40 14,560 18,693 28Wheat 41 26,622 17,749 -33Olives 42 15,636 17,682 13Apricots 43 12,719 14,150 11Dates 44 12,459 13,284 7Figs 45 9,211 12,267 33Tangerines and Mandarins 6 46 8,953 11,837 32Eggs 4 47 5,135 10,043 96Dry Beans 2 48 6,682 9,620 44Sweet Potatoes 6 49 10,472 9,525 -9Kiwi 50 10,581 8,955 -15Chickens 51 7,002 8,603 23Cottonseed Byproducts 52 16,903 6,078 -64Artichokes 53 4,188 4,390 5Avocados 54 2,216 2,749 24Mushrooms 55 2,383 2,289 -4
TOTAL 55 PRINCIPAL COMMODITIES 6,998,522 8,047,386 15
TOTAL OTHER PRODUCTS 2,4,8 1,246,108 1,295,152 4
TOTAL ALL AGRICULTURAL EXPORTS 9 8,244,630 9,342,537 13
1 Actual values are reported, numbers may not equal due to rounding.2 2004 fi gures were revised based on updated production data from the U.S. Department of Agriculture/National Agricultural Statistics Service.3 2004 fi gures were revised based on updated Canadian import data.4 2004 fi gures were revised based on updated port data from the U.S. Department of Commerce/International Trade Commission.5 Hides and skins account for 65 percent of “Beef and Products” total value in 2004 and 54 percent in 2005.6 New commodity to the top 55 list.7 “Bell and Chili Peppers” is identical to commodity labeled "Peppers" in previous reports.8 "Other Products" is composed of (a) highly processed products that are diffi cult to attribute to a specifi c commodity such as mixtures of fruits, nuts and vegetables and other processed foods; and (b) animal and plant products marketed in such small quantities that they are not included in the top 55 leading commodities.9 2004 fi gure revised based on updated data.
Source: University of California, Agricultural Issues Center.

California Agricultural Resource Directory 2006 127
California Agricultural Exports
California Share of U.S. Agricultural Exports, 2004 – 2005
Commodity ––––––––––– 2004 –––––––––– ––––––––––– 2005 ––––––––––Export Value California Export Value California
Total U.S. California Percent Share Total U.S. California Percent Share$1,000 $1,000
Animal Products 5,782,028 546,684 9.5 6,813,682 700,382 10.3Dairy and Products 1,482,069 439,916 29.7 1,667,693 563,362 33.8Beef and Products 1 2,022,743 80,071 4.0 2,381,189 99,681 4.2Turkey 2 261,696 14,560 5.6 345,473 18,693 5.4Eggs 3 187,444 5,135 2.7 214,353 10,043 5.0Chickens 1,828,076 7,002 0.4 2,204,974 8,603 0.4
Field Crops 11,644,736 1,356,467 11.6 10,716,103 1,469,232 13.7Cotton 2 4,222,396 631,892 15.0 3,920,176 699,042 17.8Rice 3 1,177,139 280,305 23.8 1,299,770 319,796 24.6Tomatoes, Processed 268,683 250,263 93.1 285,986 263,010 92.0Hay 2 489,349 109,199 22.3 508,186 108,986 21.4Potatoes 71,699 24,129 33.7 109,662 35,426 32.3Wheat 5,223,335 26,622 0.5 4,428,105 17,749 0.4Dry Beans 2 17,255 6,682 38.7 22,370 9,620 43.0Sweet Potatoes 4 22,431 10,472 46.7 24,344 9,525 39.1Cottonseed and Byproducts 152,449 16,903 11.1 117,504 6,078 5.2
Fruits and Products 3,822,950 2,574,300 67.3 3,967,093 2,626,111 66.2Wine 2 750,503 683,788 91.1 624,386 575,306 92.1Table Grapes 457,489 453,862 99.2 544,250 539,941 99.2Oranges, Fresh and Juice 5 544,554 345,194 63.4 534,855 365,029 68.2Strawberries 2 216,976 204,018 94.0 249,360 233,363 93.6Raisins 195,099 195,099 100.0 209,130 209,130 100.0Peaches and Nectarines 5 141,329 123,284 87.2 152,319 127,021 83.4Dried Plums 130,105 130,105 100.0 107,735 107,735 100.0Lemons 5 86,433 77,375 89.5 101,995 86,367 84.7Plums 39,610 37,630 95.0 58,090 55,186 95.0Grapefruit 282,024 43,000 15.2 200,982 50,270 25.0Cherries 190,194 76,677 40.3 221,320 45,524 20.6Melons 5 98,054 39,276 40.1 120,300 42,845 35.6Grape Juice 53,062 29,835 56.2 56,396 30,362 53.8Raspberries 4 35,782 23,471 65.6 42,442 28,575 67.3Pears 128,491 24,044 18.7 128,387 24,387 19.0Apples 2 392,561 15,869 4.0 526,006 24,146 4.6Olives 15,636 15,636 100.0 17,682 17,682 100.0Apricots 13,315 12,719 95.5 14,869 14,150 95.2Dates 12,459 12,459 100.0 13,284 13,284 100.0Figs 9,211 9,211 100.0 12,267 12,267 100.0Tangerines and Mandarins 4 16,979 8,953 52.7 19,052 11,837 62.1Kiwi 10,581 10,581 100.0 8,955 8,955 100.0Avocados 2,504 2,216 88.5 3,031 2,749 90.7
Tree Nuts 1,789,158 1,789,158 100.0 2,458,859 2,458,859 100.0Almonds 1,369,687 1,369,687 100.0 1,840,912 1,840,912 100.0Walnuts 240,506 240,506 100.0 318,451 318,451 100.0Pistachios 178,965 178,965 100.0 299,496 299,496 100.0
Vegetables 1,164,278 691,245 59.4 1,272,081 750,869 59.0Lettuce 2 268,726 188,317 70.1 332,367 237,022 71.3Broccoli 2 107,534 98,945 92.0 114,158 104,049 91.1Carrots 2, 3, 5 94,370 78,398 83.1 106,372 82,418 77.5Tomatoes, Fresh 172,873 67,700 39.2 166,131 53,209 32.0Celery 2 53,321 50,512 94.7 54,969 51,324 93.4Caulifl ower 5 60,847 47,980 78.9 64,465 47,641 73.9Onions 2 166,459 45,582 27.4 186,527 37,428 20.1Asparagus 2 38,346 17,975 46.9 35,048 31,063 88.6Spinach 4 38,009 26,866 70.7 45,207 30,704 67.9Bell and Chili Peppers 5, 6 88,022 26,364 30.0 90,359 25,637 28.4Garlic 21,178 21,178 100.0 24,284 24,284 100.0Cabbage 4 20,071 14,858 74.0 26,596 19,411 73.0Artichokes 4,188 4,188 100.0 4,390 4,390 100.0 Mushrooms 4 30,334 2,383 7.9 21,208 2,289 10.8
Flowers and Nursery 5 280,959 40,667 14.5 302,020 41,935 13.9
TOTAL PRINCIPAL COMMODITIES 24,484,109 6,998,522 28.6 25,529,838 8,047,386 31.5
TOTAL OTHER PRODUCTS 2, 3, 7 32,698,756 1,246,108 3.8 33,096,927 1,319,260 4.0
TOTAL ALL AGRICULTURAL EXPORTS 8 57,182,865 8,244,630 14.4 58,626,765 9,342,537 15.9
See footnotes on page 128.

128 California Agricultural Resource Directory 2006
California Agricultural Exports
1 “Beef and Products” include exports of hides and skins. Hides and skins account for 54 percent of beef and products total value. Hides and skins are included in the heading "Beef and Products"
from previous reports, but not explicitly highlighted because of its smaller percentage of total beef exports.2 2004 fi gures were revised based on updated production data from the U.S. Department of Agriculture/National Agricultural Statistics Service.3 2004 fi gures were revised based on updated port data from the U.S. Department of Commerce/International Trade Commission.4 New commodity to the top 55 list.5 2004 fi gures were revised based on updated Canadian import data.6 “Bell and Chili Peppers” is identical to commodity labeled "Peppers" in previous reports.7 "Other Products" is composed of (a) highly processed products that are diffi cult to attribute to a specifi c commodity such as mixtures of fruits, nuts and vegetables and other processed foods; and (b) animal and plant products marketed in such small quantities that they are not included in the top 55 leading commodities.8 2004 fi gure revised based on updated data.
Major California Agricultural Exports to the Top 15 Destinations, 2005 1
Commoditiesby Country
Approximate Commodities Approximate Commodities ApproximateExport Value by Country Export Value by Country Export Value
Millions Millions Millions
1 – European Union-25 2,015 2 – Canada 1,756 3 – Japan 940Almonds 1,084 Lettuce 202 Rice 160Wine 299 Strawberries 172 Almonds 145Pistachios 225 Table Grapes 159 Hay 85Walnuts 162 Tomatoes, Processed 138 Wine 61Raisins 74 Wine 119 Oranges, Fresh and Juice 60Dried Plums 49 Almonds 112 Walnuts 43Cotton 28 Oranges, Fresh and Juice 94 Dairy and Products 41Table Grapes 15 Carrots 77 Broccoli 34Strawberries 10 Peaches and Nectarines 66 Lemons 34Tomatoes, Processed 10 Broccoli 54 Raisins 31Rice 8 Tomatoes, Fresh 44 Dried Plums 31Garlic 5 Celery 40 Strawberries 31Flowers and Nursery 5 Caulifl ower 34 Cherries 29Lettuce 5 Melons 32 Cotton 25Dairy and Products 4 Lemons 30 Tomatoes, Processed 23Onions 4 Spinach 30 Grapefruit 21Olives 3 Raisins 28 Pistachios 10Lemons 3 Plums 26 Caulifl ower 9Dates 3 Walnuts 26 Melons 7Sweet Potatoes 3 Raspberries 23 Dry Beans 6Cherries 3 Peppers, Bell and Chili 2 23 Onions 6Others 13 Potatoes 21 Beef and Products 3 5
Pistachios 21 Table Grapes 5Grape Juice 20 Asparagus 5Cabbage 18 Tangerines and Mandarins 4Flowers and Nursery 16 Grape Juice 4Onions 16 Raspberries 4Pears 13 Olives 3Cotton 9 Lettuce 3Dried Plums 8 Apricots 2Asparagus 8 Flowers and Nursery 2Apricots 8 Others 11Dairy and Products 8Garlic 8Grapefruit 7Cherries 7Sweet Potatoes 7Olives 7Figs 5Dates 5Tangerines and Mandarins 4Kiwi 3Artichokes 3Rice 2Others 2

California Agricultural Resource Directory 2006 129
California Agricultural Exports
Major California Agricultural Exports to the Top 15 Destinations, 2005 1
Commoditiesby Country
Approximate Commodities Approximate Commodities ApproximateExport Value by Country Export Value by Country Export Value
Millions Millions Millions
4 – Mexico 591 5 – China / Hong Kong 569 6 – South Korea 282Dairy and Products 263 Cotton 230 Oranges, Fresh and Juice 99Table Grapes 50 Table Grapes 90 Almonds 35Cotton 40 Oranges, Fresh and Juice 59 Cotton 33Tomatoes, Processed 35 Almonds 52 Walnuts 18Beef and Products 3 30 Beef and Products 3 27 Hay 14Almonds 29 Pistachios 24 Beef and Products 3 14Strawberries 16 Raisins 17 Tomatoes, Processed 12Flowers and Nursery 14 Dairy and Products 15 Wine 10Lettuce 13 Wine 10 Grapefruit 9Peaches and Nectarines 11 Lemons 7 Rice 7Potatoes 10 Walnuts 7 Dairy and Products 6Raisins 7 Plums 6 Grape Juice 5Wine 7 Tomatoes, Processed 5 Raisins 4Oranges, Fresh and Juice 7 Peaches and Nectarines 3 Table Grapes 3Tomatoes, Fresh 6 Rice 3 Lemons 3Garlic 4 Grapefruit 2 Tangerines and Mandarins 2Plums 4 Figs 2 Others 7Onions 4 Dried Plums 2Cottonseed and Byproducts 3 Others 9Walnuts 3Kiwi 3Carrots 3Rice 3Figs 3Melons 2Pears 2Olives 2Others 15
7 – Taiwan 228 8 – India 175 9 – Turkey 124Cotton 34 Almonds 130 Cotton 66Peaches and Nectarines 29 Cotton 34 Rice 43Table Grapes 26 Table Grapes 11 Almonds 13Rice 18 Others 1 Others 2Almonds 17Beef and Products 3 14Broccoli 13Plums 12Hay 9Lettuce 8Wine 6Raisins 6Oranges, Fresh and Juice 5Celery 4Walnuts 4Dairy and Products 4Potatoes 4Cherries 3Caulifl ower 2Others 9
Major California Agricultural Exports to the 15 Top Destinations, 2005 1 continued

130 California Agricultural Resource Directory 2006
California Agricultural Exports
Major California Agricultural Exports to the Top 15 Destinations, 2005 1
Commoditiesby Country
Approximate Commodities Approximate Commodities ApproximateExport Value by Country Export Value by Country Export Value
Millions Millions Millions
10 – Indonesia 98 11 – Malaysia 97 12 – Australia 92Cotton 55 Table Grapes 62 Table Grapes 16Dairy and Products 19 Oranges, Fresh and Juice 13 Walnuts 16Table Grapes 15 Almonds 7 Almonds 13Beef and Products 3 2 Dried Plums 2 Oranges, Fresh and Juice 11Almonds 2 Raisins 2 Wine 8Others 4 Others 10 Pistachios 4
Lemons 4Dates 3Tomatoes, Processed 2Others 15
13 – Thailand 66 14 – United Arab Emirates 64 15 – Philippines 64Cottons 37 Cotton 55 Dairy and Products 34Table Grapes 9 Others 9 Table Grapes 11Peaches and Nectarines 6 Wine 6Almonds 5 Tomatoes, Processed 3Pears 3 Cotton 3Others 7 Others 7
Major California Agricultural Exports to the Top 15 Destinations, 2005 1 continued
1 This table provides export values for single commodities to the top 15 destinations. Only export values higher than $2 million are reported.2 “Bell and Chili Peppers” is identical to commodity labeled “Peppers” in previous reports.3 “Beef and Products” include exports of hides and skins. Hides and skins account for 54 percent of “Beef and Products” total export value in 2005.
Source: University of California, Agricultural Issues Center.
Major California Agricultural Exports to the European Union, 2005
Approximate Export Value, Millions
Rank EU Member 1 Almonds Wine Pistachios Walnuts Raisins Dried Plums
Cotton Other 2Commodities
Total 3
1 Germany 241 24 13 48 12 14 12 10 3722 Spain 254 <1 12 56 1 1 <1 4 3293 United Kingdom 50 138 19 3 32 5 2 46 2944 Italy 116 39 18 33 <1 10 4 4 2255 Netherlands 121 32 33 14 4 5 0 14 2236 Belgium 67 11 58 4 <1 5 8 4 1587 France 103 6 29 <1 1 0 0 4 1448 Greece 51 <1 16 1 <1 0 0 0 699 Sweden 19 18 <1 3 9 3 <1 4 56
10 Denmark 21 17 <1 <1 4 2 0 1 46Other EU Members 4 41 13 26 1 8 4 2 3 97
Total 1,084 299 225 162 74 49 28 95 2,015
1 The European Union (EU) member countries to which California exports are shipped refl ects only the initial destination of the product, not the country of consumption. Many products are distributed throughout the EU after the initial entry.2 “Other Commodities” are those that individually account for 1 percent or less of all California agricultural exports to the EU.3 Accurate export destination data is only available for 48 of the top 55 commodities. The commodities that export destinations are not included are apples, turkey, wheat, eggs, chickens, avocados and mushrooms.4 “Other EU Members” include Austria, Cyprus, Czech Republic, Estonia, Finland, Hungary, Ireland, Latvia, Lithuania, Luxembourg Malta, Poland, Portugal, Slovak Republic and Slovenia. All these countries combined account for less than 5 percent of California agricultural exports to the EU.
Source: University of California, Agricultural Issues Center.
NOTE: Totals may not equal due to rounding.

California Agricultural Resource Directory 2006 131
California Agricultural Exports
Major Destinations for California Agricultural Exports, 2005 1,2
Percent of Export Value
1 - ALMONDS 2 - COTTON 3 - WINE 4 - DAIRY AND PRODUCTSEU-25 59 China/Hong Kong 33 EU-25 52 Mexico 47Japan 8 Turkey 9 Canada 21 Japan 7India 7 Indonesia 8 Japan 11 Philippines 6Canada 6 Pakistan 6 Indonesia 5
Mexico 6Thailand 5Taiwan 5India 5Korea 5
5 - TABLE GRAPES 6 - ORANGES, FRESH AND JUICE
7 - RICE 8 - WALNUTS
Canada 29 Korea 27 Japan 50 EU-25 51China/Hong Kong 17 Canada 26 Turkey 14 Japan 13Malaysia 12 Japan 16 Jordan 11 Canada 8Mexico 9 China/Hong Kong 16 Taiwan 6 Israel 6Taiwan 5 Papua New Guinea 5 Korea 6
Australia 5
9 - PISTACHIOS 10 - TOMATOES, PROCESSED 11 - LETTUCE 12 - STRAWBERRIESEU-25 75 Canada 52 Canada 85 Canada 74China/Hong Kong 8 Mexico 13 Mexico 6 Japan 13Canada 7 Japan 9 Mexico 7
Korea 5
13 - RAISINS 14 - PEACHES AND NECTARINES
15 - HAY 16 - DRIED PLUMS
EU-25 35 Canada 52 Japan 78 EU-25 45Japan 15 Taiwan 23 Korea 13 Japan 29Canada 13 Mexico 9 Taiwan 8 Canada 8China/Hong Kong 8 Thailand 5
17 - BROCCOLI 18 - BEEF AND PRODUCTS 3 19 - LEMONS 20 - CARROTSCanada 52 Mexico 31 Japan 40 Canada 93Japan 33 China/Hong Kong 27 Canada 35Taiwan 13 Korea 14 China/Hong Kong 8
Taiwan 14Japan 5
21 - PLUMS 22 - TOMATOES, FRESH 23 - CELERY 24 - GRAPEFRUITCanada 48 Canada 83 Canada 77 Japan 41Taiwan 22 Mexico 11 Taiwan 8 Korea 18China/Hong Kong 10 Canada 14Mexico 7 New Zealand 7
China/Hong Kong 5
25 - CAULIFLOWER 26 - CHERRIES 27 - MELONS 28 - FLOWERS AND NURSERYCanada 71 Japan 64 Canada 75 Canada 38Japan 18 Canada 15 Japan 16 Mexico 34Taiwan 5 Taiwan 7 Mexico 6 EU-25 13
EU-25 6 Japan 6
29 - ONIONS 30 - POTATOES 31 - ASPARAGUS 32 - SPINACHCanada 42 Canada 58 Canada 34 Canada 97Japan 16 Mexico 29 Japan 21EU-25 11 Taiwan 11 Switzerland 15Mexico 10Taiwan 5

132 California Agricultural Resource Directory 2006
California Agricultural Exports
Major Destinations for California Agricultural Exports, 2005 1,2
Percent of Export Value
33 - GRAPE JUICE 34 - RASPBERRIES 35 - PEPPERS, BELL AND CHILI 4
36 - PEARS
Canada 67 Canada 81 Canada 89 Canada 55Korea 17 Japan 14 Mexico 6 Thailand 12Japan 13 EU-25 5 Mexico 10
37 - GARLIC 39 - CABBAGE 42 - OLIVES 43 - APRICOTSCanada 32 Canada 93 Canada 37 Canada 58EU-25 22 EU-25 19 Japan 18Mexico 17 Japan 17 Mexico 13Australia 7 Mexico 13 EU-25 6
44 - DATES 45 - FIGS 46 - TANGERINES AND MANDARINS
48 - DRY BEANS
Canada 36 Canada 43 Japan 37 Japan 68EU-25 24 Mexico 21 Canada 37 EU-25 13Australia 22 China/Hong Kong 19 Korea 18 Canada 12Mexico 5 Japan 12
49 - SWEET POTATOES 50 - KIWI 52 - COTTONSEED AND BYPRODUCTS
53 - ARTICHOKES
Canada 69 Canada 39 Mexico 54 Canada 76EU-25 29 Mexico 35 Japan 27 Mexico 18
Japan 10 Canada 8Korea 10
Major Destinations for California Agricultural Exports, 2004 1,2 continued
1 This table shows destinations receiving 5 percent of total exports and for which reliable data are available. The numbers associated with each commodity correlate to the ranking in the table “Agricultural Commodity Export Values and Rankings, 2004-2005.”2 Accurate export destination data is only available for 48 of the top 55 commodities. The commodities that export destinations are not included are apples, turkey, wheat, eggs, chickens, avocados and mushrooms.3 Hides and skins account for 54 percent of “Beef and Products” total value.4 “Peppers, Bell and Chili” is identical to commodity labeled “Peppers“ in previous reports.
Source: University of California, Agricultural Issues Center.
Note: Values for European Union include all 25-member nations.

California Agricultural Resource Directory 2006 133
California Agricultural Exports
Ratio of California Farm Quantity Exported to Farm Quantity Produced, 2005
Commodity Units Farm QuantityExported 1
Farm QuantityProduced 1
Ratio of QuantityExported to
Quantity Produced1,000 Farm-gate Units 1,000 Farm-gate Units Percentage
Almonds cwt. 7,068 9,150 77Apples cwt. 1,083 3,550 30Apricots short tons 12 71 17Artichokes cwt. 110 840 13Asparagus cwt. 188 1,044 18Avocados short tons 1,344 270,000 –Beef and Products liveweight cwt. 526 19,405 3Broccoli cwt. 2,903 18,300 16Cabbage cwt. 682 4655 15Carrots cwt. 4,193 23,305 18Caulifl ower cwt. 1,641 5,396 30Celery cwt. 2,524 18,034 14Cherries short tons 11 49 24Cotton 2 bales 1,915 1,630 112Cottonseed and byproducts short tons 17,668 594,000 3Dairy and Products 3,4 cwt. 44,203 375,640 12Dates short tons 5 16 28Dried Plums short tons 225 265 85Dry Beans cwt. 254 1,385 18Eggs dozens 10,788 423,500 3Figs short tons 15 51 30Garlic cwt. 726 4,000 18Grapefruit short tons 97,287 201,000 48Grapes, All short tons 1,600 6,978 23Hay short tons 625 8,935 7Kiwi short tons 7 36 21Lemons 38lb boxes 6,139 42,000 15Lettuce cwt. 9,910 77,685 13Melons cwt. 1,983 23,031 9Olives short tons 97 142 69Onions cwt. 3,471 20,068 17Oranges 75lb boxes 17,811 57,500 31Peaches and Nectarines cwt. 2,679 22,160 12Pears short tons 21 202 10Peppers, Bell and Chili 5 cwt. 688 8,287 8Pistachios cwt., in shell 1,679 2,830 59Plums short tons 54 171 32Potatoes cwt. 2,050 14,964 14Raspberries cwt. 633 825 77Rice cwt. 26,630 38,836 69Spinach cwt. 386 5270 7Strawberries cwt. 2,375 20,580 12Sweet Potatoes cwt. 279 3335 8Tangerines and Mandarins 75lb boxes 399 3600 11Tomatoes, Fresh cwt. 1,256 11,928 11Tomatoes, Processed short tons 1,398 9,600 15Turkey liveweight cwt. 188 4,068 5Walnuts short tons 152 355 43Wheat bushels 3,590 28,155 13
WEIGHTED AVERAGE 6 26
1 Conversion factors from the United States Department of Agriculture/National Agricultural Statistics Service are used in these calculations.2 The ratio is higher than 100 because volumes of past season inventories were exported in 2005.3 Farm quantity exported for “Dairy and Products” is calculated by converting cheese, condensed milk, fl uid milk, ice cream, nonfat dry milk and whole dry milk to their fl uid milk equivalents. 4 There is no addition for the farm quantity of milk alloted to whey exports because whey is a byproduct from cheese production. Other products, including casein, lactose, milk albumin, products for infant use, pudding and rennet are converted to farm equivalent by multiplying California’s share of U.S. milk production to the U.S. export quantity for these products, then applying a conversion factor of 1 pound of product to 8 pounds of milk equivalent. The same conversion factor is used for nonfat dry milk.5 “Peppers, Bell and Chili” is identical to commodity labeled “Peppers” in previous reports.6 The weighted average is based on each commodity’s share of production value.
Source: University of California, Agricultural Issues Center.

134 California Agricultural Resource Directory 2006
California Agricultural Directory
California Department of Food and Agriculture ............................... 135
Agricultural Publications .............................. 139
California Advisory Boards and Commissions ....................................... 141
California Agricultural Organizations ......... 143
California Fair Network ................................ 150
Certified Farmers’ Market Associations ....... 152
County Agricultural Commissioners ........... 154
County Sealers of Weights & Measures ....... 156
County Farm Bureaus .................................... 156
Farm Labor Organizations ............................ 158
National Agricultural Organizations ........... 159
Selected Government Agencies ................... 163
State Departments of Food and Agriculture ......................................... 165
University Agricultural Programs ................. 167
Water and Natural Resources ...................... 171

California Agricultural Resource Directory 2006 135
1220 N StreetSacramento, CA 95814(916) 654-0462; Fax (916) 657-4240www.cdfa.ca.gov
Office of the SecretaryA.G. Kawamura, Secretary
Vacant, UndersecretaryValerie Brown, Deputy SecretaryNancy Lungren, Deputy Secretary Kim Myrman, Deputy SecretaryDavid Pegos, Assistant SecretaryEric Stein, Deputy SecretaryRobert Tse, Director of Trade PolicySue Hessing, Principal Assistant(916) 654-0433; Fax (916) 653-0403
Ag Security and Emergency Response
Rita Witucki, Emergency Manager(916) 651-6517; Fax (916) 651-0036
Agriculture and Environmental Stewardship
Steve Shaffer, Director(916) 657-4956; Fax (916) 657-5017
California State Board of Food and Agriculture and Grant Management Program
Helen Lopez, Executive Director(916) 657-3231; Fax (916) 651-7899
County/State LiaisonEd Williams, Director(916) 653-6649; Fax (916) 651-9079
Equal Employment Opportunity
Patricia Rodden-Kesner, Acting EEO Advisor
(916) 654-1005; Fax (916) 654-8592
Information Technology ServicesDavood Ghods, Agency Information
Officer(916) 654-0442; Fax (916) 654-1236
Legal OfficeJohn Dyer, Chief Counsel(916) 654-1393; Fax (916) 653-1293
Legislative OfficeEric Stein, Deputy SecretaryMelissa Eidson, Legislative Analyst(916) 654-0321; Fax (916) 651-7417
CALIFORNIA DEPARTMENT OF FOOD and AGRICULTURE
Pierce’s Disease Control ProgramRobert L. Wynn, Statewide Coordinator(916) 651-6870; Fax (916) 651-0275
Public AffairsNancy Lungren, Deputy SecretarySteve Lyle, Director(916) 654-0462; Fax (916) 657-4240
State VeterinarianRichard E. Breitmeyer, DVM, MPVM(916) 651-6870; Fax (916) 651-0713
Administrative ServicesGeorge Deese, Director(916) 654-1020; Fax (916) 653-0206
Budgets OfficeJack Wright, Branch Chief(916) 654-0398; Fax (916) 654-0553
Departmental ServicesPaula Lewis, Branch Chief(916) 654-0954; Fax (916) 654-0542
Financial ServicesSue Louie, Branch Chief(916) 654-0362; Fax (916) 654-6269
Human ResourcesNikki Hall, Branch Chief(916) 654-0790; Fax (916) 653-5661
Animal Health and Food Safety Services
Annette Whiteford, DVM, Director(916) 654-0881; Fax (916) 653-4249
Animal HealthKent Fowler, DVM, Branch Chief (916) 654-1447; Fax (916) 653-2215
Livestock IdentificationGreg Lawley, Branch Chief(916) 654-0889; Fax (916) 653-5190
Meat and Poultry InspectionDennis L. Thompson, DVM,
Branch Chief(916) 654-0504; Fax (916) 654-2608
Milk and Dairy Food SafetyStephen Beam, Ph.D., Branch Chief(916) 653-6681; Fax (916) 653-7512
Fairs and ExpositionsMike Treacy, Director1010 Hurley Way, Suite 200Sacramento, CA 95825(916) 263-2952; Fax (916) 263-2969
Inspection ServicesNate Dechoretz, Director560 J Street, Suite 220Sacramento, CA 95814(916) 445-0029; Fax (916) 445-0232
Center for Analytical ChemistryNirmal Saini, Branch Chief3292 Meadowview RoadSacramento, CA 95832(916) 262-1434; Fax (916) 262-1572
Egg Quality Control ProgramAnthony Herrera, Program Supervisor(916) 445-4243; Fax (916) 445-2174
Feed, Fertilizer and Livestock Drugs Regulatory Services
Asif Maan, Branch Chief(916) 445-0444; Fax (916) 445-2171
Inspection and ComplianceRick Jensen, Branch Chief(916) 445-2180; Fax (916) 445-2427
Marketing ServicesKelly Krug, Director560 J Street, Suite 150Sacramento, CA 95814(916) 445-5055; Fax (916) 445-2655
Agricultural StatisticsVictor Tolomeo, Branch Chief(916) 498-5161; Fax (916) 498-5186
Dairy MarketingDavid Ikari, Branch Chief(916) 341-5988; Fax (916) 341-6697
Market EnforcementAgatha d’Esterhazy, Branch Chief(916) 341-6276; Fax (916) 341-6551
MarketingLynn Morgan, Branch Chief(916) 341-6005; Fax (916) 341-6826

136 California Agricultural Resource Directory 2006
Milk PoolingJohn Lee, Branch Chief(916) 341-5901; Fax (916) 341-5987
Measurement Standards
Dennis Johannes, Director6790 Florin-Perkins Road, Suite 100Sacramento, CA 95828(916) 229-3000; Fax (916) 229-3026
Compliance and EvaluationRoger Macey, Branch Chief(916) 229-3000
MetrologyGreg Boers, Branch Chief(916) 229-3000
Weighmaster Enforcement and Petroleum Products
Lauren Chiesa, Acting Branch Chief(916) 229-3000
Plant Health and Pest Prevention Services
John Connell, Director(916) 654-0317; Fax (916) 654-1018
Integrated Pest ControlRobert Leavitt, Branch Chief(916) 654-0768; Fax (916) 653-2403
Pest Detection/ Emergency Projects
Debby Tanouye, Branch Chief(916) 654-1211; Fax (916) 654-0555
Pest ExclusionNick Condos, Branch Chief(916) 654-0312; Fax (916) 654-0986
Plant Pest DiagnosticsUmesh Kodira, Branch Chief3294 Meadowview Road(916) 262-1100; Fax (916) 262-1190
Field OfficesAlameda CountyAnimal Health and Food Safety Services Milk and Dairy Food Safety
1515 Clay Street, Suite 803Oakland, CA 94612(510) 622-4810; Fax (510) 622-4808
Butte CountyInspection Services Shipping Point Inspection
40 Philadelphia Drive, Suite 104Chico, CA 95973-0292(530) 898-8427; Fax (530) 898-9034
Del Norte CountyPlant Health and Pest Prevention ServicesPest Exclusion – Agricultural Inspection Station
17200 Highway 101 NorthSmith River, CA 95567-9406(707) 487-8245
Plant Health and Pest Prevention ServicesPest Exclusion – Agricultural Inspection Station
U.S. Highway 199 Post Office Box 309O’Brien, OR 97534(541) 596-2119
El Dorado CountyPlant Health and Pest Prevention ServicesPest Exclusion – Agricultural Inspection Station
Post Office Box 5503703094 Highway 50South Lake Tahoe, CA 96155(530) 577-2196
Fresno CountyAnimal Health and Food Safety ServicesCalifornia Animal Health and Food SafetyLaboratory System
2789 South Orange AvenueFresno, CA 93725(559) 498-7740; Fax (559) 485-8097
Animal Health and Food Safety ServicesMeat and Poultry Inspection
2789 South Orange AvenueFresno, CA 93725(559) 233-7318; Fax (559) 233-7318
Animal Health and Food Safety ServicesMilk and Dairy Food Safety
2550 Mariposa Street, Room 3051Fresno, CA 93721(559) 445-5506; Fax (559) 445-5909
Inspection ServicesEgg Quality Control Program
Post Office Box 6543Visalia, CA 93290(559) 636-7438
Inspection ServicesFeed, Fertilizer and Livestock Drugs Regulatory Services
1683 North Helm Avenue, Suite DFresno, CA 93727(559) 452-9687; Fax (559) 452-9459
Inspection ServicesFruit and Vegetable Quality ControlStandardization
5108 East Clinton Way, Suite 115Fresno, CA 93727(559) 456-4506; Fax (559) 456-4603
Inspection ServicesShipping Point Inspection
165 East Tulare StreetDinuba, CA 93618(559) 595-8000; Fax (559) 595-8008
Inspection ServicesShipping Point Inspection
778 South Madera AvenueKerman, CA 93630(559) 846-7323; Fax (559) 846-7336
Measurement StandardsFresno Regional Office
2550 Mariposa Street, Room 3044Fresno, CA 93721(559) 445-5403; Fax (559) 445-5268
Plant Health and Pest Prevention ServicesIntegrated Pest Control
2895 North Larkin Avenue, Suite AFresno, CA 93727(559) 445-5472; Fax (559) 445-5334
Plant Health and Pest Prevention ServicesPest Detection/Emergency Projects
2889 North Larkin Avenue, Suite 106Fresno, CA 93727(559) 445-5031; Fax (559) 445-6638
Plant Health and Pest Prevention ServicesPest Exclusion
2889 North Larkin Avenue, Suite 101Fresno, CA 93727(559) 445-5033; Fax (559) 445-6880
Imperial CountyInspection ServicesShipping Point Inspection
1004 East Holton RoadEl Centro, CA 92243(760) 356-4673; Fax (760) 356-3073
Plant Health and Pest Prevention ServicesIntegrated Pest Control Biocontrol Program
4151 Highway 86Brawley, CA 92227(760) 351-0324; Fax (760) 344-7951
Plant Health and Pest Prevention ServicesIntegrated Pest ControlPink Bollworm Program
4151 Highway 86, Building 6Brawley, CA 92227(760) 344-1152; Fax (760) 344-1971
California Department of Food and Agriculture

California Agricultural Resource Directory 2006 137
Plant Health and Pest Prevention ServicesPest Exclusion – Agricultural Inspection Station
3510 West Interstate 8Winterhaven, CA 92283-9707(760) 572-0291; Fax (760) 572-0853
Kern CountyInspection ServicesShipping Point Inspection
501 Workman Street, Suite 110Bakersfield, CA 93307(661) 395-2816; Fax (661) 395-3851
Inspection ServicesShipping Point Inspection
1427 South Lexington Street, #A9Delano, CA 93215(661) 725-0288; Fax (661) 725-0149
Plant Health and Pest Prevention ServicesIntegrated Pest Control
5100 Douglas Avenue-MinterfieldShafter, CA 93263(661) 395-2914; Fax (661) 399-1601
Lake CountyPlant Health and Pest Prevention ServicesIntegrated Pest Control
893 Lakeport BoulevardLakeport, CA 95453(707) 263-1649; Fax (707) 263-1052
Lassen CountyPlant Health and Pest Prevention ServicesPest Exclusion – Agricultural Inspection Station
U.S. Highway 395Star Route 1, Box 4Chilcoot, CA 96105(530) 993-4177; Fax (530) 993-4072
Los Angeles CountyMarketing ServicesMarket Enforcement
9300 Flair Drive, Suite 308El Monte, CA 91731(626) 572-6762; Fax (626) 572-6768
Marketing ServicesMilk Pooling
9300 Flair Drive, Suite 308El Monte, CA 91731(626) 572-6762; Fax (626) 572-6768
Plant Health and Pest Prevention ServicesPest Detection/Emergency Projects
6819 East Gage AvenueCommerce, CA 90040(562) 928-4562; Fax (562) 772-7822
Plant Health and Pest Prevention ServicesPest Detection/Emergency ProjectsPest Exclusion
13915 Saticoy StreetVan Nuys, CA 91402(818) 901-7242; Fax (818) 901-1424
Marin CountyPlant Health and Pest Prevention ServicesPest Detection/Emergency Projects
1055 Las Ovejas Avenue, Suite 7San Rafael, CA 94903(415) 479-9546
Mendocino CountyPlant Health and Pest Prevention ServicesPest Detection/Emergency Projects
3001 South State Street, Suite 26Ukiah, CA 95482(707) 468-5623
Modoc CountyPlant Health and Pest Prevention ServicesPest Exclusion – Agricultural Inspection Station
South Highway 395HCO-1 Box 11200Alturas, CA 96101(530) 233-3618; Fax (530) 233-3618
Plant Health and Pest Prevention ServicesPest Exclusion – Agricultural Inspection Station
22485 State Highway 139-NorthCanby, CA 96015-9702(530) 664-5836
Mono CountyPlant Health and Pest Prevention ServicesPest Exclusion – Agricultural Inspection Station
U.S. Highway 6HC 72, Box 27211Benton, CA 93512-9803(760) 933-2225; Fax (760) 933-2225
Plant Health and Pest Prevention ServicesPest Exclusion – Agricultural Inspection Station
U.S. Highway 395Box 120117Topaz, CA 96133(530) 495-2301
Nevada CountyPlant Health and Pest Prevention ServicesPest Exclusion – Agricultural Inspection Station
11900 Interstate I-80Truckee, CA 96161(530) 587-3025; Fax (530) 587-6258
Orange CountyInspection ServicesCenter for Analytical ChemistryAnaheim Pesticide Laboratory
169 East Liberty AvenueAnaheim, CA 92801(714) 680-7901; Fax (714) 680-7919
Inspection ServicesEgg Quality Control Program
7701 Warner Avenue, Suite 214Huntington Beach, CA 92647(714) 848-1340
Measurement StandardsAnaheim Regional Office
169 East Liberty AvenueAnaheim, CA 92801(714) 680-7896; Fax (714) 449-7249
Plant Health and Pest Prevention ServicesPest Detection/Emergency Projects
935 East Discovery LaneAnaheim, CA 92801(714) 520-6866; Fax (714) 520-6856
Plant Health and Pest Prevention ServicesPest Detection/Emergency Projects
3802 Constitution AvenueLos Alamitos, CA 90720-5100(562) 795-1206; Fax (562) 795-1215
Plant Health and Pest Prevention ServicesPest Detection/Emergency Projects
312 South Melrose StreetPlacentia, CA 92670(714) 993-4301; Fax (714) 993-0748
Riverside CountyInspection ServicesShipping Point Inspection
3576 Arlington Avenue, Suite 209Riverside, CA 92514(951) 940-4552; Fax (909) 682-7865
Plant Health and Pest Prevention ServicesPest Detection/Emergency Projects
73710 Fred Waring Drive, Suite 211Palm Desert, CA 92260(760) 776-8208; Fax (760) 776-8091
Plant Health and Pest Prevention ServicesPest Detection/Emergency Projects
3180 Cridge StreetRiverside, CA 92506(951) 782-3271; Fax (951) 784-8932
Plant Health and Pest Prevention ServicesPest Exclusion
3180 Cridge StreetRiverside, CA 92507(951) 784-8905
Plant Health and Pest Prevention ServicesPest Exclusion – Agricultural Inspection Station
7116 East Interstate 10Blythe, CA 92225(760) 922-3666; Fax (760) 922-4466
California Department of Food and Agriculture

138 California Agricultural Resource Directory 2006
Sacramento CountyPlant Health and Pest Prevention ServicesPest Exclusion
3294 Meadowview RoadSacramento, CA 95832(916) 262-1100; Fax (916) 262-1190
San Bernardino CountyAnimal Health and Food Safety ServicesAnimal Health
1910 South Archibald Avenue, Suite YOntario, CA 91761(909) 947-4462; Fax (909) 923-5128
Animal Health and Food Safety ServicesCalifornia Animal Health and Food SafetyLaboratory System
Post Office Box 5579105 West Central AvenueSan Bernardino, CA 92408-2113(909) 383-4287; Fax (909) 884-5980
Animal Health and Food Safety ServicesMeat and Poultry Inspection
1910 South Archibald Avenue, Suite XOntario, CA 91761(909) 773-0079; Fax (909) 923-3961
Animal Health and Food Safety ServicesMilk and Dairy Food Safety
1910 South Archibald Avenue, Suite WOntario, CA 91761(909) 923-9929; Fax (909) 923-0359
Inspection ServicesFeed, Fertilizer and Livestock Drugs Regulatory Services
1910 South Archibald Avenue, Suite WOntario, CA 91761(909) 930-9689; Fax (909) 930-9458
Plant Health and Pest Prevention ServicesPest Exclusion – Agricultural Inspection Station
Interstate 40Post Office Box 814Needles, CA 92363-0814(760) 326-4150; Fax (760) 326-5016
Plant Health and Pest Prevention ServicesPest Exclusion – Agricultural Inspection Station
State Highway 62HCR 20, Post Office Box 410Vidal Junction, CA 92280(760) 665-8405; Fax (760) 665-2933
Plant Health and Pest Prevention ServicesPest Exclusion – Agricultural Inspection Station
Interstate 15Post Office Box 518Yermo, CA 92398-0518(760) 254-2233; Fax (760) 254-2863
San Diego CountyInspection ServicesAvocado Inspection Program
326 State PlaceEscondido, CA 92029(760) 743-4712; Fax (760) 747-2279
Inspection ServicesShipping Point Inspection
9765 Marconi Drive, Suite 102San Diego, CA 92173(619) 661-6355; Fax (619) 661-6963
Plant Health and Pest Prevention ServicesIntegrated Pest Control
7845 Lemon Grove Way, Suite BLemon Grove, CA 91945(619) 698-1046; Fax (619) 698-1347
Plant Health and Pest Prevention ServicesPest Exclusion
7845 Lemon Grove Way, Suite ALemon Grove, CA 91945(619) 698-1046; Fax (619) 698-1347
San Francisco CountyMarketing ServicesMarket Enforcement
5 Thomas Mellon Circle, Suite 232San Francisco, CA 94134(415) 469-6301; Fax (415) 469-6225
Plant Health and Pest Prevention ServicesPest Exclusion
185 Berry Street, Suite 200-ASan Francisco, CA 94107(415) 243-0563; Fax (415) 243-8358
San Joaquin CountyAnimal Health and Food Safety ServicesMilk and Dairy Food Safety
2403 West Washington Street, Room 10Stockton, CA 95203(209) 466-7186; Fax (209) 466-1738
Inspection ServicesShipping Point Inspection
8338 North West Lane, Suite 101Stockton, CA 95210(209) 478-2011; Fax (209) 478-2529
Santa Barbara CountyInspection ServicesShipping Point Inspection
Post Office Box 2652Santa Maria, CA 93457(805) 934-9236
Plant Health and Pest Prevention ServicesPest Detection/Emergency Projects
109 South La Patera LaneGoleta, CA 93117-3212(805) 964-0712; Fax (805) 964-9654
Santa Clara CountyPlant Health and Pest Prevention ServicesPest Detection/Emergency Projects
1890 Dobbin DriveSan Jose, CA 95133-1701(408) 254-8573; Fax (408) 254-4143
Shasta CountyAnimal Health and Food Safety ServicesAnimal Health
2135 Akard Avenue, Suite 8Redding, CA 96001-2794(530) 225-2140; Fax (530) 225-2240
Animal Health and Food Safety ServicesLivestock Identification
19340 Northbound I-5Cottonwood, CA 96022(530) 347-5721; Fax (530) 347-7120
Measurement StandardsRedding Regional Office
3609 Bechelli Lane, Suite ERedding, CA 96002(530) 224-2411; Fax (530) 224-2484
Plant Health and Pest Prevention ServicesIntegrated Pest Control
20235 Charlanne DriveRedding, CA 96002(530) 224-2427
Siskiyou CountyPlant Health and Pest Prevention ServicesPest Exclusion – Agricultural Inspection Station
Post Office Box 826U.S. Highway 97 51331Dorris, CA 96023(530) 397-4701; Fax (530) 397-4702
Plant Health and Pest Prevention ServicesPest Exclusion – Agricultural Inspection Station
14601 North Interstate 5Hornbrook, CA 96044(530) 475-3100; Fax (530) 475-3134
Stanislaus CountyAnimal Health and Food Safety ServicesAnimal Health
3800 Cornucopia Way, Suite FModesto, CA 95358-9494(209) 491-9350; Fax (209) 491-9353
Animal Health and Food Safety ServicesCalifornia Animal Health and Food SafetyLaboratory System
Post Office Box 1522Turlock, CA 95381(209) 634-5837; Fax (209) 667-4261
Animal Health and Food Safety ServicesLivestock Identification
3800 Cornucopia Way, Suite FModesto, CA 95358-9494(209) 491-9345; Fax (209) 491-9353
California Department of Food and Agriculture

California Agricultural Resource Directory 2006 139
AGRICULTURAL PUBLICATIONS
Inspection ServicesShipping Point Inspection
2030 Rockefeller Street, Suite HCeres, CA 95307(209) 537-0733; Fax (209) 537-2314
Plant Health and Pest Prevention ServicesPest Detection/Emergency Projects
3800 Cornucopia Way, Suite FModesto, CA 95358-9494(209) 491-9340; Fax (209) 491-9342
Tulare CountyAnimal Health and Food Safety ServicesAnimal Health
18830 Road 112Tulare, CA 93274(559) 685-3500; Fax (559) 685-3503
Animal Health and Food Safety ServicesLivestock Identification
4500 South Laspina StreetTulare, CA 93274(559) 685-3505
Plant Health and Pest Prevention ServicesIntegrated Pest Control
22847 Road 140Tulare, CA 93274(559) 686-4973; Fax (559) 686-5496
Plant Health and Pest Prevention ServicesIntegrated Pest Control
Post Office Box 346831603 Road 132Visalia, CA 93278(559) 733-0463; Fax (559) 733-0480
Ventura CountyInspection ServicesShipping Point Inspection
251 Lynn DriveVentura, CA 93003(805) 207-8175; Fax (805) 985-2024
Plant Health and Pest Prevention ServicesPest Detection/Emergency Projects
555 Airport Way, Suite FCamarillo, CA 93010(805) 383-7357; Fax (805) 389-3649
Yolo CountyAnimal Health and Food Safety ServicesCalifornia Animal Health and Food SafetyLaboratory System
Post Office Box 1770University of California, DavisDavis, CA 95617-1770(530) 752-8709; Fax (530) 752-5680
Inspection ServicesShipping Point Inspection
3120 Freeboard Drive, Suite 110West Sacramento, CA 95691(916) 371-8063; Fax (916) 371-8073
State of ArizonaPlant Health and Pest Prevention ServicesIntegrated Pest Control
3645 East Chipman RoadPhoenix, AZ 85040(602) 379-6918; Fax (602) 379-4794
State of HawaiiPlant Health and Pest Prevention ServicesPest Detection/Emergency Projects
Hawaii Fruit Fly Rearing Facility41-650 Waikupanaha StreetWaimanalo, HI 96795(808) 259-6677; Fax (808) 259-5196
State of OregonPlant Health and Pest Prevention ServicesPest Exclusion – Agricultural Inspection Station
18071 Highway 199O’Brien, OR 97534(541) 596-2119
Ag AlertCalifornia Farm Bureau Federation2300 River Plaza DriveSacramento, CA 95833(916) 561-5570; Fax (916) 561-5695E-mail: [email protected]
Agribusiness Dairyman612 N StreetSanger, CA 93657-0669(559) 875-4585: Fax (559) 875-4587E-mail: [email protected]
Agribusiness Fresh Fruit and Raisin News612 N StreetSanger, CA 93657(559) 875-4585; Fax (559) 875-4587E-mail: [email protected]
Almond FactsBlue Diamond Growers1802 C StreetSacramento, CA 95814(916) 442-0771; Fax (916) 325-2880www.bluediamond.com
American Small Farm MagazineMeister Media Worldwide3509 Coffee Road, Suite D-18Modesto, CA 95355(209) 573-8740; Fax (209) 577-2737E-mail: [email protected]
American Vegetable GrowerMeister Media Worldwide3509 Coffee Road, Suite D-18Modesto, CA 95355(209) 573-8740; Fax (209) 577-2737E-mail: [email protected]
American Vineyard MagazineMalcolm Media-Ag PublishingPost Office Box 626Clovis, CA 93613-0626(559) 298-6020; Fax (559) 323-6016E-mail: [email protected]
California Agricultural TechnologyInstitute Update
California State University, Fresno2910 East Barstow Avenue, M/S 115Fresno, CA 93740-8009(559) 278-2361; Fax (559) 278-4849http://cati.csufresno.edu
California Agriculture1111 Franklin Street, 6th FloorOakland, CA 94607(510) 987-0044; Fax (510) 465-2659E-mail: [email protected]://danr.ucop.edu//calag
Agricultural Publications

140 California Agricultural Resource Directory 2006
California Cattleman Magazine1221 H StreetSacramento, CA 95814(916) 444-0845; Fax (916) 444-2194www.calcattlemen.org
California Country MagazineCalifornia Farm Bureau Federation2300 River Plaza DriveSacramento, CA 95833(916) 561-5550; Fax (916) 561-5695www.cfbf.com
California Country TelevisionCalifornia Farm Bureau Federation2300 River Plaza DriveSacramento, CA 95833(916) 561-5550; Fax (916) 561-5695www.cfbf.com
California Dairy MagazineMalcolm Media-Ag PublishingPost Office Box 626Clovis, CA 93613-0626(559) 298-6020; Fax (559) 323-6016E-mail: [email protected]
California Farmer1355 Willow Way, Suite 260Concord, CA 94520-5208(925) 687-1662; Fax (925) 687-4945http://californiafarmer.com
California ForestsCalifornia Forestry Association1215 K Street, Suite 1830Sacramento, CA 95814(916) 444-6592; Fax (916) 444-0170www.foresthealth.org
California Grange News2101 Stockton BoulevardSacramento, CA 95817-1336(916) 454-5805; Fax (916) 739-8189www.grange.org
California HeartlandPost Office Box 6Sacramento, CA 95812(916) 929-5843; Fax (916) 929-4342www.californiaheartland.org
California Tomato GrowerCalifornia Tomato Growers Association10730 Siskiyou LaneStockton, CA 95267-0398(209) 478-1761; Fax (209) 478-9460www.ctga.org
California WheatCalifornia Wheat Commission1240 Commerce Avenue, Suite AWoodland, CA 95776-2267(530) 661-1292; Fax (530) 661-1332E-mail: [email protected]
Central Valley FarmerMalcolm Media-Ag PublishingPost Office Box 626Clovis, CA 93613-0626(559) 298-6020; Fax (559) 323-6016E-mail: [email protected]
Cotton GrowerMeister Media Worldwide3509 Coffee Road, Suite D-18Modesto, CA 95355(209) 573-8740; Fax (209) 577-2737E-mail: [email protected]
CropLifeMeister Media Worldwide3509 Coffee Road, Suite D-18Modesto, CA 95355(209) 573-8740; Fax (209) 577-2737E-mail: [email protected]
On The DeckCalifornia Agricultural Aircraft Association1404B Flightline DriveLincoln, CA 95648(916) 645-9747; Fax (916) 645-9749E-mail: [email protected]
Pacific Coast Nurseryman Magazine105 North Vermont AvenueGlendora, CA 91741(800) 577-5225; Fax (626) 914-3751E-mail: [email protected]
Pacific Nut Producer MagazineMalcolm Media-Ag PublishingPost Office Box 626Clovis, CA 93613-0626(559) 298-6020; Fax (559) 323-6016E-mail: [email protected]
The Packer10901 West 84th TerraceLenexa, KS 66214(913) 438-0768; Fax (913) 438-0691E-mail: [email protected]
Peach FuzzCalifornia Canning Peach Association2300 River Plaza Drive, Suite 110Sacramento, CA 95833(916) 925-9131; Fax (916) 925-9030E-mail: [email protected]/PeachFuzz.asp
Plum Good NewsCalifornia Dried Plum Board3840 Rosin Court Suite 170Sacramento, CA 95834(916) 565-6232; Fax (916) 565-6237E-mail: [email protected]
Small Farm NewsSmall Farm CenterUniversity of California1 Shields AvenueDavis, CA 95616-8699(530) 752-8136; Fax (530) 752-7716E-mail [email protected]
Valley Grower Magazine205 North 8th StreetEl Centro, CA 92243(760) 352-5555; Fax (760) 352-6300
Vegetables West MagazineMalcolm Media-Ag PublishingPost Office Box 626Clovis, CA 93613-0626(559) 298-6020; Fax (559) 323-6016E-mail: [email protected]
Western Dairy Business MagazineMulti AgMedia4500 South Laspina Street, Suite 218Tulare, CA 93274(559) 687-3160; Fax (559) 687-3166E-mail [email protected]
Western Farm PressPrimMedia Post Office Box 2100Skokie, IL 60076-7800(866) 505-7173; Fax (847) 763-9682E-mail [email protected]
Western Fruit GrowerMeister Media Worldwide3509 Coffee Road, Suite D-18Modesto, CA 95355(209) 573-8740; Fax (209) 577-2737E-mail: [email protected]
Western Grower and ShipperWestern Growers AssociationPost Office Box 2130Newport Beach, CA 92658(949) 863-1000; Fax (949) 863-9028www.wga.com
Wines and Vines1800 Lincoln AvenueSan Rafael, CA 94901-1298(415) 453-9700; Fax (415) 453-2517E-mail: [email protected]
Agricultural Publications

California Agricultural Resource Directory 2006 141
CALIFORNIA ADVISORY BOARDS AND COMMISSIONS
AlfalfaAlfalfa Seed Production Research Board
531-D North Alta AvenueDinuba, CA 93618(559) 591-4792; Fax (559) 591-5744E-mail: [email protected]
ApplesCalifornia Apple Commission
770 East Shaw, Suite 220Fresno, CA 93710(559) 225 3000; Fax (559) 225-3111www.calapple.org
ArtichokesCalifornia Artichoke Advisory Board
Post Office Box 747Castroville, CA 95012(831) 633-4411; Fax (831) 633-0215www.artichokes.org
AsparagusCalifornia Asparagus Commission
311 East Main Street, Suite 204Stockton, CA 95202(209) 474-7581; Fax (209) 474-9105www.calasparagus.com
AvocadosCalifornia Avocado Commission
38 Discovery, Suite 150Irvine, CA 92618(949) 341-1955; Fax (949) 341-1970www.avocado.org
BeansDry Bean Advisory Board
531-D North Alta AvenueDinuba, CA 93618(559) 591-4866; Fax (559) 591-5744www.calbeans.com
BeefCalifornia Beef Council
4640 Northgate Boulevard, Suite 115Sacramento, CA 95834(916) 925-2333; Fax (916) 925-8155www.calbeef.org
Buy CaliforniaBuy California Marketing Agreement
1521 I StreetSacramento, CA 95814(916) 441-5302www.californiagrown.org
CarrotsCalifornia Fresh Carrot Advisory Board
531-D North Alta AvenueDinuba, CA 93618(559) 591-5675; Fax (559) 591-5744E-mail: [email protected]
CeleryCalifornia Celery Research Advisory Board
531-D North Alta AvenueDinuba, CA 93618(559) 591-0434; Fax (559) 591-5744E-mail: [email protected]
CherriesCalifornia Cherry Advisory Board
Post Office Box 877Lodi, CA 95241(209) 368-0685; Fax (209) 368-4309www.calcherry.com
CitrusCitrus Research Board
531-D North Alta AvenueDinuba, CA 93618(559) 591-4866; Fax (559) 591-9005www.citrusresearch.com
Dairy ProductsCalifornia Manufacturing Milk Advisory Board
3800 Cornucopia Way, Suite DModesto, CA 95358(209) 525-6875; Fax (209) 525-6899
California Milk Processor Advisory Board1801A Fourth StreetBerkeley, CA 94710(510) 883-1085; Fax (510) 883-1088www.gotmilk.com
California Milk Producers Advisory Board400 Oyster Point Boulevard, Suite 211South San Francisco, CA 94080(650) 871-6455; Fax (650) 583-7328www.realcaliforniacheese.com
Dairy Council of California1101 National Drive, Suite BSacramento, CA 95834(916) 263-3560; Fax (916) 263-3566www.dairycouncilofca.org
DatesCalifornia Date Commission
Post Office Box 1736Indio, CA 92202-1736(760) 347-4510; Fax (760) 347-6374E-mail: [email protected]
FigsCalifornia Fig Advisory Board
7395 North Palm Bluffs, Suite 106Fresno, CA 93711(559) 440-5400; Fax (559) 438-5405www.californiafigs.com
FlowersCalifornia Cut Flower Commission
820 Bay AvenueCapitola, CA 95010(831) 462-8035; Fax (831) 462-8040www.ccfc.org.
Forest ProductsCalifornia Forest Products Commission
853 Lincoln Way, Suite 208Auburn, CA 95603(530) 823-2363; Fax (530) 823-1850www.calforests.org
Garlic and OnionsCalifornia Garlic and Onion DehydratorAdvisory Board
Post Office Box 470Stockton, CA 95201(209) 466-8247; Fax (209) 941-2719
California Garlic and Onion Research Board
1629 Pollasky Avenue, Suite 111Clovis, CA 93612(559) 297-9322; Fax (559) 297-9341
GrapesCalifornia Grape Rootstock ImprovementCommission
1521 I StreetSacramento, CA 95814(916) 441-2031; Fax (916) 446-1063
California Table Grape Commission392 West Fallbrook, Suite 101Fresno, CA 93711-6150(559) 447-8350; Fax (559) 447-9184www.freshcaliforniagrapes.com
California Advisory Boards and Commissions

142 California Agricultural Resource Directory 2006
Lake County Winegrape CommissionPost Office Box 877Lakeport, CA 95453(707) 995-3421; Fax (707) 995-3618www.lakecountywinegrape.org
Lodi-Woodbridge Winegrape Commission2545 West Turner RoadLodi, CA 95242(209) 367-4727; Fax (209) 367-0737www.lodiwine.com
Winegrape Inspection Marketing Program531-D North Alta AvenueDinuba, CA 93618(559) 591-4862; Fax (559) 591-5744
KiwifruitCalifornia Kiwifruit Commission
770 East Shaw, Suite 220Fresno, CA 93710(559) 226-4780www.kiwifruit.org
LettuceCalifornia Lettuce Research Program
512 Pajaro StreetSalinas, CA 93901(831) 424-3782; Fax (831) 424-3785www.calettuceresearchboard.org
MelonsCalifornia Cantaloupe Advisory Board
531-D North Alta AvenueDinuba, CA 93618(559) 591-5715; Fax (559) 591-5744E-mail: [email protected]
California Melon Research Board531-D North Alta AvenueDinuba, CA 93618(559) 591-0435; Fax (559) 591-5744E-mail: Jerry @tabcomp.com
NutsCalifornia Pistachio Commission
1318 East Shaw Avenue, Suite 420Fresno, CA 93710(559) 221-8294; Fax (559) 221-8044www.pistachios.org
California Walnut Commission1540 River Park Drive, Suite 203Sacramento, CA 95815(916) 646-3807; Fax (916) 923-2548www.walnuts.org
PeachesCalifornia Cling Peach Board
531-D North Alta AvenueDinuba, CA 93618-3202(559) 595-1425; Fax (559) 591-5744www.calclingpeach.com
Peaches, Plums and NectarinesCalifornia Tree Fruit Agreement
Post Office Box 968Reedley, CA 93654-0968(559) 638-8260; Fax (559) 638-8842www.eatcaliforniafruit.com
PearsCalifornia Pear Advisory Board
1521 I StreetSacramento, CA 95814(916) 441-0432; Fax (916) 446-1063www.calpear.com
PeppersCalifornia Pepper Commission
531-D North Alta AvenueDinuba, CA 93618(559) 591-3925; Fax (559) 591-5744E-mail: [email protected]
Plums, DriedCalifornia Dried Plum Board
3840 Rosin Court, Suite 170Sacramento, CA 95834-1929(916) 565-6232; Fax (916) 565-6237www.californiadriedplums.org
PotatoesCalifornia Potato Research Advisory Board
531-D North Alta AvenueDinuba, CA 93618(559) 591-0436; Fax (559) 591-5744E-mail: [email protected]
RaisinsCalifornia Raisin Marketing Board
3445 North First Street, Suite 101Fresno, CA 93726(559) 248-0287; Fax (559) 224-7016www.calraisins.org
RiceCalifornia Rice Commission
8801 Folsom Boulevard, Suite 172 Sacramento, CA 95826(916) 387-2264; Fax (916) 387-2265www.calrice.org
California Rice Research BoardPost Office Box 507Yuba City, CA 95992(530) 673-6247; Fax (530) 674-0426www.carrb.com
California Wild Rice Advisory Board3539 Bradshaw Road, Suite B 212Sacramento, CA 95827-3304(916) 638-8980; Fax (916) 638-8993www.cawildrice.com
SeafoodCalifornia Salmon Council
Post Office 2255Folsom, CA 95763-2255(916) 933-7050; Fax (916) 933-7055www.calkingsalmon.org
California Sea Urchin Commission1621-B 13th StreetSacramento, CA 95814(916) 444-8194; Fax (916) 444-8195E-mail: [email protected]
SeedCalifornia Seed Advisory Board
c/o California Department of Food andAgriculture1220 N Street, Room A-372Sacramento, CA 95814(916) 654-0493; Fax (916) 654-0986
SheepCalifornia Sheep Commission
Post Office Box 1520Folsom, CA 95763-1520(916) 933-7667; Fax (916) 933-7055www.californialamb.com
StrawberriesCalifornia Strawberry Commission
Post Office 269Watsonville, CA 95077-0269(831) 724-1301; Fax (831) 724-5973www.calstrawberry.com
Processing Strawberry Advisory BoardPost Office Box 929Watsonville, CA 95077-0929(831) 724-5454; Fax (831) 724-0295
TomatoesCalifornia Tomato Commission
1625 East Shaw Avenue, Suite 106Fresno, CA 93710(559) 230-0116; Fax (559) 230-0635www.tomato.org
Processing Tomato Advisory BoardPost Office Box 1800Davis, CA 95617-7504(530) 759-7501; Fax (530) 759-7504www.ptab.org
WheatCalifornia Wheat Commission
1240 Commerce Avenue, Suite AWoodland, CA 95776-2267(530) 661-1292; Fax (530) 661-1332www.californiawheat.org
California Advisory Boards and Commissions

California Agricultural Resource Directory 2006 143
CALIFORNIA AGRICULTURAL ORGANIZATIONS
GeneralAfrican American Farmers of California
Post Office Box 12464Fresno, CA 93778-2464(559) 442-0276E-mail: [email protected]
Ag Against Hunger1355 Abbott Street, Suite 206Salinas, CA 93901(831) 755-1480; Fax (831) 755-1484www.agagainsthunger.org
AgFresno Farm Equipment Show1121 South Chance AvenueFresno, CA 93702(559) 650-FAIR; Fax (559) 650-3226www.fresnofair.com
Agricultural Council of California1225 H StreetSacramento, CA 95814-1910(916) 443-4887; Fax (916) 443-0601www.agcouncil.org
Agricultural Crime TechnologyInformation and Operations Network(ACTION Project)
701 West Center StreetVisalia, CA 93291(559) 624-1054; Fax (559) 624-1077www.agcrime.org
Agricultural Energy Consumers Association925 L Street, Suite 800Sacramento, CA 95814(916) 447-6206; Fax (916) 441-4132www.aecaonline.com
AgSafePost Office Box 614Clovis, CA 93613 (559) 278-4404; Fax (559) 278-7035www.agsafe.org
AgTac-Southern California Edison4175 South Laspina StreetTulare, CA 93274(800) 77AGTAC; Fax (559) 625-7188www.sce.com
Alliance for Alternative Agriculture1840 Biddle Ranch RoadSan Luis Obispo, CA 93401(805) 594-1700; Fax (805) 594-1808www.pacificaggroup.com
Alliance for Food and FarmingPost Office Box 2747Watsonville, CA 95077(831) 786-1666; Fax (831) 786-1668www.foodandfarming.info
Association of Applied IPM EcologistsPost Office Box 10880Napa, CA 94581(707) 265-9349www.aaie.net
Association of Natural Biocontrol Producers
2230 Martin DriveTustin Ranch, CA 92782(714) 544-8295www.anbp.org
California Agricultural Aircraft Association1404 B Flightline DriveLincoln, CA 95648(916) 645-9747; Fax (916) 645-9749www.caaa.net
California Agricultural Commissionersand Sealers Association
142 Garden HighwayYuba City, 95991-5512(530) 822-7500; Fax (530) 822-7510www.cacasa.org
California Agricultural Leadership Foundation
1300 National Drive, Suite 180Sacramento, CA 95834(916) 928-2202; Fax (916) 928-2206www.agleaders.org
California Agricultural Teachers’ Association
Post Office Box 834 Elk Grove, CA 95624(916) 714-2970; Fax (916) 714-2973www.calagteachers.org
California Association of Farm Advisorsand Specialists
2145 Wardrobe AvenueMerced, CA 95340-6496(209) 385-7403E-mail: [email protected]
California Association of Pest Control Advisors
1143 North Market Boulevard, Suite 7Sacramento, CA 95834(916) 928-1625; Fax (916) 928-0705www.capca.com
California Biomass Energy Alliance3379 Somis BoulevardSomis, CA 93066(805) 386-4343; Fax (805) 386-4388www.calbiomass.org
California Certified Crop Advisors1143 North Market Boulevard, Suite 7Sacramento, CA 95834(916) 928-1625; Fax (916) 928-0705www.cacca.org
California Certified Organic Farmers1115 Mission StreetSanta Cruz, CA 95060(831) 423-2263; Fax (831) 423-4528www.ccof.org
California Chamber of CommercePost Office Box 1736Sacramento, CA 95812-1736(916) 444-6670; Fax (916) 352-1272www.calchamber.com
California Farm Bureau Federation2300 River Plaza DriveSacramento, CA 95833(916) 561-5500; Fax (916) 561-5699www.cfbf.com
California Farmers Union2881 Geer Road, Suite DTurlock, CA 95382(209) 632-0381; Fax (209) 632-5262www.calfu.org
California FarmLinkPost Office Box 2224Sebastopol, CA 95473(707) 829-1691; Fax (707) 829-1693www.californiafarmlink.org
California Fertilizer Association4460 Duckhorn Drive, Suite ASacramento, CA 95834(916) 574-9744; Fax (916) 574-9484www.calfertilizer.org
California Foundation for Agriculturein the Classroom
2300 River Plaza DriveSacramento, CA 95833-3293(916) 561-5625; Fax (916) 561-5697www.cfaitc.org
California Future Farmers of America Foundation
Post Office Box 834Elk Grove, CA 95759-0834(916) 714-2970; Fax (916) 714-2973www.caffafoundation.com
California Grower Foundation176 Main Street, Suite CSt. Helena, CA 94574(707) 963-7191; Fax (707) 963-5728E-mail: [email protected]
California Agricultural Organizations

144 California Agricultural Resource Directory 2006
California HeartlandPost Office Box 6Sacramento, CA 95812(916) 929-5843; Fax (916) 929-4342www.californiaheartland.org
California Institute for Rural Studies221 G Street, Suite 204Davis, CA 95616(530) 756-6555; Fax (530) 756-7429www.cirsinc.org
California Invasive Plant Council1442-A Walnut Street, Suite 462Berkeley, CA 94709(510) 843-3902; Fax (510) 217-3500www.cal-ipc.org
California League of Food Processors980 Ninth Street, Suite 230Sacramento, CA 95814(916) 444-9260; Fax (916) 444-2746www.clfp.com
California Minor Crops Council4500 South Laspina Street, Suite 214Tulare, CA 93274(559) 688-5700; Fax (559) 688-5527www.minorcrops.org
California State Grange2101 Stockton BoulevardSacramento, CA 95817(916) 454-5805; Fax (916) 739-8189www.californiagrange.org
California Weed Science SocietyPost Office Box 3073Salinas, CA 93919-3073(831) 442-0883www.cwss.org
California Women for AgriculturePost Office Box 2185Merced, CA 95344(559) 237-2474; Fax (559) 237-4929www.cawomen4ag.com
Center for Urban Education aboutSustainable Agriculture
One Ferry Building, Suite 50San Francisco, CA 94111(415) 291-FARM; Fax (415) 291-3275www.cuesa.org
Colusa Farm Show1303 Tenth StreetColusa, CA 95932(530) 458-2641; Fax (530) 458-2645www.thefarmshow.com
Commonwealth Club of California595 Market StreetSan Francisco, CA 94105(415) 597-6700; Fax (415) 597-6729www.commonwealthclub.org
Community Alliance with Family FarmersPost Office Box 363Davis, CA 95617(530) 756-8518; Fax (530) 756-7857www.caff.org
Crime and Violence Prevention CenterCalifornia Attorney General’s Office1300 I Street, Suite 1120Sacramento, CA 95814(916) 324-7863; Fax (916) 327-2384www.safestate.org
Ecological Farming Association406 Main Street, Suite 313Watsonville, CA 95076(831) 763-2111; Fax (831) 763-2112www.eco-farm.org
Far West Equipment Dealers Association2355 North Lincoln StreetDixon, CA 95620-9215(707) 678-8859; Fax (707) 678-0125www.fweda.com
Farm Safety 4 Just Kids1201 L StreetModesto, CA 95354(209) 552-7278; Fax (209) 521-9938www.fs4jk.org
Fresh Produce and Floral Council16700 Valley View Avenue, Suite 130La Mirada, CA 90638(714) 739-0177; Fax (714) 739-0226www.fpfc.org
Fresno Chamber of Commerce2331 Fresno StreetFresno, CA 93721(559) 495-4800; Fax (559) 495-4811www.fresnochamber.com
Great Valley Center201 Needham StreetModesto, CA 95354(209) 522-5103; Fax (209) 522-5116www.greatvalley.org
Heidrick Ag History Center1962 Hays LaneWoodland, CA 95776(530) 666-9700; Fax (530) 666-9712www.aghistory.org
Hmong American Community, Inc.1044 Fulton Mall, Suite 207Fresno, CA 93721(559) 237-4919; Fax (559) 237-5905http://lennon.pub.csufresno.edu/~vl059/
pheng.html
Independent Growers’ Association33 El Camino RealGreenfield, CA 93927(831) 674-5547; Fax (831) 674-3835
International Agri-Center, Inc.Post Office Box 1475Tulare, CA 93275-1475(559) 688-1751; Fax (559) 686-5065www.farmshow.org/Agricenter
Los Angeles Area Chamberof Commerce
350 South Bixel StreetLos Angeles, CA 90017(213) 580-7500; Fax (213) 580-7511www.lachamber.org
Madera District Chamber of Commerce120 North E StreetMadera, CA 93638(559) 673-3563; Fax (559) 673-5009www.maderachamber.com
Marin Agricultural Land TrustPost Office Box 809Point Reyes Station, CA 94956(415) 663-1158; Fax (415) 663-1099www.malt.org
Modesto Chamber of CommercePost Office Box 844Modesto, CA 95353(209) 577-5757; Fax (209) 577-2673www.modchamber.org
Multinational Exchange for SustainableAgriculture, Inc.
5245 College Avenue, Suite 508Oakland, CA 94618(510) 654-8858 Fax; (603) 699-2459www.mesaprogram.org
Organic Farming Research FoundationPost Office Box 440Santa Cruz, CA 95061(831) 426-6606; Fax (831) 426-6670www.ofrf.org
Pacific Coast Producers631 North Cluff AvenueLodi, CA 95241-1600(209) 367-8800; Fax (209) 367-1084www.pcoastp.com
Pesticide Applicators Professional Association
Post Office Box 80095Salinas, CA 93912-0095(831) 442-3536; Fax (831) 442-2351www.papaseminars.com
Stockton Ag Expoc/o Greater Stockton Chamber of Commerce
445 West Weber, Suite 220Stockton, CA 95203(209) 547-2770; Fax (209) 466-5271www.stocktonchamber.org
California Agricultural Organizations

California Agricultural Resource Directory 2006 145
Sustainable Conservation98 Battery Street, Suite 302San Francisco, CA 94111(415) 977-0380; Fax (415) 977-0381www.suscon.org
Tulelake Growers AssociationPost Office Box 338Tulelake, CA 96134(530) 667-5214; Fax (530) 667-3919E-mail: [email protected]
United Agribusiness League54 Corporate ParkIrvine, CA 92606-5105(800) 223-4590; Fax (949) 975-1671www.ual.org
United Fresh Fruit and Vegetable Association
Western Regional Office512 Pajaro StreetSalinas, CA 93901(831) 422-0940; Fax (831) 422-2892www.uffva.org
Ventura County Agricultural Association916 West Ventura BoulevardCamarillo, CA 93010(805) 388-2727; Fax (805) 388-2767E-mail: [email protected]
Western Fairs Association1776 Tribute Road, Suite 210Sacramento, CA 95815-4495(916) 927-3100; Fax (916) 927-6397www.fairsnet.org
Western Growers AssociationPost Office Box 2130Newport Beach, CA 92658(949) 863-1000; Fax (949) 863-9028www.wga.com
Western Plant Health Association4460 Duckhorn Avenue, Suite ASacramento, CA 95834(916) 574-9794; Fax (916) 574-9484www.cpha.net
World Ag ExpoPost Office Box 1475Tulare, CA 93275-1475(559) 688-1751; Fax (559) 686-5065www.worldagexpo.com
Animals and LivestockGeneralAll West/Select Sires
Post Office Box 1803Turlock, CA 95381(800) 278-8254; Fax (209) 667-8379www.allwestselectsires.com
California Animal Nutrition Conference1521 I StreetSacramento, CA 95814(916) 441-2272; Fax (916) 446-1063www.cgfa.org
California Association of Meat ProcessorsPost Office Box 201Penryn, CA 95663(916) 660-0598E-mail: [email protected]
California Veterinary Medical Association1400 River Park Drive, Suite 100Sacramento, CA 95815(916) 649-0599; Fax (916) 646-9156www.cvma.net
Pacific Coast Renderers AssociationPost Office Box 2415San Francisco, CA 94126(415) 441-2121; Fax (415) 441-2221
Producers Livestock Marketing AssociationPost Office Box 510Madera, CA 93639(559) 674-4674; Fax (559) 674-8351www.producerslivestock.com
Bees and HoneyCalifornia State Beekeepers Association
7220 East Grayson RoadHughson, CA 95326(209) 667-4590; Fax (530) 663-4789www.californiastatebeekeepers.com
Western Apicultural Society of North America
Department of EntomologyUniversity of CaliforniaDavis, CA 95616(530) 752-0472; Fax (530) 754-7757E-mail: [email protected]
CattleCalifornia Beef Cattle Improvement Association
52795 Netherlands AvenueClarksburg, CA 95612(916) 744-1214; Fax (916) 744-1179www.calcattlemen.org/cbcia
California Beef Council4640 Northgate Boulevard, Suite 115Sacramento, CA 95834(916) 925-BEEF; Fax (916) 925-8155www.calbeef.org
California Cattlemen’s Association1221 H StreetSacramento, CA 95814-1910(916) 444-0845; Fax (916) 444-2194www.calcattlemen.org
California-Nevada Polled Hereford Association
8500 Rock Springs RoadPenryn, CA 95663(916) 663-1142; Fax (916) 663-4141www.californiapolledhereford.com
Western Brahman Breeders AssociationPost Office Box 2542Turlock, CA 95381(209) 667-2321; Fax (209) 667-5572
DairyAlliance of Western Milk Producers
1225 H Street, Suite 102Sacramento, CA 95814(916) 447-9941; Fax (916) 447-9942E-mail: [email protected]
California Cheese and Butter Association1011 Pebble Beach DriveClayton, CA 94517(925) 672-8255; Fax (925) 673-0268www.cacheeseandbutter.org
California Creamery Operator’s Association, Inc.
313 Casa Linda DriveWoodland, CA 95695(530) 662-1228; Fax (805) 781-9659www.ccoadairy.org
California Dairies, Inc.2000 North Plaza DriveVisalia, CA 93291(559) 625-2200; Fax (559) 625-5433www.californiadairies.com
California Dairy CampaignPost Office Box 2044Turlock, CA 95381(209) 632-0885; Fax (209) 632-0706www.californiadairycampaign.com
California Dairy Research Foundation502 Mace Boulevard, Suite 12Davis, CA 95616(530) 753-0681; Fax (530) 753-1453www.cdrf.org
California Jersey Cattle Association1005 Hultberg RoadHilmar, CA 95324(209) 668-4045; Fax (209) 632-1292
Challenge Dairy Products, Inc.Post Office Box 2369Dublin, CA 94568(800) 73DAIRY; Fax (925) 828-4016www.challengedairy.com
Dairy Council of California1101 National Drive, Suite BSacramento, CA 95834-1901(877) 324-7901; Fax (916) 263-3566www.dairycouncilofca.org
California Agricultural Organizations

146 California Agricultural Resource Directory 2006
Dairy Institute of California1127 Eleventh Street, Suite 718Sacramento, CA 95814(916) 441-6921; Fax (916) 441-0802www.dairyinstitute.org
Dairyman’s Cooperative CreameryAssociation, Land O’Lakes, Inc.
4974 East Clinton Way, Building C221Fresno, CA 93727(800) 722-3110; Fax (559) 251-1078www.dairyamerica.com
Humboldt Creamery Association572 Highway 1Fortuna, CA 95540-9711(707) 725-6182; Fax (707) 725-6186www.humboldtcreamery.com
Milk Producers Council5370 Schaefer Avenue, Suite AChino, CA 91710(909) 628-6018; Fax (909) 591-7328E-mail: [email protected]
Western United Dairymen1315 K StreetModesto, CA 95354(209) 527-6453; Fax (209) 527-0630www.westernuniteddairymen.com
Dairy Herd ImprovementAssociationsCalifornia Dairy Herd Improvement
150 Clovis Avenue, Suite 102Clovis, CA 93612(559) 323-2600; Fax (559) 323-2603www.cdhia.org
Arcata Dairy Herd Improvement2126 Mad River RoadArcata, CA 95521(707) 822-0140
Central Counties Dairy Herd Improvement241 Business Park WayAtwater, CA 95301(209) 356-0355; Fax (209) 356-0103
Del Norte Dairy Herd ImprovementPost Office Box 266Smith River, CA 95567(707) 487-3843
Fresno Dairy Herd Improvement2563 South Sarah AvenueFresno, CA 93706(559) 233-7133; Fax (559) 233-0732
Kings Dairy Herd Improvement126 South 10th AvenueHanford, CA 93230(559) 582-2010; Fax (559) 582-0407
North Bay Dairy Herd Improvement5609 Verni RoadSebastopol, CA 95472(707) 823-5135
Southern Counties Dairy Herd Improvement
7000 Merrill Avenue, Box 10, Building 4Chino, CA 91710(909) 597-2111; Fax (909) 597-3926
EquineCalifornia Dressage Society
Post Office Box 417Carmel Valley, CA 93924(831) 659-5696; Fax (831) 659-2383www.california-dressage.org
California Harness Horse Breeders Association
Post Office Box 254767Sacramento, CA 95865-4767(916) 263-7888; Fax (916) 263-7887http://chhaonline.com
California Horse Racing Board1010 Hurley Way, Suite 300Sacramento, CA 95825(916) 263-6000; Fax (916) 263-6042www.chrb.ca.gov
California Reining Horse Association21900 Dunlap DrivePerris, CA 92571(951) 928-5378; Fax (951) 928-5887www.calreining.com
California State Horsemen’s AssociationPost Office Box 1228Clovis, CA 93613(559) 325-1055; Fax (559) 325-1056www.californiastatehorsemen.com
California Thoroughbred Breeders Association
Post Office Box 60018Arcadia, CA 91066-6018(800) 573-2822; Fax (626) 574-0852www.ctba.com
Pacific Coast Quarter Horse Association560 Wall Street, Suite AAuburn, CA 95603(530) 823-5991; Fax (530) 823-6653www.pcqha.com
West Coast Reining Horse Association 11525 Bruceville RoadElk Grove, CA 95758(916) 684-2555; Fax (916) 684-5401www.wcrha.com
FishCalifornia Aquaculture Association
3700 Chaney CourtCarmichael, CA 95608(916) 944-7315; Fax (916) 944-2256www.caa-aqua.org
California Fisheries and Seafood Institute1521 I StreetSacramento, CA 95814(916) 441-5560; Fax (916) 446-1063www.calseafood.net
California Salmon CouncilPost Office 2255Folsom, CA 95763-2255(916) 933-7050; Fax (916) 933-7055www.calkingsalmon.org
Fisherman’s Marketing Association320 Second Street, Suite 2BEureka, CA 95501(707) 442-3789; Fax (707) 442-9166www.trawl.org
HogsCalifornia Pork Producers Association
1225 H Street, Suite 106Sacramento, CA 95814-1910(916) 447-8950; Fax (916) 443-1506E-mail: [email protected]
LlamasCalifornia International Llama Association
1188 Olive StreetSonora, CA 95370(209) 533-4403E-mail: [email protected]
Ostriches and EmusAustralian Legacy
27398 Road 108Visalia, CA 93277(559) 734-3687; Fax (559) 627-3298www.australianlegacy.com
Poultry And EggsCalifornia Poultry Federation
3117-A McHenry AvenueModesto, CA 95350(209) 576-6355; Fax (209) 576-6119www.cpif.org
Pacific Egg and Poultry Association1521 I StreetSacramento, CA 95814(916) 441-0801; Fax (916) 446-1063www.pacificegg.org
Squab Producers of California409 Primo WayModesto, CA 95358(209) 537-4744; Fax (209) 537-2037www.squab.com
California Agricultural Organizations

California Agricultural Resource Directory 2006 147
SheepCalifornia Wool Growers Association
1225 H Street, Suite 101Sacramento, CA 95814-1910(916) 444-8122; Fax (916) 443-0601www.woolgrowers.org
Cal-Wool Marketing AssociationPost Office Box 1108Stockton, CA 95201(209) 466-6866; Fax (209) 466-4439
Field CropsAlfalfa And HayCalifornia Grain and Feed Association
1521 I StreetSacramento, CA 95814(916) 441-2272; Fax (916) 446-1063www.cgfa.org
San Joaquin Valley Hay Growers Association
5055 West Eleventh StreetTracy, CA 95304(209) 835-1662; Fax (209) 835-0719E-mail: [email protected]
BeansCal-Bean and Grain Cooperative
Drawer DPixley, CA 93256(559) 757-3581; Fax (559) 757-1324E-mail: [email protected]
California Bean Shippers Association1521 I StreetSacramento, CA 95814(916) 441-2514; Fax (916) 446-1063www.calbeanshippers.org
CottonCalcot, Ltd.
Post Office Box 259Bakersfield, CA 93302-0259(661) 327-5961; Fax (661) 861-9870www.calcot.com
California Cotton Ginners and GrowersAssociations
1947 North Gateway Boulevard, Suite 101Fresno, CA 93727(559) 252-0684; Fax (559) 252-0551www.ccgga.org
California Planting Cotton SeedDistributors
Post Office Box 80357Bakersfield, CA 93380-0357(661) 399-1400; Fax (661) 399-3169www.cpcsd.com
Mid-Valley Cotton GrowersPost Office Box 901Tulare, CA 93275(559) 686-2823; Fax (559) 685-1550www.midvalleycottongrowers.com
GrainCalifornia Association of Wheat Growers
1521 I StreetSacramento, CA 95814(916) 492-7066; Fax (916) 446-1063E-mail: [email protected]
California Grain and Feed Association1521 I StreetSacramento, CA 95814(916) 441-2272; Fax (916) 446-1063www.cgfa.org
Imperial Grain GrowersPost Office Box 184Brawley, CA 92227(760) 344-0420; Fax (760) 344-1309
Newell Grain Growers Association100 County Road 103Tulelake, CA 96134(530) 667-4190; Fax (530) 667-4845
San Luis Obispo County Farm BureauGrain Improvement Association
651 Tank Farm RoadSan Luis Obispo, CA 93401(805) 543-3654; Fax (805) 543-3697E-mail: [email protected]
RiceAssociated Rice Marketing Cooperative
Post Office Box 1180Durham, CA 95938(530) 898-1180; Fax (530) 898-1209
California Cooperative Rice ResearchFoundation, Rice Experiment Station
955 Butte City HighwayBiggs, CA 95917(530) 868-5481; Fax (530) 868-1730www.agronomy.ucdavis.edu/ricestation
California Rice Industry Association701 University Avenue, Suite 205Sacramento, CA 95825-6757(916) 929-3996; Fax (916) 929-0732
Farmers’ Rice CooperativePost Office Box 15223Sacramento, CA 95851-0223(916) 923-5100; Fax (916) 920-3321www.farmersrice.com
Rice Producers of CaliforniaPost Office Box 172Williams, CA 95987(530) 519-8628
SeedCalifornia Crop Improvement Association
Parsons Seed Certification CenterUniversity of California1 Shields AvenueDavis, CA 95616-8541(530) 752-0544; Fax (530) 752-4735http://ccia.ucdavis.edu
California Seed Association1521 I StreetSacramento, CA 95814(916) 441-2251; Fax (916) 446-1063www.calseed.org
Cal/West SeedsPost Office Box 1428Woodland, CA 95776(530) 666-3331; Fax (530) 666-5317www.calwestseeds.com
SugarC&H Sugar Company
830 Loring AvenueCrockett, CA 94525(510) 787-2121; Fax (510) 787-2058www.chsugar.com
California Beet Growers Association2 West Swain RoadStockton, CA 95207-4395(209) 477-5596; Fax (209) 477-1610E-mail: [email protected]
Floral and NurseryCalifornia Association of FlowerGrowers and Shippers
820 Bay Avenue, Suite 210Capitola, CA 95010(831) 479-4912; Fax (831) 479-4914
California Association of Nurseriesand Garden Centers
3947 Lennane Drive, Suite 150Sacramento, CA 95834(916) 928-3900; Fax (916) 567-0505www.cangc.org
California Flower Cooperative17098 El Rancho WaySalinas, CA 93907(831) 758-5553; Fax (831) 758-8640
California State Floral Association1521 I StreetSacramento, CA 95814(916) 448-5266; Fax (916) 446-1063www.calstatefloral.com
Forest ProductsAssociated California Loggers
555 Capitol Mall, Suite 745Sacramento, CA 95814(916) 441-7940; Fax (916) 441-7942www.calog.com
California Forestry Association1215 K Street, Suite 1830Sacramento, CA 95814(916) 444-6592; Fax (916) 444-0170www.foresthealth.org
California Agricultural Organizations

148 California Agricultural Resource Directory 2006
California Redwood Association405 Enfrente Drive, Suite 200Novato, CA 94949-7201(415) 382-0662; Fax (415) 382-8531www.calredwood.org
The Forest Foundation853 Lincoln Way, Suite 208Auburn, CA 95603(530) 823-3195; Fax (530) 823-1850www.calforestfoundation.org
Forest Landowners of California3550 Watt Avenue, Suite 140Sacramento, CA 95821(916) 972-0273; Fax (916) 979-7892www.forestlandowners.org
FruitsGeneralCalifornia Grape and Tree Fruit League
1540 East Shaw Avenue, Suite 120Fresno, CA 93710-8000(559) 226-6330; Fax (559) 222-8326www.cgtfl.com
California Rare Fruit Growers, Inc.Fullerton Arboretum-CSUFPost Office Box 6850Fullerton, CA 92834-6850www.crfg.org
California Tree Fruit AgreementPost Office Box 968Reedley, CA 93654-0968(559) 638-8260; Fax (559) 638-8842www.caltreefruit.com
Chilean Fresh Fruit Association601 University Avenue, Suite 275Sacramento, CA 95825(916) 927-1217; Fax (916) 927-1297www.cffa.org
Fruit Growers Laboratory853 Corporation StreetSanta Paula, CA 93060(805) 392-2000; Fax (805) 525-4172www.fglinc.com
ApplesApple Hill Growers
Post Office Box 494Camino, CA 95709(530) 644-7692; Fax (530) 644-7975www.applehill.com
ApricotsApricot Producers of California
Post Office Box 974Turlock, CA 95381(209) 632-9777; Fax (209) 632-9779www.apricotproducers.com
California Fresh Apricot Council19 Sherwood CourtSan Francisco, CA 94127(415) 584-4063; Fax (415) 584-3834www.califapricot.com
AvocadosCalifornia Avocado Society
Post Office Box 1317Carpinteria, CA 93014(805) 684-2804; Fax (805) 644-1184www.californiaavocadosociety.org
BerriesNaturipe Berry Growers, Inc.
Post Office Box 4280Salinas, CA 93912-4280(831) 722-2430; Fax (831) 728-9398www.naturipe.com
CherriesCalifornia Cherry Advisory Board
Post Office Box 877Lodi, CA 95241(209) 368-0685; Fax (209) 368-4309www.calcherry.com
CitrusCalifornia Citrus Mutual
512 North Kaweah AvenueExeter, CA 93221(559) 592-3790; Fax (559) 592-3798www.cacitrusmutual.com
California Citrus Quality Council210 Magnolia Avenue, Suite 3Auburn, CA 95603(530) 885-1894; Fax (530) 885-1546www.citrusresearch.com/ccqc
Sunkist GrowersPost Office Box 7888Van Nuys, CA 91409(818) 379-7340; Fax (818) 379-7492www.sunkist.com
Paramount Citrus Association36445 Road 172Visalia, CA 93292(559) 798-3171; Fax (559) 798-1033
Dried FruitsDried Fruit Association of California
710 Striker AvenueSacramento, CA 95834(916) 561-5900; Fax (916) 561-5906www.dfaofca.com
Raisin Administrative Committee3445 North First Street, Suite 101Fresno, CA 93726(559) 225-0520; Fax (559) 225-0652www.raisins.org
Raisin Bargaining Association1300 East Shaw Avenue, Suite 175Fresno, CA 93710-7902(559) 221-1925; Fax (559) 221-0725www.raisinbargaining.com
Sun-Maid Growers of California13525 South Bethel AvenueKingsburg, CA 93631(559) 896-8000; Fax (559) 897-6209www.sunmaid.com
Valley Fig Growers2028 South Third StreetFresno, CA 93702(559) 237-3893; Fax (559) 237-3898www.valleyfig.com
Dried PlumsPrune Bargaining Association
335 Teegarden Avenue, Suite BYuba City, CA 95991(530) 674-5636; Fax (530) 674-3804www.prunebargaining.com
Sunsweet Growers901 North Walton AvenueYuba City, CA 95993(530) 674-5010; Fax (530) 751-5238www.sunsweet.com
Grapes And WineAllied Grape Growers
3475 West Shaw Avenue, Suite 103Fresno, CA 93711(559) 276-7021; Fax (559) 276-7129www.alliedgrapegrowers.org
California Association of Winegrape Growers
601 University Avenue, Suite 135Sacramento, CA 95825(800) 241-1800; Fax (916) 924-5374www.cawg.org
Central Coast Wine Growers AssociationPost Office Box 1440Santa Maria, CA 93456-1440(805) 928-4950; Fax (805) 928-2201www.ccwga.org
Desert Grape Growers League of CaliforniaPost Office Box 70Thermal, CA 92274(760) 391-5488; Fax (760) 391-5489
Family Winemakers of California1400 K Street, Suite 304Sacramento, CA 95814(916) 498-7500; Fax (916) 498-7505www.familywinemakers.org
California Agricultural Organizations

California Agricultural Resource Directory 2006 149
Napa Valley Vintners AssociationPost Office Box 141St. Helena, CA 94574(707) 963-3388; Fax (707) 963-3488www.napavintners.com
Wine Institute425 Market Street, Suite 1000San Francisco, CA 94105(415) 512-0151; Fax (415) 442-0742www.wineinstitute.org
Wine Market Council1251 Whitehall Lane StreetSt. Helena, CA 94574(707) 967-9299; Fax (707) 967-5511www.winemarketcouncil.com
MelonsCalifornia-Arizona Watermelon Association
Post Office Box 606Piru, CA 93040(805) 521-1756; Fax (805) 521-1528E-mail: [email protected]
PeachesCalifornia Canning Peach Association
2300 River Plaza Drive, Suite 110Sacramento, CA 95833(916) 925-9131; Fax (916) 925-9030www.calpeach.com
California Freestone Peach Association1704 Herndon RoadCeres, CA 95307(209) 537-0715; Fax (209) 537-1043www.calpeach.com
PearsCalifornia Pear Growers
1521 I StreetSacramento, CA 95814(916) 441-0432; Fax (916) 446-1063www.calpear.com
PlumsCalifornia Plum Marketing Program
Post Office Box 968Reedley, CA 93654-0968(559) 638-8260; Fax (559) 638-8842E-mail: [email protected]
NutsAlmondsAlmond Board of California
1150 Ninth Street, Suite 1500Modesto, CA 95354(209) 549-8262; Fax (209) 549-8267www.almondsarein.com
Almond Hullers’ Processing Association2350 Lecco WayMerced, CA 95340(209) 723-7661; Fax (209) 723-7943www.ahpa.net
Blue Diamond GrowersPost Office Box 1768Sacramento, CA 95814(916) 442-0771; Fax (916) 446-8620www.bluediamondgrowers.com
Macadamia NutsCalifornia Macadamia Society
Post Office Box 1298Fallbrook, CA 92088(760) 728-8081; Fax (760) 728-8081http://users.aol.com/CalMacSociety
WalnutsDiamond Walnut Growers
1050 South Diamond StreetStockton, CA 95205(209) 467-6000; Fax (209) 467-6709www.diamondofcalifornia.com
Walnut Bargaining Association542 Fifth Street, Suite 2Lincoln, CA 95648(916) 645-8835; Fax (916) 645-2997E-mail: [email protected]
VegetablesGeneralFresh Produce and Floral Council
16700 Valley View Avenue, Suite 130La Mirada, CA 90638(714) 739-0177; Fax (714) 739-0226www.fpfc.org
Grower-Shipper Association of Central California
512 Pajaro StreetSalinas, CA 93901(831) 422-8844; Fax (831) 422-0868www.gsva.org
Imperial Valley Vegetable Growers Association
1000 BroadwayEl Centro, CA 92243(760) 353-1900; Fax (760) 353-3550www.ivvga.com
Western Growers AssociationPost Office Box 2130Newport Beach, CA 92658(949) 863-1000; Fax (949) 863-9028www.wga.com
BeetsCalifornia Beet Growers Association
2 West Swain RoadStockton, CA 95207-4395(209) 477-5596; Fax (209) 477-1610E-mail: [email protected]
CornCalifornia Corn Growers, Inc.
625 South Front StreetChowchilla, CA 93610(559) 665-5775; Fax (559) 665-5733
LettuceCalifornia Lettuce Research Program
512 Pajaro StreetSalinas, CA 93901(831) 424-3782; Fax (831) 424-3785www.calettuceresearchboard.org
MushroomsMushroom Council
11501 Dublin Boulevard, Suite 200Dublin, CA 94568(925) 558-2749; Fax (925) 558-2740www.mushroomcouncil.com
OlivesCalifornia Olive Committee
1903 North Fine, Suite 102Fresno, CA 93727(559) 456-9096; Fax (559) 456-9099www.calolive.org
California Olive GrowersOberti Olives12806 Road 26Madera, CA 93637(559) 674-8741; Fax (559) 673-3960www.californiaolivegrowers.com
Olive Growers Council121 East Main Street, Suite 2Visalia, CA 93291(559) 734-1710; Fax (559) 625-4847www.olivecouncil.com
PotatoesCalifornia Sweet Potato Growers Association
Post Office Box 534Livingston, CA 95334(209) 394-7935; Fax (209) 394-8433
Sweet Potato Council of CaliforniaPost Office 366Livingston, CA 95334(209) 358-1685; Fax (209) 358-2750www.cayam.com
TomatoesCalifornia Tomato Growers Association
10730 Siskiyou LaneStockton, CA 95209(209) 478-1761; Fax (209) 478-9460www.ctga.org
Central California Tomato Growers Cooperative
Post Office Box 696Merced, CA 95340(209) 722-8086; Fax (209) 383-2084
California Agricultural Organizations

150 California Agricultural Resource Directory 2006
CALIFORNIA FAIR NETWORK
Alameda County Fair4501 Pleasanton AvenuePleasanton, CA 94566(925) 426-7600; Fax (925) 426-7599www.alamedacountyfair.com
Amador County Fair (26th District)18621 Sherwood and SchoolPlymouth, CA 95669(209) 245-6921; Fax (209) 245-6923www.amadorcountyfair.com
Antelope Valley Fair (50th District)2551 West Avenue H, Suite 102Lancaster, CA 93536(661) 948-6060; Fax (661) 942-2135www.avfair.com
Big Fresno Fair (21st District)1121 South Chance AvenueFresno, CA 93702(559) 650-3247; Fax (559) 650-3226www.fresnofair.com
Butte County Fair199 East Hazel StreetGridley, CA 95948(530) 846-3626; Fax (530) 846-5924www.buttecountyfair.org
Calaveras County Fair & Jumping Frog Jubilee (39th District)
Post Office Box 489Angels Camp, CA 95222(209) 736-2561; Fax (209) 736-2476www.frogtown.org
California Exposition & State Fair 1600 Exposition BoulevardSacramento, CA 95815(916) 263-3247; Fax (916) 263-3304www.bigfun.org
California Mid-State Fair (16th District)2198 Riverside AvenuePaso Robles, CA 93446(805) 239-0655; Fax (805) 238-5308www.midstatefair.com
California Mid-Winter Fair & Fiesta(45th District)
200 East Second StreetImperial, CA 92251(760) 355-1181; Fax (760) 355-1425www.ivexpo.com
Chowchilla-Madera County Fair1000 South Third StreetChowchilla, CA 93610(559) 665-3728; Fax (559) 665-3720www.ci.chowchilla.ca.us/fairgrounds/fair.
htm
Cloverdale Citrus Fair1 Citrus Fair DriveCloverdale, CA 95425(707) 894-3992; Fax (707) 894-9553www.cloverdalecitrusfair.org
Colorado River Fair (54th District)11995 Olive Lake BoulevardBlythe, CA 92225(760) 922-3247; Fax (760) 922-6196www.coloradoriverfair.com
Colusa County Fair (44th District)1303 Tenth StreetColusa, CA 95932(530) 458-2641; Fax (530) 458-2645www.thefarmshow.com
Contra Costa County Fair (23rd District)1201 West Tenth StreetAntioch, CA 94509(925) 757-4400; Fax (925) 757-9514www.ccfair.org
Del Norte County Fair (41st District)421 Highway 101 NorthCrescent City, CA 95531(707) 464-9556; Fax (707) 464-9519www.dnfairgrounds.com
Desert Empire Fair (53rd District)520 South Richmond RoadRidgecrest, CA 93555(760) 375-8000; Fax (760) 375-8134www.desertempirefair.com
Dixon May Fair (36th District)655 South First StreetDixon, CA 95620(707) 678-5529; Fax (707) 678-4765www.dixonmayfair.com
Eastern Sierra Tri-County Fair(18th District)
Sierra Street and Fair DriveBishop, CA 93514(760) 873-3588; Fax (760) 873-8874www.tricountyfair.com
El Dorado County Fair100 Placerville DrivePlacerville, CA 95667(530) 621-5860; Fax (530) 295-2566www.eldoradocountyfair.org
Glenn County Fair (42nd District)221 East Yolo StreetOrland, CA 95963(530) 865-1168; Fax (530) 865-1197http://glenncountyfair.com
Gold Country Fair (20th District)1273 High StreetAuburn, CA 95603(530) 823-4533; Fax (530) 885-3225www.goldcountryfair.com
Grand National Rodeo, Horse& Stock Show (1-A District)
2600 Geneva AvenueSan Francisco, CA 94014(415) 404-4100; Fax (415) 337-0941www.cowpalace.com
Humboldt County Fair1250 Fifth StreetFerndale, CA 95536(707) 786-9511; Fax (707) 786-9450www.humboldtcountyfair.org
Inter-Mountain Fair of Shasta County44218 A StreetMcArthur, CA 96056(530) 336-5695; Fax (530) 336-6845www.inter-mountainfair.com
Kern County Fair (15th District)1142 South P StreetBakersfield, CA 93307(661) 833-4900; Fax (661) 836-2743www.kerncountyfair.com
Kings Fair (24-A District)810 South Tenth AvenueHanford, CA 93230(559) 584-3318; Fax (559) 584-0192www.kingsfair.com
Lake County Fair (49th District)401 Martin StreetLakeport, CA 95453(707) 263-6181; Fax (707) 263-7706www.lakecountyfair.com
Lassen County Fair195 Russell AvenueSusanville, CA 96130(530) 257-4104; Fax (530) 257-2098www.lassencountyfair.org
Lodi Grape Festival & Harvest FairPost Office Box 848Lodi, CA 95240(209) 369-2771; Fax (209) 369-9185www.grapefestival.com
Los Angeles County Fair1101 West McKinley AvenuePomona, CA 91768(909) 623-3111; Fax (909) 865-3602www.fairplex.com/fp
California Fair Network

California Agricultural Resource Directory 2006 151
Madera District Fair (21-A District)1850 West Cleveland AvenueMadera, CA 93637(559) 674-8511; Fax (559) 674-4516www.maderafair.com
Marin County Fair & Exposition10 Avenue of the FlagsSan Rafael, CA 94903(415) 499-6400; Fax (415) 499-6800www.marinfair.org
Mariposa County Fair & Homecoming(35-A District)
5007 Fairgrounds RoadMariposa, CA 95338(209) 966-2432; Fax (209) 966-6273www.mariposafair.com
Mendocino County Fair & Apple Show14400 Highway 128Boonville, CA 95415(707) 895-3011www.mendocountyfair.com
Merced County Fair (35th District)900 Martin Luther King Jr. WayMerced, CA 95340(209) 722-1506; Fax (209) 722-3773www.mercedcountyfair.com
Merced County Spring Fair403 F StreetLos Banos, CA 93635(209) 826-5166; Fax (209) 826-8737www.co.merced.ca.us/springfair/fair.html
Modoc District FairPost Office Box 26Cedarville, CA 96104(530) 279-2315; Fax (530) 279-2555hoover.hdo.net/~mdocfair/
Monterey County Fair (7th District)2004 Fairground RoadMonterey, CA 93940(831) 372-5863; Fax (831) 372-8248www.montereycountyfair.com
Mother Lode Fair (29th District)220 Southgate DriveSonora, CA 95370(209) 532-7428; Fax (209) 532-3573www.motherlodefair.com
Napa County Fair1435 Oak StreetCalistoga, CA 94515(707) 942-5111; Fax (707) 942-5125www.napacountyfairgrounds.com
Napa Town & Country Fair(25th District)
575 Third StreetNapa, CA 94559(707) 253-4900; Fax (707) 253-4943www.napavalleyexpo.com
National Orange Show689 South E StreetSan Bernardino, CA 92408(909) 888-6788; Fax (909) 889-7666www.nationalorangeshow.com
Nevada County Fair (17th District)11228 McCourtney RoadGrass Valley, CA 95949(530) 273-6217; Fax (530) 273-1146www.nevadacountyfair.com
Orange County Fair & Exposition(32nd District)
88 Fair DriveCosta Mesa, CA 92626(714) 708-1500; Fax (714) 641-1783www.ocfair.com
Placer County Fair800 All American BoulevardRoseville, CA 95678(916) 786-2023; Fax (916) 786-2139www.placercountyfair.org
Plumas-Sierra County Fair204 Fairgrounds RoadQuincy, CA 95971(530) 283-6272; Fax (530) 283-6431www.plumassierracountyfair.com
Redwood Acres Fair (9th District)3750 Harris StreetEureka, CA 95503(707) 445-3037; Fax (707) 445-1583www.redwoodacres.com
Redwood Empire Fair (12th District)1055 North State StreetUkiah, CA 95482(707) 462-3884; Fax (707) 462-2641www.redwoodempirefair.com
Riverside County Fair & National Date Festival
46-350 Arabia StreetIndio, CA 92201(760) 863-8247; Fax (760) 863-8973www.datefest.org
Sacramento County Fair (52nd District)1600 Exposition BoulevardSacramento, CA 95815(916) 263-2975; Fax (916) 263-2973www.sacfair.com
Salinas Valley Fair625 Division StreetKing City, CA 93930(831) 385-3243; Fax (831) 385-3345www.salinasvalleyfair.com
San Benito County Fair (33rd District)9000 Airline HighwayTres Pinos, CA 95075(831) 628-3421; Fax (831) 628-3551www.sanbenitocountyfair.com
San Benito Saddle Horse Show,Rodeo & Fair
9000 Airline HighwayTres Pinos, CA 95075(831) 628-3445; Fax (831) 628-3551
San Bernardino County Fair(28th District)
14800 Seventh StreetVictorville, CA 92392(760) 951-2200; Fax (760) 951-2419www.sbcfair.com
San Diego County Fair (22nd District)2260 Jimmy Durante BoulevardDel Mar, CA 92014(858) 755-1161; Fax (858) 755-7820www.sdfair.com
San Fernando Valley Fair (51st District)5121 Van Nuys Boulevard, Suite 204Sherman Oaks, CA 91403(818) 557-1600; Fax (818) 557-0600www.sfvalleyfair.org
San Joaquin County Fair (2nd District)1658 South Airport WayStockton, CA 95206(209) 466-5041; Fax (209) 466-5739www.sanjoaquinfair.com
San Mateo County Exposition & Fair2495 South Delaware StreetSan Mateo, CA 94403(650) 574-3247; Fax (650) 574-3985www.sanmateocountyfair.com
Santa Barbara Fair & Exposition(19th District)
Post Office Box 3006Santa Barbara, CA 93130(805) 687-0766; Fax (805) 569-5595www.earlwarren.com
Santa Clara County Fair344 Tully RoadSan Jose, CA 95111(408) 494-3100; Fax (408) 998-7223www.thefair.org
Santa Cruz County Fair (14th District)2601 East Lake AvenueWatsonville, CA 95076(831) 724-5671; Fax (831) 761-5827www.santacruzcountyfair.com
Santa Maria Fair Park (37th District)937 South Thornburg StreetSanta Maria, CA 93458(805) 925-8824; Fax (805) 922-4135www.santamariafairpark.com
Schools Involvement Fair (48th District)1100 North Grand AvenueMt. San Antonio College CampusBuilding F10 Farm Road Walnut, CA 91789(909) 468-4433; Fax (909) 468-4439www.schoolsinvolvement.org
California Fair Network

152 California Agricultural Resource Directory 2006
Shasta District Fair (27th District)1890 Briggs StreetAnderson, CA 96007(530) 378-6789; Fax (530) 378-6788www.shastadistrictfair.com
Silver Dollar Fair (3rd District)Post Office Box 1158Chico, CA 95927(530) 895-4666; Fax (530) 895-6987www.silverdollarfair.org
Siskiyou Golden Fair (10th District)1712 Fairlane RoadYreka, CA 96097(530) 842-2767; Fax (530) 842-4724www.sisqfair.com
Solano County Fair900 Fairgrounds DriveVallejo, CA 94589(707) 551-2000; Fax (707) 642-7947www.scfair.org
Sonoma County Fair & ExpositionPost Office Box 15361350 Bennett Valley RoadSanta Rosa, CA 95404(707) 545-4200; Fax (707) 573-9342www.sonomacountyfair.com
Sonoma-Marin Fair (4th District)175 Fairgrounds DrivePetaluma, CA 94952(707) 283-3247; Fax (707) 283-3250www.sonoma-marinfair.org
Southern California Fair (46th District)18700 Lake Perris DrivePerris, CA 92571(951) 657-4221; Fax (951) 657-5412www.socalfair.com
Stanislaus County Fair (38th District)900 North BroadwayTurlock, CA 95380(209) 668-1333; Fax (209) 668-0410www.stancofair.com
Tehama District Fair (30th District)650 Antelope BoulevardRed Bluff, CA 96080(530) 527-5920; Fax (530) 527-1511http://tehamadistrictfair.com
Trinity County Fair6000 Highway 3Hayfork, CA 96041(530) 628-5223; Fax (530) 628-4171
Tulare County Fair (24th District)215 Martin Luther King Jr. AvenueTulare, CA 93274(559) 686-4707; Fax (559) 686-7238www.tularefair.org
Tulelake-Butte Valley Fair (10-A District)800 South Main StreetTulelake, CA 96134(530) 667-5312; Fax (530) 667-3944www.tbvfair.com
Ventura County Fair (31st District)10 West Harbor BoulevardVentura, CA 93001(805) 648-3376; Fax (805) 648-1012www.seasidepark.org
Yolo County Fair (40th District)1125 East StreetWoodland, CA 95776(530) 402-2222; Fax (530) 402-2210www.yolocountyfair.com
Yuba-Sutter Fair (13th District)442 Franklin AvenueYuba City, CA 95991(530) 674-1280; Fax (530) 674-2196www.yubasutterfair.com
African Firefighters in Benevolent Association
3010 Wilshire Boulevard, Suite 257Los Angeles, CA 90010(323) 292-5550; Fax (323) 292-5558E-mail: [email protected]
Amador Farmers’ Market AssociationPost Office Box 1543Jackson, CA 95642(209) 419-2503www.amadorfarmersmarket.com
Avila Business AssociationPost Office Box 732 Avila Beach, CA 93424(805) 595-9252 www.visitavilabeach.com
Brea Certified Farmers' Market5326 Westridge RoadAnaheim, CA 92807(714) 329-6755; Fax (714) 956-3588www.breadowntown.com
California Farmers’ Markets Association3000 Citrus Circle, Suite 111Walnut Creek, CA 94598(925) 465-4690; Fax (925) 465-4693www.cafarmersmkts.com
CERTIFIED FARMERS‘ MARKET ASSOCIATIONS
California Federation of CertifiedFarmers’ Markets
Post Office Box 1813Davis, CA 95617(530) 756-1695; Fax (530) 756-1858www.cafarmersmarkets.com
Certified Farmers’ Market of Sacramento9656 Sheldon RoadElk Grove, CA 95624(916) 688-0100; Fax (916) 689-9794www.california-grown.com
Chula Vista Downtown Business Association
272 Third AvenueChula Vista, CA 91910(619) 422-1982; Fax (619)422-1452www.chulavistalibrary.com
Downtown Anaheim Association205 Center Street Promenade Anaheim, CA 92805(714) 956-3586; Fax (714) 956-3588www.downtownanaheim.com
Downtown Business Association of Escondido
120 West Grand, Suite 202Escondido, CA 92025(760) 745-8877; Fax (760) 745-0307www.downtownescondido.com
Downtown Chico Business Association330 Salem StreetChico, CA 95928(530) 345-6500; Fax (530) 345-3277www.downtownchico.net
El Cerrito Plaza Merchant's Association2999 Oak Road, Suite 1000Walnut Creek 94597(925) 935-5902; Fax (925) 935-5902www.elcerritoplaza.com
El Dorado County Farm Trails AssociationPost Office Box 542Camino, CA 95709(530) 644-3492www.edc-farmtrails.org
Foothill Farmers' Market AssociationPost Office Box 3343Auburn, CA 95604(530) 823-6183; Fax (530) 887-8295www.foothillfarmersmarket.com
Fullerton Certified Farmers’ MarketAssociation
Post Office Box 6093Fullerton, CA 92834(714) 871-5304; Fax (714) 535-5694
California Fair Network

California Agricultural Resource Directory 2006 153
Glendora Farmers’ Market Association129 East Colorado BoulevardMonrovia, CA 91016(866) 440-3374; Fax (626) 914-4822
Golden Gate Farmers’ Market Association149 Ignacio Valley CircleNovato, CA 94949(415) 382-7846; Fax (415) 382-8946
Hillcrest Association3737 Fifth Avenue, Suite 202 San Diego, CA 92163(619) 299-3330www.hillcrestassociation.com
Hollister Downtown Association455 San Benito Street, Suite 21Hollister, CA 95023(831) 636-8406; Fax (831) 636-5909www.downtownhollister.org
Japantown Business Association565 North Sixth Street, Suite GSan Jose, CA 95112(408) 298-4303; Fax (408) 286-4413www.japantownsanjose.org
Kern Farmers’ Market Association21802 Highway 202Tehachapi, CA 93561(661) 319-9108www.kernfresh.com
Marin Farmers’ Market Association76 San Pablo Avenue, Suite 200San Rafael, CA 94903(415) 472-6100-3276; Fax (415) 472-6104www.marinfarmersmarket.org
Mendocino County Farmers' Market Association
Post Office Box 2176Fort Bragg, CA 95437(707) 964-6340www.mcfarm.org
Montrose Shopping Park AssociationPost Office Box 782Montrose, CA 91021(818) 249-2499 Fax: (818) 541-0699 www.shopmontrose.com
North Coast Growers AssociationPost Office Box 4232Arcata, CA 95518(707) 441-9999; Fax (707) 825-7503www.humfarm.org
North County Farmers’ MarketAssociation
Post Office Box 1783Paso Robles, CA 93447(805) 227-2113; Fax (805) 467-9717
Ocean Beach Mainstreet Association Post Office Box 7990San Diego, CA 92167(619) 224-4906; Fax (619) 224-4976www.oceanbeachsandiego.com
Old Capistrano Chamber of Commerce 31421 La Matanza Capistrano, CA 92675(949) 493-4700; Fax (949)489-2695www.sanjuanchamber.com
Old Monterey Business Association321 Alavarado Street, Suite GMonterey, CA 93940(831) 655-8070; Fax: (831) 655-8072www.oldmonterey.org
Pacific Coast Certified Farmers’Market Association
5056 Commercial Circle, Suite EConcord, CA 94520(925) 825-9090; Fax (925) 825-9101www.pcfma.com
Redding Certified Farmers’ Market Association
Post Office Box 990187Redding, CA 96099(530) 226-7100
Reedley Downtown AssociationPost Office Box 6151713 Eleventh StreetReedley, CA 93654(559) 638-5484; Fax (559) 638-5484www.reedleydowntown.com
San Luis Obispo County Farmers' Market Association
Post Office Box 16058 San Luis Obispo, CA 93406(805) 544-9570; Fax (805) 544-9570www.slocountyfarmers.org
Santa Barbara Certified Farmers’ Market Association
232 Anacapa Street, Suite 1-ASanta Barbara, CA 93101(805) 962-5354; Fax (805) 962-1453www.sbfarmersmarket.org
Santa Rosa Downtown Market 637 First StreetSanta Rosa, CA 95404(707) 524-2123; Fax (707) 545-2123www.srdowntownmarket.com
South Bay Farmers' Market Association21900 Summit RoadLos Gatos, CA 95033(408) 353-4293; Fax (408) 367-0223E-mail: [email protected]
South Pasadena Mission West AssociationPost Office Box 655South Pasadena, CA 91031(818) 3786-6612www.mission-west.com
Southland Farmers' Market AssociationPost Office Box 858Topanga, CA 90290(310) 481-0167; Fax (310) 481-0171www.cafarmersmarkets.org
Stockton Certified Farmers’ Market Association
2707 East Fremont Street, Suite 9Stockton, CA 95205(209) 943-1830; Fax (209) 469-0160www.stocktonfarmersmarket.org
Studio City Residents Association Post Office Box 1374Studio City, CA 91614(818) 509-0230; Fax (818) 509-0260www.studiocityresidents.org
Trinity Growers AssociationPost Office Box 35Weaverville, CA 96093(530) 623-6821
Urban Village Farmers’ Market Association39120 Argonaut Way, Suite 780Fremont, CA 94538(510) 745-7100; Fax (510) 745-7180www.urbanvillageonline.com
Ventura County Certified Farmers’Market Association
Post Office Box 1050Fillmore, CA 93016(805) 529-6266; Fax (805) 524-4690http://vccfarmersmarkets.com
West LA Certified Farmers’ Market 11901 Santa Monica Boulevard, Suite 318Los Angeles, CA 90025(310) 281-7855; Fax (310) 996-6761www.westlafarmersmarket.com
Whittier Uptown Association13006 Philadelphia Street, Suite 510Whittier CA, 90601(562) 696-2662; Fax (562) 696-3763www.whittieruptown.org
California Farmers’ Market Associations

154 California Agricultural Resource Directory 2006
California Agricultural Commissionersand Sealers Association
316 Nelson AvenueOroville, CA 95965-3318(530) 538-7381; Fax (530) 538-7594
Alameda County224 West Winton Avenue, Room 184Hayward, CA 94544(510) 670-5232; Fax (510) 783-3928www.acgov.org/cda/awn
Amador County12200 B Airport RoadJackson, CA 95642-9527(209) 223-6487; Fax (209) 223-3312www.co.amador.ca.us
Butte County316 Nelson AvenueOroville, CA 95965-3318(530) 538-7381; Fax (530) 538-7594www.buttecounty.net/agcommissioner
Calaveras County891 Mountain Ranch RoadSan Andreas, CA 95249-9709(209) 754-6504; Fax (209) 754-6521www.co.calaveras.ca.us
Colusa County100 Sunrise Boulevard, Suite FColusa, CA 95932-3246(530) 458-0580; Fax (530) 458-5000www.colusacountyclerk.com
Contra Costa County2366 A Stanwell CircleConcord, CA 94520-4804(925) 646-5250; Fax (925) 646-5732www.co.contra-costa.ca.us
Del Norte County2650 Washington BoulevardCrescent City, CA 95531-8627(707) 464-7235; Fax (707) 465-6044Email: [email protected]
El Dorado County311 Fair LanePlacerville, CA 95667-4195(530) 621-5520; Fax (530) 626-4756www.co.el-dorado.ca.us/ag
Fresno County1730 South Maple AvenueFresno, CA 93702-4596(559) 456-7510; Fax (559) 456-7379www.co.fresno.ca.us
Glenn County720 North Colusa StreetWillows, CA 95988(530) 934-6501; Fax (530) 934-6503www.countyofglenn.net
Humboldt County5630 South BroadwayEureka, CA 95503-6998(707) 445-7223; Fax (707) 445-7220www.co.humboldt.ca.us
Imperial County150 South Ninth StreetEl Centro, CA 92243-2850(760) 482-4314; Fax (760) 353-9420www.imperialcounty.net
Inyo CountyCounty Services Building207 West South StreetBishop, CA 93514-3492(760) 873-7860; Fax (760) 872-1610www.countyofinyo.org
Kern County1001 South Mount Vernon AvenueBakersfield, CA 93307-2857(661) 868-6300; Fax (661) 868-6301www.co.kern.ca.us\kernag
Kings County680 North Campus Drive, Suite BHanford, CA 93230-5923(559) 582-3211 Ext. 2831; Fax (559) 582-5251www.countyofkings.com
COUNTY AGRICULTURAL COMMISSIONERS
County Agricultural Commissioners

California Agricultural Resource Directory 2006 155
Lake County883 Lakeport BoulevardLakeport, CA 95453(707) 263-0217; Fax (707) 263-1052www.co.lake.ca.us
Lassen County175 Russell AvenueSusanville, CA 96130-4299(530) 251-8110; Fax (530) 257-6515www.co.lassen.ca.us
Los Angeles County12300 Lower Azusa RoadArcadia, CA 91006(626) 575-5451; Fax (626) 350-3243http://acwm.co.la.ca.us
Madera County332 Madera AvenueMadera, CA 93637-5499(559) 675-7876; Fax (559) 674-4071www.madera-county.com/agcommissioner
Marin County1682 Novato Boulevard, 150-ANovato, CA 94947-7021(415) 499-6700; Fax (415) 499-7543www.co.marin.ca.us/depts/AG/main
Mariposa County5009 Fairgrounds RoadMariposa, CA 95338-0905(209) 966-2075; Fax (209) 966-2056www.mariposacounty.org
Mendocino County890 North Bush StreetUkiah, CA 95482-3745(707) 463-4208; Fax (707) 463-0240www.co.mendocino.ca.us
Merced County2139 Wardrobe AvenueMerced, CA 95340-6495(209) 385-7431; Fax (209) 725-3536www.co.merced.ca.us/ag
Modoc County202 West Fourth StreetAlturas, CA 96101-3915(530) 233-6401; Fax (530) 233-5542Email: [email protected]
Monterey County1428 Abbott StreetSalinas, CA 93901(831) 759-7325; Fax (831) 422-5003www.co.monterey.ca.us/ag
Napa County1710 Soscol Avenue, Suite 3Napa, CA 94559-1315(707) 253-4357; Fax (707) 253-4881www.co.napa.ac.us
Nevada County255 South Auburn StreetGrass Valley, CA 95945-7289(530) 273-2648; Fax (530) 273-1713http://new.mynevadacounty.com
Orange County1750 South Douglass Road, Building DAnaheim, CA 92806-6031(714) 447-7100; Fax (714) 567-6203www.ocagcomm.com
Placer County11477 E AvenueAuburn, CA 95603-2799(530) 889-7372; Fax (530) 823-1698www.placer.ca.gov/agriculture/agri.htm
Plumas/Sierra County208 Fairgrounds RoadQuincy, CA 95971-9462(530) 283-6365; Fax (530) 283-4210www.countyofplumas.com
Riverside County4080 Lemon Street, Room 19Riverside, CA 92502-1089(909) 955-3000; Fax (909) 955-3012www.rivcoag.org
Sacramento County4137 Branch Center RoadSacramento, CA 95827-3897(916) 875-6603; Fax (916) 875-6150www.saccounty.net/agcomm/index.html
San Benito County3224 Southside RoadHollister, CA 95024(831) 637-5344; Fax (831) 637-9015www.san-benito.ca.us
San Bernardino County777 East Rialto AvenueSan Bernardino, CA 92415-0720(909) 387-2115; Fax (909) 387-2449www.sbcounty.gov
San Diego County5555 Overland Avenue, Suite 3101San Diego, CA 92123-1292(858) 694-2739; Fax (858) 565-7046www.sdcawm.org
San Francisco County1390 Market Street, Suite 210San Francisco, CA 94102(415) 252-3830; Fax (415) 252-3869www.sfdph.org/eh
San Joaquin County1868 East Hazelton AvenueStockton, CA 95201-1809(209) 468-3300; Fax (209) 468-3330www.sjgov.org
San Luis Obispo County2156 Sierra Way, Suite ASan Luis Obispo, CA 93401-4556(805) 781-5910; Fax (805) 781-1035www.sloag.org
San Mateo County728 Heller StreetRedwood City, CA 94064-0999(650) 363-4700; Fax (650) 367-0130www.co.sanmateo.ca.us
Santa Barbara County263 Camino Del RemedioSanta Barbara, CA 93110-1335(805) 681-5600; Fax (805) 681-5603www.countyofsb.org/agcomm
Santa Clara County1553 Berger Drive, Building 1San Jose, CA 95112-2795(408) 918-4600; Fax (408) 286-2460www.sccagriculture.org
Santa Cruz County175 Westridge DriveWatsonville, CA 95076-2797(831) 763-8080; Fax (831) 763-8255www.co.santa-cruz.us
Shasta County3179 Bechelli Lane, Suite 210Redding, CA 96002-2041(530) 224-4949; Fax (530) 224-4951www.co.shasta.ca.us
Siskiyou County525 South Foothill DriveYreka, CA 96097-3090(530) 841-4025; Fax (530) 842-6690www.co.siskiyou.ca.us
Solano County501 Texas StreetFairfield, CA 94533(707) 421-7465; Fax (707) 429-0827www.co.solano.ca.us
Sonoma County133 Aviation Boulevard, Suite 110Santa Rosa, CA 95403-2893(707) 565-2371; Fax (707) 565-3850www.sonoma-county.org/agcomm/index.
htm
Stanislaus County3800 Cornucopia Way, Suite BModesto, CA 95358(209) 525-4730; Fax (209) 525-4789www.stanag.org
Sutter County142 Garden HighwayYuba City, CA 95991-5512(530) 822-7500; Fax (530) 822-7510www.co.sutter.ca.us/doc/government/
depts/ag/aghome
County Agricultural Commissioners

156 California Agricultural Resource Directory 2006
California Farm Bureau Federation2300 River Plaza DriveSacramento, CA 95833(916) 561-5500; Fax (916) 561-5695www.cfbf.com
Alameda County Farm Bureau638 Enos Way, Suite 1Livermore, CA 94551(925) 449-1677E-mail: [email protected]
Amador County Farm BureauPost Office Box 159Jackson, CA 95642-0159(209) 223-9095E-mail: [email protected]
Butte County Farm Bureau2580 Feather River BoulevardOroville, CA 95965-9692(530) 533-1473; Fax (530) 533-6508www.butte.cfbf.com
Calaveras County Farm Bureau6455 Cane LaneValley Springs, CA 95252(209) 772-3987E-mail: [email protected]
Colusa County Farm Bureau520 Market Street, Suite 1Colusa, CA 95932(530) 458-5130; Fax (530) 458-5230www.ccfb.com
Contra Costa County Farm Bureau5554 Clayton Road, Suite 4Concord, CA 94521-4198(925) 672-5115; Fax (925) 672-8382www.cccfb.org
Del Norte County Farm Bureau11775 Ocean View DriveSmith River, CA 95567(707) 487-0612E-mail: [email protected]
El Dorado County Farm Bureau2460 Headington RoadPlacerville, CA 95667(530) 622-7773; Fax (530) 622-7839www.edcfb.com
Fresno County Farm Bureau1274 West HedgesFresno, CA 93728-1202(559) 237-0263; Fax (559) 237-3396www.fcfb.org
Glenn County Farm Bureau501 Walker StreetOrland, CA 95963-1350(530) 865-9636; Fax (530) 865-7182E-mail: [email protected]
Humboldt County Farm Bureau5601 South BroadwayEureka, CA 95503-6904(707) 443-4844; Fax (707) 443-0926E-mail: [email protected]
Imperial County Farm Bureau1000 BroadwayEl Centro, CA 92243-2315(760) 352-3831; Fax (760) 352-0232www.icfb.net
Inyo-Mono County Farm Bureau58429 Highway 120Benton, CA 93512(760) 933-2505; Fax (760) 933-2278E-mail: [email protected]
Kern County Farm Bureau801 South Mount Vernon AvenueBakersfield, CA 93307-2408(661) 397-9635; Fax (661) 397-3403www.kerncfb.com
Kings County Farm Bureau870 Greenfield AvenueHanford, CA 93230-3570(559) 584-3557; Fax (559) 584-1614www.kcfb.org
Lake County Farm Bureau65 Soda Bay RoadLakeport, CA 95453(707) 263-0911; Fax (707) 263-1101www.lakecofb.com
Lassen County Farm Bureau20 South Gay StreetSusanville, CA 96130(530) 257-7242E-mail: [email protected]
COUNTY FARM BUREAUS
COUNTY SEALERS OF WEIGHTS & MEASURES
Kern County1116 East California AvenueBakersfield, CA 93307(661) 868-6300; Fax (661) 868-6301
Riverside County2950 Washington StreetRiverside, CA 92502-1480(951) 955-3030; Fax (951) 276-4728
Ventura County800 South Victoria Avenue, Suite 1750Ventura, CA 93009(805) 654-2444; Fax (805) 654-5177
Tehama County1760 Walnut StreetRed Bluff, CA 96080(530) 527-4504; Fax (530) 529-1049www.tehamacountyadmin.org/index.cfm
Trinity County173 Tom Bell RoadWeaverville, CA 96093-1466(530) 623-1356; Fax (530) 623-1391www.trinitycounty.org
Tulare County4437 South Laspina StreetTulare, CA 93291-4584(559) 685-3323; Fax (559) 685-3335www.agcomm.co.tulare.ca.us
Tuolumne County2 South Green StreetSonora, CA 95370-4617(209) 533-5691; Fax (209) 533-5520www.infonettc.org
Ventura County815 East Santa Barbara StreetSanta Paula, CA 93060-0889(805) 933-8415; Fax (805) 525-8922www.ventura.org
Yolo County70 Cottonwood StreetWoodland, CA 95695-2593(530) 666-8140; Fax (530) 662-6094www.yolocounty.org
Yuba County915 Eighth Street, Suite 127Marysville, CA 95901(530) 749-5400; Fax (530) 749-5404www.co.yuba.ca.us
County Farm Bureaus

California Agricultural Resource Directory 2006 157
Los Angeles County Farm Bureau41228 12th Street West, Suite APalmdale, CA 93551(661) 274-9709; Fax (661) 274-0637www.lacfb.org
Madera County Farm Bureau1102 South Pine StreetMadera, CA 93637(559) 674-8871; Fax (559) 674-0529www.maderafarmbureau.com
Marin County Farm BureauPost Office Box 219Point Reyes Station, CA 94956-0219(415) 663-1231; Fax (415) 663-1141E-mail: [email protected]
Mariposa County Farm Bureau5320 Highway 49 North, Suite 1BMariposa, CA 95338(209) 742-5875; Fax (209) 966-7411E-mail: [email protected]
Mendocino County Farm Bureau303-C Talmage RoadUkiah, CA 95482-6417(707) 462-6664; Fax (707) 462-6681www.mendofb.org
Merced County Farm BureauPost Office Box 1232Merced, CA 95341-1232(209) 723-3001; Fax (209) 722-3814www.mercedcountyfb.org
Modoc County Farm BureauPost Office Box 1692Alturas, CA 96101-1692(530) 233-3276; Fax (530) 233-4738E-mail: [email protected]
Monterey County Farm BureauPost Office Box 1449Salinas, CA 93902-1449(831) 751-3100; Fax (831) 751-3167www.montereycountyfarmbureau.org
Napa County Farm Bureau811 Jefferson StreetNapa, CA 94559-2422(707) 224-5403; Fax (707) 224-7836www.napafarmbureau.org
Nevada County Farm BureauPost Office Box 43Chicago Park, CA 95712-0043(530) 346-8146www.nevadacofb.org
Orange County Farm Bureau13042 Old Myford RoadIrvine, CA 92620-1606(714) 573-0374; Fax (714) 573-0376http://orange.cfbf.com
Placer County Farm Bureau10120 Ophir RoadNewcastle, CA 95658(916) 663-2929; Fax (530) 885-6645E-mail: [email protected]
Plumas-Sierra County Farm Bureau7411 Dyson LaneLoyalton, CA 96118(530) 993-4550E-mail: [email protected]
Riverside County Farm Bureau21160 Box Springs Road, Suite 102Moreno Valley, CA 92557-8706(909) 684-6732; Fax (909) 782-0621www.riversidecfb.com
Sacramento County Farm Bureau8970 Elk Grove BoulevardElk Grove, CA 95624(916) 685-6958; Fax (916) 685-7125www.sacfarmbureau.org
San Benito County Farm Bureau530 San Benito Street, Suite 201Hollister, CA 95023-3955(831) 637-7643; Fax (831) 637-7999E-mail: [email protected]
San Bernardino County Farm Bureau210 South Riverside AvenueRialto, CA 92376-6453(909) 875-5945; Fax (909) 874-6195E-mail: [email protected]
San Diego County Farm Bureau1670 East Valley ParkwayEscondido, CA 92027-2409(760) 745-3023; Fax (760) 489-6348www.sdfarmbureau.org
San Joaquin Farm Bureau FederationPost Office Box 8444Stockton, CA 95208-0444(209) 931-4931; Fax (209) 931-1433www.sjfb.org
San Luis Obispo County Farm Bureau651 Tank Farm RoadSan Luis Obispo, CA 93401-7002(805) 543-3654; Fax (805) 543-3697www.slofarmbureau.org
San Mateo County Farm Bureau765 Main StreetHalf Moon Bay, CA 94019-1924(650) 726-4485; Fax (650) 726-4495www.sanmateo.cfbf.com
Santa Barbara County Farm BureauPost Office Box 1846Buellton, CA 93427-1846(805) 688-7479; Fax (805) 688-0428www.sbcfb.com
Santa Clara County Farm Bureau605 Tennant Avenue, Suite HMorgan Hill, CA 95037-5533(408) 776-1684; Fax (408) 776-7804www.sccfarmbureau.org
Santa Cruz County Farm Bureau141 Monte Vista AvenueWatsonville, CA 95076-3271(831) 724-1356; Fax (831) 724-5821www.sccfb.com
Shasta County Farm Bureau1890 Briggs StreetAnderson, CA 96007(530) 223-2358; Fax (530) 222-0671E-mail: [email protected]
Siskiyou County Farm Bureau809 South Fourth StreetYreka, CA 96097-3311(530) 842-2364E-mail: [email protected]
Solano County Farm Bureau2210 Boynton Avenue, Suite EFairfield, CA 94533-4320(707) 425-8044; Fax (707) 425-6172E-mail: [email protected]
Sonoma County Farm Bureau970 Piner RoadSanta Rosa, CA 95403-1988(707) 544-5575; Fax (707) 544-7452www.sonomacountyfarmbureau.com
Stanislaus County Farm BureauPost Office Box 3070Modesto, CA 95354-3070(209) 522-7278; Fax (209) 521-9938www.stanfarmbureau.com
Tehama County Farm Bureau645 Antelope Boulevard, Suite 17Red Bluff, CA 96080-2464(530) 527-7882; Fax (530) 527-6028E-mail: [email protected]
Trinity County Farm BureauStar Route 1, Box 72Zenia, CA 95595E-mail: [email protected]
Tulare County Farm BureauPost Office Box 748Visalia, CA 93279-0748(559) 732-8301; Fax (559) 732-7029www.tulcofb.org
Tuolumne County Farm BureauPost Office Box 675Jamestown, CA 95327(209) 984-5922E-mail: [email protected]
County Farm Bureaus

158 California Agricultural Resource Directory 2006
FARM LABOR ORGANIZATIONS
Agricultural Labor ManagementUniversity of California 3800 Cornucopia Way, Suite A Modesto, CA 95358-9492(209) 525-6800; Fax (209) 525-6840www.cnr.berkeley.edu/ucce50/ag-labor
Agricultural Labor Relations Board915 Capitol Mall, Third FloorSacramento, CA 95814(916) 653-3699; Fax (916) 653-8750www.alrb.ca.gov
Agricultural Personnel Management Program
University of California207 Giannini HallBerkeley, CA 94720-3310(510) 642-3345; Fax (831) 643-8911
AgSafePost Office Box 614Clovis, CA 96313-0614(559) 278-4404; Fax (559) 278-7035www.agsafe.org
California Farmers Union2881 Geer Road Suite DTurlock, CA 95382(209) 632-0381; Fax (209) 632-5262www.calfu.org
California Grower Foundation176 Main Street, Suite CSt. Helena, CA 94574(707) 963-7191; Fax (707) 963-5728
California Independent Grocers Association1425 River Park Drive, Suite 226Sacramento, CA 95815(916) 929-9741; Fax (916) 929-0301www.ciga.org
California Labor Federation600 Grand Avenue, Suite 410Oakland, CA 94610-3561(510) 663-4000; Fax (510) 663-4099www.calaborfed.org
California Processors, Inc.425 Military East, Suite JBenicia, CA 94510(707) 747-6055; Fax (707) 747-6059
Farm Employers Labor Service2300 River Plaza DriveSacramento, CA 95833(800) 753-9073; Fax (916) 561-5696www.fels.org
Farm Worker Institute for Education andLeadership Development
Post Office Box 62Keene, CA 93531(661) 823-6140; Fax (661) 823-6177www.farmworkerinstitute.org
Grower-Shipper Associationof Central California
512 Pajaro StreetSalinas, CA 93901(831) 422-8844; Fax (831) 422-0868www.gsva.org
Independent Growers AssociationPost Office Box 519Greenfields, CA 93927(408) 674-5543
National Farmers Union400 North Capitol Street, NW, Suite 790Washington, DC 20001(202) 554.1600; Fax (202) 554.1654www.nfu.org
Nisei Farmers League1775 North Fine AvenueFresno, CA 93727(559) 251-8468; Fax (559) 251-8430www.niseifarmersleague.com
United Agribusiness League54 Corporate ParkIrvine, CA 92606(800) 223-4590; Fax (949) 975-1424www.ual.org
United Farm Workers of AmericaPost Office Box 62Keene, CA 93531(661) 823-6250; Fax (661) 823-6177www.ufw.org
Ventura County Farm BureauPost Office Box 3160Ventura, CA 93006-7360(805) 289-0155; Fax (805) 658-0295www.farmbureauvc.com
Yolo County Farm BureauPost Office Box 1556Woodland, CA 95776(530) 662-6316; Fax (530) 662-8611www.yolofarmbureau.org
Yuba-Sutter County Farm Bureau475 Palora Avenue, Suite AYuba City, CA 95991(530) 673-6550; Fax (530) 671-5836http://yubasutter.cfbf.com
Farm Labor Organizations

California Agricultural Resource Directory 2006 159
NATIONAL AGRICULTURAL ORGANIZATIONS
GeneralAmerican Agricultural Economics Association
415 South Duff Avenue, Suite CAmes, IA 50010-6600(515) 233-3202; Fax (515) 233-3101www.aaea.org
American Agricultural Editors’ AssociationPost Office Box 156New Prague, MN 56071(952) 758-6502; Fax (952) 758-5813www.ageditors.com
American Agri-Women5910 North Shary RoadMission, TX 78574-9656www.americanagriwomen.org
American Association of Cereal Chemists3340 Pilot Knob RoadSaint Paul, MN 55121-2097(651) 454-7250; Fax (651) 454-0766www.aaccnet.org
American Farm Bureau Federation600 Maryland Avenue, SW, Suite 1000WWashington, D.C. 20024(202) 406-3600; Fax (202) 406-3602www.fb.org
American Farmland Trust1200 18th Street NW, Suite 800Washington, D.C. 20036(202) 331-7300; Fax (202) 659-8339 www.farmland.org
American Society of Agricultural and Biological Engineers
2950 Niles RoadSaint Joseph, MI 49085(269) 429-0300; Fax (269) 429-3852www.asabe.org
American Society of Farm Managers and Rural Appraisers
California ChapterPost Office Box 838Woodbridge, CA 95258(209) 368-3672; Fax (209) 368-3602www.calasfmra.com
Food Marketing Institute655 15th Street, NWWashington, D.C. 20005(202) 452-8444; Fax (202) 429-4519www.fmi.org
Hydroponic Society of AmericaPost Office Box 1183El Cerrito, CA 94530(510)552-7632www.hydroponics.org
International Food Information Council1100 Connecticut Avenue, NW, Suite 430Washington, D.C. 20036(202) 296-6540; Fax (202) 296-6547www.ific.org
National 4-H Council7100 Connecticut AvenueChevy Chase, MD 20815(301) 961-2800; Fax (301) 961-2894www.fourhcouncil.edu
National Agri-Marketing Association11020 King Street, Suite 205Overland Park, KS 66210(913) 491-6500; Fax (913) 491-6502www.nama.org
Central California OfficePost Office Box 1475Tulare, CA 93275(800) 999-9186; Fax (559) 686-5065
National Farmers Organization528 Billy Sunday Road, Suite 100Ames, IA 50010(800) 247-2110www.nfo.org
Organic Trade AssociationPost Office Box 547Greenfield, MA 01302(413) 774-7511; Fax (413) 774-6432www.ota.com
Produce Marketing Association1500 Casho Mill RoadNewark, DE 19714-6036(302) 738-7100; Fax (302) 731-2409www.pma.com
Soil and Water Conservation Society945 Southwest Ankeny RoadAnkeny, IA 50021(515) 289-2331; Fax (515) 289-1227www.swcs.org
United Fresh Fruit and Vegetable Association
1901 Pennsylvania Avenue, NW, Suite 1100
Washington, D.C. 20006(202) 303-3400; Fax (202) 303-3433www.uffva.org
Western Plant Health Association4460 Duckhorn Avenue, Suite ASacramento, CA 95834(916) 574-9794; Fax (916) 574-9484www.cpha.net
Animals and LivestockGeneralAmerican Association of Meat Processors
Post Office Box 269Elizabethtown, PA 17022(717) 367-1168; Fax (717) 367-9096www.aamp.com
American Society of Animal Science1111 North Dunlap AvenueSavoy, IL 61874(217) 356-9050; Fax (217) 398-4119www.asas.org
National Institute for Animal Agriculture1910 Lyda AvenueBowling Green, KY 42104(270) 782-9798; Fax (270) 782-0188www.animalagriculture.org
National Meat Association1970 Broadway, Suite 825Oakland, CA 94612(510) 763-1533; Fax (510) 763-6186www.nmaonline.org
National Renderers Association801 North Fairfax Street, Suite 205Alexandria, VA 22314(703) 683-0155; Fax (703) 683-2626www.renderers.org
United States Animal Health Association8100 Three Chopt Road, Suite 203Richmond, VA 23288(804) 285-3210; Fax (804) 285-3367www.usaha.org
CattleAmerican Angus Association
3201 Frederick AvenueSaint Joseph, MO 64506-2997(816) 383-5100; Fax (816) 233-9703www.angus.org
American Brahman Breeders Association3003 South Loop West, Suite 140Houston, TX 77054(713) 349-0854; Fax (713) 349-9795www.brahman.org
American Hereford AssociationPost Office Box 014059Kansas City, MO 64101(816) 842-3757; Fax (816) 842-6931www.hereford.org
American-International Charolais Association
11700 Northwest Plaza CircleKansas City, MO 64153(816) 464-5977; Fax (816) 464-5759www.charolaisusa.com
National Agricultural Organizations

160 California Agricultural Resource Directory 2006
American Jersey Cattle Association6486 East Main StreetReynoldsburg, OH 43068-2362(614) 861-3636; Fax (614) 861-8040www.usjersey.com
American National Cattle WomenPost Office Box 3881Englewood, CO 80155(303) 694-0313; Fax (303) 694-2390www.ancw.org
American Shorthorn Association8288 Hascall StreetOmaha, NE 68124(402) 393-7200; Fax (402) 393-7203www.beefshorthornusa.com
International Livestock IdentificationAssociation
201 Livestock Exchange Building4701 Marion Street, Room 201Denver, CO 80216(303) 294-0895; Fax (303) 294-0918http://4ilia.com
National Cattlemen’s Beef Association9110 East Nichols Avenue, Suite 300Centennial, CO 80112(303) 694-0305; Fax (303) 694-2851www.beef.org
North American Limousin Foundation7383 South Alton Way, Suite 100Englewood, CO 80112(303) 220-1693; Fax (303) 220-1884www.nalf.org
Texas Longhorn Breeders Associationof America
2315 North Main Street, Suite 402Fort Worth, TX 76106(817) 625-6241; Fax (817) 625-1388www.tlbaa.org
U.S. Meat Export Federation1050 17th Street, Suite 2200Denver, CO 80265(303) 623-6328; Fax (303) 623-0297www.usmef.org
DairyAmerican Butter Institute
2101 Wilson Boulevard, Suite 400Arlington, VA 22201(703) 243-5630; Fax (703) 841-9328www.butterinstitute.org
American Cheese Society304 West Liberty Street, Suite 201Louisville, KY 40202(502) 583-3783; Fax (502) 589-3602www.cheesesociety.org
American Dairy Products Institute116 North York StreetElmhurst, IL 60126(630) 530-8700; Fax (630) 530-8707www.adpi.org
American Dairy Science Association1111 North Dunlap AvenueSavoy, IL 61874(217) 356-5146; Fax (217) 398-4119www.adsa.org
DairyAmerica4974 East Clinton Way, Building C221Fresno, CA 93727(559) 251-0992; Fax (559) 251-1078www.dairyamerica.com
Dairy Farmers of AmericaCalifornia Area Office170 North Maple Street, Suite B106Corona, CA 92880(909) 493-4900; Fax (909) 493-4901www.dfamilk.com
Dairy Management, Inc.10255 West Higgins Road, Suite 900Rosemont, IL 60018-5616(847) 803-2000; Fax (847) 803-2077www.dairyinfo.com
International Dairy Foods Association1250 H Street, NW, Suite 900Washington, D.C. 20005(202) 737-4332; Fax (202) 331-7820www.idfa.org
National Milk Producers Federation2101 Wilson Boulevard, Suite 400Arlington, VA 22201(703) 243-6111; Fax (703) 841-9328www.nmpf.org
Quality Chek’d Dairies, Inc.1733 Park StreetNaperville, IL 60563(630) 717-1110; Fax (630) 717-1126www.qchekd.com
United Ag Service12 North Park StreetSeneca Falls, NY 13148(315) 568-2750; Fax (315) 568-2752E-mail: [email protected]
United States Dairy Export Council2101 Wilson Boulevard, Suite 400Arlington, VA 22201-3061(703) 528-3049; Fax (703) 528-3705www.usdec.org
EquineAmerican Association of Equine Practitioners
4075 Iron Works ParkwayLexington, KY 40511(859) 233-0147; Fax (859) 233-1968www.aaep.org
American Buckskin Registry AssociationPost Office Box 3850Redding, CA 96049-3850(530) 223-1420www.americanbuckskin.com
American Donkey and Mule SocietyPost Office Box 1210Lewisville, TX 75067(972) 219-0781; Fax (972) 420-9980www.lovelongears.com
American Horse Council1616 H Street, NW, 7th FloorWashington, D.C. 20006(202) 296-4031; Fax (202) 296-1970www.horsecouncil.org
American Mule AssociationPost Office Box 1349Yerington, NV 89447(775) 463-1922www.americanmuleassociation.com
American Paint Horse AssociationPost Office Box 961023Fort Worth, TX 76161-0023(817) 834-2742; Fax (817) 834-3152www.apha.com
American Quarter Horse AssociationPost Office Box 200Amarillo, TX 79168(806) 376-4811; Fax (806) 349-6401www.aqha.com
American Shire Horse Association1211 Hill Harrell RoadEffingban, SC 29541(843) 629-0072www.shirehorse.org
Appaloosa Horse Club (Registry)2720 West Pullman RoadMoscow, ID 83843-0903(208) 882-5578; Fax (208) 882-8150www.appaloosa.com
Arabian Horse Association10805 East Bethany DriveAurora, CO 80014(303) 696-4500; Fax (303) 696-4599www.arabianhorses.org
United States Trotting Association750 Michigan AvenueColumbus, OH 43215(877) 800-8782; Fax (614) 224-4575www.ustrotting.com
FishAmerican Fisheries Society
5410 Grosvenor Lane, Suite 110Bethesda, MD 20814(301) 897-8616; Fax (301) 897-8096www.fisheries.org
National Agricultural Organizations
California Agricultural Resource Directory 2006 161
United States Trout Farmers Association111 West Washington Street, Suite 1Charles Town, WV 25414-1529(304) 728-2189; Fax (304) 728-2196www.ustfa.org
United States Tuna Foundation1101 17th Street, NW, Suite 609Washington, D.C. 20036(202) 857-0610; Fax (202) 331-9686www.tunafacts.com
World Aquaculture Society143 J.M. Parker ColiseumLouisiana State UniversityBaton Rouge, LA 70803(225) 578-3137; Fax (225) 578-3493www.was.org
GoatsAmerican Dairy Goat Association
209 West Main StreetSpindale, NC 28160(828) 286-3801; Fax (828) 287-0476www.adga.org
HogsNational Pork Board
1776 North West 114th StreetDes Moines, IA 50325(515) 223-2600; Fax (515) 223-2646www.pork.org
National Pork Producers Council122 C Street, NW, Suite 875Washington, DC 20001(202) 347-3600; Fax (202) 347-5265www.nppc.org
LlamasCal-ILA
California Chapter1188 Olive Hill LaneNapa, CA 94558(707) 255-2621; Fax (707) 257-1396www.cal-ila.org
Poultry And EggsAmerican Egg Board
1460 Renaissance Drive, Suite 301Park Ridge, IL 60068(847) 296-7043; Fax (847) 296-7007www.aeb.org
American Poultry AssociationPost Office Box 306 Burgettstown PA, 15021(742) 729-3459www.amerpoultryassn.com
National Chicken Council1015 15th Street, NW, Suite 930Washington, D.C. 20005-2622(202) 296-2622; Fax (202) 293-4005www.nationalchickencouncil.com
U.S.A. Poultry and Egg Export Council2300 West Park Place Boulevard, Suite 100Stone Mountain, GA 30087(770) 413-0006; Fax (770) 413-0007www.usapeec.org
U.S. Poultry and Egg Association1530 Cooledge RoadTucker, GA 30084-7303(770) 493-9401; Fax (770) 493-9257www.poultryegg.org
SheepAmerican Sheep Industry Association
9785 Maroon Circle Centennial, CO 80112-1414(303) 771-3500; Fax (303) 771-8200www.sheepusa.org
Field CropsGeneralAmerican Feed Industry Association
1501 Wilson Boulevard, Suite 1100Arlington, VA 22209(703) 524-0810; Fax (703) 524-1921www.afia.org
CropLife Amercia1156 15th Street, NW, Suite 400Washington, D.C. 20005(202) 296-1585; Fax (202) 463-0474www.croplifeamerica.org
Western Growers Association17620 Fitch StreetIrvine, CA 92614(949) 863-1000; Fax (949) 863-9028www.wga.com
Alfalfa And HayNational Hay Association
102 Treasure Island CausewaySt. Petersburg, FL 33706(800) 707-0014; Fax (727) 367-9702www.nationalhay.org
BeansUnited States Dry Bean Council
Post Office Box 550Grapeview, WA 98546(360) 277-0112; Fax (360) 233-0621www.usdrybeans.com
CornCorn Refiners Association, Inc.
1701 Pennsylvania Avenue, NW, Suite 950Washington, D.C. 20006(202) 331-1634; Fax (202) 331-2054www.corn.org
National Corn Growers Association632 Cepi DriveChesterfield, MO 63005(636) 733-9004; Fax (636) 733-9005www.ncga.com
CottonAmerican Cotton Shippers Association
88 Union Center, Suite 1204Memphis, TN 38103(901) 525-2272; Fax (901) 527-8303www.acsa-cotton.org
Cotton Council International1521 New Hampshire Avenue, NWWashington, D.C. 20036(202) 745-7805; Fax (202) 483-4040www.cottonusa.org
International Cotton Advisory Committee1629 K Street, NW, Suite 702Washington, D.C. 20006(202) 463-6660; Fax (202) 463-6950www.icac.org
Western Cotton Shippers Association88 Union Avenue, Suite 1204Memphis, TN 38173(901) 525-2272; Fax (901) 527-8303www.westerncotton.com
GrainAmerican Association of GrainInspection and Weighing Agencies
Post Office Box 8368Topeka, KS 66608-0368(785) 233-7063; Fax (785) 233-7928www.aagiwa.org
National Grain and Feed Association1250 I Street, NW, Suite 1003Washington, D.C. 20005-3922(202) 289-0873; Fax (202) 289-5388www.ngfa.org
National Grain Sorghum Producers4201 N Interstate 27Lubbock, TX 79403(806) 749-3478; Fax (806) 749-9002www.sorghumgrowers.com
U.S. Grains Council1400 K Street, NW, Suite 1200Washington, D.C. 20005(202) 789-0789; Fax (202) 898-0522www.grains.org
RiceU.S.A. Rice Federation
4301 North Fairfax Drive, Suite 425Arlington, VA 22203-1616(703) 236-2300; Fax (703) 236-2301www.usarice.com
SeedAmerican Seed Trade Association
225 Reinekers Lane, Suite 650Alexandria, VA 22314-2875(703) 837-8140; Fax (703) 837-9365www.amseed.org
National Agricultural Organizations

162 California Agricultural Resource Directory 2006
Soy BeansAmerican Soybean Association
12125 Woodcrest Executive Drive, Suite 100
Saint Louis, MO 63141-5009(314) 576-1770; Fax (314) 576-2786www.soygrowers.com
SunflowersNational Sunflower Association
4023 State StreetBismark, ND 58503-0690(701) 328-5100; Fax (701) 328-5101www.sunflowernsa.com
WheatNational Association of Wheat Growers
415 Second Street, NE, Suite 300Washington, D.C. 20002-4993(202) 547-7800; Fax (202) 546-2638www.wheatworld.org
U.S. Wheat Associates1620 I Street, NW, Suite 801Washington, D.C. 20006-4005(202) 463-0999; Fax (202) 785-1052www.uswheat.org
Wheat Quality CouncilPost Office Box 966106 West Capitol, Suite 2Pierre, SD 57501-0966(605) 224-5187; Fax (605) 224-0517www.wheatqualitycouncil.org
Floral and NurseryAmerican Association of BotanicalGardens and Arboreta
100 West 10th Street, Suite 614Wilmington, DE 19801(302) 655-7100; Fax (302) 655-8100www.aabga.org
American Horticultural Society7931 East Boulevard DriveAlexandria, VA 22308(703) 768-5700; Fax (703) 768-8700www.ahs.org
American Horticultural TherapyAssociation
3570 East 12th Avenue, Suite 206Denver, CO 80206(303) 322-2482; Fax (303) 332-2485www.ahta.org
American Society for Horticultural Science113 South West Street, Suite 200Alexandria, VA 22314-2851(703) 836-4606; Fax (703) 836-2024www.ashs.org
Forest ProductsAmerican Forests
Post Office Box 2000Washington, D.C. 20013(202) 737-1944; Fax (202) 737-2457www.americanforests.org
American Forest and Paper Association1111 19th Street, NW, Suite 800Washington, D.C. 20036(800) 878-8878www.afandpa.org
American Walnut ManufacturersAssociation, Inc.
Post Office Box 504635 Village CourtZionsville, IN 46077(317) 873-8780www.walnutassociation.org
Forest Landowners Association, Inc.900 Circle 75 Parkway, Suite 205Atlanta, GA 30339(404) 325-2954; Fax (404) 325-2955www.forestlandowners.com
Society of American Foresters5400 Grosvenor LaneBethesda, MD 20814(301) 897-8720; Fax (301) 897-3690www.safnet.org
TOC Management Services(Timber Operators Council)
6825 Southwest Sandburg StreetTigard, OR 97223(503) 620-1710; Fax (503) 620-3935www.toc.org
FruitsApplesApple Processors Association
1100 17th Street, NW, Suite 1000Washington, D. C. 20036(202) 785-6715; Fax (202) 331-4212www.agriwashington.org
U.S. Apple Association8233 Old Courthouse Road, Suite 200Vienna, VA 22182(703) 442-8850; Fax (703) 790-0845www.usapple.org
BerriesNorth American Blueberry Council
2390 East Bidwell Street, Suite 300Folsom, CA 95630-3873(916) 983-0111; Fax (916) 983-9022www.blueberry.org
CherriesCherry Marketing Institute
Post Office Box 30285Lansing, MI 48909-7785(517) 669-4264; Fax (517) 669-3354www.usacherries.com
CitrusCitrus Research and Education CenterUniversity of Florida
700 Experiment Station RoadLake Alfred, FL 33850-2299(863) 956-1151; Fax (863) 956-4631www.lal.ufl.edu
Grapes And WineAmerican Society for Enology and Viticulture
Post Office Box 1855Davis, CA 95617-1855(530) 753-3142; Fax (530) 753-3318www.asev.org
American Vineyard FoundationPost Office Box 5779Napa, CA 94581(707) 252-6911; Fax (707) 252-7672www.avf.org
Concord Grape Association1100 Johnson Ferry Road, Suite 300Atlanta, GA 30342(404) 252-3663; Fax (404) 252-0774www.concordgrape.org
Wine Institute425 Market Street, Suite 1000San Francisco, CA 94105(415) 512-0151; Fax (415) 442-0742www.wineinstitute.org
MelonsNational Watermelon Promotion Board
3501 Quadrangle Boulevard, Suite 321 Orlando, FL 32814-0065(407) 657-0261; Fax (407) 657-2213www.watermelon.org
PeachesNational Peach Council
12 Nicklaus Lane, Suite 101Columbia, SC 29229(803) 788-7101; Fax (803) 865-8090www.nationalpeach.org
PearsPacific Northwest Canned Pear Service
105 South 18th Street, Suite 205Yakima, WA 98901-2145(509) 453-4837; Fax (509) 453-4880www.eatcannedpears.com
National Agricultural Organizations

California Agricultural Resource Directory 2006 163
Pear Bureau Northwest4382 Southeast International Way, Suite AMilwaukie, OR 97222-4635(503) 652-9720; Fax (503) 652-9721www.usapears.com
NutsWalnut Marketing Board
1540 River Park Drive, Suite 203Sacramento, CA 95815(916) 922-5888; Fax (916) 923-2548www.walnut.org
VegetablesAmerican Mushroom Institute
1 Massachusetts Avenue, NW, Suite 800Washington, D.C. 20001(202) 842-4344; Fax (202) 408-7763www.americanmushroom.org
National Onion Association822 7th Street, Suite 510Greeley, CO 80631(970) 353-5895; Fax (970) 353-5897www.onions-usa.org
SELECTED GOVERNMENT AGENCIES
California Environmental Protection Agency
1001 I StreetSacramento, CA 95814(916) 323-2514www.calepa.ca.gov
Air Resources Board1001 I StreetSacramento, CA 95814(916) 322-2990; Fax (916) 445-5025www.arb.ca.gov
California Integrated WasteManagement Board
1001 I StreetSacramento, CA 95814(916) 341-6000www.ciwmb.ca.gov
Environmental Health HazardAssessment
1001 I StreetSacramento, CA 95814(916) 324-7572www.oehha.org
Department of Pesticide Regulation1001 I StreetSacramento, CA 95814(916) 445-4300www.cdpr.ca.gov
Division of Enforcement, EnvironmentalMonitoring, Pest Management and LicensingEnforcement Branch
1001 I StreetSacramento, CA 95814(916) 445-4100; Fax (916) 445-3907
Environmental Monitoring Branch1001 I StreetSacramento, CA 95814(916) 324-4039; Fax (916) 324-4088
Pest Management and Licensing Branch1001 I StreetSacramento, CA 95814(916) 445-3870; Fax (916) 445-4033
Division of Registration and Health EvaluationMedical Toxicology Branch
1001 I StreetSacramento, CA 95814(916) 445-4233; Fax (916) 324-3506
Pesticide Registration Branch1001 I StreetSacramento, CA 95814(916) 445-4377; Fax (916) 324-1719
State Water Resources Control Board1001 I StreetSacramento, CA 95814(916) 341-5250www.swrcb.ca.gov
Department of Toxic Substances Control1001 I StreetSacramento, CA 95814(916) 324-1826; Fax (916) 324-1788www.dtsc.ca.gov
Worker Health and Safety Branch1001 I StreetSacramento, CA 95814-2828(916) 445-4260; Fax (916) 445-4280
California Legislative CommitteesAssembly Committee on Agriculture
Honorable Nicole Parra, Chairman1020 N Street, Suite 362Sacramento, CA 95814(916) 319-2084; Fax (916) 319-2184www.assembly.ca.gov
Senate Committee on Agriculture andWater Resources
Honorable Abel Maldonado, Chairman1020 N Street, Suite 244Sacramento, CA 95814(916) 651-1508www.senate.ca.gov
California Resources Agency
1416 Ninth Street, Suite 1311Sacramento, CA 95814(916) 653-5656; Fax (916) 653-8102www.resources.ca.gov
CALFED Bay-Delta Authority650 Capitol Mall, 5th FloorSacramento, CA 95814(916) 445-5511www.calwater.ca.gov
California Coastal Commission45 Fremont Street, Suite 2000San Francisco, CA 94105-2219(415) 904-5200; Fax (415) 904-5400www.coastal.ca.gov
California Coastal Conservancy1330 Broadway, 11th FloorOakland, CA 94612(510) 286-1015www.scc.ca.gov
California Energy Commission1516 Ninth Street MS-29Sacramento, CA 95814-5512(916) 654-4287www.energy.ca.gov
Colorado River Board of California770 Fairmont Avenue, Suite 100Glendale, CA 91203-1035(818) 500-1625www.crb.ca.gov
Selected Government Agencies

164 California Agricultural Resource Directory 2006
Department of Conservation801 K Street, MS 24-01Sacramento, CA 95814(916) 322-1080; Fax (916) 445-0732www.consrv.ca.gov
Department of Fish and Game1416 Ninth StreetSacramento, CA 95814(916) 653-7667; Fax (916) 653-7387www.dfg.ca.gov
Department of Forestry and Fire Protection1416 Ninth StreetSacramento, CA 94244-2460(916) 653-5123; Fax (916) 653-4171www.fire.ca.gov
Department of Parks and RecreationPost Office Box 942896Sacramento, CA 94296(916) 653-6995; Fax (916) 654-6374www.parks.ca.gov
Department of Water Resources1416 Ninth StreetSacramento, CA 95814(916) 653-5791; Fax (916) 653-4684www.water.ca.gov
Reclamation Board3310 El Camino Avenue, Room LL40Sacramento, CA 94236(916) 574-0609; Fax (916) 574-0682www.recbd.ca.gov
California State Lands Commission
100 Howe Avenue, Suite 100 SouthSacramento, CA 95825-8202(916) 574-1900; Fax (916) 574-1810www.slc.ca.gov
U.S. Bureau of Reclamation
Mid-Pacific Region2800 Cottage WaySacramento, CA 95825(916) 978-5100; Fax (916) 978-5114www.usbr.gov/mp
U.S. Department of Agriculture — California OfficesAgricultural Research Service
San Joaquin Valley Agricultural Sciences Center9611 South Riverbend AvenueParlier, California 93648-9757(559) 596-2999www.ars.usda.gov/main/site_main.
htm?modecode=53020000
Western Regional Research Center800 Buchanan StreetAlbany, CA 94710(510) 559-5600; Fax (510) 559-5779www.pwa.ars.usda.gov
Animal and Plant HealthInspection Service, Veterinary Services
California/Nevada Area Office9580 Micron Avenue, Suite ESacramento, CA 95827(916) 857-6196www.aphis.usda.gov
California Marketing Order BranchAgricultural Marketing Service2202 Monterey Street, Suite 102-BFresno, CA 93721(559) 487-5901; Fax (559) 487-5906www.ams.usda.gov
Farm Service Agency430 G Street, Suite 4161Davis, CA 95616-4161(530) 792-5520www.fsa.usda.gov/ca
Food and Nutrition ServicesWestern Regional Office550 Kearny Street, Room 400San Francisco, CA 94108-2518(415) 705-1310; Fax (415) 705-1353www.fns.usda.gov/fns
Food Safety and Inspection Service620 Central Avenue, Building 2CAlameda, CA 94501(510) 337-5000; Fax (510) 337-5081www.fsis.usda.gov
Forest ServicePacific Southwest Region1323 Club DriveVallejo, CA 94592(707) 562-8737www.r5.fs.fed.us
Grain Inspection, Packers andStockyards Administration
California Designated Private AgencyPost Office Box 980187West Sacramento, CA 95798(916) 374-9700; Fax (916) 374-9779www.gipsa.usda.gov
National Agricultural Statistics ServiceCalifornia Field Office650 Capitol Mall, Suite 6-100Sacramento, CA 95814(916) 498-5161; Fax (916) 498-5186www.nass.usda.gov/ca
National Resources Conservation Service430 G Street, Suite 4164Davis, CA 95616-4164(530) 792-5644; Fax (530) 792-5791www.ca.nrcs.usda.gov
Risk Management Agency430 G Street, Suite 4168Davis, CA, 95616-4168(530) 792-5870; Fax (530) 792-5893www.rma.usda.gov
Rural Development430 G Street, Suite 4169Davis, CA 95616-4169(530) 792-5800; Fax (530) 792-5837www.rurdev.usda.gov/ca
U.S. Department of Agriculture — National OfficesOffice of Communications
(202) 720-4623www.usda.gov/OC_Index.xml
Farm and ForeignAgricultural ServicesFarm Service Agency
Public Affairs(202) 720-7809www.fsa.usda.gov
Foreign Agricultural ServicePublic Affairs(202) 720-3448www.fas.usda.gov
Risk Management AgencyPublic Affairs(202) 690-0437www.rma.usda.gov
Food, Nutrition andConsumer ServicesCenter for Nutrition Policy and Promotion
Information(703) 305-7600www.cnpp.usda.govwww.mypyramid.gov
Food and Nutrition ServiceCommunications and
Governmental Affairs(703) 305-2281www.fns.usda.gov/fns
Food SafetyFood Safety and Inspection Service
Congressional and Public Affairs(202) 720-9113www.fsis.usda.gov
Selected Government Agencies

California Agricultural Resource Directory 2006 165
Marketing andRegulatory ProgramsAgricultural Marketing Service
Public Affairs(202) 720-8998www.ams.usda.gov
Animal and Plant HealthInspection Service
Legislative and Public Affairs(202) 720-2511www.aphis.usda.gov
Grain Inspection, Packers andStockyards Administration
Public and Congressional Relations(202) 720-0219www.gipsa.usda.gov
Natural Resourcesand EnvironmentForest Service
National Press Office(202) 205-8333www.fs.fed.us
Natural Resources Conservation ServiceLegislative and Public Affairs(202) 720-3210www.nrcs.usda.gov
Research, Educationand EconomicsAgricultural Research Service
Information Staff(301) 504-1638www.ars.usda.gov
Cooperative State Research, Educationand Extension Service
Office of Communication(202) 720-2677www.csrees.usda.gov
Economic Research ServiceERS Information and Publications(202) 694-5050www.ers.usda.gov
National Agricultural LibraryPublic Affairs(301) 504-5564www.nal.usda.gov
National Agricultural Statistic ServiceCalifornia Information Hotline(800) 851-1127www.nass.usda.gov
Rural DevelopmentCommunity Development Programs
(202) 619-7980http://ocdweb.sc.egov.usda.gov
Rural Business-Cooperative Program(202) 690-4730www.rurdev.usda.gov/rbs
Rural Housing Program(202) 690-1533www.rurdev.usda.gov/rhs
Rural Utilities Program(202) 720-9540www.rurdev.usda.gov/rus
STATE DEPARTMENTS OF FOOD AND AGRICULTURE
National Association of State Departments of Agriculture
1156 15th Street, NW, Suite 1020Washington, D.C. 20005(202) 296-9680; Fax (202) 296-9686www.nasda.org
Alabama Department of Agricultureand Industries
Richard Beard Building Post Office Box 3336Montgomery, AL 36109-0336(334) 240-7100; Fax (334) 240-7190http://agi.state.al.us
State of Alaska Division of Agriculture1800 Glenn Highway, Suite 12Palmer, AK 99645-6736(907) 745-7200; Fax (907) 745-7112www.dnr.state.ak.us/ag
Arizona Department of Agriculture1688 West AdamsPhoenix, AZ 85007(602) 542-0990; Fax (602) 542-5420http://agriculture.state.az.us
Arkansas State Plant Board1 Natural Resources DriveLittle Rock, AR 72205(501) 225-1598; Fax (501) 219-1697www.plantboard.org
California Department of Foodand Agriculture
1220 N Street, 4th FloorSacramento, CA 95814(916) 654-0433; Fax (916) 654-0403www.cdfa.ca.gov
Colorado Department of Agriculture700 Kipling Street, Suite 4000Lakewood, CO 80215-8000(303) 239-4100; Fax (303) 239-4125www.ag.state.co.us
Connecticut Department of Agriculture165 Capitol AvenueHartford, CT 06105(860) 713-2500; Fax; (860) 713-2514www.state.ct.us/doag
Delaware Department of Agriculture2320 South DuPont HighwayDover, DE 19901(302) 698-4500; Fax (302) 697-4463www.state.de.us/deptagri
Florida Department of Agricultureand Consumer Services
The Capitol PL10Tallahassee, FL 32399-0810(850) 488-3022; Fax (850) 922-4936http://doacs.state.fl.us
Georgia Department of Agriculture204 Agriculture Building19 Martin Luther King Jr. DriveAtlanta, GA 30334(404) 656-3600; Fax (404) 651-8206www.agr.state.ga.us
Hawaii Department of Agriculture1428 South King StreetHonolulu, HI 96814-2512(808) 973-9560; Fax (808) 973-9613www.hawaiiag.org/hdoa
Idaho Department of AgriculturePost Office Box 790Boise, ID 83701(208) 332-8500; Fax (208) 334-2170www.agri.state.id.us
Illinois Department of AgricultureState FairgroundsPost Office Box 19281Springfield, IL 62794-9281(217) 782-2172; Fax (217) 785-4505www.agr.state.il.us
State of IndianaLieutenant Governor and Commissionerof Agriculture
150 West Market Street, Suite 414Indianapolis, IN 46204(317) 232-8770; Fax (317) 232-1362www.in.gov/oca
State Departments of Food and Agriculture

166 California Agricultural Resource Directory 2006
Iowa Department of Agricultureand Land Stewardship
Wallace Building502 East Ninth StreetDes Moines, IA 50319(515) 281-5321; Fax (515) 281-6236www.agriculture.state.ia.us
Kansas Department of Agriculture109 Southwest Ninth Street, 4th FloorTopeka, KS 66612-1280(785) 296-3556; Fax (785) 296-8389www.accesskansas.org/kda
Kentucky Department of AgricultureCapitol Annex, Room188Frankfort, KY 40601(502) 564-5126; Fax (502) 564-5016www.kyagr.com
Louisiana Department of Agricultureand Forestry
Post Office Box 631Baton Rouge, LA 70821-0631(225) 922-1234; Fax (225) 922-1253www.ldaf.state.la.us
Maine Department of Agriculture,Food and Rural Resources
Deering Building28 State House StationAugusta, ME 04333(207) 287-3419; Fax (207) 287-7548www.maine.gov/agriculture
Maryland Department of Agriculture50 Harry S. Truman ParkwayAnnapolis, MD 21401(410) 841-5880; Fax (410) 841-5914www.mda.state.md.us
Massachusetts Departmentof Agricultural Resources
251 Causeway Street, Suite 500Boston, MA 02114-2151(617) 626-1700; Fax (617) 626-1850www.state.ma.us/dfa
Michigan Department of AgriculturePost Office Box 30017525 West AlleganLansing, MI 48909(517) 373-1052; Fax (517) 335-1423www.michigan.gov/mda
Minnesota Department of Agriculture625 North Robert StreetSt. Paul, MN 55155(651) 201-6023; Fax (651) 201-6125www.mda.state.mn.us
Mississippi Department of Agricultureand Commerce
121 North Jefferson StreetJackson, MS 39201(601) 359-1100; Fax (601) 354-7710www.mdac.state.ms.us
Missouri Department of Agriculture1616 Missouri BoulevardPost Office Box 630Jefferson City, MO 65102(573) 751-4211; Fax (573) 751-5002www.mda.mo.gov
Montana Department of AgriculturePost Office Box 200201Helena, MT 59620-0201(406) 444-3144; Fax (406) 444-5409http://agr.state.mt.us
Nebraska Department of AgriculturePost Office Box 94947301 Centennial Mall South, 4th FloorLincoln, NE 68509-4947(402) 471-2341; Fax (402) 471-6876www.agr.state.ne.us
Nevada Department of Agriculture251 Jeanell Avenue, Suite 3Carson City, NV 89703(775) 688-1180; Fax (775) 688-1178http://agri.state.nv.us
New Hampshire Department ofAgriculture, Markets and Food
Post Office Box 2042Concord, NH 03302-2042(603) 271-3551; Fax (603) 271-1109http://agriculture.nh.gov
New Jersey Department of AgriculturePost Office Box 330Trenton, NJ 08625(609) 292-3976; Fax (609) 292-3978www.state.nj.us/agriculture
New Mexico Department of AgriculturePost Office Box 30005MSC 3189Las Cruces, NM 88003-8005(505) 646-3007; Fax (505) 646-8120www.nmda.nmsu.edu
New York Department of Agricultureand Markets
10B Airline DriveAlbany, NY 12235(518) 457-4188; Fax (518) 457-3087www.agmkt.state.ny.us
North Carolina Department ofAgriculture and Consumer Services
1001 Mail Service CenterRaleigh, NC 27699(919) 733-7125; Fax (919) 733-1141www.ncagr.com
North Dakota Department of Agriculture600 E Boulevard Avenue, Department 602Bismarck, ND 58505-0020(701) 328-2231; Fax (701) 328-4567www.agdepartment.com
Ohio Department of Agriculture8995 East Main StreetReynoldsburg, OH 43068(614) 466-2732; Fax (614) 466-6124www.ohioagriculture.gov
Oklahoma Department of Agriculture,Food and Forestry
2800 North Lincoln BoulevardOklahoma City, OK 73105(405) 521-3864; Fax (405) 522-0909www.oda.state.ok.us
Oregon Department of Agriculture635 Capitol Street, NortheastSalem, OR 97301-2532(503) 986-4552; Fax (503) 986-4750www.oregon.gov/ODA
Pennsylvania Department of Agriculture2301 North Cameron StreetHarrisburg, PA 17110-9408(717) 772-2853; Fax (717) 705-8402www.pda.state.pa.us
Rhode Island Division of Agriculture235 Promenade Street, Room 370Providence, RI 02908-5767(401) 222-2781; Fax (401) 222-6047www.dem.ri.gov/programs/bnatres/
agricult/index.htm
South Carolina Department of AgriculturePost Office Box 11280Columbia, SC 29211(803) 734-2190; Fax (803) 734-2192www.scda.state.sc.us
South Dakota Department of Agriculture523 East CapitolPierre, SD 57501-3182(605) 773-5425; Fax (605) 773-5926www.state.sd.us/doa
Tennessee Department of AgriculturePost Office Box 40627Nashville TN, 37204(615) 837-5100; Fax (615) 837-5333www.state.tn.us/agriculture
Texas Department of AgriculturePost Office Box 12847Capitol StationAustin, TX 78711-2847(512) 463-7476; Fax (512) 463-1104www.agr.state.tx.us
Utah Department of Agriculture and Food350 North Redwwod RoadPost Office Box 146500Salt Lake City, UT 84114-6500(801) 538-7101; Fax (801) 538-7126www.ag.state.ut.us
State Departments of Food and Agriculture

California Agricultural Resource Directory 2006 167
Vermont Agency of Agriculture,Food and Markets
116 State Street, Drawer 20Montpelier, VT 05620-2901(802) 828-2430; Fax (802) 828-2361www.vermontagriculture.com
Virginia Department of Agricultureand Consumer Services
102 Governer Street. Richmond VA 23219(804) 786-3501; Fax (804) 371-2945www.vdacs.state.va.us
Washington Department of AgriculturePost Office Box 42560Olympia, WA 98504-2560(360) 902-1976; Fax (360) 902-2092http://agr.wa.gov
West Virginia Department of Agriculture1900 Kanawha Boulevard, EastCharleston, WV 25305(304) 558-2201; Fax (304) 558-2203www.wvagriculture.org
Wisconsin Department of Agriculture,Trade and Consumer Protection
2811 Agriculture DriveMadison, WI 53708(608) 224-5012; Fax (608) 224-5045http://datcp.state.wi.us
Wyoming Department of Agriculture2219 Carey AvenueCheyenne, WY 82002(307) 777-6569; Fax (307) 777-6593http://wyagric.state.wy.us
American Samoa Department of Agriculture
Post Office Box 1442Pago Pago, AS 96799(684) 699-1497; Fax (684) 699-4031www.asg-gov.net/AGRICULTURE.htm
Guam Department of Agriculture163 Dairy RoadMangilao, GU 96923(671) 734-3942; Fax (671) 734-6569www.gov.gu
Puerto Rico Department of AgriculturePost Office Box 10163Santurce, Puerto Rico 00908-1163(787) 722-0871; Fax (787) 723-8512www.agricultura.gobierno.pr
Virgin Islands Departmentof Agriculture
1 Estate Lower LoveSt. Croix, VI 00850(340) 778-0997; Fax (340) 778-7977www.usvi.org/agriculture
UNIVERSITY AGRICULTURAL PROGRAMS
U.C. Cooperative Extension County OfficesAlameda County
1131 Harbor Bay Parkway, Suite 131Alameda, CA 94502(510) 567-6812; Fax (510) 567-9644http://cealameda.ucdavis.edu/[email protected]
Amador County12200 B Airport RoadJackson, CA 95642-9527(209) 223-6482; Fax (209) 223-3279http://[email protected]
Butte County2279-B Del Oro AvenueOroville, CA 95965(530) 538-7201; Fax (530) 538-7140http://[email protected]
Calaveras County891 Mountain Ranch RoadSan Andreas, CA 95249(209) 754-6477; Fax (209) 754-6472http://[email protected]
Colusa CountyPost Office Box 180100 Sunrise Boulevard, Suite EColusa, CA 95932(530) 458-0570; Fax (530) 458-4625http://[email protected]
Contra Costa County75 Santa Barbara Road, 2nd FloorPleasant Hill, CA 94523-4215(925) 646-6540; Fax (925) 646-6708http://[email protected]
Del Norte County586 G StreetCrescent City, CA 95531(707) 464-4711; Fax (707) [email protected]
El Dorado County311 Fair LanePlacerville, CA 95667(530) 621-5502; Fax (530) 642-0803http://[email protected]
Fresno County1720 South Maple AvenueFresno, CA 93702(559) 456-7285; Fax (559) 456-7575http://[email protected]
Glenn County821 East South StreetOrland, CA 95963(530) 865-1107; Fax (530) 865-1109http://[email protected]
Humboldt-Del Norte Counties5630 South BroadwayEureka, CA 95503-6998(707) 445-7351; Fax (707) 444-9334http://[email protected]
Imperial County1050 East Holton RoadHoltville, CA 92250-9615(760) 352-9474; Fax (760) 352-0846http://[email protected]
Inyo-Mono Counties207 West South StreetBishop, CA 93514(760) 873-7854; Fax (760) 873-7314http://[email protected]
Kern County1031 South Mount Vernon AvenueBakersfield, CA 93307(661) 868-6200; Fax (661) 868-6208http://[email protected]
University Agricultural Programs

168 California Agricultural Resource Directory 2006
Kings County680 North Campus Drive, Suite AHanford, CA 93230(559) 582-3211 Ext 2730;
Fax (559) 582-5166http://[email protected]
Lake County883 Lakeport BoulevardLakeport, CA 95453(707) 263-6838; Fax (707) 263-3963http://[email protected]
Lassen County707 Nevada StreetSusanville, CA 96130(530) 251-2601; Fax (530) 251-2666http://[email protected]
Los Angeles County4800 Cesar Chavez AvenueLos Angeles, CA 90022(323) 260-2267; Fax (323) 260-5208http://[email protected]
Madera County328 Madera AvenueMadera, CA 93637(559) 675-7879; Fax (559) 675-0639http://[email protected]
Marin County1682 Novato Boulevard, Suite 150-BNovato, CA 94947(415) 499-4204; Fax (415) 499-4209http://[email protected]
Mariposa County5009 Fairgrounds RoadMariposa, CA 95338-9435(209) 966-2417; Fax (209) 966-5321http://[email protected]
Mendocino County890 North Bush StreetUkiah, CA 95482(707) 463-4495; Fax (707) 463-4477http://[email protected]
Merced County2145 West Wardrobe AvenueMerced, CA 95340-6445(209) 385-7403; Fax (209) 722-8856http://[email protected]
Modoc County202 West Fourth StreetAlturas, CA 96101(530) 233-6400; Fax (530) [email protected]
Tulelake OfficePost Office Box 8502816 Havlina RoadTulelake, CA 96134(530) 667-2719; Fax (530) 667-5265http://[email protected]
Monterey County1432 Abbott StreetSalinas, CA 93901(831) 759-7350; Fax (831) 758-3018http://[email protected]
Napa County1710 Soscol Avenue, Suite 4Napa, CA 94559-1315(707) 253-4221; Fax (707) 253-4434http//:[email protected]
Nevada County255 South Auburn StreetGrass Valley, CA 95945(530) 273-4563; Fax (530) 273-4769http://cenevada.ucdavis.edu/E-mail: [email protected]
Orange County1045 Arlington Drive, Gate 4Costa Mesa, CA 92626(714) 708-1606; Fax (714) 708-2754http://[email protected]
Placer-Nevada Counties11477 E AvenueAuburn, CA 95603(530) 889-7385; (Fax) 530-889-7397http://[email protected]
Plumas-Sierra Counties208 Fairgrounds RoadQuincy, CA 95971(530) 283-6270; Fax (530) 283-6088http://[email protected]
Riverside County21150 Box Springs Road, Suite 202Moreno Valley, CA 92557-8718(951) 683-6491; Fax (951) 788-2615http://[email protected]
Sacramento County4145 Branch Center RoadSacramento, CA 95827-3898(916) 875-6913; Fax (916) 875-6233http://[email protected]
San Benito County649 San Benito Street, Suite 115Hollister, CA 95023(831) 637-5346; Fax (831) 637-7111http://[email protected]
San Bernardino County777 East Rialto AvenueSan Bernardino, CA 92415-0730(909) 387-2171; Fax (909) 387-3306http://[email protected]
San Diego County5555 Overland Avenue, Suite 4101San Diego, CA 92123-1219(858) 694-2845; Fax (858) 694-2849http://[email protected]
San Francisco Office300 Piedmont AvenueBuilding B, Room 227San Bruno, CA 94066(650) 871-7559; Fax (650) 871-7399http://cesanmateo.ucdavis.eduE-mail: [email protected]
San Joaquin County420 South Wilson WayStockton CA 95205(209) 468-2085; Fax (209) 462-5181http://[email protected]
San Luis Obispo County2156 Sierra Way, Suite CSan Luis Obispo, CA 93401(805) 781-5940; Fax (805) 781-4316http://[email protected]
San Mateo-San Francisco Counties80 Stone Pine Road, Suite 100Half Moon Bay, CA 94019(650) 712-3151; Fax (650) 712-3153http://[email protected]
Santa Barbara County624 West Foster Road, Suite ASanta Maria, CA 93455(805) 934-6240; Fax (805) 934-6333http://[email protected]
University Agricultural Programs

California Agricultural Resource Directory 2006 169
Santa Clara County1553 Berger Drive, Building 1San Jose, CA 95112(408) 282-3110; Fax (408) 298-5160http://[email protected]
Santa Cruz County1432 Freedom BoulevardWatsonville, CA 95076-2796(831) 763-8040; Fax (831) 763-8006http://[email protected]
Shasta County1851 Hartnell AvenueRedding, CA 96002-2217(530) 224-4900; Fax (530) 224-4904http://[email protected]
Siskiyou County1655 South Main StreetYreka, CA 96097(530) 842-2711; Fax (530) 842-6931http://[email protected]
Solano County501 Texas StreetFairfield, CA 94533-4498(707) 784-1317; Fax (707) 429-5532http://[email protected]
Sonoma County133 Aviation Boulevard, Suite 109Santa Rosa, CA 95403(707) 565-2621; Fax (707) [email protected]
Stanislaus County3800 Cornucopia Way, Suite AModesto, CA 95358(209) 525-6800; Fax (209) 525-6840http://[email protected]
Sutter-Yuba Counties142-A Garden HighwayYuba City, CA 95991-5512(530) 822-7515; Fax (530) 673-5368http://[email protected]
Tehama County1754 Walnut StreetRed Bluff, CA 96080(530) 527-3101; Fax (530) 527-0917http://[email protected]
Tulare County4437 South Laspina Street, Suite BTulare, CA 93274(559) 685-3303; Fax (559) 685-3319http://[email protected]
Tuolumne County2 South Green StreetSonora, CA 95370(209) 533-5695; Fax (209) 532-8978http://[email protected]
Ventura County669 County Square Drive, Suite 100Ventura, CA 93003-5401(805) 645-1451; Fax (805) 645-1474http://[email protected]
Yolo County70 Cottonwood StreetWoodland, CA 95695(530) 666-8143; Fax (530) 666-8736http://[email protected]
California State UniversityCalifornia State University, ChicoCollege of Agriculture
400 West First StreetChico, CA 95929-0310(530) 898-5844; Fax (530) 898-5845www.csuchicoag.org
California State University, FresnoCalifornia Agricultural Technology Institute
2910 East Barstow Avenue, M/S OF115Fresno, CA 93740-8009(559) 278-2361; Fax (559) 278-4849www.cati.csufresno.edu
College of Agricultural Sciences and Technology
2415 East San Ramon Avenue, M/S AS79Fresno, CA 93740(559) 278-2061; Fax (559) 278-4496http://cast.csufresno.edu
California State Polytechnic University,PomonaCollege of Agriculture
3801 West Temple AvenuePomona, CA 91768(909) 869-2200; Fax (909) 869-4454www.csupomona.edu/[email protected]
California Polytechnic State University,San Luis ObispoCollege of Agriculture
1 Grand Avenue, Building 11-211San Luis Obispo, CA 93407(805) 756-2161; Fax (805) 756-6577http://[email protected]
University of CaliforniaUC BerkeleyCollege of Natural Resources
101 Giannini HallBerkeley, CA 94720(510) 642-7171; Fax (510) [email protected]
UC DavisCollege of Agricultural and EnvironmentalSciences
1 Shields AvenueDavis, CA 95616-8571(530) 752-0108; Fax (530) 752-9049www.aes.ucdavis.edu
School of Veterinary MedicineOffice of the Dean1 Shields AvenueDavis, CA 95616-8754(530) 752-1360; Fax (530) 752-2801www.vetmed.ucdavis.edu
UC RiversideCollege of Natural and Agricultural Sciences
300 College Building NorthRiverside, CA 92521-0127(951) 827-4799; Fax (951) 827-4190www.cnas.ucr.edu
UC Santa CruzCenter for Agroecology and Sustainable FoodSystems
1156 High StreetSanta Cruz, CA 95064(831) 459-3240; Fax (831) 459-2799http://zzyx.ucsc.edu/casfs
UC Agriculture and Natural ResourcesOffice of the Vice President
1111 Franklin Street, 6th FloorOakland, CA 94607-5200(510) 987-0060; Fax (510) 451-2317http://ucanr.org
ANR Central Coast and South Region1150 University AvenueRoom 130, Highlander Hall Building C,UCR #213Riverside, CA 92521(951) 827-3321; Fax (951) 827-4675http://ccsr.ucdavis.edu
ANR Central Valley RegionKearney Agricultural Center9240 South Riverbend AvenueParlier, CA 93648(559) 646-6518; Fax (559) 646-6513http://cvr.ucdavis.edu
ANR North Coast and Mountain RegionANR Building, Hopkins RoadUniversity of California, DavisDavis, CA 95616(530) 754-8509; Fax (530) 754-8540http://ncmr.ucdavis.edu
University Agricultural Programs

170 California Agricultural Resource Directory 2006
ANR Research and Extension CentersDesert Research and Extension Center
1004 East Holton RoadEl Centro, CA 92243(760) 356-3060; Fax (760) 356-3073http://danrrec.ucdavis.edu/desert/home_
page.html
Hopland Research and Extension Center4070 University RoadHopland, CA 95449(707) 744-1424; Fax (707) 744-1040http://danrrec.ucdavis.edu/hopland/
home_page.html
Intermountain Research and Extension Center
Post Office Box 8502816 Havlina RoadTulelake, CA 96134(530) 667-5117; Fax (530) 667-5265http://danrrec.ucdavis.edu/intermountain/
home_page.html
Kearney Research and Extension Center9240 South Riverbend AvenueParlier, CA 93648(559) 646-6000; Fax (559) 646-6015http://danrrec.ucdavis.edu/kearney/
home_page.html
Lindcove Research and Extension Center22963 Carson AvenueExeter, CA 93221(559) 592-2408; Fax (559) 592-5947http://danrrec.ucdavis.edu/lindcove/
home_page.html
Shafter Research and Extension Center17053 North Shafter AvenueShafter, CA 93263(661) 746-8037; Fax (661) 746-1619http://danrrec.ucdavis.edu/shafter/home_
page.html
Sierra Foothill Research and Extension Center
8279 Scott Forbes RoadBrowns Valley, CA 95918(530) 639-8800; Fax (530) 639-2419http://danrrec.ucdavis.edu/sierra_foothill/
home_page.html
South Coast Research and Extension Center
7601 Irvine BoulevardIrvine, CA 92618-1201(949) 653-1810; Fax (949) 653-1800http://danrrec.ucdavis.edu/south_coast/
home_page.html
West Side Research and Extension CenterPost Office Box 15817353 West Oakland AvenueFive Points, CA 93624-0158(559) 884-2411; Fax (559) 884-2216http://danrrec.ucdavis.edu/west_side/
home_page.html
Statewide and Campus ProgramsAgricultural Issues Center
1 Shields AvenueDavis, CA 95616-8514(530) 752-2320; Fax (530) [email protected]
Agricultural Personnel Management Program
1 Shields Avenue Davis, CA 95616-8514(510) 642-7103; Fax (530) 752-5451 http://are.berkeley.edu/APMPhttp://www.cnr.berkeley.edu/ucce50/ag-
labor
Biological and Agricultural Engineering1 Shields Avenue, 2030 Bainer HallDavis, CA 95616-5294(530) 752-0102; Fax (530) 752-2640http://[email protected]
California 4-H Youth DevelopmentAgriculture and Natural ResourcesDANR Building, One Hopkins RoadDavis, CA 95616(530) 754-8518; Fax (530) 754-8541http://[email protected]
California AquacultureOne Shields Avenue1067 Academic Search Davis, CA 95616-8525(530) 752-7601; Fax (530) 752-4508http://aqua.ucdavis.edu
Center for Consumer Research1 Shields AvenueDavis, CA 95616-8598(530) 752-2774; Fax (530) 752-3975http://[email protected]
Center for CooperativesRural Cooperative CenterRoom 2116, Social Science and
Humanities BuildingDavis, CA 95616(530) 752-2408; Fax (530) [email protected]
Center for Forestry163 Mulford Hall, #3114Berkeley, CA 94720-3114(510) 642-0095; Fax (510) 643-3490http://nature.berkeley.edu/forestry
Center for Water ResourcesRubidoux Hall, #094Riverside, CA 92521-0436(915) 827-4327; Fax (915) 827-5295www.waterresources.ucr.edu
Discovery Grant2087 Addison Street, 2nd FloorBerkeley, CA 94720-3340(510) 643-3229; Fax (510) 643-7839www.ucdiscoverygrant.org
Expanded Food and NutritionEducation Program
1 Shields Avenue, 31501 Meyer HallDavis, CA 95616(530) 754-8698; Fax (530) 752-7588http://efnep.ucdavis.edu
Genetic Resources Conservation Program1 Shields AvenueDANR Building 127, Hopkins RoadDavis, CA 95616-8602(530) 754-8501; Fax (530) 754-8505www.grcp.ucdavis.edu
Giannini Foundation of Agricultural and Resource Economics
207 Giannini Hall, #3310Berkeley, CA 94720-3310(510) 642-3345; Fax (510) 643-8911www.are.berkeley.edu
Integrated Hardwood RangeManagement Program
145 Mulford Hall, #3114Berkeley, CA 94720-3114(510) 642-0095; Fax (510) 643-3490http://danr.ucop.edu/ihrmp
IR-4 Program, Western Region1 Shields Avenue, 4218 Meyer HallDavis, CA 95616-8588(530) 752-7633; Fax (530) 752-2866http://ir4.rutgers.edu
Kearney Foundation of Soil ScienceUniversity of California, Davis3234 Plant & Environmental Sciences
BuildingDavis, CA 95616(530) 754-9668; Fax (530) 752-2360http://kearney.ucdavis.edu
Mosquito Research Program1 Shields Avenue, 396C Briggs Hall Davis, CA 95616-8584(530) 752-5652; Fax (530) 752-1537www.ucmrp.ucdavis.edu
University Agricultural Programs

California Agricultural Resource Directory 2006 171
Sea Grant Extension Program1 Shields AvenueDavis, CA 95616-8751(530) 752-1497; Fax (530) 754-7780www.csgc.ucsd.edu
Small Farm Center1 Shields AvenueDavis, CA 95616-8699(530) 752-8136; Fax (530) 752-7716www.sfc.ucdavis.edu
Statewide-Integrated Pest ManagementProgram
1 Shields AvenueDavis, CA 95616-8621(530) 752-8350; Fax (530) 752-6004www.ipm.ucdavis.edu
Sustainable Agriculture Research andEducation Program
1 Shields AvenueDavis, CA 95616-8716(530) 752-7556; Fax (530) 754-8550www.sarep.ucdavis.edu
Vegetable Research and Information Center1 Shields AvenueDavis, CA 95616-8746(530) 752-1748; Fax (530) 752-2278http://vric.ucdavis.edu
Veterinary Medicine Teaching andResearch Center
18830 Road 112Tulare, CA 93274(559) 688-1731; Fax (559) 686-4231www.vmtrc.ucdavis.edu
Weed Research and Information Center1 Shields AvenueDavis, CA 95616-8746(530) 752-1748; Fax (530) 752-2278http://wric.ucdavis.edu
Wildland Resources Center145 Mulford Hall, #3114Berkeley, CA 94720-3114(510) 642-0095; Fax (510) 643-3490http://danr.ucop.edu/wrc
WATER AND NATURAL RESOURCES
Association of California Water Agencies 910 K Street, Suite 100Sacramento, CA 95814-3512(916) 441-4545; Fax (916) 325-4849www.acwa.com
CALFED Bay-Delta Program 650 Capitol Mall, 5th FloorSacramento, CA 95814(916) 445-5511; Fax (916) 445-7297www.calwater.ca.gov
California Association of Resource Conservation Districts
801 K Street, Suite 1415Sacramento, CA 958174(916) 457-7904; Fax: (916) 457-7934www.carcd.org
California Central Valley Flood Control Association
910 K Street, Suite 310Sacramento, CA 95814(916) 446-0197; Fax (916) 446-2404E-mail: [email protected]
California Department of Water ResourcesPost Office Box 942836Sacramento, CA 94236(916) 653-6192; Fax (916) 653-4684www.dwr.water.ca.gov
California Farm Water Coalition 717 K Street, Suite 417Sacramento, CA 95814(916) 441-7723; Fax (916) 441-7842www.cfwc.com
California Groundwater Association Post Office Box 14369Santa Rosa, CA 95402-6369(707) 578-4408; Fax (707) 546-4906www.groundh2o.org
Central Valley Project Water Association 1521 I StreetSacramento, CA 95814(916) 448-1638; Fax (916) 446-1063E-mail: [email protected]
Colorado River Board of California 770 Fairmont Avenue, Suite 100Glendale, CA 91203-1035(818) 500-1625; Fax (818) 543-4685www.crb.ca.gov
Family Water Alliance Post Office Box 365Maxwell, CA 95955-0365(530) 438-2026; Fax (530) 438-2940www.familywateralliance.com
Friant Water Users Authority 854 North Harvard AvenueLindsay, CA 93247-1715(559) 562-6305; Fax (559) 562-3496www.friantwater.org
Northern California Water Association 455 Capitol Mall, Suite 335Sacramento, CA 95814(916) 442-8333; Fax (916) 442-4035www.norcalwater.org
Sacramento River Water Contractors Association
910 K Street, Suite 310Sacramento, CA 95814(916) 446-0197; Fax (916) 446-2404
State Water Contractors 1121 L Street, Suite 1050Sacramento, CA 95814(916) 447-7357; Fax (916) 447-2734www.swc.org
Water Association of Kern County 801 South Mount Vernon AvenueBakersfield, CA 93307(661) 397-7426; Fax (661) 397-3403www.wakc.com
Water Education Foundation 717 K Street, Suite 317Sacramento, CA 95814(916) 444-6240; Fax (916) 448-7699www.watereducation.org
Water Reuse Association of California915 L Street, Suite 1000Sacramento, CA 95814(866) 805-9241 Fax (916) 442-0382www.watereuse.org
Water and Natural Resources

California Department of Food and Agriculture Executive Team Executive Team Executive Team Executive Team
Left to right:Valerie Brown, Deputy SecretaryNancy Lungren, Deputy Secretary for Public Affairs
Left to right:Dr. Richard Breitmeyer, State VeterinarianJohn Dyer, Chief Counsel
Left to right:Robert Tse, Director, Trade PolicyBob Wynn, Statewide Coordinator, Pierce’s Disease Control Program
Left to right:Kim Myrman, Deputy SecretaryDavid Pegos, Assistant Secretary for LegislationEric Stein, Deputy Secretary for Legislation & Policy
172 California Agricultural Resource Directory 2006
Executive Team

Top row, left to right:John Connell, Director, Plant Health and Pest Prevention ServicesNate Dechoretz, Director, Inspection ServicesGeorge Deese, Director, Administrative ServicesDavood Ghods, Chief Information Offi cer, Planning and Information TechnologyDennis Johannes, Director, Measurement Standards
Middle row, left to right:Kelly Krug, Director, Marketing ServicesHelen Lopez, Executive Director, California State Board of Food and AgricultureSteve Lyle, Director, Public AffairsSteve Shaffer, Director, Agricultural and Environmental StewardshipMike Treacy, Director, Fairs and Expositions
Bottom row, left to right:Dr. Annette Whiteford, Director, Animal Health and Food Safety ServicesEd Williams, County/State Liaison
Top row, left to right:Top row, left to right:John Connell, Director, Plant Health and Pest Prevention ServicesNate Dechoretz, Director, Inspection ServicesGeorge Deese, Director, Administrative ServicesDavood Ghods, Chief Information Offi cer, Planning and Information TechnologyDennis Johannes, Director, Measurement Standards
Middle row, left to right:Kelly Krug, Director, Marketing ServicesHelen Lopez, Executive Director, California State Board of Food and AgricultureSteve Lyle, Director, Public Affairs
Top row, left to right:
Ed Williams, County/State LiaisonEd Williams, County/State LiaisonEd Williams, County/State Liaison
Left to right:Julia Blanton, Policy Analyst
Jonnalee Henderson, Policy Analyst
Top row, left to right:
California Agricultural Resource Directory 2006 173
Executive Team

A.J. Yates retired as undersecretary in January
2007 after working for no fewer than four agency
secretaries at the California Department of Food
and Agriculture (CDFA).
Following three decades of farming in Fresno
County, Yates started his second career — as a
public servant — at CDFA in 1991. He worked
for secretaries Henry Voss, Ann Veneman and
William (Bill) Lyons Jr. until 2000. Following
that, he was tapped by then-U.S. Department of
Agriculture Secretary Veneman as administrator
of the federal agency’s Agricultural Marketing Service. Yates returned to
CDFA in 2004 under Secretary A.G. Kawamura.
A.J. Yates is one of the leading statesmen of California agriculture —
a rare talent with a deep, intuitive understanding of both farming
and government.
Thank you, A.J., for your vision and leadership. We wish you all the best!
Thank You, Mr. Undersecretary!

California Agricultural Resource Directory 2006 175
CHECK PUBLICATION TITLE AND DESCRIPTION
LIST THE YEARS DOMESTIC ENTER HERE YOU ARE BUYING CHARGE AMOUNT
U S D A - N A S S , C A L I F O R N I A F I E L D O F F I C E R E Q U E S T F O R M
UNITED STATES DEPARTMENT OF AGRICULTURE NATIONAL AGRICULTURAL STATISTICS SERVICE
California Field OfficePost Office Box 1258
Sacramento, CA 95812(916) 498-5161; Fax (916) 498-5186
E-mail: [email protected] • www.nass.usda.gov/ca
Complete the “publication request” if you want to purchase one or more publications on a one-time basis only. We will mail you the latest release unless you indicate otherwise.
Complete the “subscription request” if you want to be placed on our regular mailing list for upcoming releases.
For all requests, check the publications you wish to receive, enter the amount in the space provided and total the cost of all fees. Please be sure to complete the “requested by” information.
Publications on this order form can be viewed free-of-charge at www.nass.usda.gov/ca. Please forward any inquires to our e-mail address at [email protected]
Publication Request
California Agricultural Resource Directory 2006: (2005 Crop) $ 15.00 Year-end summary for field crops, fruit and nut crops, vegetable and melon crops, per year livestock, dairy and poultry. Also includes cash receipts, exports, floriculture, top counties, and U.S. and state rankings.
County Agricultural Commissioners’ Data: Annual Bulletin $ 20.00 County acreage, production and value by commodity. Crop years available: 1980-2005. per year
Grape Acreage: Annual Bulletin $ 10.00 Grape acreage by year planted, variety and county. per year
Crop years available: 1961, 1964, 1969 and 1972-2005.
Grape Crush Report (Final): Annual Bulletin $10.00 Tons purchased, crushed, Brix factors and price per ton by variety and district. per year
Crop years available: 1976-2005.
Summary of County Agricultural Commissioners’ Reports: Annual Bulletin $ 5.00 Gross values by commodity groups. Crop years available: 1981-2005. per year
TOTAL ONE-TIME CHARGE
Continued on next page

176 California Agricultural Resource Directory 2006
CHECK PUBLICATION TITLE AND DESCRIPTION
SUBSCRIPTION RATE ENTER HERE (FIRST CLASS MAL) AMOUNT FOREIGN1 DOMESTIC2
Subscription Request 910 Field Crop Review: Monthly Grain, cotton, hay, potatoes, sugar beets, etc.; acreage, production, value;
price and warehouse data. $ 30.00 $ 15.00
920 Fruit and Nut Review: Monthly except November Berry, grape, citrus, deciduous fruit and nut acreage, production, price and utilization. $ 30.00 $ 15.00
922 Grape Crush Report (Preliminary and Final): February and March Bulletins Tons purchased, crushed, Brix factors and price per ton by variety and district. $ 40.00 $ 20.00
923 Grape Acreage: Annual Bulletin Grape acreage by year planted, variety and county. $ 20.00 $ 10.00
931 Vegetable Review: January, April, July, September and October Processing and fresh market vegetable and potato acreage, production and value. $ 14.00 $ 7.00
940 Livestock Review: Monthly Livestock inventories, intentions and values, pasture, slaughter and on-feed data for
cattle and sheep. $ 30.00 $ 15.00
960 Poultry Review: Monthly Chicken and turkey settings, hatchings, eggs produced, inventory, value and cold storage. $ 30.00 $ 15.00
TOTAL SUBSCRIPTION FEES
1 Foreign mailing is via airmail. All checks must be drawn on a U.S. bank.2 Mexico’s rate is the same as domestic rate.
Payment
Make your check or money order payable to: USDA-NASS/CDFA
Send this request form with remittance to: USDA, National Agricultural Statistics Service California Field Office Post Office Box 1258 Sacramento, CA 95812-1258
Requested by
Company or Firm Name: _________________________________________________________________________________________________
Name _________________________________________________________________________________________________________________
Mailing Address: ________________________________________________________________________________________________________
City, State & Zip: _______________________________________________________________________________________________________
E-mail Address: ________________________________________________________________________________________________________