california alternate assessments performance … alternate assessments performance level descriptors...
TRANSCRIPT
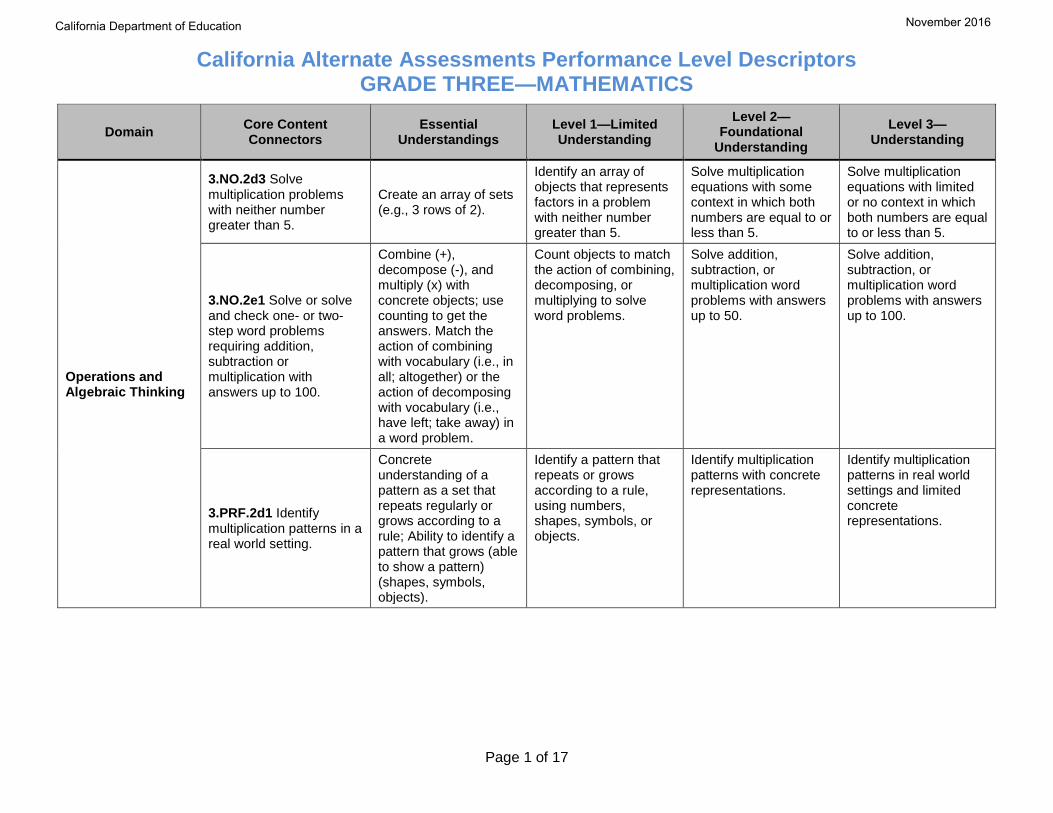
California Alternate Assessments Performance Level Descriptors GRADE THREE—MATHEMATICS
Page 1 of 17
Domain Core Content Connectors
Essential Understandings
Level 1—Limited Understanding
Level 2— Foundational
Understanding
Level 3—Understanding
Operations and Algebraic Thinking
3.NO.2d3 Solvemultiplication problemswith neither numbergreater than 5.
Create an array of sets (e.g., 3 rows of 2).
Identify an array of objects that represents factors in a problem with neither number greater than 5.
Solve multiplication equations with some context in which both numbers are equal to less than 5.
or
Solve multiplication equations with limited or no context in which both numbers are equal to or less than 5.
3.NO.2e1 Solve or solveand check one- or two-step word problemsrequiring addition,subtraction ormultiplication withanswers up to 100.
Combine (+), decompose (-), and multiply (x) with concrete objects; use counting to get the answers. Match the action of combining with vocabulary (i.e., in all; altogether) or the action of decomposing with vocabulary (i.e., have left; take away) in a word problem.
Count objects to match the action of combining, decomposing, or multiplying to solve word problems.
Solve addition, subtraction, or multiplication word problems with answers up to 50.
Solve addition, subtraction, or multiplication word problems with answers up to 100.
3.PRF.2d1 Identifymultiplication patterns real world setting.
in a
Concrete understanding of a pattern as a set that repeats regularly or grows according to a rule; Ability to identify a pattern that grows (able to show a pattern) (shapes, symbols, objects).
Identify a pattern that repeats or grows according to a rule, using numbers, shapes, symbols, or objects.
Identify multiplication patterns with concrete representations.
Identify multiplication patterns in real world settings and limited concrete representations.
California Department of Education November 2016
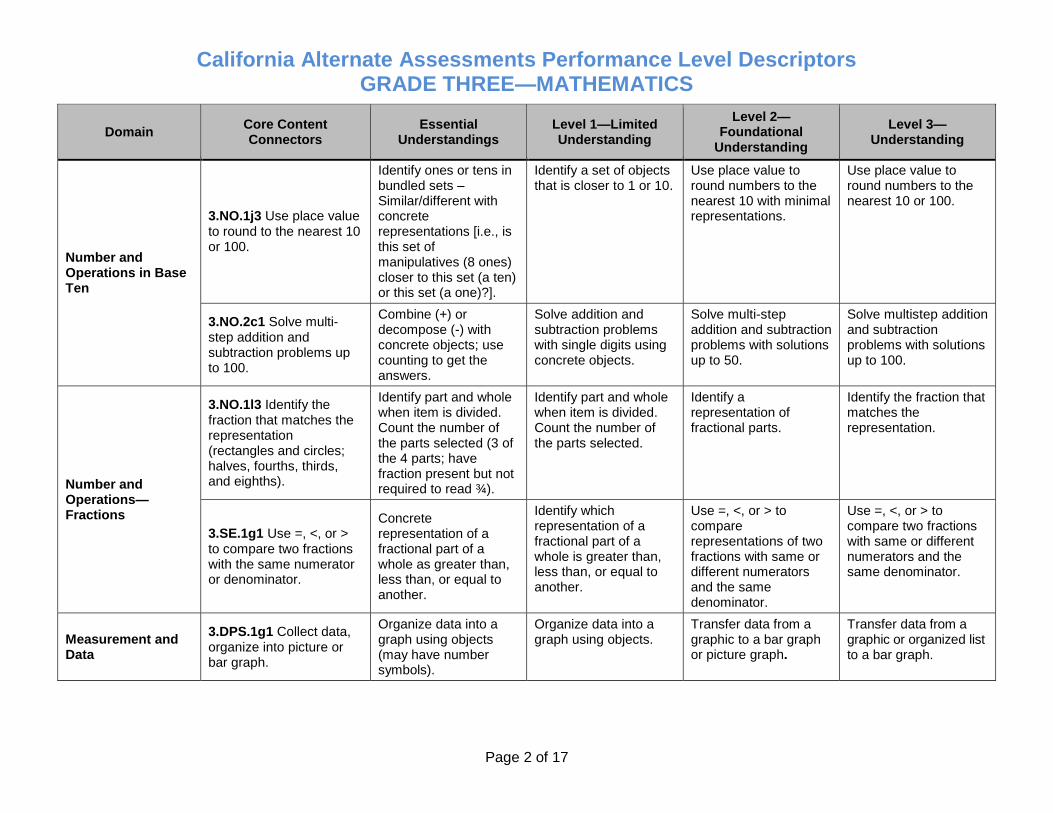
California Alternate Assessments Performance Level Descriptors GRADE THREE—MATHEMATICS
Page 2 of 17
Domain Core Content Connectors
Essential Understandings
Level 1—Limited Understanding
Level 2— Foundational
Understanding
Level 3—Understanding
Number and Operations in Base Ten
3.NO.1j3 Use place value to round to the nearest 10 or 100.
Identify ones or tens in bundled sets – Similar/different with concrete representations [i.e., is this set of manipulatives (8 ones) closer to this set (a ten) or this set (a one)?].
Identify a set of that is closer to
objects 1 or 10.
Use place value to round numbers to the nearest 10 with minimal representations.
Use place value to round numbers to the nearest 10 or 100.
3.NO.2c1 Solve multi-step addition and subtraction problems up to 100.
Combine (+) or decompose (-) with concrete objects; use counting to get the answers.
Solve addition and subtraction problems with single digits using concrete objects.
Solve multi-step addition and subtraction problems with solutions up to 50.
Solve multistep addition and subtraction problems with solutions up to 100.
Number and Operations—Fractions
3.NO.1l3 Identify the fraction that matches the representation (rectangles and circles; halves, fourths, thirds, and eighths).
Identify part and whole when item is divided. Count the number of the parts selected (3 of the 4 parts; have fraction present but not required to read ¾).
Identify part and whole when item is divided. Count the number of the parts selected.
Identify a representation of fractional parts.
Identify the fraction that matches the representation.
3.SE.1g1 Use =, <, or > to compare two fractions with the same numerator or denominator.
Concrete representation of a fractional part of a whole as greater than, less than, or equal to another.
Identify which representation of a fractional part of a whole is greater than, less than, or equal to another.
Use =, <, or > to compare representations of two fractions with same or different numerators and the same denominator.
Use =, <, or > to compare two fractions with same or different numerators and the same denominator.
Measurement Data
and 3.DPS.1g1 Collect data, organize into picture or bar graph.
Organize data into a graph using objects (may have number symbols).
Organize data into a graph using objects.
Transfer data from a graphic to a bar graph or picture graph.
Transfer data from a graphic or organized list to a bar graph.
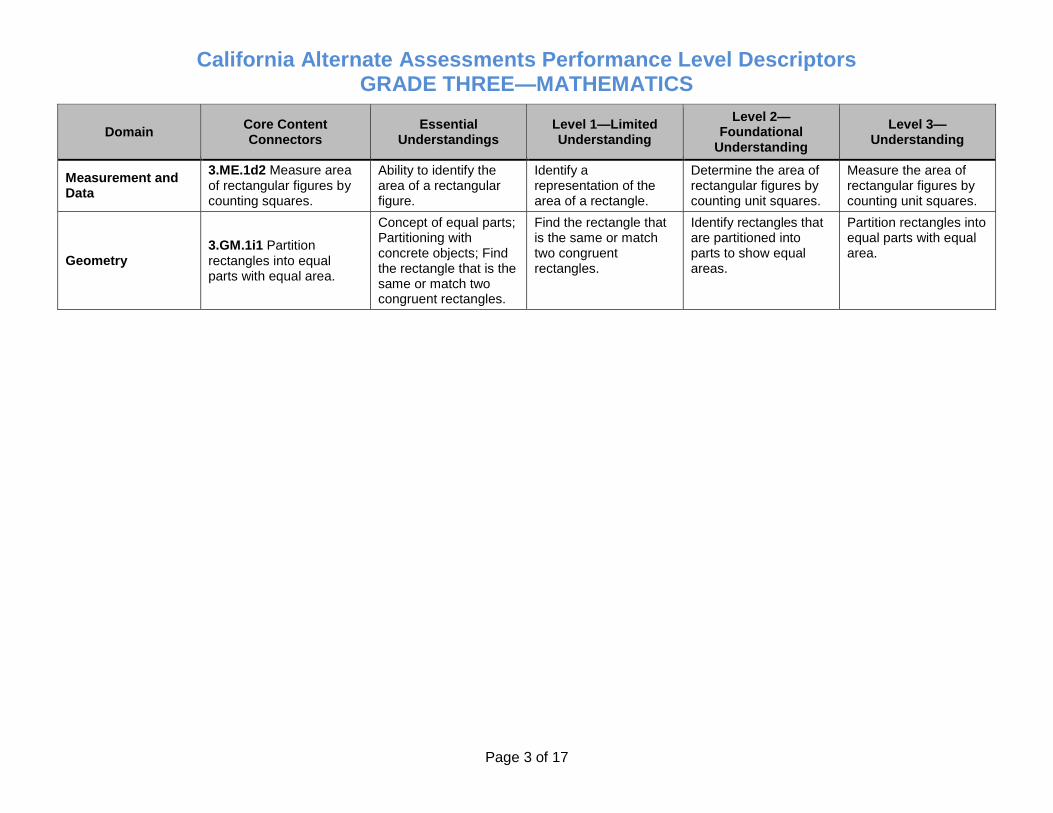
California Alternate Assessments Performance Level Descriptors GRADE THREE—MATHEMATICS
Page 3 of 17
Domain Core Content Connectors
Essential Understandings
Level 1—Limited Understanding
Level 2— Foundational
Understanding
Level 3—Understanding
Measurement Data
and 3.ME.1d2 Measure area of rectangular figures by counting squares.
Ability to identify the area of a rectangular figure.
Identify a representation of the area of a rectangle.
Determine the area of rectangular figures by counting unit squares.
Measure the area of rectangular figures by counting unit squares.
Geometry 3.GM.1i1 Partition rectangles into equal parts with equal area.
Concept of equal parts; Partitioning with concrete objects; Find the rectangle that is the same or match two congruent rectangles.
Find the rectangle that is the same or match two congruent rectangles.
Identify rectangles that are partitioned into parts to show equal areas.
Partition rectangles into equal parts with equal area.
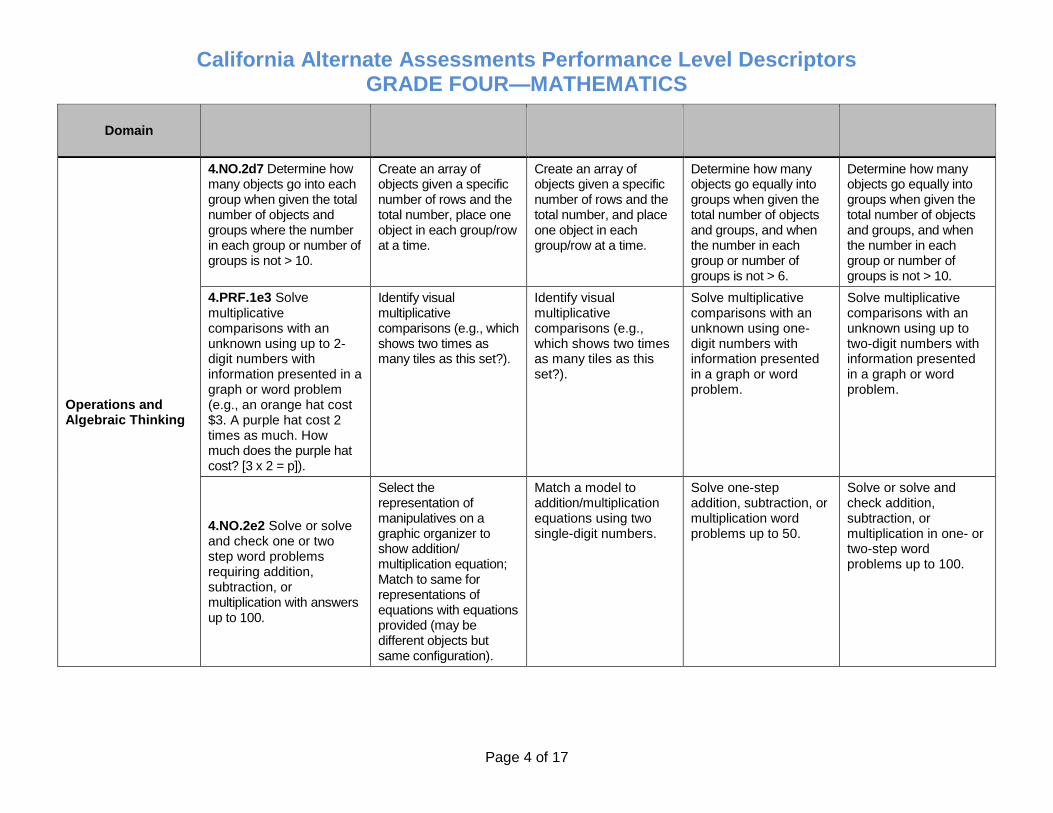
California Alternate Assessments Performance Level Descriptors GRADE FOUR—MATHEMATICS
Page 4 of 17
Domain Core Content Connectors
Essential Understandings
Level 1—Limited Understanding
Level 2— Foundational
Understanding
Level 3—Understanding
Operations and Algebraic Thinking
4.NO.2d7 Determine how many objects go into each group when given the total number of objects and groups where the number in each group or number of groups is not > 10.
Create an array of objects given a specific number of rows and the total number, place one object in each group/row at a time.
Create an array of objects given a specific number of rows and the total number, and place one object in each group/row at a time.
Determine how many objects go equally into groups when given the total number of objects and groups, and when the number in each group or number of groups is not > 6.
Determine how many objects go equally into groups when given the total number of objects and groups, and when the number in each group or number of groups is not > 10.
4.PRF.1e3 Solve multiplicative comparisons with an unknown using up to 2-digit numbers with information presented in a graph or word problem (e.g., an orange hat cost $3. A purple hat cost 2 times as much. How much does the purple hat cost? [3 x 2 = p]).
Identify visual multiplicative comparisons (e.g., which shows two times as many tiles as this set?).
Identify visual multiplicative comparisons (e.g., which shows two times as many tiles as this set?).
Solve multiplicative comparisons with an unknown using one-digit numbers with information presented in a graph or word problem.
Solve multiplicative comparisons with an unknown using up to two-digit numbers with information presented in a graph or word problem.
4.NO.2e2 Solve or solve and check one or two step word problems requiring addition, subtraction, or multiplication with answers up to 100.
Select the representation of manipulatives on a graphic organizer to show addition/ multiplication equation; Match to same for representations of equations with equations provided (may be different objects but same configuration).
Match a model to addition/multiplication equations using two single-digit numbers.
Solve one-step addition, subtraction, or multiplication word problems up to 50.
Solve or solve and check addition, subtraction, or multiplication in one- two-step word problems up to 100.
or
California Alternate Assessments Performance Level Descriptors GRADE FOUR—MATHEMATICS
Page 5 of 17
Domain Core Content Connectors
Essential Understandings
Level 1—Limited Understanding
Level 2— Foundational
Understanding
Level 3—Understanding
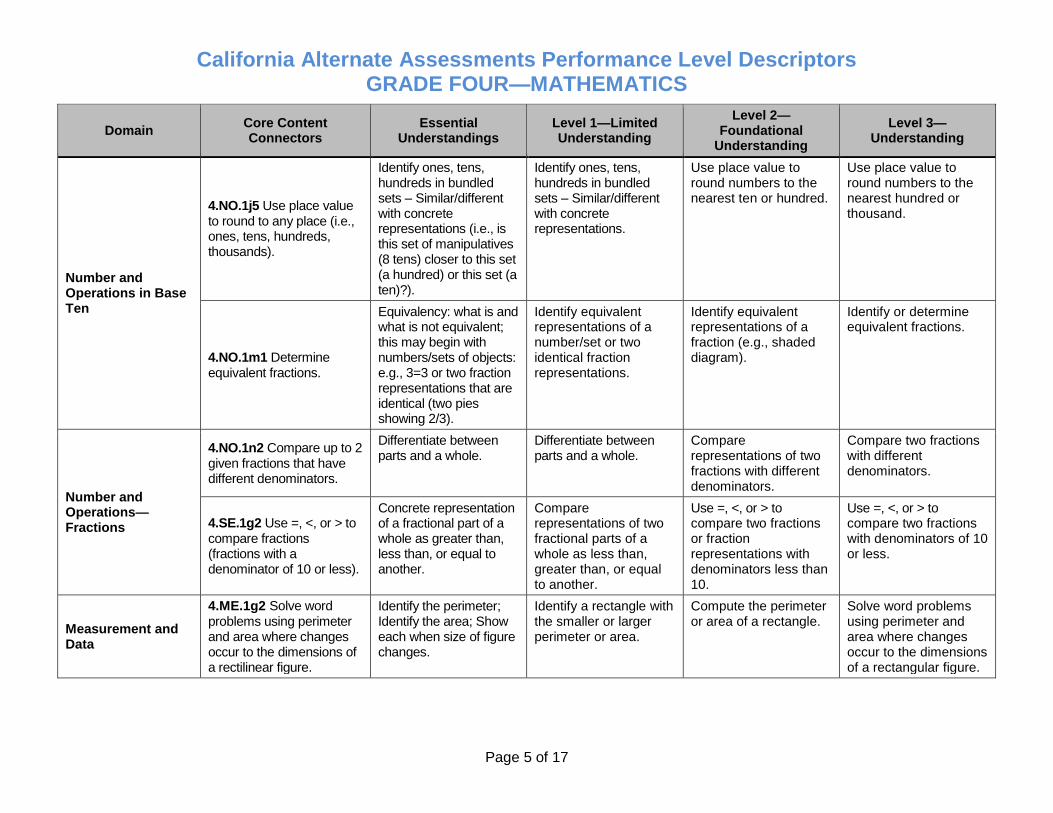
Identify ones, tens, Identify ones, tens, Use place value to Use place value to hundreds in bundled hundreds in bundled round numbers to the round numbers to the
4.NO.1j5 Use place value to round to any place (i.e., ones, tens, hundreds, thousands).
sets – Similar/different with concrete representations (i.e., is this set of manipulatives (8 tens) closer to this set
sets – Similar/different with concrete representations.
nearest ten or hundred. nearest hundred or thousand.
Number and Operations in Base Ten
(a hundred) or this set (a ten)?).
Equivalency: what is and what is not equivalent;
Identify equivalent representations of a
Identify equivalent representations of a
Identify or determine equivalent fractions.
4.NO.1m1 Determine this may begin with numbers/sets of objects:
number/set or two identical fraction
fraction (e.g., shaded diagram).
equivalent fractions. e.g., 3=3 or two fraction representations. representations that are identical (two pies showing 2/3).
Number and Operations—Fractions
4.NO.1n2 Compare up to given fractions that have different denominators.
2 Differentiate between parts and a whole.
Differentiate between parts and a whole.
Compare representations of two fractions with different denominators.
Compare two fractions with different denominators.
4.SE.1g2 Use =, <, or > to compare fractions
Concrete representation of a fractional part of a whole as greater than,
Compare representations of two fractional parts of a
Use =, <, or > to compare two fractions or fraction
Use =, <, or > to compare two fractions with denominators of 10
(fractions with a less than, or equal to whole as less than, representations with or less. denominator of 10 or less). another. greater than, or equal denominators less than
to another. 10.
4.ME.1g2 Solve word Identify the perimeter; Identify a rectangle with Compute the perimeter Solve word problems
Measurement Data
and problems using perimeter and area where changes occur to the dimensions of
Identify the each when changes.
area; Show size of figure
the smaller or larger perimeter or area.
or area of a rectangle. using perimeter and area where changes occur to the dimensions
a rectilinear figure. of a rectangular figure.
California Alternate Assessments Performance Level Descriptors GRADE FOUR—MATHEMATICS
Page 6 of 17
Domain Core Content Connectors
Essential Understandings
Level 1—Limited Understanding
Level 2— Foundational
Understanding
Level 3—Understanding
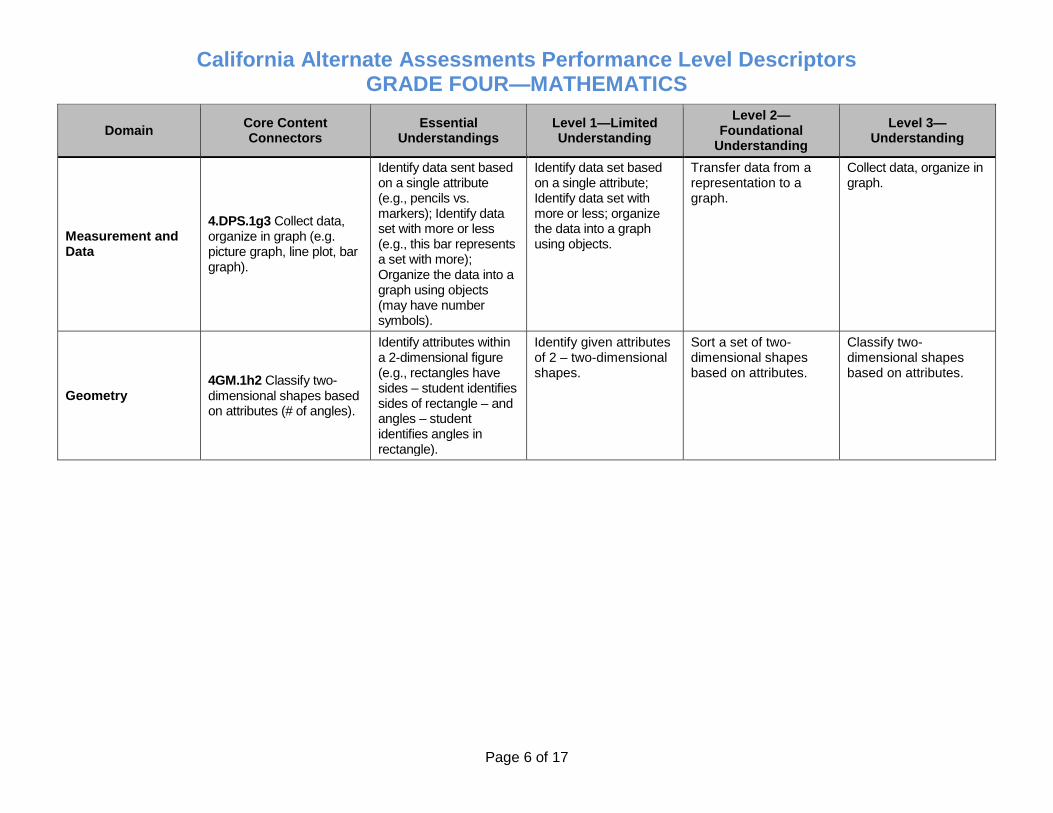
Measurement Data
and 4.DPS.1g3 Collect data, organize in graph (e.g. picture graph, line plot, bar graph).
Identify data sent based on a single attribute (e.g., pencils vs. markers); Identify data set with more or less (e.g., this bar represents a set with more); Organize the data into a graph using objects (may have number symbols).
Identify data set based on a single attribute; Identify data set with more or less; organize the data into a graph using objects.
Transfer data from a representation to a graph.
Collect graph.
data, organize in
Geometry 4GM.1h2 Classify two-dimensional shapes based on attributes (# of angles).
Identify attributes within a 2-dimensional figure (e.g., rectangles have sides – student identifies sides of rectangle – and angles – student identifies angles in rectangle).
Identify given attributes of 2 – two-dimensional shapes.
Sort a set of two-dimensional shapes based on attributes.
Classify two- dimensional shapes based on attributes.
California Alternate Assessments Performance Level Descriptors GRADE FIVE—MATHEMATICS
Page 7 of 17
Domain Core Content Connectors
Essential Understandings
Level 1—Limited Understanding
Level 2— Foundational
Understanding
Level 3—Understanding
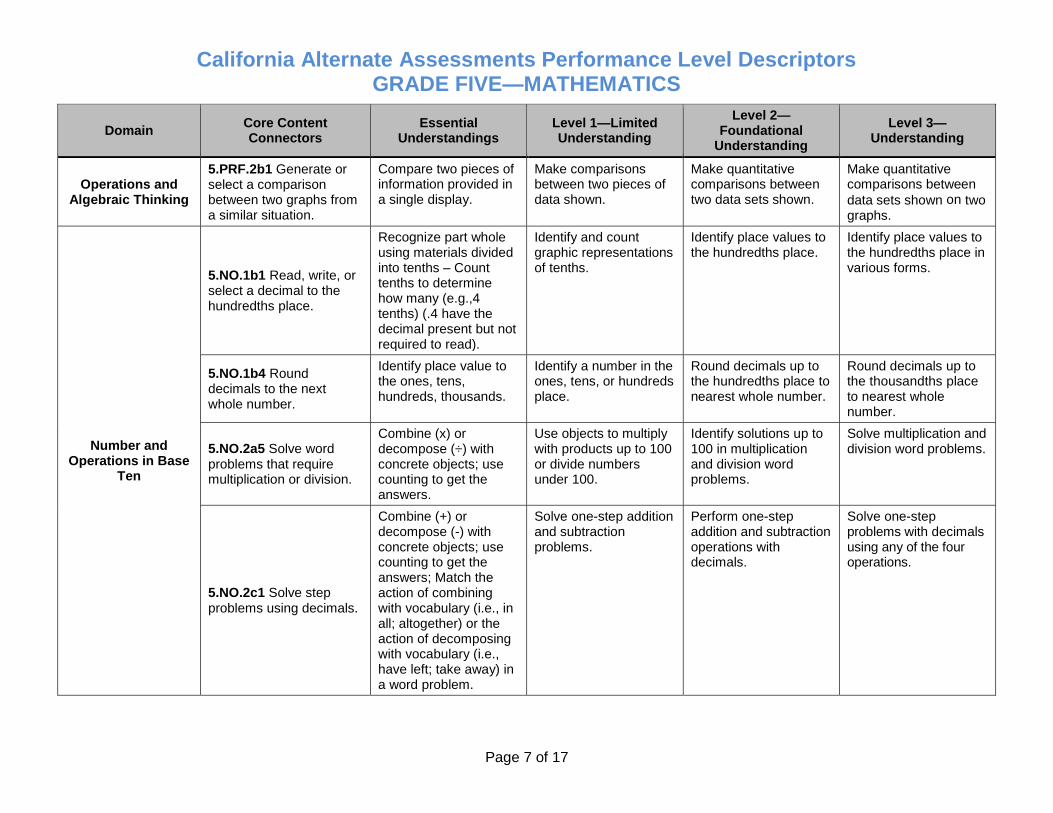
Operations and Algebraic Thinking
5.PRF.2b1 Generate or select a comparison between two graphs from a similar situation.
Compare two pieces of information provided in a single display.
Make comparisons between two pieces of data shown.
Make quantitative comparisons between two data sets shown.
Make quantitative comparisons between
data sets shown on two
graphs.
Number and Operations in Base
Ten
5.NO.1b1 Read, write, select a decimal to the hundredths place.
or
Recognize part whole using materials divided into tenths – Count tenths to determine how many (e.g.,4 tenths) (.4 have the decimal present but not required to read).
Identify and count graphic representations of tenths.
Identify place values to the hundredths place.
Identify place values to the hundredths place in various forms.
5.NO.1b4 Round decimals to the next whole number.
Identify place value to the ones, tens, hundreds, thousands.
Identify a number in the ones, tens, or hundreds place.
Round decimals up to the hundredths place to nearest whole number.
Round decimals the thousandths to nearest whole number.
up to place
5.NO.2a5 Solve word problems that require multiplication or division.
Combine (x) or decompose (÷) with concrete objects; use counting to get the answers.
Use objects to multiply with products up to 100 or divide numbers under 100.
Identify solutions up to 100 in multiplication and division word problems.
Solve multiplication and division word problems.
5.NO.2c1 Solve step problems using decimals.
Combine (+) or decompose (-) with concrete objects; use counting to get the answers; Match the action of combining with vocabulary (i.e., in all; altogether) or the action of decomposing with vocabulary (i.e., have left; take away) in a word problem.
Solve one-step addition and subtraction problems.
Perform one-step addition and subtraction operations with decimals.
Solve one-step problems with decimals using any of the four operations.
California Alternate Assessments Performance Level Descriptors GRADE FIVE—MATHEMATICS
Page 8 of 17
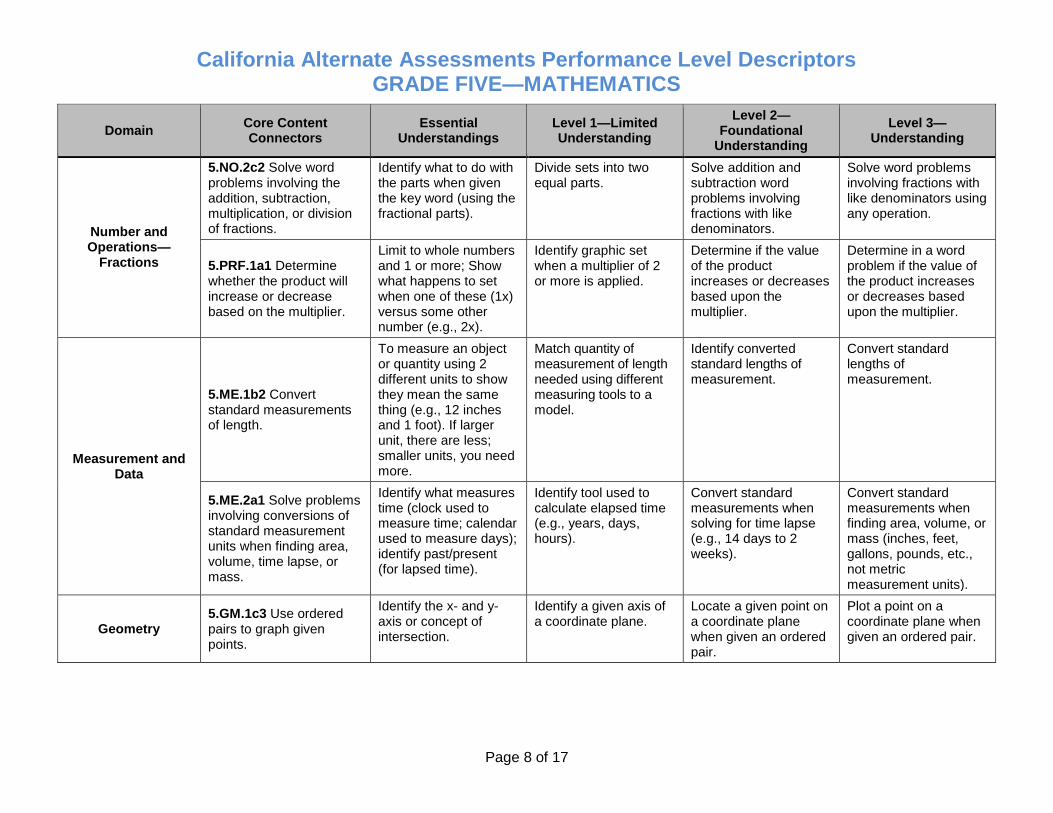
Domain Core Content Connectors
Essential Understandings
Level 1—Limited Understanding
Level 2— Foundational
Understanding
Level 3—Understanding
Number and Operations—
Fractions
5.NO.2c2 Solve word problems involving the addition, subtraction, multiplication, or division of fractions.
Identify what to do with the parts when given the key word (using the fractional parts).
Divide sets into equal parts.
two Solve addition and subtraction word problems involving fractions with like denominators.
Solve word problems involving fractions with like denominators using any operation.
5.PRF.1a1 Determine whether the product will increase or decrease based on the multiplier.
Limit to whole numbers and 1 or more; Show what happens to set when one of these (1x) versus some other number (e.g., 2x).
Identify graphic set when a multiplier of 2 or more is applied.
Determine if the value of the product increases or decreases based upon the multiplier.
Determine in a word problem if the value of the product increases or decreases based upon the multiplier.
Measurement and Data
5.ME.1b2 Convert standard measurements of length.
To measure an object or quantity using 2 different units to show they mean the same thing (e.g., 12 inches and 1 foot). If larger unit, there are less; smaller units, you need more.
Match quantity of measurement of length needed using different measuring tools to a model.
Identify converted standard lengths of measurement.
Convert standard lengths of measurement.
5.ME.2a1 Solve problems involving conversions of standard measurement units when finding area, volume, time lapse, or mass.
Identify what measures time (clock used to measure time; calendar used to measure days); identify past/present (for lapsed time).
Identify tool used to calculate elapsed time (e.g., years, days, hours).
Convert standard measurements when solving for time lapse (e.g., 14 days to 2 weeks).
Convert standard measurements when finding area, volume, or mass (inches, feet, gallons, pounds, etc., not metric measurement units).
Geometry 5.GM.1c3 Use ordered pairs to graph given points.
Identify the x- and axis or concept of intersection.
y- Identify a given axis a coordinate plane.
of Locate a given point on a coordinate plane when given an ordered pair.
Plot a point on a coordinate plane when given an ordered pair.
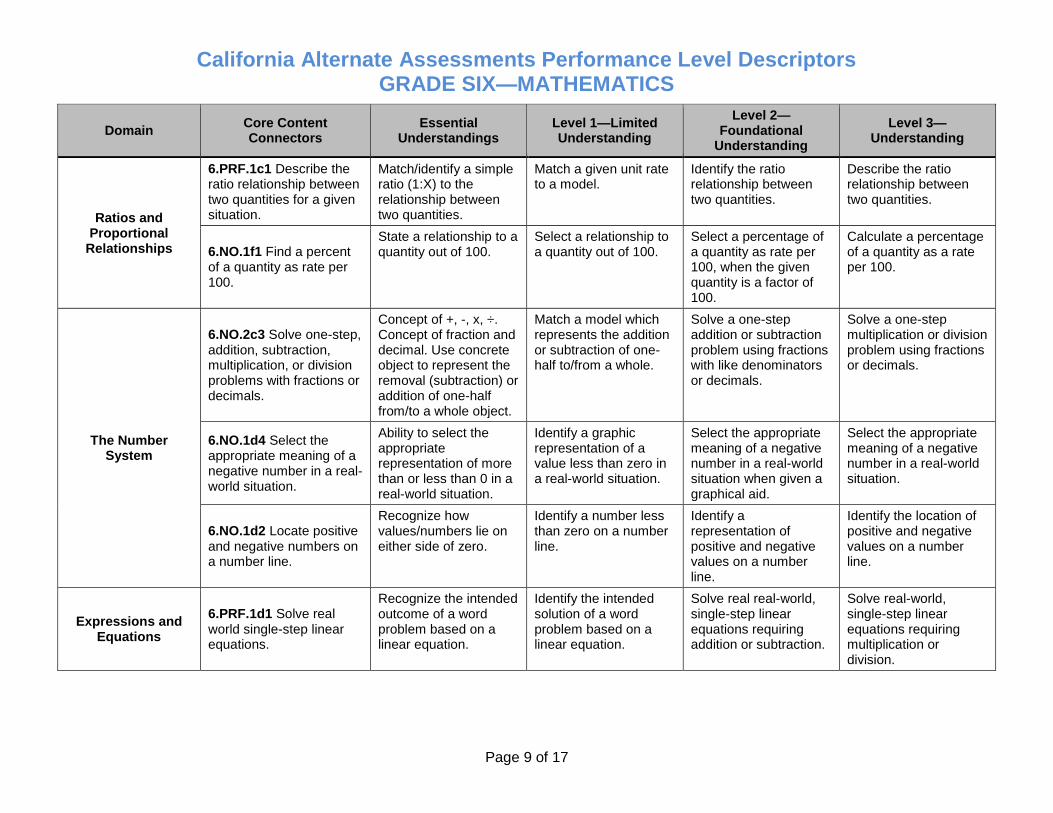
California Alternate Assessments Performance Level Descriptors GRADE SIX—MATHEMATICS
Page 9 of 17
Domain Core Content Connectors
Essential Understandings
Level 1—Limited Understanding
Level 2— Foundational
Understanding
Level 3—Understanding
Ratios and Proportional
Relationships
6.PRF.1c1 Describe the ratio relationship between two quantities for a given situation.
Match/identify a simple ratio (1:X) to the relationship between two quantities.
Match a given unit rate to a model.
Identify the ratio relationship between two quantities.
Describe the ratio relationship between two quantities.
6.NO.1f1 Find a percent of a quantity as rate per 100.
State a relationship to quantity out of 100.
a Select a relationship to a quantity out of 100.
Select a percentage of a quantity as rate per 100, when the given quantity is a factor of 100.
Calculate a percentage of a quantity as a rate per 100.
6.NO.2c3 Solve one-step, addition, subtraction, multiplication, or division problems with fractions or decimals.
Concept of +, -, x, ÷. Concept of fraction and decimal. Use concrete object to represent the removal (subtraction) or addition of one-half
Match a model which represents the addition or subtraction of one-half to/from a whole.
Solve a one-step addition or subtraction problem using fractions with like denominators or decimals.
Solve a one-step multiplication or division problem using fractions or decimals.
The Number System
from/to a whole object.
6.NO.1d4 Select the appropriate meaning of a negative number in a real-world situation.
Ability to select the appropriate representation of more than or less than 0 in a real-world situation.
Identify a graphic representation of a value less than zero in a real-world situation.
Select the appropriate meaning of a negative number in a real-world situation when given a graphical aid.
Select the appropriate meaning of a negative number in a real-world situation.
6.NO.1d2 Locate positive and negative numbers on a number line.
Recognize how values/numbers lie on either side of zero.
Identify a number less than zero on a number line.
Identify a representation of positive and negative values on a number
Identify the location of positive and negative values on a number line.
line.
Expressions and Equations
6.PRF.1d1 Solve real world single-step linear equations.
Recognize the intended outcome of a word problem based on a linear equation.
Identify the intended solution of a word problem based on a linear equation.
Solve real real-world, single-step linear equations requiring addition or subtraction.
Solve real-world, single-step linear equations requiring multiplication or division.
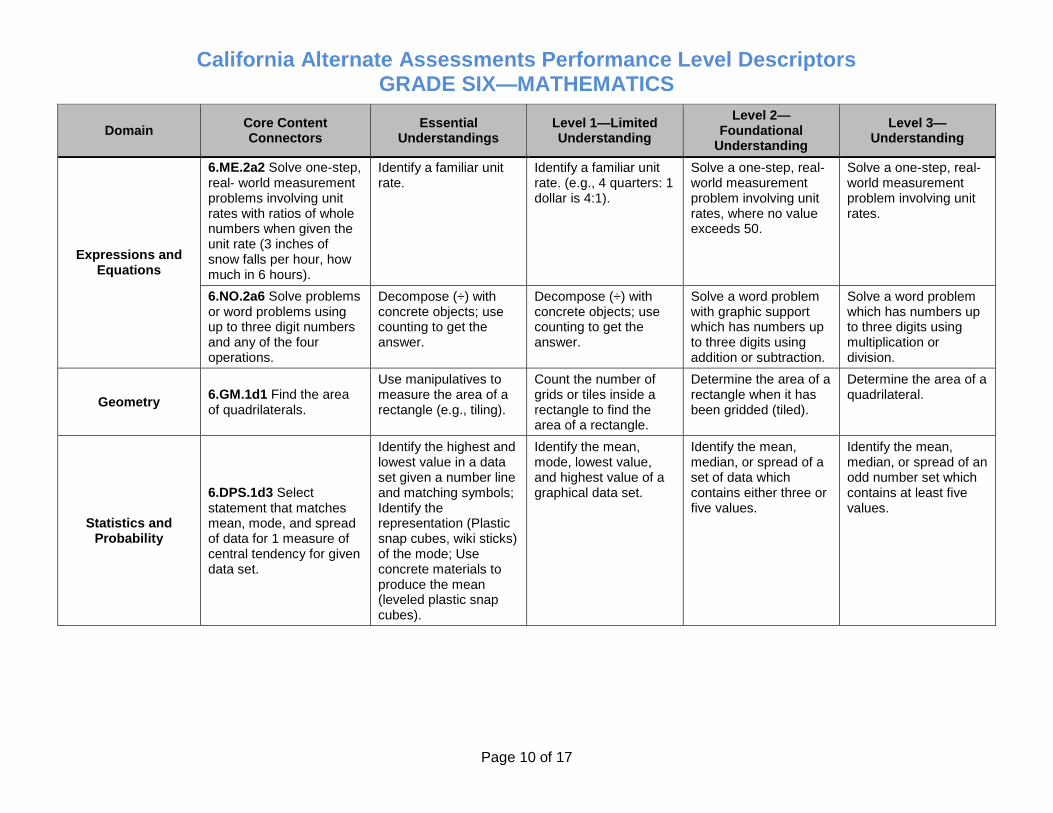
California Alternate Assessments Performance Level Descriptors GRADE SIX—MATHEMATICS
Page 10 of 17
Domain Core Content Connectors
Essential Understandings
Level 1—Limited Understanding
Level 2— Foundational
Understanding
Level 3—Understanding
Expressions and Equations
6.ME.2a2 Solve one-step, real- world measurement problems involving unit rates with ratios of whole numbers when given the unit rate (3 inches of snow falls per hour, how much in 6 hours).
Identify a familiar unit rate.
Identify a familiar unit rate. (e.g., 4 quarters: 1 dollar is 4:1).
Solve a one-step, real-world measurement problem involving unit rates, where no value exceeds 50.
Solve a one-step, real-world measurement problem involving unit rates.
6.NO.2a6 Solve problems or word problems using up to three digit numbers and any of the four operations.
Decompose (÷) with concrete objects; use counting to get the answer.
Decompose (÷) with concrete objects; use counting to get the answer.
Solve a word problem with graphic support which has numbers up to three digits using addition or subtraction.
Solve a word problem which has numbers up to three digits using multiplication or division.
Geometry 6.GM.1d1 Find the area of quadrilaterals.
Use manipulatives to measure the area of a rectangle (e.g., tiling).
Count the number of grids or tiles inside a rectangle to find the area of a rectangle.
Determine the area of a rectangle when it has been gridded (tiled).
Determine the area of a quadrilateral.
Statistics and Probability
6.DPS.1d3 Select statement that matches mean, mode, and spread of data for 1 measure of central tendency for given data set.
Identify the highest and lowest value in a data set given a number line and matching symbols; Identify the representation (Plastic snap cubes, wiki sticks) of the mode; Use concrete materials to produce the mean (leveled plastic snap cubes).
Identify the mean, mode, lowest value, and highest value of a graphical data set.
Identify the mean, median, or spread of a set of data which contains either three or five values.
Identify the mean, median, or spread of an odd number set which contains at least five values.
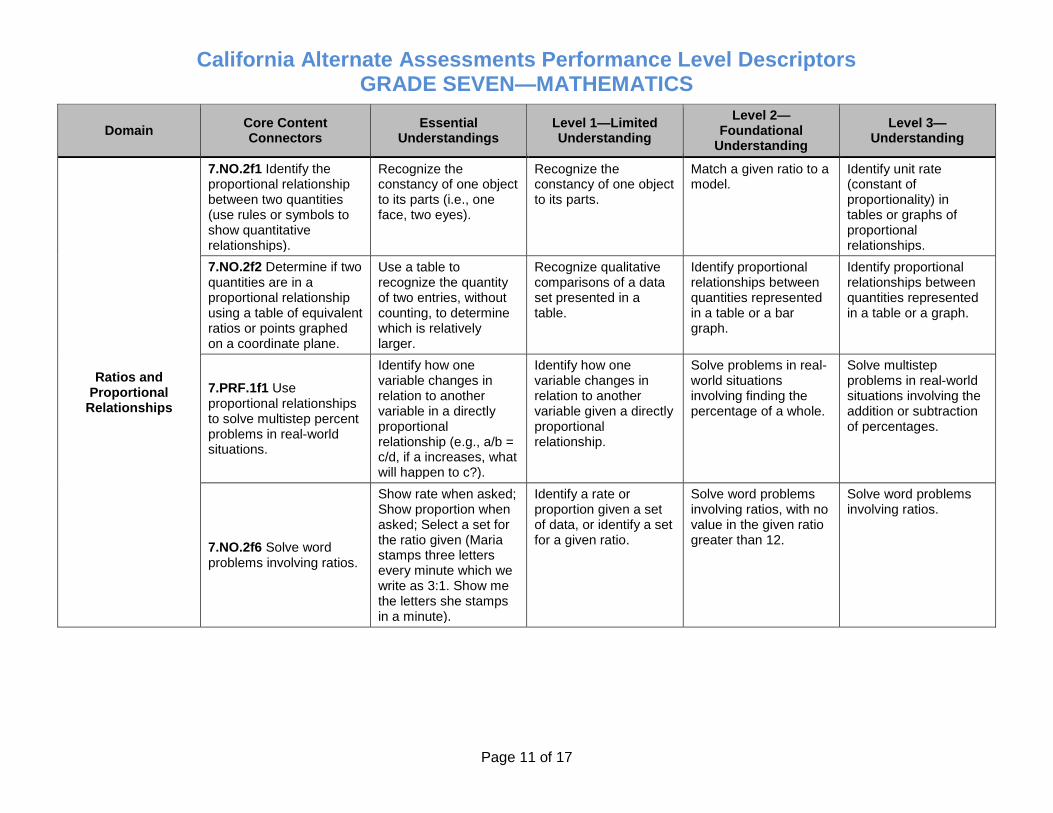
California Alternate Assessments Performance Level Descriptors GRADE SEVEN—MATHEMATICS
Page 11 of 17
Domain Core Content Connectors
Essential Understandings
Level 1—Limited Understanding
Level 2— Foundational
Understanding
Level 3—Understanding
Ratios and Proportional
Relationships
7.NO.2f1 Identify the proportional relationship between two quantities (use rules or symbols to show quantitative relationships).
Recognize the constancy of one object to its parts (i.e., one face, two eyes).
Recognize the constancy of one object to its parts.
Match a given ratio to a model.
Identify unit rate (constant of proportionality) in tables or graphs of proportional relationships.
7.NO.2f2 Determine if two quantities are in a proportional relationship using a table of equivalent ratios or points graphed on a coordinate plane.
Use a table to recognize the quantity of two entries, without counting, to determine which is relatively larger.
Recognize qualitative comparisons of a data set presented in a table.
Identify proportional relationships between quantities represented in a table or a bar graph.
Identify proportional relationships between quantities represented in a table or a graph.
7.PRF.1f1 Use proportional relationships to solve multistep percent problems in real-world situations.
Identify how one variable changes in relation to another variable in a directly proportional relationship (e.g., a/b = c/d, if a increases, what will happen to c?).
Identify how one variable changes in relation to another variable given a directly proportional relationship.
Solve problems in real-world situations involving finding the percentage of a whole.
Solve multistep problems in real-world situations involving the addition or subtraction of percentages.
7.NO.2f6 Solve word problems involving ratios.
Show rate when asked; Show proportion when asked; Select a set for the ratio given (Maria stamps three letters every minute which we write as 3:1. Show me the letters she stamps in a minute).
Identify a rate or proportion given a set of data, or identify a set for a given ratio.
Solve word problems involving ratios, with no value in the given ratio greater than 12.
Solve word problems involving ratios.
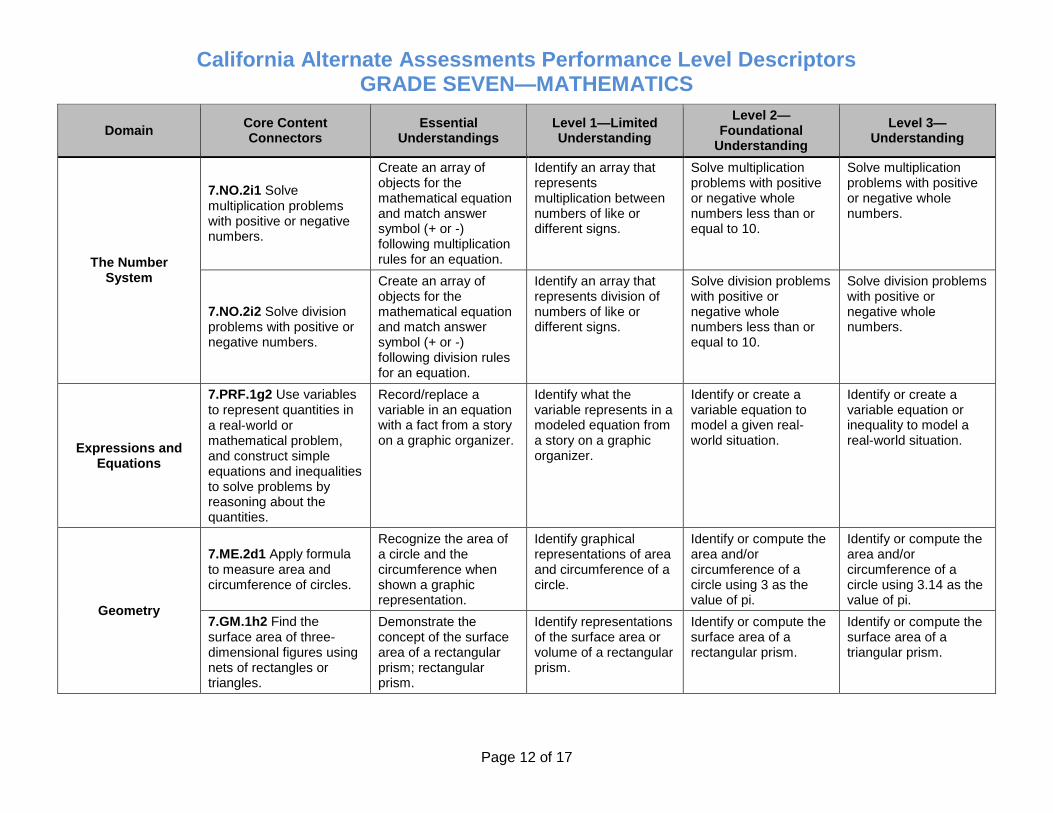
California Alternate Assessments Performance Level Descriptors GRADE SEVEN—MATHEMATICS
Page 12 of 17
Domain Core Content Connectors
Essential Understandings
Level 1—Limited Understanding
Level 2— Foundational
Understanding
Level 3—Understanding
The Number System
7.NO.2i1 Solve multiplication problems with positive or negative numbers.
Create an array of objects for the mathematical equation and match answer symbol (+ or -) following multiplication rules for an equation.
Identify an array that represents multiplication between numbers of like or different signs.
Solve multiplication problems with positive or negative whole numbers less than or equal to 10.
Solve multiplication problems with positive or negative whole numbers.
7.NO.2i2 Solve division problems with positive or negative numbers.
Create an array of objects for the mathematical equation and match answer symbol (+ or -) following division rules for an equation.
Identify an array that represents division of numbers of like or different signs.
Solve division problems with positive or negative whole numbers less than or equal to 10.
Solve division problems with positive or negative whole numbers.
Expressions and Equations
7.PRF.1g2 Use variables to represent quantities in a real‐world or mathematical problem, and construct simple equations and inequalities to solve problems by reasoning about the quantities.
Record/replace a variable in an equation with a fact from a story on a graphic organizer.
Identify what the variable represents in a modeled equation from a story on a graphic organizer.
Identify or create a variable equation to model a given real-world situation.
Identify or create a variable equation or inequality to model a real-world situation.
7.ME.2d1 Apply formula to measure area and
Recognize the area of a circle and the circumference when
Identify graphical representations of area and circumference of a
Identify or compute the area and/or circumference of a
Identify or compute the area and/or circumference of a
Geometry
circumference of circles. shown a graphic representation.
circle. circle using 3 as the value of pi.
circle using 3.14 as the value of pi.
7.GM.1h2 Find the surface area of three-dimensional figures using nets of rectangles or triangles.
Demonstrate the concept of the surface area of a rectangular prism; rectangular prism.
Identify representations of the surface area or volume of a rectangular prism.
Identify or compute the surface area of a rectangular prism.
Identify or compute the surface area of a triangular prism.
California Alternate Assessments Performance Level Descriptors GRADE SEVEN—MATHEMATICS
Page 13 of 17
Domain Core Content Connectors
Essential Understandings
Level 1—Limited Understanding
Level 2— Foundational
Understanding
Level 3—Understanding
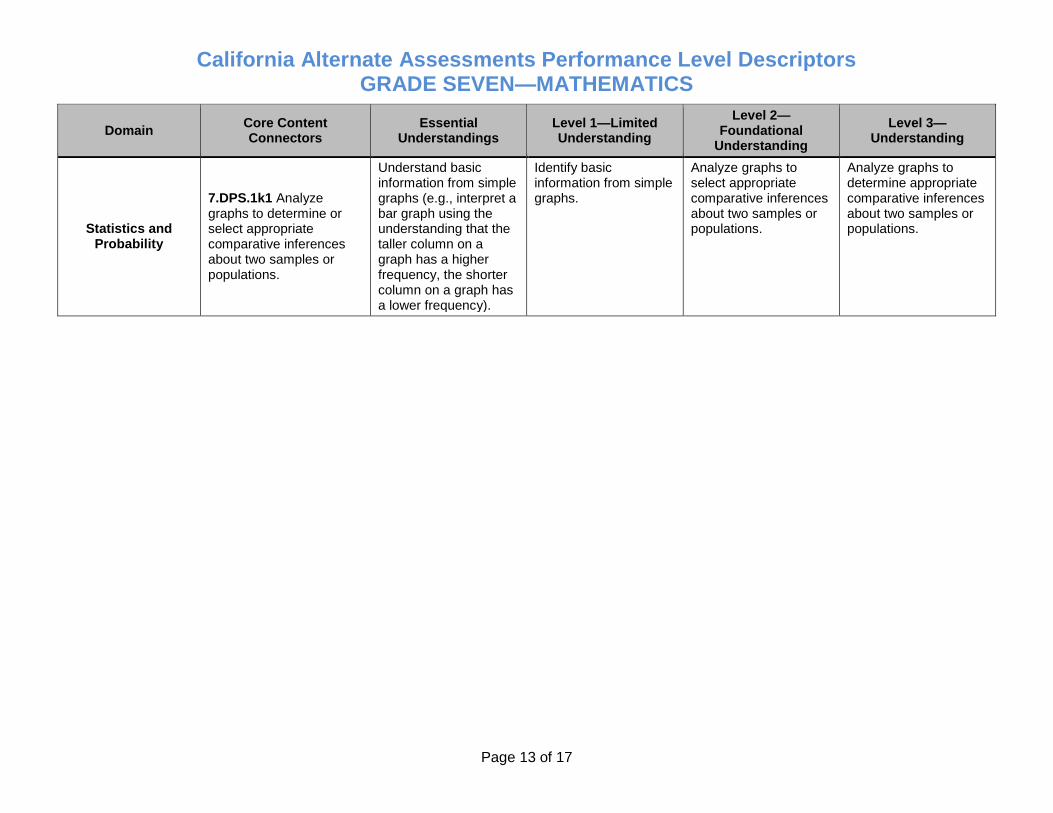
Statistics and Probability
7.DPS.1k1 Analyze graphs to determine or select appropriate comparative inferences about two samples or populations.
Understand basic information from simple graphs (e.g., interpret a bar graph using the understanding that the taller column on a graph has a higher frequency, the shorter column on a graph has a lower frequency).
Identify basic information from simple graphs.
Analyze graphs to select appropriate comparative inferences about two samples or populations.
Analyze graphs to determine appropriate comparative inferences about two samples or populations.
California Alternate Assessments Performance Level Descriptors GRADE EIGHT—MATHEMATICS
Page 14 of 17
Domain Core Content Connectors
Essential Understandings Level 1—Limited Understanding
Level 2— Foundational
Understanding
Level 3—Understanding
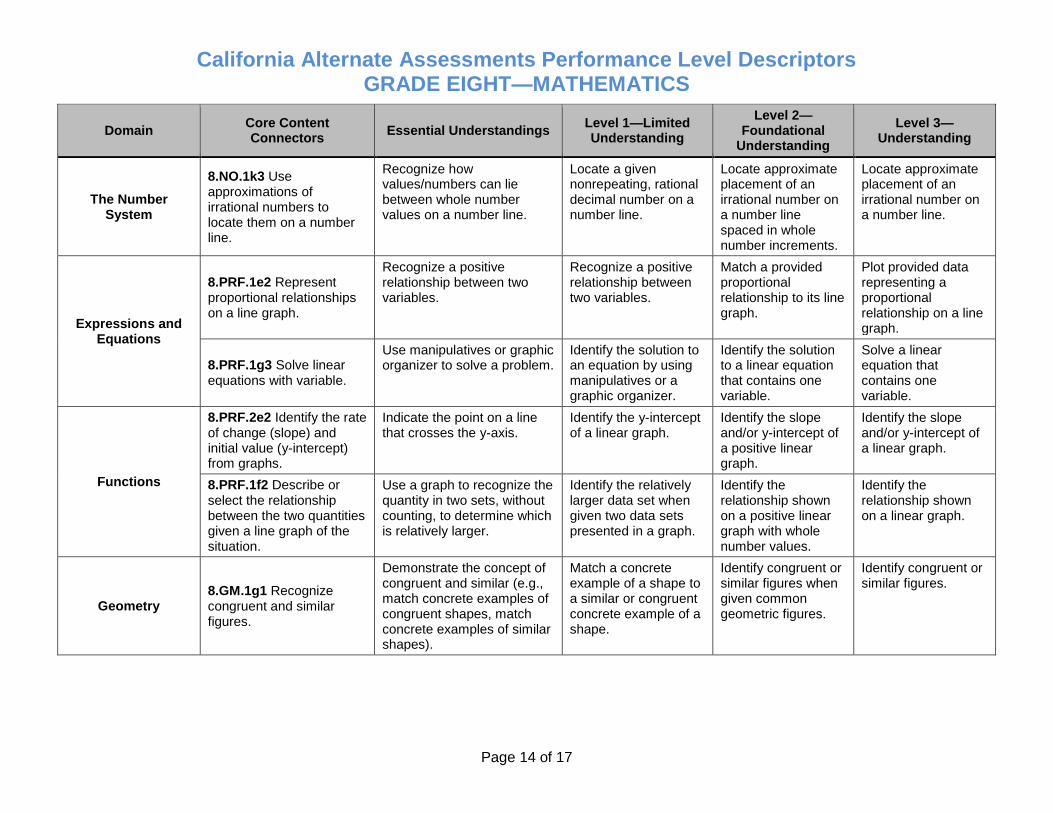
The Number System
8.NO.1k3 Use approximations of irrational numbers to locate them on a number line.
Recognize how values/numbers can lie between whole number values on a number line.
Locate a given nonrepeating, rational decimal number on a number line.
Locate approximate placement of an irrational number on a number line spaced in whole number increments.
Locate approximate placement of an irrational number on a number line.
Expressions and Equations
8.PRF.1e2 Represent proportional relationships on a line graph.
Recognize a positive relationship between two variables.
Recognize a positive relationship between two variables.
Match a provided proportional relationship to its line graph.
Plot provided data representing a proportional relationship on a line graph.
8.PRF.1g3 Solve linear equations with variable.
Use manipulatives or graphic organizer to solve a problem.
Identify the solution to an equation by using manipulatives or a graphic organizer.
Identify the solution to a linear equation that contains one variable.
Solve a linear equation that contains one variable.
Functions
8.PRF.2e2 Identify the rate of change (slope) and initial value (y-intercept) from graphs.
Indicate the point on a line that crosses the y-axis.
Identify the y-intercept of a linear graph.
Identify the slope and/or y-intercept of a positive linear graph.
Identify the slope and/or y-intercept of a linear graph.
8.PRF.1f2 Describe or select the relationship between the two quantities given a line graph of the situation.
Use a graph to recognize the quantity in two sets, without counting, to determine which is relatively larger.
Identify the relatively larger data set when given two data sets presented in a graph.
Identify the relationship shown on a positive linear graph with whole number values.
Identify the relationship shown on a linear graph.
Geometry 8.GM.1g1 Recognize congruent and similar figures.
Demonstrate the concept of congruent and similar (e.g., match concrete examples of congruent shapes, match concrete examples of similar shapes).
Match a concrete example of a shape to a similar or congruent concrete example of a shape.
Identify congruent or similar figures when given common geometric figures.
Identify congruent or similar figures.
California Alternate Assessments Performance Level Descriptors GRADE EIGHT—MATHEMATICS
Page 15 of 17
Domain Core Content Connectors
Essential Understandings Level 1—Limited Understanding
Level 2— Foundational
Understanding
Level 3—Understanding
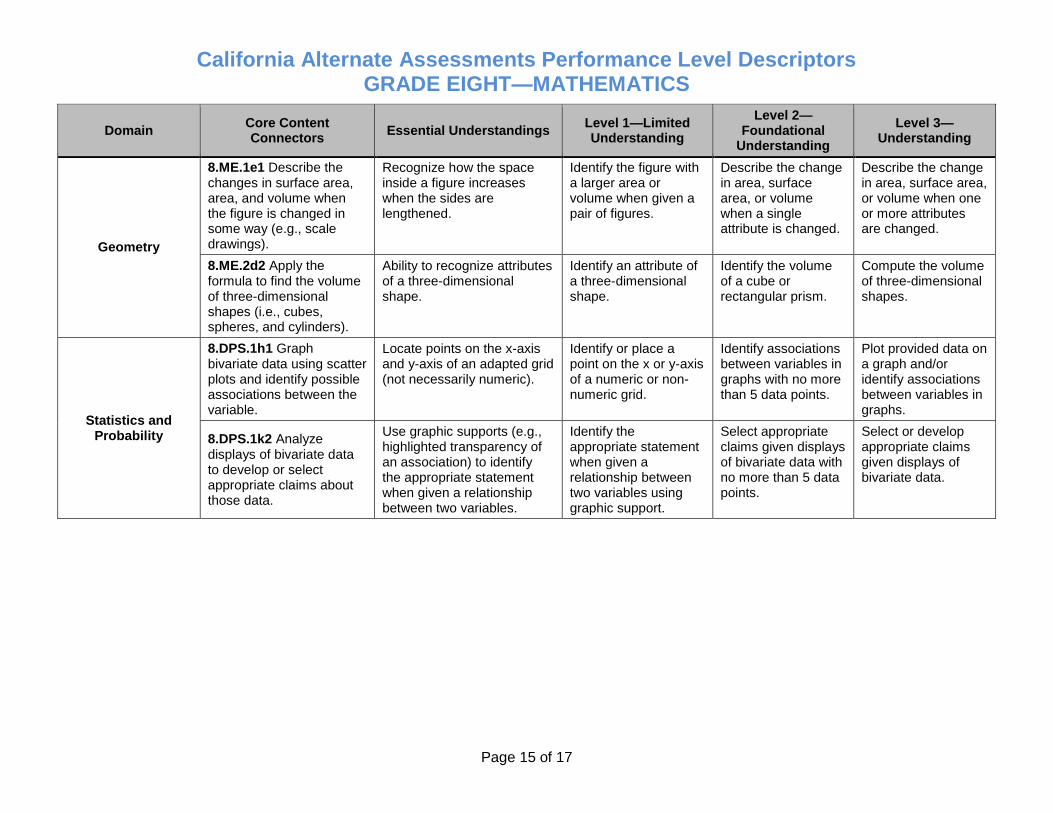
Geometry
8.ME.1e1 Describe the changes in surface area, area, and volume when the figure is changed in some way (e.g., scale drawings).
Recognize how the space inside a figure increases when the sides are lengthened.
Identify the figure with a larger area or volume when given a pair of figures.
Describe the change in area, surface area, or volume when a single attribute is changed.
Describe the change in area, surface area, or volume when one or more attributes are changed.
8.ME.2d2 Apply the formula to find the volume of three-dimensional shapes (i.e., cubes, spheres, and cylinders).
Ability to recognize attributes of a three-dimensional shape.
Identify an attribute of a three-dimensional shape.
Identify the volume of a cube or rectangular prism.
Compute the volume of three-dimensional shapes.
Statistics and Probability
8.DPS.1h1 Graph bivariate data using scatter plots and identify possible associations between the variable.
Locate points on the x-axis and y-axis of an adapted grid (not necessarily numeric).
Identify or place a point on the x or y-axis of a numeric or non-numeric grid.
Identify associations between variables in graphs with no more than 5 data points.
Plot provided data on a graph and/or identify associations between variables in graphs.
8.DPS.1k2 Analyze displays of bivariate data to develop or select appropriate claims about those data.
Use graphic supports (e.g., highlighted transparency of an association) to identify the appropriate statement when given a relationship between two variables.
Identify the appropriate statement when given a relationship between two variables using graphic support.
Select appropriate claims given displays of bivariate data with no more than 5 data points.
Select or develop appropriate claims given displays of bivariate data.
California Alternate Assessments Performance Level Descriptors GRADE ELEVEN—MATHEMATICS
Page 16 of 17
Domain Core Content Connectors
Essential Understandings
Level 1—Limited Understanding
Level 2— Foundational
Understanding
Level 3—Understanding
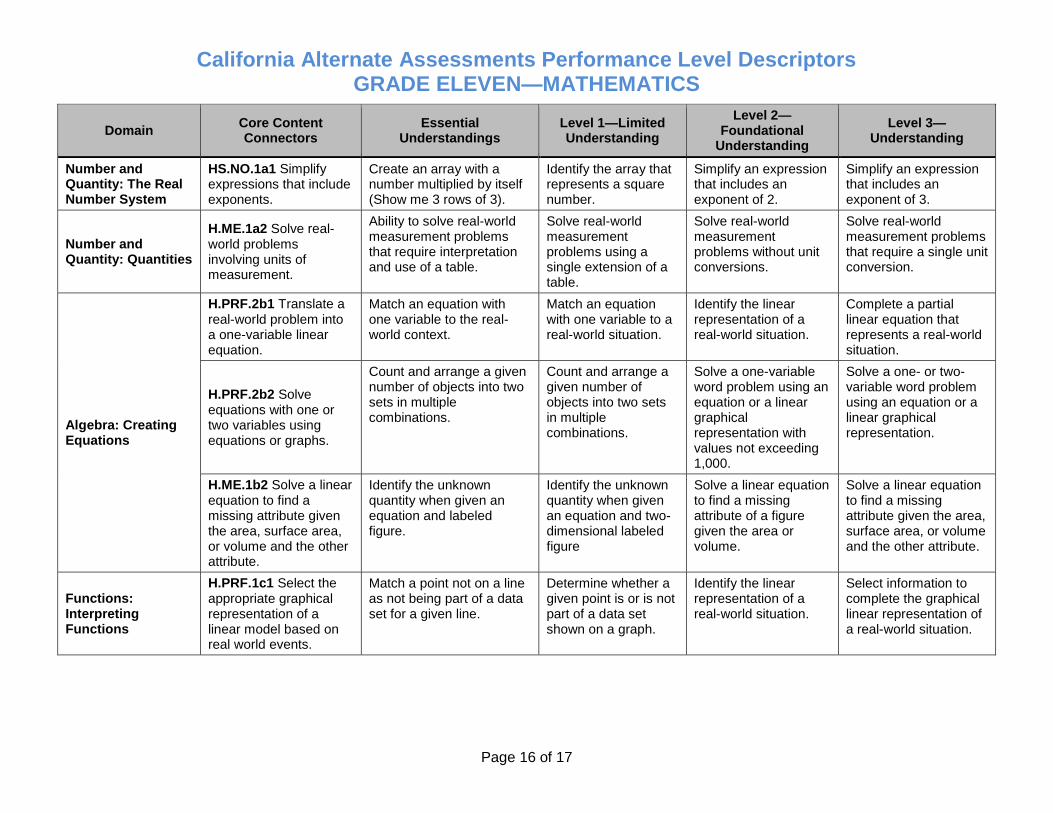
Number and Quantity: The Real Number System
HS.NO.1a1 Simplify expressions that include exponents.
Create an array with a number multiplied by itself (Show me 3 rows of 3).
Identify the array that represents a square number.
Simplify an expression that includes an exponent of 2.
Simplify an expression that includes an exponent of 3.
Number and Quantity: Quantities
H.ME.1a2 Solve real-world problems involving units of measurement.
Ability to solve real-world measurement problems that require interpretation and use of a table.
Solve real-world measurement problems using a single extension of a table.
Solve real-world measurement problems without unit conversions.
Solve real-world measurement problems that require a single unit conversion.
Algebra: Creating Equations
H.PRF.2b1 Translate a real-world problem into a one-variable linear equation.
Match an equation with one variable to the real- world context.
Match an equation with one variable to real-world situation.
a Identify the linear representation of a real-world situation.
Complete a partial linear equation that represents a real-world situation.
H.PRF.2b2 Solve equations with one or two variables using equations or graphs.
Count and arrange a given number of objects into two sets in multiple combinations.
Count and arrange a given number of objects into two sets in multiple combinations.
Solve a one-variable word problem using an equation or a linear graphical representation with values not exceeding 1,000.
Solve a one- or two-variable word problem using an equation or a linear graphical representation.
H.ME.1b2 Solve a linear equation to find a missing attribute given the area, surface area, or volume and the other attribute.
Identify the unknown quantity when given an equation and labeled figure.
Identify the unknown quantity when given an equation and two-dimensional labeled figure
Solve a linear equation to find a missing attribute of a figure given the area or volume.
Solve a linear equation to find a missing attribute given the area, surface area, or volume and the other attribute.
Functions: Interpreting Functions
H.PRF.1c1 Select the appropriate graphical representation of a linear model based on real world events.
Match a point not on a line as not being part of a data set for a given line.
Determine whether a given point is or is not part of a data set shown on a graph.
Identify the linear representation of a real-world situation.
Select information to complete the graphical linear representation of a real-world situation.
California Alternate Assessments Performance Level Descriptors GRADE ELEVEN—MATHEMATICS
Page 17 of 17
Domain Core Content Connectors
Essential Understandings
Level 1—Limited Understanding
Level 2— Foundational
Understanding
Level 3—Understanding
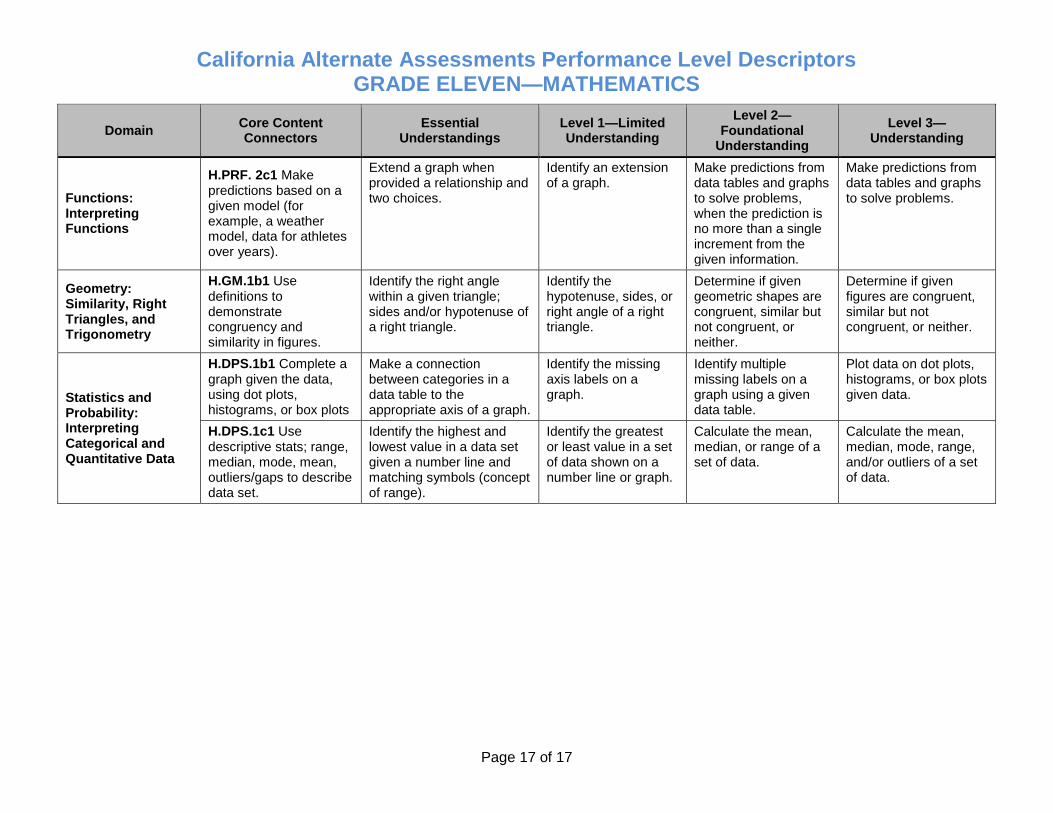
Functions: Interpreting Functions
H.PRF. 2c1 Make predictions based on a given model (for example, a weather model, data for athletes over years).
Extend a graph when provided a relationship and two choices.
Identify an extension of a graph.
Make predictions from data tables and graphs to solve problems, when the prediction is no more than a single increment from the given information.
Make predictions from data tables and graphs to solve problems.
Geometry: H.GM.1b1 Use Identify the right angle Identify the Determine if given Determine if given
Similarity, Right definitions to within a given triangle; hypotenuse, sides, or geometric shapes are figures are congruent,
Triangles, and demonstrate sides and/or hypotenuse of right angle of a right congruent, similar but similar but not
Trigonometry congruency and similarity in figures.
a right triangle. triangle. not congruent, or neither.
congruent, or neither.
Statistics and Probability: Interpreting Categorical and Quantitative Data
H.DPS.1b1 Complete a graph given the data, using dot plots, histograms, or box plots
Make a connection between categories in a data table to the appropriate axis of a graph.
Identify the missing axis labels on a graph.
Identify multiple missing labels on a graph using a given data table.
Plot data on dot plots, histograms, or box plots given data.
H.DPS.1c1 Use descriptive stats; range, median, mode, mean, outliers/gaps to describe data set.
Identify the highest and lowest value in a data set given a number line and matching symbols (concept of range).
Identify the greatest or least value in a set of data shown on a number line or graph.
Calculate the mean, median, or range of a set of data.
Calculate the mean, median, mode, range, and/or outliers of a set of data.