camden waterfront south air toxics pilot …camden waterfront south 5 air toxics pilot project ratio...
TRANSCRIPT

CAMDEN WATERFRONT SOUTHAIR TOXICS PILOT PROJECT
August 2005
Commissioner Bradley M. CampbellNJ Department of Environmental Protection

CAMDEN WATERFRONT SOUTHAIR TOXICS PILOT PROJECT
Final ReportAugust 2005
Prepared by:NJ Department of Environmental Protection
Division of Air QualityPO Box 027
Trenton, NJ 08625
With Assistance from the NJDEP Camden Air ToxicsWorkgroup, NJ Dept. of Health & Senior Services,
Camden County Health Dept., and the CamdenCommunity Advisory Committee
With Support from US Environmental Protection Agency,Community Assessment and Risk Reduction Initiatives Grant
Project Manager: Joann Held

Camden Waterfront South 1 Air Toxics Pilot Project
TABLE OF CONTENTS
ELECTRONIC ATTACHMENTS………………………………………………………………… 2 ACRONYMS………………………………………………………………………………………. 3 EXECUTIVE SUMMARY ……………………………………………………………………….. 4 1.0 INTRODUCTION…………………………………………………………………………. 7
1.1 WHY WATERFRONT SOUTH?………………………………………………… 8 1.2 ESTABLISHING A DEP WORKGROUP……………………………………….. 9
1.3 COMMUNITY ADVISORY COMMITTEE…………………………………….. 9 1.4 FINDINGS AND ACCOMPLISHMENTS…………………………………….… 10
2.0 METHODS AND RESULTS……………………………………………………………… 13 2.1 STEP 1: EMISSIONS INVENTORY……….……………………………………13
2.1.1 BASIC STEPS……………………………………………………………. 13 2.1.2 FACILITIES LIST……………………………………………………….. 15 2.2 STEP 2: DISPERSION MODELING……………………………………………. 17
2.2.1 BASIC STEPS…………………………………………………………… 17 2.2.2 ITERATIVE PROCESS…………………………………………………. 19 2.2.3 MODEL RESULTS……………………………………………………… 20 2.2.4 COMPARISON TO F.W. WINTER NATA PREDICTIONS…………… 20 2.2.5 SOURCES NOT MODELED……………………………………………. 21
2.3 STEP 3: RISK ASSESSMENT………………………………………………….. 23 2.3.1 BASIC STEPS…………………………………………………………….24 2.3.2 FACILITIES OF INTEREST……………………………………………. 29 2.3.3 QUALITATIVE ASSESSMENT………………………………………… 38
2.4 STEP 4: AMBIENT AIR MONITORING………………………………………. 40 2.4.1 FINE PARTICULATES………………………………………………….. 40 2.4.2 BUCKET BRIGADE…………………………………………………….. 43 2.4.3 CANISTER AND OPEN-PATH SAMPLES AT CCMUA……………… 48
2.5 STEP 5: RISK REDUCTION STRATEGIES…………………………………… 50 2.5.1 STATIONARY SOURCE EMISSION REDUCTIONS………………… 51 2.5.2 TRUCK EMISSION REDUCTIONS……………………………………. 55 2.5.3 ENVIRONMENTAL HEALTH EDUCATION…………………………. 56 2.5.4 VEGETATION……………………………………………………………58 3.0 RECOMMENDATIONS………………………………………………………………….. 59 REFERENCES…………………………………………………………………………………….. 62 APPENDIX A: Dispersion Modeling……………………………………………………………… 64 APPENDIX B: Preliminary Risk Assessment Results…………………………………………….. 68 APPENDIX C: Environmental Health Education…………………………………………………. 75 APPENDIX D: Additional Risk Reduction Strategies from the Community Advisory Committee..77

Camden Waterfront South 2 Air Toxics Pilot Project
ELECTRONIC ATTACHMENTS
Electronic copies of supplementary material can be found at the project website: www.nj.gov/dep/ej/airtoxics.html
GENERAL MATERIALS
• Brochure • Initial Workplan • Community Advisory Committee
o Invitation Letter o Membership List (name & affiliation) o Introduction o Frequently Asked Questions o Invitation to Initial Community meeting
• Progress Reports • Glossary
FINAL EMISSION INVENTORY RISK ASSESSMENT HANDOUTS QUALITATIVE RISK ASSESSMENT
• Camden Waterfront South Air Toxics Pilot Project – Qualitative Assessment of Stressors • Odor, Annoyance and Health Symptoms in a Residential Community Exposed to
Industrial Odors. Prepared by Pamela Dalton (Monell Chemical Sense Center) • Asthma in New Jersey (NJDHSS 2003) • Letters to Camden Health Study Task Force (NJDHSS 2003) • New Jersey HIV/AIDS Report (NJDHSS 2003)
AIR MONITORING
• Personal and Ambient Exposure to Air Toxics in Camden, New Jersey • Bucket Brigade:
o Meeting Announcement (flyer) o Quality Assurance Plan o Bucket Brigade Results
RISK REDUCTION STRATEGIES
• NJME Brochure • Air Emission and Odor Control Study (CDM 1998) • Linkage of Asthma Morbidity and Hazardous Air Pollutants in New Jersey • Getting to Know Air Pollution (brochure) • Roadmap to Restoration: South Camden Waterfront Neighborhood (Vita Nuova 2003)

Camden Waterfront South 3 Air Toxics Pilot Project
ACRONYMS AQI Air Quality Index ATSC Air Toxics Steering Committee (NJDEP) CARRI Community Air Risk Reduction Initiative CATEF California Air Toxics Emission Factor Database CCMUA Camden County Municipal Utilities Authority (sewage treatment) CCMWC Camden County Municipal Waste Combustor (incinerator) CEHA County Environmental Health Act DEP New Jersey Department of Environmental Protection EJ Environmental Justice EPCRA Emergency Planning and Community “Right-to-Know” Act FRM Federal Reference Method HAP Hazardous Air Pollutant (under the Clean Air Act Amendments of 1990) NAACP National Association for the Advancement of Colored People NAAQS National Ambient Air Quality Standard NATA National-Scale Air Toxics Assessment NJDEP New Jersey Department of Environmental Protection NJDHSS New Jersey Department of Health and Senior Services NJEMS New Jersey Environmental Management System (DEP database) NJME New Jersey Program for Manufacturing Excellence OAT Odor Abatement Team OEHHA California’s Office of Environmental Health Hazard Assessment OP-FTIR Open Path-Fourier Transform Infrared PAC Polycyclic Aromatic Compounds PM Particulate Matter POM Polycyclic Organic Matter SBAP Small Business Assistance Program SRO Southern Regional Enforcement Office (NJDEP) TEOM Tapered Element Oscillating Microbalance (air monitoring method) TRI Toxic Release Inventory TSP Total Suspended Particulate UARP Urban Airshed Reforestation Project USEPA U.S. Environmental Protection Agency VOC Volatile Organic Compound

Camden Waterfront South 4 Air Toxics Pilot Project
EXECUTIVE SUMMARY The purpose of this report is twofold. First, it provides a summary of the findings of the Waterfront South Air Toxics Pilot Project for the use of those who live and work in the neighborhood. Second, it provides a description of the steps that we followed in this project so that others undertaking community risk assessments can learn from this experience. OVERVIEW The Waterfront South Air Toxics Pilot Project began in the Fall of 2002, when a DEP Workgroup began to make plans to implement a study which was funded by a Community Assessment and Risk Reduction Initiative (CARRI) Grant provided to the DEP by the USEPA. This pilot project was designed to develop tools that can be used to quickly assess air quality (especially air toxics) problems in a community. The focus of the project was on 1) air toxics, which are harmful substances such as arsenic, lead, and cadmium that can come from industrial or manufacturing sources; and 2) particulate matter (PM), which is tiny liquid or solid particles such as dust, smoke, mist, or fumes. These pollutants can cause a wide variety of health effects, including breathing difficulties, learning disabilities and cancer. The Waterfront South neighborhood of Camden was designated as the study area in part because of the many air quality concerns that had been raised by the residents. This project provided a means to quantify the impact of the numerous sources located in this neighborhood (which covers less than one square mile) including the Camden County Sewage Treatment plant, the County Municipal Waste Combustor, the world’s largest licorice processing plant, and a cement manufacturing facility. During the course of the project the DEP worked with a Community Advisory Committee composed of residents and professionals who work in the neighborhood. The Committee helped to ensure that all critical air emission sources were identified for inclusion in the study. They also assisted in identifying risk reduction strategies to address the pollutants of concern which were flagged in the risk assessment. The pilot project included several basic elements:
• Finding the sources of air toxics and particulate matter in and around the Waterfront South neighborhood.
• Collecting detailed information about the air pollution sources, including the type and quantity of pollution they produce.
• Identifying the air toxics and particulates that pose the greatest health risks to people who live in the neighborhood, and highlighting the sources of that pollution.
• Collecting ambient air monitoring data to further assess the levels of pollution found in the neighborhood.
• Identifying strategies to reduce the health risks. EMISSION INVENTORY & DISPERSION MODELING Information on air emissions was collected on a very fine scale, beginning with what was known about emissions from air pollution permits, and then filling in many details about the sources that could not be gleaned from permits by tapping into other databases and visiting each facility. Information on emissions of about 40 pollutants from over 25 facilities was collected into what is known as an emission inventory (see Section 2.1). The inventory data were then used with a dispersion model to predict concentrations of these pollutants in the air throughout the neighborhood on a very fine grid (see Section 2.2). The results of the model runs, which represent worst-case conditions, were analyzed in the risk assessment. RISK ASSESSMENT Potential health risk for this project was estimated by calculating risk ratios, a comparison of an air concentration to a health benchmark. If the air concentration is higher than the benchmark (resulting in a

Camden Waterfront South 5 Air Toxics Pilot Project
ratio greater than 1), there is a concern that the exposure could result in some detrimental health effect. Use of a risk ratio to evaluate results is different from the approach commonly used to evaluate carcinogens. In this study, instead of reporting risk (for example one in a million cancer risk or one in ten thousand risk) which can give the impression that the precise level of risk has been calculated, we have used risk ratios to tell us if the predicted levels are above or below a critical threshold (the health benchmark). A similar approach is used here for noncarcinogenic substances. Using this approach, pollutants that fall above the health benchmark (i.e. having risk ratio greater than one) warrant additional study. Those that fall below the health benchmark are set aside. This method is outlined in Section 2.3. Using this risk ratio approach, seven toxic air pollutants and two forms of particulate matter were predicted to have risk ratios greater than one. These results lead to the general conclusion that Waterfront South is an area with relatively high particulate levels; and that some of this particulate matter contains significant quantities of toxic metals, such as arsenic, cadmium, lead, manganese and nickel. It is expected that this will be a common finding as the DEP investigates exposure to multiple air pollution sources in other urban neighborhoods around the state. Further review of the modeling results revealed that the relatively high air concentrations (flagged by the risk assessment) can be attributed to emissions from ten different facilities in and near Waterfront South. As part of this study, the emissions of these nine pollutants from the ten facilities received additional scrutiny. AIR MONITORING At the same time that the modeling and risk assessment steps were being carried out, a limited amount of ambient air monitoring was also initiated to further assess the levels of pollution found in the neighborhood. Three monitoring efforts were carried out as part of this project. They included 1) installation of a continuous monitor for fine particulate; 2) grab samples of air which were analyzed for a suite of air toxics using tedlar bags contained in buckets (i.e. the Bucket Brigade); and 3) specialized canister and open-path sampling for air toxics at the Camden County sewage treatment facility. The methods and results are described in Section 2.4 of this report. RISK REDUCTION STRATEGIES The final step in the pilot project was to identify a list of potential Risk Reduction Strategies (see Section 2.5). These are actions which could help to reduce exposure to particulate matter and air toxics in Waterfront South. The list of risk Reduction Strategies falls into four categories: Stationary Source Emission Reductions; Truck Emission Reductions; Environmental Health Education; and Vegetation for Dust Suppression. These actions span many programs in the DEP and even reach into other agencies. REDUCING AIR EMISSIONS IN WATERFRONT SOUTH Although it was not an official part of the project, some actions have already been taken to implement several of these risk reduction strategies. For example, the facility with the highest predicted particulate impacts has installed new particulate control equipment (a bag house) and another facility which was sandblasting outdoors has moved the operation indoors. An inter-local service agreement between the City and the County has resulted in a truck prohibition on a residential portion of Ferry Avenue. And the County Health Department anti-idling campaign has significantly reduced idling of trucks along Morgan Boulevard and in other areas. These actions are described briefly in Section 2.5 of this report. During the course of this project, Camden County was declared a PM2.5 Non-Attainment Area by USEPA, joining 12 other counties in the state with this designation. Three southern counties – Camden, Gloucester and Burlington – were primarily designated non-attainment due to their proximity to

Camden Waterfront South 6 Air Toxics Pilot Project
Philadelphia. However, this designation will result in additional particulate matter (PM) control strategies throughout the region which will help to reduce the PM exposure in this community. RECOMMENDATIONS This report contains several recommendations for future actions which could lead to improved air quality in Waterfront South (see Section 3.0). These recommendations suggest ways to continue dialogue with the community, reduce emissions from both stationary and mobile sources, and carry out some follow-up analysis. They include suggestions for both DEP initiatives and actions by other agencies. A separate set of recommendations is drawn from the lessons learned in this pilot project and will help to improve the efficiency and effectiveness of future pilot projects.
Camden Waterfront South 7 Air Toxics Pilot Project
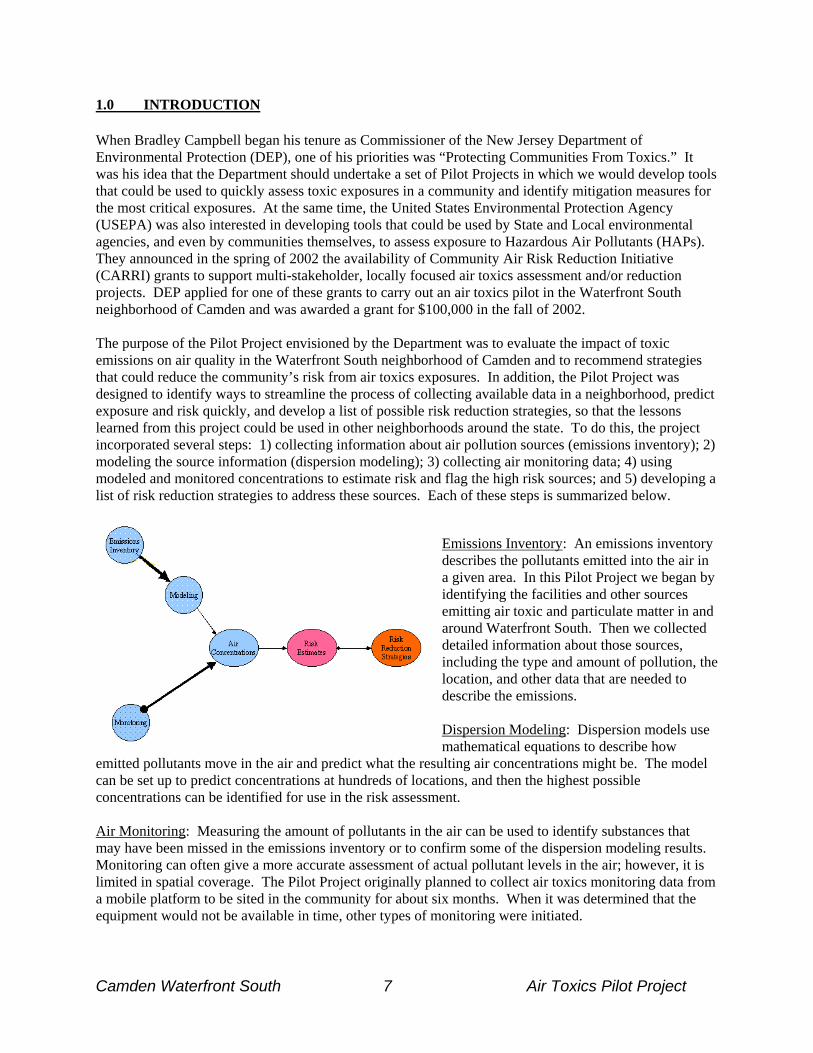
1.0 INTRODUCTION When Bradley Campbell began his tenure as Commissioner of the New Jersey Department of Environmental Protection (DEP), one of his priorities was “Protecting Communities From Toxics.” It was his idea that the Department should undertake a set of Pilot Projects in which we would develop tools that could be used to quickly assess toxic exposures in a community and identify mitigation measures for the most critical exposures. At the same time, the United States Environmental Protection Agency (USEPA) was also interested in developing tools that could be used by State and Local environmental agencies, and even by communities themselves, to assess exposure to Hazardous Air Pollutants (HAPs). They announced in the spring of 2002 the availability of Community Air Risk Reduction Initiative (CARRI) grants to support multi-stakeholder, locally focused air toxics assessment and/or reduction projects. DEP applied for one of these grants to carry out an air toxics pilot in the Waterfront South neighborhood of Camden and was awarded a grant for $100,000 in the fall of 2002. The purpose of the Pilot Project envisioned by the Department was to evaluate the impact of toxic emissions on air quality in the Waterfront South neighborhood of Camden and to recommend strategies that could reduce the community’s risk from air toxics exposures. In addition, the Pilot Project was designed to identify ways to streamline the process of collecting available data in a neighborhood, predict exposure and risk quickly, and develop a list of possible risk reduction strategies, so that the lessons learned from this project could be used in other neighborhoods around the state. To do this, the project incorporated several steps: 1) collecting information about air pollution sources (emissions inventory); 2) modeling the source information (dispersion modeling); 3) collecting air monitoring data; 4) using modeled and monitored concentrations to estimate risk and flag the high risk sources; and 5) developing a list of risk reduction strategies to address these sources. Each of these steps is summarized below.
Emissions Inventory: An emissions inventory describes the pollutants emitted into the air in a given area. In this Pilot Project we began by identifying the facilities and other sources emitting air toxic and particulate matter in and around Waterfront South. Then we collected detailed information about those sources, including the type and amount of pollution, the location, and other data that are needed to describe the emissions. Dispersion Modeling: Dispersion models use mathematical equations to describe how
emitted pollutants move in the air and predict what the resulting air concentrations might be. The model can be set up to predict concentrations at hundreds of locations, and then the highest possible concentrations can be identified for use in the risk assessment. Air Monitoring: Measuring the amount of pollutants in the air can be used to identify substances that may have been missed in the emissions inventory or to confirm some of the dispersion modeling results. Monitoring can often give a more accurate assessment of actual pollutant levels in the air; however, it is limited in spatial coverage. The Pilot Project originally planned to collect air toxics monitoring data from a mobile platform to be sited in the community for about six months. When it was determined that the equipment would not be available in time, other types of monitoring were initiated.

Camden Waterfront South 8 Air Toxics Pilot Project
Risk Estimates: Risk assessment is the process used to estimate the increased risk of health problems in people who are exposed to different amounts of toxic substances. A risk assessment for a specific toxic substance combines: a) information from studies on the health effects of various animal and human exposures to the pollutant; and b) estimates of the level of possible exposures to the pollutant (from modeling or monitoring results). While the estimates provided by these risk assessments are not exact, they are useful in comparing one risk to another and for prioritizing issues and possible problems. In this Pilot Project, risk assessment was used to identify the pollutants that pose the highest risk for the community and to flag the known sources of those pollutants which contribute significantly to that risk. Risk Reduction Strategies: Once the pollutants of concern and their possible sources are identified, strategies are needed to reduce the pollutant exposures and associated risks for the community. In some circumstances DEP may be able to use permitting or enforcement measures to require reductions in emissions. But there are many sources that are not covered by DEP’s regulatory authority (e.g. truck routes and vacant lots). For these more innovative strategies must be identified, and partners in other agencies must be found to implement the strategies.
This report contains a brief description of each of these elements. Further information and many of the reports referenced here can be found on the project website at www.nj.gov/dep/ej/airtoxics.html. 1.1 WHY WATERFRONT SOUTH? The Waterfront South neighborhood of Camden is in the southwestern portion of the city. It is bounded on the west by the Delaware River, on the north by Atlantic Avenue, on the east by Interstate Route 676 (I-676) and on the south by Newton Creek. The neighborhood has about 1700 residents and coincides with census tract 6018. The ethnic makeup of residents living in the Waterfront South community is significantly different from state and county averages. Table 1 below summarizes data from the 2000 U.S. Census, showing that 57.8% of the residents in the community are black, compared to the state average of 13.6%. Hispanic residents make up 27.2% of the community, compared to 12.5% for the entire state. Also, the economic conditions in Waterfront South are significantly below state averages. The median household income in the community is less than half the state median, and the number of individuals living below the poverty level is almost four times the state average.
Table 1: Summary of Census and Income Data
Ethnicity Income
Geographic Level Black Hispanic Non-White
Median Household
Income
Individuals Below Poverty
State 13.6% 12.5% 27.4% $55,136 8.5% Camden County 18.1% 9.7% 29.1% $48,097 10.4% Camden City 53.3% 38.8% 82.5% $23,421 35.5% Waterfront South (Census Tract 6018) 57.8% 27.2% 85.4% $22,417 33.8%
Source: U.S. Census 2000

Camden Waterfront South 9 Air Toxics Pilot Project
Residents of this community have been complaining for a number of years about the density and proximity of industrial activities. This neighborhood (which covers less than one square mile) contains the Camden County Sewage Treatment plant, the County Municipal Waste Combustor, the world’s largest licorice processing plant, and a cement manufacturing facility. The entrance to the Broadway Terminal of the South Jersey Port Corporation, which draws significant quantities of truck traffic, is located in the southern part of the neighborhood. One report (Roadmap to Restoration by Vita Nuova, 2003) estimates that there are almost 8,000 trucks per year entering the Broadway terminal and as high as 77,000 truck trips to local industries in a year. Finally, a project carried out by the U.S. Environmental Protection Agency (USEPA) called the National-Scale Air Toxics Assessment (NATA) predicted that the highest carcinogenic risk from air toxics in the entire continental United States was in the City of Camden. Although this risk proved to be an error (it was based on the assumption that the chromium being emitted from a local facility was a highly potent carcinogenic form, but it is not), it focused attention on the community's exposure to other relatively high levels of air toxics. For all of these reasons, the Waterfront South neighborhood was a good place to carry out the first of the DEP’s “Protecting Communities from Toxics” pilot projects. 1.2 ESTABLISHING A DEP WORKGROUP The New Jersey Department of Environmental Protection (DEP) established an Air Toxics Steering Committee (ATSC) in 1987 to coordinate activities across various programs that deal with air toxics. The different programs are responsible for: issuing and enforcing permits limiting air toxic emissions; carrying out or reviewing risk assessments; air toxics monitoring; collecting and reviewing toxic release information, etc. The ATSC considers a fairly broad array of air toxics, including all of the HAPs listed in the Clean Air Act plus other toxic air contaminants (such as hydrogen sulfide) for which there are no National Ambient Air Qualilty Standards. The existing ATSC formed the core of the workgroup for the Waterfront South Pilot Project. Added to the workgroup were staff from the Camden County Health Department, the N.J. Department of Health and Senior Services (NJDHSS), and other DEP employees who were familiar with some aspect of the Waterfront South or Camden area. In addition, a student was hired to help the workgroup compile neighborhood information early in the project (which proved to be a very cost-effective step). The workgroup has met one to two times per month since August 2002 to be briefed on project activities, identify sources of information, and share ideas about how to proceed. 1.3 COMMUNITY ADVISORY COMMITTEE
An important component of the pilot project is the Community Advisory Committee. When the project was initially developed, it was expected that the Advisory Committee would be consulted at the beginning of the process to ensure that all critical air emissions sources were identified for inclusion in the inventory, and at the end of the pilot to participate in the risk reduction strategies brainstorming sessions. Instead, we discovered that the members of the Advisory Committee were engaged throughout the entire process so that the Project Workgroup members met with the Advisory Committee approximately every four to eight weeks from January 2003 through August 2004.

Camden Waterfront South 10 Air Toxics Pilot Project
Invitations to the initial Community Advisory Committee meeting were sent to about fifteen people, including several neighborhood residents, professionals who work in the neighborhood (for example, staff at Heart of Camden, faculty at Rutgers University), and groups that represent some of the local residents (such as South Camden Citizens in Action (SCCIA) and the NAACP). Some community members shared the invitation with other interested parties, which expanded participation in the Committee. Ultimately, the Committee had a mailing list of 32 Camden representatives, with about 8 especially active participants. Informal progress reports were prepared for the Community Advisory Committee every four to eight weeks and were distributed to the whole mailing list and to USEPA. This Committee was especially helpful in pointing out the particular concerns of the community so that we could include them in our analysis whenever possible. In early meetings the Community Advisory Committee pointed out that there had been many studies already done in this neighborhood. Copies of these studies were hard to find. Those that we were able to acquire are now available on the project web site so that they are readily available for future work. 1.4 FINDINGS AND ACCOMPLISHMENTS The modeling, monitoring, and risk assessment steps provided a wealth of information about possible exposures to air pollution in this community. The results of these three steps are described in detail in Sections 2.2, 2.3 and 2.4. Two primary findings are highlighted here. First, the risk assessment indicates that this is an area with relatively high particulate levels. This was not a surprise to the residents, but it is quantified in this study for the first time. Some of this particulate matter contains toxic metals, such as arsenic, cadmium, lead, manganese and nickel – which may be present in certain parts of the neighborhood above the health benchmark values routinely used by the DEP. It is expected that this will be a common finding as the DEP investigates exposure to multiple air pollution sources in other urban neighborhoods around the state. Second, fine particulate (PM2.5) levels measured with a continuous particulate monitor (TEOM) on the roof of the CCMUA building are about 10% higher than those observed at the DEP permanent air monitoring site at Copewood and Davis Streets in Camden, about one mile east of Waterfront South. However, since we are using a TEOM, rather than a filter-based federal reference method, to measure particulate matter, it is not possible to make a determination about whether this site exceeds the National Ambient Air Quality Standard (NAAQS). Accomplishments Relevant to Waterfront South Although implementing Risk Reduction Strategies was not a part of the initial Pilot Project, several measures have been initiated by local sources, DEP and other agencies which will help to reduce exposure to air pollutants in Waterfront South. 1. American Minerals, which had the highest modeled particulate matter impact of all facilities in this
study, has installed a bag house control device which will significantly reduce particulate emissions from this facility. This greatly reduced the predicted levels of PM10 in Waterfront South.
2. Plastic Consulting, which had the highest lead impact in this study due to outdoor sandblasting activities, has moved this operation indoors, where it is controlled by a new baghouse with 99% control efficiency. This resulted in the risk ratio for lead dropping to much less than 1.0.
3. Several improvements have been made in the operation of the CCMUA sewage treatment plant which have reduced the impact of odors in the Waterfront South neighborhood. Many of these steps are related to improved sludge handling procedures.
Camden Waterfront South 11 Air Toxics Pilot Project
4. Camden County has approved an inter-local service agreement with the City of Camden to allow the City to assume traffic control over portions of Ferry Avenue (on the west side of Broadway). The City can now prohibit through trucks on that portion of Ferry Avenue, thus reducing truck traffic through at least one residential area of Waterfront South. Other City streets in the Waterfront South neighborhood may also be declared closed to through trucks.
5. The Camden County Health Department conducted an anti-idling campaign in Waterfront South. As a result of their activity, idling along Morgan Boulevard has been significantly reduced. In addition, the South Jersey Port Corporation is allowing the County to post signs on their public right-of-way advising trucks of the state regulations. The Camden County Health Department is also providing and posting signs on certain city streets.
6. The New Jersey Tree Foundation hired local high school students to conduct a tree census in Waterfront South. These results were entered into a model that can estimate the pollution reduction potential of the trees.
7. The local community organization Heart of Camden has undertaken a vacant lot reclamation project which will seed, fence and maintain a number of lots in the neighborhood in order to reduce windblown dust. At least one seeding project has already been completed.
8. Heart of Camden is also developing a Landscape Master Plan for Waterfront South that will help to reduce fugitive particulate dust in the air.
9. The DEP Bureau of Preconstruction Permits in the Division of Air Quality has begun to flag applications received for sources in and near Waterfront South, so that they can be reviewed in the context of the results of this Pilot Project.
Findings Relevant to Future Pilot Projects The experience of carrying out this study provided many insights that will be helpful as we undertake the next project. Some of the more tangible findings are listed below. 1. Compiling an emissions inventory at the level of detail needed for a study such as this is very
difficult. In a neighborhood study, such as this, there will be many small sources that are not included in traditional DEP documents (such as TRI and air permits). Therefore, other resources are necessary to compile a complete emissions inventory at the neighborhood level.
2. Locating information that identifies known contaminated sites in a given neighborhood was also difficult, and the actual contaminants at each site could not be determined without reviewing each DEP paper file individually. New tools in NJEMS may make this task more manageable.
3. Hiring students to help compile neighborhood information early in the project is a very cost-effective tool. Students generally have good internet searching skills and also have the benefit of staying focused on a single project while regular staff are juggling multiple projects.
4. Assistance from the County Health Department through the County Environmental Health Act (CEHA) program can be invaluable because of their intimate knowledge of local sources.
Accomplishments Relevant to Future Pilot Projects A goal of this Pilot Project was to develop a toolkit of skills and techniques that could be used to quickly assess air toxics problems in other communities. Several tools are listed below. They include both tangible products that can be easily shared with other interested parties, and many intangibles which have resulted in significant capacity- building for the DEP in general and the Division of Air Quality in particular.

Camden Waterfront South 12 Air Toxics Pilot Project
Products 1. Risk Reduction Strategy Starter List (see Table 13): Many of the strategies identified for Waterfront
South may also be relevant for other communities. 2. Air Pollution Brochure: A flyer that describes air pollution issues from the perspective of New Jersey
residents has been developed. It is available on the Pilot Project website. 3. Glossary: Definitions of terms commonly used in air pollution projects and especially in risk
assessments has been prepared and is on the Pilot Project web site. Capacity Building 1. The DEP Air Toxics Steering Committee (ATSC) has been expanded, and members now have
experience with all aspects of a Community Toxics Pilot Project. Through the expanded ATSC we have also developed connections to many programs outside of the Division of Air Quality.
2. Experience in developing a micro-inventory at the community level will speed up the process in the next Pilot Project, and has improved the statewide air toxics inventory for base year 2002.
3. Working with the Camden County Health Department has provided insight into how to work more effectively with local agencies.
4. Working with the Community Advisory Committee provided experience in how to explain modeling and risk assessment to the public.
5. The Bucket Brigade has provided experience with community-obtained grab samples, and also new ideas on how to empower a community to participate in an air monitoring project.

Camden Waterfront South 13 Air Toxics Pilot Project
2.0 METHODS AND RESULTS 2.1 STEP 1: EMISSIONS INVENTORY
The Emissions Inventory step was important for a number of reasons. First, we wanted to identify all of the relevant sources of air toxic emissions in and near Waterfront South. Then, we had to collect specific information about the location, amount, and type of source (for example, stack release, hot plume, or fugitive dust from a pile, etc.). This was needed so that a computer-based air dispersion model could be used to predict how the pollutants move through the air in the neighborhood, and what concentrations (amounts) of pollutants would be expected in the air as a result of these emissions. It is important to recognize that preparing an air toxics inventory for an urban study, such as this pilot, is not a matter of simply pulling emissions and stack information from the air permits contained in the DEP electronic database (known as NJEMS). Air permits are focused on certain types of sources, and only the largest and most complex typically have a specific air toxic emission limits. So a number of other methods must also be used to compile a comprehensive inventory that includes a broad array of sources and needs a fine level of detail in order to run the models.
2.1.1 Basic Steps The first step was to compile a list of air pollution sources based on information in DEP permitting files. This was followed by a drive through Waterfront South and adjacent parts of Camden in the company of staff from the Camden County Health Department. During this tour of the neighborhood, thirty sources were identified from signs posted on buildings and other operations that were not on existing DEP lists of air pollution sources. Many of these facilities were later found to be closed or to be simple warehousing operations with no appreciable air pollution emissions. During this site visit it became apparent that many of the typical urban air toxics sources, such as dry cleaners, gas stations, and other commercial activities, were missing from this neighborhood. It also became clear that this neighborhood, like many others in the industrial core of our cities, had a complex mix of housing and industry, with the two almost completely intermingled. It is rare to find a residence in Waterfront South that is more than three blocks away from some type of industrial acitivity. The neighborhood tour also revealed the importance of particulate emissions in Waterfront South. In addition to the major particulate sources along the river - with St. Lawrence Cement, Mafco Worldwide, American Minerals, Camden Iron and Metal, and GP Gypsum ranging along 1.5 miles from south to north - there were numerous small sources. These included facilities handling various types of waste materials; windblown dust from dozens of vacant lots; and diesel particulate matter from the hundreds of trucks that pass through the neighborhood each day, many of them idling illegally while waiting to pick up or deliver their cargo. Based on these observations, particulate matter was added to the scope of the pilot project.

Camden Waterfront South 14 Air Toxics Pilot Project
The thirty facilities identified in the neighborhood tour were added to the initial emissions inventory. The next step was a review of all relevant information that was readily available in DEP files and databases. Emissions that are allowed by Air Pollution Control Preconstruction Permits issued by DEP since about 1999 can generally be found in the Department database known as NJEMS. Information on emission sources with permits issued before 1999 can be found in hardcopy form in the file room at the Department’s Headquarters. Additional files can be found in the Regional Enforcement Offices. The Southern Regional Enforcement Office, which covers the Counties of Atlantic, Burlington, Cape May, Cumberland, Gloucester, Salem, and Camden (and thus includes Waterfront South), is located in North Camden near the Aquarium. Staff from this Regional Office were active participants in the Project Workgroup and helped to check their office files for permit information. Another way to identify potentially important emission sources came through the DEP Enforcement Sweep which was conducted in October 2002. This effort was the first of its kind to be conducted in the state of New Jersey. State workers from a myriad of DEP programs were focused on South Camden and were sent around to inspect facilities to find if they were in compliance with all of their DEP permits, and to discover sources that needed permits but had never applied for them. From this effort we were able to identify an additional list of facilities which could have locally significant air emissions. The Enforcement Sweep also helped in verification of what we had in the inventory, including the addition or deletion of facilities. All of the data we collected were put into an Excel Spreadsheet and an improved local inventory started to take shape. There were still a lot of blanks to fill in, so it was necessary to gather more information. The next step was to visit each of the facilities that had been identified from permits or from the Enforcement Sweep to collect more detailed information about the operations that might result in air emissions. These site visits helped us to really understand each facility as a physical enitity and not just some numbers on paper. Over the course of three months, DEP staff, along with staff from the Camden County Health Department, visited every facility on our list even if we had detailed information in our permit files. One important reason to visit each facility was to identify sources that do not require permits but should be included in the inventory because of their potential emissions (for example, a root mulch pile). These visits were extremely helpful when it came time to model the emissions because it gave us first-hand knowledge of where the actual sources at the facility were located and how far the facility was from the nearest residence. The knowledge of local sources possessed by the County staff was invaluable in this step of the process. Tours of the facilities varied according to the site manager and the type of operation. Some tours were very detailed and extensive. Others were a quick look around, followed by the facility manager or owner answering questions. In addition to the questions related to the operational sources at the facility, we collected information about truck traffic in and out of a facility. We also asked what kind of off road mobile sources they had at the facility, such as cranes, front-end loaders, and forklifts and what type of fuel these ran on. The information obtained during the facility tours was used to add to, or verify, the information in the neighborhood inventory. In many cases, the information that was available from the DEP air permitting program provided a very limited picture of air toxic emissions in Waterfront South. Under New Jersey’s permitting regulations, most facilities are not required to submit air toxic emissions information, and when they do it is often reported as total Hazardous Air Pollutants (HAPs), rather than as individual chemical compounds. In addition, many small sources are exempt from permit requirements and older permits are less likely to contain air toxic emission rates. We used USEPA’s AP-42, Compilation of Air Pollutant Emission Factors (USEPA 2004) and the California Air Toxics Emission Factor Database (CATEF) (CARB 2004), to fill in some of the data gaps, with mixed results. For example, in some cases the California factors

Camden Waterfront South 15 Air Toxics Pilot Project
predicted emissions of pollutants which further investigation showed would not be emitted from these New Jersey sources. Because so many sources of particulate matter (PM) were revealed while compiling the inventory of facilities in Waterfront South, a concerted effort was made to include PM emissions in this project. Particulate matter is solid matter or liquid droplets from smoke, dust, fly ash, or condensing vapors, that can be suspended in the air for long periods of time. It represents a broad class of chemically diverse particles that range in size from molecular clusters of 0.005 microns in diameter to coarse particles of 50-100 microns in diameter. Particulate includes an array of materials: for example, carbon-based matter such as soot and ash; windblown dirt, sand, and soil dust; metals; and plant matter such as pollens. Sources are varied and include automobile exhaust, diesel emissions, industrial and residential smokestacks, fires, and construction, as well as natural sources. Fine particulate is also formed secondarily from the transformation of acid gases (for example, SO2 and NO2) to acid aerosols by atmospheric processes. The first U.S. National Ambient Air Quality Standard (NAAQS) for particulate was based on particles up to 25-45 microns in size, termed "total suspended particulate" (TSP). In 1987, USEPA replaced TSP with an indicator that includes only those particles smaller than 10 microns in diameter, termed PM10. In 1997, USEPA established standards for PM2.5, which consists of particles sized 2.5 microns and smaller. DEP air permits generally contain only TSP or PM10 limits. We used California’s Air Toxics Emission Factor Database (known as CATEF (see CARB 2004)) to estimate emissions for PM2.5 or PM10 , based on whatever particulate limits were listed in a facility’s permits. In addition, certain large facilities had detailed information that had been collected for previous permit-related modeling studies, and this information was used if available. DEP staff met with representatives of the local industries on July 8, 2003, to brief them on the Air Toxics project. Over 30 facilities were invited and nine attended. At this meeting the companies were given a copy of their facility’s emissions inventory, compiled by DEP, and had the opportunity to provide corrections and other information that could be helpful in improving the accuracy of the modeling analysis. The meeting also included presentations by the New Jersey Program for Manufacturing Excellence (NJME) and the DEP Small Business Assistance Program (SBAP). The NJME (located at Rutgers University) provides no cost pollution prevention and energy efficiency assessments. The SBAP helps small businesses in the state to understand the environmental regulations which govern their operation. 2.1.2 Facilities List The final list of facilities included in the project inventory and the pollutants they emit can be seen in Table 2. In addition to the type and amount of pollutant emitted from each source, the inventory also included the following parameters: facility location; type of operation; facility contact; emission sources at the facility; and a detailed description of the sources’ exhaust components (i.e., stack height, diameter, exhaust velocity, and temperature). All of this information was entered into an Excel spreadsheet. The latest version of the inventory can be found at the Pilot Project website, www.nj.gov/dep/ej/airtoxics.html. As was described above, many facilities that were initially placed in the inventory were deleted because subsequent investigation revealed that they were closed or did not have significant air emissions. These facilities are listed in Table 3.
Table 2: Facilities Included in the Waterfront South Inventory Which Were Modeled

Camden Waterfront South 16 Air Toxics Pilot Project
Facility Name Pollutants
1 American Minerals, Inc. PM10 2 Art Metalcraft Hydrogen cyanide; soluble nickel; zinc 3 Broadway Finishing Methyl ethyl ketone; toluene; xylene 4 Cam Core PM10; PM2.5; chlorine; chromium; cobalt; copper; lead;
manganese; nickel; zinc; ethylene; n-hexane; toluene 5 Camden Cogeneration (Camden Cogen) PM10; ammonia 6 Camden County Municipal Utilities
Authority (CCMUA) PM10; PM2.5; hydrogen sulfide; chloroform; chlorobenzene; carbon disulfide; benzene; ethylbenzene; 1,4-dichlorobenzene; methylene chloride; methyl tert-butyl ether; cumene; 1,1,1-trichloroethane; dichloromethane; toluene; carbon tetrachloride; perchloroethylene; trichloroethylene; ethylene dichloride; ethylene; xylene; formaldehyde; isoprene
7 Camden County Municipal Waste Combustor (CCMWC)
PM10; PM2.5; arsenic compounds; manganese compounds; cadmium compounds; lead; chromium compounds; hexavalent chromium; mercury compounds; hydrogen chloride; hydrogen fluoride; sulfuric acid; 2,3,7,8–TCDD TEQs; nickel; formaldehyde; beryllium; 7-PAH; polycyclic organic matter
8 Camden Iron & Metal PM10; PM2.5; arsenic; barium; cadmium; chlorine; chromium; cobalt; copper; lead; manganese; mercury; nickel; selenium; zinc; ethylene; n-hexane; toluene
9 Camdett Ammonia 10 Colonial Processing PM10; PM2.5; n-hexane; xylene 11 Comarco PM10; PM2.5; lead 12 Container Recyclers of Camden Titanium dioxide; xylene 13 CWS Industries PM10; cadmium 14 Duro Plating Co. (Duro) Cadmium; hydrogen cyanide 15 F.W. Winter PM10; PM2.5; nickel; chrome dust; chromium; manganese
compounds; vanadium compounds 16 GP Gypsum (formerly Georgia Pacific Co.) PM10; PM2.5; arsenic; barium; cadmium; chlorine; chromium;
copper; lead; manganese; nickel; selenium; zinc; benzene; n-hexane; formaldehyde; naphthalene; propylene; toluene; ethylene
17 Hospital Central Services Inc. Laundry PM10; PM2.5; barium; cadmium; chlorine; cobalt; copper; lead; manganese
18 Innovative Recovery Products PM10; PM2.5; chlorine; chromium; cobalt; copper; lead; manganese; nickel; zinc
19 Mafco Worldwide (Pneumo Abex Corp.) PM10; ammonia; propylene glycol 20 Peerless Castings PM10; PM2.5; chlorine; chromium; cobalt; copper; lead;
manganese; nickel; zinc; ethylene; n-hexane; toluene 21 Plastic Consulting & Mfg. Co. PM10; PM2.5; lead; diethylene glycol monobutyl ether; methyl
isobutyl ketone 22 PSE&G Camden Coal and Gas PM10; benzene; formaldehyde; toluene; methane 23 SL Surface Technologies PM10; PM2.5; arsenic; cadmium; chromium (hexavalent; chromic
acid); copper; lead; manganese; nickel 24 St. Lawrence Cement Co. Inc. PM10; mercury; manganese; lead 25 State Metal Industries Inc. PM10; PM2.5; chlorine; chromium; cobalt; copper; lead;
manganese; nickel; zinc; ammonia; dioxins; hydrogen chloride; n-hexane; ethylene; toluene
26 Teideken Bros Auto Body Inc. Methyl isobutyl ketone Table 3: Facilities in the Waterfront South Inventory Not Modeled
Facility Name Reason for Exclusion

Camden Waterfront South 17 Air Toxics Pilot Project
1 Air Products & Chemicals No reportable emissions 2 Alnort Processing Co. Facility Closed 3 Beckett Street Marine Terminal Mobile source only 4 Biothane Facility Closed 5 Camden Asphalt & Concrete Co. Inc. Facility Closed 6 Camden International Commodities Terminal No reportable emissions 7 Camden State Inspection & Repair Facility Closed 8 Camden Yards Steel No reportable emissions 9 Central Metals No reportable emissions
10 Concord Chemical No reportable emissions 11 Del Monte Fresh Produce NA Mobile source only 12 Delaware Ship Supply Company No reportable emissions 13 Drums Service of Camden Facility Closed 14 F&R Pallets No reportable emissions 15 R. Fannelles Sons No reportable emissions 16 Gloucester City Terminal Facility Closed 17 H&S Provisions Mobile source only 18 International Resource Recovery Facility Closed 19 J.L. Poultry Mobile source only 20 Jen-Cyn Enterprises Mobile source only 21 Joseph Oat Corporation No reportable emissions 22 Kaplan & Zubrin No reportable emissions 23 National Paper Recycling Mobile source only 24 R&R Metal Fabricators No reportable emissions 25 Tri State Bulk Terminal Inc. Facility Closed 26 R. Yaffa & Sons No reportable emissions
2.2 STEP 2: DISPERSION MODELING
2.2.1 Basic Steps Dispersion modeling is a mathematical calculation that predicts how far, how fast, and in what direction certain gases and/or particulate matter will move in the air away from a given location. The model predictions are then expressed in terms of the concentration of the contaminant in the outdoor air. Models, such as the Industrial Source Complex (ISC) model which was used in this project, take into account the likely meteorological conditions in the area, using five years of hour-by-hour weather data (wind speed, wind direction, etc.). A detailed description of the modeling component of this project can be found in Appendix A. The final emission inventory prepared for this pilot project identified twenty-six facilities in or near the Waterfront South neighborhood for which air emissions could be quantified. These facilities have the potential to emit 37 different air toxics, and also emit particulate matter. Separate model runs were prepared for each of the pollutants, and concentrations for each pollutant were predicted at 2964 spots (known as receptors) within the boundaries of Waterfront South (see Figure 1). The results of the model runs were examined in several different ways. First, for each pollutant the maximum air concentration which was predicted anywhere in the neighborhood was identified. (These concentrations were later used in the risk assessment step.) Next, maps showing the distribution of predicted concentrations from all the sources combined and for each source individually were prepared for each pollutant. These maps gave a visual way to review the model outputs and made it easier to identify errors that may have cropped up in the modeling process. They also showed where impacts from individual facilities overlapped and where residential areas may be affected by these pollutants.

Camden Waterfront South 18 Air Toxics Pilot Project
Figure 1 shows one of these maps which were prepared early in the study to illustrate the predicted annual average concentrations of PM10. The rings on the map depict areas of equal concentration. In this case the outer ring is around an area in which all the concentrations are predicted to be 5 ug/m3 or higher. The next ring surrounds an area in which all concentrations are 15 ug/m3 or higher, etc. This map showed very high concentrations of PM10 (greater than 35 ug/m3) around the American Minerals facility, which led to further scrutiny of the emission rates and modeling parameters used in this study. It also triggered additional investigation by the DEP enforcement staff.
Figure 1: Example of Dispersion Modeling Results

Camden Waterfront South 19 Air Toxics Pilot Project
2.2.2 Iterative Process Dispersion modeling is most often an iterative process in which simple situations, which overstate the possible impact of a source, are modeled first. If the first round of modeling, often known as the screening step, shows a very small impact well below levels of concern, then the modeling process can stop, since any refinement would predict even lower concentrations which would be further below levels of concern. If the screening step predicts relatively high concentrations, then more detail is added from the emissions inventory and to the modeling technique, in order to get a more accurate depiction of the likely impact of the facility. This increasingly detailed iterative approach was used in the Pilot Project to predict more realistic air concentrations expected from the facility emissions. As in our schematic (where we move from a simple image to a more sharply defined image), the detail added at each modeling step moves closer to describing the actual emissions and their impact. The improvements made from one step to the next were generally based on discussions with DEP Enforcement staff familiar with how particular facilities operate, and in some cases, by additional visits to the sites. One example of this refinement, or iterative, process is the way in which manganese emissions from St. Lawrence Cement were modeled. In the initial analysis, we assumed that all of the manganese came from the raw material storage piles. This resulted in a maximum annual air concentration of 1.01 ug/m3, which is about 20 times higher than the reference concentration for manganese. Since all of the particulate emitted from the site is likely to contain some manganese, it was decided to remodel with the same quantity of manganese emissions distributed among all the particulate sources. When this more realistic scenario was modeled, the maximum annual air concentration was predicted to be 0.08 ug/m3, which is 1.6 times higher than the reference concentration. This change reflected the fact that emissions actually come from a wider variety of sources, including some tall stacks that disperse pollutants over a wider area and result in lower concentrations. Assumptions made in this second analysis were still likely to over-predict the air concentrations because of other conservative assumptions. When St. Lawrence Cement prepared a comprehensive modeling analysis of their facility in support of their initial permit application in 2000, they included more details regarding the site (for example, the location and size of buildings) than DEP’s less detailed modeling of dozens of sources in and near Waterfront South. The result of that analysis was a slightly lower concentration of manganese, predicted to be 0.04 ug/m3 that is 1.3 times higher than the reference concentration. This whole analysis of manganese emissions from the St. Lawrence Cement facility is about to be revisited as part of their new permit application, which requests permission to directly offload raw materials from ships at a dedicated dock adjacent to their property rather than use trucks to transfer the material from the Beckett Terminal which is about 1.5 miles away. The new analysis will use the most up-to-date information and the latest configuration of the equipment, and is likely to result in a slightly different predicted concentration of manganese. The analysis will be made available to interested parties as part of the DEP public participation process. As can be seen from this example, as more information is added to a modeling assessment the predicted concentrations may change significantly, moving closer to what is really experienced in the neighborhood.

Camden Waterfront South 20 Air Toxics Pilot Project
2.2.3 Model Results The model results were evaluated in a number of ways. After completing a visual review of the maps for quality assurance, the maximum annual concentration of each pollutant was identified. This was the highest concentration predicted at any of the receptor points (Figure 2) after averaging the predicted values for a whole year at each point. These values were used in the risk assessment step to flag the pollutants that warranted additional attention in this study. A summary of these annual averages can be found in Table A1. The numbers in that table represent the most recent modeling analyses using all of the additional information that we have been able to collect as the study progressed. In some cases these concentrations are now much lower than they were midway through the project due to changes made at local facilities. (For example, the PM10 concentrations are lower since American Minerals has installed a baghouse filter to reduce particulate emissions from several parts of their operation.)
Figure 2: Distribution of Air Quality Receptors across Waterfront South Each dot on the map represents a point where air concentrations were predicted by the ISC model.
For 23 pollutants, shorter-term (i.e. less than annual average) concentrations were also identified. This was necessary in order to compare the predictions to short-term health benchmarks that are set for 24-hour or shorter exposure. This is important if the pollutant has an acute effect that can occur after a short exposure to a large amount of a chemical, such as ammonia that can be highly irritating to the respiratory tract. The maximum short-term exposures based on the modeling can be found in Table A2. 2.2.4 Comparison to F.W. Winter NATA Predictions USEPA’s 1996 National-Scale Air Toxics Assessment (NATA) predicted that a section of Camden City had the highest cancer risk from hazardous air pollutants in the entire country, 1300 in a million. The predicted NATA cancer risk for Waterfront South was 160 in a million. DEP reviewed the emissions data used by USEPA, and found that about half of the cancer risk could be attributed to chromium emissions from a single source in North Camden known as F.W. Winter. The facility, which grinds and repackages chromium ore for sale, has reported to the federal Toxic Release Inventory (TRI) that they emit about 9229 pounds of chromium in 2000, with 1218 pounds coming from stacks, and the remaining 8011

Camden Waterfront South 21 Air Toxics Pilot Project
pounds being fugitive emissions. For NATA, USEPA assumed that 34% of all chromium emissions are hexavalent chromium, a carcinogenic form of chromium. DEP’s Southern Regional Enforcement Office visited F.W. Winter to determine if the chromium emissions are actually as high as reported. They were found to be high, but we know from prior work by the Camden County Health Department that they are not hexavalent. Chromium dust emitted from this type of operation would not be hexavalent, since it is being produced by a mechanical rather than chemical action. It is likely that this incorrect assumption led to the very high cancer risk predicted by NATA for Waterfront South. To confirm that this was indeed the case, F.W. Winter was included in the Pilot Project modeling analysis, even though it is about 1½ miles away from Waterfront South. Modeling the facility resulted in a predicted annual average chromium impact at the northern edge of Waterfront South of 0.007 µg/m3. If this were incorrectly assumed to be 34% hexavalent chromium, as was the case in NATA, then the estimated cancer risk would be 28 in a million. However, as stated above, the chromium emitted from F.W. Winter is not hexavalent chromium. It is trivalent chromium, a form of chromium that is not carcinogenic. In fact, there are no studies that show any harmful effects from inhalation of trivalent chromium, so there is no health benchmark to which it can be compared. Therefore in this study, since the chromium is in particulate form, it was decided that the chromium concentrations from F.W. Winter would be added to the PM10 concentrations in the modeling step. 2.2.5 Sources Not Modeled It was not possible in this study to model every single source that might contribute to the air toxics or particulate exposures in Waterfront South. Some additional categories of sources that may have a significant impact in this neighborhood are described below. Although we did not model these sources, it is important to acknowledge them and understand that these unquantified emissions are in addition to those quantified in the modeling step. Diesel Trucks There are large numbers of trucks traveling through Waterfront South, and the majority are likely to have diesel engines. During our facility visits, staff asked how many truck trips were generated by the facility on a daily basis. Using this estimate we are able to account for about 683 truck trips per day within the neighborhood. In addition, there are the trucks that come and go from the South Jersey Port Corporation Broadway Terminal (with an entrance at Morgan Boulevard), and the trucks that deliver material to facilities in the neighborhood with no other direct air emissions which were not included in the modeling analysis (see Table 3, for example). Vita Nuova collected information from South Jersey Port Corporation and several local industries (Vita Nuova, 2003, pp. 45-49). They report 7,768 truck trips per year from the Broadway Terminal and 77,019 truck trips generated by several companies located in Waterfront South, including Camden Iron & Metal, Camden International Cocoa Bean Terminal, and St. Lawrence Cement. Although it was not possible to quantify these emissions and their impact on local air quality, we can use the results of the 1996 National Air Toxics Assessment to get a ballpark number. In that analysis, it was predicted that the amount of diesel particulate matter in the air in Waterfront South (on an annual average basis) is about 0.68 ug/m3 from on-road diesel engines. (This does not include off-road engines such as fork lifts and cranes, and from diesel ships in port (as described below)). Diesel Ships in Port
Camden Waterfront South 22 Air Toxics Pilot Project
Cargo ships are generally run by diesel engines, which may continue to idle while in port loading and unloading goods. Studies have shown that these engines can emit significant quantities of particulate matter (Cooper 2003, USEPA 2000). Therefore, the 400 ships per year that visit the Camden Port (for Beckett and Broadway Terminals combined) are a significant missing emissions source, and the ships that berth on the Philadelphia side of the Delaware River may also be an important group of sources. USEPA projects in Philadelphia (Region 3) and in Oakland (Region 9) will generate new information about how to estimate emissions from port operations. When the emission factors are ready, we intend to revisit this part of the Camden study and look at other port operations in the state as well. Dust From Scrap Yards Throughout the Waterfront South neighborhood there are numerous sites of current and past scrap handling operations. These operations range from crushing cars to recycling paper and wooden pallets. Many facilities appear to be abandoned, with waste materials still on-hand. Two of these facilities – Camden Iron & Metal and Innovative Recovery – are large enough to require air permits. For these two facilities we were able to gather enough information to include them in the modeling analysis. It was not possible to include emissions from operations at other facilities since the tools to estimate emissions are not available at this time. Dust from Contaminated Sites Waterfront South has a long history of industrial activity and, as a result, it is also home to numerous contaminated sites. There are two Superfund Sites – Welsbach (also known as Camden Gas Mantle) and Martin Aaron (a former drum recycling factory, also known as Drum Service of Camden). The Welsbach site is contaminated with radium, which has also migrated to several adjacent lots. In 2004 an entire block of homes on Arlington Street adjacent to the Welsbach site was demolished after it was determined that they were contaminated and rendered uninhabitable. In addition to these Superfund sites, there are 20 or more New Jersey Known Contaminated Sites within the boundaries of Waterfront South. Where the sites are unvegetated, windblown dust is of concern. Where these sites are not fenced, there is the possibility of children being exposed to contaminated soil while playing in the dirt. Potential air contaminant emissions from these sites were not included in the dispersion modeling portion of this Pilot Project. However, some of the Risk Reduction Strategies may help to reduce exposure to the contaminants at these sites. Simply identifying the Known Contaminated Sites was an arduous task which required the examination of multiple lists which are not necessarily complete and which do not have any information about the type of contamination at each site. The Site Remediation program recognizes this problem and has recently begun an effort to make much of this information (including type of contamination) more accessible (both within and outside the Department) and more complete. The Philadelphia Plume USEPA Region 3 has recently conducted a modeling exercise aimed at quantifying air concentrations of nine HAPs across the Philadelphia metropolitan region. Included in that modeling exercise were predictions for points (receptors) in the Camden Waterfront South neighborhood in order to estimate the contribution to local HAP levels from the Philadelphia area. Although USEPA used an inventory for 1999, we can use these results to estimate the influence that Philadelphia emissions have on the Camden region. With the exception of total chromium and ethylene dichloride, all of the modeled pollutants exceed the health benchmarks used by the DEP. (Health benchmarks are discussed in Section 2.3.1 of this report.) Three of these pollutants – acetaldehyde, acrolein and formaldehyde – have high concentrations because they are formed in the atmosphere from other pollutants and do not have significant direct emissions in Philadelphia. Polycyclic Organic Matter (POM) has significant

Camden Waterfront South 23 Air Toxics Pilot Project
contributions from small stationary sources (also known as area sources). All of the other pollutants are high because of the emissions of mobile sources (both on-road vehicle such as cars and trucks, and off-road vehicles such as construction equipment). It is important to note that none of these ten pollutants are flagged in the risk assessment for this study as pollutants of concern (see section 2.3.2).
PREDICTED IMPACT OF PHILADELPHIA SOURCES ON WATERFRONT SOUTH
Pollutant Concentration (ug/m3)
Primary Source Contributions
1,3 butadiene 0.13 73% On-road vehicles 27% Off-road vehicles
Acetaldehyde 13.6 Formed in the Atmosphere Acrolein 7.8 Formed in the Atmosphere Benzene 1.2 60% On-road vehicles
33% Off-road vehicles Chromium Total 0.12 Area Sources Diesel PM Total 2.6 20% On-road vehicles
80% Off-road vehicles Ethylene Dichloride 0.0002 86% major sources
14% Area sources Formaldehyde 8.5 Formed in the Atmosphere
Polycyclic Organic Matter (POM)
0.17 84% Area sources 11% On-road vehicles
Source: Cimorelli (2005) Radioactivity The Welsbach Superfund site has been a source of radioactivity in this neighborhood for over 80 years. The remediation of this site is ongoing. The slag imported as raw material by St. Lawrence Cement is also know to contain a low level of radioactivity and the company is required to monitor for radioactivity at its fenceline. Radioactivity was not included in this study, however, due to difficulties in quantifying these emissions. In addition, a separate model would be necessary to predict the impact of these emissions on neighborhood air quality. 2.3 STEP 3: RISK ASSESSMENT Risk assessment is the process by which potential exposure to pollutants is compared to chemical-specific health benchmarks to estimate the probability that adverse health effects could occur. Probability can also be used to describe other risks that people face. For example, the probability that a person will suffer a stroke sometime in their lifetime is about one in fifteen, and the probability that a person will be struck by lightning is about 1 in 30,000.
Part of the September 30, 2003, meeting with the Community Advisory Committee was devoted to an explanation of risk assessment in general, and how we were expecting to use it in this Pilot Project. Copies of the handouts from that meeting can be found in the electronic attachments to this report at

Camden Waterfront South 24 Air Toxics Pilot Project
www.nj.gov/dep/ej/airtoxics.html. 2.3.1 Basic Steps Health risk for this project was estimated by calculating risk ratios, a comparison of an air concentration to a health benchmark. If the air concentration is higher than the benchmark (resulting in a ratio greater than 1), there is a concern that the exposure could result in some detrimental health effect. Benchmarks are developed differently for carcinogens and noncarcinogens. For carcinogens, the health benchmark is based on the air concentration that corresponds to a one in a million increase in the risk of contracting cancer from exposure to the specific chemical. That air concentration is derived from a unit risk factor, which numerically represents the risk of getting cancer over a lifetime of exposure to one unit (one microgram per cubic meter) of the chemical in the air. Unit risk factors used in the Pilot Project were developed and published by panels of experts, primarily at USEPA or California's Office of Environmental Health Hazard Assessment (OEHHA). It should be noted that use of a risk ratio to evaluate results is different from the approach commonly used to evaluate carcinogens. In this study, instead of reporting risk (for example one in a million cancer risk or one in ten thousand risk) which can give the impression that the precise level of risk has been calculated, we have used risk ratios to tell us if the predicted levels are above or below a critical threshold (the health benchmark). Pollutants that fall above the health benchmark (i.e. having a risk ratio greater than one) warrant additional study. Those that fall below the health benchmark are set aside. For effects other than cancer, USEPA and OEHHA develop reference concentrations, numbers by which you can estimate whether exposure to a noncarcinogen (non-cancer causing chemical) may result in some detrimental health effect. If the average exposure to a chemical is less than its reference concentration, there should be no health effect, even for sensitive populations like children or the elderly. For the Camden Waterfront South project, reference concentrations were used as the health benchmarks for noncarcinogenic effects, for both long-term and short-term exposures. All of the toxicity data used as air toxics benchmarks for the Pilot Project can be found on DEP’s website at www.nj.gov/dep/aqpp/risk.html. They are listed in the documents “Unit Risk Factors for Inhalation,” “Reference Concentrations for Inhalation,” and “Reference Concentrations for Short-Term Inhalation Exposure.” They can also be found in the Tables 5 and 6 below. Air Toxics Results At the beginning of the Pilot Project we did a preliminary risk assessment which compared predicted (modeled) air concentrations of pollutants to their health benchmarks. The results of the preliminary risk assessment can be found in Appendix B. Any pollutant predicted at this step to be above the benchmark was flagged for additional study. After our emissions inventory and modeling efforts were refined, as described in earlier sections of this report, a final version of the risk assessment was done. These final results are presented in Tables 4, 5 and 6 below. As shown in Table 4, of the air toxics that were modeled for the final risk assessment, seven were predicted to be above the health benchmark at one or more points in Waterfront South, and 30 were predicted to be below the health benchmark at each of the 2964 modeled points. (Note that particulate matter is discussed separately below.)

Camden Waterfront South 25 Air Toxics Pilot Project
Table 4: Pollutants Modeled in Camden Waterfront South Compared to a Health Benchmark
Pollutants ABOVE the Health Benchmark at ONE or MORE
Points in Waterfront South
Pollutants BELOW the Health Benchmark at ALL Points in
Waterfront South 1 Arsenic 1 Ammonia 2 Cadmium 2 Benzene 3 Dioxin 3 Beryllium 4 Hydrogen sulfide 5 Carbon disulfide 5 Lead 6 Carbon tetrachloride 6 Manganese 7 Chloroform 7 Nickel 8 Chromium (hexavalent) 9 Cobalt 10 1,4-Dichlorobenzene 11 Ethylbenzene 12 Ethylene dichloride 13 Formaldehyde 14 n-Hexane 15 Hydrogen chloride 16 Hydrogen cyanide 17 Hydrogen fluoride 18 Mercury 19 Methylene chloride 20 Methyl ethyl ketone 21 Methyl tert-butyl ether 22 Naphthalene 23 Perchloroethylene 24 Polycyclic organic matter 25 Propylene 26 Sulfuric acid 27 Toluene 28 Trichloroethylene 29 Xylene 30 Zinc
Table 5 shows the detailed final risk assessment results for chemicals with potential long-term effects, including cancer. The maximum predicted concentration in this table is based on the model results for the 26 facilities identified in the emission inventory. A risk ratio greater than one indicates that there is a cancer risk greater than one in a million, or a potential noncancer effect. Seven of the 37 pollutants in this modeling analysis were predicted to have concentrations above their long-term health benchmarks (i.e. a risk ratio greater than one). These risk ratios that are above 1 are in bold in Table 5.

Camden Waterfront South 26 Air Toxics Pilot Project
Table 5. Final Risk Assessment for Local Stationary Sources – Long-Term Impacts
Pollutant
Maximum Predicted
Concentration (µg/m3)
Long-Term Health
Benchmark (µg/m3)
Health
Endpoint
Long-Term Risk Ratio
1 Ammonia 3 100 Noncancer 0.03 2 Arsenic 0.011 0.00023 Cancer 48 3 Benzene 0.0026 0.13 Cancer 0.02 4 Beryllium 0.00000041 0.00042 Noncancer 0.001 5 1,3-Butadiene 0.00017 0.033 Cancer 0.01 6 Cadmium 0.0054 0.00024 Cancer 23 7 Carbon disulfide 0.0047 700 Noncancer 0.00001 8 Carbon tetrachloride 0.002 0.067 Cancer 0.03 9 Chloroform 0.012 0.043 Cancer 0.3
10 Chromium (hexavalent) 0.00007 0.000083 Cancer 0.8 11 Cobalt 0.0019 0.005 Noncancer 0.4 12 1,4-Dichlorobenzene 0.00009 0.091 Cancer 0.001 13 Dioxin 0.00000003 0.00000003 Cancer 1.1 14 Ethylene dichloride 0.002 0.038 Cancer 0.05 15 Formaldehyde 0.043 0.077 Cancer 0.6 16 n-Hexane 0.13 200 Noncancer 0.0007 17 Hydrogen chloride 0.3 20 Noncancer 0.02 18 Hydrogen cyanide 0.01 3 Noncancer 0.003 19 Hydrogen sulfide 4.4 1 Noncancer 4 20 Lead 0.27 0.083 Cancer 3 21 Manganese 0.08 0.05 Noncancer 2 22 Mercury 0.00053 0.3 Noncancer 0.002 23 Methylene chloride 0.002 2.1 Cancer 0.001 24 Methyl tert-butyl ether 0.00029 3.8 Cancer 0.0001 25 Naphthalene 0.00057 0.91 Cancer 0.001 26 Nickel 0.033 0.0042 Cancer 8 27 Perchloroethylene 0.002 0.17 Cancer 0.01 28 Polycyclic organic matter 0.00044 0.00091 Cancer 0.5 29 Propylene 0.0033 3000 Noncancer 0.000001 30 Sulfuric acid 0.079 1 Noncancer 0.08 31 Toluene 1.7 400 Noncancer 0.004 32 Trichloroethylene 0.00029 0.5 Cancer 0.001 33 Xylene 42.3 100 Noncancer 0.4 34 Zinc 0.016 0.9 Noncancer 0.02
Table 6 shows the detailed results of the risk assessment for short-term exposures. Pollutants in this portion of the risk assessment can cause short-term health effects ranging from respiratory irritation (for example, hydrogen sulfide) to developmental problems in children (for example, lead). The model results were averaged over several time periods (1, 4, 6, 7 and 24 hours) in order to find maximum concentrations that matched the averaging time designated for the various health benchmarks. The appropriate averaging times are noted in this table. Risk ratios greater than one indicate the possibility that the predicted concentration could cause an adverse health effect. This was the case for 2 of the 21 pollutants with short-term benchmarks. These risk ratios that are above 1 are in bold in Table 6.

Camden Waterfront South 27 Air Toxics Pilot Project
Table 6. Final Risk Assessment for Local Stationary Sources – Short-Term Impacts
Pollutant
Maximum Average
Short-Term Concentration
(µg/m3)
Averaging
Time (hrs)
Short-Term
Health Benchmark
(µg/m3)
Short-Term Risk Ratio
1 Ammonia 106 1 3200 0.03 2 Arsenic 0.08 4 0.19 0.42 3 Benzene 0.06 6 1300 0.00005 4 Carbon disulfide 0.06 6 6200 0.00001 5 Carbon tetrachloride 0.02 7 1900 0.00001 6 Chloroform 0.2 7 150 0.001 7 Ethylbenzene 0.003 24 1000 0.000003 8 Formaldehyde 0.9 1 94 0.01 9 Hydrogen chloride 10 1 2100 0.005
10 Hydrogen cyanide 0.36 1 340 0.001 11 Hydrogen fluoride 0.4 1 240 0.002 12 Hydrogen sulfide 107 1 42 3 13 Lead 1.6 24 0.1 16 14 Mercury 0.02 1 1.8 0.01 15 Methylene chloride 0.01 1 14000 0.000001 16 Methyl ethyl ketone 12 24 1000 0.01 17 Nickel 0.14 1 6 0.02 18 Perchloroethylene 0.027 1 20000 0.000001 19 Sulfuric acid 3 1 120 0.03 20 Toluene 24 1 37000 0.0006 21 Xylene 3110 1 22000 0.1
Figure 3 below gathers together the risk assessment results for all pollutants with risk ratios greater than one for all types of health effects (cancer, noncancer, and short-term). Among the pollutants shown in this chart are five for which cancer is the health effect of concern. These pollutants, or carcinogens, are arsenic, cadmium, dioxin, lead, and nickel. Lead is also a concern as a noncarcinogen since lead exposure during infancy and childhood increases the risk of irreversible neurological and behavioural deficits in children. There are two other pollutants of concern that are not carcinogens: hydrogen sulfide and manganese. Long-term exposure to hydrogen sulfide may result in adverse effects on the nasal tract. Injuries (lesions) inside the nose have been found in animal laboratory studies, and chronically exposed workers have been found to have decreased olfactory function. Hydrogen sulfide’s short-term effects include headache and nausea. Manganese is of concern because studies of workers exposed to manganese over a long period have found impairment of neurobehavioral function (visual reaction, eye-hand coordination, hand steadiness).

Camden Waterfront South 28 Air Toxics Pilot Project
Figure 3: Risk Ratios Greater Than 1Camden Waterfront South Air Toxics Pilot Project
Final Risk Assessment
48
23
1.13
8
42
3
16
0
10
20
30
40
50
Arsenic Cadmium Dioxin Hydrogensulfide
Lead Manganese Nickel
RIS
K R
AT
IOS
CancerNoncancerShort-Term
Particulate Matter Results In the risk assessment for particulate matter, the health benchmarks were the National Ambient Air Quality Standards (NAAQS) for inhalable particulate (PM10) and fine particulate (PM2.5). The NAAQS have been set for both short-term (24 hour) exposures and long-term (annual) exposures. The standards are given in Table 7.
Table 7: National Ambient Air Quality Standards (NAAQS) for Particulate Matter
NAAQS PM10 (µg/m3)
PM2.5 (µg/m3)
Annual 50 15 24-Hour 150 65
The USEPA is in the midst of reviewing these particulate standards and may propose more stringent levels in 2006. A Staff Paper (USEPA, 2005) has recommended that the PM2.5 annual standards be lowered from 15 ug/m3 to between 12 and 14 ug/m3; and that the 24-hour standard be lowered from 65 ug/m3 to between 25 and 35 ug/m3. Since the NAAQS are being used as the health benchmark for particulate in this analysis it is important to estimate the total amount of particulate in the air, rather than just the incremental amount contributed by the particulate-emitting sources that are being modeled. To do this, a “background” concentration should be added to the model predictions. Background concentrations are often taken from ambient air monitoring data collected at a representative site.

Camden Waterfront South 29 Air Toxics Pilot Project
DEP operates an air monitoring station at the corner of Copewood and Davis Streets about two miles east of Waterfront South. This station is sited to represent regional levels of particulate matter, so the levels of PM2.5 and PM10 which have been measured there can be assumed to represent particulate levels in Waterfront South that might exist in the absence of the sources that we have modeled. Data from this site were designated as background for this particulate risk assessment. Tables 8 and 9 show the maximum predicted concentrations for PM2.5 and PM10 for both annual and 24-hour averages (since these are the timeframes for the standards). These concentrations are then added to the background concentrations (measured at Copewood and Davis from 2001 to 2004). These total air concentrations can then be compared to the NAAQS to see if there is a chance that air levels could exceed the standards. In the original analysis, the standards for both PM2.5 and PM10 were predicted to be exceeded for both averaging times at some locations in the neighborhood. In the latest analysis, using more up-to-date emission information, both PM2.5 standards and the 24-hour PM10 standard are still predicted to be exceeded.
Table 8. Final Risk Assessment for PM2.5
PM2.5
Modeled Concentration
(µg/m3)
Background Concentration
(µg/m3)
Total Air Concentration
(µg/m3)
NAAQS (µg/m3)
Risk Ratio
Long-term 4.3 14.5 18.8 15 1.3
Short-term 36.1 58.9 95.0 65 1.5
Table 9. Final Risk Assessment for PM10
PM10
Modeled Concentration
(µg/m3)
Background Concentration
(µg/m3)
Total Air Concentration
(µg/m3)
NAAQS (µg/m3)
Risk Ratio
Long-term 12.8 25.9 38.7 50 0.8
Short-term 106.5 73.0 179.5 150 1.2
Diesel Particulate Matter (not modeled in this analysis) As was discussed above in the modeling section, we could, as a rough estimate, use the 1996 NATA predictions to represent the impact of diesel trucks on air quality. The annual average predicted concentration for diesel particulate matter for on-road vehicles was 0.68 µg/m3 in that analysis. This concentration, when compared to the diesel PM health benchmark of 0.5 µg/m3 used by the DEP Division of Air Quality results in a risk ratio of 1.4. The diesel PM concentrations predicted in the Philadelphia Study (see Section 2.2.5) is 2.6 ug/m3 which gives a risk ratio of 5.2. 2.3.2 Facilities of Interest Once the pollutants that were predicted to exceed their respective health benchmarks were identified in the preliminary risk assessment, the next step was to find which facilities might be significantly contributing to these elevated concentrations. This was done by re-examining the model results to find the facilities with predicted concentrations that pose greater than a one in a million cancer risk, or have

Camden Waterfront South 30 Air Toxics Pilot Project
noncancer impacts above a reference concentration, or PM2.5 and PM10 results above the “significance level.”1 Table 10 shows the results of this analysis, in which a total of 10 facilities were identified as “Facilities of Interest” and flagged for additional scrutiny. Figure 4 shows the location of these facilities. As discussed later in this report (see Step 5: Risk Reduction Strategies), improvements have been made at several of these facilities so that a re-analysis today would result in a shorter list of facilities and pollutants.
Table 10: Facilities of Interest and Pollutants of Concern Identified by the Risk Assessment
Facility Name DEP PI #a
Chemicals of Concern
American Minerals 50032 PM10 Camden Iron & Metal 50023 PM2.5, Arsenic, Cadmium, Lead, Nickel CCMUA 50163 Hydrogen sulfide Colonial Processing 50704 PM2.5 GP Gypsum 51611 PM2.5, Arsenic, Cadmium, Nickel Mafco 50001 PM10 Camden County Municipal Waste Combustor 51614 Dioxin Plastic Consulting 50405 Lead St. Lawrence Cement 51588 PM2.5, PM10, Manganese State Metal Industries 50539 PM2.5, Nickel, Dioxin a NJDEP facility identification number for Air Pollution Control Permits The following maps (in Figures 5-9) illustrate the extent of the predicted concentrations that are above their respective health benchmarks. Figure 5a shows that the entire neighborhood is predicted to have PM2.5 concentrations that are greater than the annual NAAQS. The maximum predicted concentration of 18.8 ug/m3 (which represents a risk ratio of 1.3) is expected at the fenceline of Colonial Processing. This does not show up on the map because the maximum occurs in one isolated spot and then drops off rapidly as you move away from the facility. This is the case for most of these pollutants, however we were able to zoom in on the neighborhood with the highest lead impacts (Figure 7a) which allows room to show the maximum risk ratio of 3.2 on the edge of Plastic Consulting. (Note that this represents the impact before the sandblasting operation was moved indoors.) In most cases, the impact areas for individual facility/pollutant combinations do no significantly overlap. However, there is overlap between the modeled impacts of GP Gypsum and Camden Iron & Metal. This is shown in Figure 6 which illustrates the risk ratios for arsenic (Figure 6a), cadmium (Figure 6b), and nickel (Figure 6c). California Emission Factors were used to estimate emissions from the handling of gypsum rock to make wallboard at GP Gypsum, and crushing of cars and other large metal items at Camden Iron & Metal. Using these estimates, we predicted that emissions of arsenic, cadmium and nickel could result in risk ratios significantly great than 1 in the neighborhood. The cumulative risk of these three pollutants produces a risk ratio of about 73, primarily from emissions from GP Gypsum. As a result of this risk assessment, conditions were recently added to the GP Gypsum Operating Permit to require testing of the metal content of their raw materials in order to get a better estimate of the actual emissions of arsenic, cadmium, and nickel from this facility.
1 Here we refer to the “significance level” as the predicted particulate concentration plus the monitored background concentration at Camden Lab. equaling or exceeding the relevant NAAQS.

Camden Waterfront South 31 Air Toxics Pilot Project

Camden Waterfront South 32 Air Toxics Pilot Project

Camden Waterfront South 33 Air Toxics Pilot Project

Camden Waterfront South 34 Air Toxics Pilot Project

Camden Waterfront South 35 Air Toxics Pilot Project

Camden Waterfront South 36 Air Toxics Pilot Project

Camden Waterfront South 37 Air Toxics Pilot Project

Camden Waterfront South 38 Air Toxics Pilot Project
2.3.3 Qualitative Assessment: Nonquantifiable Stressors Which Impact Camden Waterfront South
The residents of Camden Waterfront South are subjected to a number of chemical and non-chemical stressors. In the modeling and risk assessment portions of this study, we were able to estimate the air quality impact of 26 facilities that were identified in the emission inventory step. This section identifies and briefly discusses the major stressors that are not quantified in this report. The report titled “Camden Waterfront South Air Toxics Pilot Project – Qualitative Assessment of Stressors” (see electronic attachments www.nj.gov/dep/ej/airtoxics.html) contains a more thorough discussion of these stressors.
These stressors have the potential to adversely impact the health of the entire population of the neighborhood. The most vulnerable subpopulations are fetuses, infants, children, the elderly, those with pre-existing disease, (especially those with cardio-pulmonary disease, e.g. asthmatics), and those who work or exercise outdoors. These stressors must be recognized if one is to understand the context of the air toxics and particulate matter concentrations that are predicted in this study. Odors: This community is subjected to a multitude of odors and odor events. These odors are often pervasive and severe. The most offensive odors arise from the Camden County Municipal Utilities Authority (CCMUA), which emits odors associated with municipal sewage, and Mafco, whose odors can be likened to burnt organic material. Frequently reported health complaints from odors include irritation of the eye, nose and throat; hoarseness; sore throat; cough; chest tightness; shortness of breath; nasal congestion; palpitations; drowsiness; stress; mood alteration; diarrhea; and feelings of anger and tension (Shiffman et al., 2000). Odors are also reported to exacerbate allergies and asthma. Additional vulnerable sub-populations include persons with high occupational exposure to odors and dust. A study of the relationship between odors and health symptoms in the Waterfront South neighborhood (Dalton 1997) seems to support this association. The Dalton study results indicated that “reports of odor, annoyance, sensory irritation and health symptoms were more frequent and more intense among South Camden residents than among North Camden residents.” A copy of this report is available at www.nj.gov/dep/ej/airtoxics.html. Ozone: Ozone levels present a risk to human health statewide. In 2001 and 2002, the DEP Camden monitoring site (located less than 2 miles east of Camden Waterfront South at Copewood & Davis Sts.) recorded nineteen days with exceedances of the 8-hour ozone standard. In 2003 and 2004, the days exceeding the 8-hour standard dropped to 3 and 4, respectively, at the Camden site. (www.nj.gov/dep/airmon/oz8tbl.htm) This was around the mid-range for the DEP monitoring sites, with some having quite a few exceedances while others had fewer exceedances. Ozone exposure has been linked to a wide range of respiratory problems, such as difficulty breathing, chest pains, nausea, throat irritation, congestion, asthma, reduced lung function, scarring of lung tissue, and premature death. Trucks and Diesel Exhaust: It has been estimated that tens of thousands of trucks per year travel through this community. Trucks affect the quality of life in the community from vibration, falling debris, property damage, curb jumping and other traffic safety hazards, noise, and diesel exhaust. Many of the constituents of diesel exhaust have been classified as carcinogens and pulmonary irritants. Idling trucks have been identified by the community as a particular concern.

Camden Waterfront South 39 Air Toxics Pilot Project
Other Local Sources of Environmental Contamination: It was not possible to quantify the impact of every pollution source in this community. Some other sources that could significantly contribute to local pollution exposures include diesel ships in port and various waste handling facilities. There are also at least 22 sites contaminated by spills or past industrial activity, which could lead to pollutant exposures through both the inhalation and ingestion pathways. Cumulative Risk Assessment: Cumulative Risk Assessment has been defined by USEPA as "an analysis, characterization, and possible quantification of the combined risks to human health or the environment from multiple agents or stressors" (USEPA, 2003). Although the tools have not yet been developed to fully quantify the cumulative risk from multiple pollutants, sources and pathways, it is worth noting that residents of Waterfront South (and other urban communities) are exposed to multiple pollutants, from various sources, under different exposure pathways. For example, this risk assessment found that many facilities emit lead, with two companies, Plastic Consulting and Camden Iron and Metal, emitting lead at levels which elevates exposures to above the health benchmark for the community. In addition to the inhalation route of exposure, residents of Waterfront South are exposed to lead through the ingestion pathway - through their water supply and through hand to mouth contact with leaded paint and contaminated dust/soil. The science of risk assessment is not yet at the point where the effects of past and concurrent exposures to different pollutants are known. Although there are some methods for estimating effects (e.g., addition), they are highly speculative at this time. Low Socioeconomic Status: Residents of Camden Waterfront South experience a poverty level that is about four times the rate of the state as a whole (US Census Bureau, 2000), and the population is almost entirely composed of racial and ethnic minorities, many living in low-income rental units. Low socioeconomic status is also associated with many other stressors, including inadequate or nonexistent health care; urban blight; poor health and nutritional status; low education level; pesticide exposures; and lack of information on how risk-promoting lifestyles and behavior effect health (Haynes & Smedly, 1999). Existing Health Issues: Health data for the residents of Waterfront South specifically is not available. However, it is known that certain health conditions occur in Camden County as a whole at rates that exceed the state average.
• Asthma - Relative to state averages, Camden County has a higher rate of asthma hospitalizations (NJDHSS, 2003a).
• Cancer - The NJDHSS released a report which indicated that Waterfront South experiences a higher rate of cancer than expected (NJDHSS, 2003b).
• HIV/AIDS - As of December 2003, Camden County had the 8th highest number of cases of HIV/AIDs relative to other counties in NJ (NJDHSS, 2003c).
• Blood Lead - Camden County had the eighth highest percentage of children with elevated blood lead levels by county in NJ. (NJDHSS, 2001)
All of these factors can increase the vulnerability to other stressors in the environment. Inadequate or Nonexistent Health Care: Inadequate access to health care has been a major complaint from the members of the community who attend the Community Advisory Committee meetings. Studies have found that working age Americans without health insurance are more likely to have poorer health and to die prematurely than those Americans who have health insurance (NAS, 2002).

Camden Waterfront South 40 Air Toxics Pilot Project
2.4 STEP 4: AMBIENT AIR MONITORING The original workplan for this project called for ambient air monitoring to supplement the air concentrations predicted by the dispersion modeling effort, using the DEP mobile air toxics platform which was then being assembled. However, this platform is not yet ready to be deployed, so other air monitoring strategies were tried. They included: 1) installation of a continuous fine particulate monitor in the Waterfront South neighborhood; 2) collection of episode samples by the community (the Bucket Brigade); and 3) a combination of canister and open path sampling at the CCMUA. These efforts are described below. The results of the air monitoring, while too late to enhance the risk assessment step of this project, may be helpful in carrying out some of the risk reduction strategies, as described later in this report. 2.4.1 Fine Particulates Continuous monitoring for fine particles was initiated on the roof of the Camden County Municipal Utilities Authority (CCMUA) building on November 20, 2003. Monitoring is being conducted using a continuous PM2.5 analyzer, and data is telemetered to the Department’s data acquisition center in Trenton. This Waterfront South site was also added to the DEP’s web site, which is updated hourly with the most current results from the monitoring stations (www.state.nj.us/dep/airmon/). The CCMUA building was chosen because it offered a secure, accessible site in an area of the community where modeling had shown maximum fine particle concentrations were likely to occur. The monitor used is a Tapered Element Oscillating Microbalance (TEOM) manufactured by Rupprecht and Patashnick Co. Inc. TEOM is the method currently employed at all of New Jersey’s continuous fine particle monitoring sites. TEOMs are in wide use nationally for collecting data for reporting fine particle levels to the public but is not a federal reference method (FRM) or equivalent method. USEPA has not designated any continuous method of measuring fine particles as a reference or equivalent method. The only methods so designated are sampling methods that are based on the collection of particles on a filter by drawing air through it for a period of 24 hours. Filters are weighed before and after collecting a sample. The filters must be conditioned and are generally weighed in batches, so it is several days before results are known. Only a FRM can be used to officially determine whether an area is meeting the NAAQS. The continuous monitoring methods, such as the one used at this site, provide data that is updated hourly, in near-real time. Some of the advantages of continuous methods are that the data is almost instantly available, and they provide much better time resolution. They also run constantly except for periods when maintenance is being performed or the instrument malfunctions. They are suitable for use in issuing air quality alerts to the public based on the national Air Quality Index (AQI) (www.epa.gov/airnow/aqi.html). The primary purpose of siting the monitor in Waterfront South was to determine if there were measurably higher PM2.5 concentrations in that community than were being recorded at the State’s permanent air monitoring station in Camden, which is located at Copewood and Davis Streets less than two miles east of Waterfront South. The state operates both an FRM sampler and a TEOM at that site. Since the monitor in

Camden Waterfront South 41 Air Toxics Pilot Project
Waterfront South is located in an area impacted by several local sources, it was expected that fine particles levels there would be higher than at the permanent site. When all of the data collected by the TEOMs at both sites in 2004 is plotted on a single graph (see Figure 10), it is difficult to distinguish between the concentrations recorded at Waterfront South and those at Copewood & Davis. However, if 7-day averages are plotted (as in Figure 11), the concentrations at Waterfront South are seen to be generally the same or higher than the levels recorded at Copewood & Davis. Fitting a regression line to the two sets of data (see scatter plot in Figure 12), it can be estimated that the concentrations of PM2.5 in Waterfront South are about 10% higher than at Copewood & Davis. The strong correlation between the monitored value at the two sites is most likely due to the regional transport of PM2.5 that is thought to influence baseline levels throughout the state.

Camden Waterfront South 42 Air Toxics Pilot Project
Figure 10: Particulate (PM2.5) Concentrations for 2004 in micrograms per cubic meter
Figure 11: Particulate (PM2.5) Concentrations for 2004 in micrograms per cubic meter 7-day average
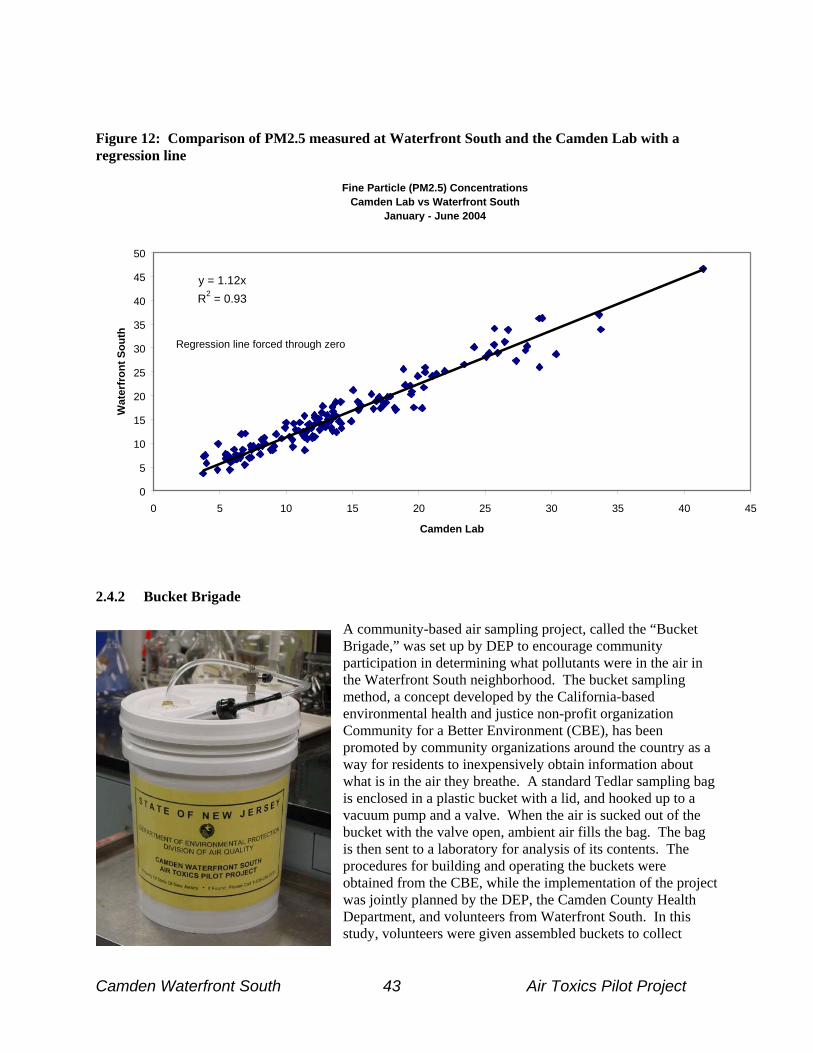
Camden Waterfront South 43 Air Toxics Pilot Project
Figure 12: Comparison of PM2.5 measured at Waterfront South and the Camden Lab with a regression line
Fine Particle (PM2.5) ConcentrationsCamden Lab vs Waterfront South
January - June 2004
y = 1.12xR2 = 0.93
0
5
10
15
20
25
30
35
40
45
50
0 5 10 15 20 25 30 35 40 45
Camden Lab
Wat
erfr
ont S
outh
Regression line forced through zero
2.4.2 Bucket Brigade
A community-based air sampling project, called the “Bucket Brigade,” was set up by DEP to encourage community participation in determining what pollutants were in the air in the Waterfront South neighborhood. The bucket sampling method, a concept developed by the California-based environmental health and justice non-profit organization Community for a Better Environment (CBE), has been promoted by community organizations around the country as a way for residents to inexpensively obtain information about what is in the air they breathe. A standard Tedlar sampling bag is enclosed in a plastic bucket with a lid, and hooked up to a vacuum pump and a valve. When the air is sucked out of the bucket with the valve open, ambient air fills the bag. The bag is then sent to a laboratory for analysis of its contents. The procedures for building and operating the buckets were obtained from the CBE, while the implementation of the project was jointly planned by the DEP, the Camden County Health Department, and volunteers from Waterfront South. In this study, volunteers were given assembled buckets to collect

Camden Waterfront South 44 Air Toxics Pilot Project
short-term whole air samples from sites in the neighborhood during high odor nuisance episodes. Some of the volunteers were assigned to be “sniffers,” who were to identify episodes when strong odors were present and call to initiate sampling. With the help of staff from the Camden County Health Department and DEP, the samples were shipped to the laboratory. There were four major objectives to the study: 1. To evaluate the feasibility of conducting a short term monitoring project to assess odor impacts using
a methodology known as “the Bucket Brigade”; 2. To determine if measurable levels of specific odorous compounds are present during episodes when
members within the community are sensing unpleasant odors; 3. To determine if these compounds are related to specific sources or processes; and 4. To determine if any of the measured toxic volatile organic compounds are elevated during the odor
episodes. The pollutants chosen for analysis in this pilot air monitoring study included those found to be emitted by facilities in Camden Waterfront South, and those that were likely to be emitted from the treatment of wastewater and other biosolids. The pollutants are listed in Table 11. Both categories of compounds, the volatile organic compounds (VOCs) and the reduced sulfur compounds, can be analyzed from a single 3- to 5-liter whole-air sample.
Table 11. Camden Bucket Brigade Target Compounds
VOLATILE ORGANIC COMPOUNDS REDUCED SULFUR COMPOUNDS Name C.A.S. No.a Name C.A.S. No.a
Benzene 71-43-2 Dimethyl disulfide 624-92-0 1,3-Butadiene 106-99-0 Dimethyl sulfide 75-18-3 Carbon tetrachloride 56-23-5 Hydrogen sulfide 7783-06-4 Chlorobenzene 108-90-7 Carbon disulfide 75-15-0 Chloroform 67-66-3 Mercaptans --- 1,4-Dichlorobenzene 106-46-7 Ethylbenzene 100-41-4 Ethylene dichloride 107-06-2 Methyl chloroform 71-55-6 Methylene chloride 75-09-2 Methyl ethyl ketone 78-93-3 Methyl tert-butyl ether 1634-04-4 Perchloroethylene 127-18-4 Propylene 115-07-1 Toluene 108-88-3 Trichloroethylene 79-01-6 Xylenes ---
a Chemical Abstract Service identification number Sampling Plan The Camden Waterfront South area is generally bounded by Atlantic Avenue to the north, Newton Creek to the south, Interstate 676 to the east, and the Delaware River to the west. Three locations with different characteristics were designated as the Bucket Brigade sampling sites: • Worst-case site • High population exposure and high expected concentration site

Camden Waterfront South 45 Air Toxics Pilot Project
• A control site in North Camden, not directly affected by sources in South Camden Based on the modeling portion of this study, the worst case site was expected to be along Viola Street, and the site that combined high population exposure and high expected concentration was determined to be along Ferry Avenue and Broadway. The control site was either within the Camden-Rutgers campus or at the DEP Southern Regional Office near the State Aquarium. A training and “shakedown” event was held on January 16, 2004. Community volunteers were given a “hands-on” training session in the operation of the samplers, and then participants went to their respective monitoring locations and collected an actual sample. After the shakedown, sampling episodes were not pre-determined, but were to be initiated by odor events that are categorized as “severe.” In “Phase 1,” three episodes for comprehensive monitoring were to be conducted. During each of these three episodes, one sample was to be obtained from each of the three sites listed above. Each sample, along with one pre-determined quality control sample per episode, was to be analyzed for the pollutants listed above. In “Phase 2” of the sampling period, only one sample was to be obtained per episode. The locations for sampling were concentrated in the Waterfront South Area that were determined from “Phase 1” as having the worst odors. These locations are flexible, changeable and may not include sites 1 or 2 above. At least eight samples were to be obtained in this manner. Table 12 below shows the proposed analyses for the sampling episodes and the testing phase. For quality assurance purposes, three bucket samples were to be collected at the DEP’s ambient monitoring station at the intersection of Copewood and Davis Streets in Camden (referred to as “NJDEP Site”) during the course of the project on a day that coincides with the collection of a 24-hour VOC sample that is routinely performed there. The 24-hour VOC sample is collected every six days.
Table 12: Breakdown of Bucket Brigade Sampling Plan
Regular Samples Quality Control Samples Phase Waterfront
Site#1 Waterfront
Site#2 Distant
Site
Replicate
Duplicate Field Blank
NJDEP Site
Testing Phase Bucket Test XXXX Shakedown X X X X X X Phase 1 (3 Fixed Sites)
Episode 1 X X X X Episode 2 X X X X Episode 3 X X X X Phase 2 (1 Flexible Site)
Waterfront Site F
Episode 4 X X Episode 5 X X Episode 6 X X Episode 7 X X Episode 8 X X Episode 9 X X Episode 10 X X Episode 11 X X

Camden Waterfront South 46 Air Toxics Pilot Project
Findings Bucket samples were collected on 7 different days from January 16, 2004 through June 28, 2005. On each day, one to four buckets were used. A total of 13 volatile organic compounds were observed in these samples. Bar charts for each of these pollutants can be found on the project website (www.nj.gov/dep/ej/airtoxics.html). The charts for benzene and chloroform are repeated below with a detailed discussion of the results. Benzene was detected in every bucket sample (see the bar chart in Figure 11). This is not surprising since benzene is a component of motor vehicle emissions. In the National-Scale Air Toxics Assessment for 1996, USEPA assumed that even remote parts of the country would have on average at least 0.48 ug/m3 concentrations of benzene in the air. This is noted in the benzene bar chart by the arrow labeled “National Background.” On the first day of sampling (January 16, 2004), which was very cold (and when volatilization from industrial and commercial sources would be limited), most of the samples were very close to the National Background. One notable difference is the Rutgers site, which is about twice as high as the other samples. This is most likely because the Rutgers site is so close to the Ben Franklin bridge. It is difficult to do a risk assessment with data that is collected sporadically, as is the case with the Bucket Brigade. A cancer risk assessment is generally based on a lifetime of exposure to a carcinogen. Since the bucket samples only represent a few minutes, a cancer risk assessment could be misleading. However, for the sake of comparison, we have shown the long-term health benchmark of 0.13 ug/m3 in the bar chart. This represents the exposure that would increase the risk of contracting cancer by one in a million. Note that this benchmark concentration is about 4 times lower than the National Background level. Although the cancer risk is difficult to calculate, one wonders if exposure to benzene at the levels measured by the buckets might result in a more immediate health effect. To answer this question, we can compare the bucket concentrations to the short-term health benchmarks developed by he California Office of Environmental Health Hazard Assessment (OEHHA). They have set a 6-hour Acute Reference Exposure level for benzene at 1300 ug/m3 to protect against non-cancer effects. This health benchmark is much higher than anything measured by the buckets. (In fact, it is such a large concentration that we could not even show it on our bar chart.) Based on this comparison, there does not seem to be any short-term danger related to the observed levels of benzene in the buckets. One final way to evaluate this data is to compare it to benzene concentrations that we have observed elsewhere in the state. In the bar chart we have noted the average concentrations at the NJDEP Monitoring sites in Camden (at Copewood & Davis) and in Chester during 2002. The bucket concentrations seem to be similar to what was found in Chester (with about half of the measurements being higher and half being lower). The Camden site, however, seems to be mostly higher than the bucket levels. This could be due to vehicle traffic at Copewood & Davis Streets.
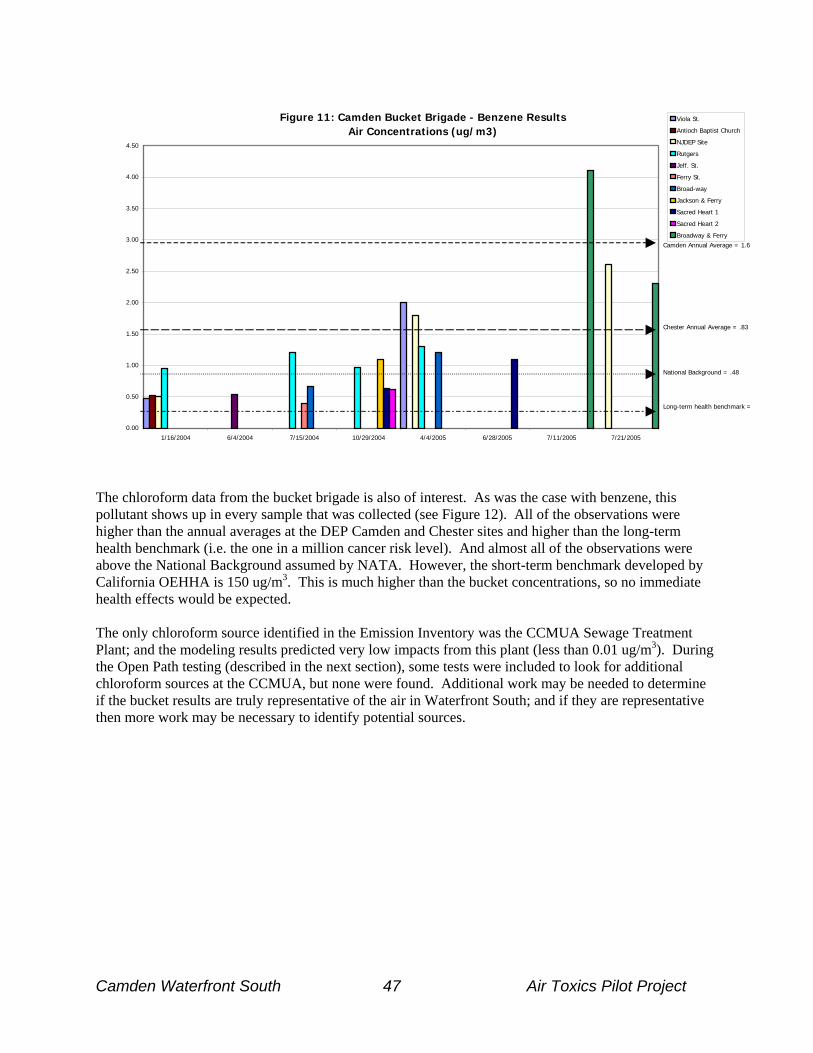
Camden Waterfront South 47 Air Toxics Pilot Project
Figure 11: Camden Bucket Brigade - Benzene ResultsAir Concentrations (ug/m3)
0.00
0.50
1.00
1.50
2.00
2.50
3.00
3.50
4.00
4.50
1/16/2004 6/4/2004 7/15/2004 10/29/2004 4/4/2005 6/28/2005 7/11/2005 7/21/2005
Viola St.
Antioch Baptist Church
NJDEP Site
Rutgers
Jeff. St.
Ferry St.
Broad-way
Jackson & Ferry
Sacred Heart 1
Sacred Heart 2
Broadway & Ferry
Long-term health benchmark =
National Background = .48
Camden Annual Average = 1.6
Chester Annual Average = .83
The chloroform data from the bucket brigade is also of interest. As was the case with benzene, this pollutant shows up in every sample that was collected (see Figure 12). All of the observations were higher than the annual averages at the DEP Camden and Chester sites and higher than the long-term health benchmark (i.e. the one in a million cancer risk level). And almost all of the observations were above the National Background assumed by NATA. However, the short-term benchmark developed by California OEHHA is 150 ug/m3. This is much higher than the bucket concentrations, so no immediate health effects would be expected. The only chloroform source identified in the Emission Inventory was the CCMUA Sewage Treatment Plant; and the modeling results predicted very low impacts from this plant (less than 0.01 ug/m3). During the Open Path testing (described in the next section), some tests were included to look for additional chloroform sources at the CCMUA, but none were found. Additional work may be needed to determine if the bucket results are truly representative of the air in Waterfront South; and if they are representative then more work may be necessary to identify potential sources.

Camden Waterfront South 48 Air Toxics Pilot Project
Figure 12: Camden Bucket Brigade - Chloroform ResultsAir Concentrations (ug/m3)
0.000
0.100
0.200
0.300
0.400
0.500
0.600
0.700
1/ 16/ 2004 6/ 4/ 2004 7/ 15/ 2004 10/ 29/ 2004 4/ 4/ 2005 6/ 28/ 2005 7/ 11/ 2005 7/ 21/ 2005
Viola St.Antioch Baptist ChurchNJDEP SiteRutgersJeff. St.Ferry St.Broad-wayJackson & FerrySacred Heart 1Sacred Heart 2Broadway & Ferry
National Backgr ound = 0.083
Long-ter m Heal th benchmar k = 0.43
Camden & Chester Annual Aver age = 0.01
Conclusions In addition to providing a glimpse at the concentrations of some pollutants in the air in Waterfront South, DEP’s experience with the Bucket Brigade has given us insight into the utility of this type of community-based monitoring. The Bucket Brigade is a good way to get community members involved in evaluating air quality and offers a great deal of temporal and spatial flexibility, with the possibility of sampling on short notice at any location within the neighborhood. In addition, the method appears to provide concentration information which can be useful if carefully analyzed. However, it was found that the samples are prone to some contamination which makes the data analysis more difficult. Odor compounds pose special problems since it is essential that the sample be analyzed within 24-hours, and we were not able to get most of our samples to the lab in that short time frame. (Other Bucket Brigades have reported this same problem.) Finally, it seems that collecting a sample with a bucket is actually a bit more difficult than taking a sample using a stainless steel canister. In future neighborhood projects, we may try using evacuated canisters instead of buckets. 2.4.3 Canister and Open-Path Samples at CCMUA The DEP Division of Science, Research and Technology has overseen a project titled “Air Toxics Measurement within Camden, NJ, and a Demonstration of Emission Rate Determination Using OP-FTIR and Path-Averaged Summa Canisters.” This research project is intended to try out new tools for measuring air toxics impacts from a complex source, while also obtaining improved information concerning the sources of potential air toxic compounds in the Camden Waterfront South area, and to supplement the neighborhood bucket brigade sampling. An important potential source of air toxics emissions in the project area is the Camden County Municipal Utilities Authority (CCMUA), which contains many area sources, such as tanks and sludge handling operations, requiring specialized sampling to determine emissions and impacts.

Camden Waterfront South 49 Air Toxics Pilot Project
This special study had two phases. In the first phase, air samples were collected in Summa canisters at the following locations in order to gather preliminary information about the sources of toxic and odorous pollutants at the CCMUA and the impact that they may have on air quality.
PRELIMINARY SAMPLING LOCATIONS AT CCMUA Background: Western Edge of Facility Background: On the Delaware River Inside Pretreatment Building Primary Settling Tanks: Influent Weir Primary Settling Tanks: Scum Transport Channel Primary Settling Tanks: Effluent Weir Aeration Tank Splitter Chamber Hypochlorite Contact Zone Inside Sludge Storage Building Sludge Truck Weighing Area Septic & Grease Delivery Area
During the preliminary phase, only acetone and toluene were found at somewhat elevated levels outdoors. Higher levels of these compound and methyl ethyl ketone were found indoors. Measurable levels of sulfur compounds were rarely found, even inside buildings. In the second, or follow-up sampling phase, another piece of equipment was used in addition to the Summa canisters. This equipment uses a method called Open Path-Fourier Transform Infrared (OP-FTIR) instrumentation, which has real-time analysis capabilities and can measure pollutants across an open space such as the top of a tank. It works by sending a beam of infrared light to a reflector. The light-beam is then reflected back to the source and the changes in the beam can tell you what pollutants are present and in what quantities. In this phase, more intense sampling was done in fewer locations, as shown below.
FOLLOW-UP SAMPLING LOCATIONS AT CCMUA Background: Western Edge of facility Primary Settling Tanks: Influent Weir Primary Settling Tanks: Effluent Weir Hypochlorite Contact Zone Scum Process Sludge Processing Area South Fenceline: Near Mafco East Fenceline: Community Locations
In this phase of the study some ammonia was found in the air. There were also some very small quantities of potentially odorous compounds such as methylthioformamide. Concentrations of toxic volatile organic compounds continued to be quite low. More work will be needed with this type of equipment before it is ready to be used routinely to monitor the air around complex facilities. However, this method does show promise when combined with Summa canister samples. Also, in the course of the work the project team, which has considerable experience at other sewage treatment plants, was able to point out to CCMUA some areas where odor control strategies might be most effective.

Camden Waterfront South 50 Air Toxics Pilot Project
2.5 STEP 5: RISK REDUCTION STRATEGIES The list of Risk Reduction Strategies was developed in two ways. First, at all Community Advisory Committee meetings, time was set aside for the committee members to suggest reduction strategies that should be considered in light of what was already known about air pollution problems in the neighborhood. The Community Advisory Committee recommended from the outset that strategies to reduce the effect of diesel truck emissions on the neighborhood would be highly desirable. General ideas for enforcement and permitting actions were also recommended. The second step was to convene a subset of the DEP Workgroup, including members from the Department of Health and Senior Services and the Camden County Health Department. This group met after the risk assessment was complete and engaged in a brainstorming session to list possible strategies. They added their ideas to the suggestions made by the Community Advisory Committee, drawing from their understanding of the stationary, mobile and fugitive sources that are contributing to generally high levels of particulate matter in the air in Waterfront South and to levels of toxic pollutants that are a component of that particulate matter. The final list of Risk Reduction Strategies fell into four categories: • Stationary Source Emission Reductions • Truck Emission Reductions • Environmental Health Education • Vegetation for Dust Suppression The overall list of Risk Reduction Strategies developed for the study area can be found in Table 13. Each of these strategies is discussed separately in this section. Where actions have already been taken to explore these strategies or to begin implementing them, those actions are also described. This starter list of strategies includes many actions that might be useful in other urban areas and should be considered in future pilot projects.

Camden Waterfront South 51 Air Toxics Pilot Project
Table 13: Camden Waterfront South Air Toxics Pilot Project Risk Reduction Strategies Starter List
A compilation of ideas for reducing exposure to air toxics and particulate matter in Waterfront South Stationary Source Emission Reductions • Pollution Prevention Plan Review • Permits for New & Modified Sources • Enforcement & Compliance Assistance • Odor Abatement Strategies • Energy Efficiency Projects • Waste Handling Best Management Practices Truck Emission Reductions • Idling Rule Enforcement • Redirect Truck Traffic • Diesel Retrofits • Ultralow Sulfur Diesel Fuel Environmental Health Education • Asthma Outreach • Air Pollution Brochures and Other Materials • Environmental Education Curriculum in the schools Vegetation for Dust Suppression • Tree Planting • Community Gardens
2.5.1 Stationary Source Emission Reductions A wide range of strategies for reducing emissions from stationary sources was identified.
• Pollution Prevention Plan Review • Permits for New & Modified Sources • Enforcement & Compliance Assistance • Odor Abatement Strategies • Energy Efficiency Projects • Waste Handling Best Management Practice
One or more of these may be useful in reducing risks posed by each of the ten facilities that were identified in the modeling and risk assessment steps as contributing to the overall high level of air pollution exposure in Waterfront South. The recommended strategies for these particular facilities are listed in Table 14 and are discussed below in the context of the recommended strategy. For two facilities – Camden Iron & Metal and Colonial Processing – a strategy has not yet been selected.

Camden Waterfront South 52 Air Toxics Pilot Project
Table 14: Facility-specific Risk Reduction Strategies Facility Name DEP PI #a Chemicals of Concern Recommended Strategy
American Minerals 50032 PM10 Enforcement Action and Permitting (New Controls)
Camden Iron & Metal 50023 PM2.5, arsenic, cadmium lead, nickel Undetermined CCMUA 50163 Hydrogen sulfide Compliance Assistance
(Odor Abatement) Colonial Processing 50704 PM2.5 Undetermined GP Gypsum 51611 PM2.5, arsenic, cadmium, nickel Permitting (Public
Hearing, Dust Management Plan & Additional Risk Assessment)
Mafco 50001 PM10 Pollution Prevention Plan Review
Camden County Municipal Waste Combustor
51614 Dioxin Existing Permit Conditions
Plastic Consulting 50405 Lead Enforcement Action and Permitting (New Controls)
St. Lawrence Cement 51588 PM2.5, PM10, manganese Permitting (Reviewing New Application)
State Metals 50539 PM2.5, nickel, dioxin Pollution Prevention Plan Review
aNJDEP facility identification number for Air Pollution Control Permits Pollution Prevention (P2) Plan Review This is the most desirable means for reducing emissions from stationary sources since it reduces the use of toxic substances, is economical (often saving the company money), and can be voluntary (which saves the time of negotiating reductions between a company and the DEP). Facilities that are required to submit to the USEPA a Toxic Release Inventory (TRI) Reporting Form under Section 313 of the federal Emergency Planning and Community Right-to-Know Act of 1986 (EPCRA) are also subject to the New Jersey Pollution Prevention Act (N.J.S.A. 13:1D-35). Each subject facility must prepare three documents: 1) a five year Pollution Prevention Plan; 2) a five year Pollution Prevention Plan Summary; and 3) an annual Pollution Prevention Plan Progress Report. Among other things, the Pollution Prevention Plan identifies each production process and determines the quantities of hazardous substances that each process uses, generates as waste, and releases to the environment. In the Plan facilities set reduction goals and identify techniques for reducing the use and generation of hazardous waste. Only two facilities in the Waterfront South neighborhood were subject to the N.J. Pollution Prevention Act: Mafco and State Metal Industries. The Office of Pollution Prevention and Right to Know conducted site visits at these two facilities to determine compliance with the P2 planning regulations. Site visits included a walk through the facility, a review of their P2 Plan, and discussion of the facility’s use and generation of TRI-listed substances. The focus at Mafco was on their reported releases of polycyclic aromatic compounds (PACs), which are a form of particulate. These releases were based on emission factors for the combustion of oil in their boilers. Mafco has since converted these boilers to natural gas, eliminating the potential PAC emissions, and are no longer subject to the P2 planning regulations. In recent years, State Metal Industries (a secondary aluminum smelter) has reported releases of lead, PCBs, dioxin, and chlorine. Recent stack tests have shown that dioxin emissions are less than the permit

Camden Waterfront South 53 Air Toxics Pilot Project
allowable. (The allowable rate is the one used in the modeling analysis.) It remains unclear how the PCBs are generated during the aluminum smelting process. The modeling analysis did not show any problems with the lead, PCB and chlorine emissions. State Metal Industries’ Pollution Prevention Plan is considered complete; however, no new emission reduction options are contained in the plan. Another component of the P2 planning process involves technical assistance for New Jersey industries. The New Jersey Program for Manufacturing Excellence (NJME), based at Rutgers University in Piscataway, provides no-cost, confidential pollution prevention and energy efficiency assessments. The purpose of this program is to improve the competitiveness and efficiency of New Jersey companies, while reducing the impact on the environment. In July 2003, invitiations were mailed to 33 industries in and near Waterfront South to attend a free morning workshop to describe the Waterfront South Project. At this workshop, presentations were also given by NJME and DEP’s Small Business Assistance Program. Eight of the local businesses attended; there were no referrals to NJME for free assessments at that time, and only two referrals for the Small Business Assistance Program. However, the companies may have contacted NJME on their own since that meeting. Permits for New and Modified Sources When a facility submits an application for a Preconstruction Permit, the impact of air toxic emissions is automatically evaluated by DEP staff using a Risk Screening Worksheet. (The worksheet is available at www.nj.gov/dep/aqpp/airtoxics) This worksheet is generally applied only to the sources covered by the permit application and does not consider other existing sources at the facility or at nearby facilities. As a risk reduction strategy, it was recommended that air permit applications received in Waterfront South be evaluated further, in light of the high particulate levels identified in this pilot project and the toxic components that are in some of the particulate emissions. It was also recommended that new permits for the CCMUA should be reviewed for additional ways to reduce off-site odors. As a first step toward implementing this strategy, the Screening Group in the DEP Bureau of Preconstruction Permits has been advised to report any new applications from anywhere in Camden City to the Bureau of Air Quality Evaluation so that a more comprehensive assessment can be completed if necessary. Since the Facilities of Interest were flagged by the Risk Assessment step of this project in the summer of 2003, three of those facilities have submitted permit applications which were flagged by the Bureau of Preconstruction Permits and subjected to additonal analysis for possible air quality impacts. The review process for each of these three facilities – American Minerals, GP Gypsum (formerly Georgia Pacific), and St. Lawrence Cement – is described below. • American Minerals (PI #50032). In April 2004 an application was received from American Minerals
which was seeking to modify its permit to include the installation of a new baghouse to control emissions from an existing dryer unit and the associated screw conveyor. This proposed change would divert those emissions to the outdoors via a vent and baghouse with 99.5% control efficiency, with a corresponding reduction in particulate emissions. The permit was approved in January, 2005. This permit activity may have been influenced by DEP’s permit enforcement sweep (described below).
• GP Gypsum (PI #51611). The facility applied for a Title V operating permit in 1996. One benefit of
an operating permit is that it consolidates all of the existing permits into one document. In this process several sources were given specific PM10 emissions limits, several permit modifications were made, several new sources were constructed, and new dust collecting devices were added. The facility also agreed to prepare a Dust Management Plan, and to test its raw materials for metal content which will help to re-evaluate the relatively high air toxics impacts of GP Gypsum that were identified in this study. Raw material test results will be available in early 2006.

Camden Waterfront South 54 Air Toxics Pilot Project
• St. Lawrence Cement (PI #50539). In May 2004, an application was received from St. Lawrence
Cement (SLC) seeking permission to off-load raw materials from a new pier being constructed adjacent to their site, to add a new raw material pile, and to enclose a lump crushing operation. The use of the pier would eliminate the need to have hundreds of trucks transport raw materials from the Beckett Street terminal to SLC. As part of this permit review, all dust producing activities at the facility will be modeled. The modeling will also include operation of the new pier, and will be extended to include total suspended particulate (TSP) and PM2.5. Public outreach and enhanced public participation have been added to the review process. An informal public meeting was held in Camden on January 24, 2005.
Enforcement and Compliance Assistance Enforcement is the most obvious method for addressing emissions from facilities that are not complying with their permit limits or which do not have the required permits. Two facilities in this neighborhood were found to be engaged in activities that were not allowed by their permits. These activities were uncovered during the DEP Enforcement Sweep of South Camden which took place on October 3 to 10, 2002. These two facilities - Plastic Consulting and American Minerals – also ended up among the ten facilities of interest identified through the Risk Assesment step of this Pilot Project. Working with the Southern Regional Enforcement Office (SRO), these noncompliance problems have been solved as described below. • Plastic Consulting & Manufacturing Company (PI#50405). During the 2002 Camden enforcement
sweep, Plastic Consulting was found to have installed and operated a sandblasting operation without first obtaining a pre-construction permit. In January 2004 the facility was again cited, for failure to comply with the Notice of Violation, and negotiations began to bring the facility into compliance. The main issue was that Plastic Consulting could not obtain a pre-construction permit from the Department until the sandblasting operation was enclosed. The Company wished to comply but had problems obtaining the proper building permit from the City of Camden. The facility finally received the proper permits from the City and the DEP, and began construction of an enclosure for the sand blasting operation in late 2004. A General Permit was obtained on March 11, 2004 for the abrasive blasting equipment (indoor operation vented to a baghouse with 99% control efficiency). A follow-up inspection was conducted by SRO on April 20, 2005 and it was concluded that the facility was operating in compliance and that they had paid all penalties associated with the illegal sandblasting operation. The equipment is located in a corner of the newly constructed addition and includes a reclamation system that recycles the blasting medium. No visible emissions can be seen during operation.
• American Minerals Company (PI#50032). American Minerals is a manufacturer of powder. In 2002
they installed a sand packaging manufacturing process without obtaining the proper DEP air permit. Then they modified the equipment without authorization. They are now in compliance with DEP requirements.
Compliance Assistance is a means by which DEP may supply technical assistance to businesses to help them comply with regulatory requirements and further protect the environment. The DEP is using this approach to work with CCMUA to develop odor abatement strategies. In response to the odors emitted from the CCMUA (PI#50163), DEP has informally assembled an Odor Abatement Team (OAT). The goal of this group is to use a multi-media, multi-disciplinary approach to identify any possible solutions to the odor problems at this facility. OAT recognizes that the DEP may not be able to implement or require CCMUA to implement the recommendations; however, highlighting them may help to identify innovative odor reduction solutions.

Camden Waterfront South 55 Air Toxics Pilot Project
The Specific Objectives of the OAT are: 1. Confirm which upgrades to the plant occurred in accordance with the “Air Emission and Odor
Control Study” prepared by Camp Dresser & McKee reports in 1998 and 1999 (CDM 1998). 2. Identify which DEP programs are involved with the CCMUA and determine what they are
responsible for (e.g., pending permits). 3. Identify which processes at the CCMUA produce the odors that are impacting the community. 4. Identify any additional controls which could be implemented at the plant and their associated costs. 5. Make recommendations to the CCMUA and DEP programs regarding additional improvements to the
plant. At the same time that the Odor Abatement Team has been studying the odor-causing operations at CCMUA, the Utilities Authority has also undertaken several steps to reduce the impact of odors on the local neighborhood. These steps include: 1. Disabling the back door of the sludge storage building. 2. Installing new belt presses which remove more water from the sludge and reduce the number of
sludge trucks leaving the facility each day. 3. Trucks leaving the facility are directed north to Atlantic Avenue, rather than driving south through
the residential area. 4. The backlog of aged sludge (which was perhaps the most odorous) has been reduced significantly. Since these changes were implemented, the number of formal and informal odor complaints seem to have dropped substantially. The CCMUA has also applied for permission to install sludge drying equipment which will further reduce odors from the sludge handling operation. DEP is presently reviewing the CCMUA application. Other Strategies Other Strategies that might be explored for future projects include Energy Efficiency Projects and improvements to Waste Handling Best Management Practice. Where emissions from industrial boilers are an important contributor to local air pollution levels, energy efficiency and renewable energy projects could make an improvement in local air quality. Initiatives such as using waste heat to generate power, upgrading to newer, more fuel efficient equipment, or switching to innovative fuel cell or solar technology might be worth considering in future neighborhood projects. This neighborhood is also home to countless waste handling operations, many of them processing waste tires, wood pallets, waste paper, or other types of specialized waste. If this type of operation were found to contribute significant quantities of pollution to the air, then the development of Best Management Practices for these waste handling operations might be considered. Currently, these very small waste facilities are only subject to water pollution control rules which protect local water bodies from storm-water runoff. 2.5.2 Truck Emission Reductions Exposure to particulate matter was identified as the most critical risk factor in this community. While emissions from diesel trucks in the neighborhood were not included in the Camden Waterfront South emissions inventory or in the modeling step, these emissions do add to the already high “predicted” concentrations. Therefore, efforts should be made to reduce local emissions from trucks by either reducing the number of trucks or making the local trucks emit less pollution. Reducing Traffic in the Residential Area

Camden Waterfront South 56 Air Toxics Pilot Project
Camden County has approved an inter-local service agreement with the City of Camden to allow the City to assume traffic control over portions of Ferry Avenue (on the west side of Broadway). The City can now prohibit through trucks on that portion of Ferry Avenue, thus reducing truck traffic through at least one residential area in Waterfront South. Other City streets in the Waterfront South neighborhood may also be declared closed to through trucks. Diesel Engine Retrofits DEP is currently working with USEPA on two funding sources, which could finance two retrofit projects in the City of Camden. One is called the First Student Project, which will involve the retrofitting of approximately 40 school buses owned by the First Student Bus Company. The other project will involve retrofitting on and off-road vehicles owned by the Camden County Municipal Utilities Authority. The goal of both projects is to reduce particulate matter emissions from the retrofitted vehicles by at least 30%. The DEP has been working with the state legislature to develop Diesel Risk Reduction Legislation. The bill, which is awaiting the Governor’s signature, sets the framework for a program to reduce particulate emissions from diesel powered mobile sources throughout the state. It includes the installation of tailpipe retrofits, an enhanced anti-idling program, and early introduction of ultra low sulfur diesel fuel. Anti-Idling Efforts DEP’s regulations limit engine idling on all types of on-road motor vehicles to three minutes. However, this regulation is not widely known; and when it is known it is often not observed. Therefore, anti-idling campaigns which educate the motoring public (especially truck drivers) and then enforce the regulation are often necessary. In August 2004, the DEP Enforcement office carried out an extensive campaign to identify illegal idling throughout the state. This effort continues on a random basis through each of our field offices. The Camden County Health Department conducted an anti-idling campaign in Waterfront South, beginning with an outreach effort along Morgan Boulevard in the winter of 2004. As of October 1, 2004, the Camden County Health Department has issued nine idling violations to trucks in Waterfront South. As a result of their activity, idling along Morgan Boulevard has been significantly reduced. Through CEHA, the County is continuing their anti-idling program with 33 days of idling inspections per year. In addition, the South Jersey Port Corporaton is allowing the County to post signs on their public right-of-way advising trucks of the state regulations. The Camden County Health Department is planning to provide and post signs on certain city streets. 2.5.3 Environmental Health Education Environmental health education can be used in the community to reduce exposure to pollutants in the short-term. While emission reductions are being pursued by official agencies, there are some things that residents can do to protect themselves, especially those with asthma or other respiratory illnesses. A handful of Environmental Health Education projects which could help in this area were identified and are described below; two of them already have had some activity. In addition, NJDHSS has received a grant to study the connections between asthma and exposure to HAPs. The results of their work may lead to better advice for those who suffer from asthma. Asthma Outreach and Education Initiative in Camden Waterfront South DEP has been awarded a $50,000 grant from the USEPA for Asthma Outreach and Education in Camden Waterfront South. DEP is partnering with the NJDHSS, the Camden Area Health Education Center (Camden AHEC) and Rutgers-Camden. The goal of this project is to reduce childhood asthma symptoms and improve the quality of life of asthmatic children and their families. This project will:

Camden Waterfront South 57 Air Toxics Pilot Project
• Incorporate educational material about asthma management into an ongoing literacy initiative for residents of Waterfront South; and
• Use community-based Environmental Health Educators, hired from the local community, to teach families how to reduce the prevalence of indoor allergens.
The project’s activities will include workshops, demonstrations, information sessions and in-home assessments and instruction. Schools, childcare facilities and a community-based environmental wellness center will be used as venues for the education of children, parents, and child care providers. The project will focus on four child care centers, two elementary schools and a high school that serve children from Waterfront South. These activities should decrease the onset and exacerbation of asthma symptoms when children are indoors and thereby improve the quality of life for asthmatic children and their families. Air Pollution Brochures and Other Materials There is very little literature written for the general public which specifically addresses air pollution in New Jersey. As discussed in Appendix C, the DEP has taken some preliminary steps to address this gap. The Division of Air Quality has also established an Outreach Workgroup that will continue to develop public materials on air pollution issues in our state. The New Jersey Urban Air Quality Education and Awareness Initiative This is a collaborative project under the sponsonship of the John S. Watson Institute for Public Policy at Thomas Edison State College in Trenton and the New Jersey Environmental Justice Alliance. The project will involve high school students from Camden, Trenton, Newark, and Linden. Its major goals are: • Education and awareness about fine particulate matter • Leadership development and skills training • Environmental Justice issues education • Networking and working collaboratively • Development of written materials, including a workshop training manual In the spring of 2005, students involved in this project measured particulate matter in the air in Camden and Trenton. Linkage of Asthma Morbidity and Hazardous Air Pollutants in New Jersey The New Jersey Department of Health and Senior Services (NJDHSS) has developed and is implementing research protocols in order to: • Examine relationships between New Jersey asthma hospitalization rates and the National-Scale Air
Toxics Assessment (NATA) estimates at the municipal geographic level • Conduct temporal analyses of asthma morbidity and air toxics monitoring site data in four New Jersey
locations (Camden, Chester, Elizabeth and New Brunswick) • Work with communities involved in the project to provide assistance and information related to
project findings. Additional information on this study can be found on our project website at www.nj.gov/dep/ej/airtoxics.html 2.5.4 Vegetation For Dust Suppression The general conclusion of the Risk Assessment was that this neighborhood has high concentrations of particulate matter, some of which contains toxic components such as arsenic and lead. While efforts to reduce particulate matter from stationary sources and mobile sources move slowly forward, short-term reductions could be gained from vegetating vacant lots and planting trees in order to reduce the overall amount of particulate in the air.

Camden Waterfront South 58 Air Toxics Pilot Project
Vacant Lots Although particles of dust from vacant lots may be larger than particles from stationary and mobile sources, they still can aggravate conditions related to exposure. Also, because of the history of known contaminated sites in the neighborhood (about 22 so far), vegetation may reduce the possibility that toxic contaminants will get into the air. Reclaiming vacant lots (accounting for almost half the lots in the neighborhood) by simply planting and maintaining grass is one option that is being explored in a pilot by Heart of Camden. Planting Community Gardens has also been suggested as an option (see below). Heart of Camden Vacant Lot Reclamation Project Heart of Camden plans to begin its second lot reclamation project in August of 2005. The designated site is owned by the City of Camden, and Heart of Camden has received permission to adopt this lot. Heart of Camden will arrange to have the lot cleaned, the soil prepared, and then seeded (in late summer). Next the lot will be fenced to keep vehicles from driving on it and, most importantly, it will be maintained so that the vegetation will remain intact and continue to protect the community. Planting Trees The NJ Tree Foundation has been coordinating the Urban Airshed Reforestation Project (UARP) in the Waterfront South neighborhood. An important component of the UARP is a quantitative study to estimate the effect of planting trees on local air quality. In the summer of 2004 the NJ Tree Foundation hired students to prepare a detailed census of the 100 trees that the UARP has planted in Waterfront South. This information was fed into a model which predicts the amount of pollutants that could be removed from the air by this little urban forest. Initial calculations indicate that these new trees can remove 9 lbs of particulate matter, 7 lbs of ozone, 3 lbs of sulfur dioxide, 4 lbs of nitrogen dioxide, and 1 lb of carbon monoxide each year. As the trees grow, their efficiency will improve. Community Gardens Neighbors adopting a vacant lot for gardening is another method of adding vegetation to the area. This alternative to simply planting grass has the added benefit of providing flowers or produce for the community members who do the gardening. Because of the potential for soil contamination, it is recommended that plots in Waterfront South be planted with flowers and shrubs. No lead agency or partners have been found for this strategy yet. The Camden Children’s Garden may be able to provide technical suppport for the gardeners.

Camden Waterfront South 59 Air Toxics Pilot Project
3.0 RECOMMENDATIONS Recommendations stemming from the work done for the Camden Waterfront South Pilot Project are listed below. Additional suggestions that came from the Community Advisory Committee can be found in Appendix D. Although not all of these Advisory Committee suggestions have been included in the list below, further investigation and discussion could identify additional actions that would be useful in reducing air pollution in Waterfront South, as well as in other parts of the state.
While this project report was being completed, the NJ Environmental Justice Task Force was considering an Environmental Justice petition submitted by residents of Waterfront South. In response to this petition, the Task Force is working with community members and the Environmental Justice Advisory Council to prepare an Environmental Justice Action Plan for Waterfront South. After it is finalized, this Action Plan can be accessed on the DEP EJ website (www.nj.gov/dep/ej). The proposed Action Plan will explore a broad range of environmental concerns and may contain commitments from several DEP programs, including, but not limited to: · Compliance and Enforcement · Air Quality · Site Remediation and Waste Management · Water Quality · Green Acres These proposed commitments to collect information on contaminated sites and coordinate remedial activities in the neighborhood would help to fill an information gap identified in this study. In addition, the efforts to address the nonpoint source water pollution impacts of scrap metal facilities may have the indirect benefit of reducing particulate emissions to the air from scrap handling operations. Recommendations for Follow-Up in Waterfront South 1. MECHANISM FOR FOLLOW-UP
The Department should establish a mechanism to continue the dialogue for follow-up on the Risk Reduction Strategies identified in the Pilot Project. Some combination of the following options should be considered. • Appoint a Joint Environmental Workgroup with members from the Waterfront South
Community, the Environmental Justice Advisory Committee, Camden County Health Department, the City of Camden, and the DEP Waterfront South Workgroup.
• Use the project website to post new information, including monthly update of permit and enforcement activities, and results of the EOHSI personal exposure study.
• Coordinate with the EJ Action Plan Follow-up meetings • Establish a Camden City Environmental Commission that could act as a conduit for
environmental information to the community and as an advocate to the DEP when new environmental issues arise.

Camden Waterfront South 60 Air Toxics Pilot Project
2. REDUCING EMISSIONS FROM STATIONARY SOURCES Both voluntary and regulatory measures should be pursued in order to continue to reduce emissions of air toxics and particulate matter in the Waterfront South neighborhood. • Urge facilities in Waterfront South to request a free N.J. Program for Manufacturing
Excellence audit that could identify ways to reduce emissions, especially from combustion sources, many of which were not quantified in this study.
• The DEP Small Business Assistance Program should provide a workshop to educate businesses on Best Management Practices (BMPs) for minimizing fugitives release from piles of stored material and other operations.
• Require stack testing of units that significantly contribute to high toxic and PM levels in Waterfront South prior to permit renewal.
• New regulations may be necessary to address fugitive dust emissions in urban areas, as well as other parts of the state located close to dusty operations involving grinding, material movement and large storage piles. A new fugitive dust regulation should be developed that mandates dust minimization, including requirements for dust management plans, with provisions for keeping materials moist, and covering or enclosure for certain types of piles.
• Through the State Implementation Plan (SIP) for Particulate Matter, which is currently under development, address local direct emissions of PM2.5 from non-major as well as major facilities.
3. REDUCING EMISSIONS FROM MOBILE SOURCES
Although air quality impacts of mobile sources were not quantified in this study, reducing their emissions will improve the overall air quality in this neighborhood. • Opportunities should be sought for funding projects that will provide retrofit technology for
trucks in Waterfront South in order to reduce particulate emissions. • When emission factors for diesel ships in port are available from the Philadelphia and
Oakland studies, evaluate the impact of this source category on the Waterfront South neighborhood.
• Include port operations around the state in the PM2.5 and ozone SIPs.
4. FOLLOW-UP ANALYSIS The following areas of concern would benefit from follow-up analysis. • Additional study is needed to determine if the Bucket Brigade results (see Section 2.4.2) for
chloroform are truly representative of the air in Waterfront South. If the concentrations continue to be 10 to 20 times above the long-term health benchmark, then more work may be necessary to identify potential sources that may be present in both Camden and Philadelphia.
• Re-run the risk assessment for GP Gypsum after raw material results are available for arsenic, cadmium and nickel.
• Participate in follow-up studies which are being developed in support of the Environmental Mitigation and Landscape Master Plan (EMLMP) to collect more information about the source categories that were not quantified in this study, especially truck traffic, ships in port, scrap handling and vacant lots.
• Periodically re-assess the air quality in Waterfront South to determine if progress has been made or if new problems have developed.
Recommendations for Future Pilot Projects Lessons learned as we worked through the Camden Pilot Project revealed many ways in which the work could be done better. Examples of ways to improve both the efficiency and effectiveness of future pilot projects are listed below.

Camden Waterfront South 61 Air Toxics Pilot Project
1. ORGANIZING RESOURCES
• Hire a student to compile initial existing data relevant to the targeted community and write a baseline report regarding what is known within two months of the start of the project.
• Appoint a liaison to work with the community with the goal of building trust and empowering the community.
• Make use of the Internet as a means to exchange information with residents of the targeted neighborhood, professionals who work in that neighborhood, and other interested parties. The DEP Environmental Justice web page may be an appropriate host for this activity.
2. BUILDING EMISSIONS INVENTORIES
• Continue to experiment with California Emission Factors to fill gaps in the emission inventory, but use them cautiously.
• Engage local industry in the development of a more detailed local emissions inventory.
3. GATHERING MORE & BETTER DATA • During the next rule re-adoption cycle, consider expansion of the universe of facilities that
are required to prepare Pollution Prevention (P2) Plans and submit plan summaries to the DEP. Develop a mechanism to require preparation of P2 plans by facilities in Environmental Justice areas.
• Work with the DEP Site Remediation Program Information Services Element to get access to information regarding location and status of Known Contaminated Sites and the type of contamination at each site.
• Develop a plan for assessing the impact of mobile sources on local air quality, with an emphasis on collecting the information (for example, traffic patterns and emission rates) needed for dispersion modeling.
4. IMPROVING OUTREACH
• Develop materials that explain the Air Permitting Process and opportunity for comment to the public.
5. REMAINING VIGILANT
• Periodically re-assess the air quality in communities where air pollution problems have been identified to determine if progress has been made or if new problems have developed.
Related Studies Two studies that are currently being conducted in Camden will provide further information regarding the exposure of residents to air pollution and the connection to health effects such as asthma. DEP personnel are actively involved in these studies and will be able to use the results to direct further risk reduction activities in Waterfront South. These results may also be useful when community toxic exposure studies are undertaken in other communities. A brief description of these studies can be found on our study website at www.nj.gov/dep/ej/airtoxics.html. They are: “Linkage of Asthma Morbidity and Hazardous Air Pollutants in New Jersey” and “Personal and Ambient Exposures to Air Toxics in Camden, New Jersey”.

Camden Waterfront South 62 Air Toxics Pilot Project
REFERENCES California Air Resources Board (CARB) 2004. California Air Toxics Emission Factor Database (CATEF). www.arb.ca.gov/ei/catef/catef.htm Camp, Dresser & McKee (CDM) 1998. Air Emission and Odor Control Study (for the Camden County Municipal Utilities Authority. November. Cimorelli 2005. Al Cimorelli, USEPA Region 3. Personal Communication January 12, 2005. Cooper, D.A. 2003. Exhaust emissions from ships at berth. Atmospheric Environment 37 (2003) 3817-3830. Dalton, P. 1997. Odor, Annoyance and Health Symptoms in a Residential Community Exposed to Industrial Odors. Technical Report – TFEJ 01. Monell Chemical Senses Center. Haynes A., and Smedley, B.D. 1999. The Unequal Burden of Cancer. National Academy Press, Washington DC. National Academy of Sciences (NAS). 2002. Care Without Coverage: Too Little, Too Late. http://books.nap.edu/catalog/10367.html. NJDHSS. 2001. Childhood Lead Poisoning. NJ Annual Report FY 2001. NJDHSS. 2003a. Asthma in New Jersey. Annual Update 2003 at www.state.nj.us/health/fhs/asthma_2003.pdf. NJDHSS. 2003b. Two letters dated March 18, 2003 and July 29, 2003, sent to Carol Wolff, Chair of the Camden Health Study Task Force and Director of the Camden Area Health Education Center. NJDHSS. 2003c. New Jersey HIV/AIDS Report. Prevalence Rate by County of Persons Living with HIV/AIDS. Reported as of December 31, 2004 at www.state.nj.us/health/aids/repa/aidsdata.shtml Orth-Rodgers Associates, 2000. Letter to Mr. Michael Davis (March 29, 2000). Shiffman, S., et al. 2000. Potential health effects of odor from animal operations, wastewater treatment, and recycling of byproducts. J. of Agromedicine 7(1). U.S. Census Bureau 2000. www.census.gov USEPA 2000. Analysis of Commercial Marine Vessels Emissions and Fuel Consumption Data. EPA420-R-00-0002, February 2000. www.epa.gov/oms/nonrdmdl.htm. USEPA 2003. Framework for Cumulative Risk Assessment. Can be accessed through the worldwide web at http://cfpub.epa.gov/ncea/cfm/recordisplay.cfm?deid=54944 USEPA 2004. AP-42, Compilation of Air Pollutant Emission Factors, 5th Edition, Volume I, Stationary Point and Area Sources. www.epa.gov/ttn/chief/ap42/index.html USEPA 2005. PM2.5 Staff Paper, June 30, 2005

Camden Waterfront South 63 Air Toxics Pilot Project
Vita Nuova 2003, Roadmap to Restoration: South Camden Waterfront Neighborhood. Prepared for Heart of Camden, submitted July 23, 2003.

Camden Waterfront South 64 Air Toxics Pilot Project
APPENDIX A
DISPERSION MODELING In a project such as the Camden Waterfront South Air Toxics Pilot Project, in addition to identifying the particular air toxics from emission inventories, it is essential to quantify the impacts on the community of the toxic emission releases. Using a personal computer-based atmospheric dispersion model is the only method available that gives the necessary spatial coverage. As previously described, the Waterfront South area was surveyed for active sources of air pollution. A total of 52 facilities were found and from these a final number of 26 were established as having significant emissions. These facilities are listed in Table 2 in the text of the report. A total of 37 air toxics plus two forms of particulate matter (PM10 and PM2.5) are emitted from these facilities. A list of the pollutants is shown in Table 4 in the report. Model Selection: Whether a particular model is suitable for a particular application is dependent upon a number of factors including the complexity of the surrounding terrain, the availability of suitable meteorological data, and the accuracy and detail of the emissions inventory. Since this application is concerned with the modeling of urban air toxics there are a number of relevant design criteria that needed to be satisfied. The model should be suitable for urban areas; capable of calculating both short and long-term averages; computationally efficient; capable of source attribution as well as grouping sources; capable of dealing with area, point and volume sources; favorable and demonstrable model to monitor performance; and, finally, the model should be acceptable to USEPA and readily available. The Industrial Source Complex (ISCST3) model is widely available, USEPA-approved and has demonstrated a reasonable ability to reproduce actual concentrations in field tests. It is also notably computationally efficient compared to grid models. The ISCST3 model is a steady-state model that assumes that the pollutant plume will be distributed throughout the lower atmosphere following a Gaussian distribution. This model was selected for assessing the probable concentrations of air toxics across the Waterfront South neighborhood. Averaging Period: The ISCST3 model was run assuming hourly emissions and using hourly meteorological data. The model allows annual averages to be calculated for long-term, chronic exposures and shorter-term averages when acute effects are known or suspected. For each hour of meteorological data, a concentration is calculated at each receptor point. Meteorological Data: The ISCST3 model requires hourly surface observations of wind speed, wind direction, ambient temperature, and stability category, in addition to mixing heights derived from twice daily upper air soundings as meteorological inputs. The U.S. Surface Weather Observations meteorological data from the nearby Philadelphia International Airport (approximately seven miles away) was used for the period 1991-1995. The selection of concurrent upper air stations for deriving mixing heights was dictated by the availability of data. This was resolved by using Atlantic City for 1991-1992 and the Brookhaven, N.Y. National Weather Station for 1993-1995. Model Domain: The study area is locally known as Camden Waterfront South and is defined here as stretching from Atlantic Avenue in the north to Morgan Boulevard in the south, and from the Delaware River in the west to I-676 in the east. The area covered by the study, the location of major highways, and the Delaware River, as well as the location of the Philadelphia Airport are shown in the figure below.

Camden Waterfront South 65 Air Toxics Pilot Project
Receptors: An air quality receptor is any location where ambient concentration estimates are required. They are usually placed in “ambient air,” in other words outside inaccessible plant property. For point and area sources the first ring of receptors is usually placed along the plant fence line. Receptors are then placed in an even grid over the study area. In this study they are located every 50m. For this project a total of 2964 receptors were used to model ambient concentrations across the Waterfront South neighborhood. Predicted concentrations within the facility boundary were not included since this is not considered ambient air. Air quality impacts from adjacent facilities were only predicted along the fenceline even if a pollutant “plume” was clearly predicted over an adjacent facility. Modeling Process: Each of the 39 pollutants was modeled separately. In each model run the necessary stack and emission information was taken from an emissions inventory spreadsheet and input into the ISCST3 model. The maximum predicted concentrations for each pollutant are shown in Table A1 for annual average impacts and Table A2 for shorter term impacts. For each pollutant the facilities that contribute the most to the predicted concentration is also shown.

Camden Waterfront South 66 Air Toxics Pilot Project
Table A1: Dispersion Modeling Results – Long-Term
Pollutant
Maximum Predicted Concentration
(ug/m3)
Largest Contributor to the Maximum Concentration
1 Ammonia 3 Camdett 2 Arsenic 0.011 GP Gypsum 3 Benzene 0.0026 Camden Cogen 4 Beryllium 0.00000041 CCMWC 5 1,3-Butadiene 0.00017 Camden Cogen 6 Cadmium 0.0054 GP Gypsum 7 Carbon disulfide 0.0047 CCMUA 8 Carbon tetrachloride 0.002 CCMUA 9 Chloroform 0.012 CCMUA
10 Chromium (hexavalent) 0.00007 GP Gypsum, CCMWC 11 Cobalt 0.0019 Camden Iron & Metal 12 1,4-Dichlorobenzene 0.00009 CCMUA 13 Dioxin 0.00000003 CCMWC, State Metals 14 Ethylene dichloride 0.002 CCMUA 15 Formaldehyde 0.043 GP Gypsum 16 n-Hexane 0.13 Colonial Processing 17 Hydrogen chloride 0.3 CCMWC 18 Hydrogen cyanide 0.01 Duro 19 Hydrogen sulfide 4.4 CCMUA 20 Lead 0.27 Plastic Consulting 21 Manganese 0.08 St. Lawrence Cement 22 Mercury 0.00053 CCMWC 23 Methylene chloride 0.002 CCMUA 24 Methyl tert-butyl ether (MTBE) 0.00029 CCMUA 25 Naphthalene 0.00057 GP Gypsum 26 Nickel 0.033 GP Gypsum 27 Perchloroethylene 0.002 CCMUA 28 PM2.5 4.3 Colonial Processing 29 PM10 12.8 American Minerals 30 Polycyclic organic matter (POM) 0.00044 CCMWC 31 Propylene 0.0033 Camden Cogen 32 Sulfuric acid 0.079 CCMWC 33 Toluene 1.7 Broadway Finishing 34 Trichloroethylene 0.00029 CCMUA 35 Xylene 42.3 Colonial Processing 36 Zinc 0.016 CCMWC

Camden Waterfront South 67 Air Toxics Pilot Project
Table A2: Dispersion Modeling Results - Short-Term
Pollutant
Maximum Short-Term Predicted Concentration
(ug/m3)
Averaging Time
Largest Contributor to the Maximum Concentration
1 Ammonia 106 1-hr Camdett 2 Arsenic 0.08 4-hr GP Gypsum 3 Benzene 0.06 1-hr Camden Cogen 4 Carbon disulfide 0.06 1-hr CCMUA 5 Carbon tetrachloride 0.02 1-hr CCMUA 6 Chloroform 0.2 1-hr CCMUA 7 Ethylbenzene 0.003 1-hr CCMUA 8 Formaldehyde 0.9 1-hr GP Gypsum 9 Hydrogen chloride 10 1-hr CCMWC 10 Hydrogen cyanide 0.36 1-hr Duro 11 Hydrogen fluoride 0.4 1-hr CCMWC 12 Hydrogen sulfide 107 1-hr CCMUA 13 Lead 1.6 24-hr Plastic Consulting 14 Mercury 0.02 1-hr CCMWC 15 Methylene chloride 0.01 1-hr CCMUA 16 Methyl ethyl ketone 12 1-hr Broadway Finishing 17 Nickel 0.14 1-hr State Metals 18 Perchloroethylene 0.027 1-hr CCMUA 19 PM2.5 36.2 24-hr Colonial Processing 20 PM10 106.5 24-hr American Minerals 21 Sulfuric acid 3 1-hr CCMWC 22 Toluene 24 1-hr Broadway Finishing 23 Xylene 3110 1-hr Colonial Processing

Camden Waterfront South 68 Air Toxics Pilot Project
APPENDIX B
PRELIMINARY RISK ASSESSMENT RESULTS At the beginning of the Pilot Project we did a preliminary risk assessment which compared predicted (modeled) air concentrations of pollutants to their health benchmarks. The results of the preliminary risk assessment, found below, were distributed to the Community Advisory Committee at a meeting on September 30, 2003. Any pollutant predicted to be above the benchmark was flagged for additional study. After our emissions inventory and modeling efforts were refined, as described in earlier sections of this report, a final version of the risk assessment was done. These final results are presented in Section 2.3 of the report. As shown in Table B1 below, of the air toxics that were modeled for the preliminary risk assessment, eight were predicted to be at or above the health benchmark at one or more points in Waterfront South, and 30 were predicted to be below the health benchmark at each of the 2964 modeled points. Table B2 shows just the eight air toxics that were at or above the health benchmark, for either long-term or short-term effects.
Differences Between the Preliminary and Final Risk Assessments Air Toxics
• Cumene was removed from the list of air toxics studied because its risk ratio was extremely small (less than one millionth of the level of concern). It is emitted in small quantities from the CCMUA.
• Beryllium was added to the pollutants modeled after the preliminary risk assessment. It was
inadvertently omitted in the first round. The final risk assessment found it to be below the level of concern.
• Ethylene was included in the preliminary risk assessment based on emissions information
generated using the California Air Toxics Emission Factor Database (CATEF) (CARB 2004). The primary emitter was the CCMUA. This compound is not listed in any of the facilities’ air permits. Specifically for the CCMUA, we could find no evidence that ethylene was being emitted from the facility. Ethylene was evaluated in the preliminary risk assessment as a carcinogen, using a unit risk factor from a 1985 USEPA report (“The Air Toxics Problem in the United States: An Analysis of Cancer Risks for Selected Pollutants,” Office of Air and Radiation, Washington, D.C., EPA-450/1-85-001; Attachment A, Summary Table). This toxicity value is being removed from the DEP Division of Air Quality unit risk factor list because it has not been verified in 20 years, and no new information could be found to support it. It has not been included in any of the USEPA or California toxicity databases. USEPA does not recognize ethylene as a carcinogen, and the International Agency for Research on Cancer (IARC) considers it to be “not classifiable as to carcinogenicity in humans.” For all of these reasons, it was decided to omit ethylene from further consideration in the risk assessment.
• Lead is evaluated for long-term effects in the final risk assessment, in addition to short-term
effects. It has recently been classified by the U.S. Department of Health and Human Services as being “reasonably anticipated” to be a carcinogen.
The seven pollutants found to be above their health benchmarks are exactly the same in the preliminary and final risk assessments (excluding ethylene), although the risk ratios for most of them have changed.

Camden Waterfront South 69 Air Toxics Pilot Project
The changes are because of improvements in the emissions inventory, which incorporated better information became available about the facilities and their emissions as the project progressed. The risk ratios for arsenic, cadmium, lead, and nickel went up. The risk ratio for manganese decreased significantly. Dioxin and hydrogen sulfide risk ratios stayed the same. Particulate Matter Tables B3 and B4 show the preliminary risk assessment results for PM2.5 and PM10. Risk ratios were slightly higher than one for both forms of PM, and for both long-term and short-term effects. The final risk assessment (as summarized in Section 2.3 of the report) found that the risk ratio for annual average concentrations of PM10 dropped below 1, but all other forms and averaging times for PM continued to be of concern.

Camden Waterfront South 70 Air Toxics Pilot Project
Table B1 DRAFT 9/30/2003
Camden Waterfront South Air Toxics Pilot Project Preliminary Modeling and Risk Assessment Results
RISK RATIOS FOR STATIONARY SOURCES OF AIR TOXICS
Long-Term Short-Term
Pollutant
Number of Facilities Modeled
Estimated Annual
Emissions (lb/yr)
Health Endpoint
Modeled Concentration
(µg/m3)
Health Benchmark
(µg/m3)
Risk Ratio
Modeled Concentration
(µg/m3)
Health Benchmark
(µg/m3)
Risk Ratio
1 Ammonia 1 212600 Noncancer 8 100 0.08 145 3200 0.05 2 Arsenic 5 104 Cancer 0.002 0.00023 7 0.01 0.19 0.07 3 Benzene 5 3480 Cancer 0.004 0.13 0.03 0.07 1300 4 1,3-Butadiene 1 218 Cancer 0.0002 0.033 0.01 5 Cadmium 8 128 Cancer 0.0003 0.00024 1 6 Carbon disulfide 1 120 Noncancer 0.005 700 0.00001 0.06 6200 0.00001 7 Carbon tetrachloride 1 30 Cancer 0.001 0.067 0.02 0.02 1900 0.00001 8 Chloroform 1 300 Cancer 0.01 0.043 0.3 0.2 150 0.001 9 Chromium (noncarcinogenic) 12 10700 Noncancer 0.04 0.1 0.4
10 Chromium (carcinogenic) 2 52 Cancer 0.00007 0.000083 0.8 11 Cumene 1 0.6 Noncancer 0.00004 400 0.0000001 12 1,4-Dichlorobenzene 1 2 Cancer 0.00009 0.091 0.001 13 Dioxin 2 0.02 Cancer 0.00000004 0.000000027 1 14 Ethylbenzene 2 35 --- 0.003 1000 0.000003 15 Ethylene 7 7160 Cancer 0.6 0.37 2 16 Ethylene dichloride 1 4 Cancer 0.0002 0.038 0.004 17 Formaldehyde 4 12700 Cancer 0.04 0.077 0.5 8 94 0.09 18 n-Hexane 7 3212 Noncancer 0.1 200 0.0006 19 Hydrogen chloride 2 245000 Noncancer 0.3 20 0.01 10 2100 0.005 20 Hydrogen cyanide 2 7 Noncancer 0.01 3 0.003 0.4 340 0.001 21 Hydrogen fluoride 1 9600 --- 0.4 240 0.002 22 Hydrogen sulfide 1 13255 Noncancer 4 1 4 107 42 3 23 Lead 13 3600 --- 2 0.1 17 24 Manganese 6 1432 Noncancer 0.9 0.05 18 25 Mercury 1 434 Noncancer 0.0005 0.3 0.002 0.02 1.8 0.01 26 Methylene chloride 1 60 Cancer 0.002 2.1 0.0009 0.01 14000 0.000001 27 Methyl ethyl ketone 1 2262 --- 12 1000 0.01 28 Methyl tert-butyl ether 1 0.4 Cancer 0.0003 3.8 0.0001 29 Naphthalene 2 85 Cancer 0.001 0.91 0.001 30 Nickel 13 14296 Cancer 0.02 0.0042 4 31 Perchloroethylene 1 29 Cancer 0.001 0.17 0.01 0.03 20000 0.000001 32 Polycylic organic matter (POM) 1 360 Cancer 0.0004 0.00091 0.5 33 Propylene 2 2820 Noncancer 0.003 3000 0.000001 34 Sulfuric acid 1 90840 Noncancer 0.08 1 0.08 3 120 0.02 35 Toluene 10 15880 Noncancer 2 400 0.004 24 37000 0.0006 36 Trichlorethylene 1 7 Cancer 0.0003 0.5 0.0006 37 Xylene 5 9720 Noncancer 42 100 0.4 2681 22000 0.1 38 Zinc 10 14234 Noncancer 0.02 0.9 0.02
NOTES Modeled concentration: Air concentration of a pollutant that is estimated, or predicted, using a computer-based air dispersion model. Health benchmark: The chemical-specific air concentration below which there should be no significant harm to human health.

Camden Waterfront South 71 Air Toxics Pilot Project
Micrograms per cubic meter (µg/m3): A standard way of measuring the amount of a chemical in the air, or its concentration. It shows how many millionths of a gram (weight) of the chemical there are in a cubic meter of air. Risk ratio: The air concentration divided by the health benchmark. This shows just how much higher the air concentration is than the health benchmark.

Camden Waterfront South 72 Air Toxics Pilot Project
Table B2 DRAFT 9/30/2003
Camden Waterfront South Air Toxics Pilot Project Preliminary Modeling and Risk Assessment Results
POLLUTANTS WITH RISK RATIOS GREATER THAN ONE
Long-Term Short-Term
Pollutant
Number of Facilities Modeled
Estimated Annual
Emissions (lb/yr)
Health Endpoint
Modeled Concentration
(µg/m3)
Health Benchmark
(µg/m3)
Risk Ratio
Modeled Concentration
(µg/m3)
Health Benchmark
(µg/m3)
Risk Ratio
1 Arsenic 5 104 Cancer 0.002 0.00023 7 0.01 0.19 0.07 2 Cadmium 8 128 Cancer 0.0003 0.00024 1 3 Dioxin 2 0.02 Cancer 0.00000004 0.000000027 1 4 Ethylene 7 7160 Cancer 0.6 0.37 2 5 Hydrogen sulfide 1 13255 Noncancer 4 1 4 107 42 3 6 Lead 13 3600 --- 2 0.1 17 7 Manganese 6 1432 Noncancer 0.9 0.05 18 8 Nickel 13 14296 Cancer 0.02 0.0042 4
NOTES Modeled concentration: Air concentration of a pollutant that is estimated, or predicted, using a computer-based air dispersion model. Health benchmark: The chemical-specific air concentration below which there should be no significant harm to human health. Micrograms per cubic meter (µg/m3): A standard way of measuring the amount of a chemical in the air, or its concentration. It shows how many millionths of a gram (weight) of the chemical there are in a cubic meter of air. Risk ratio: The air concentration divided by the health benchmark. This shows just how much higher the air concentration is than the health benchmark.

Camden Waterfront South 73 Air Toxics Pilot Project
Table B3 DRAFT 9/30/2003
Camden Waterfront South Air Toxics Pilot Project Preliminary Modeling and Risk Assessment Results
PM2.5 (Particulate Matter)
Stationary Sources Only
Number of facilities modeled: 12 Annual emissions from all facilities: 65 tons per year
PM2.5
Modeled
Concentration (µg/m3)
Background
Concentration (µg/m3)
Total Air
Concentration (µg/m3)
NAAQS (µg/m3)
Risk Ratio
Long-term 6.8 14.5 21 15 1.4 Short-term 38.1 47.8 86 65 1.3
Modeled concentration: Air concentration of a pollutant that is estimated, or predicted, using a computer-based air dispersion model. In this case, it is the maximum concentration that was predicted by the model anywhere in Waterfront South. Long-term is the highest annual average. Short-term is the highest 24-hour average. Background concentration: The air concentration of a pollutant that is the result of the sources NOT being modeled. In this case, it is the concentration measured at the NJDEP air monitoring station at Copewood and Davis Streets in Camden during 2001. Total air concentration: The modeled air concentration plus the background air concentration of a pollutant. Micrograms per cubic meter (µg/m3): A standard way of measuring the amount of a chemical in the air, or its concentration. It shows how many millionths of a gram (weight) of the chemical there are in a cubic meter of air. NAAQS: The National Ambient Air Quality Standard, set by the federal government. This is the concentration of a specific pollutant in the air which is supposed to be protective of the public health if it is not exceeded. Here it is being used as the health benchmark. Risk ratio: The total air concentration divided by the health benchmark.

Camden Waterfront South 74 Air Toxics Pilot Project
Table B4 DRAFT 9/30/2003
Camden Waterfront South Air Toxics Pilot Project Preliminary Modeling and Risk Assessment Results
PM10 (Particulate Matter)
Stationary Sources Only
Number of facilities modeled: 20 Annual emissions from all facilities: 205 tons per year
PM10
Modeled
Concentration (µg/m3)
Background
Concentration (µg/m3)
Total Air
Concentration (µg/m3)
NAAQS (µg/m3)
Risk Ratio
Long-term 26.8 25.9 53 50 1.05 Short-term 200.9 64 265 150 1.77
Modeled concentration: Air concentration of a pollutant that is estimated, or predicted, using a computer-based air dispersion model. In this case, it is the maximum concentration that was predicted by the model anywhere in Waterfront South. Long-term is the highest annual average. Short-term is the highest 24-hour average. Background concentration: The air concentration of a pollutant that is the result of the sources NOT being modeled. In this case, it is the concentration measured at the NJDEP air monitoring station at Copewood and Davis Streets in Camden during 2001. Total air concentration: The modeled air concentration plus the background air concentration of a pollutant. Micrograms per cubic meter (µg/m3): A standard way of measuring the amount of a chemical in the air, or its concentration. It shows how many millionths of a gram (weight) of the chemical there are in a cubic meter of air. NAAQS: The National Ambient Air Quality Standard, set by the federal government. This is the concentration of a specific pollutant in the air which is supposed to be protective of the public health if it is not exceeded. Here it is being used as the health benchmark. Risk ratio: The total air concentration divided by the health benchmark.

Camden Waterfront South 75 Air Toxics Pilot Project
APPENDIX C
ENVIRONMENTAL HEALTH EDUCATION Environmental health focuses on the prevention and control of environmental exposures and associated adverse health effects. It addresses the effect of environmental sources on human health, including the human impact on the environment and how that influences the health of humans as well as the environment itself. Recognizing the coexistence of humans and the environment, state, federal and community public health organizations must implement comprehensive programs that will reduce the impacts of environmental exposure to urban residents.
Over the last several decades, air pollution has become an environmental and public health problem. The debate over the relationship between air pollution and adverse health effects has existed since the 1950s. Research has proven that air pollution can cause cardiovascular and respiratory diseases, cancer, birth defects, death, and ecological impacts. As a result, the 1970 Clean Air Act established standards to protect U.S. citizens from detrimental effects of unhealthy air quality. Although the adoption of these standards has been protective of public health in many cases, many unhealthful exposures to air pollution still remain. Studies conducted throughout metropolitan cities have consistently found that increased hospitalizations and death rates as a result of respiratory and cardiac arrest correlate to elevated levels of soot or fine particulates.
The significance of this issue has not been overlooked by federal and state agencies. However, the implementation of environmental health education programs and initiatives for air pollution has been marginally successful. One critical missing factor is the development of materials and programs that assist communities in the identification and management of various environmental health conditions. DEP implemented two key activities during the pilot project in an effort to develop tools to address this lack of environmental health education materials and outreach.
(1) DEP developed an air pollution brochure that provides an overview of DEP's program, air quality
index and air pollution health effects. An electronic version is available on the project website at www.nj.gov/ej/airtoxics/html.
(2) Members of the Project Workgroup participated in the Camden County Services Fair at which we
provided attendees with information on air pollution, lead poisoning, mold/moisture, mercury ingestion, air quality and much more.
Committed to the empowerment and promotion of public health, DEP in collaboration with NJDHHS, healthcare providers, community/faith-based organizations will continue to develop an environmental health education program. The environmental health education program should encompass communication strategies that will provide information and tools to the public; support community actions to protect sensitive populations; increase the ability of health care providers to identify, prevent, and reduce environmental health threats to children; and work with state agencies to develop programs to address children's environmental health issues. Appendix C References Clean Air Task Force (2000). Death, disease and dirty power-mortality and health damage due to air
pollution from power plants. Retrieved November 10, 2003 from www.cleartheair.org.

Camden Waterfront South 76 Air Toxics Pilot Project
U.S. Department of Health and Human Services (1998). Environmental Health Policy Committee Risk Communication and Education Subcommittee. An ensemble of definitions of environmental health. Retrieved from: http://web.health.gov/environment/DefinitionsofEnvHealth/ehdef2.htm

Camden Waterfront South 77 Air Toxics Pilot Project
APPENDIX D
ADDITIONAL RISK REDUCTION STRATEGIES FROM THE COMMUNITY ADVISORY COMMITTEE
During the course of the DEP meetings with the Community Advisory Committee, many risk reduction strategies were suggested. Although they are not all included in the main recommendations of this report, further investigations and discussions could prove that some of them may be useful in reducing air pollution in the Waterfront South neighborhood as well as other parts of the state. These suggestions are recorded here for future consideration. The Advisory Committee acknowledged that implementation of some aspects of these recommendations may be beyond the jurisdiction of the DEP. However, they urged DEP to work with appropriate agencies to broaden their jurisdiction. Suggestions raised at Community Advisory Committee meetings for reducing PM levels and which should be incorporated in the risk reduction strategies included:
• Adjusting PM permitted emission levels for certain facilities. • Requiring better emission controls as a condition of permit modification or renewal. • Requiring facilities to enclose or contain its raw materials and products, such as the open slag
piles at SLC, the minerals imported by American Mineral, and various other products shipped through the Port.
• Requesting voluntary stack testing or requiring it upon permit renewal. • Taking more aggressive enforcement action against companies found to violate their permit. • Facilitating voluntary reductions in emissions by companies. • Denying permits to new or expanding facilities which emit PM. • Retrofitting trucks and rerouting truck traffic. • Clean-up of contaminated sites, with priority given to those which pose the most health risk. • Targeted relocation of some residences and businesses to separate incompatible land uses,
creating a protected residential core and buffered industrial areas. • Closing down/relocating polluting businesses to industrial areas outside of Waterfront South and
Camden. • Allocating available funding, including a portion of the state recovery fund, to address
environmental conditions. The CCMUA was frequently discussed at Community Advisory Committee meetings, while strong sewage odors from the facility sometimes permeated the meeting space. Years of resident complaints, litigation, and promised technological upgrades still have not resolved the problem. Residents expressed their frustration at the process required by DEP for lodging and verifying odor complaints. The DEP should develop a simpler process for citing a facility of this type for obvious violations, and stronger enforcement mechanisms to ensure compliance. The Advisory Committee suggests an evaluation of what additional authority DEP needs to address the types of environmental problems faced by Waterfront South community, and they recommend new regulations or legislation be developed that would strengthen DEP’s ability to do aggressive enforcement, ensure prompt clean-up of contaminated sites, reduce impacts of truck traffic, and effectuate other elements of a remediation action plan. Revisions should be made to policies, regulations and environmental laws, as appropriate, that would allow DEP to do the following:
• Conduct an analysis of whether granting permits would result in disparate and adverse impact upon the community, and denying the permit or imposing special permit conditions if necessary to prevent discriminatory impact.

Camden Waterfront South 78 Air Toxics Pilot Project
• Consider the total environmental impact of a facility, including mobile sources. • Impose a time-limited “moratorium” on new or expanding polluting facilities until local
environmental conditions are improved. • Prohibit construction-at-risk in environmentally burdened communities. • Evaluate cumulative and synergistic effects of multiple pollutants and multiple sources of
pollutants. The Advisory Committee noted that one of the significant benefits of the Air Toxics Study is that it provided a vehicle for ongoing communication between concerned residents and DEP staff, and that DEP staff shared information regarding pending permit applications, enforcement actions, and other relevant DEP activities in a timely manner. This process facilitated community awareness and input. However, other than improved access to information on the DEP website, there is no process in place to ensure that the community has a way of remaining informed about new and expanding facilities and other matters of public concern. Additional efforts to make permitting information available to the public are still necessary.