can regional cross-listings accelerate stock market - imf
TRANSCRIPT
WP/08/281
Can Regional Cross-Listings Accelerate Stock Market Development? Empirical
Evidence from Sub-Saharan Africa
Olatundun Janet Adelegan

© 2008 International Monetary Fund WP/08/281 IMF Working Paper Monetary and Capital Markets Department Can Regional Cross-listings Accelerate Stock Market Development? Empirical Evidence
from Sub-Saharan Africa
Prepared by O. Janet Adelegan1
Authorized for distribution by S. Kal Wajid
December 2008
Abstract
This Working Paper should not be reported as representing the views of the IMF. The views expressed in this Working Paper are those of the author(s) and do not necessarily represent those of the IMF or IMF policy. Working Papers describe research in progress by the author(s) and are published to elicit comments and to further debate.
This study analyzes the impact of regional cross-listing of stocks on the depth of the stock markets in sub-Saharan Africa (SSA). It analyzes data from 1990 to 2007 for a panel of 13 stock markets in SSA countries, only some of which have regional cross-listings. Using event study methodology, the paper finds significant positive effects in measures of stock market depth around regional cross-listing events. Overall, growth in the regional cross-listing of stocks facilitates stock market deepening, and the stock markets of countries with regional cross-listings perform better than those without. The study thus suggests that SSA countries can benefit from putting in place the necessary conditions for promoting regional cross-listings and thereby deepening their stock markets. These include sound legal and regulatory frameworks, macroeconomic and political stability, harmonization of listing rules, accounting laws and disclosure requirements across the region, and strong money markets. JEL Classification Numbers: G15, G20, O16, R11
Keywords: regional approach; stock markets; events study; Sub-Saharan Africa
Author’s E-Mail Address: [email protected]
1 I gratefully acknowledge comments received from S. Kal Wajid, Mary Zephirin, Inutu Lukonga, Erik Oppers, Philip Bartholomew, Delisle Worrell, and Jerome Vacher. Other IMF colleagues also provided insightful comments at a seminar held by the IMF’s Monetary and Capital Markets Department to discuss the paper.
2
Contents Page
I. Introduction ............................................................................................................................4
II. Stock Market Development In Sub-Saharan Africa: Trends and Characteristics.................6 A. Overview of Stock Markets in Sub-Saharan Africa..................................................6 B. Regional Financial Integration of Stock Markets in Sub-Saharan Africa.................8
III. Review of Theoretical and Analytical Issues.....................................................................10
IV. Are Stock Markets in Sub-Saharan Africa that are Integrated through Cross-Listings More Successful than those that are not?...........................................................................12
V. Can Regional Cross-Listing Lead Sub-Saharan Africa to the Promised Land of Stock Market Development?........................................................................................................13
A. Methodology and Data............................................................................................13 B. Event Study Results of Changes in Stock Market Development Around Regional Cross-Listing of Stocks............................................................................17
VI. The Impact of Regional Cross-Listings on Stock Market Development...........................19 A. Summary Statistics..................................................................................................19 B. Empirical Results ....................................................................................................22
VII. Conclusions, Recommendations, and Policy Implication ................................................27
References................................................................................................................................39 Tables 1. Capital Market Snapshot; as of end-2007..............................................................................7 2. Sub-Saharan Africa: Bond Markets .......................................................................................7 3. Regional Cross-Listings of Stocks.......................................................................................11 4. Selected sub-Saharan African Countries: Regionally Integrated and Nonregionally
Integrated Capital Market, 1991–2007................................................................................13 5. Event Study of Changes in Capital Market Development Around Regional Cross-Listings
of Stocks ..............................................................................................................................19 6. Summary Statistics for Measures of Growth in Regional Cross-Listing Activities and
Capital Market Development, 1990–2007 ..........................................................................21 7. Regression Results of the Impact of Regional Cross-Listing on Stock Market Development ........................................................................................................................24 8. Generalized Methods of Moments Model Results...............................................................25 Figure 1. West African Economic and Monetary Union: Stock Market Capitalization and Value
Traded Seven Years Around Full Regional Integration, 1995–2001..................................38
3
Appendices I. Statistical Tables...................................................................................................................29 II. Regional Cross-Border Listings ..........................................................................................36 Statistical Appendix Tables 9. GDP of Sub-Saharan African Countries in 2007.................................................................29 10. Overall Savings Investment Balances in Sub-Saharan Africa, 1991–2007.......................30 11. Savings-Investment Balances in Sub-Saharan Africa, 1991–2007....................................31 12. Current Account Balances in Sub-Saharan Africa, 1991–2007.........................................32 13. Number of Regional Cross-listings of Stocks, 1992–2007................................................33 14. Key Capital Market and Cross-Listing Events in Sub-Saharan Africa..............................34 15. Key Capital Market and Cross-Listing Events in Sub-Saharan Africa..............................35
4
I. INTRODUCTION
This paper analyzes the relationship between regional stock market integration through cross-listings of stocks and the deepening of stock markets in sub-Saharan Africa (SSA). The paper first provides a review of the different forms of regional approaches to stock market integration. It then examines the impact of regional cross-listings on stock market liquidity and deepening. Finally, it suggests some policy actions that could accelerate stock market development in SSA. Africa’s 52 countries had a GDP of US$1041.2 billion in 2007.2 Economic and financial reforms undertaken by many African countries in the 1980s and 1990s have fostered higher growth in these countries. The region’s real GDP grew by 5.7 percent in 2007, compared with an average of 5.5 percent for lower middle income countries. The GDP of SSA accounted for about 76 percent of the GDP of Africa in 2007. As part of the reforms, several new stock markets were established and existing ones made major progress. SSA countries have followed the global trend in establishing new stock exchanges. The number of stock exchanges in the region increased from five in 1989 to 22 in 2007. Many SSA countries are now emerging on the global financial stage (Honohan and Beck, 2007). In 2006, average market capitalization as a percentage of GDP was 36 percent (71 percent including South Africa). This was higher than in Eastern Europe (26 percent), or Central America (11.8 percent). The growing importance of stock market development in SSA stems from their greater efficiency. Stock markets play a critical role in mobilizing long-term savings, enhancing capital allocation by pooling and directing savings toward assets with higher rates of return, providing alternative sources of financing to the private and public sectors, and facilitating risk management by offering instruments widely used for collateral and distributing risk among groups of investors. Stock markets also help to channel information about asset prices and returns on investment in assets. The integration of SSA stock markets with international financial markets could potentially help reverse the region’s economic marginalization by attracting foreign capital and improving the business and investment climate and reinforcing other economic reforms (Kenny and Moss, 1998). Although the various SSA stock markets have experienced varying degrees of integration, some continue to maintain partial financial autarky.3 The main forms of stock market integration are: (i) internationalization or global integration through free foreign direct investment and portfolio
2 Africa’s real GDP grew by an average growth rate of 3.6 percent between 1992 and 2007.
3 Financial autarky is a state of financial isolation or separation of markets, in which markets operate essentially in parallel, without any interrelationship. Many capital markets in SSA operate along the continuum from financial autarky to a single market (merger).
5
capital flows,4 and (ii) regional integration in the form of a full merger5 and cross-listing of stocks.6 Regional cross-listing of stocks can bring significant benefits. Through such cross-listings, the stock markets—of both primary and secondary listings—can help finance SSA corporate and development needs, provide wealth diversification, bring greater efficiency, lower the cost of capital, increase market access for small stock markets, and potentially help mitigate the effects of foreign investment outflows in shallow markets. On the other hand, with global integration, foreign investors are increasingly interested in SSA’s stock markets which have the potential to destabilize the shallow markets. Therefore, the internationalization and globalization of stock markets, and instantaneous mobility of capital across borders can exacerbate volatility and lead to financial sector instability in the event of a sudden and unexpected deterioration in economic conditions.7 This study seeks to provide the answers to the following questions:
• Can a regional approach promote stock market development?
• Can regional cross-listing improve liquidity and facilitate stock market deepening?
• Are regionally integrated stock markets more successful than nonregionally integrated stock markets in SSA?
The remainder of this paper is divided into five parts. Section II presents emerging trends and developments in stock markets in SSA. Section III presents a review of relevant literature. Sections IV presents a comparative analysis of the indices of stock market development for regional and national stock markets in SSA. Sections V and VI present the methodology and empirical analysis of the impact of growth in regional cross-listings on stock market development. This is followed in Section VII by a discussion of policy recommendations and conclusions.
4 For instance, Mauritius attracts a lot of foreign portfolio capital flow, but maintains a state of financial autarky with respect to regional capital markets.
5 An example of a full merger is the Bourse Regionale des Valeurs Mobilieres (BRVM), which was established by the eight West African Economic and Monetary Union (WAEMU) countries and began operations in September 1998.
6 Regional cross-listings of stock can be found in South Africa, Botswana, Namibia, Nigeria, Ghana, Kenya, Tanzania, Uganda, and Zambia.
7 Typical examples are the Mexican crisis of 1995 and the Asian crisis of 1997.
6
II. STOCK MARKET DEVELOPMENT IN SUB-SAHARAN AFRICA: TRENDS AND CHARACTERISTICS
A. Overview of Stock and Bond Markets in Sub-Saharan Africa
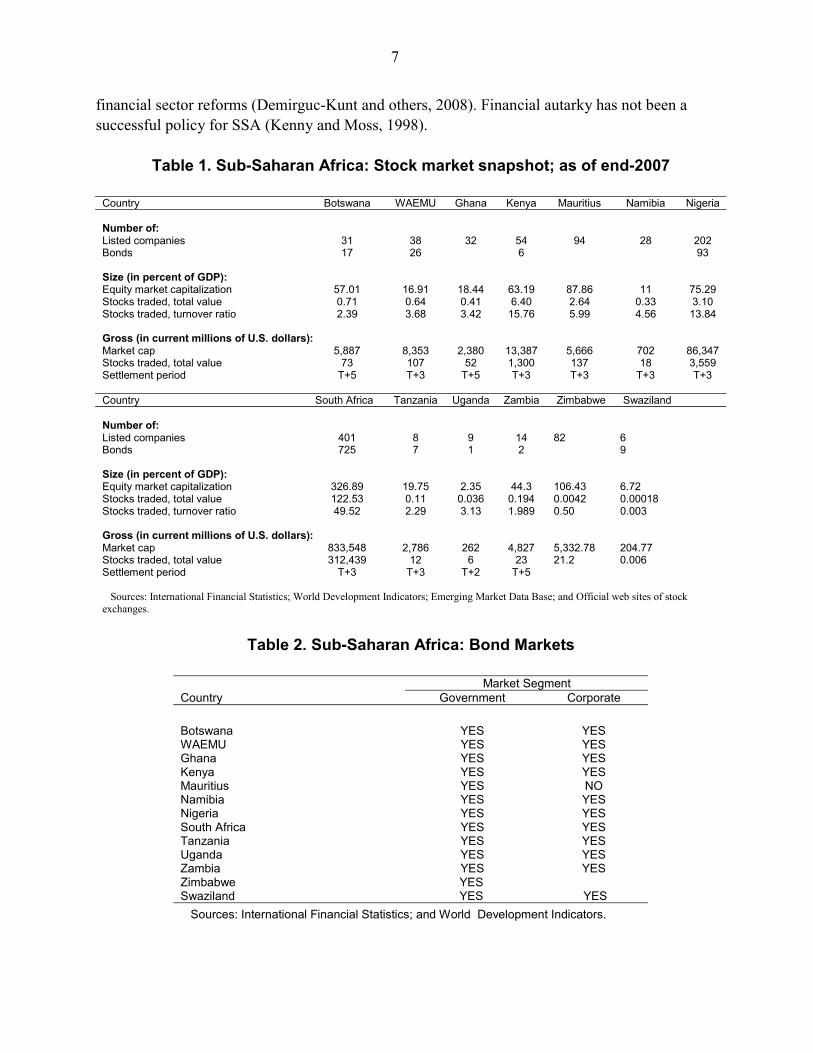
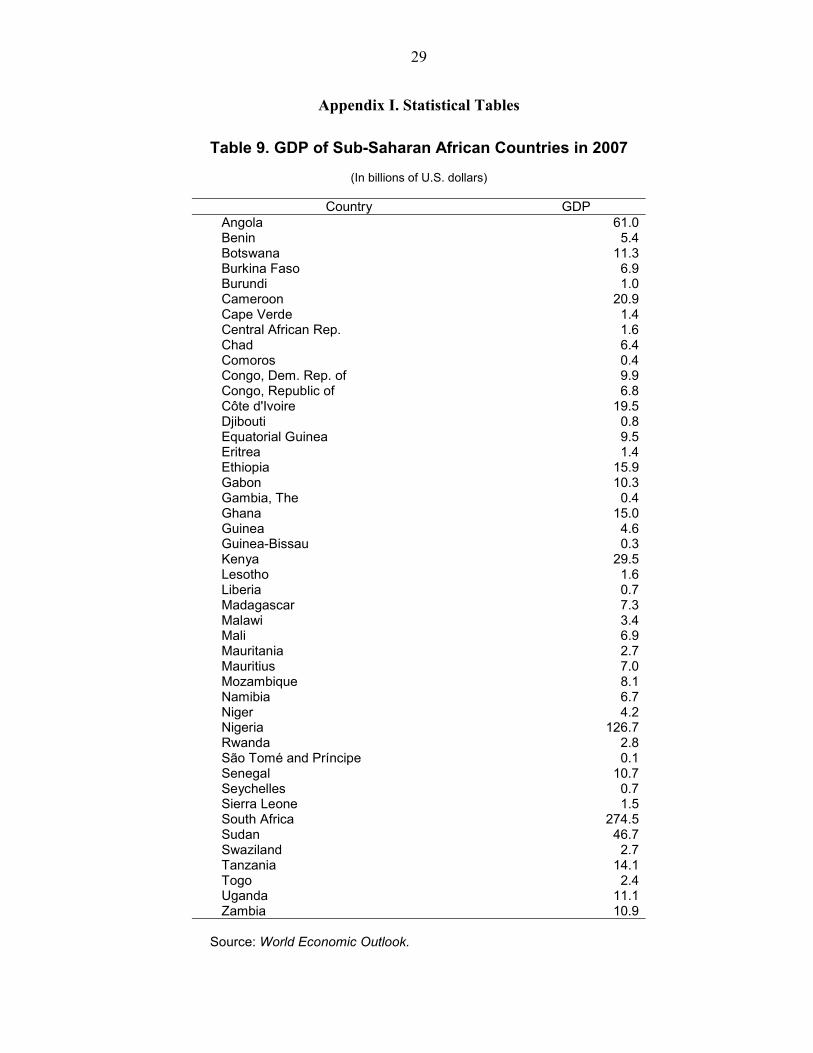
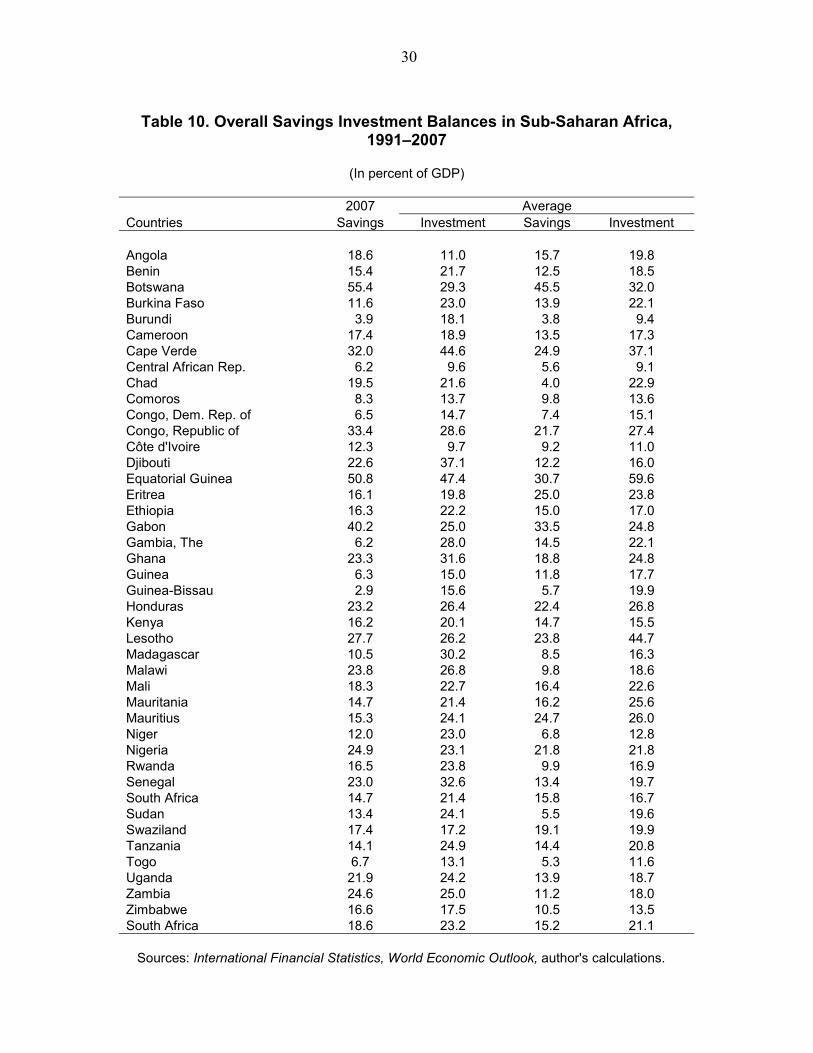
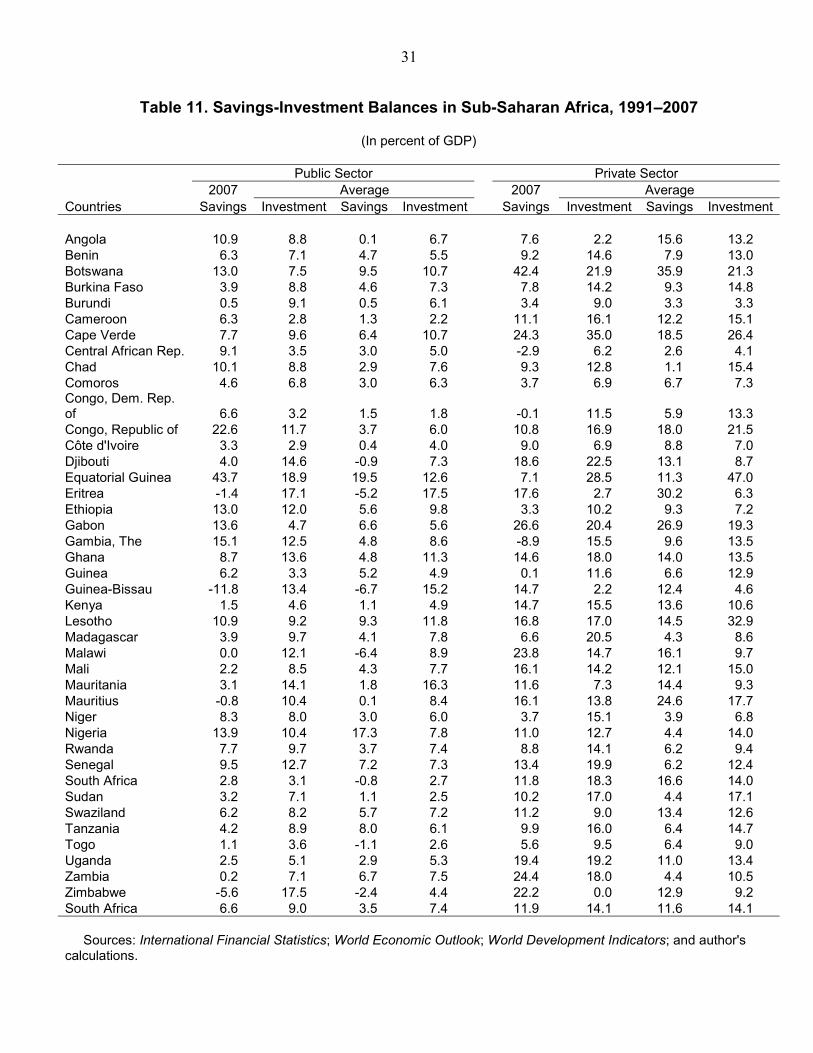
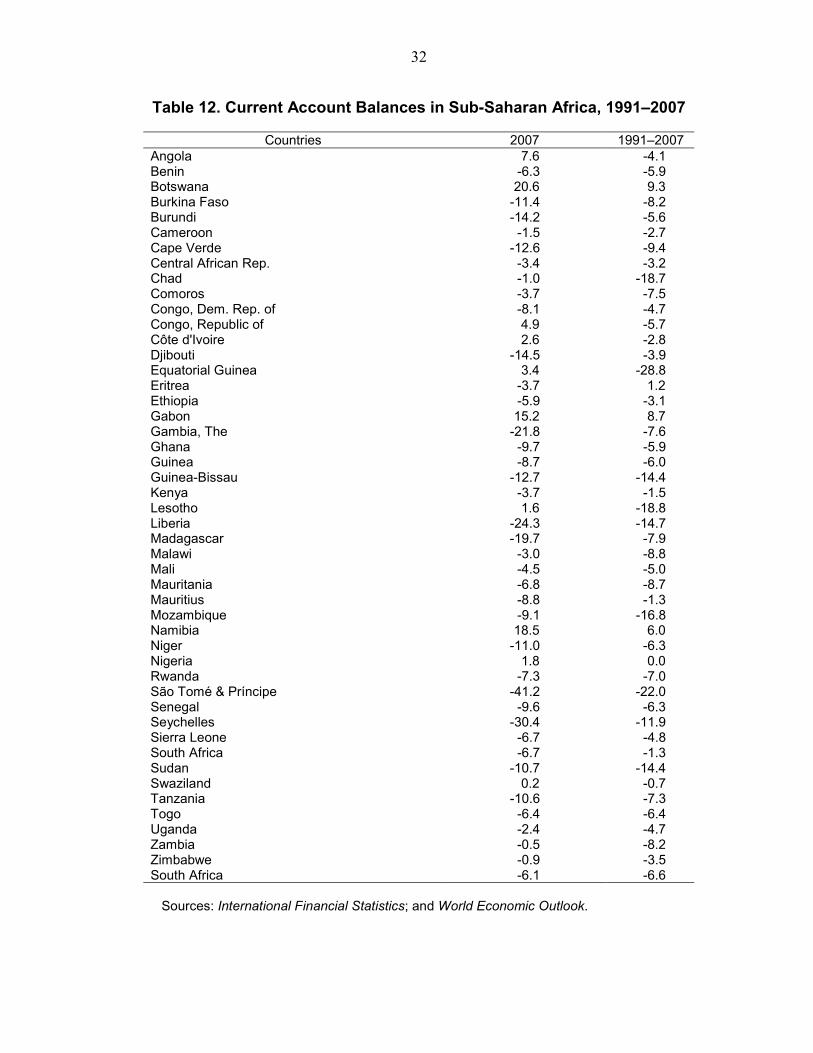
The pace and stage of stock market development have varied among SSA countries. Only four stock markets have more than 50 listed stocks; five have at least 20 listed stocks; and the remaining 14 have less than 20 stocks. Table 1 presents a snapshot of selected stock markets in SSA as of end-2007. The number of listed firms ranges from as low as 6 for the stock market of Swaziland to as high as 401 for South Africa. Market capitalization accounts for less than 20 percent of the GDP of about half of the countries in the sample. Almost all the countries in the sample have issued both government and corporate bonds (Table 2).8 All the countries have a basic legal and regulatory framework for the stock markets. With the exception of the Johannesburg Stock Exchange (JSE) of South Africa, there are no derivatives and asset-backed securitization in SSA stock markets. A key constraint for SSA countries is the low savings rates which limits intermediation through the stock market development. On average, 96 percent of SSA (44 out of 46 countries) had a negative savings-investment gap between 1991 and 2007.9 Only the resource rich countries—Angola, Botswana, Republic of Congo, Gabon, Lesotho, and Nigeria—experienced positive savings-investment balances in 2007 (Appendix Tables 9 to 11). Foreign savings is thus an important source of development finance for SSA countries. Thus SSA countries run current account deficits as they expand domestic investment beyond the resources available from domestic savers through reliance on foreign savings. Typically the savings shortfall pertain to both public and private sectors. The public sector shortfall tends to crowd out investment in the private sector by limiting the flow of private savings available for domestic intermediation. Thus very low domestic savings is a major constraint on capital market development in SSA countries. Stock market development can make an important contribution to economic growth through improved access for firms. In some African countries, equity finance is a significant source of finance for quoted firms. Equity financed accounted for 39 percent of total asset growth of listed companies in South Africa between 1996 and 2000 (Glen and Sigh, 2003), 12 percent in Ghana between 1995–2002, 25 percent in Zimbabwe between 1990—99 (Yartey and Adjasi, 2007), and about 40 percent in Nigeria between 1990 and 2000. Development economists accordingly emphasize that broader access to financial services should be a central development agenda of
8 With the exception of Mauritius that has no corporate bonds.
9 With the exception of Botswana and Gabon.
7
financial sector reforms (Demirguc-Kunt and others, 2008). Financial autarky has not been a successful policy for SSA (Kenny and Moss, 1998).
Table 1. Sub-Saharan Africa: Stock market snapshot; as of end-2007
Country Botswana WAEMU Ghana Kenya Mauritius Namibia Nigeria Number of: Listed companies 31 38 32 54 94 28 202 Bonds 17 26 6 93 Size (in percent of GDP): Equity market capitalization 57.01 16.91 18.44 63.19 87.86 11 75.29 Stocks traded, total value 0.71 0.64 0.41 6.40 2.64 0.33 3.10 Stocks traded, turnover ratio 2.39 3.68 3.42 15.76 5.99 4.56 13.84 Gross (in current millions of U.S. dollars): Market cap 5,887 8,353 2,380 13,387 5,666 702 86,347 Stocks traded, total value 73 107 52 1,300 137 18 3,559 Settlement period T+5 T+3 T+5 T+3 T+3 T+3 T+3 Country South Africa Tanzania Uganda Zambia Zimbabwe Swaziland Number of: Listed companies 401 8 9 14 82 6 Bonds 725 7 1 2 9 Size (in percent of GDP): Equity market capitalization 326.89 19.75 2.35 44.3 106.43 6.72 Stocks traded, total value 122.53 0.11 0.036 0.194 0.0042 0.00018 Stocks traded, turnover ratio 49.52 2.29 3.13 1.989 0.50 0.003 Gross (in current millions of U.S. dollars): Market cap 833,548 2,786 262 4,827 5,332.78 204.77 Stocks traded, total value 312,439 12 6 23 21.2 0.006 Settlement period T+3 T+3 T+2 T+5 Sources: International Financial Statistics; World Development Indicators; Emerging Market Data Base; and Official web sites of stock exchanges.
Table 2. Sub-Saharan Africa: Bond Markets
Market Segment Country Government Corporate Botswana YES YES WAEMU YES YES Ghana YES YES Kenya YES YES Mauritius YES NO Namibia YES YES Nigeria YES YES South Africa YES YES Tanzania YES YES Uganda YES YES Zambia YES YES Zimbabwe Swaziland
YES YES YES
Sources: International Financial Statistics; and World Development Indicators.
8
B. Regional Financial Integration of Stock Markets in Sub-Saharan Africa
Regional integration can be full or partial. Full integration will entail a single market—possibly achieved through merger of existing individual markets—with uniform rules, equal access, equal treatment, and a common trading platform and clearing and settlement process. Partial integration may be in the form of cross-listing of stocks, interoperability, alliances, and joint ventures. Full integration has a number of merits and demerits. Such integration can bring about efficiency in allocation of resources, lower inter-market barriers and operating costs, the formation of larger and more liquid markets, more diversified and better risk sharing, innovation, economies of scale and scope, market access, competition, and completeness (Tobin, 1984; Faruque, 2007). Among the demerits of full regional integration are that it brings with it contagion and spillover risks in addition to typical financial risk (liquidity risk, credit risk, market, and operational risks). With a single market and close financial links, any unfavorable event in any market or country will affect the other markets or countries. Difficulties in consolidating trading and post-trading infrastructures, legal differences, and standardization barriers are additional impediments to full integration of stock markets. Like the full regional integration, partial integration brings efficiency in resource allocation, improved liquidity, portfolio diversification, better risk sharing, and stock market development. It is also likely to entail lower financial contagion and spillover risk. While interoperability, alliances, and joint ventures involve integration of market infrastructures and processes, which are cumbersome and difficult to achieve, cross-listing of stocks does not involve such integration of market infrastructures or trading practices. Thus, regional integration through regional cross-listing, thus, facilitates cross-border equity investment by firms and operations between stock exchanges under existing market arrangements. Regional integration has been proposed in the literature as a solution to stock market development in smaller emerging countries (Demirguic-Kunt and others, 2008, Tahari, 2007, Shah, and others, 2008). Proponents of this approach have argued that regional integration, including a common trading platform, can bring greater efficiency, synergies, and economies of scale; attract foreign flow of funds; foster risk sharing and portfolio diversification; act as an impetus to financial sector reforms, thereby broadening the competitiveness of regional financial systems and minimizing the risks of financial instability; deepen the stock market; and lead to economic growth (Faruqee, 2007;10 Demirguic-Kunt and others, 2008). 10 Europe has experienced many approaches to integration, including interoperability, alliances, mergers, joint ventures, horizontal and vertical approaches. A certain level of success has been recorded, although the multiplicity of the European system has continuously created barriers to efficient cross-border trading, clearing and settlement.
9
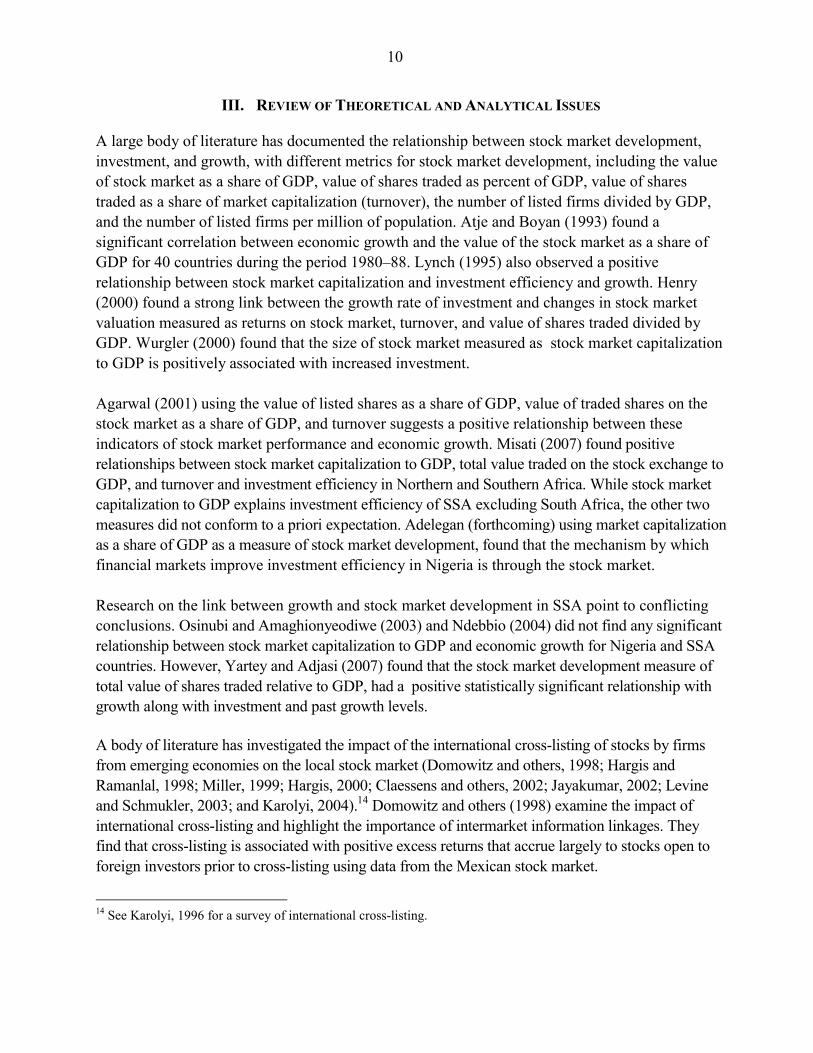
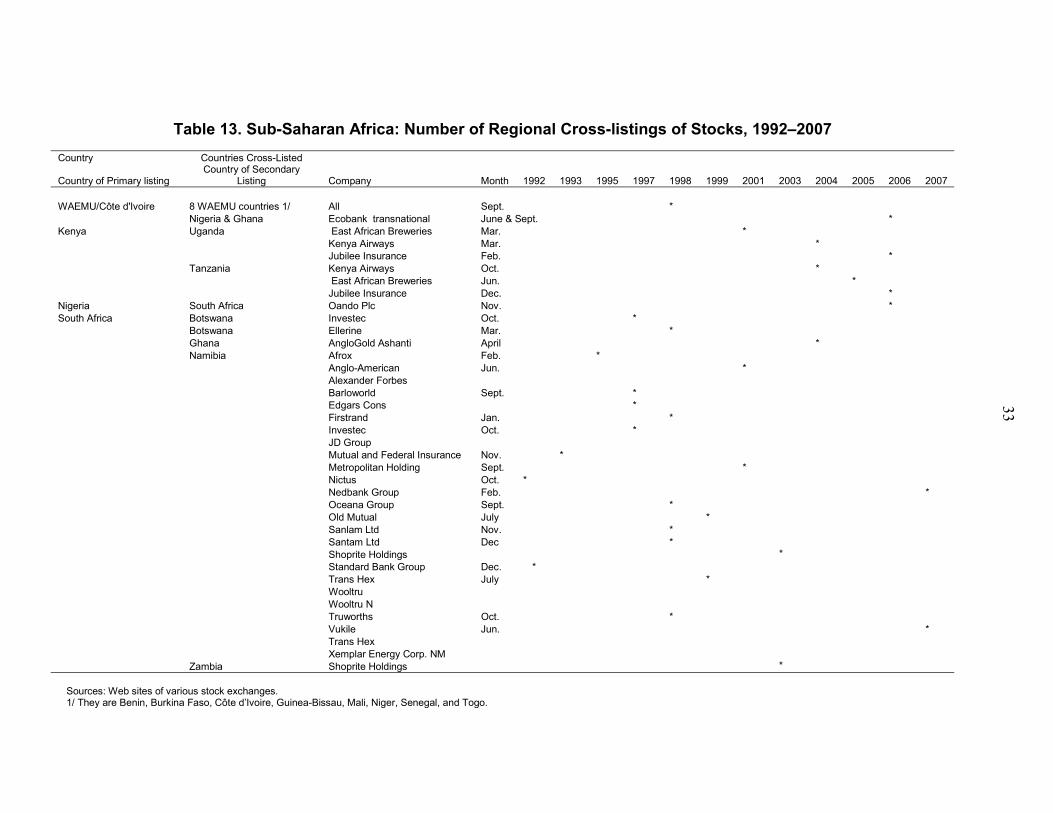
However, merging local stock markets or establishing a common platform for trading in African stock is difficult to attain because of the associated institutional and financial complexities and cultural and national prestige considerations. African governments view stock exchanges as national assets with pride, and are unlikely to embrace any policy that will limit the national profile (Yartey and Adjasi, 2007; Moss, 2003). Fear of bigger economies dominating the exchange and diverting capital toward their economies is also a key constraint against acceptance of regional integration by smaller economies (Okeahalam, 2001; Yartey and Adjasi, 2007). The only fully integrated regional stock market in SSA—the Bourse Régionale des Valeurs Mobilières (BRVM) established by the eight WAEMU countries11 in September 1998, in Côte d’Ivoire—failed to produce the desired result. Activity in the stock market declined substantially after the crisis in Côte d’Ivoire in 1999 because most of the listed firms are Ivorian (see Figure 1). Activity at the BRVM is now concentrated in the bond market. After about a decade of trading, the market is still underdeveloped compared with other stock exchanges in SSA (see Table 1), with the low level of development due to low trading value and volume and stringent listing requirements. The market capitalization was 16.91 percent of GDP in 2007, while liquidity or turnover measured as the value of shares traded was 0.64 percent of GDP.12 Partial integration has been undertaken by SSA stock markets in the form of cross-border listing of stocks with resulting financial flows (Table 3). The JSE Securities Exchange of South Africa has signed a memorandum of understanding (MOU) with Botswana, Egypt, Ghana, Kenya, Namibia, Nigeria, and Uganda. Nigeria has signed an MOU with Ghana and WAEMU, while the Nairobi Stock Exchange of Kenya has signed MOUs with Ghana, Nigeria, Tanzania, Uganda, and WAEMU. There has been regional cross-listing between stock markets in (i) Namibia and South Africa since 1992; (ii) Botswana and South Africa since 1997; (iii) Nigeria and South Africa first in 200113 and later in 2006; (iv) Zambia and South Africa in 2003; and (v) Ghana and South Africa in 2004. Triple listing of stocks has also commenced, with the three East African Exchanges of Kenya, Uganda, and Tanzania in 2004 and Ghana, Nigeria, and the BRVM (WAEMU) exchanges in 2006. The first regional cross-listing was made by South Africa on the Namibia Stock Exchange (NSX), coinciding with the first day of trading of the NSX in October 1992. Since then, South Africa has cross-listed 25 companies on the NSX, two of which are also listed on the Botswana Stock Exchange (BSE), one listed on the Lusaka Stock Exchange (LUSE) in Zambia, and one listed on the Ghana Stock Exchange (GSE) (see Appendix Table 12). 11 They are Benin, Burkina Faso, Côte d’Ivoire, Guinea-Bissau, Mali, Niger, Senegal, and Togo.
12 Market capitalization and liquidity as a share of GDP of WAEMU/BVRM jumped from 14.5 percent and 0.19 percent respectively in 2005 to 23.77 percent and 0.64 percent respectively in 2006. This is largely because of the triple listing of stocks of Ecobank Transnational Incorporated (ETI) on the BVRM, Ghana and Nigeria in 2006.
13 MNET/Super Sport, a JSE primary listed company was cross-listed on the Nigerian Stock Exchange in 2001 and delisted in 2005.
10
III. REVIEW OF THEORETICAL AND ANALYTICAL ISSUES
A large body of literature has documented the relationship between stock market development, investment, and growth, with different metrics for stock market development, including the value of stock market as a share of GDP, value of shares traded as percent of GDP, value of shares traded as a share of market capitalization (turnover), the number of listed firms divided by GDP, and the number of listed firms per million of population. Atje and Boyan (1993) found a significant correlation between economic growth and the value of the stock market as a share of GDP for 40 countries during the period 1980–88. Lynch (1995) also observed a positive relationship between stock market capitalization and investment efficiency and growth. Henry (2000) found a strong link between the growth rate of investment and changes in stock market valuation measured as returns on stock market, turnover, and value of shares traded divided by GDP. Wurgler (2000) found that the size of stock market measured as stock market capitalization to GDP is positively associated with increased investment. Agarwal (2001) using the value of listed shares as a share of GDP, value of traded shares on the stock market as a share of GDP, and turnover suggests a positive relationship between these indicators of stock market performance and economic growth. Misati (2007) found positive relationships between stock market capitalization to GDP, total value traded on the stock exchange to GDP, and turnover and investment efficiency in Northern and Southern Africa. While stock market capitalization to GDP explains investment efficiency of SSA excluding South Africa, the other two measures did not conform to a priori expectation. Adelegan (forthcoming) using market capitalization as a share of GDP as a measure of stock market development, found that the mechanism by which financial markets improve investment efficiency in Nigeria is through the stock market. Research on the link between growth and stock market development in SSA point to conflicting conclusions. Osinubi and Amaghionyeodiwe (2003) and Ndebbio (2004) did not find any significant relationship between stock market capitalization to GDP and economic growth for Nigeria and SSA countries. However, Yartey and Adjasi (2007) found that the stock market development measure of total value of shares traded relative to GDP, had a positive statistically significant relationship with growth along with investment and past growth levels. A body of literature has investigated the impact of the international cross-listing of stocks by firms from emerging economies on the local stock market (Domowitz and others, 1998; Hargis and Ramanlal, 1998; Miller, 1999; Hargis, 2000; Claessens and others, 2002; Jayakumar, 2002; Levine and Schmukler, 2003; and Karolyi, 2004).14 Domowitz and others (1998) examine the impact of international cross-listing and highlight the importance of intermarket information linkages. They find that cross-listing is associated with positive excess returns that accrue largely to stocks open to foreign investors prior to cross-listing using data from the Mexican stock market.
14 See Karolyi, 1996 for a survey of international cross-listing.
11
Table 3. Sub-Saharan Africa: Regional Cross-Listings of Stocks
Country Countries with Regional Cross-Listed Stocks
Year of First Cross-Listing Cross-Listed Number of Total
Botswana South Africa and Namibia 1997 YES 2 2 WAEMU Nigeria and Ghana 2006 YES 1 1 Ghana Nigeria and WAEMU 2006 YES 1 1 Kenya Tanzania and Uganda 2001 YES 3 3 Mauritius NO Namibia South Africa and Botswana 1992 YES 25 25 Nigeria Ghana and WAEMU 2006 YES 1 South Africa 2006 YES 1 2 South Africa Namibia 1992 YES 25 Botswana 1/ 1997 YES 2 Ghana 2/ 2004 YES 1 Nigeria 3/ 2001/2006 YES 1
Zambia 4/
2003
YES
1 27
Tanzania 2004 YES 3 3 Uganda 2001 YES 3 3 Zambia South Africa 2003 YES 1 1 Zimbabwe NO Sources: Web sites of various stock exchanges. 1/ The JSE companies cross-listed on the BSE are also cross-listed on NSX 2/ AngloGold Ashanti was formed on April 26, 2004 following the merger of AngloGold of South Africa and Ashanti Gold Fields of Ghana that were previously independently listed on the JSE and the GSE respectively. 3/ MNET/Super Sport, a JSE primary listed company was cross-listed on the Nigerian Stock Exchange in 2001 and delisted in 2005. 4/ The JSE company cross-listed on the LUSE (shoprite) is also cross-listed on the NSX.
Miller (1999) notes abnormal returns around the announcement date of American Depository Receipts (ADR) and also finds that market reaction is related to choice of exchange, geographical location, and avenue for raising equity capital. Karolyi (2004) observes that the growth and expansion of U.S. cross-listings by firms from emerging markets facilitated the expansion of cross-border capital equity flows and overall stock market development during the 1990s. Previous studies have concentrated on international cross-listing, especially ADR, but none of them have examined the impact of regional cross-listing on stock market development. This study seeks to fill the gap. It focuses on analyzing the impact of regional cross-listings on stock market development on a panel of 20 SSA countries.

12
IV. ARE STOCK MARKETS IN SUB-SAHARAN AFRICA THAT ARE INTEGRATED THROUGH CROSS-LISTINGS MORE SUCCESSFUL THAN THOSE THAT ARE NOT ?
To address the question of whether stock markets in SSA that are integrated through cross-listings are more successful than those that are not, this study split the countries into three groups: (i) those where there is no regional cross-listing; (ii) those that have cross-listed stocks regionally; and (iii) those that have cross-listed stocks regionally excluding South Africa. Countries with regional cross-listed stocks are Botswana, Côte d’Ivoire/WAEMU, Ghana, Kenya, Namibia, Nigeria, South Africa, Tanzania, Uganda, and Zambia. Countries without regional cross-listing are Mauritius and Swaziland.
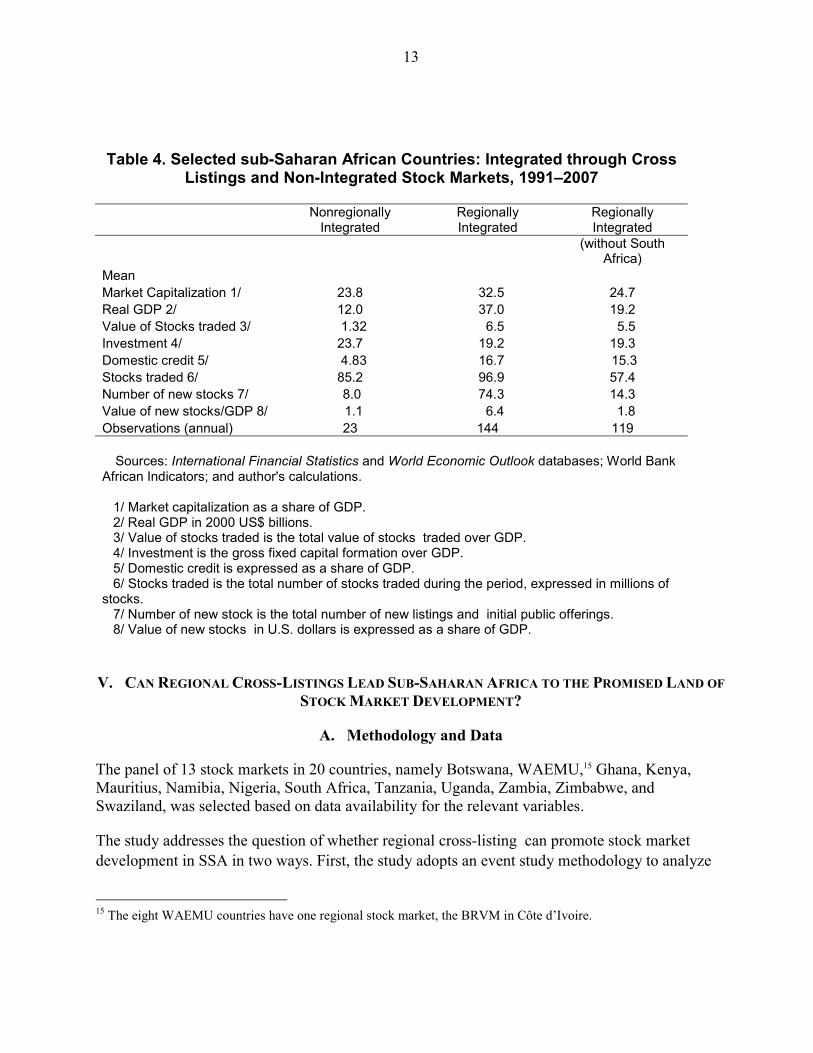
Table 4 presents the descriptive statistics of stock market and macroeconomic measures for the three groups in the sample. Market capitalization is higher for the with-cross-listings group (32.5 percent) than for that without cross-listing (23.8 percent). The value of stock traded and domestic credits as a share of GDP are 6.5 percent and 16.7 percent, respectively, for the group with cross-listings. The value of stocks traded for the group with regional cross-listings is about five times the average for the group without regional cross-listings (1.32 percent).
Domestic credit is more than three times higher for the group with regional cross-listings than for those without cross-listing group. Real GDP in SSA is on the average three times higher for the former group (US$37 billion) than for the latter. Splitting the sample also reveals that, on average, investment is higher for the group without cross-listing than for the group with regional cross-listings. The volume of stock traded, and the number and value of new stocks are higher for the group with cross-listing than for the without cross-listing group. After excluding South Africa from the group with cross listings, most of the stock market and macroeconomic measures are still higher than those of the group without regional cross-listings. Overall, stock markets in the former group perform better than in the latter group.
13
Table 4. Selected sub-Saharan African Countries: Integrated through Cross
Listings and Non-Integrated Stock Markets, 1991–2007
Nonregionally
Integrated Regionally Integrated
Regionally Integrated
(without South
Africa) Mean Market Capitalization 1/ 23.8 32.5 24.7 Real GDP 2/ 12.0 37.0 19.2 Value of Stocks traded 3/ 1.32 6.5 5.5 Investment 4/ 23.7 19.2 19.3 Domestic credit 5/ 4.83 16.7 15.3 Stocks traded 6/ 85.2 96.9 57.4 Number of new stocks 7/ 8.0 74.3 14.3 Value of new stocks/GDP 8/ 1.1 6.4 1.8 Observations (annual) 23 144 119
Sources: International Financial Statistics and World Economic Outlook databases; World Bank African Indicators; and author's calculations. 1/ Market capitalization as a share of GDP. 2/ Real GDP in 2000 US$ billions. 3/ Value of stocks traded is the total value of stocks traded over GDP. 4/ Investment is the gross fixed capital formation over GDP. 5/ Domestic credit is expressed as a share of GDP. 6/ Stocks traded is the total number of stocks traded during the period, expressed in millions of stocks. 7/ Number of new stock is the total number of new listings and initial public offerings. 8/ Value of new stocks in U.S. dollars is expressed as a share of GDP.
V. CAN REGIONAL CROSS-LISTINGS LEAD SUB-SAHARAN AFRICA TO THE PROMISED LAND OF STOCK MARKET DEVELOPMENT?
A. Methodology and Data
The panel of 13 stock markets in 20 countries, namely Botswana, WAEMU,15 Ghana, Kenya, Mauritius, Namibia, Nigeria, South Africa, Tanzania, Uganda, Zambia, Zimbabwe, and Swaziland, was selected based on data availability for the relevant variables.
The study addresses the question of whether regional cross-listing can promote stock market development in SSA in two ways. First, the study adopts an event study methodology to analyze
15 The eight WAEMU countries have one regional stock market, the BRVM in Côte d’Ivoire.
14
structural shifts in stock market development measures around key cross-listing of stock events. Second, the study adopts a multicountry multivariate methodology to analyze the impact of regional cross-listing on stock market development.
Event study methodology has been used extensively in finance, economics, and political economy literatures to empirically estimate market reactions to specific events by studying the reactions of relevant variables around the event window. The methodology has been applied to a variety of firm specific and economy wide events (see Beaver, 1968, May 1971; Patell, 1976; Bonnier and Bruner,1989; Fox and Opong, 1996; Fama, 1991; MacKinlay, 1997; Dasgupta and others, 1998; Adelegan, 2003, 2006a and b, 2007a and b, and 2008).16
The methodology is based on the assumption that stock markets are efficient and the effects of an event will be reflected immediately in stock prices and ultimately in the market capitalization. The main thrust of the methodology is that if an event contains information that alters expectations concerning future cash flows, the release of such information will cause a change in investors’ estimates of the probability distribution of the firms’ future share price and this may result in a change in the current price and the total market capitalization. To apply event study methodology, the study followed a modified form of the structure outlined in MacKinlay, 1997, and Adelegan, 2003, 2006, and 2007. This includes: (i) defining the event and identifying the event window; (ii) selecting the sample of countries to be included; (iii) selecting the nonevent window; (iv) calculating the change in the stock market development variable for both the nonevent and the event windows; and (v) testing whether the change is statistically significant around the event window.17
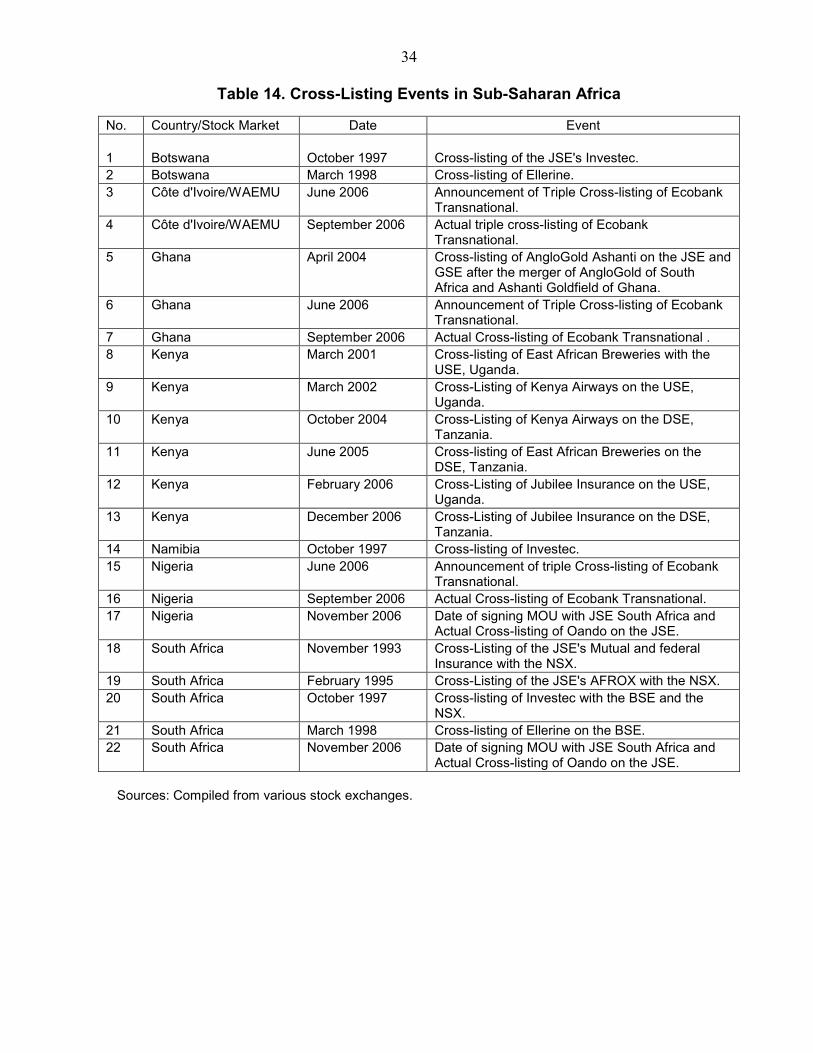
The events are the announcements of the cross-listings of stocks, the signing of MOUs for regional cross-listings, and shared platform arrangements. The study identifies the key regional cross-listing of stock (the event) dates from the publications of various exchanges, stock exchanges, and their official web sites. The dates include the dates of announcements and the dates of actual regional cross-listings of stocks on the exchanges, the dates of the signing of MOUs for regional cross-listings, and shared platform arrangements (see Appendix Table 13). The study calculates the change in market capitalization for the nonevent and event periods. The event window is five months which comprise two months before and after the event. The nonevent period is the start of the sample period until three months before the event window. The 16 Several models have been used in the microeconomic and finance literature to empirically estimate stock returns around specific events. These include the constant mean return model, the market model, the capital asset pricing model (CAPM), and the arbitrage pricing theory.
17 An event window is the period surrounding the event and it includes at least the day or month of announcement of the event (day 0), the day or the month before (day -1) and the day or the month after the event (day +1). The normal return is the expected return without conditioning on the occurrence of the event, usually estimated over a period of about 120 days (four months) before the event to prevent the event from influencing the estimates. The abnormal return is the difference between the actual ex post return of the stock over the event window and the normal return of the firm over the event window.
15
two-sided t-statistics of the changes in stock market development measure are computed around a five-month event window. The two-sided t-statistics test for the null hypothesis that the stock market does not react to regional cross-listings stock market events. Therefore, changes in stock market measure around the key dates are not statistically significant. The study investigates the aggregate impact of a regional cross-listing of stock on stock market development in SSA countries using an unbalanced panel18 of 20 countries for 18 years from 1990 to 2007. Adopting the modeling framework in Karolyi, 2004, the study constructs three measures of stock market development. These comprise the market capitalization as a share of GDP, number of listed firms, and turnover ratio. Market capitalization as a share of GDP is measured as the value of listed shares divided by GDP (MCAPGDP). This ratio has been widely adopted in the literature as a stable measure of stock market development for two reasons. First, it is a proxy of the size of the stock market which is positively correlated with the ability to mobilize capital and diversify risk. Second, it is presumed to include firms’ past retained profits and future growth prospects so that a higher ratio to GDP signifies growth prospects and stock market development (Levine and Zervos, 1998; Hargis, 1998; Moel, 2001; Bekaert et al, 2001; Rajan and Zingale, 2003; and Karolyi, 2004). The key weakness of this ratio is that a high ratio solely driven by appreciated values of few firms with little or no change in the amount of funds raised, and no change in the breadth of the stock market may be misinterpreted as stock market development. However, this is not the case for most of the stock markets covered in the sample. For most of the stock markets covered, growth in market capitalization as a share of GDP is associated with an increase in the number of listed firms (Table 1). The period of study also coincides with the decade of increased stock market activities in the SSA region with the attendant new issues. Market capitalization as a share of GDP is adopted as a measure of stock market development in this study. Monthly data on market capitalization were obtained from the EMDB and aggregated separately for those firms in a given month that have any regional cross-listings, and also for all firms .
The number of listed firms has been used as a measure of stock market development in the literature because it is a proxy of the breadth of the stock market which is not subject to stock market valuations (Moel, 2001; Bekaert et al, 2001; Rajan and Zingale, 2003; and Karolyi, 2004). This study defines this measure as the number of listed firms scaled by GDP (NUMGDP) and used it to measure the breadth of the stock market. The resulting measure is similar to the one used by Bakaert et al, 2001 and Karolyi, 2004, but different from the measure in Moel, 2001 who computed percentage changes in the number of listed firms, and Rajan and Zingales, 2003 who compute number of listed firms per million of population. NUMGDP is a count of listed firms which is not tainted by fluctuations in stock market valuations and possible mismeasurement of
18 Unbalanced panel means that there are missing data for some countries. For some of the countries, there is data over the entire study period of 1990 to 2007, while for some other countries there is data from 1995 to 2007.
16
GDP. However, the measure may be too slow-moving to fully capture high frequency changes in the market and can also be affected by firms’ restructuring, combinations, and mergers. Also, the measure may allocate a low score to countries with concentrated industrial structure with fewer but larger firms. This may be a noisy measure because concentration only partly reflects limited access to finance (Rajan and Zingale, 2003 and Karolyi, 2004). The measure is adopted in this study because it is a count of listed firms which reflects the breadth of the market that is not affected by market valuation or movement in stock prices.
Turnover ratio is measured as the value of total shares traded divided by market capitalization. It has been used in the literature to measure stock market liquidity and development (Hargis, 1998; Moel, 2001; Bekaert et al, 2001; Claessens et al, 2002; Levine and Schmukler, 2003; and Karolyi, 2004). High turnover is expected to indicate lower transaction costs. Levine and Zervos, 1998 contrast turnover with their preferred value traded as a share of GDP. Though the latter measures the positive effects of liquidity on national output, Levine and Zervos, 1998 noted that “price effects” taints their measure because a rise in stock prices accompanied by no change in the number of transactions or fall in transaction costs will increase value traded. This study follows most other studies in using turnover ratio.19
The study also constructs three measures of regional cross-listings of stocks. These comprise the fraction of market capitalization of cross-listed firms in the total market capitalization of all stocks in the stock market of primary listing (MCAPFR), the fraction of the total number of listed firms with regional cross-listing in the stock market of primary listing (NUMFR), the fraction of the total value of stocks traded with regional cross-listing in the stock market of primary listing (VALFR), and a cross-listing dummy. MCAPFR , VALFR, and NUMFR are expected to increase as the number of cross-listed stocks increases.
The two value-based measures of cross-listings—namely the fraction of market capitalization of cross-listed stock in the total market capitalization of all stocks and the fraction of the total value of cross-listed stocks in the total value of stocks traded—have some limitations. In reporting the market capitalization and the value of firms with regional cross-listing, there is no distinction between straight listing with secondary trading and primary market capital-raising activities. The data for number of listed firms, market capitalization, and value of stocks traded are obtained from the Standard and Poor’s EMDB. However, this does not affect the validity of the results.
The cross-listing dummy takes the value of one from the months of cross-listing of stocks between two or more SSA stock markets and zero otherwise (CDUM). This dummy variable is expected to have a positive and statistically significant impact on stock market development. The date of actual regional cross-listing of stocks was obtained directly from the local stock exchanges in the sample or their web sites.
19 Hargis, 1998, Moel, 2001, Bekaert et al, 2001, Claessens et al, 2002, Levine and Schmukler, 2003, Karolyi, 2004.
17
The model can be written as:
ititiititiit yzxy εδνβα ++++= −1
( 1 )
Where: yit are the three measures of stock market development (MCAPGDP, NUMGDP, and TURNOVER), Xit are the measures of regional cross-listings of stocks (MCAPFR, NUMFR, and VALFR), and Zit is the cross-listing dummy. Panel data are well suited for examining dynamic effects. However, one difficulty that may arise in such a fixed –effects setting is that the lagged dependent variable may be correlated with the disturbance, even if it is assumed that εit itself is not autocorrelated. Baltagi, 2002 identified autocorrelation as a result of the presence of a lagged dependent variable among the regressors and the presence of unobserved heterogeneity. Greene (2003) shows how the estimator may not be unbiased though it is consistent, and he points out that the problem is more severe in a random-effects specification than in a fixed effects specification. However, Giovanni, 2004 noted that panel data sets provide a solution to the problem of joint presence of dynamics and unobserved individual heterogeneity. Panel data estimators provide greater efficiency than individual country studies, solve the country specific problems, and allow the use of instrumental variables approach to consider the potential joint endogeneity of the explanatory variables. The instrumental variable approach was first introduced by Anderson and Hsiao, 1982 and later modified by Arellano and Bond, 1991; Arellano and Bover, 1995; and Blundell and Bond, 1998. This study uses an instrumental variable approach and system generalized methods of moments (GMM) approach to solve the errors and biases using lagged dependent variables as valid instruments. The study estimates the above specification for 1991 to 2007 with instrumental variable with fixed effects, and GMM estimator to address the question of whether regional cross-listing facilitates stock market development. Equation 1 was estimated using instrumental variable with fixed effects and system GMM (dynamic estimation) technique for the full sample of selected SSA countries. Data were obtained from the International Financial Statistics and World Economic Outlook databases, World Bank World Economic Indicators and African Indicators, emerging market data base, and from the country desks.
B. Event Study Results of Changes in Stock Market Development Around Regional Cross-Listing of Stocks
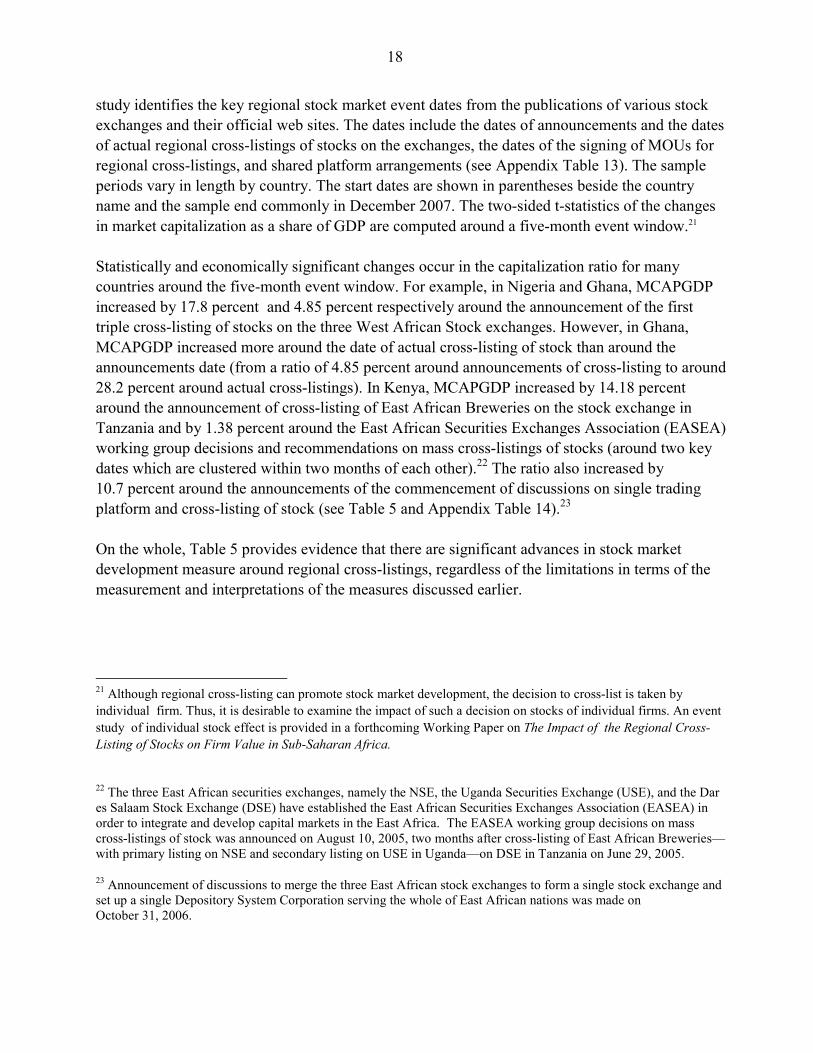
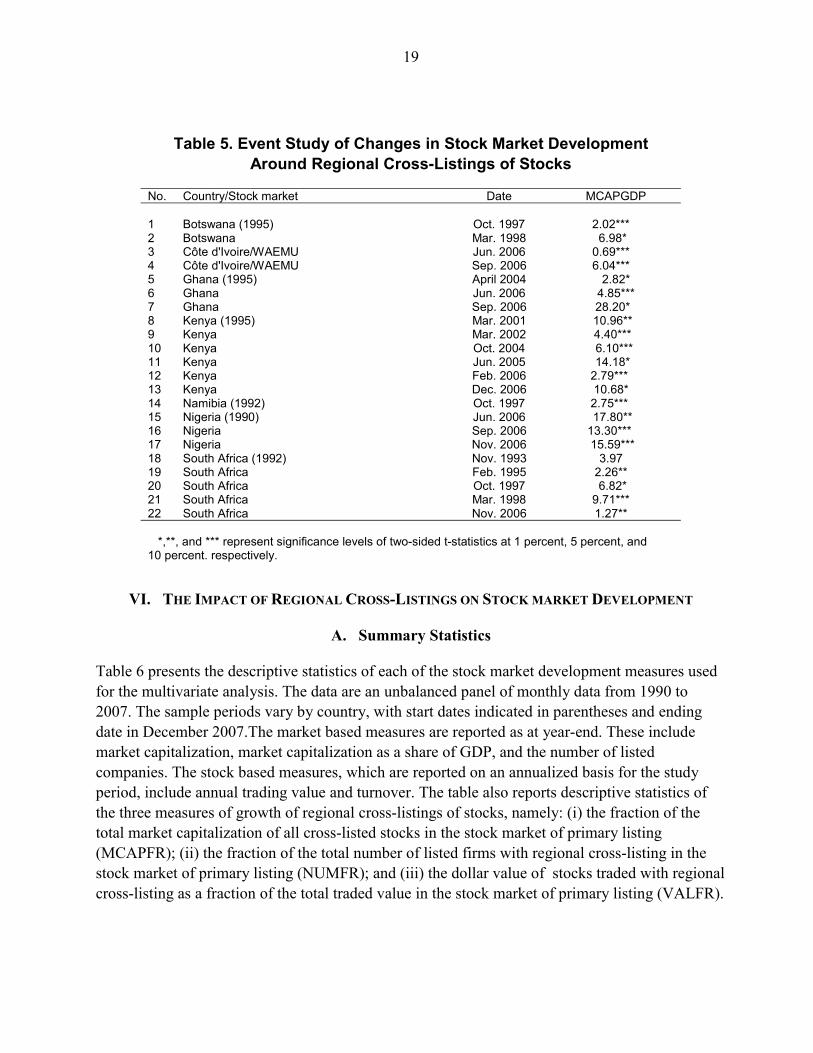
Table 5 presents the results of a number of event study and univariate tests for changes in stock market development measure around regional cross-listings and key stock market events.20 The 20 The events are the announcements of the cross-listings of stocks, the signing of MOUs for regional cross-listings and shared platform arrangements.
18
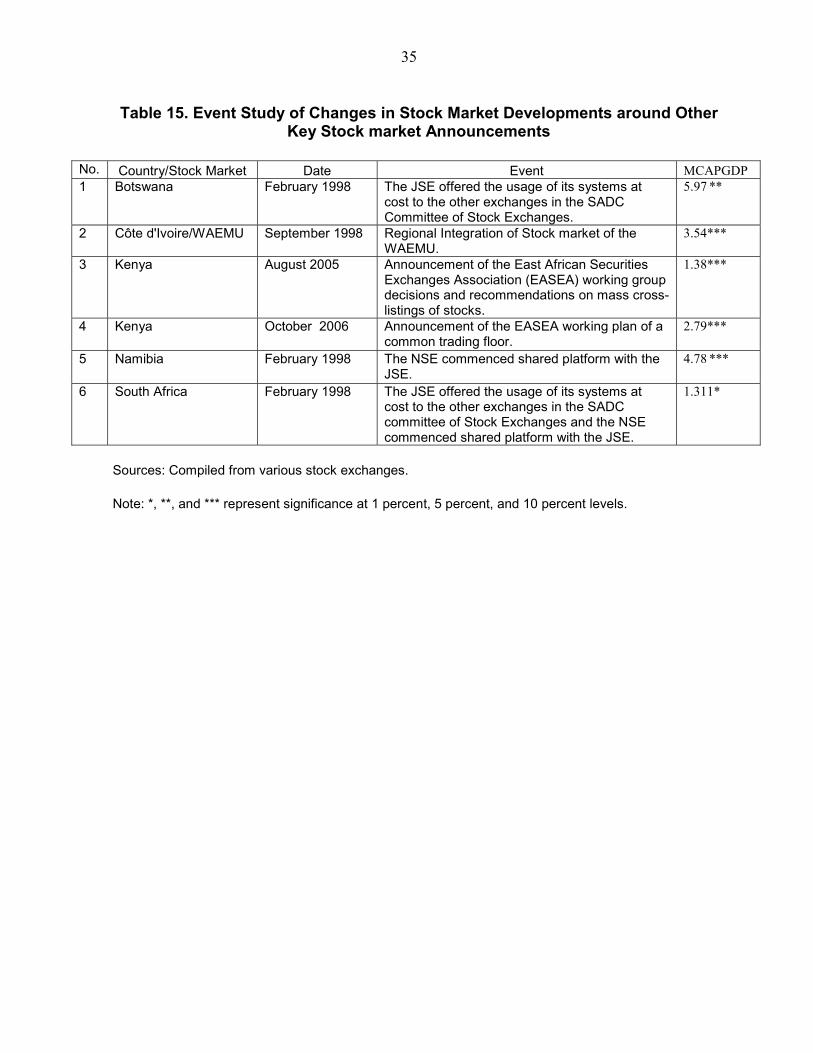
study identifies the key regional stock market event dates from the publications of various stock exchanges and their official web sites. The dates include the dates of announcements and the dates of actual regional cross-listings of stocks on the exchanges, the dates of the signing of MOUs for regional cross-listings, and shared platform arrangements (see Appendix Table 13). The sample periods vary in length by country. The start dates are shown in parentheses beside the country name and the sample end commonly in December 2007. The two-sided t-statistics of the changes in market capitalization as a share of GDP are computed around a five-month event window.21 Statistically and economically significant changes occur in the capitalization ratio for many countries around the five-month event window. For example, in Nigeria and Ghana, MCAPGDP increased by 17.8 percent and 4.85 percent respectively around the announcement of the first triple cross-listing of stocks on the three West African Stock exchanges. However, in Ghana, MCAPGDP increased more around the date of actual cross-listing of stock than around the announcements date (from a ratio of 4.85 percent around announcements of cross-listing to around 28.2 percent around actual cross-listings). In Kenya, MCAPGDP increased by 14.18 percent around the announcement of cross-listing of East African Breweries on the stock exchange in Tanzania and by 1.38 percent around the East African Securities Exchanges Association (EASEA) working group decisions and recommendations on mass cross-listings of stocks (around two key dates which are clustered within two months of each other).22 The ratio also increased by 10.7 percent around the announcements of the commencement of discussions on single trading platform and cross-listing of stock (see Table 5 and Appendix Table 14).23 On the whole, Table 5 provides evidence that there are significant advances in stock market development measure around regional cross-listings, regardless of the limitations in terms of the measurement and interpretations of the measures discussed earlier.
21 Although regional cross-listing can promote stock market development, the decision to cross-list is taken by individual firm. Thus, it is desirable to examine the impact of such a decision on stocks of individual firms. An event study of individual stock effect is provided in a forthcoming Working Paper on The Impact of the Regional Cross-Listing of Stocks on Firm Value in Sub-Saharan Africa.
22 The three East African securities exchanges, namely the NSE, the Uganda Securities Exchange (USE), and the Dar es Salaam Stock Exchange (DSE) have established the East African Securities Exchanges Association (EASEA) in order to integrate and develop capital markets in the East Africa. The EASEA working group decisions on mass cross-listings of stock was announced on August 10, 2005, two months after cross-listing of East African Breweries—with primary listing on NSE and secondary listing on USE in Uganda—on DSE in Tanzania on June 29, 2005.
23 Announcement of discussions to merge the three East African stock exchanges to form a single stock exchange and set up a single Depository System Corporation serving the whole of East African nations was made on October 31, 2006.
19
Table 5. Event Study of Changes in Stock Market Development Around Regional Cross-Listings of Stocks
No. Country/Stock market Date MCAPGDP 1 Botswana (1995) Oct. 1997 2.02*** 2 Botswana Mar. 1998 6.98* 3 Côte d'Ivoire/WAEMU Jun. 2006 0.69*** 4 Côte d'Ivoire/WAEMU Sep. 2006 6.04*** 5 Ghana (1995) April 2004 2.82* 6 Ghana Jun. 2006 4.85*** 7 Ghana Sep. 2006 28.20* 8 Kenya (1995) Mar. 2001 10.96** 9 Kenya Mar. 2002 4.40*** 10 Kenya Oct. 2004 6.10*** 11 Kenya Jun. 2005 14.18* 12 Kenya Feb. 2006 2.79*** 13 Kenya Dec. 2006 10.68* 14 Namibia (1992) Oct. 1997 2.75*** 15 Nigeria (1990) Jun. 2006 17.80** 16 Nigeria Sep. 2006 13.30*** 17 Nigeria Nov. 2006 15.59*** 18 South Africa (1992) Nov. 1993 3.97 19 South Africa Feb. 1995 2.26** 20 South Africa Oct. 1997 6.82* 21 South Africa Mar. 1998 9.71*** 22 South Africa Nov. 2006 1.27** *,**, and *** represent significance levels of two-sided t-statistics at 1 percent, 5 percent, and 10 percent. respectively.
VI. THE IMPACT OF REGIONAL CROSS-LISTINGS ON STOCK MARKET DEVELOPMENT
A. Summary Statistics
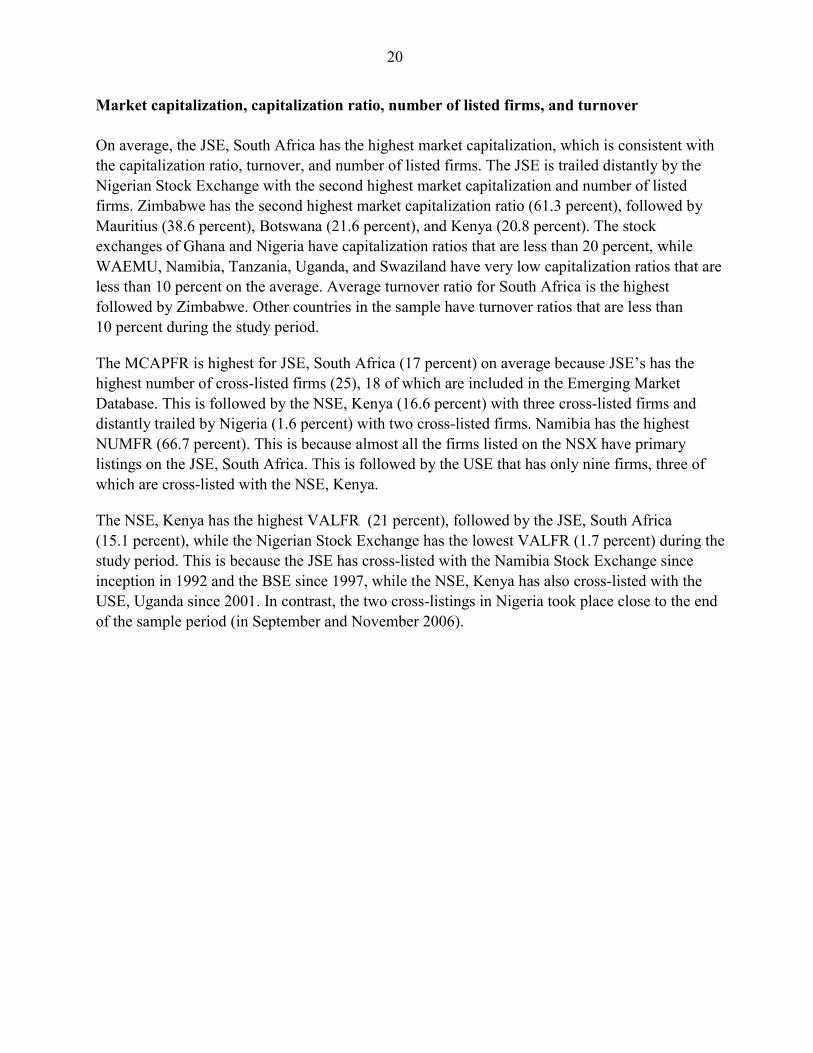
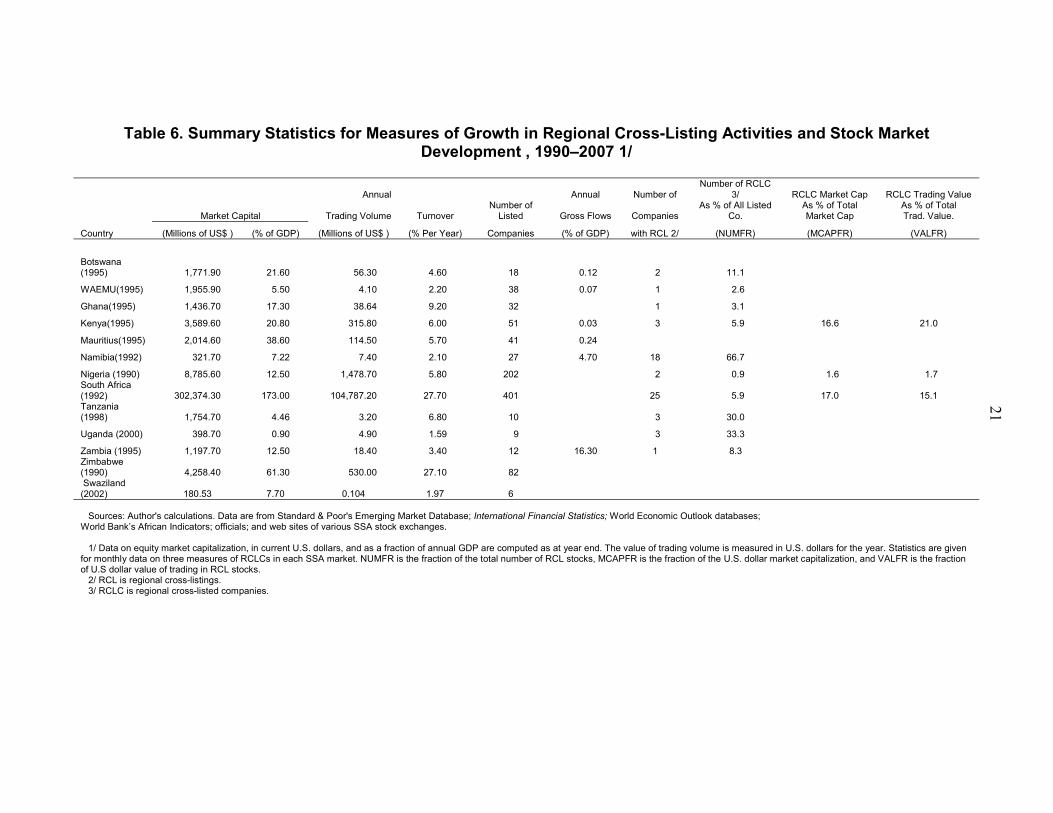
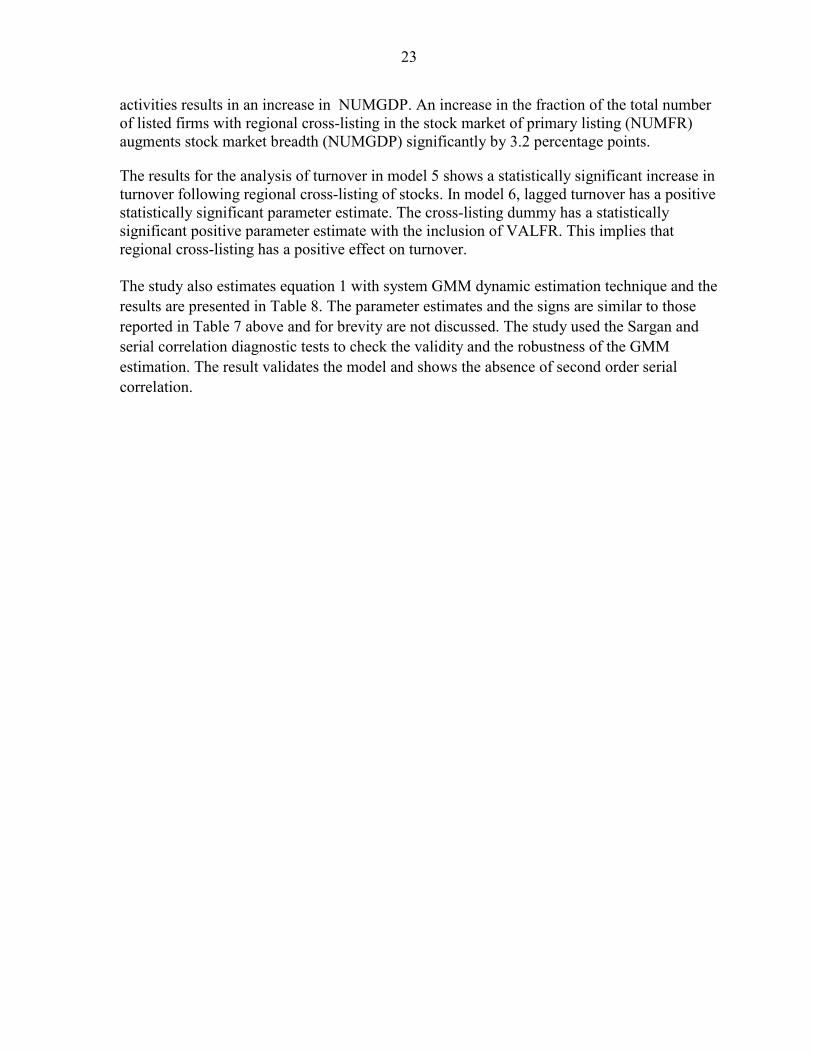
Table 6 presents the descriptive statistics of each of the stock market development measures used for the multivariate analysis. The data are an unbalanced panel of monthly data from 1990 to 2007. The sample periods vary by country, with start dates indicated in parentheses and ending date in December 2007.The market based measures are reported as at year-end. These include market capitalization, market capitalization as a share of GDP, and the number of listed companies. The stock based measures, which are reported on an annualized basis for the study period, include annual trading value and turnover. The table also reports descriptive statistics of the three measures of growth of regional cross-listings of stocks, namely: (i) the fraction of the total market capitalization of all cross-listed stocks in the stock market of primary listing (MCAPFR); (ii) the fraction of the total number of listed firms with regional cross-listing in the stock market of primary listing (NUMFR); and (iii) the dollar value of stocks traded with regional cross-listing as a fraction of the total traded value in the stock market of primary listing (VALFR).
20
Market capitalization, capitalization ratio, number of listed firms, and turnover On average, the JSE, South Africa has the highest market capitalization, which is consistent with the capitalization ratio, turnover, and number of listed firms. The JSE is trailed distantly by the Nigerian Stock Exchange with the second highest market capitalization and number of listed firms. Zimbabwe has the second highest market capitalization ratio (61.3 percent), followed by Mauritius (38.6 percent), Botswana (21.6 percent), and Kenya (20.8 percent). The stock exchanges of Ghana and Nigeria have capitalization ratios that are less than 20 percent, while WAEMU, Namibia, Tanzania, Uganda, and Swaziland have very low capitalization ratios that are less than 10 percent on the average. Average turnover ratio for South Africa is the highest followed by Zimbabwe. Other countries in the sample have turnover ratios that are less than 10 percent during the study period.
The MCAPFR is highest for JSE, South Africa (17 percent) on average because JSE’s has the highest number of cross-listed firms (25), 18 of which are included in the Emerging Market Database. This is followed by the NSE, Kenya (16.6 percent) with three cross-listed firms and distantly trailed by Nigeria (1.6 percent) with two cross-listed firms. Namibia has the highest NUMFR (66.7 percent). This is because almost all the firms listed on the NSX have primary listings on the JSE, South Africa. This is followed by the USE that has only nine firms, three of which are cross-listed with the NSE, Kenya.
The NSE, Kenya has the highest VALFR (21 percent), followed by the JSE, South Africa (15.1 percent), while the Nigerian Stock Exchange has the lowest VALFR (1.7 percent) during the study period. This is because the JSE has cross-listed with the Namibia Stock Exchange since inception in 1992 and the BSE since 1997, while the NSE, Kenya has also cross-listed with the USE, Uganda since 2001. In contrast, the two cross-listings in Nigeria took place close to the end of the sample period (in September and November 2006).
21
Table 6. Summary Statistics for Measures of Growth in Regional Cross-Listing Activities and Stock Market Development , 1990–2007 1/
Annual Annual Number of Number of RCLC
3/ RCLC Market Cap RCLC Trading Value
Market Capital Trading Volume Turnover Number of
Listed Gross Flows Companies As % of All Listed
Co. As % of Total Market Cap
As % of Total Trad. Value.
Country (Millions of US$ ) (% of GDP) (Millions of US$ ) (% Per Year) Companies (% of GDP) with RCL 2/ (NUMFR) (MCAPFR) (VALFR)
Botswana (1995) 1,771.90 21.60 56.30 4.60 18 0.12 2 11.1
WAEMU(1995) 1,955.90 5.50 4.10 2.20 38 0.07 1 2.6
Ghana(1995) 1,436.70 17.30 38.64 9.20 32 1 3.1
Kenya(1995) 3,589.60 20.80 315.80 6.00 51 0.03 3 5.9 16.6 21.0
Mauritius(1995) 2,014.60 38.60 114.50 5.70 41 0.24
Namibia(1992) 321.70 7.22 7.40 2.10 27 4.70 18 66.7
Nigeria (1990) 8,785.60 12.50 1,478.70 5.80 202 2 0.9 1.6 1.7 South Africa (1992) 302,374.30 173.00 104,787.20 27.70 401 25 5.9 17.0 15.1 Tanzania (1998) 1,754.70 4.46 3.20 6.80 10 3 30.0
Uganda (2000) 398.70 0.90 4.90 1.59 9 3 33.3
Zambia (1995) 1,197.70 12.50 18.40 3.40 12 16.30 1 8.3 Zimbabwe (1990) 4,258.40 61.30 530.00 27.10 82 Swaziland (2002) 180.53 7.70 0.104 1.97 6 Sources: Author's calculations. Data are from Standard & Poor's Emerging Market Database; International Financial Statistics; World Economic Outlook databases; World Bank’s African Indicators; officials; and web sites of various SSA stock exchanges. 1/ Data on equity market capitalization, in current U.S. dollars, and as a fraction of annual GDP are computed as at year end. The value of trading volume is measured in U.S. dollars for the year. Statistics are given for monthly data on three measures of RCLCs in each SSA market. NUMFR is the fraction of the total number of RCL stocks, MCAPFR is the fraction of the U.S. dollar market capitalization, and VALFR is the fraction of U.S dollar value of trading in RCL stocks. 2/ RCL is regional cross-listings. 3/ RCLC is regional cross-listed companies.
22
B. Empirical Results
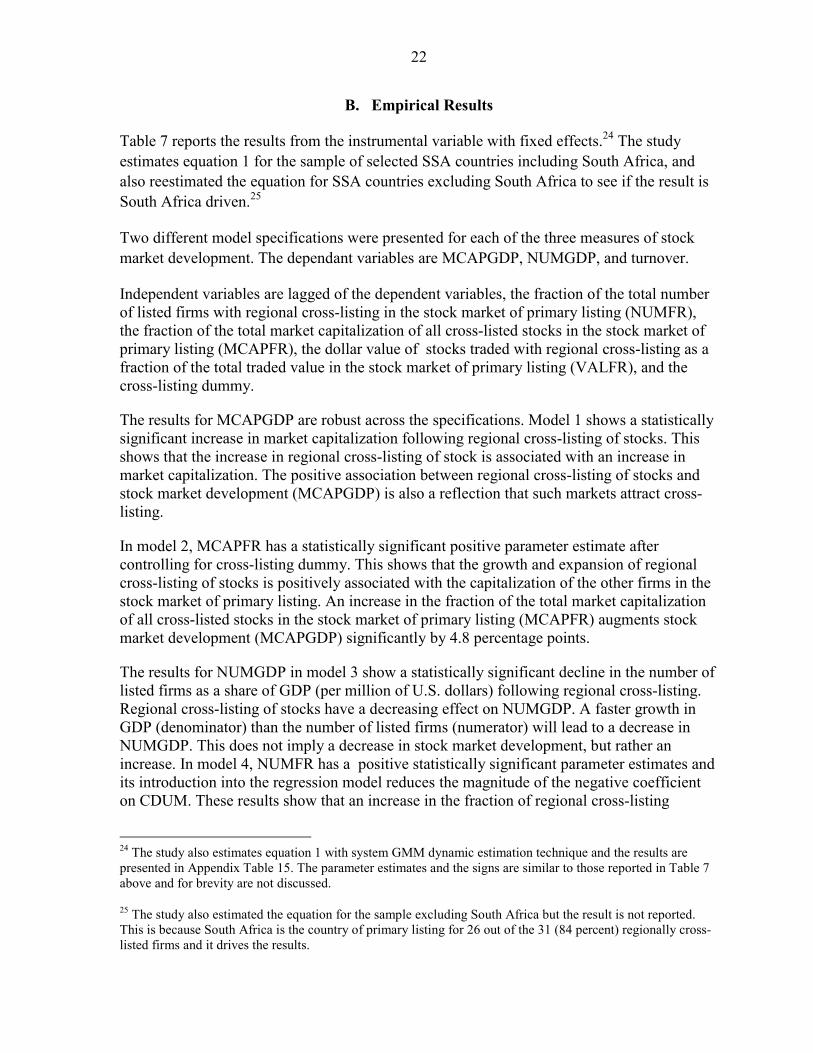
Table 7 reports the results from the instrumental variable with fixed effects.24 The study estimates equation 1 for the sample of selected SSA countries including South Africa, and also reestimated the equation for SSA countries excluding South Africa to see if the result is South Africa driven.25
Two different model specifications were presented for each of the three measures of stock market development. The dependant variables are MCAPGDP, NUMGDP, and turnover.
Independent variables are lagged of the dependent variables, the fraction of the total number of listed firms with regional cross-listing in the stock market of primary listing (NUMFR), the fraction of the total market capitalization of all cross-listed stocks in the stock market of primary listing (MCAPFR), the dollar value of stocks traded with regional cross-listing as a fraction of the total traded value in the stock market of primary listing (VALFR), and the cross-listing dummy.
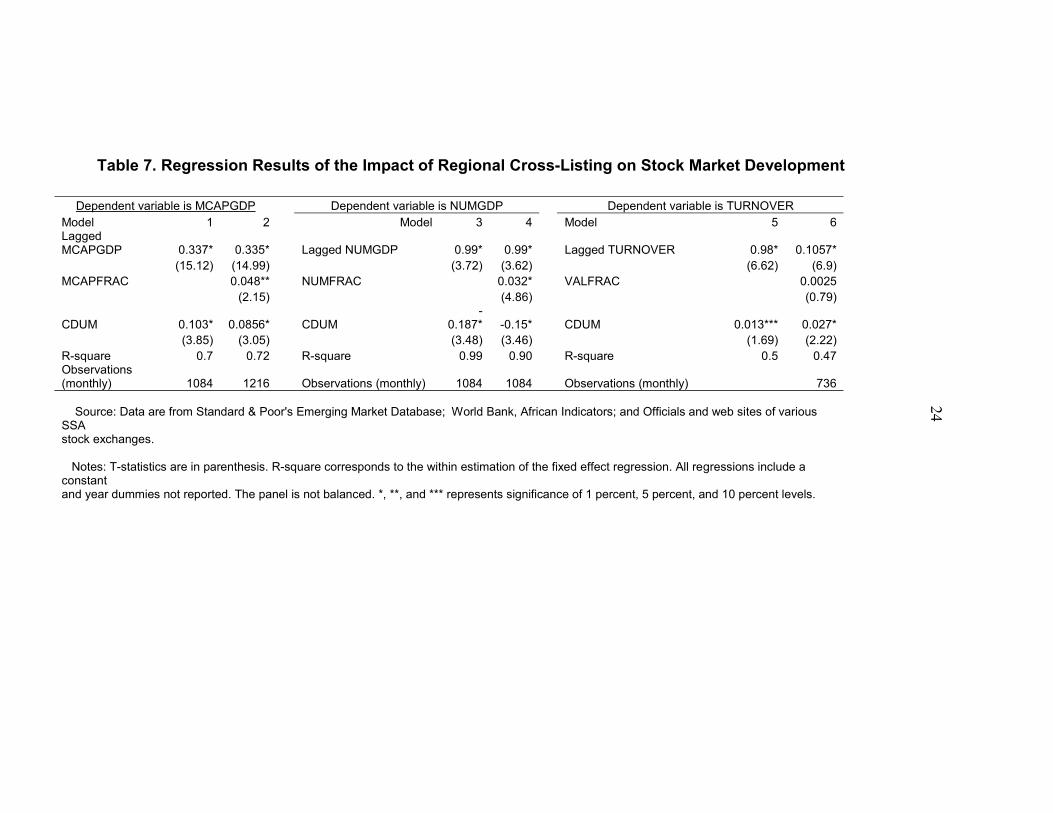
The results for MCAPGDP are robust across the specifications. Model 1 shows a statistically significant increase in market capitalization following regional cross-listing of stocks. This shows that the increase in regional cross-listing of stock is associated with an increase in market capitalization. The positive association between regional cross-listing of stocks and stock market development (MCAPGDP) is also a reflection that such markets attract cross-listing.
In model 2, MCAPFR has a statistically significant positive parameter estimate after controlling for cross-listing dummy. This shows that the growth and expansion of regional cross-listing of stocks is positively associated with the capitalization of the other firms in the stock market of primary listing. An increase in the fraction of the total market capitalization of all cross-listed stocks in the stock market of primary listing (MCAPFR) augments stock market development (MCAPGDP) significantly by 4.8 percentage points.
The results for NUMGDP in model 3 show a statistically significant decline in the number of listed firms as a share of GDP (per million of U.S. dollars) following regional cross-listing. Regional cross-listing of stocks have a decreasing effect on NUMGDP. A faster growth in GDP (denominator) than the number of listed firms (numerator) will lead to a decrease in NUMGDP. This does not imply a decrease in stock market development, but rather an increase. In model 4, NUMFR has a positive statistically significant parameter estimates and its introduction into the regression model reduces the magnitude of the negative coefficient on CDUM. These results show that an increase in the fraction of regional cross-listing
24 The study also estimates equation 1 with system GMM dynamic estimation technique and the results are presented in Appendix Table 15. The parameter estimates and the signs are similar to those reported in Table 7 above and for brevity are not discussed.
25 The study also estimated the equation for the sample excluding South Africa but the result is not reported. This is because South Africa is the country of primary listing for 26 out of the 31 (84 percent) regionally cross-listed firms and it drives the results.
23
activities results in an increase in NUMGDP. An increase in the fraction of the total number of listed firms with regional cross-listing in the stock market of primary listing (NUMFR) augments stock market breadth (NUMGDP) significantly by 3.2 percentage points.
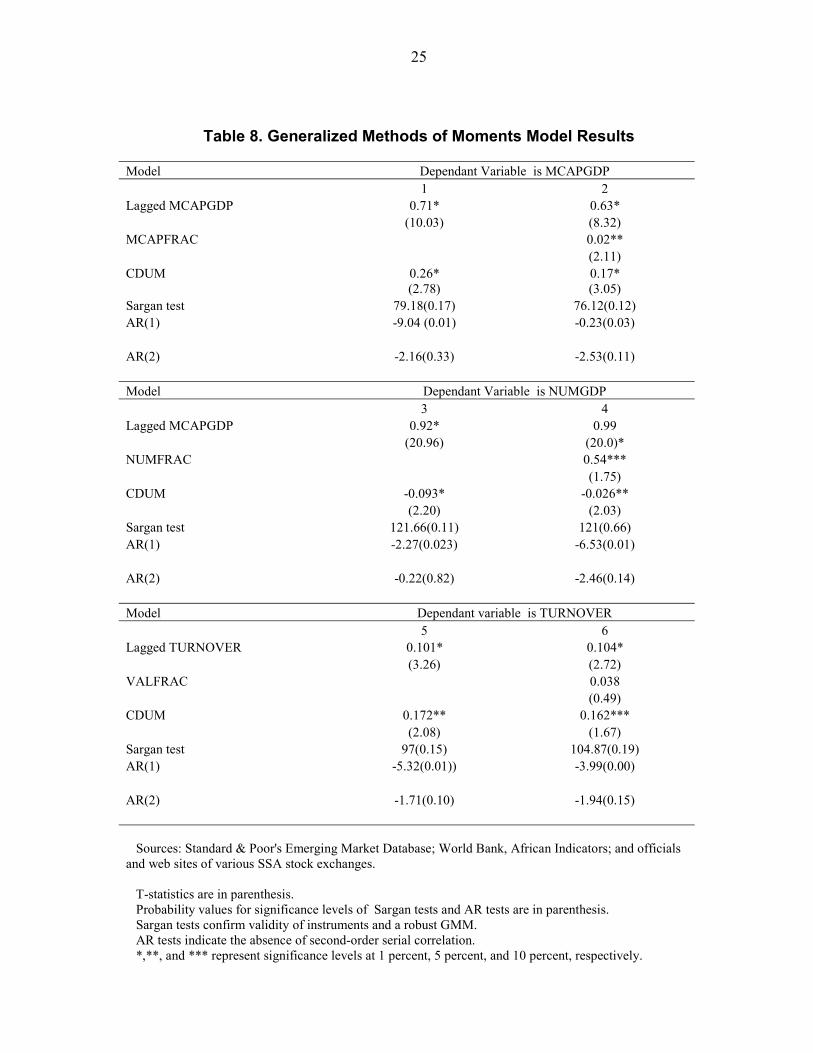
The results for the analysis of turnover in model 5 shows a statistically significant increase in turnover following regional cross-listing of stocks. In model 6, lagged turnover has a positive statistically significant parameter estimate. The cross-listing dummy has a statistically significant positive parameter estimate with the inclusion of VALFR. This implies that regional cross-listing has a positive effect on turnover. The study also estimates equation 1 with system GMM dynamic estimation technique and the results are presented in Table 8. The parameter estimates and the signs are similar to those reported in Table 7 above and for brevity are not discussed. The study used the Sargan and serial correlation diagnostic tests to check the validity and the robustness of the GMM estimation. The result validates the model and shows the absence of second order serial correlation.
24
Table 7. Regression Results of the Impact of Regional Cross-Listing on Stock Market Development
Dependent variable is MCAPGDP Dependent variable is NUMGDP Dependent variable is TURNOVER Model 1 2 Model 3 4 Model 5 6 Lagged MCAPGDP 0.337* 0.335* Lagged NUMGDP 0.99* 0.99* Lagged TURNOVER 0.98* 0.1057* (15.12) (14.99) (3.72) (3.62) (6.62) (6.9) MCAPFRAC 0.048** NUMFRAC 0.032* VALFRAC 0.0025 (2.15) (4.86) (0.79)
CDUM 0.103* 0.0856* CDUM -
0.187* -0.15* CDUM 0.013*** 0.027* (3.85) (3.05) (3.48) (3.46) (1.69) (2.22) R-square 0.7 0.72 R-square 0.99 0.90 R-square 0.5 0.47 Observations (monthly) 1084 1216 Observations (monthly) 1084 1084 Observations (monthly) 736 Source: Data are from Standard & Poor's Emerging Market Database; World Bank, African Indicators; and Officials and web sites of various SSA stock exchanges. Notes: T-statistics are in parenthesis. R-square corresponds to the within estimation of the fixed effect regression. All regressions include a constant and year dummies not reported. The panel is not balanced. *, **, and *** represents significance of 1 percent, 5 percent, and 10 percent levels.
25
Table 8. Generalized Methods of Moments Model Results
Model Dependant Variable is MCAPGDP 1 2 Lagged MCAPGDP 0.71* 0.63* (10.03) (8.32) MCAPFRAC 0.02** (2.11) CDUM 0.26* 0.17* (2.78) (3.05) Sargan test 79.18(0.17) 76.12(0.12) AR(1) -9.04 (0.01) -0.23(0.03) AR(2) -2.16(0.33) -2.53(0.11) Model Dependant Variable is NUMGDP 3 4 Lagged MCAPGDP 0.92* 0.99 (20.96) (20.0)* NUMFRAC 0.54*** (1.75) CDUM -0.093* -0.026** (2.20) (2.03) Sargan test 121.66(0.11) 121(0.66) AR(1) -2.27(0.023) -6.53(0.01) AR(2) -0.22(0.82) -2.46(0.14) Model Dependant variable is TURNOVER 5 6 Lagged TURNOVER 0.101* 0.104* (3.26) (2.72) VALFRAC 0.038 (0.49) CDUM 0.172** 0.162*** (2.08) (1.67) Sargan test 97(0.15) 104.87(0.19) AR(1) -5.32(0.01)) -3.99(0.00) AR(2) -1.71(0.10) -1.94(0.15) Sources: Standard & Poor's Emerging Market Database; World Bank, African Indicators; and officials and web sites of various SSA stock exchanges. T-statistics are in parenthesis. Probability values for significance levels of Sargan tests and AR tests are in parenthesis. Sargan tests confirm validity of instruments and a robust GMM. AR tests indicate the absence of second-order serial correlation. *,**, and *** represent significance levels at 1 percent, 5 percent, and 10 percent, respectively.
26
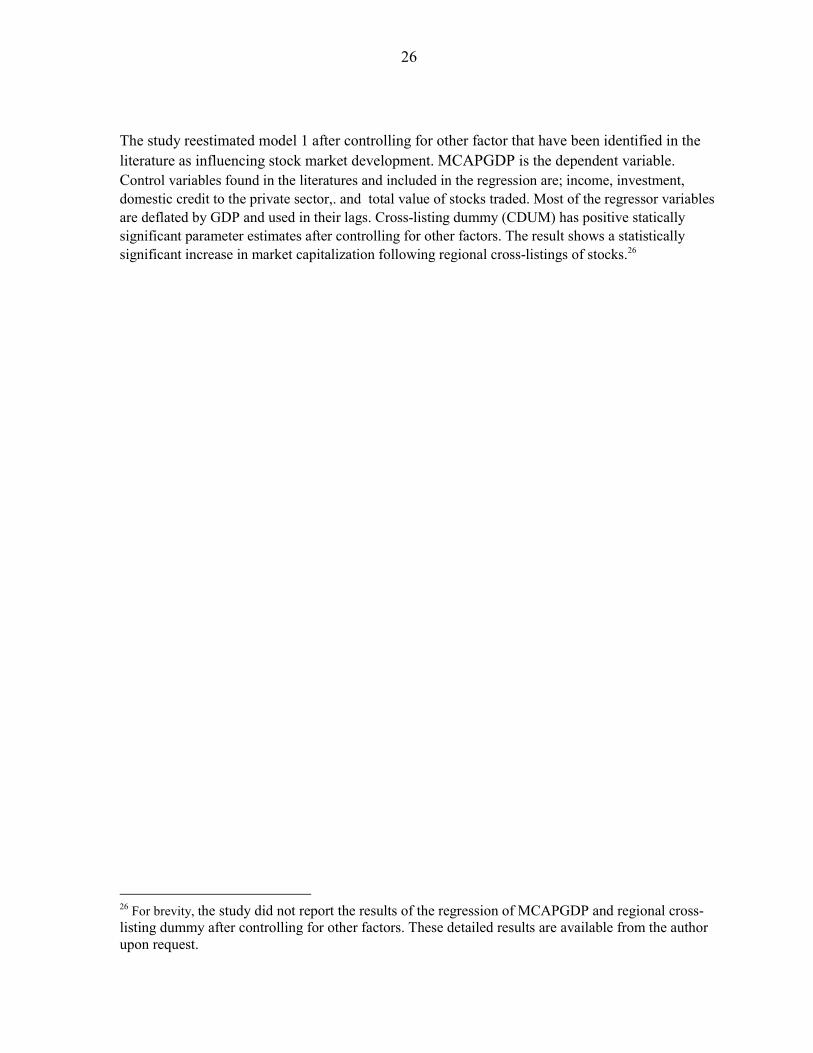
The study reestimated model 1 after controlling for other factor that have been identified in the literature as influencing stock market development. MCAPGDP is the dependent variable. Control variables found in the literatures and included in the regression are; income, investment, domestic credit to the private sector,. and total value of stocks traded. Most of the regressor variables are deflated by GDP and used in their lags. Cross-listing dummy (CDUM) has positive statically significant parameter estimates after controlling for other factors. The result shows a statistically significant increase in market capitalization following regional cross-listings of stocks.26
26 For brevity, the study did not report the results of the regression of MCAPGDP and regional cross-listing dummy after controlling for other factors. These detailed results are available from the author upon request.
27
VII. CONCLUSIONS, RECOMMENDATIONS, AND POLICY IMPLICATION
This study has analyzed the impact of regional cross-listings on stock market development in SSA. Having undergone stock market reforms, SSA countries are now emerging on the global financial stage. Average market capitalization as a percentage of GDP is 36 percent (71 percent including South Africa and Zimbabwe). This is higher than in Eastern Europe (26 percent) or Central America (11.8 percent). Nonetheless, 44 out of 46 countries representing 96 percent of SSA countries, have a negative savings-investment gap on average between 1991 and 2007. The savings-investment gap is mostly wider for the public than the private sector.
The study analyzed a panel of 20 SSA countries between 1990 and 2007 using event study methodology. The study finds that there are significant advances in the measure of stock market development around regional cross-listing events.
Overall, regionally integrated stock markets—as indicated by cross-listings—perform better than nonregionally integrated stock markets. The value of stock traded for the group with cross-listings is about five times the average for the without cross-listings group, while domestic credit is about three times higher. Real GDP on the average is also three times higher for the group with cross-listings. The study finds that the growth of regional cross-listing activities facilitated the development of the stock market in those countries, and that the growth and expansion of regional cross-listing of stocks is positively associated with the capitalization of the other firms in the stock market of primary listing.
The study suggests that regional cross-listings may help finance SSA corporate and development needs. The necessary conditions to harness the benefits of regional cross-listings are sound legal and regulatory frameworks, macroeconomic and political stability, harmonization of listing rules, accounting law and disclosure requirements across the region, strong money markets, and incentives for listed firms and other market participants to take advantage of regional cross-listing.
The results of the study underscores the importance of stock market development for economic growth, therefore policy makers need to give due consideration to taking the necessary steps to further integrate SSA stock markets. These steps include the following:
• Providing incentives to encourage corporate firms to fully embrace increased regional cross-listings. These incentives should include reductions in the transaction and approval costs of regional cross-listings and relaxation of stringent cross-listing requirements.
• Encouraging national stock markets to embark on increasing significantly regional cross-listings. To achieve this, there is a need to sign MOUs among more stock markets in the region. In the African region, the JSE South Africa has already signed an MOU with Botswana, Egypt, Ghana, Kenya, Namibia, Nigeria, and Uganda. Nigeria has
28
signed an MOU with Ghana and the WAEMU, while the NSE, Kenya has signed an MOU with Ghana, Nigeria, Tanzania, Uganda, and the WAEMU.
• Introducing measures that focus on shareholder protection and information, and the proper code and regulation of corporate governance. Strong investor protection and transparency are prerequisites for capital inflows. Therefore, such measures are important if the stock markets are to make external capital available to firms with growth prospects and lower the cost of capital (Demirguc-Kunt and others, 2008).
• Harmonizing legal and regulatory mechanisms, listing and trading rules, accounting laws, disclosure requirements, and taxes and fees associated with cross-listings across the region. It is necessary to harmonize legal mechanisms such as bankruptcy courts and laws to enforce contracts and ensure minority rights protection by SSA stock markets. Harmonizing common listing requirements and rules will facilitate cross-border listings. Transparency and accountability could be improved through moving to a common financial reporting system and accounting framework. A common accounting framework can lower the cost of maintaining multiple accounting frameworks for firms listed in, or obtaining financing from, different countries within the SSA region. For example, Botswana requires companies that have primary cross-listings in other exchanges and secondary listings on the BSE to comply with some aspects of their listing requirements. It is necessary to harmonize trading rules, settlement periods, operating days, taxes, and fees associated with cross-listings across the region. Such rules and practices should be monitored and enforced by national exchanges and authorities, thereby ensuring horizontal integration and producing decentralized and technically uniform stock exchanges. Although vertical integration with a common trading platform will bring about cost efficiency and economies of scale by combining trading, clearing, and settlement in a single institution, it will not be favored by SSA countries because of the institutional and financial complexities, culture, and nationalistic politics discussed earlier.
• Improving the regional flow of information and coordination to facilitate cross- listings. The exchange of information between stock exchanges should be facilitated as regional cross-listing deepens.
• Introducing regional integration policies that are aimed at removing artificial or policy induced barriers, particularly those that are legal, regulatory, and institutional in nature. Barriers27 to entry can compartmentalize markets and hamper market liquidity and efficiency.
27 Barriers between countries can range from structural factors (linguistic and cultural differences), economic factors (high fixed cost and network externalities), and policy-induced factors (legal, regulatory, and institutional barriers).
29
Appendix I. Statistical Tables
Table 9. GDP of Sub-Saharan African Countries in 2007
(In billions of U.S. dollars)
Country GDP Angola 61.0 Benin 5.4 Botswana 11.3 Burkina Faso 6.9 Burundi 1.0 Cameroon 20.9 Cape Verde 1.4 Central African Rep. 1.6 Chad 6.4 Comoros 0.4 Congo, Dem. Rep. of 9.9 Congo, Republic of 6.8 Côte d'Ivoire 19.5 Djibouti 0.8 Equatorial Guinea 9.5 Eritrea 1.4 Ethiopia 15.9 Gabon 10.3 Gambia, The 0.4 Ghana 15.0 Guinea 4.6 Guinea-Bissau 0.3 Kenya 29.5 Lesotho 1.6 Liberia 0.7 Madagascar 7.3 Malawi 3.4 Mali 6.9 Mauritania 2.7 Mauritius 7.0 Mozambique 8.1 Namibia 6.7 Niger 4.2 Nigeria 126.7 Rwanda 2.8 São Tomé and Príncipe 0.1 Senegal 10.7 Seychelles 0.7 Sierra Leone 1.5 South Africa 274.5 Sudan 46.7 Swaziland 2.7 Tanzania 14.1 Togo 2.4 Uganda 11.1 Zambia 10.9
Source: World Economic Outlook.
30
Table 10. Overall Savings Investment Balances in Sub-Saharan Africa,
1991–2007
(In percent of GDP) 2007 Average Countries Savings Investment Savings Investment Angola 18.6 11.0 15.7 19.8 Benin 15.4 21.7 12.5 18.5 Botswana 55.4 29.3 45.5 32.0 Burkina Faso 11.6 23.0 13.9 22.1 Burundi 3.9 18.1 3.8 9.4 Cameroon 17.4 18.9 13.5 17.3 Cape Verde 32.0 44.6 24.9 37.1 Central African Rep. 6.2 9.6 5.6 9.1 Chad 19.5 21.6 4.0 22.9 Comoros 8.3 13.7 9.8 13.6 Congo, Dem. Rep. of 6.5 14.7 7.4 15.1 Congo, Republic of 33.4 28.6 21.7 27.4 Côte d'Ivoire 12.3 9.7 9.2 11.0 Djibouti 22.6 37.1 12.2 16.0 Equatorial Guinea 50.8 47.4 30.7 59.6 Eritrea 16.1 19.8 25.0 23.8 Ethiopia 16.3 22.2 15.0 17.0 Gabon 40.2 25.0 33.5 24.8 Gambia, The 6.2 28.0 14.5 22.1 Ghana 23.3 31.6 18.8 24.8 Guinea 6.3 15.0 11.8 17.7 Guinea-Bissau 2.9 15.6 5.7 19.9 Honduras 23.2 26.4 22.4 26.8 Kenya 16.2 20.1 14.7 15.5 Lesotho 27.7 26.2 23.8 44.7 Madagascar 10.5 30.2 8.5 16.3 Malawi 23.8 26.8 9.8 18.6 Mali 18.3 22.7 16.4 22.6 Mauritania 14.7 21.4 16.2 25.6 Mauritius 15.3 24.1 24.7 26.0 Niger 12.0 23.0 6.8 12.8 Nigeria 24.9 23.1 21.8 21.8 Rwanda 16.5 23.8 9.9 16.9 Senegal 23.0 32.6 13.4 19.7 South Africa 14.7 21.4 15.8 16.7 Sudan 13.4 24.1 5.5 19.6 Swaziland 17.4 17.2 19.1 19.9 Tanzania 14.1 24.9 14.4 20.8 Togo 6.7 13.1 5.3 11.6 Uganda 21.9 24.2 13.9 18.7 Zambia 24.6 25.0 11.2 18.0 Zimbabwe 16.6 17.5 10.5 13.5 South Africa 18.6 23.2 15.2 21.1 Sources: International Financial Statistics, World Economic Outlook, author's calculations.
31
Table 11. Savings-Investment Balances in Sub-Saharan Africa, 1991–2007
(In percent of GDP) Public Sector Private Sector 2007 Average 2007 Average Countries Savings Investment Savings Investment Savings Investment Savings Investment Angola 10.9 8.8 0.1 6.7 7.6 2.2 15.6 13.2 Benin 6.3 7.1 4.7 5.5 9.2 14.6 7.9 13.0 Botswana 13.0 7.5 9.5 10.7 42.4 21.9 35.9 21.3 Burkina Faso 3.9 8.8 4.6 7.3 7.8 14.2 9.3 14.8 Burundi 0.5 9.1 0.5 6.1 3.4 9.0 3.3 3.3 Cameroon 6.3 2.8 1.3 2.2 11.1 16.1 12.2 15.1 Cape Verde 7.7 9.6 6.4 10.7 24.3 35.0 18.5 26.4 Central African Rep. 9.1 3.5 3.0 5.0 -2.9 6.2 2.6 4.1 Chad 10.1 8.8 2.9 7.6 9.3 12.8 1.1 15.4 Comoros 4.6 6.8 3.0 6.3 3.7 6.9 6.7 7.3 Congo, Dem. Rep. of 6.6 3.2 1.5 1.8 -0.1 11.5 5.9 13.3 Congo, Republic of 22.6 11.7 3.7 6.0 10.8 16.9 18.0 21.5 Côte d'Ivoire 3.3 2.9 0.4 4.0 9.0 6.9 8.8 7.0 Djibouti 4.0 14.6 -0.9 7.3 18.6 22.5 13.1 8.7 Equatorial Guinea 43.7 18.9 19.5 12.6 7.1 28.5 11.3 47.0 Eritrea -1.4 17.1 -5.2 17.5 17.6 2.7 30.2 6.3 Ethiopia 13.0 12.0 5.6 9.8 3.3 10.2 9.3 7.2 Gabon 13.6 4.7 6.6 5.6 26.6 20.4 26.9 19.3 Gambia, The 15.1 12.5 4.8 8.6 -8.9 15.5 9.6 13.5 Ghana 8.7 13.6 4.8 11.3 14.6 18.0 14.0 13.5 Guinea 6.2 3.3 5.2 4.9 0.1 11.6 6.6 12.9 Guinea-Bissau -11.8 13.4 -6.7 15.2 14.7 2.2 12.4 4.6 Kenya 1.5 4.6 1.1 4.9 14.7 15.5 13.6 10.6 Lesotho 10.9 9.2 9.3 11.8 16.8 17.0 14.5 32.9 Madagascar 3.9 9.7 4.1 7.8 6.6 20.5 4.3 8.6 Malawi 0.0 12.1 -6.4 8.9 23.8 14.7 16.1 9.7 Mali 2.2 8.5 4.3 7.7 16.1 14.2 12.1 15.0 Mauritania 3.1 14.1 1.8 16.3 11.6 7.3 14.4 9.3 Mauritius -0.8 10.4 0.1 8.4 16.1 13.8 24.6 17.7 Niger 8.3 8.0 3.0 6.0 3.7 15.1 3.9 6.8 Nigeria 13.9 10.4 17.3 7.8 11.0 12.7 4.4 14.0 Rwanda 7.7 9.7 3.7 7.4 8.8 14.1 6.2 9.4 Senegal 9.5 12.7 7.2 7.3 13.4 19.9 6.2 12.4 South Africa 2.8 3.1 -0.8 2.7 11.8 18.3 16.6 14.0 Sudan 3.2 7.1 1.1 2.5 10.2 17.0 4.4 17.1 Swaziland 6.2 8.2 5.7 7.2 11.2 9.0 13.4 12.6 Tanzania 4.2 8.9 8.0 6.1 9.9 16.0 6.4 14.7 Togo 1.1 3.6 -1.1 2.6 5.6 9.5 6.4 9.0 Uganda 2.5 5.1 2.9 5.3 19.4 19.2 11.0 13.4 Zambia 0.2 7.1 6.7 7.5 24.4 18.0 4.4 10.5 Zimbabwe -5.6 17.5 -2.4 4.4 22.2 0.0 12.9 9.2 South Africa 6.6 9.0 3.5 7.4 11.9 14.1 11.6 14.1 Sources: International Financial Statistics; World Economic Outlook; World Development Indicators; and author's calculations.
32
Table 12. Current Account Balances in Sub-Saharan Africa, 1991–2007
Countries 2007 1991–2007 Angola 7.6 -4.1 Benin -6.3 -5.9 Botswana 20.6 9.3 Burkina Faso -11.4 -8.2 Burundi -14.2 -5.6 Cameroon -1.5 -2.7 Cape Verde -12.6 -9.4 Central African Rep. -3.4 -3.2 Chad -1.0 -18.7 Comoros -3.7 -7.5 Congo, Dem. Rep. of -8.1 -4.7 Congo, Republic of 4.9 -5.7 Côte d'Ivoire 2.6 -2.8 Djibouti -14.5 -3.9 Equatorial Guinea 3.4 -28.8 Eritrea -3.7 1.2 Ethiopia -5.9 -3.1 Gabon 15.2 8.7 Gambia, The -21.8 -7.6 Ghana -9.7 -5.9 Guinea -8.7 -6.0 Guinea-Bissau -12.7 -14.4 Kenya -3.7 -1.5 Lesotho 1.6 -18.8 Liberia -24.3 -14.7 Madagascar -19.7 -7.9 Malawi -3.0 -8.8 Mali -4.5 -5.0 Mauritania -6.8 -8.7 Mauritius -8.8 -1.3 Mozambique -9.1 -16.8 Namibia 18.5 6.0 Niger -11.0 -6.3 Nigeria 1.8 0.0 Rwanda -7.3 -7.0 São Tomé & Príncipe -41.2 -22.0 Senegal -9.6 -6.3 Seychelles -30.4 -11.9 Sierra Leone -6.7 -4.8 South Africa -6.7 -1.3 Sudan -10.7 -14.4 Swaziland 0.2 -0.7 Tanzania -10.6 -7.3 Togo -6.4 -6.4 Uganda -2.4 -4.7 Zambia -0.5 -8.2 Zimbabwe -0.9 -3.5 South Africa -6.1 -6.6 Sources: International Financial Statistics; and World Economic Outlook.
33
Table 13. Sub-Saharan Africa: Number of Regional Cross-listings of Stocks, 1992–2007
Country Countries Cross-Listed
Country of Primary listing Country of Secondary
Listing Company Month 1992 1993 1995 1997 1998 1999 2001 2003 2004 2005 2006 2007 WAEMU/Côte d'Ivoire 8 WAEMU countries 1/ All Sept. * Nigeria & Ghana Ecobank transnational June & Sept. * Kenya Uganda East African Breweries Mar. * Kenya Airways Mar. * Jubilee Insurance Feb. * Tanzania Kenya Airways Oct. * East African Breweries Jun. * Jubilee Insurance Dec. * Nigeria South Africa Oando Plc Nov. * South Africa Botswana Investec Oct. * Botswana Ellerine Mar. * Ghana AngloGold Ashanti April * Namibia Afrox Feb. * Anglo-American Jun. * Alexander Forbes Barloworld Sept. * Edgars Cons * Firstrand Jan. * Investec Oct. * JD Group Mutual and Federal Insurance Nov. * Metropolitan Holding Sept. * Nictus Oct. * Nedbank Group Feb. * Oceana Group Sept. * Old Mutual July * Sanlam Ltd Nov. * Santam Ltd Dec * Shoprite Holdings * Standard Bank Group Dec. * Trans Hex July * Wooltru Wooltru N Truworths Oct. * Vukile Jun. * Trans Hex Xemplar Energy Corp. NM Zambia Shoprite Holdings * Sources: Web sites of various stock exchanges. 1/ They are Benin, Burkina Faso, Côte d’Ivoire, Guinea-Bissau, Mali, Niger, Senegal, and Togo.
34
Table 14. Cross-Listing Events in Sub-Saharan Africa
No. Country/Stock Market Date Event 1 Botswana October 1997 Cross-listing of the JSE's Investec. 2 Botswana March 1998 Cross-listing of Ellerine. 3 Côte d'Ivoire/WAEMU June 2006 Announcement of Triple Cross-listing of Ecobank
Transnational. 4 Côte d'Ivoire/WAEMU September 2006 Actual triple cross-listing of Ecobank
Transnational. 5 Ghana April 2004 Cross-listing of AngloGold Ashanti on the JSE and
GSE after the merger of AngloGold of South Africa and Ashanti Goldfield of Ghana.
6 Ghana June 2006 Announcement of Triple Cross-listing of Ecobank Transnational.
7 Ghana September 2006 Actual Cross-listing of Ecobank Transnational . 8 Kenya March 2001 Cross-listing of East African Breweries with the
USE, Uganda. 9 Kenya March 2002 Cross-Listing of Kenya Airways on the USE,
Uganda. 10 Kenya October 2004 Cross-Listing of Kenya Airways on the DSE,
Tanzania. 11 Kenya June 2005 Cross-listing of East African Breweries on the
DSE, Tanzania. 12 Kenya February 2006 Cross-Listing of Jubilee Insurance on the USE,
Uganda. 13 Kenya December 2006 Cross-Listing of Jubilee Insurance on the DSE,
Tanzania. 14 Namibia October 1997 Cross-listing of Investec. 15 Nigeria June 2006 Announcement of triple Cross-listing of Ecobank
Transnational. 16 Nigeria September 2006 Actual Cross-listing of Ecobank Transnational. 17 Nigeria November 2006 Date of signing MOU with JSE South Africa and
Actual Cross-listing of Oando on the JSE. 18 South Africa November 1993 Cross-Listing of the JSE's Mutual and federal
Insurance with the NSX. 19 South Africa February 1995 Cross-Listing of the JSE's AFROX with the NSX. 20 South Africa October 1997 Cross-listing of Investec with the BSE and the
NSX. 21 South Africa March 1998 Cross-listing of Ellerine on the BSE. 22 South Africa November 2006 Date of signing MOU with JSE South Africa and
Actual Cross-listing of Oando on the JSE. Sources: Compiled from various stock exchanges.
35
Table 15. Event Study of Changes in Stock Market Developments around Other
Key Stock market Announcements
No. Country/Stock Market Date Event MCAPGDP 1 Botswana February 1998 The JSE offered the usage of its systems at
cost to the other exchanges in the SADC Committee of Stock Exchanges.
5.97 **
2 Côte d'Ivoire/WAEMU September 1998 Regional Integration of Stock market of the WAEMU.
3.54***
3 Kenya August 2005 Announcement of the East African Securities Exchanges Association (EASEA) working group decisions and recommendations on mass cross-listings of stocks.
1.38***
4 Kenya October 2006 Announcement of the EASEA working plan of a common trading floor.
2.79***
5 Namibia February 1998 The NSE commenced shared platform with the JSE.
4.78 ***
6 South Africa February 1998 The JSE offered the usage of its systems at cost to the other exchanges in the SADC committee of Stock Exchanges and the NSE commenced shared platform with the JSE.
1.311*
Sources: Compiled from various stock exchanges. Note: *, **, and *** represent significance at 1 percent, 5 percent, and 10 percent levels.
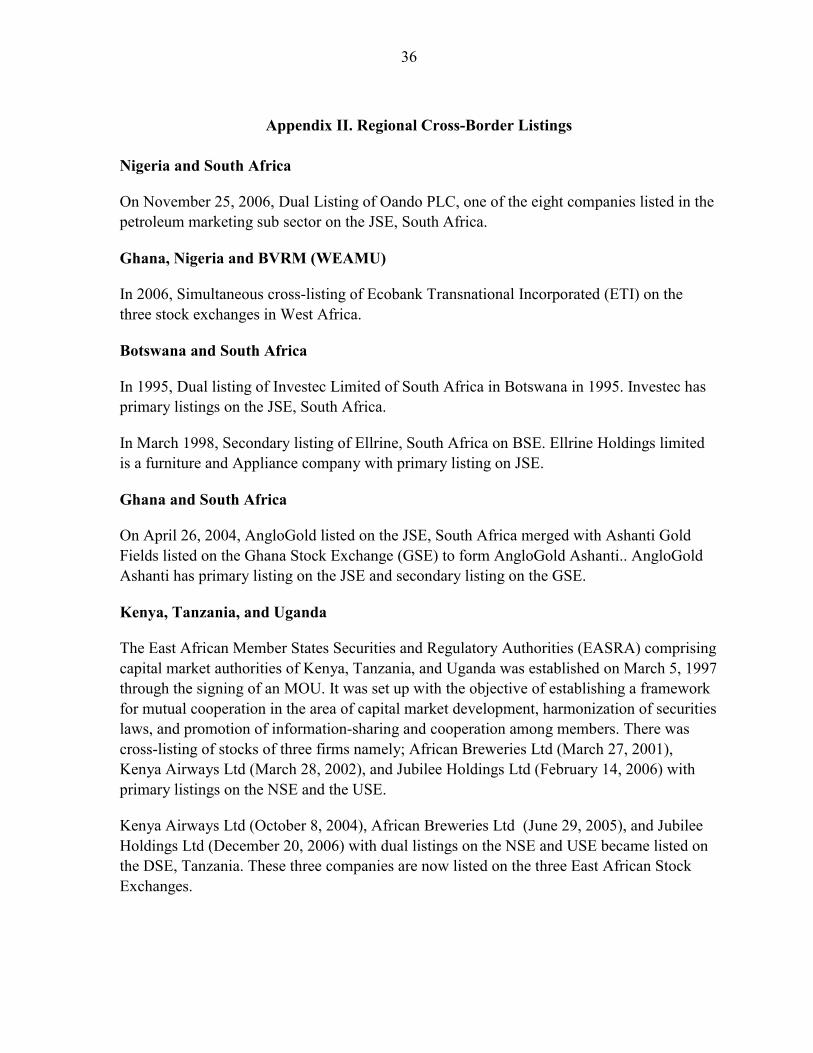
36
Appendix II. Regional Cross-Border Listings
Nigeria and South Africa
On November 25, 2006, Dual Listing of Oando PLC, one of the eight companies listed in the petroleum marketing sub sector on the JSE, South Africa.
Ghana, Nigeria and BVRM (WEAMU)
In 2006, Simultaneous cross-listing of Ecobank Transnational Incorporated (ETI) on the three stock exchanges in West Africa.
Botswana and South Africa
In 1995, Dual listing of Investec Limited of South Africa in Botswana in 1995. Investec has primary listings on the JSE, South Africa.
In March 1998, Secondary listing of Ellrine, South Africa on BSE. Ellrine Holdings limited is a furniture and Appliance company with primary listing on JSE.
Ghana and South Africa
On April 26, 2004, AngloGold listed on the JSE, South Africa merged with Ashanti Gold Fields listed on the Ghana Stock Exchange (GSE) to form AngloGold Ashanti.. AngloGold Ashanti has primary listing on the JSE and secondary listing on the GSE.
Kenya, Tanzania, and Uganda
The East African Member States Securities and Regulatory Authorities (EASRA) comprising capital market authorities of Kenya, Tanzania, and Uganda was established on March 5, 1997 through the signing of an MOU. It was set up with the objective of establishing a framework for mutual cooperation in the area of capital market development, harmonization of securities laws, and promotion of information-sharing and cooperation among members. There was cross-listing of stocks of three firms namely; African Breweries Ltd (March 27, 2001), Kenya Airways Ltd (March 28, 2002), and Jubilee Holdings Ltd (February 14, 2006) with primary listings on the NSE and the USE.
Kenya Airways Ltd (October 8, 2004), African Breweries Ltd (June 29, 2005), and Jubilee Holdings Ltd (December 20, 2006) with dual listings on the NSE and USE became listed on the DSE, Tanzania. These three companies are now listed on the three East African Stock Exchanges.
37
Namibia and South Africa
There has been cross-listing between the NSX and the JSE Securities Exchange of South Africa since 1992. At present, most of the stocks listed on the NSX have primary listings on the JSE, South Africa.
Zambia and South Africa In 2003, secondary listing of Shoprites, South Africa on the LUSE. Shoprites has primary listing on the JSE.
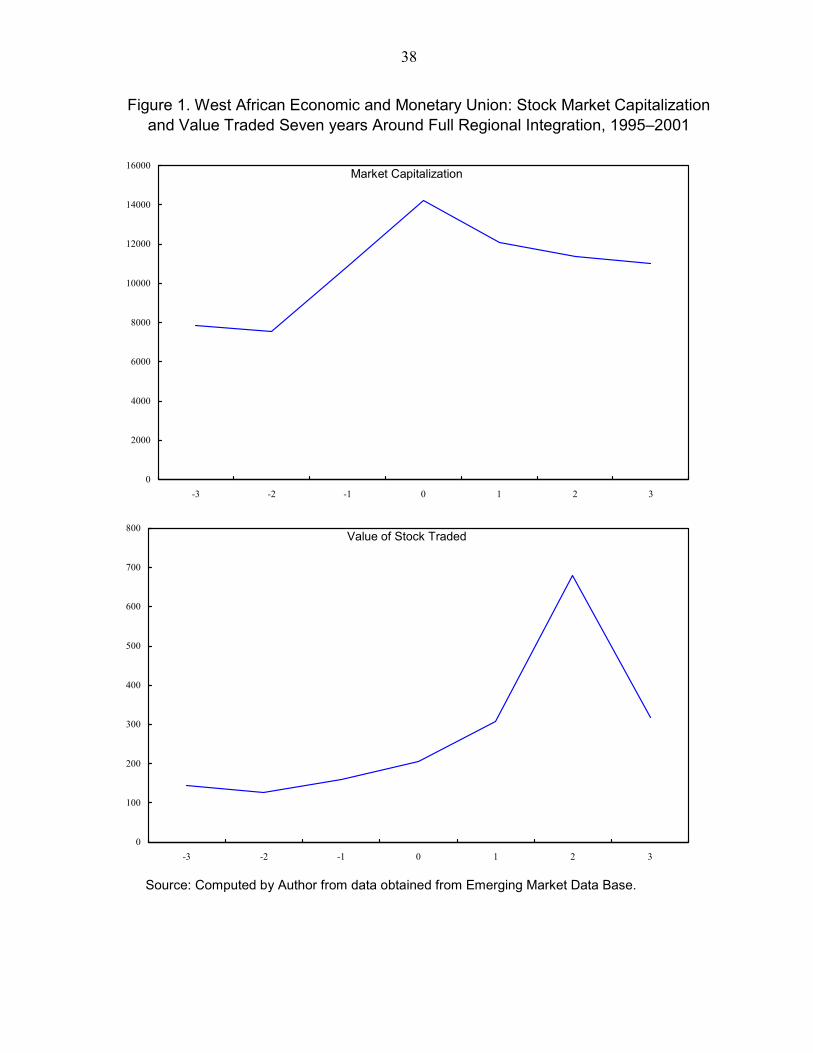
38
Figure 1. West African Economic and Monetary Union: Stock Market Capitalization and Value Traded Seven years Around Full Regional Integration, 1995–2001
Market Capitalization
0
2000
4000
6000
8000
10000
12000
14000
16000
-3 -2 -1 0 1 2 3
Value of Stock Traded
0
100
200
300
400
500
600
700
800
-3 -2 -1 0 1 2 3
Source: Computed by Author from data obtained from Emerging Market Data Base.
39
REFERENCES
Adelegan, O.J., forthcoming, Financial Integration, Capital Market Development and Investment Efficiency in Nigeria, African Review of Money, Finance, and Banking.
———, 2008, The Impact of Changes in Board Composition on Shareholders Wealth: Evidence from Nigeria, African Journal of Economic Policy. Vol. 15 (1), (June).
———, 2007a, Political Succession, Capital Market Performance and Firm Valuations in Nigeria, Ibadan Journal of the Social Sciences, Vol. 5(1), (March), pp 17–27.
———, 2007b, Capital Market Efficiency and The Impact of Board Changes on Shareholders Wealth in Nigeria,” Corporate Board, Roles, Duties and Compositions, Vol. 3(2), (April-July), pp 7–23.
———, 2006a, Market Reactions to Initiations and Omissions of Dividend on the Nigerian Stock Market, Ibadan Journal of the Social Sciences, Vol. 4(1), (March), pp 47–59.
———, 2006b, Price Reactions to Dividend Policy Changes on the Nigerian Stock Market, African Journal of Economic Policy, Vol. 13(2), (December), pp 59–79.
———, 2003, Capital Market Efficiency and The Effects of Dividend Announcement on Share Prices in Nigeria, African Development Review, Vol. 15(2 and 3), (December), pp. 218–236.
Adam, K., T. Jappelli, A. Menichini, M. Padula, M. Pagano, 2002, “Analyze, Compare, and Apply Alternative Indicators and Monitoring Methodologies to Measure the Evolution of Capital Market Integration in the European Union,” CSEF, Vol. 77 (January), (Salerno: Centre for Studies in Economics and Finance).
Arellano, M and S. Bond 1991, “Some Tests of Specification for Panel Data: Monte Carlo Evidence and an Application to Employment Equations,” Review of Economic Studies, Vol. 58, pp. 277–97.
Arellano, M and O. Bover, 1995, “Another look at the Instrumental-Variable Estimation of Error-Components Models, Journal of Econometrics, 68, pp. 29–52.
Agarwal, S., 2001, “Stock Market Development: Preliminary Evidence from African Countries,” Journal of Sustainable Development in Africa, 3(1), pp. 48–56.
Atje, R. and J. Boyan, 1993, “Stock Markets and Development, European Economic Review, Vol. 37(2/3) (April), pp. 632–640.
Bagehot, W.,1873, Lombard Street: A Description of the Money Market (1992 ed.). (Irwin: Homewood, IL).
Balgati, B., 2002, Econometric Analysis of Panel Data, (John and Wiley & Sons Inc., NY).
40
Beaver, W., 1968, ‘Information Content of Annual Earnings Announcements,’ Empirical Research in Accounting: Selected Studies, 1968, Journal of Accounting Research, Supplement to Vol. 6, pp. 67–92.
Beck, T., R. Levine, and N. Loayza, 2000, “Finance and the Sources of Growth,” Journal of Financial Economics, Vol. 58, pp. 261–300.
Bekaert, G., C.R. Harvey, and C. Lundblad, 2001, “Emerging Equity Markets and Economic Development”, Journal of Development Economics, Vol. 66(2), pp. 465–504.
Blundell, R.W. and S.R. Bond, 1998, “Initial Conditions and Moment Restrictions in Dynamic Panel Models,” Journal of Econometrics, Vol. 87, pp. 115–143.
Bonnier, K and Bruner, R.F., 1989, “An Analysis of Stock Price Reactions to Management Change in Distressed Firms,” Journal of Accounting and Economics, 11, 95–106.
Claessens, S., D. Klingebiel, and S. Schmukler, 2002, “Explaining the Migration of Stocks from Exchanges in Emerging Economies to International Centres,” Center for Economic Policy Research Working Paper No. 3301.
Cho, Y., 1988, “The Effect of Financial Liberalization on the Efficiency of Credit Allocation: Some Evidence for Korea,” Journal of Development Economics, Vol. 29, pp. 101–110.
Demirguc-Kunt, A., T. Beck, and P. Honohan, 2008, Finance for All? Policies and Pitfalls in Expanding Access, A World Bank Policy Research Report, (Washington: The World Bank).
Deverux, M.B. and G.W. Smith, 1994, “International Risk Sharing and Economic Growth,” International Economic Review, Vol. 35, (2), pp. 535–550.
Domowitz, I., J. Glen, A. Madhavan, 1998), “International Cross-Listing and Order Flow Migration: Evidence from an Emerging Market,” The Journal of Finance, Vol. 53, No. 6, (December). pp. 2001–2027.
Easterly, W., 2003, “Can foreign Aid Buy Growth?,” Journal of Economic Perspectives, Vol. 17(3), pp. 23–48.
Fama, F.F., 1991:“Efficient Capital Market II,” The Journal of Finance, Vol. 46, No. 5, Dec. 1991, pp. 1575–1617.
Faruqee, H., 2007, “Equity Market Integration,” in Decressin J, .H. Faruqee, and W. Fonteyne eds., Integrated Europe’s Financial Market, (Washington: International Monetary Fund), pp. 86-120.
41
Fox, A.F and Opong, K.K 1999: “The Impact of Board Changes on Shareholders Wealth: Some U.K. Evidence" Corporate Governance An International Review, Papers, Vol. 7, Number 4, Blackwell Publishers, United Kingdom.
Gupta, S., C. Pattillo, and S. Wagh, 2007, “Impact of Remittances on Poverty and Financial Development in Sub-Saharan Africa,” IMF Working Paper 7/38 (Washington: International Monetary Fund).
Gurley, J. and E. Shaw, 1967, “Financial Structure and Economic Development,” Economic Development and Cultural Change, Vol. 34, pp. 333–346.
Giovanni, S.F., 2004: “Estimation, Inference and Monte Carlo Analysis in Dynamic Panel data Models with a Small Number of Individuals,” (Milano: Instituto di Economia Politica).
Greene, W.H., 2003: Econometric Analysis , 5th ed.(Upper Saddle River, NJ: Pearson Education, Inc.)
Hargis, K., 2000, “International Cross-Listing and Stock Market Development in Emerging Economies,” International Review of Economics and Finance, Vol. 9, pp. 101–122.
Hargis, K., and P. Ramanlal, 1998: “The Internationalization of Equity Markets: Domestic Market Development or Retardation? Journal of Financial Intermediation Vol. 7, pp. 263–292.
Henry, P.B., 2000, “Do Stock Market Liberalizations Cause Investment Booms? Journal of Financial Economics,” Vol. 58, pp. 301–334.
Honohan, P. and T. Beck, 2007, Making Finance Work for Africa, (Washington: The World Bank).
Jayakumar, V, 2002,: “Impact of International Cross-listing on Local Exchanges: Evidence from Chile.” International Review of Finance, Vol. 3 (3/4), pp. 189–211.
Karolyi, G.A, 2004, The Role of American Depositary Receipts in the development of Emerging Equity Markets, The Review of Economics and Statistics, August, 86(3), pp. 670–690.
Kenny, C.J. and T.J. Moss, 1998, “Stock Markets in Africa: Emerging Lions or White Elephants?” World Development, Vol. 26 (5), pp. 829–843.
King, R. and R. Levine, 1993, “Finance and Growth: Schumpeter Might be Right” Quarterly Journal of Economics, Vol. 108, pp. 717–737.
42
Laeven, L., 2001, “Financial Liberalization and Financing Constraints: Evidence from Panel Data on Emerging Economies,” World Bank Working Paper Series (Washington: The World Bank).
———, 2003, “Does Financial liberalization Reduce Financing Constraints?” Financial Management, Spring, pp. 5–34.
Levine, R., 2005, “Finance and Growth: Theory and Evidence,” in Handbook of Economic Growth, eds. by Aghion P and S. Durlauf (Amsterdam: Elsevier).
Levine, R. and S. Zervos, 1998, “Stock Markets, Banks, and Economic Growth,” American Economic Review, Vol. 88, pp. 537–558.
Levine, R and S. Schmukler, 2003, Migration, Spillover and Trade Diversion: The Impact of Internationalization on Stock Market Liquidity,” University of Minnesota Working Paper.
Luintel, K.B. and M. Khan, 1999, “A Quantitative Reassessment of the Finance-Growth Nexus: Evidence from a Multivariate VAR,” Journal of Development Economics, Vol. 60, pp. 381–405.
Lynch, D., 1995, “Does Financial Sector Development Matter to Investment?” Savings and Development, Vol. 1.
MacKinlay, A.C., 1997, “Event studies in Economics and Finance,” Journal of Economic Literature, Vol. 35 (March), pp. 13–39.
May, R., 1971, “The Influence of Quarterly Earnings Announcements on Investors Decisions as Reflected in Common Stock Price Changes,” Empirical Research on Accounting: Selected Studies, Supplement to Vol.9 of the Journal of Accounting Research, pp. 119–163.
Mckinnon, R.,1973, Money and Capital in Economic Development, (Washington: Brookings Institution).
Misati, R.N., 2007, “Liberalization, Stock Market Development and Investment Efficiency in Africa,” paper presented at the CSAE Conference, University of Oxford March 18–20.
Miller, D., 1999, “The Market Reaction to International Cross-Listings: Evidence from Depository Receipts,” Journal of Financial Economics, Vol. 51, pp. 103–123.
Moel, A., 2001, “The Role of American Depositary Receipts in the Development of Emerging Markets,” Economia Vol. 2(1), pp. 209–257.
Moss, T., 2003, Adventure Capitalism: Globalization and the Political Economy of Stock Markets in Africa, (London: Palgrave Macmillian).
43
Ndebbio, J.E., 2004, “Financial Deepening, Economic Growth and Development: Evidence from Selected Sub-Saharan African Countries,” AERC Research Paper 142 (AERC).
Ndikumana, L., 2000, “Financial Determinants of Domestic Investment in Sub-Saharan Africa: Evidence from Panel Data,” World Development, 28(2), pp. 381–400.
Nigerian Stock Exchange, “Nigerian Stock Exchange Fact Books,” various issues, Nigerian Stock Exchange.
Nnanna, O.J., 2006, “Economic and Monetary Integration in Africa,” a paper presented at the G4 meeting in Singapore, on September 14.
Obstfeld, M., 1994, “Risk Taking, Global Diversification and Growth,” American Economic Review, Vol. 84(5), pp. 1310–1329.
Okeahalam, C., 2001,”Strategic Alliances and Mergers of Financial Exchanges: The Case of SADC,” presented at the Fourth Annual Conference for the Study of African Economies, Oxford University, March 19–31.
Osinubi, T. and L. Amaghionyeodiwe, 2003, “Stock Market Development and Long-Run Growth in Nigeria,” Journal of African Business, Vol. 4(3), pp. 103–129.
Oxford Analytica, 2007, Sub-Saharan Africa key Issues to 2012—A Syndicated Research Study (Oxford Analytical Ltd).
Patell, M.P., 1976: “Corporate Forecast of Earnings Per Share and Stock Price Behavior: Some Empirical Evidence,” Journal of Accounting (Autumn), 246–276.
Rajan, R., and L., Zingales, 2003, “The Great Reversals: The Politics of Financial Development in the 20th Century,” Journal of Financial Economics, 69(1), pp. 5–49.
Shah, H., A. Carvajal, G. Bannister, J. Chan-Lau, and I. Guerra, 2007, “Equity and Private Debt Markets in Central America, Panama, and the Dominican Republic,” IMF Working Paper 07/288 (Washington: International Monetary Fund).
Shaw, E., 1973, Financial Deepening in Economic Development (New York: Oxford University Press).
Tahari, A., P. Brenner, E.D Vrijer, M. Moretti, A.S. Senhadji, G. Sensenbrenner, and J. Sole, 2007, “Financial Sector Reforms, Prospects for Financial Integration in Maghreb Countries,” IMF Working Paper 07/125 (Washington: International Monetary Fund).
Tobin, J., 1984, “On the Efficiency of the Financial System,” Fred Hirsch Memorial Lecture, New York, Lloyds Bank Review, No. 153 (July), pp. 1–15.
44
World Bank, 2002, “Capital Market Integration in the East African Community,” (Washington: The World Bank).
Wurgler, J., 2000, “Financial Markets and the Allocation of Capital,” Journal of Financial Economics, 58, pp. 187–214.
Yartey, C.A. and C.K. Adjasi, 2007, “Stock Market Development in Sub-Saharan Africa: Critical Issues and Challenges,” IMF Working Paper 07/209 (Washington: International Monetary Fund).