canadian banks 2012 - perspectives on the canadian - pwc
TRANSCRIPT
www.pwc.com/ca/canadianbanks
Canadian Banks 2012Perspectives on the Canadian banking industry

2 Canadian Banks 2012
The firms of the PricewaterhouseCoopers global network (www.pwc.com) provide industry-focused assurance, tax and advisory services to build public trust and enhance value for clients and their stakeholders.
More than 169,000 people in 158 countries across our network share their thinking, experience and solutions to develop fresh perspectives and practical advice.
In Canada, PricewaterhouseCoopers LLP (www.pwc.com/ca) and its related entities have more than 5,700 partners and staff in offices across the country.

Perspectives on the Canadian banking industry 3
PwC is pleased to present the 2012 edition of Canadian Banks.
This edition of Canadian Banks reviews the 2011 financial results for the Big Six. We also take an in-depth look at some of the business impacts of regulatory changes.
Canada’s banks continued to perform well despite the turmoil in Europe over rising sovereign debt levels and the economic uncertainty in the United States. Canadian banks posted their third consecutive year of higher earnings following the 2008 global financial crisis. Many banks reported record profits.
Regulatory reform continues to increase costs and create uncertainty as various new regulations get finalized. Basel III, Dodd-Frank including the Volcker Rule, and FATCA will require banks to adapt to a changing regulatory landscape with capital, business model and resource implications. As you know, Canadian banks are actively reviewing the implications and taking action in order to meet these new regulatory requirements.
We hope you find this publication helpful and look forward to your feedback.
Bill McFarland CEO and Canadian Senior Partner PwC Canada
A message from our CEO and senior partnerBill McFarland

4 Canadian Banks 2012
ContentsPerspectives
Consumer lending survey 2012
2011 economic highlights
Analysis of 2011 results
Continued capital strength
Credit losses
Results by business segment
Market capitalization
Snapshot of the Big Six
Outlook
Appendix
Financial Services publications
Financial Services leadership team
06162026293235404257607678

Perspectives on the Canadian banking industry 5

Perspectives01
Regulatory risk is significant and banks are devoting considerable resources towards these new rules.

Perspectives on the Canadian banking industry 7
The occurrence of a financial crisis is nothing new. History has taught us that economies are prone to sharp market declines, bank runs and loss of consumer confidence. Deflating speculative bubbles are also not a new concept. The stock market crash of 1929, the dot-com bubble in 2000, and even Dutch tulip mania of the 1600s all shared similar characteristics. This all might lead one to wonder why market observers couldn’t have seen and prevented the recent financial crisis from taking shape.
The Group of Twenty (G20) countries was formed in 1999 to specifically address financial stability concerns arising from another financial crisis, in particular the 1997 Asian financial crisis. The group’s aim was to “broaden the dialogue on key economic and financial policy issues among systemically significant economies and promote cooperation to achieve stable and sustainable world economic growth that benefits all.”
Changes in technology, government trade policies, and the expansion of emerging markets had created new demands on government policy. Specifically, there was a growing need to address risks created by the integration of the global economy and financial markets. These risks did not diminish over the next decade and as the 2008 financial crisis demonstrated, the risk of events happening at one end of the globe can instantly impact markets thousands of miles away.
After meetings in Washington in November 2008 and in London in April 2009, the G20 agreed to expand the Financial Stability Forum, which was created by the G7 in 1999. The mandate of the new Financial Stability Board (FSB) included, among other aspects, assessing vulnerabilities in the financial system, promoting co-ordination between authorities responsible for financial stability, and advising on
market developments and their implications for regulatory policy. One clear theme of the mandate was that regulators could no longer act alone as the integrated global market required an enhanced, coordinated approach.
In September 2009, the FSB released its framework on Improving Financial Regulation. Early in the report, the FSB called out on G20 leaders to support international policy development and to “signal their determination to implement fully and consistently the reforms at national levels.” The details proposed changes to the quality and quantity of banks’ capital, reducing the moral hazard posed by systemically important institutions, strengthening the over-the-counter (OTC) derivatives market, and improving global liquidity.
With that began a tsunami of regulatory reform, being thrust upon the global integrated market economy. However, despite the importance of global consistency being stressed, what we are now seeing a little more than two years later is that protectionist pressures, driven by differences in legal frameworks, is having a significant impact on each country’s ability to implement these reforms. As a result, many are taking a jurisdictional approach for the actual implementation, rather than a global approach.

8 Canadian Banks 2012
Basel III
One of the cornerstones of the regulatory reform is the implementation of Basel III, developed by the Basel Committee on Banking Supervision. Basel III raises both the quality and quantity of the required regulatory capital base and enhances the risk coverage of the Basel II capital framework to capture major on-and off-balance sheet risks. It also strengthens the quality, consistency, and transparency of the capital base by defining and limiting the types of eligible capital instruments. Furthermore, it introduces significant new regulatory requirements for bank liquidity, net stable funding, leverage, counterparty credit risk, and conservation. Countercyclical buffers which “dampen” the pro-cyclical effects of Basel II minimum capital requirements were also introduced. One of the drawbacks noted of Basel II was that provisions increased in bad times but fell in good times. This prevented banks from building up an appropriate level of protection to prepare for economic downturns.
Basel III also addresses systemic risk and lack of transparency within the financial sector, including strong incentives for banks to move exposures to central clearing parties. It places higher risk weights on highly correlated exposures to financial institutions and adds measures to mitigate reliance on external credit ratings, and additional loss-absorbing capacity for systemically important banks.
While the Basel III rules may be global, it is up to each local regulator to oversee its implementation. With a January 1, 2013 start date for the phased in implementation, a lot of work is left to be done. Global debates are currently ongoing, discussing how the impacts of Basel III will be felt by each country. In Canada, the Office of the Superintendent of Financial Institutions (OSFI) is expected to release draft regulations in May 2012, with final guidance before the end of 2012.
Basel III will be challenging to implement, but Canadian banks are starting from a good position to adopt the provisions of Basel III compared to other international banks. The concept of deleveraging to meet these targets for some banks can lead to reduced credit availability in that country, hampering attempts at economic recovery. In Europe, European banks are purchasing sovereign debt at the request of the European Central Bank. These purchases will make it harder for those banks to meet Basel III targets if the quality of the debt does not improve. It also is counter-intuitive with the premise under Basel III of reducing risk, as additional capital will be required to be set aside to cover the potential for losses in riskier assets such as European sovereign debt.
Basel III phase-in will commence in Canada starting on January 1, 2013.

Perspectives on the Canadian banking industry 9
With banks being required to hold higher quality and greater levels of capital, there will be business implications. Larger levels of higher quality capital on the balance sheet of a bank generally produces lower levels of return. With banks holding greater levels of this capital, shareholder returns could be impacted. In terms of the type of capital being issued, Canadian banks last February responded to an OSFI release regarding the phase-out of certain non-qualifying capital instruments. These instruments contained redemption rights which could be triggered if a regulatory event occurred which changed their capital treatment. The banks clarified that they would not be redeeming these instruments during the Basel III phase-in period. By the time Basel III is fully implemented, these innovative capital instruments will no longer be recognized as regulatory capital, and as a result can no longer be issued by the banks seeking to increase their regulatory capital levels.
While still in the implementation stage for Basel III and with many hurdles still to be passed, the global market appears to be attempting to meet the FSB’s goal of having consistency at national levels. However, the same cannot be said for other regulations being developed on a country-by-country basis.
Regulatory Change
Key existing or emerging areas of regulatory direction also include the creation of living wills to ensure an orderly resolution process should a bank fail to protect the financial system. European proposed regulations such as the European Markets Infrastructure Regulation (EMIR) and the Markets in Financial Instruments Directive (MiFID) II to address OTC and trading reform have been designed with a view to strengthen market infrastructure and enhance transparency and disclosure.
The American Dodd-Frank Wall Street Reform and Consumer Protection Act (Dodd-Frank), enacted in July 2010, promises to impact almost every segment of the US financial services sector. However, it required significant rulemaking to take place to allow the implementation of the framework described in the act to occur. Dodd-Frank impacts not only every segment of the US financial services industry, but also impacts financial institutions that deal with banks with US operations in ways that may not have been fully anticipated. This can be seen most recently in discussions relating to one aspect of Dodd-Frank, the Volcker Rule.

10 Canadian Banks 2012
Volcker Rule
The Volcker Rule places prohibitions on banking entities from engaging in proprietary trading and certain relationships with hedge funds and private equity funds. Running throughout the Volcker Rule is the presumption that acting as “principal” is “speculating,” except where the rule says it is not. As a result, this could significantly change the economics of firms’ capital markets and trading businesses.
The comment period for the rule closed in January 2012 with significant feedback being received from financial institutions globally. OSFI and the five major Canadian banks delivered comment letters on the proposed rule to the US lawmakers expressing a number of concerns that would impact their banking operations.
OSFI conveyed that the proposal as it currently stands could potentially “hinder the ability of foreign financial institutions to efficiently manage their risks” as a number of the core systems utilized by the Canadian banks are US-based and therefore would be impacted by the Volcker Rule. This includes systems used for clearing and settling US transactions, US exchanges, and US-owned infrastructure.
In addition, OSFI noted that the current rule would only allow proprietary trading by banking entities in US Treasury, state, and municipal general, limited and pass-through obligations. Other foreign government securities currently don’t have an exemption.
The rule sees these types of transactions in the light of a “principal” relationship or “speculation” as they are trading for profit while putting their own capital at risk. However, as the Canadian banks play a key role in market-making for government securities in Canada, these transactions are multi-purpose. Restrictions in this area could impact liquidity and funding requirements.
The five largest Canadian banks expressed that rules relating to the definition of a “covered fund” would restrict the ability for investors, that might reside in the US, such as “snowbirds”, to continue to invest in certain Canadian bank-sponsored mutual funds.
OSFI and the five major Canadian banks delivered comment letters on the proposed rule to the US lawmakers expressing a number of concerns that would impact their banking operations.

Perspectives on the Canadian banking industry 11
FATCA
In an effort to stem increasing cases of income tax evasion by US persons subject to US tax and the difficulty of accessing foreign-based information due to foreign law privacy constraints, the US Government passed the Hiring Incentives to Restore Employment Act (HIRE) in 2010. Included in the legislation was the Foreign Account Tax Compliance Act (FATCA). FATCA’s objective is identifying US persons who
(i) directly own financial accounts at or investments in non-US financial institutions to earn income from the underlying investments, or
(ii) own directly or indirectly non-US entities having such accounts or investments.
Under this legislation, foreign financial institutions are broadly defined to include those accepting deposits, holding financial assets for the account of others, or engaged primarily in the business of investing or reinvesting in securities or derivatives.
Such institutions are subject to 30% withholding tax on the receipt of US source income (e.g., interest and dividends) and gross proceeds from the sale of US debt or equity interest (collectively “withholdable payments”) unless the institution enters into an agreement with the Internal Revenue Service (IRS) to identify and report on its existing and new US accountholders. Upon review of the institution’s client data and after application of specified due diligence procedures, those with actual or potential US indications who do not clarify their status, US persons refusing to provide privacy waivers, and other foreign financial institutions not entering into such agreements with the IRS will be subject to withholding on payments made to them by the financial institution. Some limited categories of foreign financial institutions considered at low risk for use by US persons for tax evasion will be exempt from FATCA withholding on payments they receive. An example of this latter category includes wholly owned government instrumentalities and certain pension plans.
To combat the use of non-US entities by US persons to own financial assets, a withholding agent will be required to withhold 30% on withholdable payments unless the entity certifies that it has no substantial US owners or provides the identification of such persons. Withholding agents will provide the ownership information to the IRS.

12 Canadian Banks 2012
While the legislation is relatively straightforward, the proposed regulations released on February 8, 2012 still leave many issues unanswered and contentious areas are deferred for additional industry consultation. What is clear is that, while the regulations attempt to take in to account industry comments to make the application of FATCA more practical, the drive for transparent government reporting is gaining momentum internationally. The FATCA regulations provide financial institutions with sufficient clarity to move forward to enter into agreements with the IRS and make the necessary systems and processes changes for an expected effective date of July 1, 2013.
Implementing FATCA may result in financial institutions incurring costs to:
• Change customer on-boarding systems and processes to include new data and supporting documentation necessary to classify the customer’s FATCA status;
• Examine existing client account data to identify US persons;
• Develop new or expanded withholding and reporting systems;
• Develop systems to calculate and publish quarterly information regarding the composition of US and non-US assets;
• Educate personnel and customers regarding the new requirements; and
• Update derivative contracts to address FATCA withholdings and confirm the counterparty’s FATCA status.
OTC derivatives
In relation to OTC derivatives, the G20 leaders agreed in September 2009 that “All standardized OTC derivative contracts should be traded on exchanges or electronic trading platforms, where appropriate, and cleared through central counterparties by end-2012 at the latest. OTC derivative contracts should be reported to trade repositories. Non-centrally cleared contracts should be subject to higher capital requirements.”
The aim of these requirements was to “improve transparency in the derivatives markets, mitigate systemic risk, and protect against market abuse.” Each country must take steps to ensure that their jurisdiction can ensure compliance with the G20 agreement.

Perspectives on the Canadian banking industry 13
Rather than focus on the progress being made by Canada and other jurisdictions, we will focus on the potential business and market implications of the anticipated changes. One such impact is that for those companies that use derivatives, either to take exposure or mitigate risk, the cost of doing so will increase. This could be the result of needing to post margin with a central counterparty for centrally cleared transactions or providing collateral to an individual counterparty for bilateral transactions, where previously no collateral may have been posted.
As margin or collateral is generally required to be in a liquid form, for example, cash or liquid highly rated securities, this will require an ability for derivative users to turn assets into cash or equivalents to meet these margin or collateral requirements, potentially on short notice. While this ability has generally been required for banks today, expanding this to include all derivative counterparties will require this ability to be replicated at non-bank financial institutions and corporates alike.
The ability to manage collateral effectively will be a skill required by all companies that use derivatives and will be an ongoing cost going forward.

14 Canadian Banks 2012
Operational risk
Under Basel, banks can use one of three approaches to measure their level of operational risk. One of these approaches is the Advanced Measurement Approach (AMA), which many of the Canadian banks are working towards. The purpose of AMA is to enhance operational risk measurement and management. The AMA framework requires effective governance, risk capture and assessment, and quantification of operational risk exposure. The benefits of using AMA include a potential reduction in the operational risk capital charge as capital will be based on risk exposures and not income levels, improved risk culture and understanding of the risks faced by the institution, and improved reputation amongst stakeholders through the use of more advanced risk-management methodologies.
Given the pace of regulatory change, operational risk management is at a crucial point in its development. While institutions are struggling to make AMA fully effective and embedded into the day-to-day management of the business, regulatory change may further increase the operational risk profile for many institutions.
However, there could be unsuspected advantages in the upheaval across the financial world. Under AMA, operational risk-capital modeling allows for the understanding of the institution’s level of exposure to operational risk. One component of the capital model is the business environment and internal control factors which provide a more forward-looking view, recognizing both improvements and deterioration in operational-risk profiles. As a result, management actions, such as the investment in internal controls can be reflected in the operational-risk capital.
While regulatory change is pushing institutions into a more general overhaul of internal compliance systems, procedures, and internal controls, it is also a “cleansing” opportunity to have a more streamlined regime that focuses on efficient and effective internal controls. By taking a strategic approach to internal controls under AMA, many institutions have the opportunity to benefit by a reduction in operational risk capital.
As new regulation increases capital costs, the need to boost returns by reducing expenses and bolstering revenues will intensify. 15th Annual Global CEO Survey – Banking and Capital Markets sector summary

Perspectives on the Canadian banking industry 15
Summary
The level and pace of regulatory change impacting Canadian banks is significant. Currently, Canadian banks are assessing the potential impacts of these regulations, the emerging rules, and responding in several ways:
• Undertaking analysis of the potential operating and strategic implications, for their businesses, products, customers, and the Canadian financial system;
• Responding to proposed regulations via comments to the relevant regulatory bodies to ensure their views are heard on unintended consequences as individual banks and on an industry basis;
• Liaising with government bodies such as OSFI and the Bank of Canada where proposals would negatively impact the Canadian economy, such as the Volcker rule, to provide their perspectives and ask for their engagement on the issue; and
• Preparing for changed processes, systems and business models based on views formed on the proposed regulations.
Ryan Leopold
Audit and Assurance Partner
416 869 2594
Jason Boggs
Consulting & Deals Partner
416 941 8311
Michael Bondy
Banking and Capital Markets Tax Leader
416 365 2724
Elisabeth Burke
Consulting & Deals Partner
416 687 8589
Rani Turna
Consulting & Deals Partner
416 869 2911
Overall, the banks have demonstrated their ability to weather the changes in the economic and regulatory environment to date. This is demonstrated by the $23.6 billion in profits earned during 2011 by the largest six Canadian Banks. Their capital levels remain strong which helps provides stability in uncertain times. The uncertainty created by the vast range of regulatory changes and proposals adds significant layers of complexity to the system. This can make basic planning decisions difficult for the banks, let alone dealing with the ever changing macro-economic environment. However, as the rules are finalized, additional clarity will be provided. Until that point is reached we will see banks operating in an evolving landscape, both in Canada and abroad.
The weight of the proposed regulatory changes, including new capital and liquidity demands, is going to be a key factor in determining business plans, changing the cost profile of many banking products. 15th Annual Global CEO Survey – Banking and Capital Markets sector summary

Consumer lending survey 201202

Perspectives on the Canadian banking industry 17
Canadians continue to feel confident about their debt levels. However, this confidence has somewhat softened in the last year, according to our annual consumer lending survey. They appear to be more concerned about the level of debt they carry and have indicated that they intend to reduce their debt level over the next year.
The survey of 1,200 Canadians, which was conducted by Leger Marketing, finds that 59% of respondents think their debt level is about right. One-third think it’s too high while 4% say it’s too low and another 4% did not answer the question. The results are interesting considering data from the Bank of Canada indicating that consumer debt is at an all time high and Statistics Canada reporting that the debt-to-income ratio of Canadians has reached a record high of 153% in the third quarter of 2011. Consumers still seem to be relatively comfortable despite having a debt-to-income ratio that’s similar to levels in the United States. This comfort could be in part due to the economic and structural differences between the US and Canadian markets. Furthermore, the trends in other key indicators such as the debt-to-asset or debt servicing ratios are more favourable.
Compared to last year, the survey results indicate a softening of confidence as we observed a three percentage point increase in the number of Canadians who believe that their debt level is too high.
Confidence levels vary by demographic: most concerned are people aged 25 to 55 (41% think it’s too high). Those who earn more are more confident about their debt levels. Sixty-four percent of those surveyed with household incomes above $100,000 say their debt levels are about right.
Respondents seem to be listening to Bank of Canada governor Mark Carney, who has warned Canadians about rising consumer debt levels. The majority of those surveyed – 63% – want to decrease the amount of debt they carry over the next year. Nearly one-third intend to maintain their debt levels, while 4% actually intend to go deeper into debt. The intent to reduce debt was present regardless of the respondent’s comfort level with their debt.

18 Canadian Banks 2012
65%forego buying
new electronics
Similar to the sentiment of concern expressed when asked about their debt levels, we saw a 4.5 percentage point increase year over year in the number of respondents who indicated they wanted to reduce their level of debt. Those aged between 25 and 55, have children, and own their own home are more inclined to reduce their debt. Surprisingly, wealthier respondents strongly indicated they also want to reduce their debt. Those surveyed with household incomes of more than $100,000 indicated a stronger desire to reduce debt compared to lower-income respondents (68% vs. 58%).
Canadians are also more willing to cut back on discretionary spending. In order to reduce their debt, 70% said they would be willing to delay the purchase of a new car, 65% would forego buying new electronics, and 62% would delay buying a new house or upgrading their home. Compared to last year, consumers were more willing to postpone purchases in all categories, but this willingness was most pronounced in houses and cars.
Canadians continue to be content with their banks. When asked about the likelihood of switching primary banks in the next 12 months, 88% indicated that they are not likely to do so while 10% indicated that they are likely to switch and 2% did not answer. Compared to last year where 14% intended to switch, this indicates an improvement in customer sentiment.
70%willing to delay
purchase of a new car
62%willing to delay
buying a new house or upgrading
their home
Canadians are more willing to cut back on discretionary spending.

Perspectives on the Canadian banking industry 19
Banks may not have much pricing leeway to compete for customers on price so they will have to focus their attention on customer experience and product innovation.
Interestingly, the majority of respondents feel that their financial institution should play a role in helping them manage their level of debt. Eighty-two percent of respondents say banks should play a role in both determining the maximum amount of debt someone can responsibly take on and hold them to that limit. This was especially true of those with household incomes of more than $100,000 a year compared to those making less (85% vs. 71%).
Based on what Canadians have told us, we believe that banks will experience a slowdown in lending growth over the next 12 months, which will only serve to intensify competition for volume. Given the prolonged low interest rate environment, banks may not have much pricing leeway to compete for customers on price so they will have to focus their attention on customer experience and product innovation as means of differentiation. Furthermore, banks need to do so while being more efficient by managing the cost of delivery.
We will be releasing more detailed results from our second annual consumer lending survey later in March 2012. Visit www.pwc.com/ca/banking for more.
John MacKinlay
National Financial Services Consulting & Deals Leader
416 815 5117

Perspectives on the Canadian banking industry 20
Economic highlights03
While economic activity rebounded vigorously in the third quarter as these temporary factors were resolved, the economy continued to show signs of deceleration in the latter part of 2011.
Perspectives on the Canadian banking industry 21
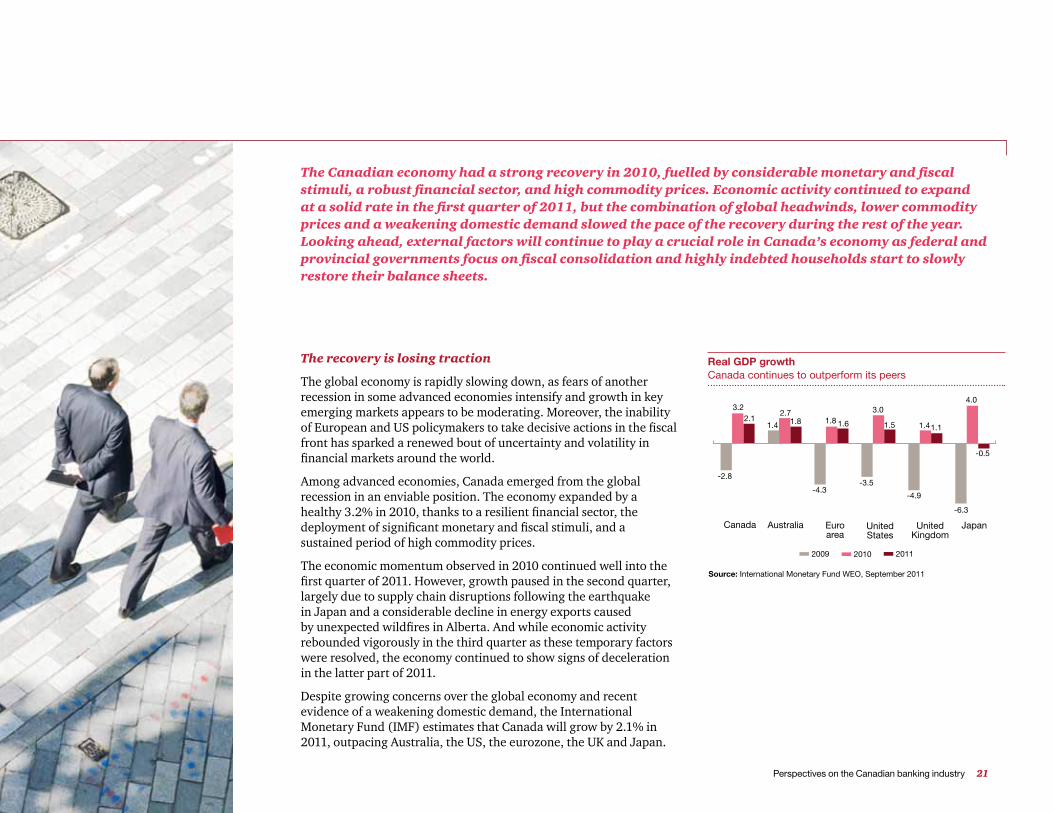
The Canadian economy had a strong recovery in 2010, fuelled by considerable monetary and fiscal stimuli, a robust financial sector, and high commodity prices. Economic activity continued to expand at a solid rate in the first quarter of 2011, but the combination of global headwinds, lower commodity prices and a weakening domestic demand slowed the pace of the recovery during the rest of the year. Looking ahead, external factors will continue to play a crucial role in Canada’s economy as federal and provincial governments focus on fiscal consolidation and highly indebted households start to slowly restore their balance sheets.
-8-7-6-5-4-3-2-101234
2010 20112009
Canada
-2.8
3.22.1
1.4
2.71.8 1.8 1.6
-4.3-3.5
-4.9
-6.3
1.41.1
4.0
-0.5
1.5
3.0
Australia Euroarea
UnitedKingdom
UnitedStates
Japan
Source: International Monetary Fund WEO, September 2011
Real GDP growth Canada continues to outperform its peers
The recovery is losing traction
The global economy is rapidly slowing down, as fears of another recession in some advanced economies intensify and growth in key emerging markets appears to be moderating. Moreover, the inability of European and US policymakers to take decisive actions in the fiscal front has sparked a renewed bout of uncertainty and volatility in financial markets around the world.
Among advanced economies, Canada emerged from the global recession in an enviable position. The economy expanded by a healthy 3.2% in 2010, thanks to a resilient financial sector, the deployment of significant monetary and fiscal stimuli, and a sustained period of high commodity prices.
The economic momentum observed in 2010 continued well into the first quarter of 2011. However, growth paused in the second quarter, largely due to supply chain disruptions following the earthquake in Japan and a considerable decline in energy exports caused by unexpected wildfires in Alberta. And while economic activity rebounded vigorously in the third quarter as these temporary factors were resolved, the economy continued to show signs of deceleration in the latter part of 2011.
Despite growing concerns over the global economy and recent evidence of a weakening domestic demand, the International Monetary Fund (IMF) estimates that Canada will grow by 2.1% in 2011, outpacing Australia, the US, the eurozone, the UK and Japan.

22 Canadian Banks 2012
Strong global headwinds ahead
As a small open economy, the fate of Canada depends in large part on the prospects of the global economy. In the near term, Canada faces several risks to its external environment, including growing concerns over the possibility of debt and banking crises in Europe, uncertainty surrounding economic growth in the US, and lower-than-expected economic activity in China and other large emerging markets.
The European sovereign debt crisis continued to unfold during 2011 and is threatening to spread into larger economies such as Italy and Spain. Europe’s inability to contain the crisis could pose a serious threat to the stability of the world banking system and global trade.
South of the border, Canada’s largest trading partner continues to struggle with a sluggish recovery; US growth in 2011 is estimated at a mere 1.6%. Moreover, the combination of a fragile labour market, a depressed housing market and a prolonged household deleveraging process is likely to hold back domestic demand well into 2012.
Finally, China and other emerging economies began to experience more sustainable rates of growth in the second half of 2011, in part thanks to monetary policy tightening policies introduced in the early part of the year. All these developments have also been reflected in lower demand for commodities and softer prices.
Some risks persist at home
In addition to successful accommodative fiscal and monetary policies, Canada was able to exit the global recession on firm footing thanks to strong private demand. Domestic consumption continued to be the engine of growth in 2011, albeit at a more moderate pace than in 2010. The unemployment rate, which reached a peak in August 2009 of 8.7%, continued to retreat gradually during the year, but still remains above pre-crisis levels.
The financial and corporate sectors retained a strong position during 2011. Bank profits are now back to pre-Lehman levels and business credit continues to grow, as firms take advantage of historically low funding costs. Additionally, capital ratios have remained at healthy levels and non-performing loans are well under control.
Canada was able to exit the global recession on firm footing.
Perspectives on the Canadian banking industry 23
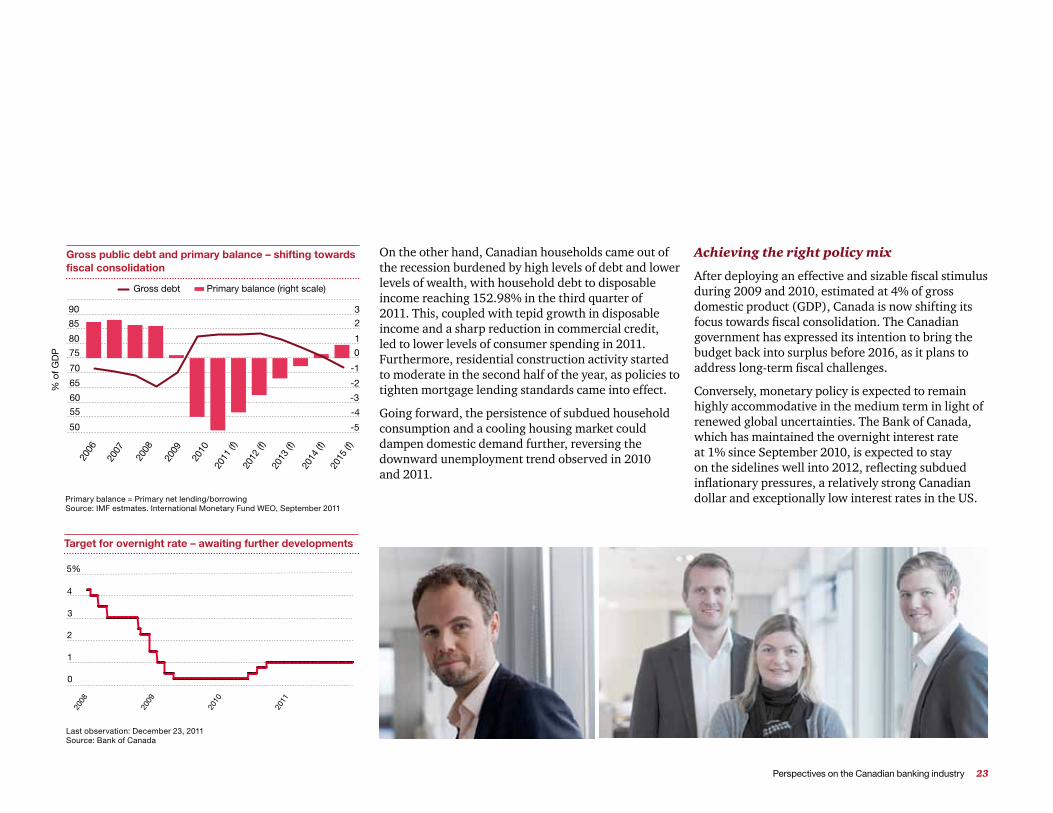
On the other hand, Canadian households came out of the recession burdened by high levels of debt and lower levels of wealth, with household debt to disposable income reaching 152.98% in the third quarter of 2011. This, coupled with tepid growth in disposable income and a sharp reduction in commercial credit, led to lower levels of consumer spending in 2011. Furthermore, residential construction activity started to moderate in the second half of the year, as policies to tighten mortgage lending standards came into effect.
Going forward, the persistence of subdued household consumption and a cooling housing market could dampen domestic demand further, reversing the downward unemployment trend observed in 2010 and 2011.
Achieving the right policy mix
After deploying an effective and sizable fiscal stimulus during 2009 and 2010, estimated at 4% of gross domestic product (GDP), Canada is now shifting its focus towards fiscal consolidation. The Canadian government has expressed its intention to bring the budget back into surplus before 2016, as it plans to address long-term fiscal challenges.
Conversely, monetary policy is expected to remain highly accommodative in the medium term in light of renewed global uncertainties. The Bank of Canada, which has maintained the overnight interest rate at 1% since September 2010, is expected to stay on the sidelines well into 2012, reflecting subdued inflationary pressures, a relatively strong Canadian dollar and exceptionally low interest rates in the US.Primary balance = Primary net lending/borrowing
Source: IMF estmates. International Monetary Fund WEO, September 2011
60
55
50
70
80
75
90
85
65
-3
-4
-5
0
-1
-2
1
23
60
80
100
-5-4-3-2-10123
2006
2008
2010
2012
(f)
2013
(f)
2014
(f)
2015
(f)
2011
(f)
2009
2007
Primary balance (right scale)Gross debt
% o
f GD
P
Gross public debt and primary balance – shifting towards fiscal consolidation
0
2
1
4
3
5%
0
1
2
3
4
5
2008
2009
2010
2011
2008
2008
-220
08-4
2008
-620
08-8
2008
-920
08-1
120
0920
09-3
2009
-420
09-6
2009
-820
09-1
020
09-1
120
1020
10-3
2010
-520
10-6
2010
-820
10-1
020
10-1
220
1120
11-3
2011
-520
11-7
2011
-820
11-1
020
11-1
2
Last observation: December 23, 2011 Source: Bank of Canada
Target for overnight rate – awaiting further developments
24 Canadian Banks 2012
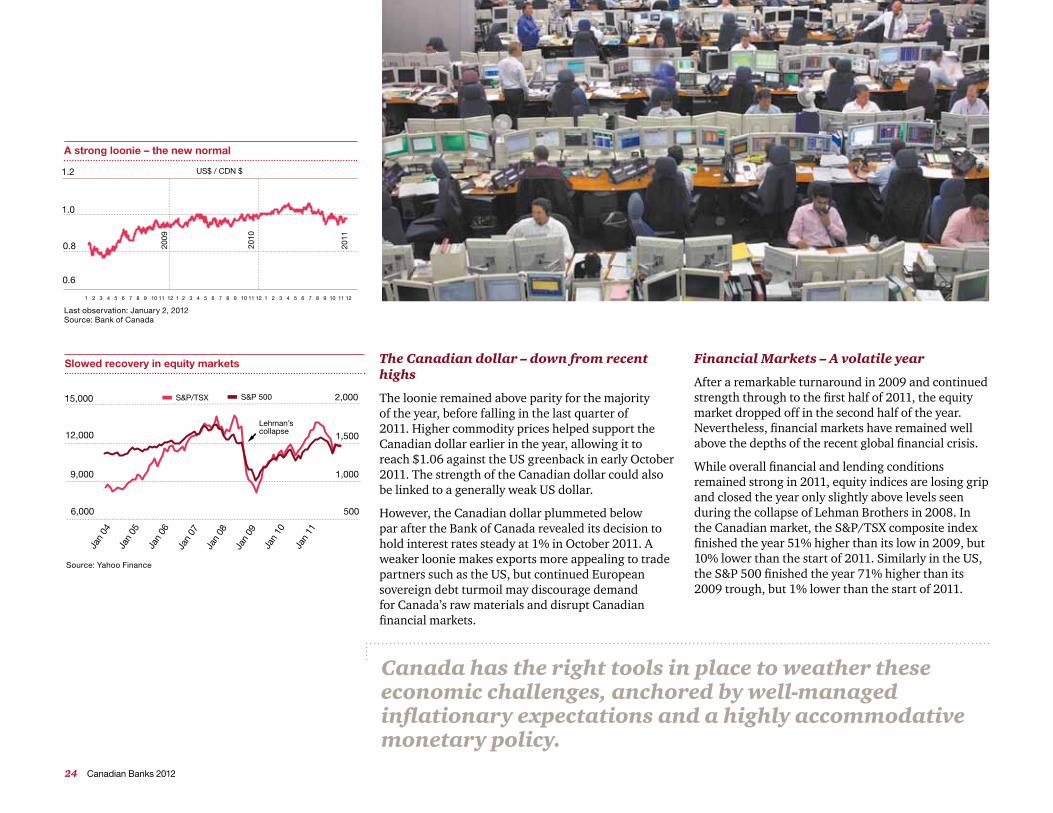
The Canadian dollar – down from recent highs
The loonie remained above parity for the majority of the year, before falling in the last quarter of 2011. Higher commodity prices helped support the Canadian dollar earlier in the year, allowing it to reach $1.06 against the US greenback in early October 2011. The strength of the Canadian dollar could also be linked to a generally weak US dollar.
However, the Canadian dollar plummeted below par after the Bank of Canada revealed its decision to hold interest rates steady at 1% in October 2011. A weaker loonie makes exports more appealing to trade partners such as the US, but continued European sovereign debt turmoil may discourage demand for Canada’s raw materials and disrupt Canadian financial markets.
Financial Markets – A volatile year
After a remarkable turnaround in 2009 and continued strength through to the first half of 2011, the equity market dropped off in the second half of the year. Nevertheless, financial markets have remained well above the depths of the recent global financial crisis.
While overall financial and lending conditions remained strong in 2011, equity indices are losing grip and closed the year only slightly above levels seen during the collapse of Lehman Brothers in 2008. In the Canadian market, the S&P/TSX composite index finished the year 51% higher than its low in 2009, but 10% lower than the start of 2011. Similarly in the US, the S&P 500 finished the year 71% higher than its 2009 trough, but 1% lower than the start of 2011.
Canada has the right tools in place to weather these economic challenges, anchored by well-managed inflationary expectations and a highly accommodative monetary policy.
6,000
9,000
12,000
15,000
500
1,000
1,500
2,000
6000
9000
12000
15000
500
1000
1500
2000
Jan
04
Jan
06
Jan
08
Jan
10
Jan
11
Jan
09
Jan
07
Jan
05
S&P 500S&P/TSX
Lehman’scollapse
Source: Yahoo Finance
Slowed recovery in equity markets
0.6
0.8
1.0
1.2
0.6
0.8
1.0
1.2
US$ / CDN $20
09
2010
2011
1 2 3 4 5 6 7 8 9 10 11 12 1 2 3 4 5 6 7 8 9 10 11 12 1 2 3 4 5 6 7 8 9 10 11 12
Last observation: January 2, 2012 Source: Bank of Canada
A strong loonie – the new normal

Perspectives on the Canadian banking industry 25
Contributing economists:
Diego Mesa Puyo
Economics and Statistics Practice, Vancouver
604 806 7119
Jessica Yu
Economics and Statistics Practice, Vancouver
604 806 7521
1 Bank of Canada Monetary Policy Report, January 2012
0
1
2
3
4
5
0
1
2
3
4
5
0
1
2
3
4
5
6
0
1
2
3
4
5
6
6%
3-month Canadian dollar offering rate5 year debt swaped into 3 month floating rate debt
3-month overnight index swap
Jul 0
7O
ct 0
7Ja
n 08
Apr 0
8Ju
l 08
Oct
08
Jan
09Ap
r 09
Jul 0
9O
ct 0
9Ja
n 10
Apr 1
0Ju
l 10
Oct
10
Jan
11Ap
r 11
Jul 1
1
Notes: The 3-month CDOR is the average bid-side rate for Canadian bankers’ acceptances determined daily from a survey of market makers and can be used as a proxy for the cost of 3-month bank funding. Five-year debt swapped into 3-month floating rate debt is an indicator of the rate for senior deposit notes, and provides an indication of the longer-term cost of bank funding. The 3-month OIS rate represents the expected overnight interest rate over the 3-month period and can be used as a point of reference to compare the two measures of the cost of wholesale bank funding.
Source: Bank of Canada
3-month overnight index swap
Notes: The effective interest rate for households is a weighted-average of various mortgage and consumer credit interest rates. The weights are derived from residential mortgage and consumer credit data, adjusted for additional information provided by financial institutions. The effective interest rate for businesses is a weighted-average borrowing rate for new lending to non-financial businesses, estimated as a function of bank and market interest rates. The weights are derived from business credit data.
Source: Bank of Canada
3
4
5
6
7
8%
3
4
5
6
7
8
3
4
5
6
7
8
Jan
07Ap
r 07
Jul 0
7O
ct 0
7Ja
n 08
Apr 0
8Ju
l 08
Oct
08
Jan
09Ap
r 09
Jul 0
9O
ct 0
9Ja
n 10
Apr 1
0Ju
l 10
Oct
10
Jan
11Ap
r 11
Jul 1
1O
ct 1
1
Business effective interest rate
Household effective interest rate
Weekly effective interest rates
Outlook for the Canadian economy
As a result of weakening external demand and moderating household spending, the outlook for the Canadian economy has darkened compared to the prospects faced in early 2011. Continued risks from financial markets turmoil, linked to the European debt crisis, along with high levels of household indebtedness and fiscal consolidation are likely to hamper consumer and business confidence in the near term. Moreover, the persistent strength of the Canadian dollar, coupled with a very fragile recovery in the US and moderating growth in key emerging economies could restrain export performance in 2012, further tempering the speed of economic growth.
However, Canada has the right tools in place to weather these economic challenges, anchored by well-managed inflationary expectations and a highly accommodative monetary policy. The Bank of Canada is calling for growth of 2.0% in 2012 followed by 2.8% in 2013. Canadian banks are expected to remain well capitalized in 2012, with high levels of liquidity and easily accessible funding at relatively low rates by global standards.

Analysis of 2011 results04
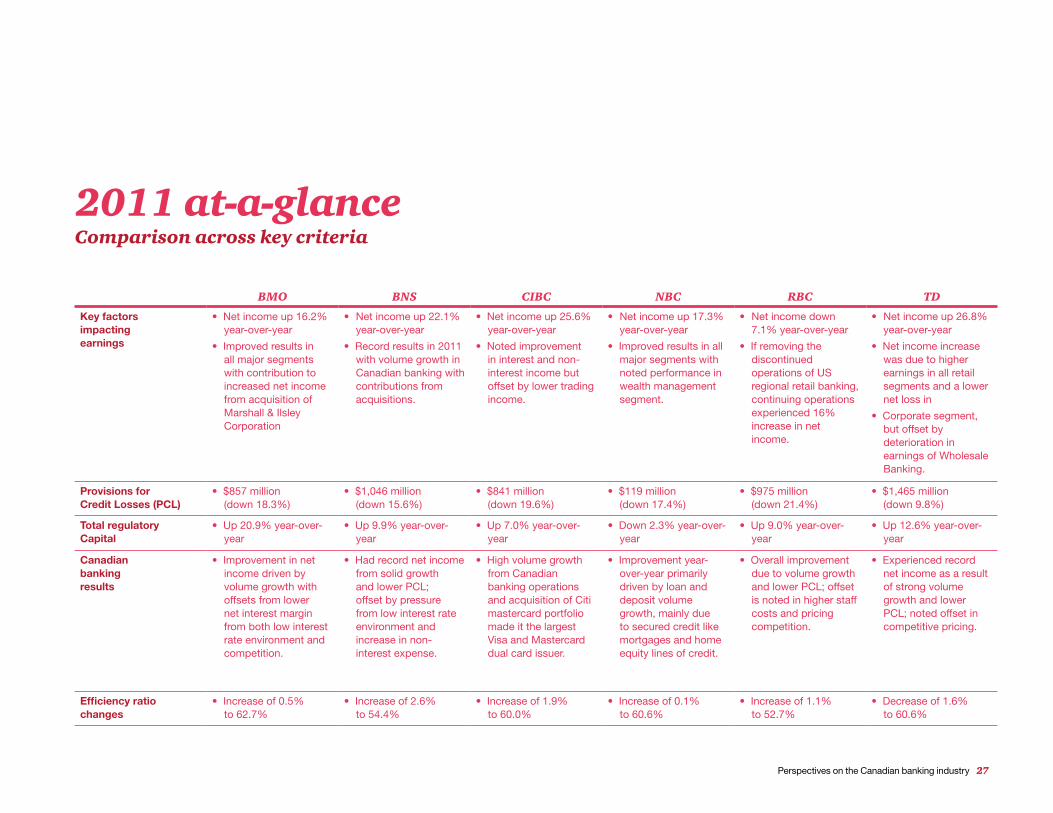
Comparison across key criteria2011 at-a-glance
BMO BNS CIBC NBC RBC TD
Key factors impacting earnings
• Net income up 16.2% year-over-year
• Improved results in all major segments with contribution to increased net income from acquisition of Marshall & Ilsley Corporation
• Net income up 22.1% year-over-year
• Record results in 2011 with volume growth in Canadian banking with contributions from acquisitions.
• Net income up 25.6% year-over-year
• Noted improvement in interest and non-interest income but offset by lower trading income.
• Net income up 17.3% year-over-year
• Improved results in all major segments with noted performance in wealth management segment.
• Net income down 7.1% year-over-year
• If removing the discontinued operations of US regional retail banking, continuing operations experienced 16% increase in net income.
• Net income up 26.8% year-over-year
• Net income increase was due to higher earnings in all retail segments and a lower net loss in
• Corporate segment, but offset by deterioration in earnings of Wholesale Banking.
Provisions for Credit Losses (PCL)
• $857 million (down 18.3%)
• $1,046 million (down 15.6%)
• $841 million (down 19.6%)
• $119 million (down 17.4%)
• $975 million (down 21.4%)
• $1,465 million (down 9.8%)
Total regulatory Capital
• Up 20.9% year-over-year
• Up 9.9% year-over-year
• Up 7.0% year-over-year
• Down 2.3% year-over-year
• Up 9.0% year-over-year
• Up 12.6% year-over-year
Canadian banking results
• Improvement in net income driven by volume growth with offsets from lower net interest margin from both low interest rate environment and competition.
• Had record net income from solid growth and lower PCL; offset by pressure from low interest rate environment and increase in non-interest expense.
• High volume growth from Canadian banking operations and acquisition of Citi mastercard portfolio made it the largest Visa and Mastercard dual card issuer.
• Improvement year-over-year primarily driven by loan and deposit volume growth, mainly due to secured credit like mortgages and home equity lines of credit.
• Overall improvement due to volume growth and lower PCL; offset is noted in higher staff costs and pricing competition.
• Experienced record net income as a result of strong volume growth and lower PCL; noted offset in competitive pricing.
Efficiency ratio changes
• Increase of 0.5% to 62.7%
• Increase of 2.6% to 54.4%
• Increase of 1.9% to 60.0%
• Increase of 0.1% to 60.6%
• Increase of 1.1% to 52.7%
• Decrease of 1.6% to 60.6%
Perspectives on the Canadian banking industry 27
28 Canadian Banks 2012
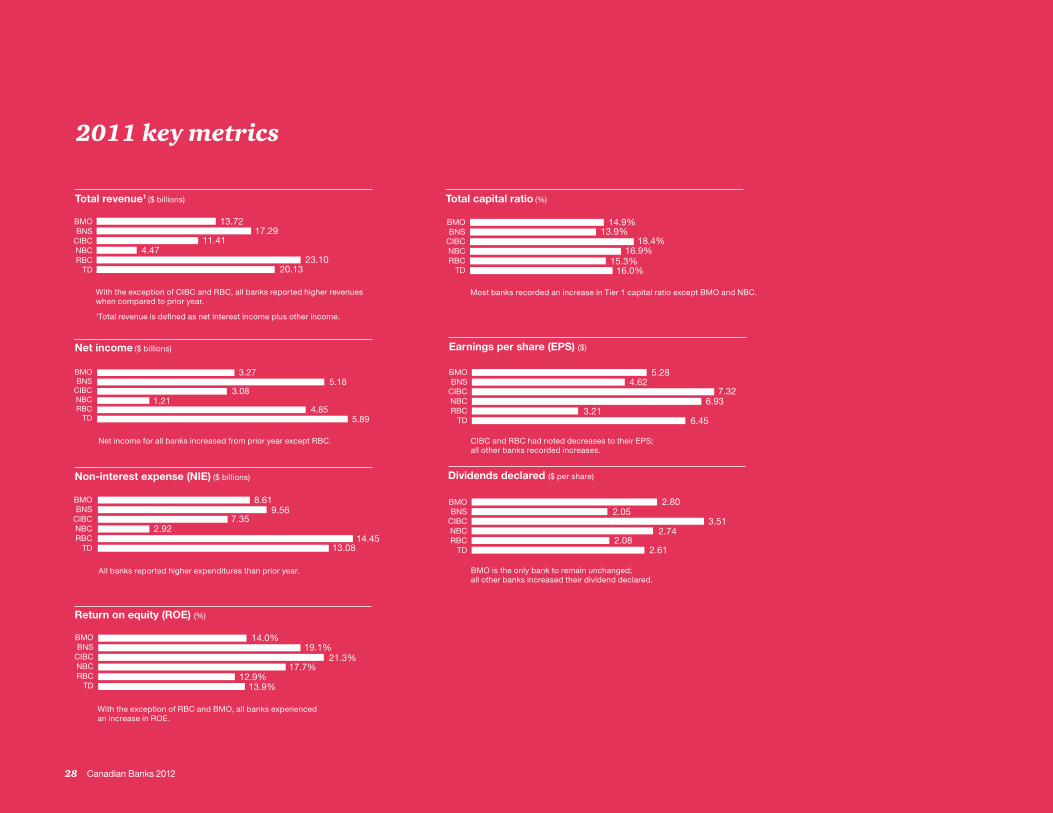
13.7217.29
11.414.47
23.1020.13
With the exception of CIBC and RBC, all banks reported higher revenues when compared to prior year.
1Total revenue is defined as net interest income plus other income.
Total revenue1 ($ billions)
With the exception of RBC and BMO, all banks experienced an increase in ROE.
0 5 10 15 20 25
12.9%13.9%
21.3%
14.0%19.1%
17.7%
BMOBNS
CIBCNBCRBC
TD
Return on equity (ROE) (%)
0 1 2 3 4 5 6 7 8
3.216.45
7.32
5.284.62
6.93
BMOBNS
CIBCNBCRBC
TD
CIBC and RBC had noted decreases to their EPS; all other banks recorded increases.
Earnings per share (EPS) ($)
Net income for all banks increased from prior year except RBC.
0 1 2 3 4 5 6
4.855.89
3.27
3.085.18
1.21
BMOBNS
CIBCNBCRBC
TD
Net income ($ billions)
14.9%13.9%
18.4%16.9%
15.3%16.0%
Most banks recorded an increase in Tier 1 capital ratio except BMO and NBC.
Total capital ratio (%)
0 3 6 9 12 15
BMOBNS
CIBCNBCRBC
TD14.45
13.08
8.61
7.359.56
2.92
All banks reported higher expenditures than prior year.
Non-interest expense (NIE) ($ billions)
0.0 0.5 1.0 1.5 2.0 2.5 3.0 3.5 4.0
2.082.61
3.51
2.802.05
2.74
BMOBNS
CIBCNBCRBC
TD
BMO is the only bank to remain unchanged; all other banks increased their dividend declared.
Dividends declared ($ per share)
2011 key metrics
Perspectives on the Canadian banking industry 29
Ratios were maintained at strong levels in anticipation of pending regulatory capital changes under Basel III and the adoption of International Financial Reporting Standards (IFRS). Internal capital generation through strong earnings was the primary driver behind continued capital strength. The only significant common share issuances were by BMO ($4.3 billion) and Bank of Nova Scotia (Scotiabank) ($1.8 billion) in support of acquisitions.
Less emphasis was placed on Tier 2 capital, with only BMO and Royal Bank of Canada (RBC) increasing Tier 2 capital levels, both from subordinated debt increases. This is not surprising given the Basel III changes and the non-viability contingent capital (NVCC) rules.
On February 9, 2012, Scotiabank completed its issuance of $1.66 billion in common shares. If this capital were included in the October 31, 2011 results, it would have increased Scotiabank’s Tier 1 capital ratio to approximately 12.9%.
Dividend payouts meeting internal bank targets
The desire to maintain strong capital levels was balanced with the desire to maintain or increase dividend levels. Other than BMO, all the banks increased their dividends in 2011. NBC and TD led the way with year-over-year dividend increases of 10.5% (as a result of the increase at the end of FY2010) and 7%, respectively. Although BMO did not raise its dividend in 2011, it continues to have the highest dividend payout target ratio (45% to 55%). Scotiabank, CIBC, NBC and RBC continue to have targets of 40% to 50% while TD has a target of 35% to 45%. All of the banks met their payout ratio targets, other than NBC (39.5%, just below its target) and RBC (64.8%), which exceeded its target as a result of the loss incurred on the announced sale of its US regional retail banking operations to PNC Financial Services Group. The payout ratio on a continuing operations basis was 47%, which is within its target.
Continued capital strengthAll the banks continue to show strong capital positions, with Tier 1 capital ratios ranging from 12% to 14.7% and a combined average of 12.9% (2010 – 12.8%). Total capital ratios ranged from 13.9% to 18.4% or a combined average of 15.4% (2010 – 15.3%). All of the ratios were well above the minimum required levels by OSFI of 7% and 10%, respectively, and represent slight improvements from 2010. All of the banks showed improvements in their ratios, except for BMO and National Bank of Canada (NBC), which had increased Tier 1 capital deductions for goodwill and intangible assets as a result of acquisitions in the year.
Tier 1 capital ratios 2011 2010
BMO 12.0% 13.5%
Scotiabank 12.2% 11.8%
CIBC 14.7% 13.9%
NBC 13.6% 14.0%
RBC 13.3% 13.0%
TD 13.0% 12.2%
Dividend payout ratios Target 2011 2010
BMO 45% to 55% 53.0% 58.6%
Scotiabank 40% to 50% 44.4% 50.1%
CIBC 40% to 50% 48.0% 59.1%
NBC 40% to 50% 39.5% 41.4%
RBC 40% to 50% 64.8% 57.3%
TD 35% to 45% 47.6% 69.9%

30 Canadian Banks 2012
Transition to IFRS will reduce capital levels
All of the banks presented preliminary opening IFRS reconciliations as of November 1, 2010, their opening balance sheet date. Decreases in shareholder’s equity ranging from 3.5% (Scotiabank) to 9.1% (RBC) are expected on the transition to IFRS. Increases in assets-to-capital multiples are also anticipated. However, the impact to regulatory capital and the multiples are cushioned by OSFI’s transitional guidance, permitting the banks to phase in the impact of IFRS on Tier 1 capital over a five-quarter period beginning in Q1 2012. OSFI’s transitional relief to exclude residential mortgages from Canada Mortgage and Housing Corporation (CMHC) securitizations prior to March 31, 2010, recognized back on balance sheet under IFRS, will also reduce the impact to assets-to-capital multiples.
Basel III
Although full Basel III implementation is not until January 1, 2019, the transitional arrangements commence January 1, 2013. OSFI is expected to release updated guidance in Spring 2012. The banks continue to prepare for these enhanced capital requirements both in terms of quality of capital and quantity of capital, but they are well positioned for the Basel III requirements thanks to their strong capital positions and historical profitability.
OSFI issued guidance in August 2011, outlining NVCC requirements for instruments issued by Canadian banks. All instruments issued after December 31, 2012 must meet these NVCC requirements to qualify as regulatory capital. Existing instruments need to be assessed or amended to meet NVCC criteria. Only CIBC ($881 million of its non-cumulative preferred shares) and TD (certain instruments issued by its US subsidiaries) have indicated that some of its instruments will be treated as NVCC under Basel III. Non-common share capital that does not meet Basel III requirements will be subject to grandfathering provisions, with recognition as regulatory capital phased out over a 10-year period beginning January 1, 2013. This is expected to apply to all of the banks. CIBC and TD are the only ones that have indicated they expect to exercise a regulatory event redemption right only in FY2022 for non-common capital instruments that will not qualify and have not matured by that date.

Perspectives on the Canadian banking industry 31
Other Basel II changes
Before Basel III is effective, institutions will also be affected by revisions to Basel II. Effective as of January 1, 2012, banks are required to implement market risk guidelines to include stressed value-at-risk and an incremental risk charge in market risk capital. These changes will result in increases to risk-weighted assets.
Also effective at the beginning of 2012, insurance subsidiaries held prior to January 1, 2007 will be deducted 50% from Tier 1 capital and 50% from Tier 2 capital, as opposed to deducting 100% from Tier 2 capital. The impact of this change will result in reductions to Tier 1 capital but not to total capital.
Dodd-Frank’s capital implications
While the Dodd–Frank Wall Street Reform and Consumer Protection Act was enacted in the US in July 2010, many of its provisions have not been written yet. The banks have been closely monitoring and commenting on the potential implications to date, such as the limits on interchange fees, regulation of over-the-counter derivatives markets, and the restrictions on proprietary trading and sponsorship of private investment funds (the much debated Volcker Rule).
Effective as of January 1, 2012, banks are required to implement market risk guidelines to include stressed value-at-risk and an incremental risk charge in market risk capital.
However, Dodd-Frank also has potential implications to capital requirements. On December 20, 2011, the US Federal Reserve proposed steps to strengthen regulation and supervision of banks with more than US$50 billion in assets. The proposal, with comments requested by March 31, 2012, includes a wide range of measures such as capital, liquidity, credit exposure, stress testing, risk management, and early remediation requirements. Sound similar to Basel III? Many of the proposed requirements have a phased-in approach with the intention to converge with Basel III, but the Federal Reserve also indicated that it’s carefully considering what changes to the standards it may recommend to Basel III based on the results of this observation. Canadian banks will need to be mindful of the potential implications of these standards on their US subsidiaries.
32 Canadian Banks 2012
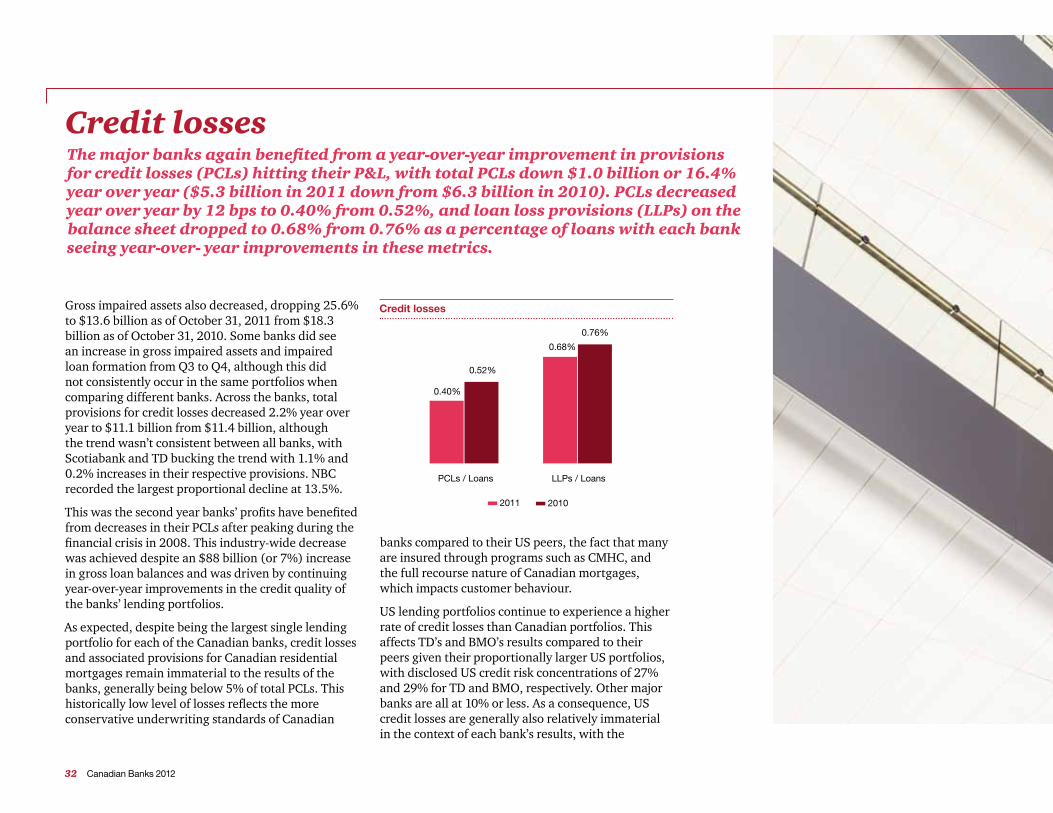
Gross impaired assets also decreased, dropping 25.6% to $13.6 billion as of October 31, 2011 from $18.3 billion as of October 31, 2010. Some banks did see an increase in gross impaired assets and impaired loan formation from Q3 to Q4, although this did not consistently occur in the same portfolios when comparing different banks. Across the banks, total provisions for credit losses decreased 2.2% year over year to $11.1 billion from $11.4 billion, although the trend wasn’t consistent between all banks, with Scotiabank and TD bucking the trend with 1.1% and 0.2% increases in their respective provisions. NBC recorded the largest proportional decline at 13.5%.
This was the second year banks’ profits have benefited from decreases in their PCLs after peaking during the financial crisis in 2008. This industry-wide decrease was achieved despite an $88 billion (or 7%) increase in gross loan balances and was driven by continuing year-over-year improvements in the credit quality of the banks’ lending portfolios.
As expected, despite being the largest single lending portfolio for each of the Canadian banks, credit losses and associated provisions for Canadian residential mortgages remain immaterial to the results of the banks, generally being below 5% of total PCLs. This historically low level of losses reflects the more conservative underwriting standards of Canadian
banks compared to their US peers, the fact that many are insured through programs such as CMHC, and the full recourse nature of Canadian mortgages, which impacts customer behaviour.
US lending portfolios continue to experience a higher rate of credit losses than Canadian portfolios. This affects TD’s and BMO’s results compared to their peers given their proportionally larger US portfolios, with disclosed US credit risk concentrations of 27% and 29% for TD and BMO, respectively. Other major banks are all at 10% or less. As a consequence, US credit losses are generally also relatively immaterial in the context of each bank’s results, with the
0.00.10.20.30.40.50.60.70.8
0.52%
PCLs / Loans LLPs / Loans
0.40%
0.76%
0.68%
20102011
Credit losses
Credit lossesThe major banks again benefited from a year-over-year improvement in provisions for credit losses (PCLs) hitting their P&L, with total PCLs down $1.0 billion or 16.4% year over year ($5.3 billion in 2011 down from $6.3 billion in 2010). PCLs decreased year over year by 12 bps to 0.40% from 0.52%, and loan loss provisions (LLPs) on the balance sheet dropped to 0.68% from 0.76% as a percentage of loans with each bank seeing year-over- year improvements in these metrics.

Perspectives on the Canadian banking industry 33
exception of TD and BMO. TD reported continuing improvement in the performance of its US portfolio, offset by portfolio growth with the net effect being that its provision related to its US book remained flat. BMO reported an $86 million increase in its PCLs, with this largely driven by its acquisition of Marshall & Ilsley and the resultant increase in its portfolio size.
The bulk of retail banking credit losses relate to the unsecured credit card and personal lending portfolios. In general, the banks saw year-over-year improvements in the credit quality of these portfolios. However, there is some indication that this trend stopped in Q4, with arrears rates either stabilizing or deteriorating slightly compared to Q3.
The other large driver of credit losses is commercial lending. Most banks reported a year-over-year improvement in commercial lending credit losses. Having said that, as with unsecured personal lending, there was some divergence in trends between banks from Q3 to Q4. Some banks continued to see improvements in certain portfolios while others saw slight declines in credit quality.
The divergence in trends from Q3 to Q4 in PCL ratios at a consolidated level are detailed below:
The majority of the banks don’t publish credit-related information segmented by province and territory, but mortgage arrears information collated by the Canadian Bankers Association shows that the year-over-year improvement in mortgage arrears has been consistent in all provinces and territories. Having said that, it is interesting to note that as of September 2011, the percentage of mortgages over 30 days in arrears in Alberta remains substantially higher at 0.75%, compared to British Columbia at 0.47%, Quebec at 0.34%, and Ontario at 0.29%. Other provinces and territories account for a relatively small proportion of lending balances, but their mortgage arrears rates are similarly also lower than those seen in Alberta.
In relation to Europe, the Canadian banks have generally made an effort to reduce their exposure to peripheral Europe (Portugal, Italy, Ireland, Greece and Spain). They have also made voluntary disclosures to the market in relation to their European holdings, generally segmented by region and nature of exposure. In short, direct credit losses have been very limited to date and it appears that the banks are closely managing the exposures that they do have.
The impact the European debt crisis is having on credit losses is less direct. The prolonged period of uncertainty has had a negative impact on business and consumer confidence globally, impacting levels of business and consumer spending. The Canadian and US economies are still forecast to grow in 2012, but not as quickly as may have been the case in the absence of this uncertainty.
BMO BNS CIBC NBC RBC TD
Canada Stable Improved Improved Deteriorated Improved Deteriorated
International* Improved Deteriorated Deteriorated n/a Improved Improved
* In the case of TD and BMO, this primarily represents their US businesses.

34 Canadian Banks 2012
The indirect impact on credit quality is that we’re seeing indications that arrears rates are bottoming out at a level higher than may otherwise have been the case. The credit card delinquency rate (90 days and over) stood at 1.05% in July 2011, slightly above the average from 2004 to 2007 of 0.82%. A similar trend holds for the percentage of mortgages in arrears by more than 30 days (0.39% as at September 2011 vs. a 0.26% average for 2004-2007). Still, it is interesting to note that the rate is already below the average since 1990 of 0.42%.
There is some divergence in views about what will happen to credit losses in 2012, although this divergence is likely just a matter of timing. Canada’s economic fundamentals remain sound and there has been some positive data coming out of the US. Unfortunately, the uncertainty surrounding Europe continues to dampen business and consumer confidence, which is having a real impact on spending and investment decisions.
This year also marked the banks’ final year of reporting under pre-IFRS Canadian GAAP. As noted in our previous publication, both IFRS and GAAP require the use of an incurred loss provisioning model. The banks have largely refined their provisioning models to comply with IFRS and none have indicated that they expect any significant adjustments. Credit loss metrics will be impacted where securitized loans are brought back onto the balance sheet under IFRS. But given that the level of insurance on mortgages securitized under the CMHC’s securitization programs typically results in very low losses being suffered by lenders in the event of default, there will, however, be a change in presentation and classification with IFRS requiring provisions for credit losses to be presented based on whether they have been assessed collectively or individually.

Perspectives on the Canadian banking industry 35
Personal and commercial banking
This segment includes a range of banking and investing services relating to the banks’ network of branches, automated banking machines, internet as well as mobile, and telephone banking. This segment also includes the main businesses of retail and small business banking, and commercial banking.
All six banks showed solid financial results in the area of personal and commercial banking. Net income rose at all six banks, with the increase ranging from 9% to close to 20%. The strength in this area is attributed to strong volume growth related to loan products especially secured lending, which includes real estate, auto lending, and business loans. While the volume displayed a healthy growth, the benefits were
partially offset by the narrowing net interest margin. Banks experienced difficulty in this area due to the low-interest rate environment and very competitive pricing on loans such as mortgages. Average deposits were also higher in fiscal 2011 than the previous year. In general, banks had an increase in costs in this segment due to a rise in payroll-related expenses, including salary, pensions, and performance-based compensation costs. Also, the full-year impact of the Harmonized Sales Tax (HST) was noted by numerous banks as contributing to an increase in non-interest expenses.
Wealth management
The banks reported a strong performance in the wealth management segment. Part of the reason was due to acquisitions; those transactions completed in late 2010 or early 2011 had an overall positive impact on the banks’ wealth management segment results. Most banks showed an increase in assets under management and assets under administration; however, this is frequently offset by market declines.
In terms of financial results, all six banks experienced double-digit increases in net income, with increases ranging from 13% to 49%. Higher transaction revenue due to an increase in transaction volume and higher average revenue per transaction contributed to the rise. Fee-based revenue also increased due to better stock market performance and thus greater capital appreciation for part of the year. Non-interest expenses increased year-over-year for all banks due to higher variable compensation costs and strategic initiatives supporting business growth.
Results by business segments
BMO % change
BNS % change
CIBC % change
NBC % change
RBC % change
TD % change
Personal and commercial banking2
10.9% 14.3% 15.3% 9.0% 15.8% 19.6%
Wealth management 12.6% 49.3% 24.0% 42.0% 20.9% 21.1%
Wholesale banking and capital markets
12.7% -12.3% 65.2% 5.6% -4.4% -17.6%
1 The bank’s operations are grouped in three categories for this analysis. Corporate and other segment is excluded for each bank.
2 International banking incomes for TD, RBC, BNS, and BMO are included in personal and commercial banking; NBC derives little income from non-Canadian sources. RBC’s insurance earnings are also included in personal and commercial banking. CIBC’s international banking income is excluded from the above table because it is embedded in corporate and other.
Year-over-year change in net income by segments1
Percent increase or decrease from 2010 to 2011

36 Canadian Banks 2012
Wholesale banking and capital markets
This segment – which includes investment banking, corporate banking, capital markets, and other services – slowed down from the 2010 highs. The first six months of the year displayed stronger results and higher investor confidence. However, in the last six months of the year, market uncertainty contributed to a low-confidence environment that is expected to continue due to unresolved complications relating to Europe’s debt crisis. While analysts’ expectations were low for this segment’s results, the banks pleasantly surprised the market with better-than-expected results.
NBC and BMO came out ahead with 6% and 13% year-over-year increases, respectively. CIBC displayed a significant 65% increase from 2010 due to higher equity sales and new issuances. The banks with positive growth in net income benefited from an increase in corporate and investment banking and lower provisions for credit losses. However, the below-trend performance of the market is still evident in some banks’ financial results. Three of the six
banks (RBC, TD, and Scotiabank) saw a moderate decrease to net income ranging from 4% to 18% in the wholesale banking and capital markets segment. Banks felt the pressure of the global economic situation. All six banks experienced declines in the global fixed-income business, especially related to the US and Europe.
Results by geographic segments
The large Canadian banks ended the 2011 fiscal year on a very positive note. All banks presented solid results with the majority of them performing above analysts’ expectations; some banks experienced record or close to record income for the year. The benefit is mainly due to an increase in Canadian retail banking and growth in loan portfolios. However, 2012 began with a tone of great domestic competition; the first spark starting with BMO offering a record low rate on mortgages, which caused quick responses from the other banks. This is a sign of intense competition for new customers and to compensate for tight margins by expanding loan volumes.

Perspectives on the Canadian banking industry 37
While all the Canadian banks have a significant focus in Canada, for some, their foreign operations also form an integral part of their business model, some more significantly than others. The banks have varying degrees of foreign involvement and differ markedly in their approach to international operations. Certain banks actively focus on enhancing their international presence by way of acquisition, expanding their existing foreign operations, and entering emerging markets. Some banks decided to pull out of certain markets and focus their efforts in another area. Other banks focused on the domestic market with limited foreign operations.
However, the recent global economic situation has many of the banks skeptical about the future. The banks acknowledge that growth will be challenging given uncertainty over the resolution of Europe’s debt issues. However, some have said that the turmoil may
produce new business opportunities as their foreign competitors are forced to give up market share to the more financially sound Canadian banks. Nevertheless, international developments will cause difficulties for Canadian banks on the international front. Recent US legislative changes, such as Dodd-Frank, will ultimately affect all financial institutions operating in the US; many Canadian banks have subsidiaries and other significant operations there. The US is not alone in making changes. The European Commission is reviewing the Markets in Financial Instruments Directive (MiFID). Also, Basel III is expected to be enacted in the near future. The laws are expected to increase compliance costs, add to legal risks, and restrict the banks’ ability to earn income the way they previously had. While the banks had a strong performance in 2011 and seem relatively shielded from the circumstances around them, Canadian banks are not unaffected by the recent reforms.
The large Canadian banks ended the 2011 fiscal year on a very positive note.

38 Canadian Banks 2012
Scotiabank is Canada’s most international bank, operating in more than 55 countries worldwide and currently generates the largest share of net income outside of Canada, deriving more than 35% of its net income from foreign sources for 2011. It concentrates in high-growth emerging markets, positioning itself in Mexico, the Caribbean, Asia, and Central, Latin and South America. A number of significant transactions occurred in 2011 in Asian and South American markets: announcing the purchases of a 19.99% interest in China’s Bank of Guangzhou and a 51% stake in Colombia’s Banco Colpatria as well as the completion of the acquisition of Dresdner Bank in Brazil and Nuevo Banco Comercial S.A. in Uruguay. Due to the recent reforms in Cuba, Canadian banks are considering what opportunities are available. Among the first to act is Scotiabank, applying to the Central Bank of Cuba for a representative office licence in December 2011. Its medium-term goal is to generate an equal amount of net income from its Canadian and foreign operations.
In 2011, RBC pulled back on its US operations and is currently working to sell its US regional retail banking arm to PNC Financial Services Group. However, RBC’s global presence remained strong, focusing on corporate, institutional and high net worth clients in its capital markets and wealth management segments.
RBC strengthened its ties with Asia, launching a new trading floor in Hong Kong in late 2010 and appointed a new head of Asia capital markets in mid-2011. The European and Caribbean arms of RBC, however, faced challenges. The European fixed-income trading business is experiencing difficulties due to the European debt crisis. Its Caribbean banking business faces pressure due to a slowdown in the tourism industry and the local economy. Its joint venture with Dexia, RBC Dexia Investor Services with clients in 15 countries, faces stress due to the stability of its joint venture partner. Despite all this, RBC’s international banking arm still managed a CAD$81 million increase in net income after discontinued operations due to higher earnings at RBC Dexia. Future developments for RBC may include Cuba, where RBC is in the early stages of considering this market.
TD operates a large network of branches in the US with more than 1,200 “stores”. It has the largest US retail arm of all the Canadian banks. TD also owns about 45% of online brokerage TD Ameritrade. Its recent acquisition of 100% of Chrysler Financial, renamed TD Auto Finance US, further increased TD’s operations in the US. The integration of the recently acquired South Financial Group also occurred in 2011. The US retail banking sector is a highly competitive environment. Combined with the changes in regulations, TD will have to focus on product evolution where products are in compliance with new regulations while delivering value to customers. On the international front, TD Waterhouse International operates in the UK and Europe.

Perspectives on the Canadian banking industry 39
In 2011, BMO completed the acquisition of Marshall & Ilsley (M&I) in July. This new acquisition will contribute mainly to BMO’s US personal and commercial banking, private client and corporate service segments. M&I was combined with BMO’s existing US-based Harris Bank to form BMO Harris Bank, which more than doubles the US branch network to 679 branches in 2011 from 312 in 2010. This acquisition gives BMO a significant market presence in eight US states, mostly in the Midwest.
CIBC is more focused on domestic operations. However, in 2011, it completed another transaction in a series of strategic investment over the last two years, purchasing a 41% equity interest in American Century Investments, a US asset management company. CIBC also opened a new wholesale banking office in London, England and a new corporate credit products office in Houston, Texas. CIBC’s international banking operations are comprised of CIBC FirstCaribbean,
joint venture CIBC Mellon and the Bank of N.T. Butterfield & Son Ltd. In 2011, CIBC’s international banking operations performed relatively worse than the prior year due to low gains on the sale of securities and a strong Canadian dollar.
NBC’s operations are primarily focused in the province of Quebec where it earns 70% of its revenue. NBC is leveraging its distribution network to grow its presence outside of Quebec into the rest of Canada, which currently represents 27% of revenue earned. Internationally, NBC’s activities are limited in comparison to its other large Canadian bank peers at only 3%. NBC operates under Natbank in Florida and owns Putnam Lovell NBF, a US-based investment bank acquired in 2002. While Scotiabank and RBC are considering or acting on opportunities in Cuba, NBC has already been operating in the country for more than 15 years.
Some have said that the turmoil may produce new business opportunities as their foreign competitors are forced to give up market share to the more financially sound Canadian banks.

40 Canadian Banks 2012
Four of the Big Six banks realized a drop in the value of their common share price compared to the year-ago period. The most significant decline of 16.6% was recognized by RBC to $48.62 from $54.39, followed by CIBC with a 4% drop to $75.10, Scotiabank with a 3.9% decrease to $52.53, and BMO with a drop of 2.2% and ending value of $58.89. Increases were posted by NBC of 6% to $71.14 and TD of 2.3% to $75.23. While the price of Scotiabank and BMO shares fell, the market cap of both banks rose because both issued stock, offsetting the decline.
TCE ratios ranged from 19.6% for TD at the high end to 11.7% for BMO at the low end as of October 31, 2011. Overall, ratios stayed relatively consistent with the prior year, which had a TCE ratio range of 19.0% for TD to 10.8% for Scotiabank. It’s important to note that this ratio compares tangible common equity to risk-weighted assets as opposed to total assets, which some analysts point out would remove the judgment required in determining the likelihood of the assets going bad and result in significantly lower ratios.
Potential earnings are inhibited by the fact that the industry is currently seeing smaller margins on loans and with a ceiling on consumer lending in Canada, the banks are not able to simply increase portfolios to maintain profits. Furthermore, the continual global economic uncertainty is projected by some analysts to have an impact on growth in Canada, which is likely one of the factors that led two of the banks to lay off a significant amount of employees during the quarter
As of October 31, 2011, RBC continued to register as Canada’s largest bank with a market capitalization of $69.9 billion. However, this is a decline of 9.8% from October 31, 2011 and a 9.7% decline from October 31, 2009, making RBC the only one of the Big Six that has seen a decrease compared to both the 2010 and 2009 comparatives. TD stood a close second, registering a market capitalization of $67.9 billion, an increase of 5.1% over the prior year. Scotiabank followed with a modest 0.4% rise and a market value of $57.2 billion and BMO with an increase of 10.4% and a market capitalization of $37.6 billion. CIBC ranked fifth at $30.1 billion, and although this was a decrease of 2.1% from the prior year, it was a 26.3% rise over the two-year period. NBC, the smallest of the Big Six, was valued at $11.4 billion, an increase of 4.1% from the prior year. The total market capitalization as of October 31, 2011 for the six banks in Canada was $274.1 billion, overall holding very steady from $274.8 billion in the prior year. Subsequent activity in market capitalization saw TD edge ahead of RBC on November 9, 2011, showing how close the race is for the top spot. This was a short lived move; RBC has since regained and maintained top spot.
Market capitalization
The last two years have seen some variability in the market capitalization, tangible common equity (TCE) ratios, and stock prices of Canada’s Big Six.

Perspectives on the Canadian banking industry 41
ending October 31, 2011. RBC had 585 fewer full-time positions and BMO had 435 fewer full-time positions as compared to the end of fiscal Q3.
Despite challenges faced by the Canadian banks, there are reasons to be optimistic. The quarter ending October 31, 2011 saw record earnings of $6.5 billion for the big six banks.
Looking at past performance, the value of the banks has been stable. Government funding has not been required in difficult times and the largest portions of
Investors in Canada are aware that if the debt crisis deepens in Europe and spreads to the global economy, the effects could be felt by Canadians.
the Canadian banks’ assets are in housing portfolios, resulting in lower reliance on international markets. Although Canadian banking regulations are more stringent than most other countries, many of the banks maintain capital in excess of regulatory requirements, continuing to show capital strength.
However, investors in Canada are aware that if the debt crisis deepens in Europe and spreads to the global economy, the effects could be felt by Canadians. Should we be impacted through job losses and other economic hardships, there will be a knock-on impact on the Canadian banks through defaults on lending portfolios.
When compared to their counterparts in the United States, the performance of Canada’s Big Six looks much better than the Big Four (Bank of America, Citigroup, JPMorgan Chase, and Wells Fargo).
Stock performance declined across the board as of October 31, 2011 compared to the prior year for the four largest US banks. The most significant drops in value were at Bank of America, which declined 40.3% to US$6.83, and Citigroup, which fell 30.6% to $28.92. The declines were more modest at JPMorgan Chase, which was down 7.6% to $34.76, and Wells Fargo, falling just 0.6% to $25.91. Beyond difficulties in the domestic US markets, the US banking industry is also impacted by a stronger interrelation to European markets than that of the Canadian banks. One figure from JPMorgan Chase estimates that US banks (in total) have approximately $170 billion in loans to countries in the eurozone as of October 25, 2011, which is estimated to equate to 12.5% of their capital.

42 Canadian Banks 2012
Last year was one of turbulence and uncertainty. The first half of 2011 saw improvement in global capital markets showing increased investor confidence but was overshadowed by civil unrest in the Middle East and a natural disaster in Japan. The latter half of the year brought additional uncertainty over a weakening global economy, Standard & Poor’s downgrade of the United States’ credit rating, and the added stress of the continual deterioration of European sovereign debt. The low-interest rate environment throughout the year increased consumer lending demand but also resulted in spread compression. The global economy is fragile and major changes to the regulatory environment for financial institutions create a difficult atmosphere for Canadian banks to operate in.
Snapshot of the Big Six
BMO highlights
BMO had another strong fiscal year ending October 31, 2011. That was despite challenging economic conditions due to growing concerns about a US recession, European sovereign debt and economic difficulties, and a decrease in investors’ risk tolerance. For the fourth consecutive year, BMO had solid growth in net interest income and non-interest revenue, and in 2011 both increased 9.5% and 11.1%, respectively. Adjusted return on equity was 15.3% in 2011 (15% in 2010) and the dividend remained steady at $2.80 per share. The strong results overall can be attributed to an increase in earnings across all of BMO’s groups.
The personal and commercial (P&C) banking operating group is the largest at BMO. The Canadian P&C business generated higher revenues and net income in 2011, driven by volume growth in most products. However, revenue growth was partially offset by lower deposit spreads due to the low-interest rate environment in Canada, competitive pricing pressure on personal mortgages, and lower volumes on retail cards. Looking ahead, the expectation is that consumer credit will remain soft throughout 2012 and 2013, and the demand for real estate mortgages will slow moderately from its strong pace in early 2011. The demand for commercial loans will continue to grow as businesses upgrade equipment, expand space, and build inventories.
The global economy is fragile and major changes to the regulatory environment for financial institutions create a difficult atmosphere for Canadian banks to operate in.

Perspectives on the Canadian banking industry 43
The US P&C business generated increases in net income, revenues, and net interest margin. The increases were driven by improved loan spreads, higher deposit balances, and securities gains. However, the most significant event impacting the US P&C business was its acquisition of Marshall & Ilsley (M&I) for about US$4 billion. As a result of this significant acquisition, the US P&C business more than doubled its branch count to 688, it added one million more customers and increased its assets under management and administration to more than CAD$530 billion. The acquisition of M&I substantially increased BMO’s US Midwest presence. The US P&C business expects commercial loan demand to slowly improve in 2012 as credit availability increases and demand for consumer products gradually improves. Consumer spending will continue to be sluggish as households focus on reducing their debts. Demand for home equity loans and mortgages will remain weak due to the soft real estate market.
The private client group (PCG) generated growth in all of its businesses and net income was up $58 million or 13% in 2011 compared to 2010. Revenue growth was particularly strong in the brokerage and mutual fund business. Assets under management and administration grew by $158 billion compared to 2010, with this increase being primarily attributed to the acquisition of M&I. Insurance net income was down $32 million from 2010, which was attributed to the increase in reinsurance claims from the Japanese and New Zealand earthquakes as well as the unfavourable impact of long-term interest rate movements on policyholder liabilities. The PCG group expects that the North American wealth management industry will continue to grow over the long term due to changing demographics in the retirement, mass affluent, and high net worth sectors.
Bank of Montreal’s net income for 2011 was $3.3 billion, up from $2.8 billion in 2010.

44 Canadian Banks 2012
Provision for credit losses improved over the past two years, however, global economic uncertainty remains, and certain sectors remain challenged. The majority of BMO’s provisions continue to relate to the US portfolio. Of particular concern to BMO is the US real estate sector, as the largest portion of new impaired loans is derived from the commercial real estate and commercial mortgage sectors.
In 2011, while BMO was not the most active bank in the merger and acquisition space, it did complete one of the largest among the Big Six. Its key corporate events were:
• The closing of the acquisition of M&I for nearly US$4 billion, its largest-ever acquisition
• The purchase of Hong Kong-based portfolio manager Lloyd George Management
BMO’s business outlook for 2012 and beyond includes two significant areas of change to its operations. Firstly, BMO anticipates increased regulatory compliance costs due to increasing complexity and breadth of change from new legislation such as Dodd-Frank and the Volcker Rule, and secondly BMO expects a gradual recovery of the global economy with modest growth in 2012. Similar to its Canadian peers, the European debt crisis hasn’t had a significant impact on BMO as direct exposure to PIIGS (Portugal, Italy, Ireland, Greece, and Spain) countries is modest at $203 million.
BMO Capital Markets’ net income increased 13% to $104 million. Non-interest revenues increased 13% due to increased equity trading and higher investment banking fees, particularly from merger and acquisition activity and debt underwriting. Lending fees were down due to decreased volume. Net interest income decreased $186 million or 13% relative to 2010 due to a weaker market environment and lower corporate banking revenues. Looking ahead, modest growth, if any, is expected in 2012 as there remains uncertainty due to lingering economic difficulties. Growth will depend on the performance of the commodity and financial markets, economic activity, and business confidence.

Perspectives on the Canadian banking industry 45
BNS highlights
Scotiabank had a record-breaking year, reporting net income of $5.3 billion, a $929 million increase compared to 2010. Led by its international banking and global wealth management divisions, Scotiabank increased its return on equity by 0.5 percentage points to 18.8%. Despite the record profitability, the appreciation of the Canadian dollar against the US and Peruvian dollars had adverse affects on the total profitability in fiscal 2011. Scotiabank increased its quarterly dividend during its first fiscal quarter in 2011 by 6.1% to $0.52.
The Canadian banking business line, Scotiabank’s largest segment, had another strong year as net income increased 5.2% to $1.86 billion in 2011. Net interest income fell $30 million to $4.89 billion as interest spreads declined by 16 basis points to 2.33% in 2011. The decline was offset by higher transaction-based revenue, mainly from Visa credit cards as well as growth in the retail and small business banking segments which were offset by a decline in commercial banking. The overall growth in the Canadian banking business is consistent with the other Canadian banks’ results for the fiscal year.
The international banking business rebounded in 2011 as net income jumped 28% to $1.5 billion, largely driven by strategic acquisitions including the prior-year acquisition of R-G Premier Bank of Puerto Rico. Strong retail growth in Peru and Chile as well as strong commercial growth in Asia helped offset the appreciation of the Canadian dollar. Scotiabank continues to benefit from its global diversification strategy as Canada’s most international bank.

46 Canadian Banks 2012
Global wealth management had a strong year in 2011, aided by the completion of the acquisition of DundeeWealth. Net income increased by $402 million to $1.2 billion in 2011. Assets under management increased to $103 billion from $54 billion with the completion of the acquisition. Scotiabank continued to expand its insurance offerings in Canada and internationally, with expanded life and health offering products. Total revenue for the insurance segment grew 12% to $491 million in fiscal 2011. Scotiabank will continue to look for organic growth in global wealth management through expansion and acquisitions, both locally and internationally in 2012.
Scotiabank’s net income for 2011 was $5.2 billion, up from $4.2 billion in 2010.
Scotia Capital continued to be impacted by challenging market conditions with net income declining $166 million to $1.2 billion in 2011. Similar to other financial institutions, Scotia Capital experienced significant declines in global capital markets, specifically in the fixed-income business, which has been impacted more heavily than other areas of the business. Recovery and growth in 2012 for Scotia Capital will depend upon the market recovery and its ability to effectively expand its sales and trading business into the Latin American markets.
Provision for credit losses continued to improve for Scotiabank, with the total provision declining 16% to $1 billion. The Canadian banking business experienced the largest drop, with the provision for credit losses decreasing $115 million to $590 million based off of lower retail and commercial provisions. For international banking, lower commercial provisions in the Caribbean helped drive the overall provision for credit losses as a percentage of loans and acceptances to 0.72% in 2011 from 1.0% in 2010. In 2012, Scotiabank expects provision for credit losses to increase with the overall expansion of the portfolio.
In 2011, Scotiabank continued to be the most active bank in terms of acquisitions and expansion including the following key corporate events:
• Completion of the acquisition of DundeeWealth, making Scotiabank the second-largest mutual fund provider in Canada
• Expanded presence in China through a 19.99% purchase in the Bank of Guangzhou, the 29th largest bank in mainland China
• Completion of a number of South American acquisitions including a 51% interest in Banco Colpatria, Colombia’s fifth-largest financing group and Pronto!, Uruguay’s third-largest consumer finance company

Perspectives on the Canadian banking industry 47
Scotiabank updated its exposure to the European PIIGS in its most recent financial results. Given its international focus, Scotiabank faces higher direct exposure at $2.2 billion with nearly half of its concentration in Italy.
In fiscal 2012, Scotiabank’s business outlook will face uncertain market conditions, regulatory changes, and sustained competition for market share both locally and internationally. According to the management discussion and analysis included in the annual report, the following are the strategic priorities for Scotiabank in 2012:
• Align Canadian banking and global wealth management to help drive revenue growth in mutual funds
• Growth in international banking through both organic growth and selective acquisitions
• Continue to capitalize on the acquisition of DundeeWealth and the growth of the global wealth management division

48 Canadian Banks 2012
CIBC’s net income for 2011 was $3.1 billion, up from $2.5 billion in 2010.
CIBC highlights
CIBC generated strong earnings for the year ended October 31, 2011, with net income of $3.1 billion compared to $2.5 billion in 2010 and return on equity (ROE) of 21.3% compared to 19.4% in 2010. CIBC maintained its quarterly dividend at $0.87 throughout the first three quarters and increased the dividend by $0.03 in the fourth quarter for total dividends per share of $3.51 in 2011 ($3.48 in 2010).
CIBC reorganized its structure in 2011 into three strategic business units (SBUs): retail and business banking, wealth management, and wholesale banking. The primary change is that wealth management and international banking (including FirstCaribbean) have been reported separately from CIBC Retail Markets and included in the wealth management SBU, corporate and other.
The retail and business banking SBU is the largest with average assets of $255 billion, which represents approximately 70% of total average assets. Net income was $2.13 billion, a $282 million increase from 2010. Revenues were $7.97 billion, which increased $392 million from 2010 as a result of volume growth across most lines of business as well as higher treasury allocations and fees. Personal banking revenue was $6.47 billion up $203 million from 2010 primarily due to the impact of the 2010 Mastercard portfolio acquisition from Citigroup and volume growth. Business banking revenues were $1.4 billion, up $33 million due to higher commercial banking fees and volume growth in lending and deposits. In both personal and business banking, increases in volume were partially offset by narrower interest spreads, consistent with its Canadian peers.
The wealth management SBU generated higher net income of $279 million in 2011, up $54 million from 2010 and higher revenues of $1.64 billion, up $157 million from 2010. The increase was due to higher fee revenue from the retail brokerage and asset management divisions. However, the increase would have been more if not for higher non-interest expenses. Retail brokerage revenues were $1.1 billion, up $95 million due to wider spreads, higher fees, and higher commissions on new issuances. Private wealth management revenues of $98 million were comparable to 2010 ($100 million). Asset management revenue was $456 million, up $64 million, primarily due to higher assets under management. Assets under administration were $202.9 billion, up $4 billion from 2010. The increase was primarily related to high net sales of long-term mutual funds and higher average balances in client assets. In Q4 of 2011, CIBC completed its acquisition of a 41% minority interest in American Century Investments (ACI), an asset management firm. The results of ACI have been included in the wealth management SBU.

Perspectives on the Canadian banking industry 49
2010 due to an improvement in credit quality in the Canadian portfolio as well as the US real estate finance business. The decreases were partially offset by higher provisions related to CIBC’s FirstCaribbean subsidiary, which continued to be affected by global economic stresses that have had a negative impact on tourism and real estate development in the Caribbean. The specific provision also increased due to the exited leveraged finance business in Europe. The change in the general provision was unfavourable by $71 million from 2010 due to a slow improvement in the Visa cards portfolio compared to the prior year.
In 2011, there was one key corporate event for CIBC in terms of expansion:
• The bank announced and completed its acquisition of a 41% stake in ACI for US$848 million, which it purchased from JPMorgan Chase
CIBC’s outlook for 2012 is similar to its peers. The primary concern is that economic growth will be slow on both sides of the border, with the potential risk of a European sovereign debt crisis spill over into the global economy. CIBC expects the European sovereign debt crisis to be contained which would prevent a larger eurozone banking crisis and a deeper global recession. Similar to its Canadian peers, CIBC doesn’t have significant exposure to the European PIIGS, which have experienced credit concerns. The bank has immaterial exposure net of any collateral held. Net exposure as at October 31, 2011 was approximately $40 million compared to $345 million in 2010.
The wholesale banking SBU generated significantly higher net income of $565 million in 2011, up $223 million from 2010. The increase can be attributed to higher revenue from corporate and investment banking, a lower provision for credit losses, and a lower effective tax rate. Capital markets revenue of $1.1 billion was up $60 million, which is due to higher equity sales and new issuances as well as higher tax-exempt revenue. Corporate and investment banking revenue was $952 million, up $234 million, which is primarily due to higher merchant banking gains and higher revenue from corporate credit and advisory. The increase in net income was partially offset by higher non-interest expenses. The structured credit run-off business continues to generate net losses, however, at a decreasing rate. The net loss for 2011 was $122 million, down from a loss of $161 million in 2010 and $684 million loss in 2009. The loss for 2011 was primarily due to a decrease in the value of receivables net of the credit valuation adjustment (CVA) related to protection purchased from financial guarantors.
Provision for credit losses have decreased over the past two years and were $841 million, down $205 million in 2011 compared to 2010. The specific provision in consumer portfolios of $762 million decreased $181 million, which is mainly due to lower write-offs across most products as well as a favourable impact from the higher amount of credit card securitizations in 2011. The specific provision for credit losses in the business and government lending portfolios was $163 million, down $95 million from

50 Canadian Banks 2012
National Bank of Canada’s net income for 2011 was $1.2 billion, up from $1.0 billion in 2010.
NBC highlights
NBC continued its trend of reporting strong results over the last few years with net income increasing $179 million to $1.2 billion in fiscal 2011. Personal and commercial banking (P&C), which represents nearly half of NBC’s operations, continued to drive the higher results as personal and mortgage loan volumes. And values continued to grow, reducing the effect of narrowing interest spreads where interest margin narrowed to 2.36% in 2011 from 2.48% in 2010. NBC continued to expand insurance activities during the year, achieving growth of 6%. NBC continues to be a market leader in dividend increases. The quarterly dividend was increased twice in fiscal 2011, first by 6.5% to $0.66 in Q1 and then by 9.1% to $0.71 in Q3.
NBC’s wealth management segment had its strongest fiscal year in recent years with net income increasing $47 million to $159 million, an increase of 42% from the previous year. A combination of higher interest
rates, acquisitions and high organic growth through a higher volume of transactions contributed to the strong results. As a result, assets under management have increased 7% to $56 billion. With five acquisitions completed in the past four years, NBC continues to look for opportunities for expansion nationally for its wealth management segment.
The financial markets segment’s net income increased 6% to $492 million with total revenues of $1.4 billion. The increase in net income was largely driven by banking services revenues including treasury operations and subsidiary activity. Overall trading activity revenues were down $49 million to $478 million, which can be mainly attributed to lower revenues on fixed-income securities. The decrease in trading activity is relatively consistent with the other banks. For 2012, the financial markets segment will concentrate resources in all targeted sectors for mid-market companies as well as continuing to expand in the structured products market.

Perspectives on the Canadian banking industry 51
Provisions for credit losses have continued to decline, falling to $134 million in 2011 compared to $144 million in 2010. That’s despite the continued economic uncertainty and growth in the personal and commercial portfolios. The majority of the provisions relate to the P&C segment where provisions have decreased on personal and credit card loans and increased on commercial credit. A one-time $5 million recovery, compared to $2 million provision in 2010, in the financial markets segment helped reduce the overall provisions for credit losses in the fiscal year.
NBC, unlike the other major banks is predominantly regionally focused in Quebec with limited international operations. This high-potential niche focus provides opportunity for the bank to continue with its strategic focus of its one client, one bank initiative. NBC expanded that strategy in Ontario, Western Canada and Atlantic Canada by pursuing opportunities outside of Quebec. In 2011, it completed the acquisition of three residential mortgage portfolios, in which 80% of the clients were outside of the province of Quebec.
In 2011, NBC had the following key corporate events aligned with its strategic priorities:
• Acquisition of Wellington West Holdings (Wellington West) for $279 million
• Agreement with HSBC Bank of Canada to acquire the full service investment advisory business HSBC Securities (Canada)
Given its limited operations internationally, NBC is not affected at the same level as the other banks with regards to regulatory changes. However, similar to the other Canadian banks, NBC is exposed to the European debt crisis. Net exposure is $736 million with $183 million to the European PIIGS, with the majority of the direct exposure to Spain.
According to NBC’s 2011 management discussion and analysis, NBC’s strategic priorities are largely driven around business or geographic expansion nationally including:
• Annual net income growth of 5%-10%, achieved through client service quality
• Generate sustained higher growth in P&C in Quebec, while expanding geographic diversification to help with long-term growth
• Fully integrate Wellington West to help expand Canadian presence in wealth management and financial markets, specifically in Ontario and British Columbia where 70% of the business is based

52 Canadian Banks 2012
RBC highlights
RBC had another strong year despite the macro economic challenges in 2011. Overall net income from continuing operations grew to $6.7 billion, a $918 million increase, led by strong business growth in the wealth management and Canadian banking and insurance operations as well as lower provisions for credit losses. RBC announced its first quarterly dividend increase in nearly four years during the second quarter, with an increase of 8.0% to $0.54.
The Canadian banking operations, consisting of the domestic and personal business operations, are the largest operating group of RBC in terms of revenue. Led by the personal financial group — which focuses on individual clients for financing and investor product services, personal lending, and deposit accounts — the Canadian banking operations saw non-interest and net interest revenues grow to $11.2 billion in 2011 from $10.6 billion in 2010. The growth is mainly attributed to home equity products, personal loans and personal deposits as well as higher overall mutual fund distribution fees.
RBC’s domestic wealth management division increased revenue by $222 million to $1.7 billion, largely driven by higher transaction volumes and an increase in assets under administration. Higher fee-based client assets largely in the US helped increase the international wealth management group’s revenue by 5% over the prior year. However, this increase was offset by a stronger Canadian dollar and spread compression, resulting in a decline of $4 million to $1.95 billion compared to the prior year.

Perspectives on the Canadian banking industry 53
Royal Bank of Canada’s net income from continuing operations for 2011 was $6.7 billion, up from $5.7 billion in 2010.
RBC’s insurance group, although continuing to be impacted by the overall low interest rate environment, was able to increase net income to $601 million in 2011 from $491 million in 2010. The growth was driven both domestically and internationally in all businesses as well as the result of lower claims in reinsurance, auto, and disability sectors.
RBC’s international banking group underwent significant changes during the year with the sale of the US retail banking business. For the purpose of the annual report, results of the US banking business were reported as part of discontinued operations. As reported, international banking, now comprised of banking operations in the Caribbean and the RBC Dexia Investor Services joint venture, saw net income grow to $173 million from $92 million. This was largely attributed to improved spreads on client cash deposits, higher transaction volumes, and higher assets under administration.
RBC’s capital markets group continued to be impacted by the challenging market conditions as well as the unfavourable impact of a stronger Canadian dollar. Net income decreased for the second consecutive year, decreasing $72 million to $1.58 billion. The decline was largely driven by the global markets business line, which saw revenue decrease $354 million to $3.45 billion, mainly attributed to lower fixed-income trading revenue in the US and Europe.
Provisions for credit losses have continued to improve over the past two years. In 2011, total provisions for credit losses decreased $265 million to $975 million. That was largely driven by lower write-offs in the credit card portfolio as well as lower provisions in business and personal lending.
In 2011, RBC had the following key corporate events:
• Completed the acquisition of BlueBay Asset Management for $1.5 billion
• Announced the sale of its US regional retail banking operations to PNC Financial Services Group for an estimated $3.6 billion
• Completed the divestiture of Liberty Life Insurance Company to Athene Holdings Ltd. for US$628 million
RBC’s 2012 business outlook and beyond, includes ongoing concerns of European sovereign debt as well international regulatory changes. RBC had direct exposure to Europe of $43.2 billion, concentrated predominantly with France, Germany and the UK. RBC has an overall exposure to the European PIIGS of $1.4 billion, with the majority of the exposure concentrated in Spain and Ireland. RBC continues to consider and address regulatory developments including Basel III but will need to be cognizant of the changing environment with new legislation such as Dodd-Frank as well as the Foreign Account Tax Compliance Act (FACTA).

54 Canadian Banks 2012
TD highlights
TD had another successful year in 2011 generating adjusted net income of $6.25 billion, up 20% from 2010 and adjusted revenue of $21.4 billion, up 9% from 2010. Cash dividends declared and paid in 2011 totalled $2.61 per share (2010 -$2.44). At October 31, 2011, the quarterly dividend was $0.68 per share which is consistent with the bank’s current target payout range of 35% to 45% of adjusted earnings.
The bank’s operations and activities are organized into the following business segments: Canadian personal and commercial banking (Canadian P&C), US personal and commercial banking (US P&C), wealth management, and wholesale banking.
The Canadian P&C business generated record net income of $3.6 billion compared to $3.1 billion in 2010. Revenues increased $439 million to $10.8 billion, which was mainly due to volume growth and strong insurance revenue. However, margin on average earning assets decreased 15 basis points to 2.77% compared to the prior year. The decrease
in margin was primarily attributable to the low-rate environment and competitive pricing. Similar challenges were experienced by the other Canadian banks. Provisions for credit losses (PCLs) in 2011 were $820 million, a decrease of $226 million, mainly due to improved credit portfolio performance and better collection strategies. Non-interest expenses for the year increased 2% to $5.05 billion due to continued investment in the business segment. The business outlook for 2012 is that the business will generate moderate earnings due to the impact of lower margins and slower underlying personal banking growth, consistent with the other major banks in Canada.
Wealth management net income for 2011 was $776 million, an increase of $135 million from 2010. Revenue for the year rose $322 million to $2.8 billion. Asset management revenue increased primarily due to growth in average client assets, which drove higher fee-based revenue. Direct investing revenue rose due to higher net interest income, higher client deposits, margin loans, and higher transaction volume. Non-interest expenses increased to $1.99 billion, an increase of $176 million compared with 2010, which was primarily driven by higher variable costs in the advice-based and asset management business. The business outlook for 2012 remains positive due to strong business fundamentals. Growth is expected, however, challenges such as economic uncertainty, operating in a low interest rate environment, and sustained pressure on margins will be present throughout 2012.
Toronto-Dominion Bank’s net income for 2011 was $5.9 billion, up from $4.6 billion in 2010.
Perspectives on the Canadian banking industry 55
Net income in the US P&C business increased $283 million to a record of $1.33 billion (in US dollar terms, net income increased $337 million from 2010). The increase was primarily due to higher core fee-based revenue, increased volume of loans and deposits, and lower PCLs. The increase was partially offset by higher expenses and the impact of Regulation E with respect to overdraft fees. Revenue for the year was US$5.8 billion, which was 26% higher than the prior year. The increase was driven by loan and deposit volume, higher fee-based revenue and the impact of acquisitions. Furthermore, the margin on average earning assets increased by 14 basis points. PCLs for the year increased 9% to US$677 million. The increase is primarily due to the impact of the acquired loan portfolios. Excluding the impact of acquisitions, PCLs for loans decreased by 32 basis points due to the continuing improvement in credit quality. The business outlook for 2012 is that revenue growth will be muted due to the impact of the Durbin amendment, the competitive banking environment, and the low-interest rate environment. This outlook is aligned with other US banks and Canadian banks with US-based subsidiaries.
Wholesale banking experienced a challenging year in 2011 due to a tough trading environment. Government issuers struggled with low growth as well as large debt and deficit burdens. This created market uncertainty over the resolution of these issues, which negatively affected investors’ confidence and further depressed markets. With continued uncertainty expected in the short term, TD expects lower levels of activity and further volatility in asset values. Net income for wholesale banking was $813 million, down $174 million compared to the prior year. The decrease was primarily attributed to lower client volumes, particularly in fixed-income trading in Europe and in the US. Declines were partially offset by stronger equity underwriting fees and increased security gains. Revenue for the year was $2.5 billion, a decrease of $372 million from the prior year. Capital markets revenue decreased due to lower revenue in fixed-income and credit trading. Despite the lower net income and revenue results, the return on invested capital for the year remained strong at 24.4%. However, this was lower than the 30.7% generated in 2010.
TD was one of the most active of the Canadian banks and its two key corporate events in 2011 were:
• The $7.8 billion purchase of MBNA Canada’s credit card business
• The $6.4 billion acquisition of Chrysler Financial
The acquisition of substantially all of MBNA Canada’s credit card portfolio was completed on December 1, 2011, as well as certain other assets and liabilities. At closing, the bank paid a premium of $75 million on the portfolio with the total acquisition costing approximately $7.8 billion. MBNA Canada was the largest MasterCard issuer in Canada and the fourth-largest credit card issuer in the country. With the acquisition of MBNA, the bank has significantly increased its credit card business and may position the bank to become the largest credit card issuer amongst its peers. The results of the MBNA Canada acquisition will be reflected in TD’s fiscal 2012 financial statements.
The other acquisition was for Chrysler Financial in Canada and the US. The acquisition closed in April 2011 for total cash consideration of approximately $6.4 billion. The results of Chrysler Financial for Canada and the US will be reported separately in the Canadian and US P&C segment, respectively. As of October 31, 2011, Chrysler Financial contributed $9.5 billion of loans and other assets and $3.1 billion of liabilities.
TD has a significant US presence primarily through its P&C operations, therefore, the developments in US legislation, specifically the enactment of Dodd-Frank, will have a significant impact on the bank. It continues to monitor the development of Dodd-Frank closely and other legislative developments. The bank will analyze the impact of such regulatory and legislative changes on its businesses. Similar to its Canadian peers, TD has limited exposure to European countries, specifically the PIIGS. TD’s total exposure as at October 31, 2011 was $1.04 billion (2010 – $1.83 billion).

56 Canadian Banks 2012

Perspectives on the Canadian banking industry 57
There has been some positive data coming out of the United States, but growth will also be impacted by the uncertainty surrounding Europe. As a consequence, most banks’ economists are forecasting gross domestic product (GDP) growth of around 2% for Canada and a similar number for the US, although the Federal Reserve is a little more positive about the United States’ prospects, predicting GDP growth in the 2.5% to 2.9% range.
Combine this with a decrease in the forecast for housing starts and the increases in property values that have pushed consumer debt-to-disposable income levels up to a record high for the Canadian market and the general expectation in the banking industry is that the rate of retail lending growth will be lower in 2012 than in 2011, albeit still positive in the mid-single digit range.
The above industry expectations also correspond to findings of PwC’s recently completed survey of consumers with regards to their credit expectations. The survey results indicate there has been a slight year-over-year increase in the proportion of consumers who responded that they wish to
reduce their debt levels in the coming 12 months. Interestingly though, despite concerns voiced in the media about consumer debt levels, 78% of respondents indicated that they still had the capacity to service more debt, a figure which was unchanged from last year’s result.
The industry is expecting that commercial lending will pick up and become the more significant driver of balance sheet and profit growth. Uncertainty has definitely impacted confidence and business investment decisions, but the major banks seem to agree that they should see an increase in demand for credit from businesses in the coming year.
The increased demand for credit from businesses is largely expected to result from an increase in business investment. Obviously there is some risk that the level of uncertainty may result in businesses continuing to postpone investment. Having said that, with European banks under pressure to shore up their capital positions, they may have limited appetite to increase the size of their balance sheets or they may seek to reduce the size of their balance sheets. This will present some opportunities to the Canadian banks, which all remain well capitalized.
Outlook
Canada’s own economic fundamentals remain sound, but growth forecasts have generally been revised downwards to take into account the impacts of continuing uncertainty in relation to the European debt crisis and decreased demand in Europe, which is having a global impact.

58 Canadian Banks 2012
In relation to potential opportunities presented by the pressure on European banks, the general impression left by comments made at the January 2011 RBC Capital Markets Canadian Bank CEO conference was that the Canadian banks are only really interested in opportunities that arise in the markets in which they are already operating and familiar with. In terms of the nature of opportunities, the European banks aren’t seen as big players in the syndicated loan market so while there is some benefit to be derived there, it is limited. In terms of asset portfolios, and in particular residential mortgage portfolios, the majority of the Canadian banks appear to have limited appetite for picking up such portfolios from the European banks. NBC is the one exception, indicating that it does like portfolio acquisitions given their relatively low integration risk.
Deposit balances are expected to continue to grow, with the rate of growth benefiting from the continuing volatility in the equity and bond markets and resultant reluctance to invest in such securities. Obviously if markets stabilize and confidence returns, there would be some drag on deposit growth, but it would take a very brave person to predict a resolution of the European debt crisis in the near term.
Margins are expected to continue to be compressed due to continued competitive pressures and the expectation that interest rates will remain flat. Increased funding costs remain a reality for the global banking industry. Having said that, it is definitely of relatively less concern for the Canadian banks compared to international peers, with a comparison by Scotiabank indicating that the Canadian banks were, in January, paying around 160bps for five-year notes. That compares to 200bps for JPMorgan Chase, Wells Fargo and Australia’s Big Four banks; 400bps for US banks such as Citigroup and Morgan Stanley, and 500bps for European banks such as RBS and Lloyds.
Margins are expected to continue to be compressed due to continued competitive pressures and the expectation that interest rates will remain flat.
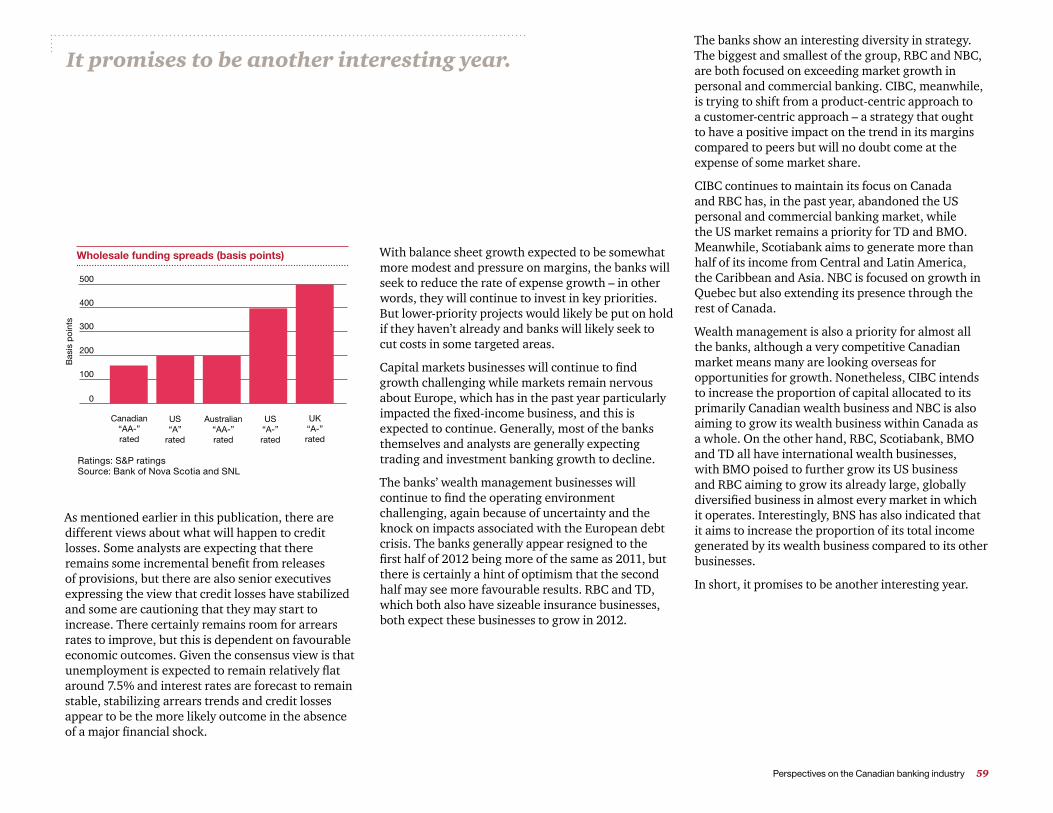
Perspectives on the Canadian banking industry 59
As mentioned earlier in this publication, there are different views about what will happen to credit losses. Some analysts are expecting that there remains some incremental benefit from releases of provisions, but there are also senior executives expressing the view that credit losses have stabilized and some are cautioning that they may start to increase. There certainly remains room for arrears rates to improve, but this is dependent on favourable economic outcomes. Given the consensus view is that unemployment is expected to remain relatively flat around 7.5% and interest rates are forecast to remain stable, stabilizing arrears trends and credit losses appear to be the more likely outcome in the absence of a major financial shock.
With balance sheet growth expected to be somewhat more modest and pressure on margins, the banks will seek to reduce the rate of expense growth – in other words, they will continue to invest in key priorities. But lower-priority projects would likely be put on hold if they haven’t already and banks will likely seek to cut costs in some targeted areas.
Capital markets businesses will continue to find growth challenging while markets remain nervous about Europe, which has in the past year particularly impacted the fixed-income business, and this is expected to continue. Generally, most of the banks themselves and analysts are generally expecting trading and investment banking growth to decline.
The banks’ wealth management businesses will continue to find the operating environment challenging, again because of uncertainty and the knock on impacts associated with the European debt crisis. The banks generally appear resigned to the first half of 2012 being more of the same as 2011, but there is certainly a hint of optimism that the second half may see more favourable results. RBC and TD, which both also have sizeable insurance businesses, both expect these businesses to grow in 2012.
It promises to be another interesting year.The banks show an interesting diversity in strategy. The biggest and smallest of the group, RBC and NBC, are both focused on exceeding market growth in personal and commercial banking. CIBC, meanwhile, is trying to shift from a product-centric approach to a customer-centric approach – a strategy that ought to have a positive impact on the trend in its margins compared to peers but will no doubt come at the expense of some market share.
CIBC continues to maintain its focus on Canada and RBC has, in the past year, abandoned the US personal and commercial banking market, while the US market remains a priority for TD and BMO. Meanwhile, Scotiabank aims to generate more than half of its income from Central and Latin America, the Caribbean and Asia. NBC is focused on growth in Quebec but also extending its presence through the rest of Canada.
Wealth management is also a priority for almost all the banks, although a very competitive Canadian market means many are looking overseas for opportunities for growth. Nonetheless, CIBC intends to increase the proportion of capital allocated to its primarily Canadian wealth business and NBC is also aiming to grow its wealth business within Canada as a whole. On the other hand, RBC, Scotiabank, BMO and TD all have international wealth businesses, with BMO poised to further grow its US business and RBC aiming to grow its already large, globally diversified business in almost every market in which it operates. Interestingly, BNS has also indicated that it aims to increase the proportion of its total income generated by its wealth business compared to its other businesses.
In short, it promises to be another interesting year.
Ratings: S&P ratings Source: Bank of Nova Scotia and SNL
0
100
200
300
400
500
0
100
200
300
400
500Canadian
“AA-”rated
US“A”
rated
Australian“AA-”rated
US“A-”rated
UK“A-”rated
Bas
is p
oint
s
Wholesale funding spreads (basis points)

60 Canadian Banks 2012
Shareholder value summary
Regulatory capital
Balance sheet highlights
Income statement highlights
Derivatives
Credit risk summary
Top 25 Canadian Banks
62646668707274
Appendix

Perspectives on the Canadian banking industry 61
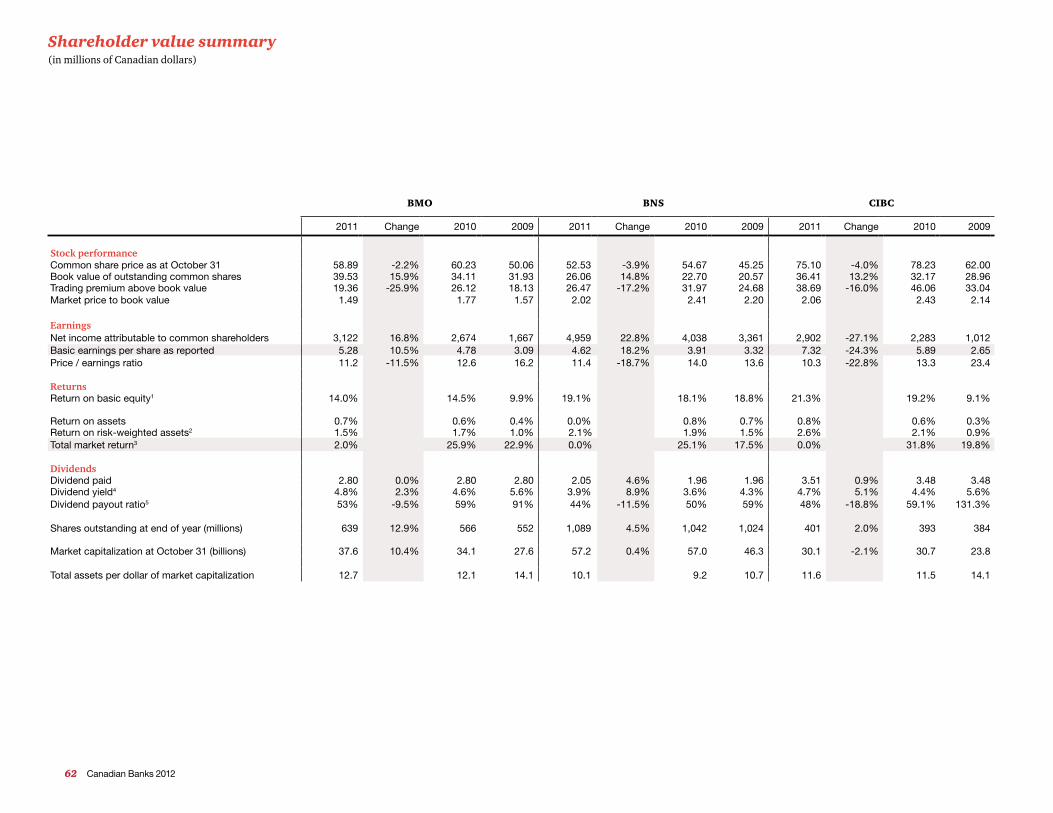
62 Canadian Banks 2012
Shareholder value summary(in millions of Canadian dollars)
BMO BNS CIBC
2011 Change 2010 2009 2011 Change 2010 2009 2011 Change 2010 2009
Stock performanceCommon share price as at October 31 58.89 -2.2% 60.23 50.06 52.53 -3.9% 54.67 45.25 75.10 -4.0% 78.23 62.00 Book value of outstanding common shares 39.53 15.9% 34.11 31.93 26.06 14.8% 22.70 20.57 36.41 13.2% 32.17 28.96Trading premium above book value 19.36 -25.9% 26.12 18.13 26.47 -17.2% 31.97 24.68 38.69 -16.0% 46.06 33.04Market price to book value 1.49 1.77 1.57 2.02 2.41 2.20 2.06 2.43 2.14
Earnings Net income attributable to common shareholders 3,122 16.8% 2,674 1,667 4,959 22.8% 4,038 3,361 2,902 -27.1% 2,283 1,012Basic earnings per share as reported 5.28 10.5% 4.78 3.09 4.62 18.2% 3.91 3.32 7.32 -24.3% 5.89 2.65 Price / earnings ratio 11.2 -11.5% 12.6 16.2 11.4 -18.7% 14.0 13.6 10.3 -22.8% 13.3 23.4 ReturnsReturn on basic equity1 14.0% 14.5% 9.9% 19.1% 18.1% 18.8% 21.3% 19.2% 9.1%
Return on assets 0.7% 0.6% 0.4% 0.0% 0.8% 0.7% 0.8% 0.6% 0.3%Return on risk-weighted assets2 1.5% 1.7% 1.0% 2.1% 1.9% 1.5% 2.6% 2.1% 0.9%Total market return3 2.0% 25.9% 22.9% 0.0% 25.1% 17.5% 0.0% 31.8% 19.8%
Dividends Dividend paid 2.80 0.0% 2.80 2.80 2.05 4.6% 1.96 1.96 3.51 0.9% 3.48 3.48Dividend yield4 4.8% 2.3% 4.6% 5.6% 3.9% 8.9% 3.6% 4.3% 4.7% 5.1% 4.4% 5.6%Dividend payout ratio5 53% -9.5% 59% 91% 44% -11.5% 50% 59% 48% -18.8% 59.1% 131.3%
Shares outstanding at end of year (millions) 639 12.9% 566 552 1,089 4.5% 1,042 1,024 401 2.0% 393 384
Market capitalization at October 31 (billions) 37.6 10.4% 34.1 27.6 57.2 0.4% 57.0 46.3 30.1 -2.1% 30.7 23.8
Total assets per dollar of market capitalization 12.7 12.1 14.1 10.1 9.2 10.7 11.6 11.5 14.1
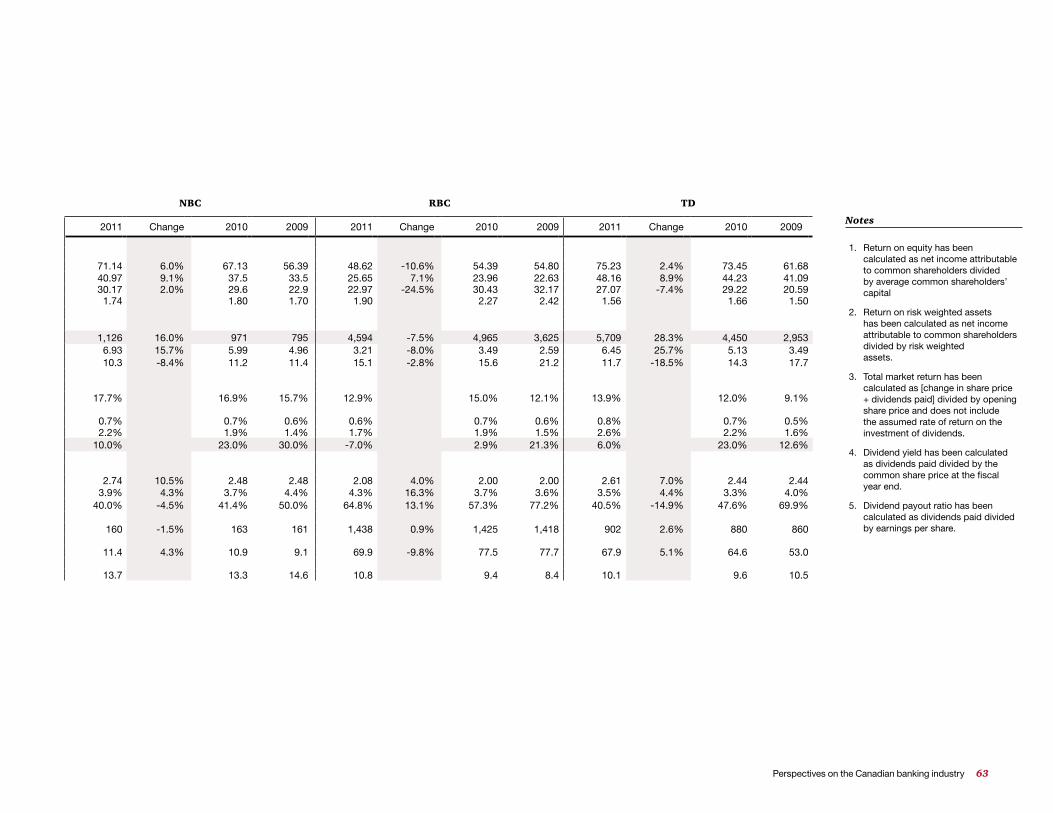
Perspectives on the Canadian banking industry 63
NBC RBC TD
2011 Change 2010 2009 2011 Change 2010 2009 2011 Change 2010 2009
71.14 6.0% 67.13 56.39 48.62 -10.6% 54.39 54.80 75.23 2.4% 73.45 61.68 40.97 9.1% 37.5 33.5 25.65 7.1% 23.96 22.63 48.16 8.9% 44.23 41.0930.17 2.0% 29.6 22.9 22.97 -24.5% 30.43 32.17 27.07 -7.4% 29.22 20.59
1.74 1.80 1.70 1.90 2.27 2.42 1.56 1.66 1.50
1,126 16.0% 971 795 4,594 -7.5% 4,965 3,625 5,709 28.3% 4,450 2,953 6.93 15.7% 5.99 4.96 3.21 -8.0% 3.49 2.59 6.45 25.7% 5.13 3.49 10.3 -8.4% 11.2 11.4 15.1 -2.8% 15.6 21.2 11.7 -18.5% 14.3 17.7
17.7% 16.9% 15.7% 12.9% 15.0% 12.1% 13.9% 12.0% 9.1%
0.7% 0.7% 0.6% 0.6% 0.7% 0.6% 0.8% 0.7% 0.5%2.2% 1.9% 1.4% 1.7% 1.9% 1.5% 2.6% 2.2% 1.6%
10.0% 23.0% 30.0% -7.0% 2.9% 21.3% 6.0% 23.0% 12.6%
2.74 10.5% 2.48 2.48 2.08 4.0% 2.00 2.00 2.61 7.0% 2.44 2.443.9% 4.3% 3.7% 4.4% 4.3% 16.3% 3.7% 3.6% 3.5% 4.4% 3.3% 4.0%
40.0% -4.5% 41.4% 50.0% 64.8% 13.1% 57.3% 77.2% 40.5% -14.9% 47.6% 69.9%
160 -1.5% 163 161 1,438 0.9% 1,425 1,418 902 2.6% 880 860
11.4 4.3% 10.9 9.1 69.9 -9.8% 77.5 77.7 67.9 5.1% 64.6 53.0
13.7 13.3 14.6 10.8 9.4 8.4 10.1 9.6 10.5
Notes
1. Return on equity has been calculated as net income attributable to common shareholders divided by average common shareholders’ capital
2. Return on risk weighted assets has been calculated as net income attributable to common shareholders divided by risk weighted assets.
3. Total market return has been calculated as [change in share price + dividends paid] divided by opening share price and does not include the assumed rate of return on the investment of dividends.
4. Dividend yield has been calculated as dividends paid divided by the common share price at the fiscal year end.
5. Dividend payout ratio has been calculated as dividends paid divided by earnings per share.

64 Canadian Banks 2012
Regulatory capital1
(in millions of Canadian dollars)
BMO BNS CIBC
2011 Change 2010 2009 2011 Change 2010 2009 2011 Change 2010 2009
Tier 1 capital Common shareholders' equity 24,455 18,753 17,132 27,932 23,199 20,945 15,071 12,995 11,489 OCI – accumulated foreign currency translation losses (650) (575) (495)Non-cumulative preferred shares 2,861 2,571 2,571 4,384 3,975 3,710 2,756 3,156 3,756 Innovative Tier 1 capital 2,156 2,542 2,907 2,900 3,400 3,400 1,600 1,599 1,599 Non-controlling interests 38 23 26 640 579 554 164 168 174 Less: Goodwill and excess intangible assets (3,585) (1,619) (1,569) (4,377) (3,050) (2,908) (1,894) (1,913) (1,997)Adjustments to Tier 1 capital (854) (592) (605) (2,990) (2,769) (2,051) (839) (579) (372)Total Tier 1 capital 25,071 15.7% 21,678 20,462 28,489 12.5% 25,334 23,650 16,208 9.1% 14,851 14,154 Tier 2 capital Subordinated debt 5,896 3,776 4,236 5,723 5,790 5,833 4,975 4,674 5,022 Trust subordinated notes 800 800 800 1,000 1,000 1,000 – – –Accumulated unrealized gain from AFS securities 7 10 152 176 6 5 4 –Eligible general allowance for credit losses 309 292 296 353 574 570 108 126 –Other adjustments to capital 2 (1,091) (919) (935) (3,184) (3,275) (2,471) (1,009) (689) (349)Total Tier 2 capital 5,921 49.6% 3,959 4,397 4,044 -5.2% 4,265 4,938 4,079 -0.9% 4,115 4,673
Total regulatory capital 30,992 20.9% 25,637 24,859 32,533 9.9% 29,599 28,588 20,287 7.0% 18,966 18,827
Risk weighted capital ratio Tier 1 12.0% 13.5% 12.2% 12.2% 11.8% 10.7% 14.7% 13.9% 12.1%Total capital ratio 14.9% 15.9% 14.9% 13.9% 13.8% 12.9% 18.4% 17.8% 16.1%
Risk-weighted assetsCredit risk 179,092 136,290 143,098 200,800 180,500 187,800 90,110 86,782 97,190 Market risk 4,971 5,217 6,578 5,900 10,500 11,400 1,646 1,625 1,321 Operational risk 24,609 19,658 17,525 27,300 24,000 22,400 18,212 18,256 18,787 Total risk-weighted assets 208,672 29.5% 161,165 167,201 234,000 8.8% 215,000 221,600 109,968 3.1% 106,663 117,298
Assets to capital multiple 13.7 -5.5% 14.5 14.1 16.6 -2.4% 17.0 16.6 16.0 -5.9% 17.0 16.3
Tangible common equity to risk-weighted assets 11.7% 0.7% 11.6% 10.2% 11.9% 10.6% 10.8% 9.5% 13.7% 12.5% 12.2% 9.8%
Total assets to risk-weighted assets 228.8% -10.4% 255.4% 232.3% 245.8% 0.4% 245.0% 224.1% 318.3% -3.6% 330.0% 286.4%
Total general allowance as a percentage of risk adjusted assets 0.63% 0.80% 0.78% 0.58% 0.66% 0.65% 0.93% 1.08% 1.04%
Total general allowance 1,318 1,297 1,306 1,352 1,410 1,450 1,018 1,153 1,225

Perspectives on the Canadian banking industry 65
NBC3 RBC TD
2011 Change 2010 2009 2011 Change 2010 2009 2011 Change 2010 2009
6,432 5,934 5,282 38,471 36,229 33,790 42,921 37,903 34,310 (130) (133) (100) (3,199) (2,901) (1,539) 762 1,089 1,089 4,810 4,810 4,811 3,395 3,944 3,945 975 975 971 2,582 3,327 3,991 3,705 3,844 4,588
28 25 19 30 351 353 – – 31 (1,001) (744) (781) (7,703) (8,064) (8,368) (14,376) (14,460) (15,015)
(212) (176) (215) (2,477) (2,681) (2,803) (3,943) (3,944) (4,913) 6,854 -1.7% 6,970 6,265 35,713 5.1% 33,972 31,774 28,503 16.9% 24,386 21,407
1,883 1,894 1,897 7,669 6,641 6,461 11,253 11,812 11,948 – – 1,027 1,023 1,017 –
– 13 – – – – 35 66 42 48 79 456 430 517 575 940 915 877
(286) (259) (219) (3,818) (4,528) (4,946) (5,753) (6,109) (5,936) 1,645 -4.7% 1,727 2,134 5,308 45.3% 3,653 3,107 6,475 -3.1% 6,684 6,931
8,499 -2.3% 8,697 8,399 41,021 9.0% 37,625 34,881 34,978 12.6% 31,070 28,338
13.6% 14.0% 10.7% 13.3% 13.0% 13.0% 13.0% 12.2% 11.3% 16.9% 17.5% 14.3% 15.3% 14.4% 14.2% 16.0% 15.5% 14.9%
40,277 39,811 48,589 206,151 197,195 185,051 183,405 167,297 160,465 2,478 3,226 3,894 21,346 24,828 23,321 5,083 4,474 3,735 7,665 6,794 6,124 40,283 38,433 36,465 30,291 28,139 25,385
50,420 1.2% 49,831 58,607 267,780 2.8% 260,456 244,837 218,779 9.4% 199,910 189,585
17.1 7.5% 15.9 15.4 16.1 -2.4% 16.5 16.3 17.2 -1.7% 17.5 17.1
12.8% 7.1% 11.9% 9.0% 14.4% 3.3% 13.9% 13.8% 19.6% 3.5% 19.0% 18.1%
310.0% 6.3% 291.6% 225.5% 280.7% 0.7% 278.8% 267.5% 313.7% 1.2% 309.9% 293.9%
0.63% 0.86% 0.78% 0.49% 0.51% 0.83% 0.75% 0.82% 0.95%
318 429 456 1,312 1,317 2,023 1,643 1,632 1,810
Notes
1. Regulatory capital and risk weighted assets are calculated under Basel II guidelines.
2. Includes requirements for insurance entities, non-consolidated subsidiaries, substantial investments, securitization-related deduction, expected loss in excess of allowance, and other deductions.
3. For NBC, off-balance sheet assets have been included with market risk.
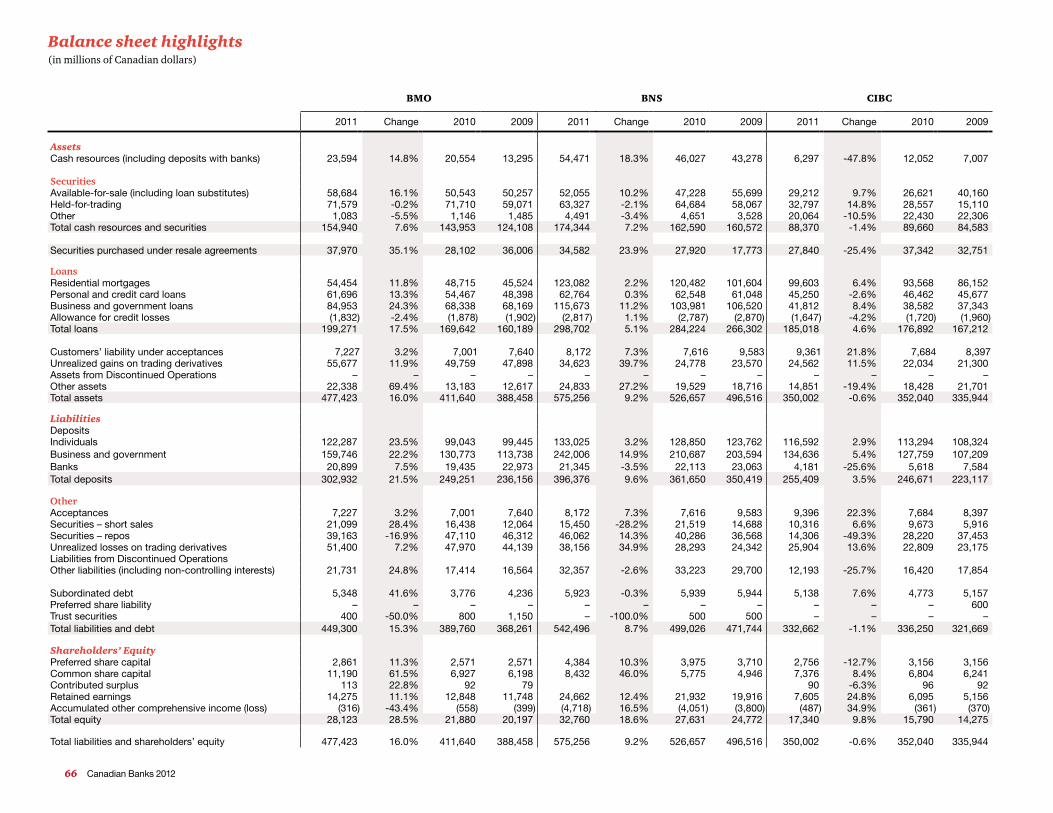
66 Canadian Banks 2012
Balance sheet highlights(in millions of Canadian dollars)
BMO BNS CIBC
2011 Change 2010 2009 2011 Change 2010 2009 2011 Change 2010 2009
AssetsCash resources (including deposits with banks) 23,594 14.8% 20,554 13,295 54,471 18.3% 46,027 43,278 6,297 -47.8% 12,052 7,007
SecuritiesAvailable-for-sale (including loan substitutes) 58,684 16.1% 50,543 50,257 52,055 10.2% 47,228 55,699 29,212 9.7% 26,621 40,160 Held-for-trading 71,579 -0.2% 71,710 59,071 63,327 -2.1% 64,684 58,067 32,797 14.8% 28,557 15,110 Other 1,083 -5.5% 1,146 1,485 4,491 -3.4% 4,651 3,528 20,064 -10.5% 22,430 22,306 Total cash resources and securities 154,940 7.6% 143,953 124,108 174,344 7.2% 162,590 160,572 88,370 -1.4% 89,660 84,583
Securities purchased under resale agreements 37,970 35.1% 28,102 36,006 34,582 23.9% 27,920 17,773 27,840 -25.4% 37,342 32,751
LoansResidential mortgages 54,454 11.8% 48,715 45,524 123,082 2.2% 120,482 101,604 99,603 6.4% 93,568 86,152 Personal and credit card loans 61,696 13.3% 54,467 48,398 62,764 0.3% 62,548 61,048 45,250 -2.6% 46,462 45,677 Business and government loans 84,953 24.3% 68,338 68,169 115,673 11.2% 103,981 106,520 41,812 8.4% 38,582 37,343 Allowance for credit losses (1,832) -2.4% (1,878) (1,902) (2,817) 1.1% (2,787) (2,870) (1,647) -4.2% (1,720) (1,960)Total loans 199,271 17.5% 169,642 160,189 298,702 5.1% 284,224 266,302 185,018 4.6% 176,892 167,212
Customers’ liability under acceptances 7,227 3.2% 7,001 7,640 8,172 7.3% 7,616 9,583 9,361 21.8% 7,684 8,397 Unrealized gains on trading derivatives 55,677 11.9% 49,759 47,898 34,623 39.7% 24,778 23,570 24,562 11.5% 22,034 21,300 Assets from Discontinued Operations – – – – – – – – – – – –Other assets 22,338 69.4% 13,183 12,617 24,833 27.2% 19,529 18,716 14,851 -19.4% 18,428 21,701 Total assets 477,423 16.0% 411,640 388,458 575,256 9.2% 526,657 496,516 350,002 -0.6% 352,040 335,944
LiabilitiesDepositsIndividuals 122,287 23.5% 99,043 99,445 133,025 3.2% 128,850 123,762 116,592 2.9% 113,294 108,324 Business and government 159,746 22.2% 130,773 113,738 242,006 14.9% 210,687 203,594 134,636 5.4% 127,759 107,209 Banks 20,899 7.5% 19,435 22,973 21,345 -3.5% 22,113 23,063 4,181 -25.6% 5,618 7,584 Total deposits 302,932 21.5% 249,251 236,156 396,376 9.6% 361,650 350,419 255,409 3.5% 246,671 223,117
OtherAcceptances 7,227 3.2% 7,001 7,640 8,172 7.3% 7,616 9,583 9,396 22.3% 7,684 8,397 Securities – short sales 21,099 28.4% 16,438 12,064 15,450 -28.2% 21,519 14,688 10,316 6.6% 9,673 5,916 Securities – repos 39,163 -16.9% 47,110 46,312 46,062 14.3% 40,286 36,568 14,306 -49.3% 28,220 37,453 Unrealized losses on trading derivatives 51,400 7.2% 47,970 44,139 38,156 34.9% 28,293 24,342 25,904 13.6% 22,809 23,175 Liabilities from Discontinued Operations Other liabilities (including non-controlling interests) 21,731 24.8% 17,414 16,564 32,357 -2.6% 33,223 29,700 12,193 -25.7% 16,420 17,854
Subordinated debt 5,348 41.6% 3,776 4,236 5,923 -0.3% 5,939 5,944 5,138 7.6% 4,773 5,157 Preferred share liability – – – – – – – – – – – 600 Trust securities 400 -50.0% 800 1,150 – -100.0% 500 500 – – – –Total liabilities and debt 449,300 15.3% 389,760 368,261 542,496 8.7% 499,026 471,744 332,662 -1.1% 336,250 321,669
Shareholders’ Equity Preferred share capital 2,861 11.3% 2,571 2,571 4,384 10.3% 3,975 3,710 2,756 -12.7% 3,156 3,156 Common share capital 11,190 61.5% 6,927 6,198 8,432 46.0% 5,775 4,946 7,376 8.4% 6,804 6,241 Contributed surplus 113 22.8% 92 79 90 -6.3% 96 92 Retained earnings 14,275 11.1% 12,848 11,748 24,662 12.4% 21,932 19,916 7,605 24.8% 6,095 5,156 Accumulated other comprehensive income (loss) (316) -43.4% (558) (399) (4,718) 16.5% (4,051) (3,800) (487) 34.9% (361) (370)Total equity 28,123 28.5% 21,880 20,197 32,760 18.6% 27,631 24,772 17,340 9.8% 15,790 14,275
Total liabilities and shareholders’ equity 477,423 16.0% 411,640 388,458 575,256 9.2% 526,657 496,516 350,002 -0.6% 352,040 335,944

Perspectives on the Canadian banking industry 67
NBC RBC TD
2011 Change 2010 2009 2011 Change 2010 2009 2011 Change 2010 2009
2,858 25.7% 2,274 2,228 25,428 17.2% 21,694 17,276 24,111 11.1% 21,710 21,517
15,884 44.4% 10,997 13,281 34,284 -11.2% 38,594 46,210 117,269 14.6% 102,355 84,841 42,295 -2.3% 43,271 36,952 145,274 0.2% 144,925 140,062 68,279 14.7% 59,542 54,320
– – – – – – – – 6,990 -28.0% 9,715 9,662 61,037 7.9% 56,542 52,461 204,986 -0.1% 205,213 203,548 216,649 12.1% 193,322 170,340
9,388 -13.7% 10,878 7,637 84,947 16.8% 72,698 41,580 53,599 5.8% 50,658 32,948
17,569 11.2% 15,806 14,961 134,804 6.3% 126,790 122,130 86,769 21.3% 71,507 65,665 22,906 11.5% 20,549 18,313 91,199 6.7% 85,435 80,243 119,283 8.7% 109,750 102,509 23,896 11.3% 21,469 20,003 72,239 15.0% 62,819 81,778 93,245 2.4% 91,072 87,322
(550) -13.5% (636) (640) (1,958) -3.9% (2,038) (3,188) (2,313) 0.2% (2,309) (2,368) 63,821 11.6% 57,188 52,637 296,284 8.5% 273,006 280,963 296,984 10.0% 270,020 253,128
7,394 24.4% 5,946 5,733 7,689 4.3% 7,371 9,024 7,815 0.7% 7,757 9,946 7,348 0.5% 7,309 6,798 115,565 13.3% 102,021 86,165 49,244 19.0% 41,368 40,654
– – – – 27,143 -21.0% 34,364 – – – – – 7,309 -1.7% 7,438 6,872 15,088 -52.2% 31,533 33,709 62,069 10.0% 56,420 50,203
156,297 7.6% 145,301 132,138 751,702 3.5% 726,206 654,989 686,360 10.8% 619,545 557,219
35,695 4.6% 34,112 34,609 166,030 9.7% 151,347 152,328 268,669 7.8% 249,251 223,228 46,589 11.0% 41,985 36,698 258,494 8.1% 239,233 220,772 200,779 19.4% 168,212 162,326 4,830 -15.1% 5,688 3,863 19,657 -18.0% 23,981 25,204 11,666 -6.7% 12,508 5,480
87,114 6.5% 81,785 75,170 444,181 7.1% 414,561 398,304 481,114 11.9% 429,971 391,034
7,394 24.4% 5,946 5,733 7,689 4.3% 7,371 9,024 7,815 0.7% 7,757 9,946 18,181 -0.6% 18,292 13,221 44,284 -5.0% 46,597 41,359 24,434 3.1% 23,695 17,641 13,837 10.6% 12,513 12,736 46,188 12.1% 41,207 35,150 25,625 0.8% 25,426 16,472 7,564 17.9% 6,418 5,859 117,807 12.4% 104,832 79,747 55,070 20.6% 45,674 41,049
20,071 -17.9% 24,454 12,871 15.9% 11,106 10,925 22,026 -46.0% 40,825 46,643 33,748 6.7% 31,632 28,529
2,000 -1.6% 2,033 2,017 7,749 16.0% 6,681 6,461 11,670 -6.7% 12,506 12,383 – – – – – – – – 32 -94.5% 582 550 – – – – – -100.0% 727 1,395 – – – 895
148,961 7.9% 138,093 125,661 709,995 3.3% 687,255 618,083 639,508 10.8% 577,243 518,499
762 -30.0% 1,089 1,089 4,813 0.0% 4,813 4,811 3,395 0.0% 3,394 3,395 2,016 11.8% 1,804 1,729 14,025 5.5% 13,295 12,980 18,301 10.0% 16,639 15,342
55 -16.7% 66 48 212 -10.2% 236 246 281 -7.9% 305 336 4,361 6.9% 4,081 3,515 24,282 6.9% 22,706 20,585 24,339 16.1% 20,959 18,632
142 -15.5% 168 96 (1,625) -22.6% (2,099) (1,716) 536 -46.7% 1,005 1,015 7,336 1.8% 7,208 6,477 41,707 7.1% 38,951 36,906 46,852 10.8% 42,302 38,720
156,297 7.6% 145,301 132,138 751,702 3.5% 726,206 654,989 686,360 10.8% 619,545 557,219

68 Canadian Banks 2012
Income statement highlights(in millions of Canadian dollars)
BMO BNS CIBC
2011 Change 2010 2009 2011 Change 2010 2009 2011 Change 2010 2009
Interest and dividend income Loans 8,348 14.8% 7,270 7,960 13,479 8.9% 12,372 14,363 8,073 7.9% 7,481 7,507 Securities 2,437 14.2% 2,134 2,427 4,887 15.6% 4,227 4,090 1,963 25.7% 1,562 1,705 Deposits with banks 130 75.7% 74 186 346 18.5% 292 482 63 21.2% 52 85
Total interest income 10,915 15.2% 9,478 10,573 18,712 10.8% 16,891 18,935 10,099 11.0% 9,095 9,297
Interest expenseDeposits 2,641 11.8% 2,362 4,041 7,598 12.3% 6,768 8,339 2,787 27.1% 2,192 2,879 Subordinated debt 157 31.9% 119 135 315 9.0% 289 285 215 14.4% 188 208 Other1 1,038 36.2% 762 827 1,529 26.1% 1,213 1,983 747 46.2% 511 816
Total interest expense 3,836 18.3% 3,243 5,003 9,442 14.2% 8,270 10,607 3,749 29.7% 2,891 3,903
Net interest income 7,079 13.5% 6,235 5,570 9,270 7.5% 8,621 8,328 6,350 2.4% 6,204 5,394 Provision for credit losses 857 -18.3% 1,049 1,603 1,046 -15.6% 1,239 1,744 841 -19.6% 1,046 1,649 Net interest income after provision for credit losses 6,222 20.0% 5,186 3,967 8,224 11.4% 7,382 6,584 5,509 6.8% 5,158 3,745
Other incomeCapital market fees 1,698 13.7% 1,493 1,370 624 11.2% 561 620 1,010 12.2% 900 950 Card service fees 145 -37.8% 233 121 469 10.1% 426 424 99 -67.4% 304 328 Foreign exchange other than trading 93 0.0% 93 53 368 9.2% 337 373 237 -65.3% 683 496 Insurance income (net) 283 -11.8% 321 295 320 15.5% 277 258 Investment management fees 495 39.4% 355 344 1,013 29.7% 781 728 486 5.9% 459 419 AFS/investment securities gains (losses) 172 14.7% 150 (354) 239 -32.7% 355 (412) 273 -222.4% (223) 242 Lending fees 577 0.9% 572 556 868 4.5% 831 866 381 11.7% 341 304 Mutual fund revenues 633 15.1% 550 467 1,100 89.0% 582 371 849 13.0% 751 658 Securitization revenues 821 21.1% 678 929 236 90.3% 124 409 1,063 68.5% 631 518 Service charges 834 4.0% 802 820 922 4.4% 883 905 756 0.0% 756 773 Trading income (loss) 571 -13.3% 504 723 740 -27.2% 1,016 1,057 (74) 112.3% 603 (531)Other revenues 317 41.5% 224 170 1,439 45.6% 988 788 499 25.1% 399 119
Total other income 6,639 11.1% 5,975 5,494 8,018 16.5% 6,884 6,129 5,899 -0.3% 5,881 4,534
Non-interest expenses Employee compensation and benefits 4,881 11.8% 4,364 4,385 5,399 16.2% 4,647 4,344 4,163 7.5% 3,871 3,610 Premises and equipment costs 1,566 16.6% 1,343 1,281 1,719 12.6% 1,526 1,543 1,658 0.4% 1,651 1,607 Other expenses 2,158 14.6% 1,883 1,715 2,446 21.8% 2,009 2,032 1,529 1.6% 1,505 1,443
Total other expenses 8,605 13.4% 7,590 7,381 9,564 16.9% 8,182 7,919 7,350 4.6% 7,027 6,660
Income (loss) before income taxes and non-controlling interest in subsidiaries
4,256
19.2%
3,571
2,080
6,678
9.8%
6,084
4,794
4,058
1.1%
4,012
1,619
Provision for (recovery of) income taxes 917 33.5% 687 217 1,410 -19.2% 1,745 1,133 969 -36.8% 1,533 424 Non-controlling interest 73 -1.4% 74 76 93 -7.0% 100 114 10 -63.0% 27 21 Discontinued operations – – – – – – – – – – – –Net income (loss) 3,266 16.2% 2,810 1,787 5,175 22.1% 4,239 3,547 3,079 25.6% 2,452 1,174
Less: Preferred dividends 144 5.9% 136 120 216 7.5% 201 186 177 4.7% 169 162
Net income (loss) attributable to common shareholders 3,122 16.8% 2,674 1,667 4,959 22.8% 4,038 3,361 2,902 27.1% 2,283 1,012

Perspectives on the Canadian banking industry 69
NBC RBC TD
2011 Change 2010 2009 2011 Change 2010 2009 2011 Change 2010 2009
2,301 19.6% 1,924 2,029 13,711 5.7% 12,968 13,371 13,941 7.7% 12,939 13,691 1,059 9.9% 964 1,155 5,118 8.5% 4,719 5,739 4,164 10.2% 3,780 4,754
15 200.0% 5 12 91 54.2% 59 162 354 -47.0% 668 442
3,375 16.7% 2,893 3,196 18,920 6.6% 17,746 19,272 18,459 6.2% 17,387 18,887
808 34.9% 599 820 5,242 6.6% 4,917 6,426 4,289 -6.3% 4,578 5,818 92 -8.0% 100 102 353 -83.8% 2,184 1,790 659 -1.2% 667 671
524 85.8% 282 308 2,725 787.6% 307 351 680 13.5% 599 1,072
1,424 45.2% 981 1,230 8,320 12.3% 7,408 8,567 5,628 -3.7% 5,844 7,561
1,951 2.0% 1,912 1,966 10,600 2.5% 10,338 10,705 12,831 11.2% 11,543 11,326 119 -17.4% 144 305 975 -21.4% 1,240 2,167 1,465 -9.8% 1,625 2,480
1,832 3.6% 1,768 1,661 9,625 5.8% 9,098 8,538 11,366 14.6% 9,918 8,846
635 11.6% 569 549 2,818 14.4% 2,464 2,406 1,468 6.5% 1,379 1,303 40 -4.8% 42 37 646 24.0% 521 728 961 17.2% 820 733
105 -3.7% 109 110 683 12.3% 608 635 180 11.8% 161 201 127 5.0% 121 117 1,119 19.2% 939 1,025 1,173 14.1% 1,028 913
1,998 12.6% 1,774 1,615 215 13.8% 189 191 85 -24.8% 113 (97) 128 236.8% 38 (611) 393 424.0% 75 (437)
329 4.8% 314 259 707 13.8% 621 522 687 8.4% 634 622 427 14.2% 374 327 1,977 25.8% 1,571 1,400 941 9.9% 856 718 338 17.0% 289 351 797 4.3% 764 1,169 450 -8.0% 489 468 228 -0.4% 229 230 1,324 0.2% 1,321 1,299 1,602 -3.0% 1,651 1,507
22 -128.2% (78) 12 800 -40.0% 1,333 2,380 43 -91.1% 484 685 305 7.4% 284 270 473 93.9% 244 126 650 153.9% 256 (370)
2,641 11.6% 2,366 2,165 13,470 10.4% 12,198 12,694 8,763 9.2% 8,022 6,534
1,750 7.8% 1,624 1,538 8,958 6.3% 8,430 8,480 6,723 12.8% 5,960 5,839
551 1.3% 544 582 2,038 7.0% 1,904 1,892 2,085 -1.5% 2,116 2,110 621 -3.4% 643 542 3,457 10.3% 3,135 3,064 4,275 4.6% 4,087 4,262
2,922 3.9% 2,811 2,662 14,453 7.3% 13,469 13,436 13,083 7.6% 12,163 12,211
1,551
17.2%
1,323
1,164
8,642
10.4%
7,827
7,796
7,046
22.0%
5,777
3,169
284 28.5% 221 252 1,888 -5.4% 1,996 2,015 1,299 2.9% 1,262 241 54 -20.6% 68 58 104 5.1% 99 100 (142) -10.1% (129) (192)
– – – – (1,798) 253.2% (509) (1,823) – – – – 1,213 17.3% 1,034 854 4,852 -7.1% 5,223 3,858 5,889 26.8% 4,644 3,120
87 38.1% 63 59 258 0.0% 258 233 180 -7.2% 194 167
1,126 16.0% 971 795 4,594 -7.5% 4,965 3,625 5,709 28.3% 4,450 2,953
Notes
1. Includes interest on preferred share liabilities, trust securities and other liabilities.
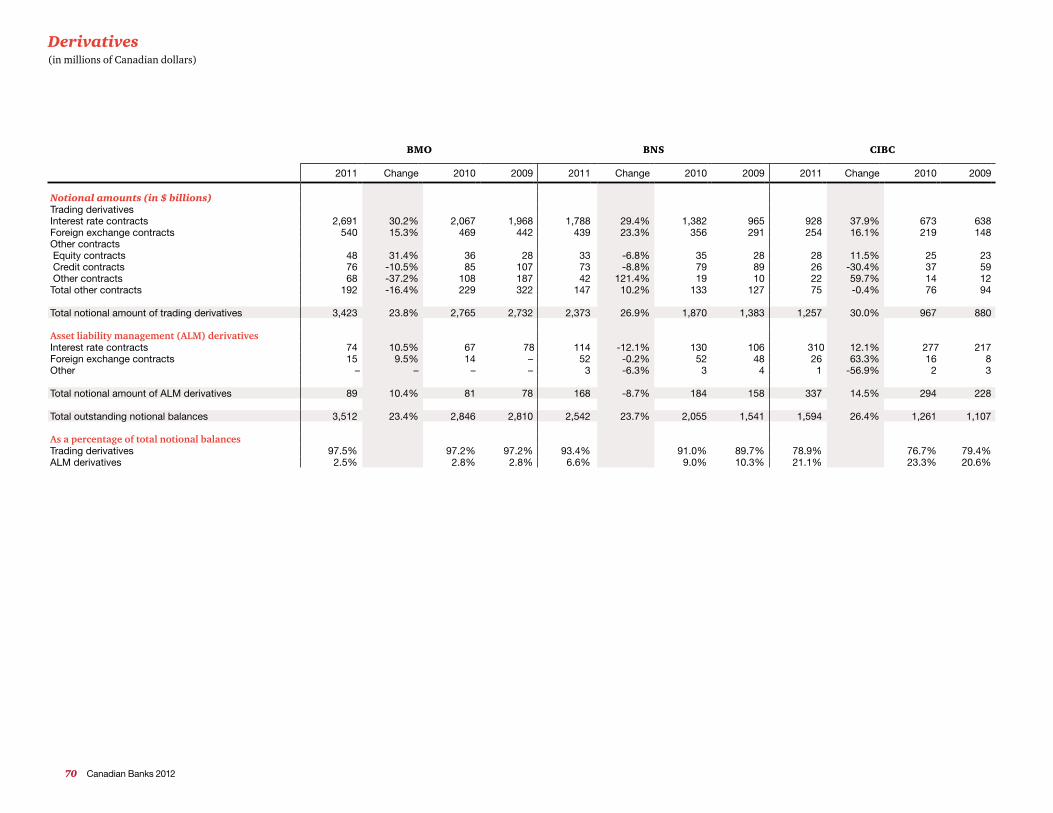
70 Canadian Banks 2012
Derivatives(in millions of Canadian dollars)
BMO BNS CIBC
2011 Change 2010 2009 2011 Change 2010 2009 2011 Change 2010 2009
Notional amounts (in $ billions) Trading derivatives Interest rate contracts 2,691 30.2% 2,067 1,968 1,788 29.4% 1,382 965 928 37.9% 673 638 Foreign exchange contracts 540 15.3% 469 442 439 23.3% 356 291 254 16.1% 219 148 Other contracts Equity contracts 48 31.4% 36 28 33 -6.8% 35 28 28 11.5% 25 23 Credit contracts 76 -10.5% 85 107 73 -8.8% 79 89 26 -30.4% 37 59 Other contracts 68 -37.2% 108 187 42 121.4% 19 10 22 59.7% 14 12 Total other contracts 192 -16.4% 229 322 147 10.2% 133 127 75 -0.4% 76 94
Total notional amount of trading derivatives 3,423 23.8% 2,765 2,732 2,373 26.9% 1,870 1,383 1,257 30.0% 967 880
Asset liability management (ALM) derivatives Interest rate contracts 74 10.5% 67 78 114 -12.1% 130 106 310 12.1% 277 217 Foreign exchange contracts 15 9.5% 14 – 52 -0.2% 52 48 26 63.3% 16 8 Other – – – – 3 -6.3% 3 4 1 -56.9% 2 3
Total notional amount of ALM derivatives 89 10.4% 81 78 168 -8.7% 184 158 337 14.5% 294 228
Total outstanding notional balances 3,512 23.4% 2,846 2,810 2,542 23.7% 2,055 1,541 1,594 26.4% 1,261 1,107
As a percentage of total notional balances Trading derivatives 97.5% 97.2% 97.2% 93.4% 91.0% 89.7% 78.9% 76.7% 79.4%ALM derivatives 2.5% 2.8% 2.8% 6.6% 9.0% 10.3% 21.1% 23.3% 20.6%
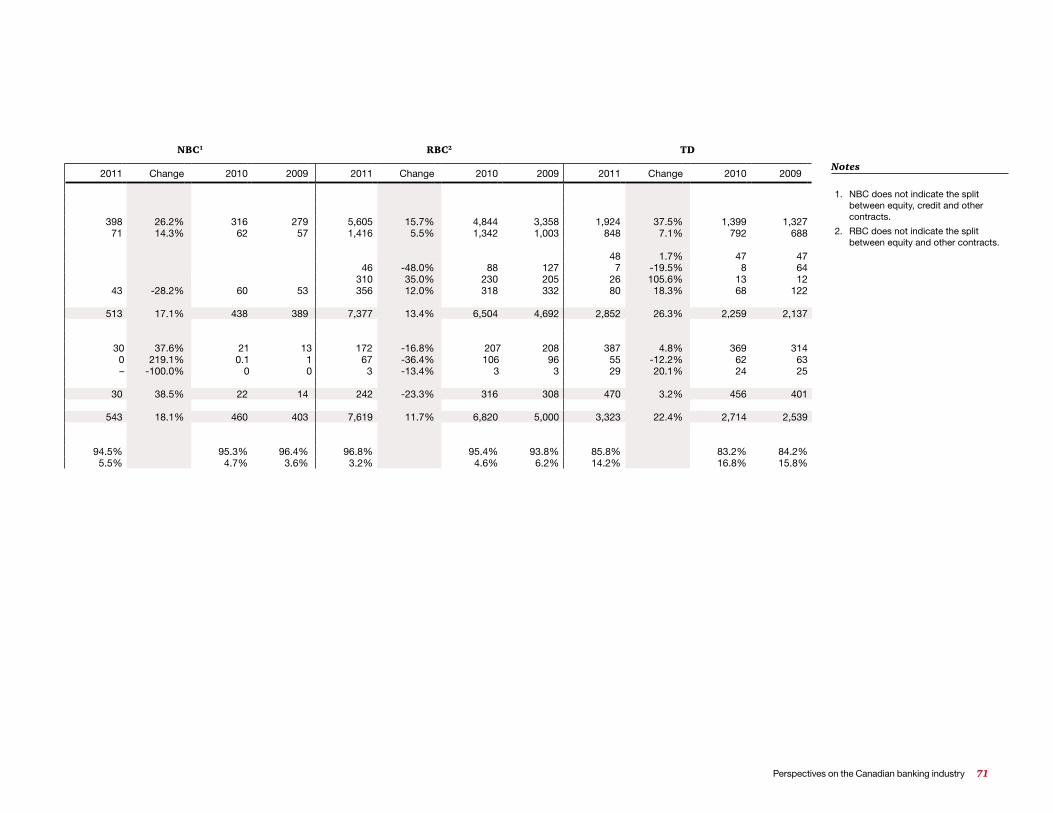
Perspectives on the Canadian banking industry 71
NBC1 RBC2 TD
2011 Change 2010 2009 2011 Change 2010 2009 2011 Change 2010 2009
398 26.2% 316 279 5,605 15.7% 4,844 3,358 1,924 37.5% 1,399 1,327
71 14.3% 62 57 1,416 5.5% 1,342 1,003 848 7.1% 792 688
48 1.7% 47 47 46 -48.0% 88 127 7 -19.5% 8 64
310 35.0% 230 205 26 105.6% 13 12 43 -28.2% 60 53 356 12.0% 318 332 80 18.3% 68 122
513 17.1% 438 389 7,377 13.4% 6,504 4,692 2,852 26.3% 2,259 2,137
30 37.6% 21 13 172 -16.8% 207 208 387 4.8% 369 314 0 219.1% 0.1 1 67 -36.4% 106 96 55 -12.2% 62 63 – -100.0% 0 0 3 -13.4% 3 3 29 20.1% 24 25
30 38.5% 22 14 242 -23.3% 316 308 470 3.2% 456 401
543 18.1% 460 403 7,619 11.7% 6,820 5,000 3,323 22.4% 2,714 2,539
94.5% 95.3% 96.4% 96.8% 95.4% 93.8% 85.8% 83.2% 84.2%
5.5% 4.7% 3.6% 3.2% 4.6% 6.2% 14.2% 16.8% 15.8%
Notes
1. NBC does not indicate the split between equity, credit and other contracts.
2. RBC does not indicate the split between equity and other contracts.
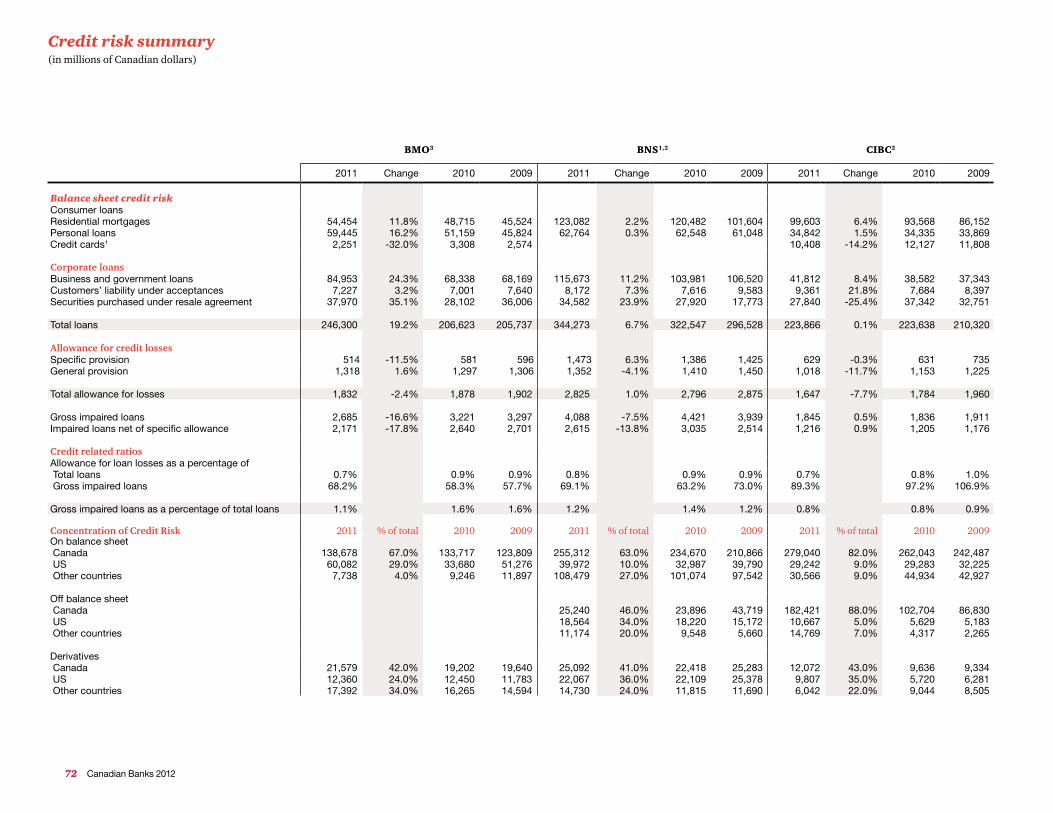
72 Canadian Banks 2012
Credit risk summary(in millions of Canadian dollars)
BMO3 BNS1,2 CIBC2
2011 Change 2010 2009 2011 Change 2010 2009 2011 Change 2010 2009
Balance sheet credit riskConsumer loans Residential mortgages 54,454 11.8% 48,715 45,524 123,082 2.2% 120,482 101,604 99,603 6.4% 93,568 86,152 Personal loans 59,445 16.2% 51,159 45,824 62,764 0.3% 62,548 61,048 34,842 1.5% 34,335 33,869 Credit cards1 2,251 -32.0% 3,308 2,574 10,408 -14.2% 12,127 11,808
Corporate loansBusiness and government loans 84,953 24.3% 68,338 68,169 115,673 11.2% 103,981 106,520 41,812 8.4% 38,582 37,343 Customers’ liability under acceptances 7,227 3.2% 7,001 7,640 8,172 7.3% 7,616 9,583 9,361 21.8% 7,684 8,397 Securities purchased under resale agreement 37,970 35.1% 28,102 36,006 34,582 23.9% 27,920 17,773 27,840 -25.4% 37,342 32,751
Total loans 246,300 19.2% 206,623 205,737 344,273 6.7% 322,547 296,528 223,866 0.1% 223,638 210,320
Allowance for credit lossesSpecific provision 514 -11.5% 581 596 1,473 6.3% 1,386 1,425 629 -0.3% 631 735 General provision 1,318 1.6% 1,297 1,306 1,352 -4.1% 1,410 1,450 1,018 -11.7% 1,153 1,225
Total allowance for losses 1,832 -2.4% 1,878 1,902 2,825 1.0% 2,796 2,875 1,647 -7.7% 1,784 1,960
Gross impaired loans 2,685 -16.6% 3,221 3,297 4,088 -7.5% 4,421 3,939 1,845 0.5% 1,836 1,911 Impaired loans net of specific allowance 2,171 -17.8% 2,640 2,701 2,615 -13.8% 3,035 2,514 1,216 0.9% 1,205 1,176
Credit related ratiosAllowance for loan losses as a percentage of Total loans 0.7% 0.9% 0.9% 0.8% 0.9% 0.9% 0.7% 0.8% 1.0% Gross impaired loans 68.2% 58.3% 57.7% 69.1% 63.2% 73.0% 89.3% 97.2% 106.9%
Gross impaired loans as a percentage of total loans 1.1% 1.6% 1.6% 1.2% 1.4% 1.2% 0.8% 0.8% 0.9%
Concentration of Credit Risk 2011 % of total 2010 2009 2011 % of total 2010 2009 2011 % of total 2010 2009On balance sheet Canada 138,678 67.0% 133,717 123,809 255,312 63.0% 234,670 210,866 279,040 82.0% 262,043 242,487 US 60,082 29.0% 33,680 51,276 39,972 10.0% 32,987 39,790 29,242 9.0% 29,283 32,225 Other countries 7,738 4.0% 9,246 11,897 108,479 27.0% 101,074 97,542 30,566 9.0% 44,934 42,927
Off balance sheet Canada 25,240 46.0% 23,896 43,719 182,421 88.0% 102,704 86,830 US 18,564 34.0% 18,220 15,172 10,667 5.0% 5,629 5,183 Other countries 11,174 20.0% 9,548 5,660 14,769 7.0% 4,317 2,265
Derivatives Canada 21,579 42.0% 19,202 19,640 25,092 41.0% 22,418 25,283 12,072 43.0% 9,636 9,334 US 12,360 24.0% 12,450 11,783 22,067 36.0% 22,109 25,378 9,807 35.0% 5,720 6,281 Other countries 17,392 34.0% 16,265 14,594 14,730 24.0% 11,815 11,690 6,042 22.0% 9,044 8,505
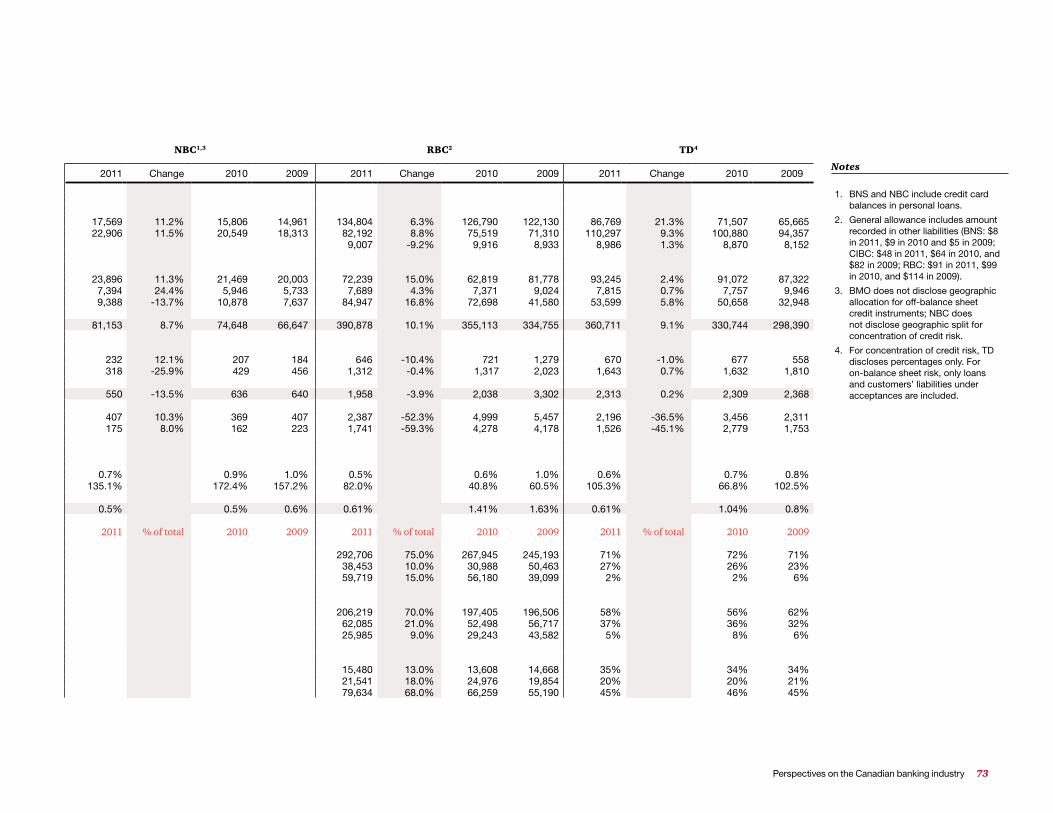
Perspectives on the Canadian banking industry 73
NBC1,3 RBC2 TD4
2011 Change 2010 2009 2011 Change 2010 2009 2011 Change 2010 2009
17,569 11.2% 15,806 14,961 134,804 6.3% 126,790 122,130 86,769 21.3% 71,507 65,665 22,906 11.5% 20,549 18,313 82,192 8.8% 75,519 71,310 110,297 9.3% 100,880 94,357
9,007 -9.2% 9,916 8,933 8,986 1.3% 8,870 8,152
23,896 11.3% 21,469 20,003 72,239 15.0% 62,819 81,778 93,245 2.4% 91,072 87,322 7,394 24.4% 5,946 5,733 7,689 4.3% 7,371 9,024 7,815 0.7% 7,757 9,946 9,388 -13.7% 10,878 7,637 84,947 16.8% 72,698 41,580 53,599 5.8% 50,658 32,948
81,153 8.7% 74,648 66,647 390,878 10.1% 355,113 334,755 360,711 9.1% 330,744 298,390
232 12.1% 207 184 646 -10.4% 721 1,279 670 -1.0% 677 558 318 -25.9% 429 456 1,312 -0.4% 1,317 2,023 1,643 0.7% 1,632 1,810
550 -13.5% 636 640 1,958 -3.9% 2,038 3,302 2,313 0.2% 2,309 2,368
407 10.3% 369 407 2,387 -52.3% 4,999 5,457 2,196 -36.5% 3,456 2,311 175 8.0% 162 223 1,741 -59.3% 4,278 4,178 1,526 -45.1% 2,779 1,753
0.7% 0.9% 1.0% 0.5% 0.6% 1.0% 0.6% 0.7% 0.8%135.1% 172.4% 157.2% 82.0% 40.8% 60.5% 105.3% 66.8% 102.5%
0.5% 0.5% 0.6% 0.61% 1.41% 1.63% 0.61% 1.04% 0.8%
2011 % of total 2010 2009 2011 % of total 2010 2009 2011 % of total 2010 2009
292,706 75.0% 267,945 245,193 71% 72% 71% 38,453 10.0% 30,988 50,463 27% 26% 23% 59,719 15.0% 56,180 39,099 2% 2% 6%
206,219 70.0% 197,405 196,506 58% 56% 62% 62,085 21.0% 52,498 56,717 37% 36% 32% 25,985 9.0% 29,243 43,582 5% 8% 6%
15,480 13.0% 13,608 14,668 35% 34% 34% 21,541 18.0% 24,976 19,854 20% 20% 21% 79,634 68.0% 66,259 55,190 45% 46% 45%
Notes
1. BNS and NBC include credit card balances in personal loans.
2. General allowance includes amount recorded in other liabilities (BNS: $8 in 2011, $9 in 2010 and $5 in 2009; CIBC: $48 in 2011, $64 in 2010, and $82 in 2009; RBC: $91 in 2011, $99 in 2010, and $114 in 2009).
3. BMO does not disclose geographic allocation for off-balance sheet credit instruments; NBC does not disclose geographic split for concentration of credit risk.
4. For concentration of credit risk, TD discloses percentages only. For on-balance sheet risk, only loans and customers’ liabilities under acceptances are included.
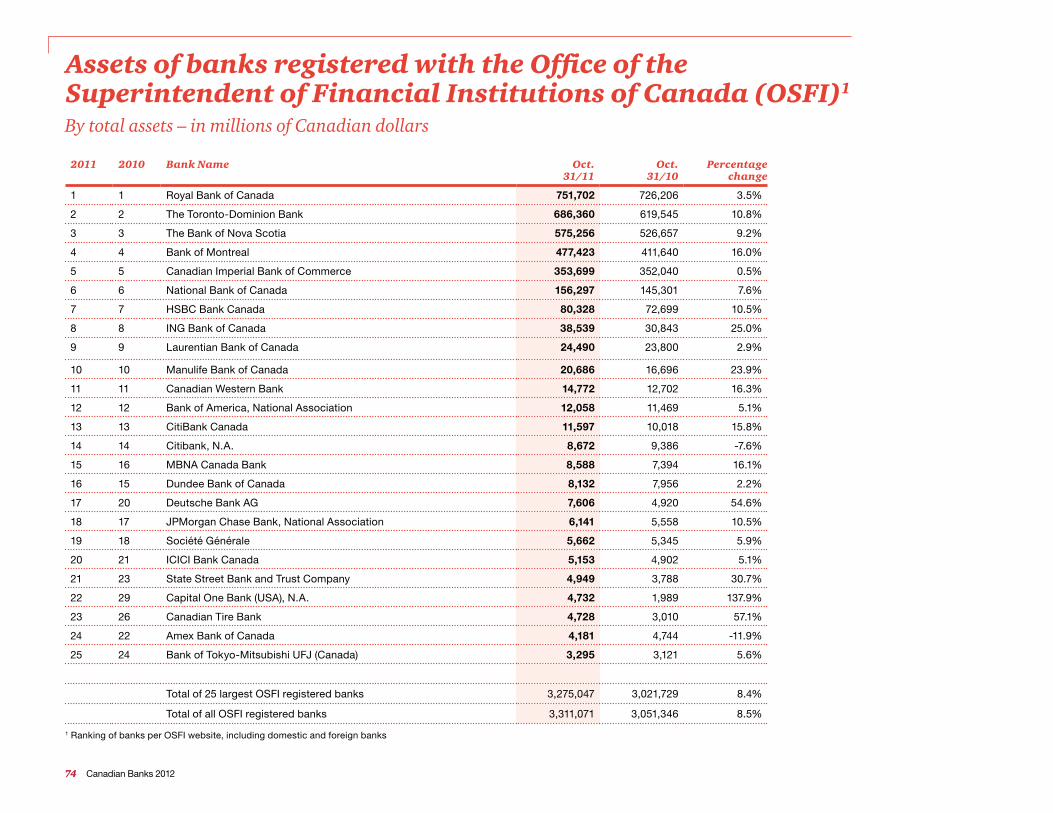
74 Canadian Banks 2012
By total assets – in millions of Canadian dollars
Assets of banks registered with the Office of the Superintendent of Financial Institutions of Canada (OSFI)1
2011
2010
Bank Name
Oct. 31/11
Oct. 31/10
Percentage change
1 1 Royal Bank of Canada 751,702 726,206 3.5%
2 2 The Toronto-Dominion Bank 686,360 619,545 10.8%
3 3 The Bank of Nova Scotia 575,256 526,657 9.2%
4 4 Bank of Montreal 477,423 411,640 16.0%
5 5 Canadian Imperial Bank of Commerce 353,699 352,040 0.5%
6 6 National Bank of Canada 156,297 145,301 7.6%
7 7 HSBC Bank Canada 80,328 72,699 10.5%
8 8 ING Bank of Canada 38,539 30,843 25.0%
9 9 Laurentian Bank of Canada 24,490 23,800 2.9%
10 10 Manulife Bank of Canada 20,686 16,696 23.9%
11 11 Canadian Western Bank 14,772 12,702 16.3%
12 12 Bank of America, National Association 12,058 11,469 5.1%
13 13 CitiBank Canada 11,597 10,018 15.8%
14 14 Citibank, N.A. 8,672 9,386 -7.6%
15 16 MBNA Canada Bank 8,588 7,394 16.1%
16 15 Dundee Bank of Canada 8,132 7,956 2.2%
17 20 Deutsche Bank AG 7,606 4,920 54.6%
18 17 JPMorgan Chase Bank, National Association 6,141 5,558 10.5%
19 18 Société Générale 5,662 5,345 5.9%
20 21 ICICI Bank Canada 5,153 4,902 5.1%
21 23 State Street Bank and Trust Company 4,949 3,788 30.7%
22 29 Capital One Bank (USA), N.A. 4,732 1,989 137.9%
23 26 Canadian Tire Bank 4,728 3,010 57.1%
24 22 Amex Bank of Canada 4,181 4,744 -11.9%
25 24 Bank of Tokyo-Mitsubishi UFJ (Canada) 3,295 3,121 5.6%
Total of 25 largest OSFI registered banks 3,275,047 3,021,729 8.4%
Total of all OSFI registered banks 3,311,071 3,051,346 8.5%
1 Ranking of banks per OSFI website, including domestic and foreign banks

Perspectives on the Canadian banking industry 75

76 Canadian Banks 2012
Banking Review: A Canadian perspective
Our quarterly publication of Banking Review offers a Canadian perspective on the challenges and opportunities in the banking and capital markets sector.
To subscribe to our quarterly publication, please email [email protected].
Banking Banana Skins 2012: The Canadian results
Banking Banana Skins 2012, a unique survey of the risks facing the industry, which has been produced by the CSFI in association with PwC. The overall response of this year’s survey showed that the Canadian economy and banking system are seen to be in better shape than in many other countries, though concern about contagion from more troubled economies, particularly the US and Europe, is clouding the outlook.
Most of the top risks identified by Canada were in line with those in the global ranking: macro-economic risk, funding issues and regulation.
The survey received more than 700 responses from individuals in 58 countries, including more than 40 from Canada.
The new digital tipping point
Banks are constantly adapting to satisfy the needs of their stakeholders. In addition, the number of customers who use the internet has exploded.
PwC surveyed approximately 3000 banking customers in nine different markets to understand customers’ needs, attitudes and behaviours to digital media.
Our insights from this research can help banks harness the power of the new and improved digital market, not just by saving costs, but by deepening customer relationships. The new digital tipping point explores these insights and the opportunities that exist for banks.
15th Annual Global CEO Survey Delivering results: Growth and value in a volatile world
The 15th Annual Global CEO Survey explores CEO confidence in prospects, and how they’re building local capabilities and creating new networks for new markets.
CEOs are adapting how they go to market, reconfiguring processes, and at times entire operating models. They’re also addressing risks that greater integration can amplify and are focused on making talent more strategic to pursue market opportunities.
To view these publications, please visit our website at www.pwc.com and click on Publications.
Recent PwC Financial Services publications

Perspectives on the Canadian banking industry 77
Navigating Through Regulatory Complexity: Perspectives on the Canadian banking industry
Overall, 2011 was another successful year for Canadian banks. However, while Canadian banks have long established their ability to manage events at home, winds of uncertainty are swirling in the global market that will likely be felt in Canada. Governments are introducing a wide range of regulatory reforms, impacting Canadian banking operations in foreign countries. This publication provides a perspective on the key regulatory issues facing the banking industry.
The Journal: Too good to fail
The Dodd-Frank Wall Street Reform and Consumer Protection Act is one of the most complex pieces of legislation ever written. Financial service firms and other impacted organizations are just beginning to understand the Act’s many facets and its full impact.
Through this series, leaders in our Regulatory practice will take A Closer Look at how the Act will impact several distinct market segments.
Visit www.pwcregulatory.com to view the complete series.
Banking in 2050
In this report we present projections of the long term growth potential of the banking sector from now until 2050 in 22 of the world’s leading economies.
This highlights the speed of the shift in global economic and financial power to the emerging E7 economies, which by 2050 could have banking markets around 50% bigger than the established G7 economies.
China could overtake the US as the largest banking market by the mid-2020s with India and Brazil also moving rapidly up the world rankings.
Value through your people: Workforce performance in Canadian banking
PwC’s study of workforce composition and performance in the Canadian banking sector included a review of data submitted for calendar years 2006 to 2010.
Saratoga’s Human Capital Effectiveness Survey tracks over 150 workforce metrics – covering a wide range of workforce and internal corporate function metrics.
This report covers a select set of key metrics for Canadian banking clients.
Anticipating a new age in wealth management: Global Private Banking and Wealth Management Survey
What are the issues and trends impacting the world of wealth management, and what practical actions should wealth managers be taking to achieve best outcomes? Our Global Private Banking and Wealth Management surveys keep tabs on the latest developments to help institutions meet changing challenges and demands.
In PwC’s 2011 biennial report, which surveyed a record 275 institutions from 67 countries, we found that wealth management continues to be a lucrative business with untapped potential for significant growth if institutions can be agile in adapting to meet changing demands.

78 Canadian Banks 2012
Financial Services George Sheen416 815 [email protected]
Banking and Capital MarketsDiane Kazarian 416 365 8228 [email protected]
Consulting John MacKinlay 416 815 [email protected]
Asset Management Raj Kothari 416 869 [email protected]
InsuranceJonathan Simmons 416 869 [email protected]
Private Equity Ajay Chadha 416 814 [email protected]
MontréalCaroline Emond 514 205 [email protected]
CalgaryMichael Godwin403 509 7322 [email protected]
VancouverPaul Challinor604 806 [email protected]
TaxJillian Welch 416 869 2464 [email protected]
Financial Services leadership team PwC Canada
This publication can be viewed on our website at www.pwc.com/ca/canadianbanks.
ContributorsJean Enright, Ryan Grey, Andy Lee, Bryan Lee, Jill Lising, Diego Mesa Puyo, Sasan Parhizgari, Carmelo Scali, Craig Sebastiano, Andrew Smee, Jonathan Willis, Ashley Yanke, and Jessica Yu.
Publication DesignJessica Kim
If you would like to receive additional copies of this publication, please email: [email protected].

Perspectives on the Canadian banking industry 79© 2012 PricewaterhouseCoopers LLP. All rights reserved. “PwC” refers to PricewaterhouseCoopers LLP, an Ontario limited liability partnership, which is a member firm of PricewaterhouseCoopers International Limited, each member firm of which is a separate legal entity. 2279-03 0212
This publication has been prepared for general guidance on matters of interest only, and does not constitute professional advice. You should not act upon the information contained in this publication without obtaining specific professional advice. No representation or warranty (express or implied) is given as to the accuracy or completeness of the information contained in this publication, and, to the extent permitted by law, PricewaterhouseCoopers LLP, its members, employees and agents do not accept or assume any liability, responsibility or duty of care for any consequences of you or anyone else acting, or refraining to act, in reliance on the information contained in this publication or for any decision based on it.

www.pwc.com/ca/canadianbanks