cancer statistics review 1975-2010: introduction · cancer statistics review 1975-2010:...
TRANSCRIPT

CANCER STATISTICS REVIEW 1975-2010: INTRODUCTION The annual SEER Cancer Statistics Review (CSR) contains incidence, mortality, prevalence, and survival statistics from 1975 through the most recent year for which data are available. This report is published by the Surveillance Research Program of the National Cancer Institute, which manages the Surveillance, Epidemiology, and End Results (SEER) Program. The scope and purpose of the CSR follow a report to the Senate Appropriations Committee (Breslow, 1988), which recommended that a broad profile of cancer be presented regularly to the American public. The SEER program is an authoritative source of information on cancer incidence and survival in the United States. SEER collects and publishes these statistics from population-based registries covering 28% of the US population. The 18 SEER registries routinely collect data on patient demographics, primary tumor site, tumor morphology, extent of disease, first course of treatment, and active follow-up for vital status. Detailed information describing these fields can be found at http://seer.cancer.gov/resources/. This report presents statistics on 29 primary sites and subsites, organized into site-specific chapters. Detailed statistics on cancer incidence, mortality, survival, and prevalence are reported by sex, race and ethnicity, age, stage at diagnosis, and geographic area. Information on tumor morphology is also presented. In addition, the CSR features a chapter on adolescent and young adult cancers and a chapter on childhood cancers. Information on some rare cancers can be found in the summary tables of section I. For a detailed list of primary sites, the summary tables provide incidence and death rates for the most recent 5-year period, trends from 1975 to the most recent year, median age at diagnosis, median age at death, and survival rates. Delay-adjusted cancer incidence rates are a distinctive feature of the CSR. Delay-adjustment corrects the current case count to account for underreporting and corrections to the data. The final delay-adjusted rates are valuable in more precisely estimating trends. New features added to the CSR include:
• Estimated cases for 2010 added to the Overview chapter.
Changes in methodology to CSR include: • Population estimates now incorporate information from the 2010 Census. See Technical
Notes or http://seer.cancer.gov/popdata/ for more information. • Cancer sites, as reported in the CSR, are defined and grouped by the primary site and
histology of the tumor. Beginning with cases diagnosed in 2010, these definitions were updated for Hematopoietic codes. See Technical Notes or http://seer.cancer.gov/siterecode/icdo3_dwhoheme/ for more information.
• Survival time was calculated using pre-calculated months based on the exact day information. See http://seer.cancer.gov/survivaltime/.

• Starting with this release of the CSR, nine new counties have been designated as Indian Health Service’s Contract Health Service Delivery Areas. Four of these counties are in SEER areas and so will be included in the calculation of rates for American Indian/Alaska Natives and all nine will be included in the calculation of mortality rates. See Technical Notes or http://seer.cancer.gov/seerstat/variables/seer/race_ethnicity/.
• Starting with patients diagnosed in 2007, the new multiple primary and histology coding rules may impact their incidence data for some cancer sites (e.g., female breast). However, the impact of the new rule on observed incidence is negligible for a majority of the cancer sites. To learn more about the multiple primary rules, visit: http://seer.cancer.gov/tools/mphrules/.
The CSR files are provided in both PDF and HTML formats. The HTML format is provided as an alternative and accessible version of the SEER Cancer Statistics Review. The current edition of the CSR is available on the web at http://seer.cancer.gov/csr/. Statistics from SEER may also be obtained via FastStats (http://seer.cancer.gov/faststats/) or Cancer Query Systems (http://seer.cancer.gov/canques/), which allow the user to access over 10,000,000 cancer statistics. The SEER Research Data file (http://seer.cancer.gov/data/) may be accessed by the public, either through SEER*Stat software or in an ASCII text format that can be analyzed with standard statistical software. While most of the rates in this publication have been age-adjusted to the 2000 US standard population, some previous SEER publications have used the 1970 US standard million population. Therefore, rates given in this publication cannot be compared to rates given in those publications. This change conforms to a federal policy for reporting disease rates; it allows for the age-adjusted rate to more accurately reflect the current age distribution and burden of cancer.
INTERPRETATION OF CANCER STATISTICS A number of factors may affect the interpretation of cancer incidence, mortality, and survival statistics provided in this report. Survival rates for all cancers combined: The mix of cancers changes over time as the incidence of some cancers increases and the incidence of others decreases. The overall cancer survival rate can fluctuate even when the survival rates for site-specific cancers remain unchanged. (While it is possible to adjust the survival rate for all cancers combined on the basis of the relative frequencies of the component cancers, rates adjusted in this manner differ by only a small amount from unadjusted rates. In the future, such an adjustment may become more important if there are substantial changes in the incidence of various cancers.) Early detection/screening: The improved earlier detection and diagnosis of cancers caused by new screening procedures may produce an increase in both incidence rates and survival rates. These increases can occur as a result of the introduction of a new procedure to screen subgroups of the population for a specific cancer; they need not be related to whether use of the
screening test results in a decrease in mortality from that cancer. As the proportion of cancers detected at screening increases, presumably as a result of increased screening of the population, patient survival rates will increase, because they are based on survival time after diagnosis. The interval between the time a cancer is diagnosed by a screening procedure and the time when the cancer would have been diagnosed in the absence of screening is called lead-time (Zelen, 1976). (Screening for breast cancer has been demonstrated to result in increased survival over and above that resulting from lead-time alone and to reduce breast cancer mortality. The benefit of screening is being studied for some other cancers.) If a new screening procedure consistently detects cancer in a preinvasive phase, it may result in a decrease in survival rates for invasive cancer. In this case, length-biased sampling (Zelen, 1976) may be operating. Length-biased sampling would result in the preferential detection—in a preinvasive phase—of those cancers that would have had a relatively good prognosis had they progressed to invasive disease; these potentially invasive cancers would be systematically eliminated. If this occurs, the mix of cancers that are not detected at screening and then progress to invasive behavior may become less prognostically favorable, resulting in a decrease in survival rates for patients with invasive cancers. (Length-biased sampling may at least partially explain survival trends for cervical cancer. Other cancers possibly affected include breast, colon, rectum, and prostate.) Changes in diagnostic criteria: Early detection of cancer resulting from either screening or earlier response to symptoms may result in the increasing diagnosis of small tumors that are not yet life-threatening. This may have the effect of raising the incidence rates and survival estimates without changing the mortality rates. Breast, colon, prostate, cervix uteri, bladder, and skin (melanoma) are the cancer sites most likely to be affected. Technological advances in diagnostic procedures: In this report, trends in survival by stage at diagnosis for specific cancers are not presented; trends in stage distributions are presented rarely. However, it is possible to compare survival by stage. The assignment of a given stage to a particular cancer may change over time due to advances in diagnostic technology. Introduction of new technology can give rise to a phenomenon known as stage migration. Stage migration occurs when diagnostic procedures change over time, resulting in an increase in the probability that a given cancer will be diagnosed in a more advanced stage. For example, certain distant metastases that would have been undetectable a few years ago can now be diagnosed by a computer tomography (CT) scan or by magnetic resonance imaging (MRI). Therefore, some patients who would have been diagnosed previously as having cancer in a localized or regional stage are now diagnosed as having cancer in a distant stage. The likely result would be to remove the worst survivors, those with previously undetected distant metastases, from the localized and regional categories and put them into the distant category. As a result, the stage-at-diagnosis distribution for a cancer may become less favorable over time, but the survival for each stage may improve: The early stage will lose cases that will survive shorter than those remaining in that category, while the advanced stage will

gain cases that will survive longer than those already in that category. However, overall survival would not change (Feinstein et al., 1985). Stage migration is an important concept to understand when examining temporal trends in survival by stage at diagnosis as well as temporal trends in stage distributions; it could affect the analysis of virtually all solid tumors. Evolution of stage classifications: Every few years, the American Joint Committee on Cancer produces a new cancer-staging manual; the seventh edition is the most recent (Edge et al., 2010). The evolution of such classifications reflects the identification of new prognostic factors that may influence choice of treatment. Historically, the SEER Program has only collected data on extent of disease (EOD), rather than stage. EOD is more specific than stage and usually determines stage, even when stage definitions change. Thus, SEER easily adapts to changes in stage definitions; moreover, trends in a newly redefined stage can usually be calculated. Recently the SEER Program has begun collecting Collaborative Stage. Collaborative Stage has the advantage of being a consolidated data collection system of three main staging systems (TNM, EOD, and Summary Stage) and allows combined pathological and clinical stage to be captured. New prognostic variables are introduced into staging for some cancers and so previously collected EOD data cannot determine new stage categories. There can be problems in assessing trends in stage of disease for these cancers. Only by reviewing the evolution of staging for a given cancer is it possible to determine what effects changes in stage definitions have had on stage-specific survival and on stage-at-diagnosis distributions. Stage migration (mentioned above) and EOD migration need also be taken into account. For some sites, the historic stage (localized, regional, or distant) is not shown, either because of inconsistencies in its definition over time or because stage is not appropriate (such as for leukemias, which are all considered to be distant at diagnosis). Interpreting relative survival: The relative survival estimate is the ratio of observed survival to expected survival for a given patient cohort. Expected survival is based on mortality rates for the entire population, taking into account, as appropriate, the age, sex, race, and year of diagnosis of the patients. Assuming that the presence of cancer is the only factor that distinguishes the cancer patient cohort from the general population, relative survival estimates the probability that a patient will not die of the diagnosed cancer within the given time interval. This is the same as the probability that the patient will either survive the interval or die of a different cause. A factor related to the risk of a cancer may also be related to the risk of dying from causes unrelated to the cancer. An example of such a factor is smoking. Smoking is a major risk factor for lung cancer; therefore, a cohort of lung cancer patients will contain a much higher proportion of smokers than the general population. However, smoking is also a risk factor for other diseases so smokers have a shorter life expectancy than nonsmokers. For this reason, expected survival estimates for lung cancer patients based on life tables for the general population will be unrealistically high; since relative survival = observed / expected, this will result in relative-survival estimates that are lower than they would be if the population consisted only of smokers. The problem cannot be easily corrected because separate life tables for smokers and nonsmokers are not available. Moreover, amount of smoking (usually measured in

pack-years) is an important variable and cannot be easily quantified. In addition, expected survival may not be appropriate for patients with cancers of the cervix uteri or breast because the risk of these cancers has been associated with socioeconomic status (Baquet et al., 1991) which may be related to life expectancy. This should be considered when interpreting relative survival for these cancers. Previous to the CSR for 1973–1996, the expected survival tables used were for 1970 and 1980; there were separate tables for whites, blacks, American Indians, Chinese, Japanese, Filipinos, white Hispanics, and Hawaiians. In updating the tables for 1990, several problems emerged. The US life tables are based on age, race, and sex information from death certificates. The information on race on the death certificate may not be accurate (Rosenberg et al., 1999). One reason is that funeral directors may inaccurately report race on a death certificate. Also, reported age at death, especially for those older than 85, may not be accurate because birth certificates were not issued with as much regularity in the early 1900s as they are today. Although race misclassification and age-at-death misreporting exist across all races, they may be more problematic for races other than white or black because of those races' smaller population sizes. Therefore, life tables were generated for 1970, 1980, 1990, and 2000 only for white, black, and other; these life tables were used to produce the relative survival estimates in this review. There may be small variations among survival estimates calculated in this CSR and those in CSRs prior to 1973–1996. Comparison with other databases: The SEER data are obtained from population-based cancer registries covering about 28 percent of the US population. It is sometimes of interest to compare cancer statistics for SEER areas with those from other registries both in the US and worldwide. In making such comparisons, one must carefully consider the factors mentioned above for both data sources. In addition, one should assess all of the following: (1) completeness of case ascertainment, (2) rules used to determine multiple primaries, (3) follow-up, (4) rules used in assigning and coding cause of death, and (5) the sources and procedures used in obtaining population estimates. Depending on the rates being compared, there could be other confounding factors which should be considered. The same standard or standard million population should be used for the age-adjustment of each group being compared; most statistics from outside the US are based on the 2000 world standard million population. Examples of other databases are US Cancer Statistics (http://apps.nccd.cdc.gov/uscs) and CINA+ Online (http://www.cancer-rates.info/naaccr/). It is sometimes of interest to compare survival for cancer patients in SEER areas with data from clinical trials. This must be done with great caution. Survival data from clinical trials may have been obtained from a patient population that differs from that of SEER patients in prognostic factors for the given cancer; any survival comparisons would have to adjust for such differences. Also, it is necessary to verify that the methodology used in computing survival is the same for both data sources. Furthermore, patients on clinical trials may differ from SEER patients in characteristics that may be related to survival but are not recorded in either database. If this were true for a given cancer, it would not be possible to make valid comparisons of this type.

Errors in data collection: In the process of registering cancer patients, errors may be made in abstracting and coding the data, which include demographic information, cancer site, histology, extent of disease, treatment, and patient survival. Quality control studies are periodically carried out to detect and correct this type of error, but no attempt is made to incorporate this source of error into the variance estimates of cancer rates reported here. Comparison of this report with previous reports: The cancer registries that participate in the SEER Program submit data on all cancers diagnosed in their coverage areas to the NCI each year. Because of the dynamic nature of the registries' databases, the reported number of new cancer cases in a particular race, sex, age, cancer category in a given calendar year may change from that which has been reported in a previous publication. For a given diagnosis year, additional cancer cases that were previously overlooked may have been found and reported to the central registry. There may have been follow-back of cancers diagnosed by death certificate only; successful efforts to establish the dates of diagnosis for such patients will change the number of patients reported for a given diagnosis year. Code changes may occur when a patient dies; for example, information on race is generally available on the death certificate and may be used to update a previously unknown value. There may have been elimination of duplicate records for the same patient, often due to name changes or misspellings. Thus, a recent report may have a different number of cases for a given diagnosis year than an earlier report, with resulting effects on incidence and possibly survival. Population estimates may also change from one report to another for some calendar years. This occurs because the NCI receives population estimates that are regularly revised and updated by the Bureau of the Census (BOC). Such changes may result in some differences between incidence and mortality rates for a given calendar period as published in different reports. See our website for the most current information about the population estimates (http://seer.cancer.gov/popdata/).
REFERENCES Baquet CR, Horm JW, Gibbs T, Greenwald P. Socioeconomic factors and cancer incidence among blacks and whites. J Natl Cancer Inst 1991; 83:551-557. Breslow L (Chairman, Extramural Committee to Assess Measures of Progress Against Cancer). Measurement of progress against cancer: Final report to the Senate Appropriations Committee. Bethesda: National Cancer Institute; 1988. Edge SB, Byrd DR, Compton CC, Fritz AG, Greene FL, Trotti A, editors. AJCC Cancer Staging Manual, 7th ed. New York (NY): Springer; 2010. Feinstein AR, Sosin DM, Wells CK. The Will Rogers phenomenon: Stage migration and new diagnostic techniques as a source of misleading statistics for survival of cancer. New Engl J Med 1985;312:1604-1608.

Rosenberg HM, Maurer JD, Sorlie PD, Johnson NJ, MacDorman MF, Hoyert DL, Spitler JF, Scott C. Quality of death rates by race and Hispanic origin: A summary of current research. Hyattsville (MD): National Center for Health Statistics; Vital and Health Statistics, Series 2, No. 128, 1999. Zelen M. Theory of early detection of breast cancer in the general population. In: Heuson J-C, Mattheiem WH, Rozencweig M, editors. Breast Cancer: Trends in Research and Treatment. New York (NY): Raven Press; 1976. p. 287-299.

TECHNICAL NOTES There are four measures commonly used to assess the impact of a cancer in the general population and are reported in this review. The incidence rate is the number of new cases per year per 100,000 persons. The death (or mortality) rate is the number of deaths per year per 100,000 persons. The survival estimate is the proportion of patients alive at some point subsequent to the diagnosis of their cancer. The prevalence count is the number of people alive that have ever been diagnosed with a cancer. The Surveillance, Epidemiology, and End Results (SEER) Program (http://seer.cancer.gov) (based within the Surveillance Research Program (SRP) at the National Cancer Institute (NCI) collects incidence and survival data for all areas that participate in the Program. The National Center for Health Statistics (NCHS) provides mortality data for the entire United States (US). All incidence and mortality rates in this report are age-adjusted (see below) to the 2000 US standard population (see Appendix) unless otherwise specified. Age-adjustment minimizes the effect of a difference in age distributions when comparing rates.
THE SEER PROGRAM The National Cancer Act of 1971 mandated the collection, analysis, and dissemination of data useful in the prevention, diagnosis, and treatment of cancer. This mandate led to the establishment of the SEER Program. The population-based cancer registries participating in NCI’s SEER Program routinely collect data on all cancers occurring in residents of the participating areas. Trends in cancer incidence and patient survival in the US are derived from this database. See the SEER Research Data (http://seer.cancer.gov/data/) for more information. The SEER Program is a sequel to two earlier NCI programs—the End Results Program and the Third National Cancer Survey. The initial SEER reporting areas were the States of Connecticut, Iowa, New Mexico, Utah, and Hawaii; the metropolitan areas of Detroit, Michigan, and San Francisco-Oakland, California; and the Commonwealth of Puerto Rico. Case ascertainment began with January 1, 1973, diagnoses. In 1974-1975, the program was expanded to include the metropolitan area of New Orleans, Louisiana, the thirteen-county Seattle-Puget Sound area in the State of Washington, and the metropolitan area of Atlanta, Georgia. New Orleans participated in the program only through the 1977 data collection year. In 1978, ten predominantly African-American counties in rural Georgia were added. American Indian residents of Arizona were added in 1980. In 1983, four counties in New Jersey were added with coverage retrospective to 1979. New Jersey and Puerto Rico participated in the program until the end of the 1989 reporting year. The National Cancer Institute also began funding a cancer registry that, with technical assistance from SEER, collects information on cancer cases among Alaska Native populations residing in Alaska. In 1992, the SEER Program was expanded to increase coverage of minority populations, especially Hispanics, by adding Los Angeles County and four counties in the San Jose-Monterey area south of San Francisco. In 2001, the SEER Program expanded coverage to

include Kentucky, Greater California (the counties of California that were not already covered by SEER), New Jersey, and Louisiana. In 2012, Greater Georgia (the parts of Georgia not included in Atlanta and Rural Georgia) was added to the SEER Program, with data retroactive to 2000. The long-term incidence trends and survival data for this report are from five states (Connecticut, Hawaii, Iowa, New Mexico, and Utah) and four metropolitan areas (Detroit, Atlanta, San Francisco-Oakland, and Seattle-Puget Sound) (Fig. I-1); this set of registries is called the SEER 9. Additional tables show more recent incidence trends for the SEER 13 areas (the 9 areas above plus Los Angeles, San Jose-Monterey, Alaska Native Registry, and rural Georgia) since 1992 and additional information on race and ethnicity. Other tables give statistics for the SEER 18 areas; these are the SEER 13 plus Kentucky, Greater California, New Jersey, Louisiana, and Greater Georgia. The participating regions were selected principally for their ability to operate and maintain a population-based cancer reporting system and for their epidemiologically significant population subgroups. With respect to selected demographic and epidemiologic factors, they are when combined a reasonably representative subset of the US population. Data from the 9, 13, or 18 SEER geographic areas are used in this report; the given groups contain, respectively, approximately 9, 14, or 28 percent of the US population. By the end of the 2010 diagnosis year, the database of the 18 SEER registries (plus Arizona Indians) contained information on over 7 million cases diagnosed since 1973. New cases added in the most recent data year numbered over 449,000. The goals of the SEER Program are: 1) to assemble and report, on a periodic basis, estimates of cancer incidence, mortality,
survival, and prevalence in the US; 2) to monitor annual cancer incidence trends to identify unusual changes in specific forms of
cancer occurring in population subgroups defined by geographic and demographic characteristics;
3) to provide continuing information on trends over time in the extent of disease at diagnosis, trends in therapy, and associated changes in patient survival; and
4) to promote studies designed to identify factors amenable to cancer control interventions, such as: (a) environmental, occupational, socioeconomic, dietary, and health-related exposures; (b) screening practices, early detection and treatment; and (c) determinants of the length and quality of patient survival.
DATA SOURCES
INCIDENCE AND SURVIVAL DATA
The SEER Program contracts with nonprofit, medically-oriented organizations having statutory responsibility for registering diagnoses of cancer among residents of their respective geographic coverage areas. Each SEER contractor: 1) maintains a cancer information reporting system;

2) abstracts records for resident cancer patients seen in every hospital both inside and outside the coverage area;
3) abstracts all death certificates of residents (dying both inside and outside the coverage area) on which cancer is listed as a cause of death;
4) strives for complete ascertainment of cases by searching records of private laboratories, radiotherapy units, nursing homes, and other health services units that provide diagnostic service;
5) registers all in situ and malignant neoplasms (with the exceptions of certain histologies for cancer of the skin and—beginning in 1996—in situ neoplasms of the cervix uteri);
6) records data on all newly diagnosed cancers, including selected patient demographics, primary site, morphology, diagnostic confirmation, extent of disease, and first course of cancer-directed therapy;
7) provides active follow-up on all living patients (except for those with in situ cancer of the cervix uteri);
8) maintains confidentiality of patient records; 9) at least annually submits electronically to NCI data on all reportable diagnoses of cancer
made in residents of the coverage area. For 1992 to 2000 diagnoses, the SEER program codes site and histology by the International Classification of Diseases for Oncology, second edition (ICD-O-2) (Percy et al., 1990). All cases before 1992 were machine-converted to ICD-O-2. Cases diagnosed 2001-2009 have been coded according to the third edition (ICD-O-3) (Fritz et al., 2000). Beginning with 2010 diagnoses, cases are coded based on ICD-O-3 updated for hematopoetic codes based on WHO Classification of Tumours of Haematopoietic and Lymphoid Tissues (2008). The primary site groupings used for incidence are found in the Appendix. Changes were made to the site recode for ICD-O-2 for comparability with cases coded to ICD-O-3. Follow-up rates are also in the Appendix. Underreporting Adjustment for Veterans Affairs Cases: A CSR section on Department of Veterans Affairs (VA) underreporting (Howlader et al., 2009) was included in recent versions of the CSR. As of the current CSR this section was removed since available evidence indicates that VA underreporting is resolved as of diagnosis year 2010. The section of the CSR introduction about the reporting delay describes measures to address any backlog of VA cases reported after the initial reporting year. Excluded cancers: Some cancers were excluded from most of the analyses. Myelodysplastic syndrome (MDS), for example, was reclassified in ICD-O-3 (effective diagnosis year 2001) from nonmalignant to malignant; other cancers so reclassified include endometrial stromal sarcoma (low grade), papillary ependymoma, papillary meningioma, polycythemia vera, chronic myeloproliferative disease (NOS), myelosclerosis with myeloid metaplasia, essential thrombocythemia, refractory anemia, refractory anemia with sideroblasts, refractory anemia with excess blasts, and refractory anemia with excess blasts in transformation. In contrast, borderline tumors of the ovary were reclassified from malignant to nonmalignant at the same time. In addition, benign brain/CNS tumors were collected beginning for 2004 diagnoses. All of these cancers were excluded from most of the analyses, especially time trends. Pilocytic

astrocytoma, although reclassified in ICD-O-3, was not excluded. Separate tables for MDS and benign brain/CNS are shown.
MORTALITY DATA
The SEER Program annually obtains from the National Center for Health Statistics (NCHS) a file containing information on all deaths occurring in the US by calendar year. Information on each death includes age at death, sex, geographic area of residence, and underlying and contributing causes of death. For this publication, only the underlying cause of death is used in the calculation of death rates. Cause of death for 1969-1978 was coded according to ICD-8; for 1979-1998, ICD-9 was used; beginning with deaths in 1999, ICD-10 was used. Mortality rates for the SEER geographic areas, for each state, and for the entire US are obtained from these data. A list of the mortality site groupings used in this publication is in the Appendix and reflects updates made in 2004.
POPULATION DATA The population estimates used in the SEER*Stat software to calculate cancer incidence and mortality rates for this report are a modified version of the intercensal and Vintage 2011 annual time series of July 1 county population estimates by age, sex, race, and Hispanic origin that are produced by the Population Estimates Program of the US Census Bureau (http://www.census.gov/popest/) with support from the NCI through an interagency agreement. Descriptions of the methodologies employed by the Census Bureau for various sets of estimates may be found on the same website. The new intercensal estimates provide an adjustment of previous population estimates based on the actual 2010 Census results. County population estimates for 2000 and later years must be bridged from 31 race categories used in Census 2000 to the four race categories specified under earlier OMB standards in order to report long-term cancer trends. The bridging methodology was developed by the National Center for Health Statistics and is described in a report (Ingram et al., 2003) and on their website http://www.cdc.gov/nchs/nvss/bridged_race.htm Modifications made by the NCI to the population estimates are documented in “Population Estimates Used in NCI’s SEER*Stat Software” (http://seer.cancer.gov/popdata/methods.html) and the population data files are available for download (see “Download US Population Data” from http://seer.cancer.gov/popdata/download.html). Several of the modifications pertaining to the grouping of specific counties needed to assure the compatibility of all incidence, mortality and population datasets. Another modification affects only population estimates for the State of Hawaii. The Epidemiology Program of the Hawaii Cancer Research Center has developed its own set of population estimates, based on sample survey data collected by the Hawaii Department of Health. This effort grew out of a concern that the native Hawaiian population has been vastly undercounted in previous censuses. The "Hawaii adjustment" to the Census Bureau’s estimates has the net result of reducing the estimated white population and increasing the estimated Asian and Pacific Islander population for the state. The estimates for the total

population, black population, and American Indian and Alaska Native populations in Hawaii are not modified. The cancer incidence and mortality rates for American Indians and Alaska Natives (AI/AN) are based on the geographic areas (counties) included in the Indian Health Service’s Contract Health Service Delivery Area (CHSDA). This reflects a concern that previously reported AI/AN rates were underestimated due to racial/ethnic misclassification of American Indian cases in geographic areas outside of CHSDA. This change has the net effect of higher, and more accurate, incidence and mortality rates for this population. Beginning in 2013, CSR reporting diagnoses 1975-2010, CHSDA counties were updated with 9 new counties designated as CHSDA. Four of these are in SEER areas. This addition was made to better reflect AI/AN populations that had been living in these counties. Usually the use of a population estimate for July 1 of a particular year reflects the average population of that area for the year. Both Hurricane Katrina and Hurricane Rita struck the Gulf Coast area of the United States in 2005. This had the effect of displacing large populations. Since there weren’t any population estimates by age, race, sex, and county for time periods just after the hurricanes, it is very difficult to estimate the actual population at risk for certain areas along the Gulf Coast for 2005. For Louisiana, only the first six months of incidence data for 2005 coupled with ½ of the population estimate for July 1, 2005, were used to calculate cancer incidence. For death rate calculations, no adjustments were made to the total US population, but for the Gulf area, an adjustment for displaced populations was made for 2005 state rates. For more details, see http://seer.cancer.gov/popdata/methods.html.
2000 US STANDARD POPULATION
Starting with the November 2004 SEER submission of data (diagnoses through 2002), the SEER Program age-adjusts using the 2000 US standard population based on single years of age from the Census P25-1130 series estimates of the 2000 US population (Day, 1996). For the CSR, 19 age groupings were used for age-adjustment: <1, 1–4, 5–9, … , 80–84, 85+.
STATISTICAL METHODS
ESTIMATED CANCER CASES AND DEATHS IN 2013 The American Cancer Society (ACS) projects the numbers of new cancer cases and cancer deaths in the US in 2013 (American Cancer Society, 2012). The ACS projects incidence in 2013 based on incidence rates for 1995-2009 from 49 states and the District of Columbia, representing about 98% of the US population. These high-quality incidence data were submitted to the North American Association of Central Cancer Registries (NAACCR) by 49 states (and District of Columbia) belonging to the SEER Program and/or the National Program of Cancer Registries (NPCR). For additional details please refer to http://www.cancer.org/docroot/STT/STT_0.asp

LONG-TERM TRENDS, 1950-2010 Trends in cancer mortality from 1950 to 2010 are summarized by age both for all cancers combined and for lung cancer (Table 1-2). These cancer mortality trends are based on the mortality experience in the entire US. Summaries of long-term trends back to 1950 in cancer survival are also shown for whites.
Use caution when interpreting these statistics. Evaluating trends over a long period of time may hide recent changes in the trends.
YEARS OF LIFE LOST DUE TO PREMATURE DEATH FROM VARIOUS CAUSES Death rates alone give an incomplete picture of the burden that deaths impose on the population. Another measure is the years of life lost due to premature death. This shows the extent to which life is cut short by a particular cause or disease. This measure is estimated by linking life table data to each death of a person of a given age and sex. The life table permits a determination of the number of additional years an average person of that age, race, and sex would be expected to live. In this report, the age groups used in the calculation were 1-year intervals. These remaining years of life left are summed over all deaths due to a particular cause, yielding the estimate of the number of person-years of life lost (PYLL). The average years of life lost (AYLL) is obtained by dividing the PYLL by the number of deaths. Both of these measures can be calculated for any cause of death.
RELATIVE SURVIVAL Relative survival (Ederer, 1961) was developed to provide an objective measure of the probability of survival of cancer in the absence of other causes of death. It is a measure that is not influenced by changes in mortality from other causes and, therefore, provides a useful measure for both tracking survival across time and comparisons between racial/ethnic groups or between registries. For most cancer registries, cause-of-death information obtained from death certificates is either unavailable or unreliable due to misclassification error. Therefore, instead of calculating the probability of surviving cancer in the usual (cause-specific) way, considering deaths from other causes as censoring events, relative survival compares the observed survival proportion of a group of cancer patients with the survival of a “similar” theoretical cancer-free group. Relative survival is formally defined as the ratio of the observed survival (all causes of death) of a cohort of cancer patients to the expected survival of a comparable set of cancer-free individuals. Since a cohort of cancer-free individuals is difficult to obtain, life tables representing survival of the general population are used instead. The underlying assumption is that the cancer deaths are a negligible proportion of all deaths. To learn more on this topic, visit: http://surveillance.cancer.gov/survival/measures.html. Expected survival can be calculated using different methods which vary with respect to the definition of the matching group. The three most common methods are: Ederer I (Ederer, et al., 1961), Ederer II (Ederer and Heise, 1959) and Hakulinen (Hakulinen, 1982). In previous

versions of SEER*Stat, relative survival has been calculated using Ederer I and Hakulinen methods, Ederer I being the default for calculations in the Cancer Statistics Review. In the Ederer I and Hakulinen methods, theoretical individuals are matched to each patient and are considered to be at risk for the entire follow-up. Hakulinen adjusts for potential follow-up times. Relative survival using expected rates derived via these two methods are very similar. However, recent research on relative survival has resuscitated the initial method to estimate expected rate: the Ederer II method. Although none of the three methods can be considered a gold standard, the Ederer II method has be shown to be in better alignment with the concept of net cancer survival. For that reason, as of 2011, we have switched to Ederer II as our default choice for calculating expected rate in SEER*Stat and the CSR. For more detail regarding this topic, read Cho et al., 2011 at: http://surveillance.cancer.gov/reports/.
CAUSE-SPECIFIC SURVIVAL Cause-specific survival is a net-survival measure representing survival of a specified cause of death in the (theoretical) absence of other causes of death. Estimates are calculated by specifying the cause of death. Individuals who die of causes other than the specified cause are censored. This requires a cause-of-death variable that accurately captures all causes related to the specific cause. Cancer registries use algorithms to process causes of death from death certificates in order to identify a single, disease-specific, underlying cause of death. In some cases, attribution of a single cause of death may be difficult and misattribution may occur. For example, a death may be attributed to the site of metastasis instead of the primary site (Percy et al., 1981). To capture deaths related to the specific cancer but not coded as such, the SEER cause-specific death classification variable is defined by taking into account causes of deaths in conjunction with tumor sequence (i.e., only one tumor or the first of subsequent tumors), site of the original cancer diagnosis, and comorbidities (e.g., AIDS and/or site-related diseases). To learn more on this topic, please read the recent article published at the Journal of National Cancer Institute (Howlader et al., 2010) or visit: http://seer.cancer.gov/causespecific/.
CANCER PREVALENCE Methods: In this report prevalence is calculated at 1/1/2009. Limited-duration prevalence is calculated using the counting method implemented in the SEER*Stat software. This method calculates the number or proportion of people alive at the prevalence date who had a diagnosis of the disease within the past x years (e.g., x = 5, 10, 20, or the full history of the registry). Because SEER has available information for the various racial/ethnic groups for different numbers of years, different years and registries were used to estimate limited-duration prevalence. Prevalence estimates for all races combined, for whites, and for blacks use cases from 1975 through 2008 from the SEER 9 registries; prevalence estimates for Asian Pacific Islanders and Hispanics use cases diagnosed from 1990 through 2008 from the SEER 11 areas and rural Georgia.

The limited-duration prevalence method includes a correction for people lost to follow-up. For each individual lost to follow-up, a probability of being alive at the prevalence date is estimated from an appropriate survival function stratified by age at diagnosis (0–59, 60–69, 70+), sex, cancer site, year of diagnosis, and race, conditional on being alive at the time of loss to follow-up. Year of diagnosis is stratified into 5-year groups from the prevalence date, with the least recent interval being of varying length (4-8 years), depending on the length of years used to calculate prevalence. Race is stratified into white, black, other (American Indian/Alaska Native, Asian/Pacific Islander), and unknown/other-unspecified. When we use the SEER 11 registries, the same stratification as before is used, with American Indian/Alaska Native separated from Asian/Pacific Islander. Prevalence calculations for Hispanics use race stratified into: white, non-white, and unknown. Different methods can be used to determine which tumors are to be included for people diagnosed with multiple tumors. Unless otherwise specified, prevalence calculations include only the first malignant tumor per person; that is, in situ cancers and second-or-later primary cancers were not included. Thus, if a woman had a melanoma prior to a breast cancer diagnosis, her melanoma would contribute to the prevalence of melanoma and to the prevalence of all sites, but the breast cancer would not contribute to the prevalence of breast cancer. Counting only one cancer per individual avoids some ambiguity in prevalence counts, and allows the counts for individual sites to sum to the all sites total. Prevalence using different selection criteria is compared in a table in the overview chapter. For more information on tumor selection criteria refer to http://surveillance.cancer.gov/prevalence/methods.html. Complete prevalence is an estimate of the number of persons (or the proportion of population) alive on a specified date who had been diagnosed with the given cancer, no matter how long ago that diagnosis was. It was estimated for all races, whites, and blacks by applying the completeness index method (Capocaccia & De Angelis, 1997; Merrill et al., 2000; Mariotto et al., 2002) to limited-duration prevalence. The completeness index method is implemented in the COMPREV software, which can be found at http://surveillance.cancer.gov/comprev/. Validation of the completeness index for all races and for whites was made by using data from the Connecticut Tumor Registry (CTR) beginning with 1940. For blacks, SEER 9 data beginning with 1975 were used; identification of blacks is not possible in the CTR data prior to 1970. To validate the completeness index for blacks, we have compared the performance of the method to obtain 24-year prevalence from 10-year limited-duration prevalence. For all races combined and for whites, in cases where the validation indicated some lack of fit of the model, an approximation to the completeness index was derived from the CTR data. If there was a lack of fit for blacks, no estimate of complete prevalence was reported. Complete prevalence for Asian/Pacific Islanders and Hispanics is not available at this time. Complete prevalence by age for all races combined was validated by comparing estimated 10-year complete prevalence with observed prevalence from the CTR data. Prevalence by age is reported for the sites that validated well. The US cancer prevalence counts at 1/1/2009 were estimated by multiplying the SEER age-

and race-specific prevalence proportions by the corresponding US population estimates based on the average of 2008 and 2009 population estimates from the US Census Bureau. US cancer prevalence counts for all races were estimated by summing the US estimated counts for whites/unknown, blacks, and other races. For Hispanics, the estimates for Hispanics of white or unknown race and for Hispanics of other races were summed. Complete prevalence estimates of the number of individuals in the US diagnosed with cancer as children (ages 0-19), including those surviving for more than 34 years, is calculated using a statistical method that estimates the number of childhood survivors diagnosed before 1975 (Simonetti et al., 2008; Mariotto et al., 2009). Limited-duration prevalence proportions by age at prevalence are not shown for childhood cancers (age at diagnosis 0-19) since many of these estimates are not informative. For example, the number of people diagnosed with childhood cancers in the last 25 years and who are currently age 50-59 is zero by definition. For more details on available prevalence estimates, see http://surveillance.cancer.gov/prevalence/. The overview chapter contains two prevalence tables. The first table reports US complete prevalence counts by age at prevalence and sex for some main cancer sites. The second table reports US prevalence counts for people diagnosed in the 5 years and 34 years prior to the prevalence date using different tumor inclusion criteria. Each site-specific chapter contains a prevalence table that reports limited-duration US prevalence counts by time since diagnosis for different racial/ethnic groups. US complete prevalence estimates are also reported when available. The second part of the site-specific tables displays the percent of the population in the SEER 11 areas diagnosed in the previous 19 years with the specific cancer by 10-year age groups for the different racial/ethnic groups.
PROBABILITY OF BEING DIAGNOSED WITH OR DYING FROM CANCER Lifetime and interval risks of being diagnosed with cancer: The probability of being diagnosed with cancer is computed by applying cross-sectional age-specific 2007-2010 incidence rates from the SEER 17 areas and death rates from those same areas to a hypothetical cohort of 10,000,000 live births. This cohort is considered to be at risk for two mutually exclusive events: (1) developing the specified cancer, and (2) dying of other causes without developing the specified cancer. Using these two types of events, a standard multiple decrement life table (with 20 age groups from 0-4 to 90-94 and 95+) is derived. For each age interval, the number alive and free of the specified cancer at the beginning of the interval is decremented by the number who develop the specified cancer and the number who die of other causes. The lifetime risk of being diagnosed with the specified cancer is derived by summing all cancer cases from age 0-4 through age 95+ and dividing by 10,000,000. This calculation does not assume that an individual lives to any particular age; rather, it is the sum over all age intervals of the probability of living to the beginning of that interval without developing the given cancer times the probability of developing the cancer in that interval. The probability of developing cancer during any time period (e.g., between age 50 and age 60) is calculated by adding up all the cancers in the life table over the specified age range and dividing by the number of individuals alive and
free of the specified cancer at the beginning of the period. The methodology is described in detail in (Fay et al., 2003) and (Fay, 2004). To improve the precision of the calculations, rates were calculated beyond the usual last open ended age interval (i.e. 85+) for the age groups 85-89, 90-94, and 95+. Lifetime risk of dying from cancer: The lifetime risk of dying from a specified cancer is derived using a standard multiple decrement life table (Elandt-Johnson & Johnson, 1980). For each age, the risks of dying of the specified cancer and of all other causes are calculated, based on mortality data from the entire United States. Detailed methodology and software: The estimates of developing and dying from cancer are implemented in DevCan (Probablity of DEVeloping or dying from CANcer software). More details on the software, various databases, and the methodology can be found at http://surveillance.cancer.gov/devcan/.
US CANCER DEATH RATES BY STATE Each cancer-site-specific section presents the death rate for the given cancer for each state and the District of Columbia, specifying the five highest and the five lowest death rates by state for the most recent 5-year period for all persons, males only, and females only. The rates are per 100,000 persons; they are age-adjusted to the 2000 US standard population. (In some previous editions of the CSR, the 1970 US standard million population was used; death rates standardized to the 2000 US standard million population cannot be compared to death rates standardized to the 1970 US standard million population.) The percent difference (PD) between a state rate and the rate for the total US is given by the formula: PD = [(State Rate – Total US Rate)/Total US Rate] * 100
The standard error for each age-adjusted state death rate is calculated, based on the assumptions that (1) for each age-specific rate, the number of deaths is a Poisson random variable (Keyfitz, 1966) and (2) the variance of the age-adjusted rate is a linear combination of the variances of the age-specific rates (Snedecor & Cochran, 1980; pp. 188-9). The standard error of the difference (SEd) between a state rate and the total US rate is given by the formula SEd = Square Root of [SES
2 + SEU2 – 2 * Cov S,U]
where SES and SEU are the standard errors of a state rate and of the total US rate, respectively, and Cov S,U is the covariance between the two rates. The variance of each rate (i.e., the square of the standard error) and the covariance between the two rates are based on the Poisson

assumption. The standard error does not represent the total error that may be present in the age-adjusted rate; it is merely the square root of the variance associated with the rates. In addition to this variance, there also exist potential biases and errors in the measurement of the rate that are difficult to assess accurately and probably impact differently on the error calculations for different states. The difference between each age-adjusted state rate and the age-adjusted US rate is tested for statistical significance (see below) by calculating a Z (standard normal) statistic from the formula: Z = (State rate – Total US rate) / SEd Although the rates being compared are not independent because each state is part of the US, the statistical test may not be substantially affected if the state represents a small proportion of the total US. There is also an adjustment for multiple comparisons; see below under Statistical Significance.
JOINPOINT REGRESSION ANALYSIS OF CANCER TRENDS An advance in the presentation of cancer trends is the use of joinpoint models (Kim et al., 2000). In some past issues of the Cancer Statistics Review, certain time intervals (e.g., 1973–1996) were specified and the annual percent changes (APC) were computed over those intervals. The choices of where to start and where to end an interval were arbitrary and sometimes did not give an accurate picture of the trend for a given cancer site. For example, the rates might be increasing and decreasing in different parts of the same interval. For some sites, increases occurred in the earlier years, followed by declines in more recent years. To achieve greater descriptive accuracy, a statistical algorithm finds the optimal number and location of places where a trend changes. The point (in time) when a trend changes is called a joinpoint. Trends may change in different ways at a joinpoint: from up to down, from down to up, from up to up at a different rate, or from down to down at a different rate. A joinpoint regression model describes the trends by a continuous, piecewise-exponential function. Adjacent segments are connected at a joinpoint. The segments are connected because we assume that rates generally change smoothly, rather than “jump” abruptly. In each segment, the rates are assumed to grow or decay exponentially (𝑦 = 𝑒𝑚𝑥+𝑏), i.e., to change by a constant percentage each year. Thus the “slope” m in each segment can be associated with a fixed annual percent change (APC) by 𝐴𝑃𝐶 = 100(𝑒𝑚 − 1). Joinpoint analysis first assumes no joinpoints are needed to describe the data accurately, i.e., the trend over the entire interval 1975-2010 does not change. Joinpoints are added in turn if they are statistically significant. Thus, in the final model, each joinpoint represents a significant change in trend. Smoother polynomial models may provide a good fit overall, but are less sensitive to what is occurring at the ends of the data. In running the Joinpoint program, we set the program parameters as follows:

(1) Joinpoints occur only at exact years; the joinpoint is not necessarily the same as the data point for that year;
(2) The minimum time interval between consecutive joinpoints is three years; (3) The first joinpoint is not earlier than two years after the first year of data; (4) The last joinpoint is not later than two years before the last year of data; (5) The maximum number of joinpoints is five for 1975-2010 (SEER 9) data and three for
1992-2010 (SEER 13) data. These restrictions provide some added stability to the resultant models. Different values for these parameters may yield a different joinpoint model. Since the test statistic to determine if additional joinpoints are necessary cannot be compared against any known standard distribution to determine significance (e.g., the normal, t, or f), a permutation test is used which simulates the distribution of the test statistic under the null hypothesis. Thus an element of randomness is introduced by the random number stream used. However, for greater consistency in the p-values obtained if one were to change the random seed for each run, we run the program for 4499 permutations. A Windows-based program, Joinpoint, is freely available at http://surveillance.cancer.gov/joinpoint/; it accepts data from the SEER*Stat program, as well as user-defined data. Further details on joinpoint regression may be found at the website. Starting with the 2011 edition of CSR, we have generated all our cancer trend statistics using a Linux-based Joinpoint program as opposed to the downloadable Windows-based program. As a result of using a different platform, in rare instances the results (e.g., # of joinpoints) may differ. Average Annual Percent Change (AAPC) is a summary measure of a trend over a pre-specified fixed interval based on an underlying joinpoint model. It allows us to use a single number to describe the average trend over a period of multiple years. It can be estimated even if the joinpoint model indicates that there were changes in trends during those years, since it is estimated as a geometric weighted average of the joinpoint APCs, with the weights equal to the lengths of each segment over the pre-specified fixed interval. In this report, we have included AAPCs as an addendum to the underlying joinpoint trends, and as a summary measure to compare fixed interval trends by race/ethnicity. For more information on how the AAPC is calculated and the advantages of reporting an AAPC over APCs, see http://surveillance.cancer.gov/joinpoint/aapc.html.
REPORTING DELAY Timely and accurate calculation of cancer incidence rates is hampered by reporting delay, the time lapse before a diagnosed cancer case is reported to the NCI or the delay in receiving updated information for an existing case. Currently, the NCI allows a standard delay of 22 months between the end of the diagnosis year and the time the cancers are reported to the NCI in November, almost two years later. The data are released to the public in the spring of the following year. For example, cases diagnosed in 2010 were first reported to the NCI in November 2012 and released to the public in April 2013. However, in each subsequent release of the SEER data, records from all prior diagnosis years (e.g., diagnosis years 2009 and earlier

in the 2012 submission to the NCI) are updated as either new cases are found or new information is received about previously submitted cases. The submissions for the most recent diagnosis year are, in general, about two percent below the total number of cancers that will eventually be submitted for that year, although this varies by cancer site and other factors. The idea behind modeling reporting delay is to adjust the recent rates to anticipate future corrections (additions, changes, and deletions) to the data. These adjusted rates and the associated delay model are valuable in more precisely determining current cancer trends, as well as in monitoring the timeliness of data collection—an important aspect of quality control (Clegg et al., 2002). Reporting delay models have been previously used in the reporting of AIDS cases (Brookmeyer & Damiano, 1989; Pagano et al., 1994; Harris, 1990). In this report, we show SEER age-adjusted incidence rates and trends, along with their calculated delay adjustments for SEER 9 and SEER 13 areas. The adjusted rates, factors, and trends are available for all cancers combined (malignant only except for urinary bladder), for female breast in situ, for urinary bladder (in situ and malignant combined), and for 22 malignant cancer sites: melanoma (for all races combined and whites only), lung/bronchus, colon/rectum, prostate, female breast, liver and intrahepatic bile duct, pancreas, cervix uteri, corpus and uterus, ovary, testis, kidney and renal pelvis, brain and other nervous system, Hodgkin lymphoma, non-Hodgkin lymphoma, all leukemias, esophagus, larynx, myeloma, oral cavity and pharynx, thyroid, and stomach. For more information on cancer incidence rates adjusted for reporting delay, see http://surveillance.cancer.gov/delay/. Estimates of observed incidence rates, delay-adjusted incidence rates, and delay-adjustments factors may be found in the Cancer Query Systems at http://seer.cancer.gov/canques/.
Adjustment for VA Case Backlog, Submission Year 2010 A policy change of the Department of Veterans Affairs (VA) regarding data sharing on VA cancer cases resulted in underreporting on VA hospital cases for submission years 2007-2011. Some special adjustments to case counts are necessary to fit the delay adjustment model. Beginning with the 2009 submission of SEER data, some SEER registries began accounting for the backlog of VA cases that would have been reported in 2006-2008. This upsurge in cases could cause perturbation in the delay model if fit in the usual manner. As with the 2009 to 2011 submissions, to take account of the effect of the VA backlog in the 2012 submission on the delay adjustment model, the counts are adjusted by re-distributing VA cases to previous submission years according to the expected counts from the delay distribution conditional on the current submission. Specifically, for each of the diagnosis years 2004-2009, given the total cancer count in submission year 2012, the proportion of cumulative cancer count in each subsequent submission year is calculated based on the estimated parameters from previous year’s reporting delay model. The VA cases in the 2012 submission are re-distributed

to each of the prior submission years according to this proportion. The adjusted total cancer count in that submission year was then calculated by combining the non-VA cases and the re-distributed VA counts.
Delay-adjusted incidence rates and trends are reported for all cancers combined (malignant only except for urinary bladder), for female breast in situ, for urinary bladder (in situ and malignant combined), and for 22 malignant cancer sites: melanoma (for all races combined and whites only), lung/bronchus, colon/rectum, prostate, female breast, liver and intrahepatic bile duct, pancreas, cervix uteri, corpus and uterus, ovary, testis, kidney and renal pelvis, brain and other nervous system, Hodgkin lymphoma, non-Hodgkin lymphoma, all leukemias, esophagus, larynx, myeloma, oral cavity and pharynx, thyroid, and stomach.
STATISTICAL SIGNIFICANCE Errors may be made in the estimation of a given statistic. In order to test whether two groups (such as the populations of a state and the entire US) have the same or different actual rates, the observed rates for the groups are compared. Statisticians consider that a difference in observed rates can be explained by one of two hypotheses: (H0) The actual rates are really the same, but the observed rates are different because of some combination of error-causing factors, or (H1) the actual rates of the groups are really different. H0 is called the null hypothesis (because it says there is no real difference); H1 is called the alternate hypothesis. Typically, H0 is rejected only if there is strong evidence in favor of H1. (Thus, if the observed rates are equal, we cannot reject H0.) Using statistical theory, one can determine the distribution of the rate difference under the assumption that H0 is true. Then values of the rate difference that are very unlikely to occur if H0 is true are identified. More specifically, a small positive number, called alpha (α), is chosen; usually, α is 0.05 or 0.01. (Alpha is called the significance level of the hypothesis test.) One can then identify limits for the difference in rates such that, if H0 is true, the probability of the difference being outside of those limits is α. If the observed difference is outside of these limits, then the observed result is very unlikely to happen if H0 is true, so H0 is rejected. Another way of looking at the same process is to calculate, assuming H0 is true, the probability that the observed difference or any greater difference would occur; this number is called the P-value of the observed result. If the P-value of a comparison is less than α (that is, the observed difference is very unlikely to happen if the null hypothesis is true), H0 will be rejected. If the P-value of a test is greater than the significance level α, H0 will not be rejected. When a difference in rates is sufficiently large to cause the null hypothesis to be rejected for a given value of α (usually 0.05), it is called a statistically significant difference. When a null hypothesis is rejected, there remains a small chance that a wrong decision has been made. If many statistical comparisons are done, even with α = 0.01, the chance of making at least one wrong decision becomes a concern. In testing the differences between the total US rate and the rate for each state (or for the District of Columbia) for a given cancer, 51 statistical

comparisons of the type described above are performed. Based on one of Bonferroni's inequalities (if there are n events and pi is the probability of success in event i, then P(at least 1 success) < p1 + ... + pn) (Snedecor & Cochran,1980; p. 115-117), the significance level α for each individual comparison was set equal to 0.01/51 ≈ 0.0002. Thus, only individual-state-to-total-US comparisons with an associated P-value less than 0.0002 are considered to be statistically significant. That is, a very small significance level α (0.0002) is used in order to minimize the total risk (0.01) of falsely deciding that some pair of equal rates are unequal. Use caution in assessing statistically significant differences. Population size has an important role in any calculation of statistical significance. Some states may have estimated rates that are very close to the estimated total US rate, but because of their large population, the difference between their estimated rate and the estimated total US rate is found to be statistically significant. In this case, the true state rate and the true US rate are almost certainly different, because the observed difference, though small, is nearly impossible if the null hypothesis (equal rates) is true. A small difference in rates, however, may have no practical importance. On the other hand, some smaller states may have estimated rates that differ substantially from the estimated total US rate, but because of their relatively small population, the differences are found to be statistically nonsignificant. When this happens, if the true state rate and the true US rate were equal, the probability of obtaining a difference at least as large as what has been observed is greater than α ≈ 0.0002. Therefore, because the evidence against it isn’t strong enough, the null hypothesis (equal rates) is not rejected. If the percent difference (PD) between the two rates is small, there may be some question about the importance of the difference. It is difficult to specify a minimally significant absolute PD, below which the difference would always be unimportant, because the observed PD will depend on the populations of the areas involved. It may be of value to consider the size of the PD between a state rate and the US rate in assessing the importance of a statistically significant difference. Comparing individual state rates with the US rate and assessing statistical significance is not an appropriate procedure for assessing geographic clustering of state rates. Identification of states which may represent regional clusters of high or low rates would require additional statistical and graphical analyses. For a number of cancers, the District of Columbia has the highest death rates. Use caution when comparing cancer rates for the District with those from the 50 states. The District is an entirely urban area, whereas a state includes urban, suburban, and rural areas. Mortality rates for many cancers are higher in urban areas. Also, the District has a higher percentage of blacks —51% of the total population in 2010 (US Census Bureau, 2013)—than any state. In addition, their higher mortality rates for several types of cancer elevate the overall rate for the District.

STANDARD ERRORS OF RATES Survival rates: In the tables presenting survival estimates, the magnitude of the standard error is given as a measure of the reliability of a given rate: the greater the standard error, the more uncertainty associated with the estimated rate. In addition, if there were fewer than 25 diagnoses in the first interval of the life table constructed to calculate survival, or if all cases became lost to follow-up within an interval, a valid survival estimate could not be calculated, as is noted in the table footnotes. The standard error (SE) of a relative survival estimate is obtained as follows (Ederer et al., 1961): SE(CRt) = CRt * square root of [q1/(e1-d1) + q2/(e2-d2) +… + qt/(et-dt)]
where CRt is the t-year relative survival estimate, and for i = 1, ... , t, qi is the probability of dying in year i after diagnosis, ei is the effective number of patients at risk in year i after diagnosis, and di is the number of deaths in year i after diagnosis. Incidence and mortality rates: The standard errors of age-adjusted incidence and mortality rates are often not specified. However, the reader can approximate the SE of a particular incidence or mortality rate by the SE of a crude incidence or mortality rate (Keyfitz, 1966), that is, the SE can be approximated by the rate divided by the square root of the number of cancer cases (or the number of deaths). Appendix tables provide numbers of cancer diagnoses within SEER areas and numbers of deaths in the entire US, respectively, by race and sex for the most recent 5-year period. These can be used to obtain approximations of the standard errors for associated age-adjusted rates for the same time period using the above formula. To approximate the standard error of a rate for a single year, use the formula but replace the number of cancer cases or deaths with the number of cancer cases or deaths divided by 5.
DEFINITIONS Several technical terms are used in presenting the data in this report. Their definitions are presented here to clarify them for the reader. Incidence rate: The cancer incidence rate is the number of new cancers of a specific site/type occurring in a specified population during a year, usually expressed as the number of cancers per 100,000 persons at risk. That is, Incidence rate = (New cancers / Population) * 100,000. The numerator of the incidence rate is the number of new cancers; the denominator of the

incidence rate is the size of the population. The number of new cancers may include multiple primary cancers occurring in one patient. The primary site reported is the site of origin and not the metastatic site. In general, the incidence rate would not include recurrences. The population used depends on the rate to be calculated. For cancer sites that occur in only one sex, the sex-specific population (e.g., females for cervical cancer) is used. The incidence rate can be computed for a given type of cancer or for all cancers combined. Except for 5-year age-specific rates, all incidence rates in this report are age-adjusted (see below) to the 2000 US standard population (or, where appropriate, to the world standard million population). (In some previous editions of the CSR, the 1970 US standard million population was used; therefore, incidence rates in this edition cannot be compared to rates published in those editions.) Incidence rates are for invasive cancer only, unless otherwise specified. (Exceptions are the incidence rate for cancer of the urinary bladder (where both in situ and invasive cancers are counted) and breast cancer in situ, which is shown separately.) Death rate: The cancer death (or mortality) rate is the number of deaths with cancer given as the underlying cause of death occurring in a specified population during a year, usually expressed as the number of deaths due to cancer per 100,000 persons. That is, Death Rate = (Cancer Deaths / Population) ∗ 100,000. The numerator of the death rate is the number of deaths; the denominator of the death rate is the size of the population. As with the incidence rate, the population used depends on the rate to be calculated. The death rate can be computed for a given cancer site or for all cancers combined. Except for 5-year age-specific rates, all death rates in this report are age-adjusted (see below) to the 2000 US standard population (or, where appropriate, to the world standard million population). (In some previous editions of the CSR, the 1970 US standard million population was used; therefore, death rates in this edition cannot be compared to rates published in those editions.) Age distribution: A table showing a partition of the entire lifespan into disjoint age intervals, along with the proportion of the population in each interval. Median age: The age at which half of a population is younger and half is older. Standard population: A standard population for a geographic area, such as the US or the world, is a table giving the proportions of the population falling into the age groups 0, 1-4, 5-9, ..., 80-84, and 85+. A standard million population for a geographic area is a table giving the number of persons in each age group 0, 1-4, ... , 85+ out of a theoretical cohort of 1,000,000 persons that is distributed by age in the same proportions as the standard population. Table A-7 shows the US 2000 standard population and the world standard million population. (Some World Health Organization mortality publications use a different world standard million population.) Age-adjusted rate: An age-adjusted incidence or mortality rate is a weighted average of the

age-specific incidence or mortality rates, where the weights are the counts of persons in the corresponding age groups of a standard population. The potential confounding effect of age is reduced when comparing age-adjusted rates based on the same standard population. For this report, the 2000 US standard population (or, where appropriate, the world standard million population) is used in computing age-adjusted rates, unless otherwise noted. Percent change: The percent change (PC) in a statistic over a given time interval is Percent change = (Final value – Initial value) / Initial value * 100. A positive PC corresponds to an increasing trend, a negative PC to a decreasing trend. Annual percent change: The annual percent change (APC) is calculated by first fitting a regression line to the natural logarithms of the rates (r) using calendar year (x) as a regressor variable. In this report the method of weighted least squares is used to calculate the regression equation. If ln(r) = mx + b is the resulting regression equation (with slope m), then APC = 100 * (em – 1). A positive APC corresponds to an increasing trend, a negative APC to a decreasing trend. Because the methods used in their calculation are mathematically different, the signs of the PC and the APC for a given statistic and time interval may differ, as occurs in a few of the tables presented. That is, one of these statistics may show an increasing trend, the other a decreasing trend. Testing the hypothesis that the actual mean annual percent change is 0 is equivalent to testing the hypothesis that the theoretical slope estimated by the slope m of the line representing the equation ln(r) = mx + b is 0. The latter hypothesis is tested using the t distribution of m / SEm with n – 2 degrees of freedom. The standard error of m, called SEm, is obtained from the fit of the regression (Kleinbaum et al., 1988). (This calculation assumes that the rates increased or decreased at a constant rate over the entire calendar year interval; the validity of this assumption was not assessed.) In those few instances where at least one of the rates was 0, the linear regression was not calculated. Average Annual Percent Change: The average annual percent change (AAPC) is a summary measure of a trend over a pre-specified fixed interval based on an underlying joinpoint model. It allows us to use a single number to describe the average trend over a period of multiple years. It can be estimated even if the joinpoint model indicates that there were changes in trends during those years, since it is estimated as a weighted average of the joinpoint APCs, with the weights equal to the lengths of each subinterval over the pre-specified fixed interval. Life table: A table for a given population listing, for each sex and each age from 0 to 120, how many members die at that age and how many survive one more year. Observed survival: The observed survival estimate represents the proportion of cancer patients surviving for a specified time interval after diagnosis. Note that some of those not surviving died of the given cancer and some died of other causes.

Relative survival: The relative survival estimate is calculated using a procedure (Ederer et al., 1961; Ederer and Heise, 1959) whereby the observed survival estimate is adjusted for expected mortality. The relative survival estimate approximates the likelihood that a patient will not die from causes associated specifically with the given cancer before some specified time after diagnosis. It is always larger than the observed survival estimate for the same group of patients. Standard error: The standard error of a rate is a measure of the sampling variability of the rate. Person-years of life lost: The person-years of life lost (PYLL) is calculated as follows: For each individual who dies of the cancer of interest, the number of years of expected additional life for an average person of that age, race, and sex is obtained from life tables for the US population (available from the NCHS). The PYLL in the general population associated with a particular cancer for a given year is simply the sum of this expectation over all those individuals who died of that cancer in that year. Average years of life lost: The average years of life lost (AYLL) associated with a particular cancer for a given year is the PYLL associated with that cancer in the general population divided by the number of deaths from that cancer in the general population in that year. Prevalence: Prevalence is defined as the number or percent of people alive on a certain date in a population who previously had a diagnosis of the disease. It includes new (incident) and pre-existing cases and is a function of past incidence, past survival, and the size and age structure of the population. Limited-duration prevalence represents the proportion of people alive on a certain day who had a diagnosis of the disease within the past x years (e.g. x = 5, 10, or 20 years). Complete prevalence is an estimate of the number of persons (or the proportion of the population) alive on a specified date who had been diagnosed with the given disease, no matter how long ago that diagnosis was. For more details on cancer prevalence definitions and methods, refer to http://surveillance.cancer.gov/prevalence/. Stage of disease at diagnosis: Extent-of-disease information determines stage of disease at diagnosis. The SEER summary stage presented has four levels. An invasive neoplasm confined entirely to the organ of origin is said to be localized. A neoplasm that has extended beyond the limits of the organ of origin, either directly into surrounding organs or tissues or into regional lymph nodes, is said to be regional. A neoplasm that has spread to parts of the body remote from the primary tumor, either by direct extension or by discontinuous metastasis, is said to be distant. When information is not sufficient to assign a stage, a neoplasm is said to be unstaged. In situ tumors (except those of the cervix uteri) are also collected by SEER but generally are not published in this series. For some cancers and diagnosis years, the extent of disease information can also be converted to Stages 0-IV as defined by the American Joint Committee on Cancer (Greene et al, 2002; Edge et al., 2010 ).

SOFTWARE USED TO GENERATE THE SEER CANCER STATISTICS REVIEW The SEER Cancer Statistics Review includes statistics generated by a variety of statistical software including:
• SEER*Stat, statistical software for the analysis of SEER and other cancer databases, was used to generate incidence, mortality, prevalence, and survival statistics presented in the CSR.
• Analysis generated by the Joinpoint Regression Program are presented to better describe trends that are not constant over time.
• The DevCan system generated the probability of developing cancer from twelve SEER areas and the probability of dying from cancer from the total United States.
• The ComPrev software was used to calculate complete prevalence estimates.
Additional statistics can be obtained via SEER's Cancer Query Systems. These data retrieval applications provide access to pre-calculated cancer statistics stored in online databases.

REFERENCES American Cancer Society. Cancer Facts & Figures 2012. Atlanta: American Cancer Society; 2012. Baquet CR, Horm JW, Gibbs T, Greenwald P. Socioeconomic factors and cancer incidence among blacks and whites. J Natl Cancer Inst 1991; 83:551-557.
Breslow L (Chairman, Extramural Committee to Assess Measures of Progress Against Cancer). Measurement of progress against cancer: Final report to the Senate Appropriations Committee. Bethesda: National Cancer Institute; 1988.
Brookmeyer R, Damiano A. Statistical methods for short-term projections of AIDS incidence. Stat Med 1989;8:23-34.
Byrne J, Kessler LG, Devesa SS. The prevalence of cancer among adults in the United States: 1987. Cancer 1992;68:2154-9.
Capocaccia R, De Angelis R. Estimating the completeness of prevalence based on cancer registry data. Stat Med 1997;16:425-40.
Cho H, Howlader N, Mariotto AB, Cronin KA. Estimating relative survival for cancer patients from the SEER Program using expected rates based on Ederer I versus Ederer II method. Surveillance Research Program, National Cancer Institute; 2011. Technical Report #2011-01.
Clegg LX, Feuer EJ, Midthune D, Fay MP, Hankey BF. Impact of reporting delay and reporting error on cancer incidence rates and trends. J Natl Cancer Inst 2002;94:1537-1545.
Clegg L, Gail M, Feuer EJ. Estimating the variance of disease prevalence estimates from population-based registries. Biometrics 2002;58(3):684-8.
Day JC. Population Projections of the United States by Age, Sex, Race, and Hispanic Origin: 1995 to 2050, US Census Bureau, Current Population Reports, P25-1130, US Government Printing Office, Washington, DC, 1996. Available from: http://www.census.gov/prod/1/pop/p25-1130/p251130.pdf
Ederer F, Axtell LM, Cutler SJ. The relative survival rate: A statistical methodology. J Natl Cancer Inst Monogr 1961;6:101-121.
Ederer F, Heise H. Instructions to IBM 650 Programmers in Processing Survival Computations, Technical, End Results Evaluation Section, National Cancer Institute, 1959.
Edge SB, Byrd DR, Compton CC, Fritz AG, Greene FL, Trotti A III. AJCC Cancer Staging Manual, 7th ed. New York (NY): Springer; 2010.

Elandt-Johnson RC, Johnson NL. Survival Models and Data Analysis. New York (NY): Wiley; 1980.
Fay MP. Estimating age conditional probability of developing disease from surveillance data. Popul Health Metr. 2004 Jul 27;2(1):6. Available from: http://www.pophealthmetrics.com/content/2/1/6
Fay MP, Pfeiffer R, Cronin KA, Le C, Feuer EJ. Age-conditional probabilities of developing cancer. Stat Med. 2003;22(11):1837-48.
Feinstein AR, Sosin DM, Wells CK. The Will Rogers phenomenon: Stage migration and new diagnostic techniques as a source of misleading statistics for survival of cancer. New Engl J Med 1985;312:1604-1608.
Feldman AR, Kessler L, Myers M, Naughton MD. The prevalence of cancer: Estimates based on the Connecticut Tumor Registry. New Engl J Med 1986; 315:1394-1397.
Feuer EJ, Wun L-M, Boring CC. Probability of developing cancer. In: Miller BA, Ries LAG, Hankey BF, Kosary CL, Edwards BK, editors. Cancer Statistics Review: 1973-1989. National Cancer Institute, NIH Pub. No. 92-2789, 1992. p. 1-8.
Feuer EJ, Wun L-M, Boring CC, Flanders WD, Timmel MJ, Tong T. The lifetime risk of developing breast cancer. J Natl Cancer Inst 1993;85:892-897.
Fritz A, Percy C, Jack A, Shanmugaratnam K, Sobin L, Parkin DM, Whelan S, editors. International Classification of Diseases for Oncology, 3rd ed. Geneva: World Health Organization; 2000.
Gail MH, Kessler L, Midthune D, Scoppa S. Two approaches for estimating disease prevalence from population-based registries of incidence and total mortality. Biometrics 1999;55:1137-44.
Greene FL, Page DL, Fleming ID, Fritz AG, Balch CM, Haller DG, Morrow M, editors. AJCC Cancer Staging Manual, 6th ed. New York (NY): Springer; 2002.
Hahn RA, Mulinare J, Teutsch SM. Inconsistencies in coding of race and ethnicity between birth and death in US infants. JAMA 1992;267:259-263.
Hakulinen T. Cancer survival corrected for heterogeneity in patient withdrawal. Biometrics 1982;38:933-942. Harris JE. Reporting delays and the incidence of AIDS. J Am Stat Assoc 1990;85:915-924. Howlader N, Ries LAG, Mariotto AB, Reichman ME, Ruhl J, Cronin KA. Improved estimates of cancer-specific survival rates from population-based data. J Natl Cancer Inst 2010;102:1-15. Howlader N, Ries LAG, Stinchcomb DG, Edwards BK. The impact of underreported Veterans

Affairs data on national cancer statistics: analysis using population-based SEER registries. J Natl Cancer Inst 2009;101(7):533-536. Ingram DD, Parker JD, Schenker N, Weed JA, Hamilton B, Arias E, Madans JH. United States Census 2000 population with bridged race categories. Vital Health Stat 2. 2003 Sep;(135):1-55. Keyfitz N. Sampling variance of standardized mortality rates. Hum Biol 1966;38:309-317. Kim H-J, Fay MP, Feuer EJ, Midthune DN. Permutation tests for joinpoint regression with applications to cancer rates. Stat Med 2000;19:335-351. Kleinbaum DG, Kupper LL, Muller KE. Applied Regression Analysis and Other Multivariable Methods, 2nd ed. Boston: PWS-Kent, 1988. Mariotto A, Gigli A, Capocaccia R, Clegg L, Scoppa S, Ries LA, Tesauro GS, Rowland JS, Feuer EJ. Complete and limited duration prevalence estimates. SEER Cancer Statistics Review, 1973-1999. 2002;19. Merrill RM, Feuer EJ, Capocaccia R, Mariotto A. Cancer prevalence estimates based on tumor registry data in the SEER Program. Int J Epidemiol 2000;29:197-207. Midthune DN, Fay MP, Clegg LX, Feuer EJ. Modeling reporting delays and reporting corrections in cancer registry data. J Am Stat Assoc 2005;100(469):61-70.
Pagano M, Tu XM, De Gruttola V, MaWhinney S. Regression analysis of censored and truncated data: estimating reporting-delay distributions and AIDS incidence from surveillance data. Biometrics 1994;50:1203-1214.
Percy C, Ries LAG, Van Holten VD. The accuracy of liver cancer as the underlying cause of death on death certificates. Public Health Rep 1990;105:361-368.
Percy C, Stanek E, Gloeckler L. Accuracy of cancer death certificates and its effect on cancer mortality statistics. . Am J Public Health 1981;71: 3242-3250.
Percy C, Van Holten V, Muir C, editors. International Classification of Diseases for Oncology, 2nd ed. Geneva: World Health Organization;1990.
Ries LAG, Eisner MP, Kosary CL, Hankey BF, Miller BA, Clegg LX, Edwards BK (eds). SEER Cancer Statistics Review, 1973-1997. National Cancer Institute. NIH Pub. No. 00-2789. Bethesda, MD, 2000.
Robinson JG, West KK, Adlakha A. Coverage of the population in Census 2000: Results from demographic analysis. Population Res Policy Rev 2002;21:19-38.
Rosenberg HM, Maurer JD, Sorlie PD, Johnson NJ, MacDorman MF, Hoyert DL, Spitler JF, Scott C. Quality of death rates by race and Hispanic origin: A summary of current research. Hyattsville (MD): National Center for Health Statistics; Vital and Health Statistics, Series 2, No. 128, 1999.

Siegel R, Naishadham D, Jemal A. Cancer statistics, 2012. CA Cancer J Clin 2012 Jan-Feb;62(1):10-29.
Simonetti A, Gigli A, Capocaccia R, Mariotto A. Estimating complete prevalence of cancers diagnosed in childhood. Stat Med 2008 Mar 30;27(7):990-1007. Snedecor GW, Cochran WG. Statistical Methods, 7th ed. Ames (IA): Iowa State University Press; 1980.
US Cancer Statistics Working Group. United States Cancer Statistics: 1999-2002 Incidence and Mortality Web-based Report Version. Atlanta: Department of Health and Human Services, Centers for Disease Control and Prevention, and National Cancer Institute; 2005. Available from: http://www.cdc.gov/cancer/npcr/uscs/index.htm
US Census Bureau. Current Population Reports; Series P-25 No. 985. Washington (DC): US Government Printing Office; 1986.
US Census Bureau: State and County QuickFacts. Data derived from Population Estimates, Census of Population and Housing, Small Area Income and Poverty Estimates, State and County Housing Unit Estimates, County Business Patterns, Nonemployer Statistics, Economic Census, Survey of Business Owners, Building Permits, Consolidated Federal Funds Report. Last Revised: Thursday, 04-Nov-2010 12:46:18 EDT.
Zelen M. Theory of early detection of breast cancer in the general population. In: Heuson J-C, Mattheiem WH, Rozencweig M, editors. Breast Cancer: Trends in Research and Treatment. New York (NY): Raven Press; 1976. p. 287-299.
Zou J, Huang L, Midthune D, Horner MJ, Krapcho M, Feuer EJ. Effect of reporting year on delay modeling. Statistical Research and Applications Branch, National Cancer Institute; 2009. Technical Report #2009-01. Available from: http://surveillance.cancer.gov/reports/.

SEER Cancer Statistics Review 1975-2010 National Cancer Institute
Cancer Facts & Figures – 2013, American Cancer Society (ACS), Atlanta, Georgia, 2013.Excludes basal and squamous cell skin and in situ carcinomas except urinary bladder.
Incidence projections are based on rates from the North American Association of CentralCancer Registries(NAACCR) from 1995-2009, representing about 98% of the US population.Estimated deaths are based on data from US Mortality Data, 1995-2009, National Center forHealth Statistics, Centers for Disease Control and Prevention.
a Estimated deaths for colon & rectum cancers are combined.b Carcinoma in situ of the breast accounts for about 64,640 new cases annually,
and melanoma in situ accounts for about 61,300 new cases annually.c More deaths than cases suggests lack of specificity in recording underlying causes of
death on death certificate.
Estimated New Cases Estimated DeathsPrimary Site Total Males Females Total Males Females
All Sites 1,660,290 854,790 805,500 580,350 306,920 273,430Oral Cavity and Pharynx 41,380 29,620 11,760 7,890 5,500 2,390Tongue 13,590 9,900 3,690 2,070 1,380 690Mouth 11,400 6,730 4,670 1,800 1,080 720Pharynx 13,930 11,200 2,730 2,400 1,790 610Other Oral Cavity 2,460 1,790 670 1,640 1,260 380
Digestive System 290,200 160,750 129,450 144,570 82,700 61,870Esophagus 17,990 14,440 3,550 15,210 12,220 2,990Stomach 21,600 13,230 8,370 10,990 6,740 4,250Small Intestine 8,810 4,670 4,140 1,170 610 560Colona 102,480 50,090 52,390 50,830 26,300 24,530Rectum 40,340 23,590 16,750Anus, Anal Canal, and 7,060 2,630 4,430 880 330 550Anorectum
Liver and Intrahepatic 30,640 22,720 7,920 21,670 14,890 6,780Bile Duct
Gallbladder and Other 10,310 4,740 5,570 3,230 1,260 1,970Biliary
Pancreas 45,220 22,740 22,480 38,460 19,480 18,980Other Digestive 5,750 1,900 3,850 2,130 870 1,260
Respiratory System 246,210 131,760 114,450 163,890 90,600 73,290Larynx 12,260 9,680 2,580 3,630 2,860 770Lung and Bronchus 228,190 118,080 110,110 159,480 87,260 72,220Other Respiratory 5,760 4,000 1,760 780 480 300
Bones and Joints 3,010 1,680 1,330 1,440 810 630Soft Tissue 11,410 6,290 5,120 4,390 2,500 1,890Skin (excl. basal & squamous) 82,770 48,660 34,110 12,650 8,560 4,090Melanoma of the Skinb 76,690 45,060 31,630 9,480 6,280 3,200Other non-epithelial skin 6,080 3,600 2,480 3,170 2,280 890
Breastb 234,580 2,240 232,340 40,030 410 39,620Genital Organs 339,810 248,080 91,730 58,480 30,400 28,080Cervix (uterus) 12,340 12,340 4,030 4,030Endometrium (uterus) 49,560 49,560 8,190 8,190Ovary 22,240 22,240 14,030 14,030Vulva 4,700 4,700 990 990Vagina and other genital 2,890 2,890 840 840organs, female
Prostate 238,590 238,590 29,720 29,720Testis 7,920 7,920 370 370Penis and other genital 1,570 1,570 310 310organs, male
Urinary System 140,430 96,800 43,630 29,790 20,120 9,670Urinary Bladder 72,570 54,610 17,960 15,210 10,820 4,390Kidney and Renal Pelvis 65,150 40,430 24,720 13,680 8,780 4,900Ureter and other urinary 2,710 1,760 950 900 520 380organs
Eye and Orbit 2,800 1,490 1,310 320 120 200Brain and Other Nervous 23,130 12,770 10,360 14,080 7,930 6,150System
Endocrine System 62,710 16,210 46,500 2,770 1,270 1,500Thyroid 60,220 14,910 45,310 1,850 810 1,040Other Endocrine 2,490 1,300 1,190 920 460 460
Lymphoma 79,030 42,670 36,360 20,200 11,250 8,950Hodgkin Lymphoma 9,290 5,070 4,220 1,180 660 520Non-Hodgkin Lymphoma 69,740 37,600 32,140 19,020 10,590 8,430
Myeloma 22,350 12,440 9,910 10,710 6,070 4,640Leukemia 48,610 27,880 20,730 23,720 13,660 10,060Lymphocytic Leukemias 21,750 13,070 8,680 6,010 3,570 2,440Myeloid Leukemias 20,510 11,240 9,270 10,980 6,270 4,710Other leukemia 6,350 3,570 2,780 6,730 3,820 2,910
All Other Sitesc 31,860 15,450 16,410 45,420 25,020 20,400
Table 1.1
Estimated New Cancer Cases and Deaths for 2013All Races, By Sex

SEER Cancer Statistics Review 1975-2010 National Cancer Institute
Excludes basal and squamous cell skin and in situ carcinomas except urinary bladder.
Incidence projections are based on rates from the North American Association of CentralCancer Registries(NAACCR) from 1995-2009, representing about 98% of the US population.Estimated deaths are based on data from US Mortality Data, 1995-2009, National Center forHealth Statistics, Centers for Disease Control and Prevention.
a Estimated deaths for colon & rectum cancers are combined.b More deaths than cases suggests lack of specificity in recording underlying causes of
death on death certificate.
Estimated New Cases Estimated DeathsPrimary Site Total Males Females Total Males Females
All Sites 1,585,440 824,270 761,170 574,738 301,032 273,706Oral Cavity and Pharynx 38,540 27,290 11,250 8,474 5,815 2,659Tongue 11,850 8,500 3,350 2,125 1,421 704Mouth 11,190 6,610 4,580 2,132 1,268 864Pharynx 12,850 10,240 2,610 2,626 1,946 680Other Oral Cavity 2,650 1,940 710 1,591 1,180 411
Digestive System 278,440 152,640 125,800 142,800 80,772 62,028Esophagus 17,000 13,490 3,510 14,490 11,416 3,074Stomach 21,390 13,100 8,290 11,390 6,703 4,687Small Intestine 7,760 4,110 3,650 1,218 656 562Colona 103,340 50,470 52,870 52,045 27,073 24,972Rectum 40,330 23,350 16,980Anus, Anal Canal, and 6,130 2,300 3,830 813 335 478Anorectum
Liver and Intrahepatic 25,920 18,800 7,120 20,304 13,657 6,647Bile Duct
Gallbladder and Other 9,720 4,390 5,330 3,624 1,424 2,200Biliary
Pancreas 41,740 20,920 20,820 36,888 18,699 18,189Other Digestive 5,110 1,710 3,400 2,028 809 1,219
Respiratory System 238,740 130,380 108,360 162,866 91,237 71,629Larynx 12,420 9,810 2,610 3,691 2,951 740Lung and Bronchus 220,690 116,650 104,040 158,248 87,698 70,550Other Respiratory 5,630 3,920 1,710 927 588 339
Bones and Joints 2,920 1,620 1,300 1,378 803 575Soft Tissue 10,650 5,830 4,820 4,377 2,299 2,078Skin (excl. basal & squamous) 73,150 42,830 30,320 12,125 8,147 3,978Melanoma of the Skin 67,020 39,010 28,010 9,154 6,002 3,152Other non-epithelial skin 6,130 3,820 2,310 2,971 2,145 826
Breast 217,770 2,100 215,670 41,435 439 40,996Genital Organs 338,960 251,350 87,610 58,046 29,276 28,770Cervix (uterus) 12,400 12,400 3,939 3,939Endometrium (uterus) 46,090 46,090 8,402 8,402Ovary 21,880 21,880 14,572 14,572Vulva 4,520 4,520 942 942Vagina and other genital 2,720 2,720 915 915organs, female
Prostate 241,890 241,890 28,560 28,560Testis 7,940 7,940 399 399Penis and other genital 1,520 1,520 317 317organs, male
Urinary System 128,980 88,790 40,190 28,726 19,329 9,397Urinary Bladder 69,370 51,940 17,430 14,730 10,428 4,302Kidney and Renal Pelvis 56,850 35,140 21,710 13,219 8,436 4,783Ureter and other urinary 2,760 1,710 1,050 777 465 312organs
Eye and Orbit 2,700 1,440 1,260 283 146 137Brain and Other Nervous 22,150 12,190 9,960 14,164 7,977 6,187System
Endocrine System 49,290 12,800 36,490 2,641 1,220 1,421Thyroid 46,920 11,540 35,380 1,686 723 963Other Endocrine 2,370 1,260 1,110 955 497 458
Lymphoma 74,450 40,070 34,380 21,525 11,761 9,764Hodgkin Lymphoma 8,930 4,890 4,040 1,231 714 517Non-Hodgkin Lymphoma 65,520 35,180 30,340 20,294 11,047 9,247
Myeloma 20,640 11,450 9,190 11,022 5,881 5,141Leukemia 45,890 26,390 19,500 22,673 12,912 9,761Lymphocytic Leukemias 20,250 11,970 8,280 5,922 3,476 2,446Myeloid Leukemias 18,990 10,420 8,570 10,169 5,764 4,405Other leukemia 6,080 3,450 2,630 6,582 3,672 2,910
All Other Sitesb 32,600 15,960 16,640 42,203 23,018 19,185
Table 1.2
Estimated New Cancer Cases and Actual Deaths for 2010All Races, By Sex

SEER Cancer Statistics Review 1975-2010 National Cancer Institute
Source: US Mortality Files, National Center for Health Statistics, Centers for Disease Control andPrevention.
a Rates are per 100,000 and age-adjusted to the 2000 US Std Population (18 age groups -Census P25-1130).
b Due to coding changes throughout the years, Lung and Bronchus includes trachea and pleura.* The APC is significantly different from zero (p<.05).- Statistic not shown. Rate based on less than 16 cases for the time interval.
Trend based on less than 10 cases for at least one year within the time interval.
Total
Annual Percent
Percent Change Change
Age Group 1950 1980 2010 1950-1980 1980-2010 1950-2010
Ages 0-4 11.1 4.2 2.0 -3.2* -2.6* -81.8
Ages 5-14 6.7 4.3 2.2 -1.5* -2.2* -66.4
Ages 15-24 8.6 6.3 3.6 -1.1* -1.5* -57.6
Ages 25-34 20.4 13.9 8.9 -1.4* -1.6* -56.3
Ages 35-44 63.6 49.9 28.7 -0.7* -1.8* -54.9
Ages 45-54 174.2 175.5 109.5 0.1* -1.7* -37.2
Ages 55-64 391.3 431.5 295.4 0.4* -1.4* -24.5
Ages 65-74 710.0 823.7 674.3 0.5* -0.7* -5.0
Ages 75-84 1,167.2 1,227.9 1,188.1 0.2* -0.1 1.8
Ages 85+ 1,450.7 1,572.9 1,713.7 0.2 0.3* 18.1
All Ages 195.4 206.9 171.8 0.2* -0.7* -12.1
Total
Annual Percent
Percent Change Change
Age Group 1950 1980 2010 1950-1980 1980-2010 1950-2010
Ages 0-4 - - - - - -
Ages 5-14 - - - - - -
Ages 15-24 0.2 0.1 0.1 -2.8* -0.1 -53.0
Ages 25-34 0.8 0.7 0.4 -0.3 -2.2* -49.5
Ages 35-44 4.6 9.6 3.3 2.7* -2.6* -28.3
Ages 45-54 20.2 52.7 26.2 3.3* -2.6* 29.5
Ages 55-64 48.9 137.1 84.0 3.3* -1.8* 71.9
Ages 65-74 59.4 234.5 226.8 4.2* -0.2 281.7
Ages 75-84 55.4 239.4 355.5 4.9* 1.2* 541.9
Ages 85+ 42.3 174.7 330.0 5.1* 2.1* 680.2
All Ages 14.9 49.7 47.5 3.9* -0.3* 217.9
Table 1.3
61-Year Trends in U.S. Cancer Death Ratesa
All Races, Males and Females
All Primary Cancer Sites Combined
Lung and Bronchus Cancerb
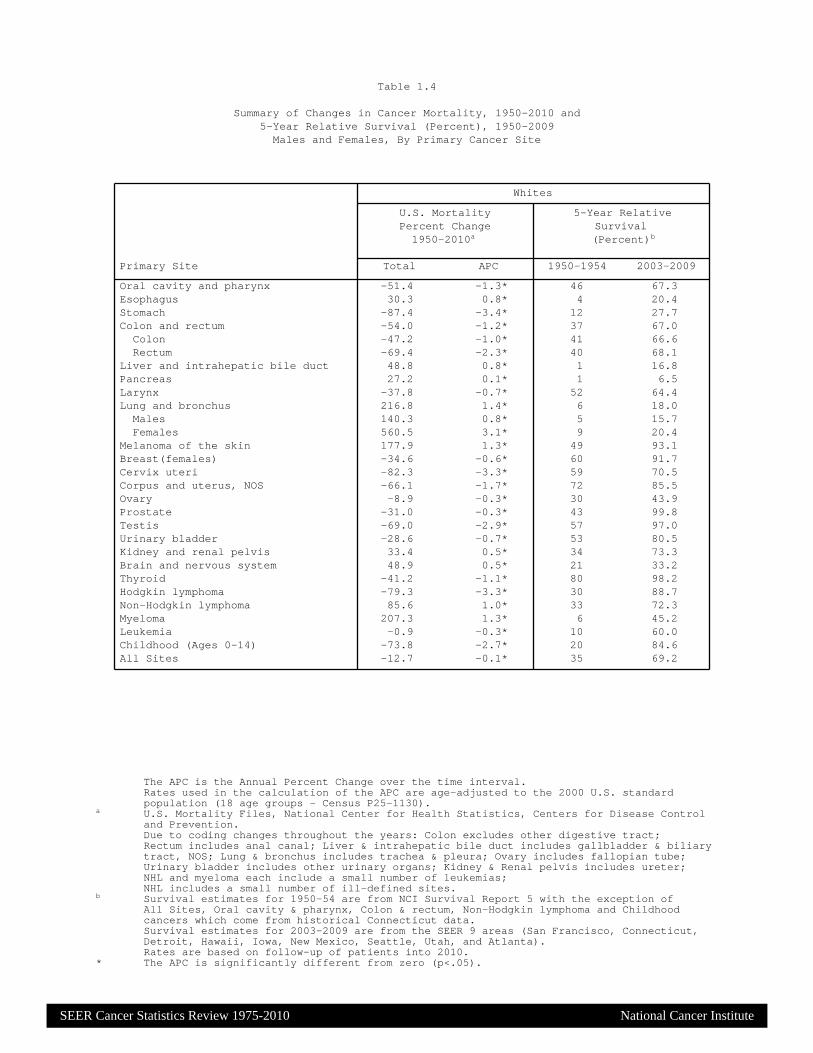
SEER Cancer Statistics Review 1975-2010 National Cancer Institute
The APC is the Annual Percent Change over the time interval.Rates used in the calculation of the APC are age-adjusted to the 2000 U.S. standardpopulation (18 age groups - Census P25-1130).
a U.S. Mortality Files, National Center for Health Statistics, Centers for Disease Controland Prevention.Due to coding changes throughout the years: Colon excludes other digestive tract;Rectum includes anal canal; Liver & intrahepatic bile duct includes gallbladder & biliarytract, NOS; Lung & bronchus includes trachea & pleura; Ovary includes fallopian tube;Urinary bladder includes other urinary organs; Kidney & Renal pelvis includes ureter;NHL and myeloma each include a small number of leukemias;NHL includes a small number of ill-defined sites.
b Survival estimates for 1950-54 are from NCI Survival Report 5 with the exception ofAll Sites, Oral cavity & pharynx, Colon & rectum, Non-Hodgkin lymphoma and Childhoodcancers which come from historical Connecticut data.Survival estimates for 2003-2009 are from the SEER 9 areas (San Francisco, Connecticut,Detroit, Hawaii, Iowa, New Mexico, Seattle, Utah, and Atlanta).Rates are based on follow-up of patients into 2010.
* The APC is significantly different from zero (p<.05).
Whites
U.S. Mortality 5-Year RelativePercent Change Survival1950-2010a (Percent)b
Primary Site Total APC 1950-1954 2003-2009
Oral cavity and pharynx -51.4 -1.3* 46 67.3Esophagus 30.3 0.8* 4 20.4Stomach -87.4 -3.4* 12 27.7Colon and rectum -54.0 -1.2* 37 67.0Colon -47.2 -1.0* 41 66.6Rectum -69.4 -2.3* 40 68.1
Liver and intrahepatic bile duct 48.8 0.8* 1 16.8Pancreas 27.2 0.1* 1 6.5Larynx -37.8 -0.7* 52 64.4Lung and bronchus 216.8 1.4* 6 18.0Males 140.3 0.8* 5 15.7Females 560.5 3.1* 9 20.4
Melanoma of the skin 177.9 1.3* 49 93.1Breast(females) -34.6 -0.6* 60 91.7Cervix uteri -82.3 -3.3* 59 70.5Corpus and uterus, NOS -66.1 -1.7* 72 85.5Ovary -8.9 -0.3* 30 43.9Prostate -31.0 -0.3* 43 99.8Testis -69.0 -2.9* 57 97.0Urinary bladder -28.6 -0.7* 53 80.5Kidney and renal pelvis 33.4 0.5* 34 73.3Brain and nervous system 48.9 0.5* 21 33.2Thyroid -41.2 -1.1* 80 98.2Hodgkin lymphoma -79.3 -3.3* 30 88.7Non-Hodgkin lymphoma 85.6 1.0* 33 72.3Myeloma 207.3 1.3* 6 45.2Leukemia -0.9 -0.3* 10 60.0Childhood (Ages 0-14) -73.8 -2.7* 20 84.6All Sites -12.7 -0.1* 35 69.2
Table 1.4
Summary of Changes in Cancer Mortality, 1950-2010 and5-Year Relative Survival (Percent), 1950-2009Males and Females, By Primary Cancer Site

SEER Cancer Statistics Review 1975-2010 National Cancer Institute
Note: Incidence and death rates are per 100,000 and are age-adjusted to the 2000 US StdPopulation (19 age groups - Census P25-1130).
a SEER 18 areas (San Francisco, Connecticut, Detroit, Hawaii, Iowa, New Mexico, Seattle,Utah, Atlanta, San Jose-Monterey, Los Angeles, Alaska Native Registry, Rural Georgia,California excluding SF/SJM/LA, Kentucky, Louisiana, New Jersey andGeorgia excluding ATL/RG).
b US Mortality Files, National Center for Health Statistics, Centers for Disease Control andPrevention.
c SEER 18 areas. Based on follow-up of patients into 2010.d Mesotheliomas of the Pleura are included in the separate group Mesothelioma for incidence
but are included in the Pleura grouping for mortality.- Statistic could not be calculated due to less than 16 cases in the time interval.
Incidencea US Mortalityb Survivalc (%)(2006-2010) (2006-2010) (2003-2009)
Site Total Males Females Total Males Females Total Males Females
All Sites 463.0 535.9 411.2 176.4 215.3 149.7 65.8 66.4 65.3
Oral Cavity & Pharynx: 10.8 16.2 6.2 2.5 3.8 1.4 62.2 61.4 64.0Lip 0.7 1.1 0.3 0.0 0.0 0.0 89.6 89.8 88.9Tongue 3.1 4.7 1.8 0.6 0.9 0.4 62.1 62.6 60.7Salivary gland 1.3 1.7 1.0 0.2 0.4 0.1 72.1 65.2 81.1Floor of mouth 0.6 0.8 0.3 0.0 0.0 0.0 50.8 48.1 57.4Gum & other oral cavity 1.5 1.8 1.3 0.4 0.4 0.3 60.1 58.4 62.0Nasopharynx 0.6 0.9 0.4 0.2 0.3 0.1 58.9 58.0 61.0Tonsil 1.8 3.0 0.6 0.2 0.4 0.1 69.9 70.7 66.2Oropharynx 0.4 0.6 0.2 0.2 0.3 0.1 40.7 41.8 36.8Hypopharynx 0.6 1.1 0.3 0.1 0.2 0.0 30.9 30.5 32.2Other oral cavity & pharynx 0.2 0.3 0.1 0.5 0.8 0.2 35.4 37.0 31.2
Digestive System: 85.3 104.2 69.9 42.9 55.1 33.3 44.6 42.8 46.6Esophagus 4.4 7.7 1.8 4.3 7.6 1.6 17.3 17.5 16.5Stomach 7.5 10.4 5.3 3.5 4.9 2.5 27.7 25.8 30.4Small intestine 2.1 2.5 1.7 0.4 0.4 0.3 64.5 64.6 64.5Colon & Rectum: 45.0 52.2 39.3 16.4 19.6 13.9 64.9 65.1 64.6Colon 32.2 36.1 29.1 - - - 64.2 64.7 63.8Rectum 12.8 16.1 10.1 - - - 66.5 66.1 67.0
Anus, anal canal & anorectum 1.7 1.5 1.9 0.2 0.2 0.2 65.6 59.8 69.5Liver & intrahepatic 7.7 11.9 4.0 5.6 8.3 3.4 16.1 15.9 16.7bile duct
Gallbladder 1.2 0.8 1.4 0.6 0.5 0.8 17.5 15.7 18.2Other biliary 1.8 2.3 1.5 0.4 0.5 0.4 16.1 17.2 14.7Pancreas 12.2 13.9 10.9 10.9 12.5 9.6 6.0 5.6 6.5Retroperitoneum 0.4 0.4 0.4 0.1 0.1 0.1 53.2 53.0 53.5Peritoneum, omentum & 0.6 0.1 1.1 0.3 0.1 0.4 30.7 41.4 30.0mesentery
Other digestive system 0.5 0.6 0.5 0.3 0.4 0.2 10.9 10.6 11.1
Respiratory System: 65.7 81.6 53.8 50.9 65.9 39.8 19.6 18.8 20.6Nose, nasal cavity & 0.7 0.9 0.5 0.2 0.2 0.1 55.5 56.0 54.8middle ear
Larynx 3.4 6.0 1.3 1.1 2.0 0.4 60.6 61.5 57.2Lung & bronchus 61.4 74.3 51.9 49.5 63.5 39.2 16.6 14.3 19.2Pleurad 0.0 0.0 0.0 0.1 0.1 0.0 22.2 16.3 31.1Trachea & other 0.2 0.3 0.1 0.1 0.1 0.0 49.8 52.1 44.2respiratory organs
Bones & joints 0.9 1.1 0.8 0.4 0.5 0.3 66.4 64.0 69.3
Soft tissue (including heart) 3.3 4.0 2.8 1.3 1.5 1.1 66.1 65.2 67.1
Skin (excl. basal & squamous): 23.1 30.1 18.1 3.6 5.6 2.1 90.8 88.9 93.3Melanoma of the skin 21.1 27.4 16.7 2.7 4.1 1.7 91.3 89.4 93.7Other non-epithelial skin 2.0 2.7 1.4 0.9 1.5 0.4 84.9 82.5 87.9
Breast 66.8 1.2 123.8 12.7 0.3 22.6 89.2 83.5 89.2
Breast (in situ) 16.6 0.2 31.4 - - - 100.0 100.0 100.0
Table 1.5Age-Adjusted SEER Incidence and U.S. Death Rates and 5-Year Relative Survival (Percent)
By Primary Cancer Site, Sex and Time Period
All Races

SEER Cancer Statistics Review 1975-2010 National Cancer Institute
Note: Incidence and death rates are per 100,000 and are age-adjusted to the 2000 US StdPopulation (19 age groups - Census P25-1130).
a SEER 18 areas (San Francisco, Connecticut, Detroit, Hawaii, Iowa, New Mexico, Seattle,Utah, Atlanta, San Jose-Monterey, Los Angeles, Alaska Native Registry, Rural Georgia,California excluding SF/SJM/LA, Kentucky, Louisiana, New Jersey andGeorgia excluding ATL/RG).
b US Mortality Files, National Center for Health Statistics, Centers for Disease Control andPrevention.
c SEER 18 areas. Based on follow-up of patients into 2010.d Ovary excludes borderline cases or histologies 8442, 8451, 8462, 8472, and 8473.e Due to coding changes, Brain & Nervous System mortality are no longer shown separately.f Rate not shown for mortality. Category did not exist in mortality coding until 1999.- Statistic could not be calculated due to less than 16 cases in the time interval.
Incidencea US Mortalityb Survivalc (%)(2006-2010) (2006-2010) (2003-2009)
Site Total Males Females Total Males Females Total Males Females
Female Genital System: 26.1 - 48.8 8.7 - 15.6 68.1 - 68.1Cervix uteri 4.1 - 7.9 1.2 - 2.4 67.9 - 67.9Corpus uteri 12.6 - 23.6 1.1 - 1.9 82.8 - 82.8Uterus, NOS 0.3 - 0.6 1.3 - 2.4 26.6 - 26.6Ovaryd 6.8 - 12.5 4.5 - 8.1 44.2 - 44.2Vagina 0.4 - 0.7 0.1 - 0.2 50.9 - 50.9Vulva 1.3 - 2.4 0.3 - 0.5 70.8 - 70.8Other female genital system 0.5 - 0.9 0.1 - 0.2 60.1 - 60.1
Male Genital System: 71.8 158.6 - 9.2 23.5 - 98.9 98.9 -Prostate 68.6 152.0 - 9.0 23.0 - 99.2 99.2 -Testis 2.8 5.5 - 0.1 0.2 - 95.3 95.3 -Penis 0.4 0.8 - 0.1 0.2 - 68.4 68.4 -Other male genital system 0.1 0.3 - 0.0 0.0 - 87.4 87.4 -
Urinary System: 36.9 58.9 20.0 8.6 13.8 5.0 74.8 76.1 72.0Urinary bladder 20.7 36.6 8.9 4.4 7.7 2.2 77.9 79.4 73.1Kidney & renal pelvis 15.3 21.0 10.6 4.0 5.8 2.6 71.8 71.7 72.1Ureter 0.6 0.8 0.4 0.1 0.1 0.1 50.4 52.6 47.5Other urinary system 0.3 0.5 0.2 0.1 0.2 0.1 51.7 55.3 45.8
Eye & Orbit 0.8 0.9 0.7 0.1 0.1 0.1 81.7 81.4 82.1
Brain & Nervous System:e 6.5 7.7 5.4 4.3 5.2 3.5 33.5 32.3 35.0Brain 6.1 7.3 5.0 - - - 30.4 29.7 31.2Cranial nerves & other 0.4 0.4 0.4 - - - 77.7 74.1 80.9nervous system
Endocrine System: 13.0 7.0 18.8 0.8 0.8 0.8 95.6 91.0 97.2Thyroid 12.2 6.1 18.2 0.5 0.5 0.5 97.7 95.2 98.5Other endocrine & thymus 0.8 0.9 0.7 0.3 0.3 0.3 63.9 64.6 63.0
Lymphoma: 22.5 27.0 18.8 6.8 8.7 5.4 71.3 70.0 72.7Hodgkin lymphoma 2.8 3.2 2.4 0.4 0.5 0.3 85.1 84.3 86.0Non-Hodgkin lymphoma 19.7 23.9 16.4 6.4 8.2 5.1 69.0 67.6 70.6
Myeloma 5.9 7.5 4.8 3.4 4.3 2.7 43.2 44.1 42.1
Leukemia: 12.8 16.3 10.0 7.1 9.5 5.3 56.0 56.7 55.2Lymphocytic: 6.4 8.4 4.7 2.0 2.8 1.4 75.5 75.5 75.4Acute lymphocytic 1.7 1.9 1.5 0.5 0.5 0.4 66.0 66.0 66.0Chronic lymphocytic 4.3 5.9 3.1 1.4 2.1 0.9 79.2 78.4 80.3Other lymphocytic 0.4 0.7 0.2 0.1 0.2 0.1 80.7 85.0 68.8
Myeloid & Monocytic: 5.7 7.1 4.7 3.4 4.5 2.6 35.3 34.8 36.0Acute myeloid 3.7 4.5 3.1 2.8 3.7 2.2 24.2 22.7 25.9Chronic myeloid 1.6 2.1 1.2 0.3 0.4 0.2 61.0 60.1 62.2Acute monocytic 0.3 0.3 0.2 0.0 0.0 0.0 23.3 23.6 23.0Other myeloid & monocytic 0.2 0.2 0.1 0.2 0.3 0.1 32.8 31.6 34.0
Other leukemia: 0.6 0.8 0.6 1.7 2.2 1.3 28.8 28.5 29.0Other acute leukemia 0.2 0.3 0.2 0.7 0.9 0.5 17.2 18.0 16.3Aleukemic, subleukemic & NOS 0.4 0.5 0.4 1.0 1.4 0.8 36.8 36.6 37.0
Kaposi Sarcomaf 0.6 1.0 0.1 - - - 71.1 70.5 75.9Mesotheliomaf 1.0 1.9 0.4 - - - 8.4 6.6 13.8
Ill-defined & unspecified 9.1 10.6 8.0 13.1 16.6 10.6 17.1 21.1 13.3
Table 1.5 - continuedAge-Adjusted SEER Incidence and U.S. Death Rates and 5-Year Relative Survival (Percent)
By Primary Cancer Site, Sex and Time Period
All Races

SEER Cancer Statistics Review 1975-2010 National Cancer Institute
Note: Incidence and death rates are per 100,000 and are age-adjusted to the 2000 US StdPopulation (19 age groups - Census P25-1130).
a SEER 18 areas (San Francisco, Connecticut, Detroit, Hawaii, Iowa, New Mexico, Seattle,Utah, Atlanta, San Jose-Monterey, Los Angeles, Alaska Native Registry, Rural Georgia,California excluding SF/SJM/LA, Kentucky, Louisiana, New Jersey andGeorgia excluding ATL/RG).
b US Mortality Files, National Center for Health Statistics, Centers for Disease Control andPrevention.
c SEER 18 areas. Based on follow-up of patients into 2010.d Mesotheliomas of the Pleura are included in the separate group Mesothelioma for incidence
but are included in the Pleura grouping for mortality.- Statistic could not be calculated due to less than 16 cases in the time interval.
Incidencea US Mortalityb Survivalc (%)(2006-2010) (2006-2010) (2003-2009)
Site Total Males Females Total Males Females Total Males Females
All Sites 471.9 539.1 424.4 175.8 213.1 149.8 66.5 66.8 66.1
Oral Cavity & Pharynx: 11.2 16.7 6.3 2.4 3.6 1.4 63.9 63.6 64.6Lip 0.8 1.3 0.4 0.0 0.0 0.0 89.7 90.1 88.7Tongue 3.4 5.1 1.9 0.6 0.9 0.4 64.1 65.0 61.9Salivary gland 1.3 1.8 1.0 0.2 0.4 0.1 71.0 63.8 81.0Floor of mouth 0.6 0.9 0.4 0.0 0.0 0.0 52.0 49.3 58.7Gum & other oral cavity 1.5 1.8 1.3 0.4 0.4 0.3 60.0 59.0 61.2Nasopharynx 0.4 0.6 0.2 0.2 0.2 0.1 54.1 54.5 52.9Tonsil 1.9 3.3 0.7 0.2 0.4 0.1 72.4 73.1 68.9Oropharynx 0.4 0.6 0.2 0.2 0.3 0.1 44.7 46.4 38.3Hypopharynx 0.6 1.1 0.3 0.1 0.1 0.0 33.7 33.7 34.0Other oral cavity & pharynx 0.2 0.3 0.1 0.5 0.8 0.2 37.7 39.5 33.0
Digestive System: 82.6 100.9 67.5 41.5 53.2 32.0 45.3 43.7 47.2Esophagus 4.6 8.0 1.8 4.4 7.8 1.6 18.2 18.5 17.2Stomach 6.6 9.2 4.5 3.1 4.2 2.2 26.2 24.4 29.2Small intestine 2.0 2.5 1.7 0.3 0.4 0.3 65.0 65.9 63.9Colon & Rectum: 44.2 51.3 38.4 15.9 19.1 13.4 65.5 65.9 65.1Colon 31.7 35.6 28.5 - - - 65.1 65.6 64.6Rectum 12.6 15.7 9.9 - - - 66.6 66.5 66.6
Anus, anal canal & anorectum 1.8 1.5 2.1 0.2 0.2 0.3 67.1 61.7 70.5Liver & intrahepatic 6.7 10.4 3.5 5.2 7.6 3.2 15.4 15.3 15.7bile duct
Gallbladder 1.1 0.8 1.4 0.6 0.4 0.7 17.7 15.0 18.7Other biliary 1.8 2.2 1.5 0.5 0.5 0.4 15.9 17.2 14.5Pancreas 12.1 13.8 10.7 10.8 12.5 9.4 6.0 5.6 6.4Retroperitoneum 0.4 0.4 0.4 0.1 0.1 0.1 53.6 52.4 54.6Peritoneum, omentum & 0.7 0.1 1.2 0.3 0.1 0.4 30.4 39.9 29.7mesentery
Other digestive system 0.5 0.6 0.5 0.3 0.4 0.2 10.4 10.7 10.2
Respiratory System: 67.4 81.8 56.5 51.5 65.6 41.0 19.9 19.1 20.8Nose, nasal cavity & 0.7 0.9 0.5 0.2 0.2 0.1 56.2 57.5 54.5middle ear
Larynx 3.4 6.0 1.3 1.1 1.9 0.4 61.5 62.4 57.8Lung & bronchus 63.1 74.5 54.6 50.2 63.2 40.4 16.9 14.5 19.5Pleurad 0.0 0.1 0.0 0.1 0.1 0.0 20.2 15.9 27.1Trachea & other 0.2 0.3 0.1 0.1 0.1 0.1 49.9 53.4 40.4respiratory organs
Bones & joints 1.0 1.2 0.8 0.4 0.5 0.4 66.9 63.9 70.6
Soft tissue (including heart) 3.4 4.1 2.8 1.3 1.5 1.1 67.2 66.1 68.5
Skin (excl. basal & squamous): 27.0 34.8 21.4 4.1 6.3 2.4 90.5 88.5 93.1Melanoma of the skin 25.0 31.9 20.0 3.1 4.6 2.0 91.1 89.1 93.5Other non-epithelial skin 2.0 2.9 1.4 0.9 1.6 0.5 83.1 80.3 86.8
Breast 68.0 1.2 127.4 12.3 0.3 22.1 90.4 85.8 90.4
Breast (in situ) 16.7 0.1 31.9 - - - 100.0 100.0 100.0
Table 1.6Age-Adjusted SEER Incidence and U.S. Death Rates and 5-Year Relative Survival (Percent)
By Primary Cancer Site, Sex and Time Period
Whites

SEER Cancer Statistics Review 1975-2010 National Cancer Institute
Note: Incidence and death rates are per 100,000 and are age-adjusted to the 2000 US StdPopulation (19 age groups - Census P25-1130).
a SEER 18 areas (San Francisco, Connecticut, Detroit, Hawaii, Iowa, New Mexico, Seattle,Utah, Atlanta, San Jose-Monterey, Los Angeles, Alaska Native Registry, Rural Georgia,California excluding SF/SJM/LA, Kentucky, Louisiana, New Jersey andGeorgia excluding ATL/RG).
b US Mortality Files, National Center for Health Statistics, Centers for Disease Control andPrevention.
c SEER 18 areas. Based on follow-up of patients into 2010.d Ovary excludes borderline cases or histologies 8442, 8451, 8462, 8472, and 8473.e Due to coding changes, Brain & Nervous System mortality are no longer shown separately.f Rate not shown for mortality. Category did not exist in mortality coding until 1999.- Statistic could not be calculated due to less than 16 cases in the time interval.
Incidencea US Mortalityb Survivalc (%)(2006-2010) (2006-2010) (2003-2009)
Site Total Males Females Total Males Females Total Males Females
Female Genital System: 26.7 - 50.5 8.5 - 15.5 69.3 - 69.3Cervix uteri 4.0 - 7.9 1.1 - 2.2 69.1 - 69.1Corpus uteri 13.0 - 24.5 1.0 - 1.8 84.9 - 84.9Uterus, NOS 0.3 - 0.6 1.2 - 2.2 26.7 - 26.7Ovaryd 7.1 - 13.3 4.7 - 8.4 44.0 - 44.0Vagina 0.4 - 0.7 0.1 - 0.2 51.9 - 51.9Vulva 1.4 - 2.6 0.3 - 0.5 70.5 - 70.5Other female genital system 0.5 - 0.9 0.1 - 0.2 60.9 - 60.9
Male Genital System: 70.0 152.6 - 8.5 21.7 - 99.2 99.2 -Prostate 66.1 144.9 - 8.3 21.2 - 99.5 99.5 -Testis 3.3 6.6 - 0.1 0.3 - 95.6 95.6 -Penis 0.4 0.9 - 0.1 0.2 - 67.4 67.4 -Other male genital system 0.1 0.3 - 0.0 0.0 - 89.0 89.0 -
Urinary System: 39.3 62.7 21.0 8.9 14.3 5.0 75.3 76.5 72.6Urinary bladder 22.5 39.8 9.5 4.6 8.1 2.2 78.3 79.7 74.0Kidney & renal pelvis 15.8 21.5 10.9 4.1 5.9 2.6 72.1 71.9 72.3Ureter 0.6 0.9 0.4 0.1 0.2 0.1 49.9 53.1 45.4Other urinary system 0.3 0.5 0.1 0.1 0.2 0.1 52.5 54.4 48.6
Eye & Orbit 0.9 1.1 0.8 0.1 0.1 0.1 81.3 81.2 81.5
Brain & Nervous System:e 7.1 8.4 6.0 4.6 5.6 3.8 32.3 31.4 33.4Brain 6.7 8.0 5.5 - - - 29.2 28.9 29.7Cranial nerves & other 0.4 0.4 0.4 - - - 79.2 76.5 81.8nervous system
Endocrine System: 13.7 7.4 20.0 0.8 0.8 0.8 96.1 91.8 97.5Thyroid 13.0 6.6 19.4 0.5 0.5 0.5 97.9 95.4 98.7Other endocrine & thymus 0.7 0.8 0.6 0.3 0.3 0.3 64.1 65.6 62.2
Lymphoma: 23.7 28.3 19.9 7.1 9.0 5.7 71.9 70.9 73.0Hodgkin lymphoma 3.0 3.4 2.6 0.4 0.5 0.3 85.6 85.1 86.2Non-Hodgkin lymphoma 20.7 25.0 17.3 6.7 8.5 5.3 69.6 68.5 70.8
Myeloma 5.5 7.1 4.2 3.1 4.0 2.5 43.1 44.7 41.2
Leukemia: 13.5 17.2 10.5 7.3 9.8 5.5 56.3 56.8 55.6Lymphocytic: 6.9 9.0 5.2 2.1 2.9 1.5 75.7 75.8 75.7Acute lymphocytic 1.8 2.1 1.6 0.5 0.6 0.4 66.0 66.1 65.8Chronic lymphocytic 4.6 6.3 3.3 1.5 2.1 1.0 79.3 78.5 80.5Other lymphocytic 0.4 0.7 0.2 0.1 0.2 0.1 81.5 85.7 69.6
Myeloid & Monocytic: 5.9 7.4 4.8 3.5 4.6 2.7 34.3 33.7 34.9Acute myeloid 3.8 4.6 3.2 2.9 3.8 2.3 23.4 22.0 25.1Chronic myeloid 1.6 2.1 1.2 0.3 0.4 0.2 59.6 59.0 60.5Acute monocytic 0.3 0.4 0.2 0.0 0.0 0.0 23.4 23.4 23.3Other myeloid & monocytic 0.2 0.2 0.1 0.2 0.3 0.2 31.3 30.5 32.2
Other leukemia: 0.6 0.8 0.6 1.7 2.3 1.3 28.1 27.4 28.8Other acute leukemia 0.2 0.3 0.2 0.7 0.9 0.5 15.5 15.9 14.9Aleukemic, subleukemic & NOS 0.4 0.5 0.4 1.0 1.4 0.8 37.1 36.2 37.6
Kaposi Sarcomaf 0.5 0.9 0.1 - - - 76.8 76.0 84.1Mesotheliomaf 1.1 2.1 0.5 - - - 8.3 6.5 14.0
Ill-defined & unspecified 9.3 10.8 8.1 13.1 16.6 10.6 17.6 22.3 13.1
Table 1.6 - continuedAge-Adjusted SEER Incidence and U.S. Death Rates and 5-Year Relative Survival (Percent)
By Primary Cancer Site, Sex and Time Period
Whites

SEER Cancer Statistics Review 1975-2010 National Cancer Institute
Note: Incidence and death rates are per 100,000 and are age-adjusted to the 2000 US StdPopulation (19 age groups - Census P25-1130).
a SEER 18 areas (San Francisco, Connecticut, Detroit, Hawaii, Iowa, New Mexico, Seattle,Utah, Atlanta, San Jose-Monterey, Los Angeles, Alaska Native Registry, Rural Georgia,California excluding SF/SJM/LA, Kentucky, Louisiana, New Jersey andGeorgia excluding ATL/RG).
b US Mortality Files, National Center for Health Statistics, Centers for Disease Control andPrevention.
c SEER 18 areas. Based on follow-up of patients into 2010.d Mesotheliomas of the Pleura are included in the separate group Mesothelioma for incidence
but are included in the Pleura grouping for mortality.- Statistic could not be calculated due to less than 16 cases in the time interval.
Incidencea US Mortalityb Survivalc (%)(2006-2010) (2006-2010) (2003-2009)
Site Total Males Females Total Males Females Total Males Females
All Sites 483.6 610.4 397.5 210.3 276.6 171.2 59.2 62.3 55.7
Oral Cavity & Pharynx: 9.6 14.9 5.4 3.0 5.2 1.4 43.2 38.6 53.0Lip 0.1 0.1 0.1 - - - 76.9 60.5 95.1Tongue 2.2 3.5 1.2 0.6 0.9 0.3 35.3 33.7 38.0Salivary gland 1.0 1.1 1.0 0.2 0.3 0.1 73.2 63.5 80.9Floor of mouth 0.5 0.9 0.3 0.0 0.1 0.0 38.0 34.9 46.0Gum & other oral cavity 1.4 1.7 1.2 0.3 0.5 0.2 54.4 45.5 64.2Nasopharynx 0.7 1.1 0.3 0.3 0.4 0.1 53.9 54.1 53.1Tonsil 1.7 3.0 0.6 0.3 0.5 0.1 46.9 46.8 47.2Oropharynx 0.7 1.2 0.3 0.4 0.6 0.2 20.4 20.1 21.0Hypopharynx 1.0 2.0 0.3 0.2 0.3 0.1 18.1 16.6 24.1Other oral cavity & pharynx 0.3 0.4 0.2 0.8 1.5 0.3 21.4 21.8 19.0
Digestive System: 106.7 132.0 88.5 57.7 76.0 45.0 39.1 36.1 42.3Esophagus 5.1 8.4 2.7 4.4 7.7 2.1 11.3 10.3 13.7Stomach 11.6 16.1 8.7 6.7 9.8 4.7 26.7 24.2 29.8Small intestine 3.3 3.9 2.8 0.6 0.7 0.5 63.4 58.2 67.6Colon & Rectum: 55.3 64.3 49.2 22.8 28.7 19.0 57.5 56.7 58.2Colon 41.6 47.2 37.8 - - - 56.3 56.3 56.4Rectum 13.7 17.1 11.4 - - - 61.0 58.0 64.1
Anus, anal canal & anorectum 1.7 1.9 1.6 0.2 0.3 0.2 55.2 48.3 61.9Liver & intrahepatic 9.1 15.1 4.5 7.4 11.8 4.1 11.3 9.3 16.0bile duct
Gallbladder 1.5 1.2 1.7 0.8 0.7 1.0 14.2 17.6 12.8Other biliary 1.7 2.0 1.5 0.4 0.4 0.4 13.2 12.1 14.2Pancreas 15.8 17.6 14.3 13.7 15.3 12.5 5.5 5.2 5.7Retroperitoneum 0.4 0.3 0.4 0.0 0.0 0.0 46.0 48.9 44.6Peritoneum, omentum & 0.3 0.1 0.5 0.2 0.1 0.2 30.6 51.6 26.4mesentery
Other digestive system 0.7 1.0 0.6 0.4 0.5 0.3 12.6 13.7 11.9
Respiratory System: 75.6 106.5 54.5 55.8 82.8 38.1 17.1 17.0 17.2Nose, nasal cavity & 0.6 0.9 0.4 0.2 0.2 0.1 48.2 45.6 53.0middle ear
Larynx 5.0 9.6 1.8 2.0 3.9 0.7 54.5 55.2 51.4Lung & bronchus 69.7 95.8 52.2 53.5 78.5 37.2 13.5 12.0 15.4Pleurad - - - 0.0 0.1 - - - -Trachea & other 0.2 0.3 0.1 0.1 0.1 0.0 50.9 48.6 54.4respiratory organs
Bones & joints 0.8 0.9 0.7 0.4 0.6 0.3 62.7 60.5 64.9
Soft tissue (including heart) 3.3 3.6 3.1 1.4 1.4 1.4 59.2 58.7 59.7
Skin (excl. basal & squamous): 2.1 2.2 2.0 0.9 1.3 0.6 84.9 83.3 85.5Melanoma of the skin 1.0 1.1 1.0 0.4 0.5 0.4 73.1 64.0 79.1Other non-epithelial skin 1.1 1.2 1.1 0.5 0.8 0.2 92.7 96.5 89.6
Breast 69.3 1.9 121.4 18.2 0.5 30.8 78.6 69.6 78.7
Breast (in situ) 16.6 0.3 29.5 - - - 100.0 98.7 100.0
Table 1.7Age-Adjusted SEER Incidence and U.S. Death Rates and 5-Year Relative Survival (Percent)
By Primary Cancer Site, Sex and Time Period
Blacks

SEER Cancer Statistics Review 1975-2010 National Cancer Institute
Note: Incidence and death rates are per 100,000 and are age-adjusted to the 2000 US StdPopulation (19 age groups - Census P25-1130).
a SEER 18 areas (San Francisco, Connecticut, Detroit, Hawaii, Iowa, New Mexico, Seattle,Utah, Atlanta, San Jose-Monterey, Los Angeles, Alaska Native Registry, Rural Georgia,California excluding SF/SJM/LA, Kentucky, Louisiana, New Jersey andGeorgia excluding ATL/RG).
b US Mortality Files, National Center for Health Statistics, Centers for Disease Control andPrevention.
c SEER 18 areas. Based on follow-up of patients into 2010.d Ovary excludes borderline cases or histologies 8442, 8451, 8462, 8472, and 8473.e Due to coding changes, Brain & Nervous System mortality are no longer shown separately.f Rate not shown for mortality. Category did not exist in mortality coding until 1999.- Statistic could not be calculated due to less than 16 cases in the time interval.
Incidencea US Mortalityb Survivalc (%)(2006-2010) (2006-2010) (2003-2009)
Site Total Males Females Total Males Females Total Males Females
Female Genital System: 25.5 - 44.9 11.3 - 19.1 54.7 - 54.7Cervix uteri 5.3 - 9.6 2.4 - 4.2 59.2 - 59.2Corpus uteri 11.9 - 21.0 1.8 - 3.0 62.5 - 62.5Uterus, NOS 0.7 - 1.2 2.6 - 4.4 25.0 - 25.0Ovaryd 5.6 - 9.7 4.0 - 6.7 36.1 - 36.1Vagina 0.5 - 0.9 0.2 - 0.3 45.6 - 45.6Vulva 1.0 - 1.7 0.2 - 0.3 69.4 - 69.4Other female genital system 0.4 - 0.8 0.2 - 0.3 49.5 - 49.5
Male Genital System: 97.4 230.9 - 18.1 51.4 - 96.5 96.5 -Prostate 96.3 228.5 - 18.0 50.9 - 96.7 96.7 -Testis 0.6 1.4 - 0.1 0.1 - 89.5 89.5 -Penis 0.3 0.9 - 0.1 0.3 - 61.5 61.5 -Other male genital system 0.1 0.2 - 0.0 0.0 - 78.5 78.5 -
Urinary System: 30.6 46.1 19.9 7.7 11.4 5.4 67.3 69.3 64.0Urinary bladder 12.5 21.0 7.1 3.7 5.5 2.6 64.9 69.5 56.1Kidney & renal pelvis 17.4 24.1 12.3 3.9 5.7 2.6 69.6 69.6 69.6Ureter 0.3 0.4 0.2 0.1 0.1 0.1 50.0 52.6 47.9Other urinary system 0.4 0.6 0.3 0.1 0.1 0.2 39.8 50.1 32.9
Eye & Orbit 0.2 0.3 0.2 0.0 0.0 0.0 79.1 75.5 83.4
Brain & Nervous System:e 4.1 4.7 3.7 2.5 3.0 2.1 39.6 35.5 43.7Brain 3.7 4.3 3.3 - - - 36.0 33.1 38.9Cranial nerves & other 0.4 0.3 0.4 - - - 70.1 60.8 75.0nervous system
Endocrine System: 8.1 4.2 11.4 0.9 0.8 0.9 92.5 83.9 94.9Thyroid 7.1 3.2 10.5 0.5 0.4 0.6 96.6 91.9 97.4Other endocrine & thymus 0.9 1.0 0.9 0.4 0.4 0.3 63.4 62.8 63.8
Lymphoma: 16.9 20.5 14.0 4.9 6.3 3.9 65.5 61.6 70.0Hodgkin lymphoma 2.7 3.2 2.3 0.4 0.4 0.3 80.5 77.5 83.7Non-Hodgkin lymphoma 14.2 17.4 11.8 4.6 5.9 3.6 61.9 57.9 66.6
Myeloma 11.9 14.4 10.2 6.4 7.9 5.4 42.8 41.9 43.6
Leukemia: 9.8 12.6 7.8 6.1 8.2 4.8 49.5 50.4 48.5Lymphocytic: 4.1 5.8 2.9 1.7 2.6 1.2 65.8 64.9 67.0Acute lymphocytic 0.9 1.2 0.7 0.3 0.4 0.2 63.2 62.8 63.7Chronic lymphocytic 2.9 4.2 2.0 1.3 2.0 0.9 67.5 66.1 69.5Other lymphocytic 0.2 0.4 0.1 0.1 0.2 0.1 58.8 63.2 46.9
Myeloid & Monocytic: 4.9 5.9 4.3 2.7 3.4 2.2 38.4 38.5 38.2Acute myeloid 3.1 3.6 2.8 2.2 2.7 1.9 25.5 25.1 25.7Chronic myeloid 1.5 1.9 1.3 0.3 0.5 0.3 62.4 60.2 64.8Acute monocytic 0.1 0.2 0.1 0.0 - - 25.2 23.8 26.3Other myeloid & monocytic 0.1 0.2 0.1 0.1 0.2 0.1 40.6 41.0 39.3
Other leukemia: 0.8 0.9 0.6 1.7 2.2 1.4 27.3 27.3 26.8Other acute leukemia 0.2 0.3 0.2 0.5 0.7 0.4 22.6 22.2 22.2Aleukemic, subleukemic & NOS 0.5 0.6 0.5 1.2 1.5 1.0 29.8 30.3 28.5
Kaposi Sarcomaf 1.0 2.0 0.2 - - - 52.5 52.2 54.0Mesotheliomaf 0.6 1.1 0.3 - - - 8.3 6.5 10.2
Ill-defined & unspecified 10.2 11.4 9.2 15.1 19.8 12.0 12.5 12.9 12.0
Table 1.7 - continuedAge-Adjusted SEER Incidence and U.S. Death Rates and 5-Year Relative Survival (Percent)
By Primary Cancer Site, Sex and Time Period
Blacks

SEER Cancer Statistics Review 1975-2010 National Cancer Institute
The APC is the Annual Percent Change over the time interval.Trends are based on rates age-adjusted to the 2000 US Std Population(19 age groups - Census P25-1130).
a SEER 18 areas (San Francisco, Connecticut, Detroit, Hawaii, Iowa, New Mexico, Seattle,Utah, Atlanta, San Jose-Monterey, Los Angeles, Alaska Native Registry, Rural Georgia,California excluding SF/SJM/LA, Kentucky, Louisiana, New Jersey andGeorgia excluding ATL/RG).
b US Mortality Files, National Center for Health Statistics, Centers for Disease Control andPrevention.
* The APC is significantly different from zero (p<.05).- Statistic could not be calculated. Trend based on less than 10 cases for at least one
year within the time interval.
Incidencea US Mortalityb
Total Males Females Total Males FemalesSite APC APC APC APC APC APC
All Sites -0.6* -1.1* -0.3 -1.5* -1.8* -1.4*
Oral Cavity & Pharynx: 0.2 0.2 -0.2 -1.3* -1.3* -1.5*Lip -3.9* -4.5* -2.7* -4.1* -5.2* -2.2Tongue 1.8* 2.2* 0.9 -0.7* -0.7* -0.9*Salivary gland 0.7 0.5 0.9 -0.3 -0.1 -1.0Floor of mouth -3.7* -4.5* -2.2 -7.1* -7.5* -5.9*Gum & other oral cavity -1.1* -1.4* -0.8 -2.2* -2.6* -1.7*Nasopharynx -0.4 -0.3 -1.0 -0.7* -0.6 -1.4Tonsil 3.1* 3.5* 1.2 0.6 1.0 -1.4Oropharynx 2.0 2.4* 0.3 0.9* 0.7 0.7Hypopharynx -2.6* -2.6* -3.2* -3.5* -3.5* -3.9*Other oral cavity & pharynx -3.7* -3.9* -4.0* -2.8* -2.8* -3.2*
Digestive System: -1.1* -1.2* -1.1* -1.1* -1.1* -1.4*Esophagus -0.9* -0.9* -1.9* -0.6* -0.5* -1.5*Stomach -1.1* -1.5* -0.6 -2.9* -3.2* -2.7*Small intestine 1.9* 1.8* 2.0* -0.3 -0.4 -0.4Colon & Rectum: -2.6* -2.9* -2.4* -2.9* -3.0* -3.0*Colon -2.9* -3.2* -2.7* - - -Rectum -2.0* -2.3* -1.7* - - -
Anus, anal canal & anorectum 2.4* 2.1* 2.7* 3.4* 4.0* 3.1*Liver & intrahepatic 3.6* 3.8* 2.6* 2.4* 2.5* 1.6*bile duct
Gallbladder -0.5 -0.8 -0.3 -1.1* -0.5 -1.4*Other biliary 0.9* 1.0 0.5 -2.9* -3.2* -2.7*Pancreas 0.9* 0.8* 1.0* 0.5* 0.4* 0.4*Retroperitoneum -1.3 -0.7 -2.2 -2.8* -2.1 -3.8*Peritoneum, omentum & -0.5 -0.6 -0.4 0.7 0.6 0.8mesentery
Other digestive system 2.0* 3.1* 1.0 -1.0 -0.3 -1.9
Respiratory System: -1.5* -2.2* -0.7* -1.8* -2.5* -1.0*Nose, nasal cavity & 0.1 0.4 -0.5 -0.6 -0.7 -0.5middle ear
Larynx -2.1* -2.3* -1.8* -2.4* -2.7* -2.1*Lung & bronchus -1.5* -2.2* -0.7* -1.7* -2.5* -0.9*Pleura -1.6 -1.3 - -7.2* -7.1* -8.0*Trachea & other 0.0 -0.5 0.6 -4.2* -4.6* -3.8*respiratory organs
Bones & joints -0.1 0.0 -0.3 -0.2 -0.2 -0.3
Soft tissue (including heart) 1.1* 0.9* 1.3* 0.5* 1.0* 0.0
Skin (excl. basal & squamous): 1.5* 1.8* 1.1* 0.5* 0.8* -0.3Melanoma of the skin 1.5* 1.8* 1.2* 0.5* 0.9* -0.2Other non-epithelial skin 1.4* 2.0* 0.5 0.5 0.7 -0.6
Breast -0.8* 1.3 -0.6 -2.2* -1.2 -2.0*
Breast (in situ) 0.9* 3.0 1.1* - - -
Table 1.8SEER Incidence and U.S. Mortality Trends by Primary Cancer Site and Sex
All Races, 2001-2010

SEER Cancer Statistics Review 1975-2010 National Cancer Institute
The APC is the Annual Percent Change over the time interval.Trends are based on rates age-adjusted to the 2000 US Std Population(19 age groups - Census P25-1130).
a SEER 18 areas (San Francisco, Connecticut, Detroit, Hawaii, Iowa, New Mexico, Seattle,Utah, Atlanta, San Jose-Monterey, Los Angeles, Alaska Native Registry, Rural Georgia,California excluding SF/SJM/LA, Kentucky, Louisiana, New Jersey andGeorgia excluding ATL/RG).
b US Mortality Files, National Center for Health Statistics, Centers for Disease Control andPrevention.
c Ovary excludes borderline cases or histologies 8442, 8451, 8462, 8472, and 8473.d Due to coding changes, Brain & Nervous System mortality are no longer shown separately.e Trend not shown for mortality. Category did not exist in mortality coding until 1999.* The APC is significantly different from zero (p<.05).- Statistic could not be calculated. Trend based on less than 10 cases for at least one
year within the time interval.
Incidencea US Mortalityb
Total Males Females Total Males FemalesSite APC APC APC APC APC APC
Female Genital System: -0.4 - -0.2 -1.3* - -1.0*Cervix uteri -1.8* - -1.7* -1.7* - -1.5*Corpus uteri 0.6 - 0.9* -0.9* - -0.5Uterus, NOS 0.9 - 1.2 1.0* - 1.3*Ovaryc -1.8* - -1.7* -2.0* - -1.8*Vagina -0.3 - 0.0 -1.1* - -0.8Vulva 0.8* - 1.0* 0.6* - 1.0*Other female genital system 4.8* - 4.8* 0.1 - 0.4
Male Genital System: -1.8* -2.2* - -2.6* -3.3* -Prostate -1.9* -2.3* - -2.7* -3.4* -Testis 0.6* 0.6* - -0.3 -0.3 -Penis 0.1 -0.3 - -0.1 -0.3 -Other male genital system 0.6 0.5 - 2.9 2.4 -
Urinary System: 0.6* 0.3 0.7* -0.4* -0.3* -0.9*Urinary bladder -0.6* -0.7* -0.9* 0.1 0.1 -0.6*Kidney & renal pelvis 2.4* 2.2* 2.3* -1.0* -1.0* -1.3*Ureter -0.3 -0.3 -0.3 0.5 0.2 0.2Other urinary system 1.8* 1.3 2.1 1.8 3.0 -0.1
Eye & Orbit -0.6 -1.2* 0.1 0.7 0.1 1.3
Brain & Nervous System:d -0.3 -0.3 -0.4 -0.5* -0.5* -0.5*Brain -0.2 -0.2 -0.3 - - -Cranial nerves & other -1.8* -1.4 -2.3* - - -nervous system
Endocrine System: 5.9* 5.0* 6.3* 0.4 0.4 0.5Thyroid 6.3* 5.6* 6.5* 1.2* 1.5* 1.1*Other endocrine & thymus 1.3* 0.7 1.9* -0.9 -1.2 -0.6
Lymphoma: 0.1 0.2 -0.1 -2.7* -2.6* -3.1*Hodgkin lymphoma 0.0 0.1 -0.1 -2.5* -2.3* -2.8*Non-Hodgkin lymphoma 0.1 0.2 -0.1 -2.8* -2.6* -3.1*
Myeloma 0.4 0.6* 0.1 -1.8* -1.4* -2.3*
Leukemia: -0.5* -0.8* -0.4 -1.0* -1.0* -1.3*Lymphocytic: -0.6* -0.8* -0.6 -1.5* -1.5* -1.7*Acute lymphocytic 0.7* 0.8 0.6 -1.3* -1.4* -1.1Chronic lymphocytic -1.1* -1.3* -1.0 -1.6* -1.5* -2.1*Other lymphocytic -0.9 -0.6 -2.1 -1.0 -1.3 -1.2
Myeloid & Monocytic: 0.0 -0.3 0.2 -0.5* -0.4* -0.9*Acute myeloid 0.1 -0.4 0.7 0.3* 0.4* 0.0Chronic myeloid 0.2 0.3 -0.1 -6.7* -6.1* -7.4*Acute monocytic -1.5 -1.0 -1.9 -3.5* -4.2* -3.3Other myeloid & monocytic -1.7* -1.1 -2.6 0.3 -0.2 0.4
Other leukemia: -4.1* -4.9* -3.5* -1.4* -1.6* -1.5*Other acute leukemia -5.8* -6.0* -5.8* -3.7* -4.2* -3.4*Aleukemic, subleukemic & NOS -3.0* -4.0* -1.8 0.2 0.3 -0.1
Kaposi Sarcomae -3.2* -3.3* -3.3* - - -Mesotheliomae -1.0 -1.2 -0.6 - - -
Ill-defined & unspecified -2.9* -2.8* -3.0* -2.1* -2.0* -2.4*
Table 1.8 - continuedSEER Incidence and U.S. Mortality Trends by Primary Cancer Site and Sex
All Races, 2001-2010

SEER Cancer Statistics Review 1975-2010 National Cancer Institute
The APC is the Annual Percent Change over the time interval.Trends are based on rates age-adjusted to the 2000 US Std Population(19 age groups - Census P25-1130).
a SEER 18 areas (San Francisco, Connecticut, Detroit, Hawaii, Iowa, New Mexico, Seattle,Utah, Atlanta, San Jose-Monterey, Los Angeles, Alaska Native Registry, Rural Georgia,California excluding SF/SJM/LA, Kentucky, Louisiana, New Jersey andGeorgia excluding ATL/RG).
b US Mortality Files, National Center for Health Statistics, Centers for Disease Control andPrevention.
* The APC is significantly different from zero (p<.05).- Statistic could not be calculated. Trend based on less than 10 cases for at least one
year within the time interval.
Incidencea US Mortalityb
Total Males Females Total Males FemalesSite APC APC APC APC APC APC
All Sites -0.6* -1.1* -0.3 -1.4* -1.7* -1.3*
Oral Cavity & Pharynx: 0.5* 0.6* 0.1 -0.8* -0.8* -1.3*Lip -4.1* -4.7* -2.5* -3.8* -5.1* -1.3Tongue 2.3* 2.6* 1.3* -0.2 -0.1 -0.6Salivary gland 1.1 0.6 1.4 -0.3 -0.2 -0.9Floor of mouth -3.2* -4.1* -1.4 -6.5* -6.9* -5.6*Gum & other oral cavity -1.0* -1.2* -0.7 -1.7* -2.1* -1.4Nasopharynx -0.3 -0.7 0.0 -0.6 -0.5 -1.3Tonsil 3.8* 4.2* 1.6* 1.3* 1.9* -1.3Oropharynx 2.0 2.4 0.2 1.8* 1.8* 1.2Hypopharynx -2.5* -2.4* -3.6* -3.5* -3.2* -5.1*Other oral cavity & pharynx -3.3* -2.9 -5.3* -2.2* -2.2* -2.7*
Digestive System: -1.1* -1.2* -1.2* -1.1* -1.1* -1.3*Esophagus -0.3 -0.2 -1.7* 0.0 0.1 -0.9*Stomach -0.9* -1.3* -0.7 -3.0* -3.4* -2.7*Small intestine 2.3* 2.3* 2.3* -0.3 -0.2 -0.6Colon & Rectum: -2.8* -3.1* -2.5* -3.0* -3.1* -3.0*Colon -3.0* -3.3* -2.8* - - -Rectum -2.3* -2.7* -1.9* - - -
Anus, anal canal & anorectum 2.6* 2.0* 3.1* 3.3* 3.5* 3.3*Liver & intrahepatic 4.2* 4.5* 3.0* 2.5* 2.6* 1.9*bile duct
Gallbladder -0.7 -1.2 -0.4 -1.5* -1.2* -1.6*Other biliary 0.9* 1.0 0.5 -3.0* -3.3* -2.8*Pancreas 1.0* 0.8* 1.1* 0.6* 0.5* 0.6*Retroperitoneum -1.5 -1.3 -2.1 -2.5* -1.9 -3.3*Peritoneum, omentum & -0.2 0.8 -0.2 0.9 0.9 1.0mesentery
Other digestive system 1.7* 2.2* 1.3 -1.0 0.0 -2.0
Respiratory System: -1.4* -2.1* -0.6* -1.6* -2.4* -0.9*Nose, nasal cavity & 0.3 0.7 -0.5 -0.7 -0.6 -0.9middle ear
Larynx -1.8* -2.0* -1.8* -2.0* -2.4* -1.8*Lung & bronchus -1.4* -2.2* -0.6* -1.6* -2.4* -0.8*Pleura -1.5 -0.9 - -7.1* -7.1* -7.9*Trachea & other -0.4 -1.1 0.7 -4.2* -4.6* -4.0*respiratory organs
Bones & joints -0.1 0.2 -0.7 -0.2 -0.2 -0.1
Soft tissue (including heart) 1.2* 1.1* 1.3* 0.6* 1.2* -0.1
Skin (excl. basal & squamous): 1.5* 1.8* 1.2* 0.7* 1.0* -0.1Melanoma of the skin 1.6* 1.8* 1.3* 0.7* 1.0* 0.0Other non-epithelial skin 1.4* 2.0* 0.4 0.8 1.0* -0.4
Breast -1.0* 1.2 -0.8* -2.2* -1.2* -2.0*
Breast (in situ) 0.7 3.0 0.9 - - -
Table 1.9SEER Incidence and U.S. Mortality Trends by Primary Cancer Site and Sex
Whites, 2001-2010

SEER Cancer Statistics Review 1975-2010 National Cancer Institute
The APC is the Annual Percent Change over the time interval.Trends are based on rates age-adjusted to the 2000 US Std Population(19 age groups - Census P25-1130).
a SEER 18 areas (San Francisco, Connecticut, Detroit, Hawaii, Iowa, New Mexico, Seattle,Utah, Atlanta, San Jose-Monterey, Los Angeles, Alaska Native Registry, Rural Georgia,California excluding SF/SJM/LA, Kentucky, Louisiana, New Jersey andGeorgia excluding ATL/RG).
b US Mortality Files, National Center for Health Statistics, Centers for Disease Control andPrevention.
c Ovary excludes borderline cases or histologies 8442, 8451, 8462, 8472, and 8473.d Due to coding changes, Brain & Nervous System mortality are no longer shown separately.e Trend not shown for mortality. Category did not exist in mortality coding until 1999.* The APC is significantly different from zero (p<.05).- Statistic could not be calculated. Trend based on less than 10 cases for at least one
year within the time interval.
Incidencea US Mortalityb
Total Males Females Total Males FemalesSite APC APC APC APC APC APC
Female Genital System: -0.4 - -0.2 -1.3* - -1.0*Cervix uteri -1.5* - -1.4* -1.5* - -1.3*Corpus uteri 0.4 - 0.7* -0.9* - -0.5Uterus, NOS 0.1 - 0.4 0.8* - 1.3*Ovaryc -1.9* - -1.7* -2.0* - -1.8*Vagina 0.3 - 0.6 -0.7 - -0.4Vulva 1.1* - 1.3* 0.8* - 1.3*Other female genital system 5.1* - 5.1* 0.4 - 0.7
Male Genital System: -1.9* -2.4* - -2.5* -3.2* -Prostate -2.0* -2.5* - -2.5* -3.3* -Testis 0.7* 0.7* - 0.3 0.2 -Penis 0.3 -0.2 - -0.3 -0.5 -Other male genital system 0.5 0.3 - 3.6 3.1 -
Urinary System: 0.6* 0.3 0.7 -0.3* -0.2* -0.8*Urinary bladder -0.6* -0.7* -0.9* 0.3* 0.2 -0.4Kidney & renal pelvis 2.3* 2.2* 2.3* -1.0* -1.0* -1.2*Ureter -0.2 -0.2 -0.5 0.4 0.1 0.2Other urinary system 2.2* 1.5 2.8 2.2 3.2 0.2
Eye & Orbit -0.4 -1.1 0.3 1.0 0.1 1.8
Brain & Nervous System:d -0.2 -0.1 -0.4 -0.4 -0.4 -0.4Brain -0.1 -0.1 -0.2 - - -Cranial nerves & other -1.8* -1.1 -2.4 - - -nervous system
Endocrine System: 6.0* 5.0* 6.4* 0.1 0.2 0.2Thyroid 6.4* 5.8* 6.6* 1.0* 1.4* 0.8Other endocrine & thymus 0.6 -0.1 1.2 -1.2* -1.7* -1.0
Lymphoma: 0.1 0.2 -0.1 -2.7* -2.6* -3.0*Hodgkin lymphoma -0.1 0.0 -0.2 -2.4* -2.1* -2.7*Non-Hodgkin lymphoma 0.1 0.2 0.0 -2.7* -2.6* -3.1*
Myeloma 0.4 0.7* -0.1 -1.8* -1.5* -2.3*
Leukemia: -0.5* -0.8* -0.4 -0.9* -0.9* -1.2*Lymphocytic: -0.6 -0.9* -0.3 -1.3* -1.4* -1.4*Acute lymphocytic 1.1* 0.9 1.5* -0.9* -1.1* -0.6Chronic lymphocytic -1.2* -1.5* -1.1 -1.5* -1.5* -1.8*Other lymphocytic -1.1 -0.9 -2.0 -0.8 -1.2 -1.0
Myeloid & Monocytic: 0.0 -0.2 0.0 -0.4* -0.3 -0.9*Acute myeloid 0.1 -0.3 0.3 0.4* 0.5* -0.1Chronic myeloid 0.2 0.3 -0.1 -6.7* -6.0* -7.5*Acute monocytic -1.2 -0.2 -2.3 -3.3* -4.0* -2.9Other myeloid & monocytic -1.4 -0.7 -2.5 0.3 -0.2 0.5
Other leukemia: -4.0* -4.9* -3.1* -1.4* -1.5* -1.4*Other acute leukemia -5.7* -6.1* -5.5* -3.7* -4.2* -3.3*Aleukemic, subleukemic & NOS -2.7* -4.0* -1.4 0.3 0.4 0.0
Kaposi Sarcomae -3.5* -3.4* -4.5* - - -Mesotheliomae -0.8 -1.0 -0.5 - - -
Ill-defined & unspecified -2.7* -2.5* -3.0* -1.9* -1.9* -2.2*
Table 1.9 - continuedSEER Incidence and U.S. Mortality Trends by Primary Cancer Site and Sex
Whites, 2001-2010

SEER Cancer Statistics Review 1975-2010 National Cancer Institute
The APC is the Annual Percent Change over the time interval.Trends are based on rates age-adjusted to the 2000 US Std Population(19 age groups - Census P25-1130).
a SEER 18 areas (San Francisco, Connecticut, Detroit, Hawaii, Iowa, New Mexico, Seattle,Utah, Atlanta, San Jose-Monterey, Los Angeles, Alaska Native Registry, Rural Georgia,California excluding SF/SJM/LA, Kentucky, Louisiana, New Jersey andGeorgia excluding ATL/RG).
b US Mortality Files, National Center for Health Statistics, Centers for Disease Control andPrevention.
* The APC is significantly different from zero (p<.05).- Statistic could not be calculated. Trend based on less than 10 cases for at least one
year within the time interval.
Incidencea US Mortalityb
Total Males Females Total Males FemalesSite APC APC APC APC APC APC
All Sites -1.0* -1.9* -0.1 -2.1* -2.6* -1.7*
Oral Cavity & Pharynx: -2.5* -3.1* -1.4 -3.9* -4.1* -3.2*Lip - - - - - -Tongue -2.1* -2.5* -1.1 -3.9* -4.3* -2.4Salivary gland -1.0 -1.7 -0.5 0.2 1.0 -1.3Floor of mouth -7.4* -8.2* -5.9* -10.5* - -Gum & other oral cavity -3.8* -5.6* -1.5 -5.7* -6.0* -5.0*Nasopharynx -1.6 -1.0 -2.2 -2.1 -2.1 -2.9Tonsil -0.2 -0.2 -0.2 -2.2 -2.8* -0.4Oropharynx 0.0 0.3 - -2.5* -2.5* -2.3Hypopharynx -3.9* -4.4* -3.1 -3.1 -4.4 -Other oral cavity & pharynx -7.4* -11.8* - -5.2* -5.0* -5.1*
Digestive System: -1.2* -1.2* -1.3* -1.7* -1.5* -2.1*Esophagus -4.5* -5.0* -3.1* -4.8* -4.6* -5.2*Stomach -1.8* -2.1* -1.2 -3.2* -3.1* -3.5*Small intestine 1.1 1.0 1.2 -0.1 -0.8 0.1Colon & Rectum: -2.3* -2.4* -2.4* -2.8* -2.4* -3.3*Colon -2.7* -3.0* -2.6* - - -Rectum -1.0* -0.8 -1.4* - - -
Anus, anal canal & anorectum 1.9* 2.7 0.9 4.8* 6.3* 3.1Liver & intrahepatic 3.7* 3.7* 3.2* 2.4* 3.0* 0.8bile duct
Gallbladder 2.2* 4.8 1.8 0.4 4.3* -0.8Other biliary 2.4 0.7 3.5* -1.8 -2.4 -1.9Pancreas 0.5 1.3* 0.0 -0.1 0.0 -0.1Retroperitoneum 0.3 - -1.0 -5.5 - -Peritoneum, omentum & -0.8 - 0.2 -0.7 - -1.3mesentery
Other digestive system 3.5 8.4* -0.5 -1.9 -3.0 -1.3
Respiratory System: -1.7* -2.9* -0.2 -2.5* -3.3* -1.3*Nose, nasal cavity & -1.8 -2.5 -0.8 1.3 -0.7 4.2middle ear
Larynx -3.1* -3.7* -1.1 -3.8* -4.0* -3.0*Lung & bronchus -1.7* -2.8* -0.2 -2.4* -3.3* -1.2*Pleura - - - - - -Trachea & other - - - -4.6 - -respiratory organs
Bones & joints 0.8 0.2 1.7 -0.7 0.0 -1.8
Soft tissue (including heart) 0.2 -0.4 0.8 0.1 -0.8 0.7
Skin (excl. basal & squamous): 0.1 -0.8 0.6 -1.5* -1.4 -1.5Melanoma of the skin -0.2 -1.5 0.6 0.1 1.9 -1.2Other non-epithelial skin 0.4 -0.1 0.7 -3.0* -3.3* -1.9
Breast 0.3 1.5 0.4 -1.7* -1.5 -1.6*
Breast (in situ) 2.1* - 2.3* - - -
Table 1.10SEER Incidence and U.S. Mortality Trends by Primary Cancer Site and Sex
Blacks, 2001-2010

SEER Cancer Statistics Review 1975-2010 National Cancer Institute
The APC is the Annual Percent Change over the time interval.Trends are based on rates age-adjusted to the 2000 US Std Population(19 age groups - Census P25-1130).
a SEER 18 areas (San Francisco, Connecticut, Detroit, Hawaii, Iowa, New Mexico, Seattle,Utah, Atlanta, San Jose-Monterey, Los Angeles, Alaska Native Registry, Rural Georgia,California excluding SF/SJM/LA, Kentucky, Louisiana, New Jersey andGeorgia excluding ATL/RG).
b US Mortality Files, National Center for Health Statistics, Centers for Disease Control andPrevention.
c Ovary excludes borderline cases or histologies 8442, 8451, 8462, 8472, and 8473.d Due to coding changes, Brain & Nervous System mortality are no longer shown separately.e Trend not shown for mortality. Category did not exist in mortality coding until 1999.* The APC is significantly different from zero (p<.05).- Statistic could not be calculated. Trend based on less than 10 cases for at least one
year within the time interval.
Incidencea US Mortalityb
Total Males Females Total Males FemalesSite APC APC APC APC APC APC
Female Genital System: -0.2 - 0.0 -1.2* - -1.0*Cervix uteri -3.2* - -3.0* -2.6* - -2.4*Corpus uteri 1.7* - 1.9* -1.1 - -0.7Uterus, NOS 2.0 - 2.2 1.5* - 1.7*Ovaryc -1.1 - -0.9 -1.9* - -1.7*Vagina -2.2 - -2.0 -3.4* - -3.1*Vulva -0.9 - -0.8 -1.6 - -1.5Other female genital system 2.6 - 2.3 -0.4 - -0.5
Male Genital System: -2.1* -2.6* - -3.4* -3.7* -Prostate -2.1* -2.6* - -3.4* -3.8* -Testis -0.7 -0.7 - -4.7 -5.2 -Penis -2.2 -2.3 - 1.8 1.8 -Other male genital system - - - - - -
Urinary System: 1.5* 1.5* 1.4* -1.0* -0.7 -1.5*Urinary bladder -0.2 0.4 -1.2 -0.8 0.0 -1.9*Kidney & renal pelvis 2.9* 2.5* 3.2* -1.1* -1.3* -1.1*Ureter - - - - - -Other urinary system 0.6 - - -3.1 - -3.4
Eye & Orbit -0.4 - - - - -
Brain & Nervous System:d -0.3 -0.2 -0.2 -0.5 -0.8 -0.3Brain 0.2 0.0 0.4 - - -Cranial nerves & other -4.1 -3.2 -4.3 - - -nervous system
Endocrine System: 5.6* 4.8* 6.0* 1.5 2.5 1.0Thyroid 5.7* 4.9* 6.1* 1.3 1.7 1.2Other endocrine & thymus 4.6* 4.4* 4.7 1.8 3.3 0.7
Lymphoma: 0.0 0.0 0.0 -2.4* -2.1* -2.9*Hodgkin lymphoma 1.3* 1.0 1.3 -2.3* -3.1 -1.8Non-Hodgkin lymphoma -0.2 -0.2 -0.3 -2.5* -2.0* -3.0*
Myeloma 0.3 -0.4 0.7 -1.7* -1.3* -2.2*
Leukemia: -1.7* -1.9* -1.6* -1.6* -1.3* -1.9*Lymphocytic: -2.7* -2.4 -3.1* -2.2* -1.7 -3.3*Acute lymphocytic 1.2 3.4 -1.5 -2.8* -2.7 -3.4*Chronic lymphocytic -3.8* -3.8* -3.6* -2.1* -1.4 -3.4*Other lymphocytic -2.3 - - -2.0 -3.4 -
Myeloid & Monocytic: -0.3 -0.9 0.4 -1.6* -1.4 -1.6*Acute myeloid 0.3 -0.3 1.0 -0.3 -0.3 -0.3Chronic myeloid -0.9 -1.7 0.1 -7.5* -7.0* -7.6*Acute monocytic - - - - - -Other myeloid & monocytic - - - -1.1 -0.3 -3.3
Other leukemia: -5.1* -4.3 -5.7 -1.0 -0.8 -1.0Other acute leukemia -9.3* - - -3.2* -2.8* -3.6Aleukemic, subleukemic & NOS -2.5 -1.8 -1.7 0.1 0.3 0.2
Kaposi Sarcomae -2.5* -3.0* - - - -Mesotheliomae -0.3 -0.8 - - - -
Ill-defined & unspecified -4.0* -4.5* -3.5* -3.3* -3.3* -3.3*
Table 1.10 - continuedSEER Incidence and U.S. Mortality Trends by Primary Cancer Site and Sex
Blacks, 2001-2010

SEER Cancer Statistics Review 1975-2010 National Cancer Institute
Source: SEER 18 areas (San Francisco, Connecticut, Detroit, Hawaii, Iowa, New Mexico, Seattle, Utah,Atlanta, San Jose-Monterey, Los Angeles, Alaska Native Registry, Rural Georgia,California excluding SF/SJM/LA, Kentucky, Louisiana, New Jersey and Georgia excluding ATL/RG).Percents may not sum to 100 due to rounding.
AllSite <20 20-34 35-44 45-54 55-64 65-74 75-84 85+ Ages Cases
All Sites 1.0 2.6 5.3 14.2 23.8 25.1 20.1 7.8 100.0% 1,968,702
Oral Cavity & Pharynx: 0.6 2.1 5.9 20.2 29.1 21.4 14.7 6.0 100.0% 47,286Lip 0.2 1.2 5.4 14.9 18.9 23.3 23.4 12.8 100.0% 2,872Tongue 0.1 1.9 5.5 20.2 32.4 22.5 12.8 4.6 100.0% 13,820Salivary gland 2.1 6.2 7.5 14.5 20.0 19.0 20.3 10.4 100.0% 5,407Floor of mouth 0.1 0.2 3.8 20.5 31.7 25.1 14.5 4.1 100.0% 2,512Gum & other oral cavity 0.7 2.1 4.7 13.5 22.8 23.4 21.6 11.2 100.0% 6,417Nasopharynx 3.5 5.8 13.2 25.3 25.6 15.2 9.0 2.3 100.0% 2,820Tonsil 0.0 0.5 6.6 31.4 36.9 16.5 6.5 1.5 100.0% 7,993Oropharynx 0.0 0.3 4.3 20.4 33.7 24.1 13.0 4.2 100.0% 1,723Hypopharynx 0.0 0.1 1.6 16.7 31.9 27.7 17.7 4.1 100.0% 2,812Other oral cavity & pharynx 0.3 0.8 3.1 14.8 29.6 26.9 16.6 7.9 100.0% 910
Digestive System: 0.2 1.0 3.6 13.4 22.2 24.4 23.8 11.3 100.0% 361,202Esophagus 0.0 0.3 2.1 11.9 26.9 27.5 23.0 8.3 100.0% 18,984Stomach 0.1 1.6 4.6 12.2 19.7 24.7 25.0 12.2 100.0% 31,599Small intestine 0.1 1.3 5.3 15.6 24.9 25.1 19.8 8.0 100.0% 8,822Colon & Rectum: 0.1 1.2 4.0 13.8 20.8 24.0 24.1 12.0 100.0% 190,166
Colon 0.1 1.0 3.4 11.6 19.3 24.5 26.4 13.8 100.0% 135,206Rectum 0.0 1.6 5.7 19.4 24.4 22.8 18.4 7.7 100.0% 54,960
Colon & Rectum (Male) 0.1 1.2 4.0 14.7 23.2 25.9 22.2 8.7 100.0% 97,800Colon & Rectum (Female) 0.1 1.1 4.1 13.0 18.2 22.0 26.0 15.6 100.0% 92,366Anus, anal canal & anorectum 0.0 1.0 7.8 25.1 26.7 18.7 14.2 6.4 100.0% 7,504Liver & intrahepatic 1.0 0.8 2.6 17.8 32.1 22.4 17.5 5.9 100.0% 33,637
bile ductGallbladder 0.0 0.4 2.7 8.5 19.1 25.3 28.7 15.4 100.0% 4,830Other biliary 0.1 0.6 2.4 8.7 19.0 25.7 28.7 14.9 100.0% 7,656Pancreas 0.1 0.4 2.1 9.7 20.8 26.0 27.4 13.5 100.0% 51,395Retroperitoneum 9.0 4.8 8.2 15.0 22.3 20.9 14.9 4.8 100.0% 1,629Peritoneum, omentum & 0.6 1.2 3.0 9.8 24.3 32.0 23.1 5.8 100.0% 2,674
mesenteryOther digestive system 0.2 1.0 3.2 10.9 19.3 22.4 28.3 14.7 100.0% 2,306
Respiratory System: 0.1 0.4 1.5 9.3 21.8 31.1 27.3 8.5 100.0% 274,554Nose, nasal cavity & 1.6 4.5 7.0 15.1 23.6 21.3 17.5 9.3 100.0% 2,965
middle earLarynx 0.1 0.4 2.6 16.2 30.2 28.6 17.0 4.8 100.0% 14,693Lung & bronchus 0.0 0.3 1.4 8.8 21.3 31.4 28.1 8.7 100.0% 255,990Lung & bronchus (Male) 0.0 0.2 1.3 8.6 22.4 32.1 27.6 7.8 100.0% 135,823Lung & bronchus (Female) 0.0 0.3 1.5 9.0 20.1 30.8 28.5 9.8 100.0% 120,167Pleura 4.9 0.0 4.1 9.8 13.0 26.0 28.5 13.8 100.0% 123Trachea & other 16.1 20.1 9.6 11.9 13.0 11.5 11.9 6.0 100.0% 783
respiratory organs
Bones & joints 27.4 15.3 9.7 13.1 11.9 9.5 9.3 3.6 100.0% 3,888
Soft tissue (including heart) 9.0 9.4 10.0 14.8 17.2 16.2 16.2 7.2 100.0% 13,963
Skin (excl. basal & squamous): 0.6 6.4 9.8 17.2 21.2 19.5 17.6 7.7 100.0% 98,066Melanoma of the skin 0.6 6.5 10.0 17.8 21.8 19.6 16.8 7.0 100.0% 89,930Other non-epithelial skin 1.3 5.5 7.1 9.9 14.8 19.1 26.5 15.9 100.0% 8,136
Breast (Female) 0.0 1.8 9.6 22.2 25.2 20.7 14.8 5.7 100.0% 285,391
Breast (Female -in situ) 0.0 0.7 10.7 28.8 26.8 19.7 11.2 2.2 100.0% 72,153
Table 1.11
Age Distribution (%) of Incidence Cases by Site, 2006-2010
All Races, Both Sexes
Age at Diagnosis

SEER Cancer Statistics Review 1975-2010 National Cancer Institute
Source: SEER 18 areas (San Francisco, Connecticut, Detroit, Hawaii, Iowa, New Mexico, Seattle, Utah,Atlanta, San Jose-Monterey, Los Angeles, Alaska Native Registry, Rural Georgia,California excluding SF/SJM/LA, Kentucky, Louisiana, New Jersey and Georgia excluding ATL/RG).Percents may not sum to 100 due to rounding.
a Ovary excludes borderline cases or histologies 8442, 8451, 8462, 8472, and 8473.
AllSite <20 20-34 35-44 45-54 55-64 65-74 75-84 85+ Ages Cases
Female Genital System: 0.4 4.1 9.2 19.2 27.3 20.1 13.7 5.9 100.0% 112,905Cervix uteri 0.1 13.8 25.7 24.2 17.0 10.7 5.8 2.6 100.0% 17,288Corpus uteri 0.0 1.6 5.8 18.8 33.6 22.9 13.0 4.3 100.0% 55,690Uterus, NOS 0.2 1.5 5.1 16.3 22.9 19.5 18.3 16.2 100.0% 1,500Ovarya 1.3 3.6 7.2 18.5 23.7 20.4 17.2 8.2 100.0% 29,070Vagina 0.8 1.6 5.1 14.2 23.1 21.0 21.5 12.7 100.0% 1,717Vulva 0.2 2.0 6.7 15.4 18.9 18.5 23.1 15.1 100.0% 5,556Other female genital system 1.1 6.6 7.0 14.5 24.3 22.5 17.0 7.1 100.0% 2,084
Male Genital System: 0.2 1.8 1.6 9.8 31.2 34.5 17.1 3.9 100.0% 309,497Prostate 0.0 0.0 0.6 9.6 32.3 35.8 17.7 4.0 100.0% 295,797Testis 6.2 48.4 24.9 13.8 4.7 1.3 0.7 0.2 100.0% 11,637Penis 0.1 2.0 6.7 11.3 22.0 24.7 22.5 10.7 100.0% 1,565Other male genital system 3.2 2.4 6.4 13.3 21.1 19.9 21.5 12.2 100.0% 498
Urinary System: 0.6 1.0 3.4 11.1 21.6 26.5 25.5 10.4 100.0% 154,986Urinary bladder 0.1 0.4 1.5 7.3 18.5 27.6 30.9 13.7 100.0% 85,752Kidney & renal pelvis 1.2 1.7 6.0 16.4 25.9 25.0 17.8 5.8 100.0% 65,613Ureter 0.0 0.1 0.6 4.0 14.3 29.1 36.8 15.1 100.0% 2,350Other urinary system 0.0 0.7 2.0 7.9 17.2 23.9 31.3 16.9 100.0% 1,271
Eye & Orbit 13.0 3.2 6.3 15.0 20.2 20.2 15.8 6.2 100.0% 3,429
Brain & Nervous System: 13.1 8.8 8.8 14.9 19.5 16.7 13.4 4.8 100.0% 27,410Brain 12.5 8.7 8.7 14.8 19.7 17.1 13.7 4.9 100.0% 25,747Cranial nerves & other 23.3 11.3 11.1 16.1 16.3 10.3 8.4 3.2 100.0% 1,663
nervous system
Endocrine System: 2.9 14.8 19.3 23.8 19.4 12.2 6.0 1.5 100.0% 55,611Thyroid 1.8 15.3 19.9 24.4 19.5 12.0 5.7 1.4 100.0% 52,338Other endocrine & thymus 21.1 7.5 8.8 15.2 18.6 16.0 10.1 2.7 100.0% 3,273
Lymphoma: 3.1 7.2 7.4 13.4 19.2 21.0 20.5 8.3 100.0% 94,880Hodgkin lymphoma 13.0 31.2 14.6 12.7 10.7 8.8 6.7 2.2 100.0% 11,775Non-Hodgkin lymphoma 1.7 3.8 6.3 13.5 20.4 22.8 22.4 9.2 100.0% 83,105
Myeloma 0.0 0.5 3.2 11.4 22.8 27.4 25.2 9.6 100.0% 25,028
Leukemia: 10.3 4.7 5.2 10.4 16.7 20.0 21.7 11.1 100.0% 53,448Lymphocytic: 15.5 3.0 3.2 9.0 17.5 20.8 20.6 10.4 100.0% 26,775
Acute lymphocytic 59.5 10.5 5.5 6.7 7.0 5.3 4.0 1.5 100.0% 6,974Chronic lymphocytic 0.0 0.2 1.6 8.9 21.1 26.9 27.2 14.0 100.0% 18,082Other lymphocytic 0.2 2.2 10.9 19.1 22.2 18.8 18.6 8.0 100.0% 1,719
Myeloid & Monocytic: 5.1 6.7 7.5 12.2 16.2 19.7 22.3 10.3 100.0% 23,979Acute myeloid 5.8 6.4 6.6 11.3 15.8 20.5 23.3 10.3 100.0% 15,392Chronic myeloid 2.9 7.5 9.3 14.3 17.2 18.3 20.5 10.0 100.0% 6,803Acute monocytic 9.4 6.5 8.2 12.8 17.7 16.8 19.3 9.3 100.0% 1,115Other myeloid & monocytic 4.6 5.4 7.8 10.2 12.3 21.1 23.9 14.8 100.0% 669
Other leukemia: 4.0 3.5 4.0 8.1 12.6 16.0 26.5 25.3 100.0% 2,694Other acute leukemia 7.7 4.2 3.3 8.2 11.4 15.0 25.4 24.8 100.0% 1,016Aleukemic, subleukemic & NOS 1.8 3.1 4.4 8.0 13.3 16.6 27.2 25.6 100.0% 1,678
Kaposi Sarcoma 0.2 19.1 29.0 21.1 9.2 7.5 7.8 6.1 100.0% 2,283Mesothelioma 0.1 0.6 1.9 6.4 16.1 27.0 34.1 13.7 100.0% 4,184
Ill-defined & unspecified 0.4 0.9 2.4 9.6 18.1 22.2 27.5 18.8 100.0% 38,395
Table 1.11 - continued
Age Distribution (%) of Incidence Cases by Site, 2006-2010
All Races, Both Sexes
Age at Diagnosis

SEER Cancer Statistics Review 1975-2010 National Cancer Institute
a SEER 18 areas (San Francisco, Connecticut, Detroit, Hawaii, Iowa, New Mexico, Seattle,Utah, Atlanta, San Jose-Monterey, Los Angeles, Alaska Native Registry, Rural Georgia,California excluding SF/SJM/LA, Kentucky, Louisiana, New Jersey andGeorgia excluding ATL/RG).
- Statistic could not be calculated. Less than 16 cases were diagnosed during the timeinterval.
All Races Whites Blacks Site Total Males Females Total Males Females Total Males Females
All Sites 66.0 66.0 65.0 66.0 67.0 65.0 62.0 63.0 62.0
Oral Cavity & Pharynx: 62.0 61.0 64.0 62.0 61.0 66.0 58.0 58.0 57.0Lip 68.0 67.0 72.0 69.0 68.0 73.0 56.0 56.0 54.0Tongue 61.0 61.0 63.0 62.0 61.0 64.0 59.0 60.0 57.0Salivary gland 64.0 66.0 61.0 66.0 68.0 63.0 55.0 57.5 52.0Floor of mouth 62.0 61.0 67.0 63.0 61.0 68.0 59.0 59.0 59.0Gum & other oral cavity 67.0 64.0 71.0 68.0 65.0 73.0 59.0 59.0 60.0Nasopharynx 55.0 55.0 56.0 58.0 57.0 61.0 52.0 53.0 51.0Tonsil 57.0 57.0 60.0 57.0 57.0 60.0 57.0 57.5 56.5Oropharynx 62.0 61.0 65.0 63.0 62.0 66.0 59.0 59.0 60.0Hypopharynx 64.0 64.0 66.0 65.0 64.0 67.0 60.0 60.0 62.0Other oral cavity & pharynx 65.0 64.0 70.0 65.0 64.0 70.0 62.0 60.5 66.5
Digestive System: 68.0 66.0 71.0 69.0 67.0 72.0 64.0 63.0 66.0Esophagus 67.0 66.0 72.0 68.0 67.0 73.0 63.0 63.0 65.0Stomach 69.0 68.0 71.0 70.0 69.0 72.0 67.0 66.0 69.0Small intestine 66.0 65.0 67.0 66.0 65.0 67.0 63.0 63.0 63.0Colon & Rectum: 69.0 67.0 71.0 70.0 68.0 72.0 64.0 63.0 65.0Colon 71.0 69.0 73.0 72.0 70.0 74.0 65.0 64.0 67.0Rectum 64.0 63.0 65.0 65.0 64.0 66.0 60.0 60.0 61.0
Anus, anal canal & anorectum 60.0 58.0 61.0 61.0 59.0 61.0 54.0 51.0 58.0Liver & intrahepatic 63.0 61.0 69.0 63.0 62.0 70.0 59.0 59.0 62.0bile duct
Gallbladder 72.0 72.0 72.0 73.0 73.0 74.0 67.0 69.0 67.0Other biliary 72.0 71.0 74.0 73.0 72.0 74.0 68.0 66.0 70.0Pancreas 71.0 69.0 74.0 72.0 69.0 74.0 67.0 64.0 70.0Retroperitoneum 60.0 60.0 60.5 61.0 60.0 62.0 58.0 56.0 58.0Peritoneum, omentum & 68.0 63.5 68.0 68.0 65.0 68.0 65.0 54.0 66.0mesentery
Other digestive system 72.0 70.0 74.0 73.0 71.0 75.0 67.0 67.0 66.5
Respiratory System: 70.0 69.0 71.0 71.0 70.0 71.0 66.0 65.0 66.0Nose, nasal cavity & 64.0 63.0 66.0 65.0 64.0 67.0 57.0 57.0 57.5middle ear
Larynx 65.0 65.0 64.0 65.0 65.0 64.0 62.0 62.0 60.0Lung & bronchus 70.0 70.0 71.0 71.0 71.0 71.0 66.0 66.0 67.0Pleura 72.0 73.0 67.5 73.0 72.5 76.0 - - -Trachea & other 48.0 41.0 61.0 50.0 41.0 65.0 52.5 47.0 56.0respiratory organs
Bones & joints 42.0 40.0 45.0 44.0 41.0 46.0 36.0 32.0 41.0
Soft tissue (including heart) 58.0 59.0 58.0 60.0 61.0 59.0 51.0 48.0 53.0
Skin (excl. basal & squamous): 62.0 65.0 58.0 62.0 65.0 58.0 56.0 56.0 55.0Melanoma of the skin 61.0 64.0 57.0 62.0 64.0 57.0 62.0 63.0 62.0Other non-epithelial skin 71.0 72.0 69.0 73.0 73.0 71.0 48.0 51.0 48.0
Breast 61.0 68.0 61.0 62.0 69.0 62.0 58.0 64.0 58.0
Breast (in situ) 58.0 64.0 58.0 59.0 64.0 58.0 58.0 65.0 58.0
Table 1.12Median Age of Cancer Patients at Diagnosisa, 2006-2010
By Primary Cancer Site, Race and Sex

SEER Cancer Statistics Review 1975-2010 National Cancer Institute
a SEER 18 areas (San Francisco, Connecticut, Detroit, Hawaii, Iowa, New Mexico, Seattle,Utah, Atlanta, San Jose-Monterey, Los Angeles, Alaska Native Registry, Rural Georgia,California excluding SF/SJM/LA, Kentucky, Louisiana, New Jersey andGeorgia excluding ATL/RG).
b Ovary excludes borderline cases or histologies 8442, 8451, 8462, 8472, and 8473.- Statistic could not be calculated. Less than 16 cases were diagnosed during the time
interval.
All Races Whites Blacks Site Total Males Females Total Males Females Total Males Females
Female Genital System: 61.0 - 61.0 61.0 - 61.0 60.0 - 60.0Cervix uteri 49.0 - 49.0 48.0 - 48.0 51.0 - 51.0Corpus uteri 61.0 - 61.0 62.0 - 62.0 63.0 - 63.0Uterus, NOS 66.0 - 66.0 68.0 - 68.0 63.0 - 63.0Ovaryb 63.0 - 63.0 63.0 - 63.0 61.0 - 61.0Vagina 67.0 - 67.0 68.0 - 68.0 61.0 - 61.0Vulva 68.0 - 68.0 70.0 - 70.0 56.0 - 56.0Other female genital system 63.0 - 63.0 64.0 - 64.0 59.0 - 59.0
Male Genital System: 66.0 66.0 - 66.0 66.0 - 63.0 63.0 -Prostate 66.0 66.0 - 67.0 67.0 - 64.0 64.0 -Testis 33.0 33.0 - 33.0 33.0 - 35.0 35.0 -Penis 68.0 68.0 - 68.0 68.0 - 65.0 65.0 -Other male genital system 66.5 66.5 - 67.5 67.5 - 54.0 54.0 -
Urinary System: 69.0 69.0 69.0 70.0 70.0 70.0 65.0 64.0 66.0Urinary bladder 73.0 72.0 74.0 73.0 73.0 74.0 70.0 68.0 73.0Kidney & renal pelvis 64.0 63.0 65.0 64.0 64.0 66.0 61.0 60.0 63.0Ureter 75.0 74.0 76.0 75.0 74.0 77.0 73.0 74.0 69.5Other urinary system 74.0 75.0 72.0 75.0 75.0 74.0 67.0 69.0 65.0
Eye & Orbit 61.0 61.0 60.0 62.0 62.0 61.0 6.0 6.0 3.0
Brain & Nervous System: 57.0 56.0 58.0 58.0 57.0 59.0 50.0 50.0 49.0Brain 57.0 57.0 59.0 58.0 57.0 60.0 50.0 50.0 49.0Cranial nerves & other 47.0 45.0 49.0 47.0 45.0 50.0 44.0 41.0 47.0nervous system
Endocrine System: 50.0 54.0 49.0 50.0 54.0 49.0 51.0 53.0 50.0Thyroid 50.0 54.0 49.0 50.0 54.0 49.0 51.0 54.0 50.0Other endocrine & thymus 53.0 51.0 55.0 53.0 51.0 56.0 51.0 50.0 52.0
Lymphoma: 64.0 63.0 66.0 65.0 64.0 67.0 54.0 52.0 57.0Hodgkin lymphoma 38.0 40.0 36.0 39.0 41.0 37.0 36.0 37.0 34.0Non-Hodgkin lymphoma 66.0 65.0 68.0 67.0 66.0 69.0 57.0 55.0 60.0
Myeloma 69.0 68.0 70.0 70.0 69.0 71.0 66.0 65.0 66.0
Leukemia: 66.0 65.0 67.0 67.0 66.0 68.0 60.0 59.0 62.0Lymphocytic: 65.0 65.0 67.0 66.0 65.0 67.0 62.0 60.0 65.0Acute lymphocytic 14.0 14.0 13.0 14.0 14.0 13.0 13.0 13.0 13.0Chronic lymphocytic 71.0 70.0 73.0 72.0 70.0 74.0 69.0 68.0 72.0Other lymphocytic 62.0 61.0 68.0 62.0 61.0 67.0 68.0 66.0 76.0
Myeloid & Monocytic: 66.0 66.0 66.0 67.0 67.0 67.0 58.0 58.0 58.0Acute myeloid 67.0 67.0 67.0 68.0 68.0 68.0 59.0 58.0 60.0Chronic myeloid 64.0 63.0 65.0 66.0 65.0 67.0 56.0 56.0 56.0Acute monocytic 62.0 64.0 60.0 63.0 65.0 61.0 52.0 57.0 49.5Other myeloid & monocytic 69.0 70.0 69.0 70.0 71.0 69.5 63.5 64.0 63.0
Other leukemia: 76.0 73.0 78.0 77.0 75.0 79.0 65.0 62.0 71.0Other acute leukemia 75.0 71.0 78.0 77.0 73.0 80.0 61.5 56.0 66.5Aleukemic, subleukemic & NOS 76.0 73.0 78.0 77.0 76.0 79.0 69.0 65.0 72.0
Kaposi Sarcoma 45.0 44.0 74.5 47.0 46.0 80.0 39.0 39.0 41.5Mesothelioma 74.0 74.0 71.0 74.0 75.0 72.0 70.0 71.0 63.0
Ill-defined & unspecified 73.0 70.0 76.0 74.0 71.0 76.0 67.0 64.0 69.0
Table 1.12 - continuedMedian Age of Cancer Patients at Diagnosisa, 2006-2010
By Primary Cancer Site, Race and Sex

SEER Cancer Statistics Review 1975-2010 National Cancer Institute
Source: US Mortality Files, National Center for Health Statistics, Centers for Disease Control andPrevention.Percents may not sum to 100 due to rounding.
AllSite <20 20-34 35-44 45-54 55-64 65-74 75-84 85+ Ages Deaths
All Sites 0.4 0.8 2.3 8.9 18.5 24.9 28.4 15.8 100.0% 2,830,559
Oral Cavity & Pharynx: 0.1 0.7 3.0 13.9 25.1 23.9 21.2 12.0 100.0% 40,202Lip 0.3 0.6 2.3 10.0 12.5 16.4 25.1 32.8 100.0% 311Tongue 0.1 1.0 3.6 14.6 25.9 23.7 20.3 10.8 100.0% 10,019Salivary gland 0.1 0.7 2.8 9.4 16.8 21.4 27.8 20.9 100.0% 3,781Floor of mouth 0.0 0.2 2.3 13.5 30.2 27.7 18.4 7.7 100.0% 517Gum & other oral cavity 0.1 0.5 2.1 9.1 18.8 21.8 25.9 21.8 100.0% 5,680Nasopharynx 0.7 3.3 6.9 18.5 25.8 20.9 16.6 7.3 100.0% 3,318Tonsil 0.0 0.1 3.1 21.5 32.2 23.7 14.8 4.6 100.0% 3,597Oropharynx 0.0 0.2 2.4 15.1 29.3 24.1 19.1 9.7 100.0% 3,631Hypopharynx 0.0 0.3 1.2 12.8 28.6 28.8 22.1 6.0 100.0% 1,522Other oral cavity & pharynx 0.0 0.2 1.8 13.3 26.6 27.2 21.7 9.3 100.0% 7,826
Digestive System: 0.1 0.5 2.2 9.6 19.7 23.7 27.6 16.7 100.0% 692,392Esophagus 0.0 0.2 1.7 10.6 24.7 27.4 24.9 10.4 100.0% 69,389Stomach 0.0 1.3 3.9 10.3 17.2 22.4 27.5 17.4 100.0% 56,659Small intestine 0.0 0.8 2.8 9.8 20.1 23.2 27.7 15.5 100.0% 5,779Colon & Rectum: 0.0 0.6 2.5 8.9 17.0 21.9 28.2 20.8 100.0% 263,165Colon & Rectum (Male) 0.0 0.7 2.7 9.8 19.7 24.7 27.5 15.0 100.0% 134,617Colon & Rectum (Female) 0.0 0.6 2.3 8.0 14.2 19.0 28.9 27.0 100.0% 128,548Anus, anal canal & anorectum 0.0 0.6 5.8 20.0 24.9 18.9 18.3 11.4 100.0% 3,616Liver & intrahepatic 0.3 0.6 1.9 13.7 26.1 23.1 24.0 10.5 100.0% 91,540
bile ductGallbladder 0.0 0.2 1.6 7.0 17.4 25.8 30.3 17.7 100.0% 10,038Other biliary 0.0 0.3 1.4 6.5 14.8 22.1 32.4 22.5 100.0% 7,143Pancreas 0.0 0.2 1.4 8.0 19.4 25.8 29.5 15.7 100.0% 175,321Retroperitoneum 0.4 1.6 2.7 10.8 19.6 24.3 27.5 13.1 100.0% 1,008Peritoneum, omentum & 0.1 0.6 1.9 7.5 19.2 28.5 30.2 12.0 100.0% 4,003
mesenteryOther digestive system 0.1 0.4 1.9 7.4 16.1 21.2 30.8 22.2 100.0% 4,731
Respiratory System: 0.0 0.1 1.1 7.9 19.7 30.4 29.9 10.8 100.0% 815,324Nose, nasal cavity & 0.1 1.9 5.9 12.8 19.3 20.8 23.7 15.6 100.0% 2,442
middle earLarynx 0.0 0.1 1.4 11.7 25.8 28.3 23.6 9.2 100.0% 18,536Lung & bronchus 0.0 0.1 1.1 7.8 19.6 30.5 30.1 10.8 100.0% 792,203Lung & bronchus (Male) 0.0 0.1 1.0 7.8 20.8 31.3 29.5 9.4 100.0% 441,505Lung & bronchus (Female) 0.0 0.1 1.2 7.8 18.1 29.4 30.8 12.6 100.0% 350,698Pleura 0.2 0.4 1.4 3.6 14.0 26.4 38.5 15.6 100.0% 1,037Trachea & other 0.8 4.6 4.2 12.3 17.1 21.8 25.0 14.1 100.0% 1,106
respiratory organs
Bones & joints 12.8 15.3 6.2 10.6 12.4 14.1 16.6 12.0 100.0% 6,821
Soft tissue (including heart) 3.6 6.1 6.6 13.5 19.1 19.1 20.8 11.2 100.0% 20,689
Skin (excl. basal & squamous): 0.1 2.0 4.4 11.7 19.3 20.9 24.8 16.8 100.0% 58,070Melanoma of the skin 0.1 2.5 5.3 13.1 20.3 21.5 24.0 13.2 100.0% 43,878Other non-epithelial skin 0.0 0.3 1.5 7.5 16.3 19.0 27.5 27.7 100.0% 14,192
Breast (Female) 0.0 0.9 5.3 14.6 21.6 20.2 21.5 15.9 100.0% 203,679
Table 1.13
Age Distribution (%) of Deaths by Site, 2006-2010
All Races, Both Sexes
Age at Death

SEER Cancer Statistics Review 1975-2010 National Cancer Institute
Source: US Mortality Files, National Center for Health Statistics, Centers for Disease Control andPrevention.Percents may not sum to 100 due to rounding.
AllSite <20 20-34 35-44 45-54 55-64 65-74 75-84 85+ Ages Deaths
Female Genital System: 0.0 1.2 4.1 11.7 21.0 23.8 24.1 14.0 100.0% 139,987Cervix uteri 0.0 4.8 14.9 24.3 22.2 15.5 11.9 6.4 100.0% 19,853Corpus uteri 0.0 0.3 1.9 7.4 22.5 28.3 25.5 14.1 100.0% 17,239Uterus, NOS 0.0 0.5 2.2 8.7 21.1 25.8 25.4 16.3 100.0% 21,391Ovary 0.1 0.7 2.5 10.7 20.9 24.9 26.2 14.0 100.0% 72,848Vagina 0.0 0.7 2.7 7.1 16.2 19.3 29.1 24.8 100.0% 2,010Vulva 0.0 0.5 2.4 7.2 13.0 16.6 29.7 30.6 100.0% 4,536Other female genital system 0.1 1.5 3.4 10.2 20.2 25.6 23.7 15.2 100.0% 2,110
Male Genital System: 0.0 0.5 0.4 1.9 8.5 19.8 37.0 31.9 100.0% 145,865Prostate 0.0 0.0 0.1 1.6 8.3 20.0 37.6 32.5 100.0% 142,584Testis 1.9 35.4 21.3 17.8 11.2 5.0 4.5 3.0 100.0% 1,817Penis 0.1 0.7 4.5 10.7 21.4 23.9 22.9 15.9 100.0% 1,229Other male genital system 0.9 1.7 2.1 9.4 13.6 23.4 24.7 24.3 100.0% 235
Urinary System: 0.2 0.3 1.2 6.7 15.8 22.8 31.3 21.7 100.0% 138,317Urinary bladder 0.0 0.1 0.7 4.0 11.5 20.7 35.2 27.8 100.0% 70,284Kidney & renal pelvis 0.4 0.5 1.9 9.7 20.8 25.1 26.7 14.9 100.0% 64,191Ureter 0.0 0.3 0.5 3.5 9.7 23.7 38.0 24.4 100.0% 1,776Other urinary system 0.0 0.2 1.1 6.1 12.5 21.9 35.3 22.8 100.0% 2,066
Eye & Orbit 1.8 1.5 5.3 11.1 19.1 22.2 24.6 14.4 100.0% 1,291
Brain & Nervous System: 3.8 3.6 6.1 14.4 22.9 22.7 19.3 7.2 100.0% 68,184
Endocrine System: 6.7 2.5 4.1 9.7 17.4 22.0 24.1 13.5 100.0% 12,722Thyroid 0.1 0.9 2.4 8.0 16.9 24.7 29.5 17.6 100.0% 8,122Other endocrine & thymus 18.2 5.5 7.1 12.8 18.4 17.3 14.6 6.2 100.0% 4,600
Lymphoma: 0.5 2.1 2.8 6.9 14.3 21.8 32.1 19.6 100.0% 108,422Hodgkin lymphoma 1.4 12.8 10.7 11.2 14.9 16.8 21.7 10.5 100.0% 6,250Non-Hodgkin lymphoma 0.4 1.4 2.3 6.6 14.3 22.1 32.8 20.2 100.0% 102,172
Myeloma 0.0 0.1 1.1 6.1 16.3 26.2 33.3 16.8 100.0% 53,902
Leukemia: 2.7 3.1 3.0 6.3 13.1 21.6 30.8 19.5 100.0% 111,736Lymphocytic: 4.2 3.8 2.3 4.8 11.5 18.9 29.6 24.8 100.0% 31,468
Acute lymphocytic 18.1 16.2 8.7 10.8 13.6 13.6 12.7 6.4 100.0% 7,094Chronic lymphocytic 0.0 0.1 0.4 2.8 10.8 20.6 34.7 30.6 100.0% 22,407Other lymphocytic 1.6 1.5 1.6 5.7 11.5 19.0 32.9 26.1 100.0% 1,967
Myeloid & Monocytic: 2.0 3.0 3.6 7.9 15.3 23.9 30.2 14.1 100.0% 53,485Acute myeloid 2.1 3.1 3.6 8.0 15.8 24.7 30.0 12.7 100.0% 44,442Chronic myeloid 0.6 3.2 4.9 8.9 13.0 17.9 28.8 22.8 100.0% 5,083Acute monocytic 1.4 1.8 2.3 5.3 11.1 23.8 32.8 21.5 100.0% 488Other myeloid & monocytic 1.6 1.3 2.1 5.2 12.6 22.8 34.9 19.5 100.0% 3,472
Other leukemia: 2.3 2.3 2.3 5.0 10.7 20.2 33.3 24.0 100.0% 26,783Other acute leukemia 1.3 2.6 2.5 5.1 10.7 20.9 34.1 22.9 100.0% 10,301Aleukemic, subleukemic & NOS 2.9 2.2 2.2 4.9 10.7 19.7 32.7 24.7 100.0% 16,482
Ill-defined & unspecified 0.2 0.7 2.0 8.1 17.4 23.4 29.3 18.8 100.0% 210,920
Table 1.13 - continued
Age Distribution (%) of Deaths by Site, 2006-2010
All Races, Both Sexes
Age at Death

SEER Cancer Statistics Review 1975-2010 National Cancer Institute
a US Mortality Files, National Center for Health Statistics, Centers for Disease Control andPrevention.
- Statistic could not be calculated. Less than 16 deaths occurred during the time interval.
All Races Whites Blacks Site Total Males Females Total Males Females Total Males Females
All Sites 72.0 72.0 73.0 73.0 72.0 74.0 68.0 67.0 68.0
Oral Cavity & Pharynx: 67.0 65.0 73.0 69.0 66.0 75.0 62.0 61.0 63.0Lip 78.0 75.0 85.0 78.0 75.0 85.0 - - -Tongue 66.0 64.0 72.0 67.0 65.0 73.0 61.0 62.0 60.0Salivary gland 74.0 73.0 76.0 75.0 74.0 77.0 62.0 62.0 63.5Floor of mouth 66.0 63.0 71.0 67.0 64.0 72.0 61.5 60.0 64.0Gum & other oral cavity 74.0 68.0 80.0 75.0 69.0 81.0 64.0 62.0 68.0Nasopharynx 62.0 61.0 67.0 65.0 63.0 71.0 57.0 57.0 59.0Tonsil 62.0 61.0 67.0 62.0 61.0 67.0 61.0 61.0 61.0Oropharynx 66.0 64.0 72.0 67.0 64.0 74.0 61.0 61.0 59.0Hypopharynx 67.0 66.0 70.0 68.0 67.0 70.0 62.0 61.0 65.0Other oral cavity & pharynx 67.0 66.0 71.0 68.0 67.0 72.0 63.0 62.0 66.0
Digestive System: 72.0 70.0 76.0 73.0 70.0 77.0 67.0 65.0 71.0Esophagus 69.0 68.0 74.0 70.0 68.0 75.0 65.0 64.0 66.0Stomach 72.0 71.0 75.0 73.0 71.0 76.0 70.0 68.0 73.0Small intestine 72.0 70.0 74.0 73.0 71.0 75.0 65.0 63.0 66.5Colon & Rectum 74.0 72.0 77.0 75.0 72.0 78.0 69.0 67.0 71.0Anus, anal canal & anorectum 64.0 62.0 65.0 65.0 63.0 66.0 56.0 53.0 60.0Liver & intrahepatic 68.0 65.0 74.0 69.0 66.0 75.0 61.0 60.0 67.0bile duct
Gallbladder 74.0 73.0 74.0 75.0 74.0 75.0 69.0 70.0 68.0Other biliary 76.0 74.0 78.0 77.0 75.0 79.0 71.5 69.5 74.0Pancreas 73.0 70.0 75.0 73.0 71.0 76.0 69.0 66.0 72.0Retroperitoneum 70.0 68.5 72.0 71.0 69.0 73.0 63.0 61.0 67.5Peritoneum, omentum & 72.0 68.0 73.0 72.0 68.0 73.0 67.0 65.5 68.0mesentery
Other digestive system 76.0 73.0 79.0 77.0 74.0 79.0 69.0 65.0 74.0
Respiratory System: 72.0 71.0 72.0 72.0 72.0 73.0 67.0 67.0 69.0Nose, nasal cavity & 70.0 66.0 74.0 71.0 68.0 75.0 62.0 60.0 66.0middle ear
Larynx 68.0 68.0 70.0 69.0 69.0 71.0 65.0 64.0 65.0Lung & bronchus 72.0 71.0 72.0 72.0 72.0 73.0 68.0 67.0 69.0Pleura 75.0 76.0 74.0 76.0 76.0 75.0 68.5 68.0 -Trachea & other 69.0 66.0 74.0 70.0 67.0 75.0 61.5 61.5 62.0respiratory organs
Bones & joints 59.0 56.0 63.0 60.0 58.0 65.0 51.0 49.0 54.0
Soft tissue (including heart) 65.0 65.0 65.0 66.0 66.0 67.0 57.0 55.0 58.0
Skin (excl. basal & squamous): 71.0 70.0 72.0 71.0 70.0 72.0 63.0 61.0 69.0Melanoma of the skin 69.0 68.0 69.0 69.0 68.0 69.0 68.0 65.0 70.0Other non-epithelial skin 77.0 75.0 81.0 78.0 76.0 82.0 60.0 59.0 68.0
Breast 68.0 71.0 68.0 70.0 72.0 70.0 61.0 65.0 61.0
Table 1.14Median Age of Cancer Patients at Deatha, 2006-2010
By Primary Cancer Site, Race and Sex

SEER Cancer Statistics Review 1975-2010 National Cancer Institute
a US Mortality Files, National Center for Health Statistics, Centers for Disease Control andPrevention.
- Statistic could not be calculated. Less than 16 deaths occurred during the time interval.
All Races Whites Blacks Site Total Males Females Total Males Females Total Males Females
Female Genital System: 70.0 - 70.0 70.0 - 70.0 66.0 - 66.0Cervix uteri 57.0 - 57.0 57.0 - 57.0 56.0 - 56.0Corpus uteri 71.0 - 71.0 71.0 - 71.0 68.0 - 68.0Uterus, NOS 71.0 - 71.0 72.0 - 72.0 69.0 - 69.0Ovary 71.0 - 71.0 71.0 - 71.0 67.0 - 67.0Vagina 76.0 - 76.0 77.0 - 77.0 71.0 - 71.0Vulva 79.0 - 79.0 79.0 - 79.0 70.0 - 70.0Other female genital system 70.0 - 70.0 71.0 - 71.0 66.0 - 66.0
Male Genital System: 80.0 80.0 - 81.0 81.0 - 77.0 77.0 -Prostate 80.0 80.0 - 81.0 81.0 - 77.0 77.0 -Testis 40.0 40.0 - 41.0 41.0 - 39.0 39.0 -Penis 70.0 70.0 - 71.0 71.0 - 66.0 66.0 -Other male genital system 74.0 74.0 - 75.0 75.0 - 69.0 69.0 -
Urinary System: 76.0 75.0 78.0 76.0 75.0 78.0 71.0 68.0 74.0Urinary bladder 79.0 78.0 80.0 79.0 78.0 81.0 75.0 73.0 77.0Kidney & renal pelvis 71.0 69.0 75.0 72.0 70.0 75.0 67.0 64.0 71.0Ureter 78.0 77.0 79.0 78.0 77.0 80.0 74.5 74.5 74.0Other urinary system 77.0 77.0 78.0 78.0 77.0 79.0 67.0 67.0 67.0
Eye & Orbit 70.0 69.0 71.0 70.0 69.0 71.5 57.0 54.5 58.5
Brain & Nervous System 64.0 63.0 66.0 65.0 63.0 67.0 59.0 58.0 61.0
Endocrine System: 69.0 66.0 71.0 70.0 67.0 73.0 63.0 58.0 65.0Thyroid 73.0 71.0 76.0 74.0 71.0 76.0 70.0 67.0 71.0Other endocrine & thymus 58.0 57.0 59.0 59.0 58.0 60.0 51.0 50.0 53.0
Lymphoma: 75.0 73.0 77.0 76.0 74.0 78.0 64.0 61.0 68.0Hodgkin lymphoma 64.0 61.0 68.0 66.0 63.0 70.0 50.0 48.0 53.0Non-Hodgkin lymphoma 76.0 73.0 78.0 76.0 74.0 78.0 65.0 62.0 69.0
Myeloma 75.0 73.0 76.0 75.0 74.0 77.0 71.0 69.0 72.0
Leukemia: 75.0 73.0 76.0 75.0 74.0 77.0 68.0 66.0 70.0Lymphocytic: 76.0 74.0 79.0 77.0 75.0 80.0 69.0 67.0 74.0Acute lymphocytic 52.0 48.0 55.0 53.0 50.0 56.0 42.0 35.0 49.0Chronic lymphocytic 79.0 77.0 82.0 80.0 78.0 83.0 73.0 71.0 77.0Other lymphocytic 78.0 76.0 81.0 78.0 76.0 81.0 74.0 68.0 78.0
Myeloid & Monocytic: 72.0 72.0 73.0 73.0 73.0 74.0 65.0 65.0 66.0Acute myeloid 72.0 72.0 72.0 72.0 72.0 73.0 66.0 65.0 66.0Chronic myeloid 75.0 73.0 78.0 77.0 75.0 80.0 61.0 60.0 62.0Acute monocytic 76.0 77.0 76.0 77.0 77.0 76.0 71.0 - -Other myeloid & monocytic 76.0 75.0 78.0 77.0 76.0 78.0 69.0 68.0 75.0
Other leukemia: 77.0 76.0 79.0 78.0 76.0 80.0 71.0 69.0 73.0Other acute leukemia 77.0 76.0 78.0 77.0 76.0 79.0 71.0 69.0 73.0Aleukemic, subleukemic & NOS 77.0 76.0 79.0 78.0 77.0 80.0 71.0 69.0 73.0
Ill-defined & unspecified 74.0 72.0 76.0 75.0 73.0 77.0 68.0 66.0 70.0
Table 1.14 - continuedMedian Age of Cancer Patients at Deatha, 2006-2010
By Primary Cancer Site, Race and Sex

SEE
R C
ancer Statistics Review
1975-2010N
ational Cancer Institute
Devcan Version 6.7.0, June 2013, National Cancer Institute (http://surveillance.cancer.gov/devcan/).Source: SEER 18 areas (San Francisco, Connecticut, Detroit, Hawaii, Iowa, New Mexico, Seattle, Utah, Atlanta, San Jose-Monterey,
Los Angeles, Alaska Native Registry, Rural Georgia, California excluding SF/SJM/LA, Kentucky, Louisiana, New Jersey,and Georgia excluding ATL/RG).
Note: Invasive cancer only unless specified otherwise.A percent or confidence interval value of 0.00 represents a value that is below 0.005.
All Races Whites Blacks Site Percent ( 95% C.I. ) Percent ( 95% C.I. ) Percent ( 95% C.I. )
All Sites 40.76 (40.67, 40.85 ) 41.08 (40.98, 41.18 ) 37.66 (37.40, 37.93 )Invasive and In Situ 43.13 (43.04, 43.22 ) 43.48 (43.38, 43.58 ) 39.01 (38.74, 39.28 )
Oral Cavity and Pharynx 1.09 ( 1.07, 1.10 ) 1.13 ( 1.11, 1.14 ) 0.80 ( 0.76, 0.83 )Esophagus 0.51 ( 0.50, 0.52 ) 0.52 ( 0.51, 0.54 ) 0.47 ( 0.44, 0.50 )Stomach 0.86 ( 0.85, 0.88 ) 0.75 ( 0.74, 0.77 ) 1.12 ( 1.08, 1.17 )Colon and Rectum 4.82 ( 4.79, 4.85 ) 4.74 ( 4.71, 4.77 ) 4.94 ( 4.84, 5.03 )Invasive and In Situ 5.01 ( 4.98, 5.04 ) 4.92 ( 4.88, 4.95 ) 5.19 ( 5.09, 5.29 )
Liver and Intrahepatic Bile Duct 0.86 ( 0.85, 0.87 ) 0.76 ( 0.74, 0.77 ) 0.88 ( 0.85, 0.92 )Pancreas 1.49 ( 1.47, 1.51 ) 1.47 ( 1.45, 1.49 ) 1.59 ( 1.54, 1.65 )Larynx 0.36 ( 0.35, 0.37 ) 0.36 ( 0.35, 0.37 ) 0.45 ( 0.42, 0.48 )Invasive and In Situ 0.38 ( 0.38, 0.39 ) 0.39 ( 0.38, 0.40 ) 0.48 ( 0.45, 0.51 )
Lung and Bronchus 6.88 ( 6.85, 6.92 ) 7.06 ( 7.02, 7.10 ) 6.56 ( 6.45, 6.68 )Melanoma of the Skin 2.03 ( 2.02, 2.05 ) 2.38 ( 2.35, 2.40 ) 0.09 ( 0.07, 0.10 )Invasive and In Situ 3.35 ( 3.33, 3.38 ) 3.83 ( 3.80, 3.86 ) 0.11 ( 0.10, 0.13 )
Breast 6.37 ( 6.33, 6.40 ) 6.50 ( 6.46, 6.54 ) 5.78 ( 5.69, 5.88 )Invasive and In Situ 7.63 ( 7.59, 7.66 ) 7.76 ( 7.72, 7.80 ) 6.93 ( 6.83, 7.04 )
Urinary Bladder (Invasive and In Situ) 2.40 ( 2.38, 2.43 ) 2.61 ( 2.58, 2.63 ) 1.24 ( 1.19, 1.29 )Kidney and Renal Pelvis 1.61 ( 1.59, 1.63 ) 1.66 ( 1.64, 1.68 ) 1.59 ( 1.54, 1.64 )Brain and Other Nervous System 0.62 ( 0.61, 0.63 ) 0.68 ( 0.67, 0.70 ) 0.35 ( 0.33, 0.37 )Thyroid 1.08 ( 1.07, 1.09 ) 1.14 ( 1.13, 1.15 ) 0.60 ( 0.57, 0.63 )Hodgkin Lymphoma 0.22 ( 0.22, 0.23 ) 0.24 ( 0.23, 0.25 ) 0.20 ( 0.18, 0.21 )Non-Hodgkin Lymphoma 2.14 ( 2.12, 2.16 ) 2.24 ( 2.22, 2.27 ) 1.27 ( 1.22, 1.31 )Myeloma 0.70 ( 0.69, 0.71 ) 0.64 ( 0.63, 0.66 ) 1.17 ( 1.12, 1.22 )Leukemia 1.40 ( 1.38, 1.41 ) 1.46 ( 1.44, 1.48 ) 0.92 ( 0.87, 0.96 )Acute Lymphocytic Leukemia 0.13 ( 0.12, 0.13 ) 0.14 ( 0.14, 0.15 ) 0.07 ( 0.06, 0.08 )Chronic Lymphocytic Leukemia 0.52 ( 0.51, 0.53 ) 0.55 ( 0.54, 0.56 ) 0.29 ( 0.26, 0.31 )Acute Myeloid Leukemia 0.41 ( 0.40, 0.42 ) 0.42 ( 0.41, 0.43 ) 0.29 ( 0.27, 0.32 )Chronic Myeloid Leukemia 0.17 ( 0.17, 0.18 ) 0.18 ( 0.17, 0.18 ) 0.14 ( 0.13, 0.16 )
Kaposi Sarcoma 0.05 ( 0.04, 0.05 ) 0.04 ( 0.04, 0.05 ) 0.07 ( 0.06, 0.08 )Mesothelioma 0.13 ( 0.12, 0.13 ) 0.14 ( 0.14, 0.15 ) 0.06 ( 0.05, 0.07 )
Table 1.15
Lifetime Risk (Percent) of Being Diagnosed with Cancer by Site and Race/Ethnicity
Both Sexes, 18 SEER Areas, 2008-2010

SEE
R C
ancer Statistics Review
1975-2010N
ational Cancer Institute
Devcan Version 6.7.0, June 2013, National Cancer Institute (http://surveillance.cancer.gov/devcan/).Source: SEER 18 areas (San Francisco, Connecticut, Detroit, Hawaii, Iowa, New Mexico, Seattle, Utah, Atlanta, San Jose-Monterey,
Los Angeles, Alaska Native Registry, Rural Georgia, California excluding SF/SJM/LA, Kentucky, Louisiana, New Jersey,and Georgia excluding ATL/RG).
Note: Invasive cancer only unless specified otherwise.a Underlying incidence data for American Indian/Alaska Native are based on the CHSDA(Contract Health Service Delivery Area)
counties.b Hispanic is not mutually exclusive from whites, blacks, Asian Pacific Islanders, and American Indians/Alaska Natives.
Underlying incidence data for Hispanics are based on NHIA and exclude cases from the Alaska Native Registry.A percent or confidence interval value of 0.00 represents a value that is below 0.005.
Asian/Pacific American Indian/Islanders Alaska Nativesa Hispanicsb
Site Percent ( 95% C.I. ) Percent ( 95% C.I. ) Percent ( 95% C.I. )
All Sites 35.09 (34.74, 35.46 ) 29.44 (28.26, 30.73 ) 37.76 (37.43, 38.09 )Invasive and In Situ 36.55 (36.19, 36.92 ) 30.05 (28.86, 31.34 ) 39.05 (38.72, 39.38 )
Oral Cavity and Pharynx 0.90 ( 0.84, 0.96 ) 0.82 ( 0.60, 1.16 ) 0.78 ( 0.74, 0.84 )Esophagus 0.36 ( 0.32, 0.40 ) 0.42 ( 0.30, 0.68 ) 0.38 ( 0.35, 0.41 )Stomach 1.85 ( 1.76, 1.95 ) 0.99 ( 0.79, 1.31 ) 1.52 ( 1.45, 1.59 )Colon and Rectum 5.05 ( 4.91, 5.20 ) 4.20 ( 3.75, 4.76 ) 4.71 ( 4.59, 4.84 )Invasive and In Situ 5.25 ( 5.11, 5.40 ) 4.34 ( 3.88, 4.91 ) 4.89 ( 4.77, 5.02 )
Liver and Intrahepatic Bile Duct 1.89 ( 1.81, 1.97 ) 1.57 ( 1.33, 1.92 ) 1.54 ( 1.48, 1.61 )Pancreas 1.59 ( 1.51, 1.69 ) 1.26 ( 1.02, 1.62 ) 1.65 ( 1.58, 1.73 )Larynx 0.18 ( 0.15, 0.21 ) 0.26 ( 0.17, 0.50 ) 0.31 ( 0.28, 0.34 )Invasive and In Situ 0.19 ( 0.16, 0.22 ) 0.28 ( 0.19, 0.51 ) 0.33 ( 0.30, 0.36 )
Lung and Bronchus 5.62 ( 5.47, 5.78 ) 4.57 ( 4.11, 5.14 ) 4.41 ( 4.29, 4.53 )Melanoma of the Skin 0.16 ( 0.13, 0.19 ) 0.31 ( 0.22, 0.54 ) 0.51 ( 0.47, 0.55 )Invasive and In Situ 0.21 ( 0.19, 0.25 ) 0.44 ( 0.32, 0.68 ) 0.77 ( 0.72, 0.82 )
Breast 5.35 ( 5.23, 5.47 ) 3.80 ( 3.45, 4.25 ) 5.11 ( 5.00, 5.22 )Invasive and In Situ 6.71 ( 6.58, 6.84 ) 4.23 ( 3.87, 4.69 ) 6.01 ( 5.90, 6.13 )
Urinary Bladder (Invasive and In Situ) 1.44 ( 1.36, 1.52 ) 0.95 ( 0.74, 1.29 ) 1.59 ( 1.52, 1.68 )Kidney and Renal Pelvis 1.03 ( 0.97, 1.09 ) 2.02 ( 1.74, 2.42 ) 1.78 ( 1.71, 1.84 )Brain and Other Nervous System 0.39 ( 0.35, 0.43 ) 0.32 ( 0.19, 0.59 ) 0.55 ( 0.52, 0.60 )Thyroid 1.19 ( 1.14, 1.25 ) 0.73 ( 0.56, 1.02 ) 1.01 ( 0.97, 1.06 )Hodgkin Lymphoma 0.11 ( 0.10, 0.13 ) 0.11 ( 0.05, 0.35 ) 0.22 ( 0.20, 0.24 )Non-Hodgkin Lymphoma 1.83 ( 1.75, 1.92 ) 1.27 ( 1.04, 1.62 ) 2.23 ( 2.15, 2.32 )Myeloma 0.51 ( 0.47, 0.56 ) 0.38 ( 0.27, 0.64 ) 0.72 ( 0.68, 0.77 )Leukemia 0.97 ( 0.91, 1.03 ) 0.88 ( 0.68, 1.19 ) 1.18 ( 1.13, 1.24 )Acute Lymphocytic Leukemia 0.11 ( 0.09, 0.13 ) 0.09 ( 0.05, 0.31 ) 0.19 ( 0.18, 0.21 )Chronic Lymphocytic Leukemia 0.15 ( 0.13, 0.18 ) 0.18 ( 0.09, 0.42 ) 0.29 ( 0.26, 0.32 )Acute Myeloid Leukemia 0.42 ( 0.38, 0.46 ) 0.35 ( 0.23, 0.62 ) 0.40 ( 0.36, 0.43 )Chronic Myeloid Leukemia 0.15 ( 0.13, 0.18 ) 0.14 ( 0.08, 0.38 ) 0.16 ( 0.14, 0.19 )
Kaposi Sarcoma 0.02 ( 0.01, 0.04 ) 0.02 ( 0.00, 0.25 ) 0.08 ( 0.07, 0.10 )Mesothelioma 0.05 ( 0.04, 0.07 ) 0.11 ( 0.05, 0.35 ) 0.13 ( 0.11, 0.15 )
Table 1.15 - continued
Lifetime Risk (Percent) of Being Diagnosed with Cancer by Site and Race/Ethnicity
Both Sexes, 18 SEER Areas, 2008-2010

SEE
R C
ancer Statistics Review
1975-2010N
ational Cancer Institute
Devcan Version 6.7.0, June 2013, National Cancer Institute (http://surveillance.cancer.gov/devcan/).Source: SEER 18 areas (San Francisco, Connecticut, Detroit, Hawaii, Iowa, New Mexico, Seattle, Utah, Atlanta, San Jose-Monterey,
Los Angeles, Alaska Native Registry, Rural Georgia, California excluding SF/SJM/LA, Kentucky, Louisiana, New Jersey,and Georgia excluding ATL/RG).
Note: Invasive cancer only unless specified otherwise.A percent or confidence interval value of 0.00 represents a value that is below 0.005.
All Races Whites Blacks Site Percent ( 95% C.I. ) Percent ( 95% C.I. ) Percent ( 95% C.I. )
All Sites 43.92 (43.78, 44.06 ) 43.72 (43.57, 43.87 ) 42.13 (41.72, 42.55 )Invasive and In Situ 45.35 (45.21, 45.49 ) 45.17 (45.01, 45.32 ) 42.46 (42.05, 42.88 )
Oral Cavity and Pharynx 1.52 ( 1.49, 1.54 ) 1.57 ( 1.55, 1.60 ) 1.14 ( 1.08, 1.21 )Esophagus 0.80 ( 0.78, 0.82 ) 0.84 ( 0.82, 0.86 ) 0.69 ( 0.64, 0.74 )Stomach 1.08 ( 1.06, 1.10 ) 0.97 ( 0.95, 0.99 ) 1.32 ( 1.25, 1.40 )Colon and Rectum 5.01 ( 4.97, 5.06 ) 4.94 ( 4.89, 4.99 ) 5.00 ( 4.86, 5.14 )Invasive and In Situ 5.22 ( 5.18, 5.27 ) 5.13 ( 5.08, 5.19 ) 5.26 ( 5.11, 5.40 )
Liver and Intrahepatic Bile Duct 1.23 ( 1.20, 1.25 ) 1.08 ( 1.06, 1.11 ) 1.32 ( 1.26, 1.39 )Pancreas 1.50 ( 1.47, 1.52 ) 1.49 ( 1.46, 1.52 ) 1.54 ( 1.46, 1.62 )Larynx 0.60 ( 0.58, 0.61 ) 0.60 ( 0.58, 0.61 ) 0.76 ( 0.71, 0.82 )Invasive and In Situ 0.64 ( 0.63, 0.66 ) 0.65 ( 0.63, 0.66 ) 0.82 ( 0.77, 0.88 )
Lung and Bronchus 7.62 ( 7.56, 7.68 ) 7.66 ( 7.59, 7.72 ) 7.87 ( 7.70, 8.06 )Melanoma of the Skin 2.54 ( 2.50, 2.57 ) 2.93 ( 2.90, 2.97 ) 0.08 ( 0.07, 0.11 )Invasive and In Situ 4.14 ( 4.10, 4.18 ) 4.68 ( 4.64, 4.73 ) 0.11 ( 0.09, 0.14 )
Breast 0.13 ( 0.12, 0.14 ) 0.13 ( 0.12, 0.14 ) 0.15 ( 0.12, 0.18 )Invasive and In Situ 0.14 ( 0.14, 0.15 ) 0.14 ( 0.13, 0.15 ) 0.17 ( 0.14, 0.20 )
Prostate 15.33 (15.26, 15.41 ) 14.61 (14.52, 14.69 ) 19.26 (18.99, 19.53 )Testis 0.39 ( 0.38, 0.39 ) 0.46 ( 0.45, 0.47 ) 0.09 ( 0.08, 0.11 )Urinary Bladder (Invasive and In Situ) 3.82 ( 3.78, 3.87 ) 4.15 ( 4.10, 4.19 ) 1.76 ( 1.67, 1.86 )Kidney and Renal Pelvis 2.05 ( 2.02, 2.08 ) 2.11 ( 2.08, 2.14 ) 1.94 ( 1.86, 2.03 )Brain and Other Nervous System 0.69 ( 0.68, 0.71 ) 0.76 ( 0.75, 0.78 ) 0.37 ( 0.33, 0.41 )Thyroid 0.55 ( 0.54, 0.57 ) 0.59 ( 0.58, 0.61 ) 0.26 ( 0.23, 0.30 )Hodgkin Lymphoma 0.25 ( 0.24, 0.25 ) 0.26 ( 0.25, 0.27 ) 0.21 ( 0.19, 0.24 )Non-Hodgkin Lymphoma 2.36 ( 2.33, 2.40 ) 2.47 ( 2.44, 2.51 ) 1.40 ( 1.34, 1.48 )Myeloma 0.80 ( 0.78, 0.82 ) 0.76 ( 0.74, 0.78 ) 1.22 ( 1.15, 1.29 )Leukemia 1.65 ( 1.63, 1.68 ) 1.73 ( 1.70, 1.76 ) 1.02 ( 0.96, 1.09 )Acute Lymphocytic Leukemia 0.14 ( 0.14, 0.15 ) 0.16 ( 0.15, 0.16 ) 0.08 ( 0.07, 0.10 )Chronic Lymphocytic Leukemia 0.64 ( 0.63, 0.66 ) 0.68 ( 0.66, 0.70 ) 0.34 ( 0.30, 0.39 )Acute Myeloid Leukemia 0.47 ( 0.45, 0.48 ) 0.48 ( 0.47, 0.50 ) 0.31 ( 0.27, 0.35 )Chronic Myeloid Leukemia 0.21 ( 0.20, 0.22 ) 0.21 ( 0.20, 0.22 ) 0.16 ( 0.14, 0.19 )
Kaposi Sarcoma 0.08 ( 0.08, 0.09 ) 0.07 ( 0.07, 0.08 ) 0.13 ( 0.11, 0.15 )Mesothelioma 0.21 ( 0.20, 0.22 ) 0.24 ( 0.23, 0.25 ) 0.10 ( 0.08, 0.12 )
Table 1.16
Lifetime Risk (Percent) of Being Diagnosed with Cancer by Site and Race/Ethnicity
Males, 18 SEER Areas, 2008-2010

SEE
R C
ancer Statistics Review
1975-2010N
ational Cancer Institute
Devcan Version 6.7.0, June 2013, National Cancer Institute (http://surveillance.cancer.gov/devcan/).Source: SEER 18 areas (San Francisco, Connecticut, Detroit, Hawaii, Iowa, New Mexico, Seattle, Utah, Atlanta, San Jose-Monterey,
Los Angeles, Alaska Native Registry, Rural Georgia, California excluding SF/SJM/LA, Kentucky, Louisiana, New Jersey,and Georgia excluding ATL/RG).
Note: Invasive cancer only unless specified otherwise.a Underlying incidence data for American Indian/Alaska Native are based on the CHSDA(Contract Health Service Delivery Area)
counties.b Hispanic is not mutually exclusive from whites, blacks, Asian Pacific Islanders, and American Indians/Alaska Natives.
Underlying incidence data for Hispanics are based on NHIA and exclude cases from the Alaska Native Registry.A percent or confidence interval value of 0.00 represents a value that is below 0.005.
Asian/Pacific American Indian/Islanders Alaska Nativesa Hispanicsb
Site Percent ( 95% C.I. ) Percent ( 95% C.I. ) Percent ( 95% C.I. )
All Sites 37.06 (36.52, 37.62 ) 30.38 (28.63, 32.38 ) 41.11 (40.59, 41.63 )Invasive and In Situ 37.43 (36.88, 37.99 ) 30.58 (28.82, 32.59 ) 41.56 (41.04, 42.09 )
Oral Cavity and Pharynx 1.25 ( 1.16, 1.36 ) 1.20 ( 0.82, 1.95 ) 1.04 ( 0.97, 1.13 )Esophagus 0.52 ( 0.46, 0.60 ) 0.65 ( 0.43, 1.28 ) 0.64 ( 0.58, 0.71 )Stomach 2.17 ( 2.03, 2.33 ) 1.16 ( 0.85, 1.83 ) 1.86 ( 1.74, 1.99 )Colon and Rectum 5.27 ( 5.07, 5.48 ) 4.53 ( 3.83, 5.53 ) 5.22 ( 5.03, 5.42 )Invasive and In Situ 5.50 ( 5.29, 5.71 ) 4.69 ( 3.98, 5.70 ) 5.41 ( 5.22, 5.61 )
Liver and Intrahepatic Bile Duct 2.57 ( 2.44, 2.71 ) 2.36 ( 1.91, 3.12 ) 2.09 ( 1.99, 2.20 )Pancreas 1.51 ( 1.40, 1.64 ) 1.26 ( 0.96, 1.92 ) 1.49 ( 1.39, 1.59 )Larynx 0.33 ( 0.29, 0.40 ) 0.49 ( 0.31, 1.08 ) 0.58 ( 0.52, 0.66 )Invasive and In Situ 0.35 ( 0.30, 0.42 ) 0.49 ( 0.32, 1.09 ) 0.62 ( 0.56, 0.70 )
Lung and Bronchus 7.08 ( 6.83, 7.35 ) 5.02 ( 4.32, 6.01 ) 5.05 ( 4.86, 5.26 )Melanoma of the Skin 0.19 ( 0.15, 0.25 ) 0.31 ( 0.17, 0.89 ) 0.53 ( 0.47, 0.60 )Invasive and In Situ 0.26 ( 0.21, 0.32 ) 0.47 ( 0.29, 1.07 ) 0.79 ( 0.72, 0.88 )
Breast 0.10 ( 0.07, 0.16 ) 0.04 ( 0.01, 0.64 ) 0.07 ( 0.06, 0.12 )Invasive and In Situ 0.11 ( 0.08, 0.17 ) 0.06 ( 0.01, 0.65 ) 0.08 ( 0.06, 0.12 )
Prostate 10.31 (10.04, 10.59 ) 7.69 ( 6.87, 8.79 ) 14.64 (14.35, 14.95 )Testis 0.14 ( 0.12, 0.18 ) 0.32 ( 0.23, 0.87 ) 0.34 ( 0.32, 0.38 )Urinary Bladder (Invasive and In Situ) 2.26 ( 2.12, 2.41 ) 1.52 ( 1.15, 2.25 ) 2.56 ( 2.42, 2.73 )Kidney and Renal Pelvis 1.37 ( 1.27, 1.49 ) 2.53 ( 2.00, 3.37 ) 2.25 ( 2.14, 2.37 )Brain and Other Nervous System 0.45 ( 0.40, 0.52 ) 0.25 ( 0.15, 0.82 ) 0.57 ( 0.52, 0.64 )Thyroid 0.55 ( 0.50, 0.62 ) 0.28 ( 0.18, 0.84 ) 0.44 ( 0.40, 0.50 )Hodgkin Lymphoma 0.12 ( 0.10, 0.16 ) 0.06 ( 0.03, 0.65 ) 0.25 ( 0.22, 0.30 )Non-Hodgkin Lymphoma 2.05 ( 1.93, 2.18 ) 1.32 ( 1.03, 1.97 ) 2.38 ( 2.26, 2.51 )Myeloma 0.56 ( 0.51, 0.64 ) 0.31 ( 0.18, 0.89 ) 0.84 ( 0.77, 0.94 )Leukemia 1.14 ( 1.05, 1.25 ) 1.06 ( 0.72, 1.76 ) 1.35 ( 1.26, 1.46 )Acute Lymphocytic Leukemia 0.13 ( 0.10, 0.17 ) 0.10 ( 0.04, 0.68 ) 0.19 ( 0.18, 0.23 )Chronic Lymphocytic Leukemia 0.22 ( 0.18, 0.28 ) 0.28 ( 0.11, 0.91 ) 0.35 ( 0.30, 0.41 )Acute Myeloid Leukemia 0.45 ( 0.40, 0.53 ) 0.37 ( 0.18, 0.99 ) 0.45 ( 0.40, 0.52 )Chronic Myeloid Leukemia 0.21 ( 0.18, 0.27 ) 0.17 ( 0.04, 0.78 ) 0.18 ( 0.15, 0.23 )
Kaposi Sarcoma 0.03 ( 0.02, 0.07 ) 0.04 ( 0.00, 0.64 ) 0.12 ( 0.10, 0.17 )Mesothelioma 0.08 ( 0.06, 0.12 ) 0.15 ( 0.04, 0.75 ) 0.22 ( 0.18, 0.28 )
Table 1.16 - continued
Lifetime Risk (Percent) of Being Diagnosed with Cancer by Site and Race/Ethnicity
Males, 18 SEER Areas, 2008-2010

SEE
R C
ancer Statistics Review
1975-2010N
ational Cancer Institute
Devcan Version 6.7.0, June 2013, National Cancer Institute (http://surveillance.cancer.gov/devcan/).Source: SEER 18 areas (San Francisco, Connecticut, Detroit, Hawaii, Iowa, New Mexico, Seattle, Utah, Atlanta, San Jose-Monterey,
Los Angeles, Alaska Native Registry, Rural Georgia, California excluding SF/SJM/LA, Kentucky, Louisiana, New Jersey,and Georgia excluding ATL/RG).
Note: Invasive cancer only unless specified otherwise.a Ovary excludes borderline cases or histologies 8442, 8451, 8462, 8472, and 8473.
A percent or confidence interval value of 0.00 represents a value that is below 0.005.
All Races Whites Blacks Site Percent ( 95% C.I. ) Percent ( 95% C.I. ) Percent ( 95% C.I. )
All Sites 38.00 (37.88, 38.12 ) 38.80 (38.67, 38.94 ) 33.78 (33.44, 34.12 )Invasive and In Situ 41.31 (41.19, 41.43 ) 42.18 (42.04, 42.31 ) 36.05 (35.70, 36.40 )
Oral Cavity and Pharynx 0.68 ( 0.66, 0.69 ) 0.70 ( 0.68, 0.72 ) 0.48 ( 0.45, 0.53 )Esophagus 0.23 ( 0.22, 0.24 ) 0.23 ( 0.22, 0.24 ) 0.28 ( 0.25, 0.32 )Stomach 0.67 ( 0.65, 0.68 ) 0.56 ( 0.54, 0.57 ) 0.96 ( 0.90, 1.03 )Colon and Rectum 4.65 ( 4.60, 4.69 ) 4.56 ( 4.51, 4.61 ) 4.90 ( 4.77, 5.03 )Invasive and In Situ 4.82 ( 4.78, 4.86 ) 4.72 ( 4.67, 4.77 ) 5.14 ( 5.01, 5.28 )
Liver and Intrahepatic Bile Duct 0.51 ( 0.50, 0.52 ) 0.44 ( 0.43, 0.45 ) 0.49 ( 0.45, 0.53 )Pancreas 1.48 ( 1.46, 1.51 ) 1.45 ( 1.43, 1.48 ) 1.64 ( 1.56, 1.72 )Larynx 0.14 ( 0.13, 0.14 ) 0.14 ( 0.13, 0.15 ) 0.17 ( 0.15, 0.20 )Invasive and In Situ 0.14 ( 0.14, 0.15 ) 0.15 ( 0.14, 0.16 ) 0.18 ( 0.16, 0.21 )
Lung and Bronchus 6.26 ( 6.21, 6.31 ) 6.56 ( 6.51, 6.62 ) 5.46 ( 5.32, 5.60 )Melanoma of the Skin 1.60 ( 1.58, 1.62 ) 1.89 ( 1.86, 1.92 ) 0.09 ( 0.07, 0.11 )Invasive and In Situ 2.68 ( 2.65, 2.70 ) 3.09 ( 3.05, 3.12 ) 0.12 ( 0.10, 0.14 )
Breast 12.29 (12.23, 12.36 ) 12.68 (12.61, 12.75 ) 10.82 (10.64, 11.01 )Invasive and In Situ 14.76 (14.70, 14.83 ) 15.18 (15.10, 15.26 ) 13.00 (12.81, 13.20 )
Cervix Uteri 0.66 ( 0.65, 0.68 ) 0.65 ( 0.63, 0.66 ) 0.83 ( 0.78, 0.88 )Corpus and Uterus, NOS 2.69 ( 2.66, 2.72 ) 2.78 ( 2.74, 2.81 ) 2.34 ( 2.26, 2.43 )Invasive and In Situ 2.71 ( 2.68, 2.74 ) 2.80 ( 2.77, 2.83 ) 2.37 ( 2.29, 2.46 )
Ovarya 1.37 ( 1.35, 1.39 ) 1.45 ( 1.43, 1.48 ) 1.00 ( 0.94, 1.06 )Urinary Bladder (Invasive and In Situ) 1.15 ( 1.13, 1.17 ) 1.23 ( 1.20, 1.25 ) 0.80 ( 0.74, 0.86 )Kidney and Renal Pelvis 1.20 ( 1.18, 1.22 ) 1.23 ( 1.21, 1.25 ) 1.27 ( 1.21, 1.34 )Brain and Other Nervous System 0.55 ( 0.54, 0.57 ) 0.61 ( 0.59, 0.62 ) 0.33 ( 0.30, 0.37 )Thyroid 1.61 ( 1.59, 1.63 ) 1.71 ( 1.68, 1.73 ) 0.92 ( 0.87, 0.97 )Hodgkin Lymphoma 0.20 ( 0.20, 0.21 ) 0.22 ( 0.21, 0.23 ) 0.18 ( 0.16, 0.21 )Non-Hodgkin Lymphoma 1.93 ( 1.91, 1.96 ) 2.04 ( 2.01, 2.07 ) 1.15 ( 1.09, 1.21 )Myeloma 0.61 ( 0.59, 0.62 ) 0.54 ( 0.53, 0.56 ) 1.14 ( 1.07, 1.20 )Leukemia 1.17 ( 1.15, 1.19 ) 1.22 ( 1.19, 1.24 ) 0.83 ( 0.78, 0.89 )Acute Lymphocytic Leukemia 0.11 ( 0.11, 0.12 ) 0.13 ( 0.12, 0.13 ) 0.06 ( 0.05, 0.08 )Chronic Lymphocytic Leukemia 0.41 ( 0.40, 0.43 ) 0.44 ( 0.42, 0.45 ) 0.24 ( 0.21, 0.28 )Acute Myeloid Leukemia 0.37 ( 0.35, 0.38 ) 0.37 ( 0.36, 0.38 ) 0.28 ( 0.25, 0.32 )Chronic Myeloid Leukemia 0.14 ( 0.14, 0.15 ) 0.14 ( 0.14, 0.15 ) 0.13 ( 0.11, 0.15 )
Kaposi Sarcoma 0.01 ( 0.01, 0.01 ) 0.01 ( 0.01, 0.01 ) 0.01 ( 0.01, 0.03 )Mesothelioma 0.05 ( 0.05, 0.06 ) 0.06 ( 0.05, 0.06 ) 0.03 ( 0.02, 0.04 )
Table 1.17
Lifetime Risk (Percent) of Being Diagnosed with Cancer by Site and Race/Ethnicity
Females, 18 SEER Areas, 2008-2010

SEE
R C
ancer Statistics Review
1975-2010N
ational Cancer Institute
Devcan Version 6.7.0, June 2013, National Cancer Institute (http://surveillance.cancer.gov/devcan/).Source: SEER 18 areas (San Francisco, Connecticut, Detroit, Hawaii, Iowa, New Mexico, Seattle, Utah, Atlanta, San Jose-Monterey,
Los Angeles, Alaska Native Registry, Rural Georgia, California excluding SF/SJM/LA, Kentucky, Louisiana, New Jersey,and Georgia excluding ATL/RG).
Note: Invasive cancer only unless specified otherwise.a Underlying incidence data for American Indian/Alaska Native are based on the CHSDA(Contract Health Service Delivery Area)
counties.b Hispanic is not mutually exclusive from whites, blacks, Asian Pacific Islanders, and American Indians/Alaska Natives.
Underlying incidence data for Hispanics are based on NHIA and exclude cases from the Alaska Native Registry.c Ovary excludes borderline cases or histologies 8442, 8451, 8462, 8472, and 8473.
A percent or confidence interval value of 0.00 represents a value that is below 0.005.
Asian/Pacific American Indian/Islanders Alaska Nativesa Hispanicsb
Site Percent ( 95% C.I. ) Percent ( 95% C.I. ) Percent ( 95% C.I. )
All Sites 33.59 (33.11, 34.08 ) 28.80 (27.19, 30.59 ) 35.25 (34.83, 35.69 )Invasive and In Situ 36.00 (35.51, 36.50 ) 29.83 (28.21, 31.63 ) 37.33 (36.90, 37.78 )
Oral Cavity and Pharynx 0.59 ( 0.53, 0.67 ) 0.47 ( 0.25, 0.95 ) 0.55 ( 0.49, 0.62 )Esophagus 0.22 ( 0.18, 0.28 ) 0.22 ( 0.11, 0.61 ) 0.15 ( 0.12, 0.19 )Stomach 1.59 ( 1.47, 1.72 ) 0.84 ( 0.60, 1.31 ) 1.24 ( 1.15, 1.33 )Colon and Rectum 4.87 ( 4.68, 5.08 ) 3.95 ( 3.35, 4.74 ) 4.29 ( 4.13, 4.46 )Invasive and In Situ 5.05 ( 4.85, 5.26 ) 4.08 ( 3.47, 4.87 ) 4.47 ( 4.30, 4.64 )
Liver and Intrahepatic Bile Duct 1.31 ( 1.21, 1.42 ) 0.86 ( 0.63, 1.31 ) 1.04 ( 0.96, 1.13 )Pancreas 1.66 ( 1.54, 1.80 ) 1.24 ( 0.90, 1.81 ) 1.78 ( 1.67, 1.90 )Larynx 0.05 ( 0.03, 0.09 ) 0.06 ( 0.02, 0.44 ) 0.07 ( 0.05, 0.10 )Invasive and In Situ 0.05 ( 0.03, 0.09 ) 0.08 ( 0.03, 0.46 ) 0.08 ( 0.06, 0.11 )
Lung and Bronchus 4.42 ( 4.24, 4.61 ) 4.21 ( 3.61, 5.01 ) 3.90 ( 3.75, 4.07 )Melanoma of the Skin 0.13 ( 0.10, 0.18 ) 0.31 ( 0.19, 0.70 ) 0.50 ( 0.45, 0.56 )Invasive and In Situ 0.18 ( 0.15, 0.23 ) 0.41 ( 0.27, 0.81 ) 0.77 ( 0.71, 0.84 )
Breast 9.87 ( 9.65, 10.10 ) 7.38 ( 6.71, 8.22 ) 9.73 ( 9.53, 9.94 )Invasive and In Situ 12.39 (12.16, 12.64 ) 8.22 ( 7.53, 9.08 ) 11.49 (11.28, 11.71 )
Cervix Uteri 0.66 ( 0.60, 0.72 ) 0.58 ( 0.43, 0.97 ) 0.98 ( 0.93, 1.05 )Corpus and Uterus, NOS 2.12 ( 2.03, 2.23 ) 2.03 ( 1.71, 2.54 ) 2.27 ( 2.18, 2.37 )Invasive and In Situ 2.14 ( 2.04, 2.24 ) 2.05 ( 1.73, 2.56 ) 2.29 ( 2.20, 2.39 )
Ovaryc 1.08 ( 1.00, 1.17 ) 1.21 ( 0.88, 1.76 ) 1.37 ( 1.29, 1.46 )Urinary Bladder (Invasive and In Situ) 0.76 ( 0.67, 0.86 ) 0.43 ( 0.23, 0.90 ) 0.80 ( 0.72, 0.88 )Kidney and Renal Pelvis 0.74 ( 0.67, 0.82 ) 1.61 ( 1.28, 2.13 ) 1.37 ( 1.29, 1.45 )Brain and Other Nervous System 0.34 ( 0.29, 0.39 ) 0.36 ( 0.16, 0.84 ) 0.53 ( 0.48, 0.59 )Thyroid 1.76 ( 1.68, 1.86 ) 1.15 ( 0.86, 1.66 ) 1.58 ( 1.52, 1.66 )Hodgkin Lymphoma 0.10 ( 0.08, 0.14 ) 0.16 ( 0.05, 0.57 ) 0.19 ( 0.17, 0.23 )Non-Hodgkin Lymphoma 1.65 ( 1.54, 1.78 ) 1.21 ( 0.88, 1.76 ) 2.11 ( 2.01, 2.23 )Myeloma 0.46 ( 0.41, 0.53 ) 0.44 ( 0.27, 0.87 ) 0.63 ( 0.58, 0.70 )Leukemia 0.82 ( 0.74, 0.91 ) 0.74 ( 0.52, 1.20 ) 1.04 ( 0.97, 1.12 )Acute Lymphocytic Leukemia 0.08 ( 0.07, 0.12 ) 0.09 ( 0.04, 0.46 ) 0.19 ( 0.17, 0.21 )Chronic Lymphocytic Leukemia 0.10 ( 0.08, 0.14 ) 0.10 ( 0.04, 0.48 ) 0.24 ( 0.20, 0.28 )Acute Myeloid Leukemia 0.39 ( 0.34, 0.45 ) 0.34 ( 0.18, 0.77 ) 0.35 ( 0.31, 0.41 )Chronic Myeloid Leukemia 0.10 ( 0.07, 0.15 ) 0.13 ( 0.07, 0.51 ) 0.14 ( 0.11, 0.18 )
Kaposi Sarcoma 0.00 ( 0.00, 0.04 ) 0.01 ( 0.00, 0.40 ) 0.04 ( 0.02, 0.07 )Mesothelioma 0.03 ( 0.01, 0.06 ) 0.08 ( 0.01, 0.48 ) 0.05 ( 0.04, 0.08 )
Table 1.17 - continued
Lifetime Risk (Percent) of Being Diagnosed with Cancer by Site and Race/Ethnicity
Females, 18 SEER Areas, 2008-2010

SEE
R C
ancer Statistics Review
1975-2010N
ational Cancer Institute
Devcan Version 6.7.0, June 2013, National Cancer Institute (http://surveillance.cancer.gov/devcan/).Source: NCHS public use data file for the total US.
A percent or confidence interval value of 0.00 represents a value that is below 0.005.
All Races Whites Blacks Site Percent ( 95% C.I. ) Percent ( 95% C.I. ) Percent ( 95% C.I. )
All Sites 20.93 (20.90, 20.96 ) 21.05 (21.02, 21.09 ) 21.11 (21.02, 21.21 )
Oral Cavity and Pharynx 0.28 ( 0.27, 0.28 ) 0.28 ( 0.27, 0.28 ) 0.27 ( 0.26, 0.29 )
Esophagus 0.49 ( 0.48, 0.49 ) 0.51 ( 0.50, 0.51 ) 0.42 ( 0.40, 0.43 )
Stomach 0.41 ( 0.41, 0.42 ) 0.36 ( 0.36, 0.37 ) 0.68 ( 0.66, 0.70 )
Colon and Rectum 1.98 ( 1.97, 1.99 ) 1.94 ( 1.93, 1.95 ) 2.31 ( 2.27, 2.34 )
Liver and Intrahepatic Bile Duct 0.65 ( 0.65, 0.66 ) 0.61 ( 0.61, 0.62 ) 0.74 ( 0.72, 0.76 )
Pancreas 1.33 ( 1.32, 1.34 ) 1.32 ( 1.32, 1.33 ) 1.42 ( 1.39, 1.44 )
Larynx 0.13 ( 0.12, 0.13 ) 0.12 ( 0.12, 0.12 ) 0.19 ( 0.18, 0.20 )
Lung and Bronchus 5.75 ( 5.73, 5.76 ) 5.88 ( 5.86, 5.90 ) 5.25 ( 5.20, 5.30 )
Melanoma of the Skin 0.31 ( 0.31, 0.32 ) 0.36 ( 0.35, 0.36 ) 0.04 ( 0.04, 0.05 )
Breast 1.44 ( 1.44, 1.45 ) 1.42 ( 1.41, 1.43 ) 1.77 ( 1.74, 1.80 )
Urinary Bladder 0.59 ( 0.59, 0.60 ) 0.62 ( 0.61, 0.63 ) 0.40 ( 0.38, 0.41 )
Kidney and Renal Pelvis 0.47 ( 0.47, 0.47 ) 0.48 ( 0.48, 0.49 ) 0.39 ( 0.38, 0.40 )
Brain and Other Nervous System 0.45 ( 0.44, 0.45 ) 0.49 ( 0.48, 0.49 ) 0.23 ( 0.22, 0.25 )
Thyroid 0.06 ( 0.06, 0.07 ) 0.06 ( 0.06, 0.06 ) 0.05 ( 0.05, 0.06 )
Hodgkin Lymphoma 0.04 ( 0.04, 0.04 ) 0.04 ( 0.04, 0.04 ) 0.03 ( 0.03, 0.03 )
Non-Hodgkin Lymphoma 0.78 ( 0.78, 0.79 ) 0.82 ( 0.82, 0.83 ) 0.44 ( 0.42, 0.45 )
Myeloma 0.41 ( 0.41, 0.41 ) 0.39 ( 0.38, 0.39 ) 0.65 ( 0.63, 0.67 )
Leukemia 0.86 ( 0.85, 0.87 ) 0.90 ( 0.89, 0.90 ) 0.62 ( 0.60, 0.64 )
Acute Lymphocytic Leukemia 0.04 ( 0.04, 0.04 ) 0.05 ( 0.04, 0.05 ) 0.03 ( 0.02, 0.03 )
Chronic Lymphocytic Leukemia 0.19 ( 0.19, 0.19 ) 0.20 ( 0.19, 0.20 ) 0.14 ( 0.13, 0.15 )
Acute Myeloid Leukemia 0.33 ( 0.32, 0.33 ) 0.34 ( 0.34, 0.35 ) 0.21 ( 0.20, 0.22 )
Chronic Myeloid Leukemia 0.04 ( 0.04, 0.04 ) 0.04 ( 0.04, 0.04 ) 0.03 ( 0.03, 0.04 )
Table 1.18
Lifetime Risk (Percent) of Dying from Cancer by Site and Race/Ethnicity
Both Sexes, Total U.S., 2008-2010

SEE
R C
ancer Statistics Review
1975-2010N
ational Cancer Institute
Devcan Version 6.7.0, June 2013, National Cancer Institute (http://surveillance.cancer.gov/devcan/).Source: NCHS public use data file for the total US.a Underlying mortality data for American Indian/Alaska Native are based on the CHSDA (Contract Health Service Delivery Area)
counties.b Hispanic is not mutually exclusive from whites, blacks, Asian Pacific Islanders, and American Indians/Alaska Natives.
Underlying mortality data for Hispanics exclude deaths from the District of Columbia, Minnesota, New Hampshire, North Dakotaand South Carolina.A percent or confidence interval value of 0.00 represents a value that is below 0.005.
Asian/Pacific American Indian/Islanders Alaska Nativesa Hispanicsb
Site Percent ( 95% C.I. ) Percent ( 95% C.I. ) Percent ( 95% C.I. )
All Sites 18.71 (18.47, 18.96 ) 17.42 (16.92, 17.93 ) 17.66 (17.51, 17.80 )
Oral Cavity and Pharynx 0.30 ( 0.27, 0.34 ) 0.22 ( 0.17, 0.30 ) 0.21 ( 0.19, 0.23 )
Esophagus 0.29 ( 0.26, 0.32 ) 0.39 ( 0.32, 0.49 ) 0.33 ( 0.31, 0.35 )
Stomach 1.19 ( 1.12, 1.26 ) 0.54 ( 0.45, 0.65 ) 0.81 ( 0.78, 0.85 )
Colon and Rectum 2.10 ( 2.01, 2.20 ) 1.95 ( 1.77, 2.15 ) 1.90 ( 1.85, 1.95 )
Liver and Intrahepatic Bile Duct 1.53 ( 1.46, 1.60 ) 0.98 ( 0.86, 1.12 ) 1.18 ( 1.15, 1.22 )
Pancreas 1.38 ( 1.31, 1.46 ) 0.94 ( 0.82, 1.09 ) 1.30 ( 1.26, 1.34 )
Larynx 0.06 ( 0.05, 0.08 ) 0.12 ( 0.08, 0.20 ) 0.12 ( 0.11, 0.13 )
Lung and Bronchus 4.30 ( 4.18, 4.42 ) 4.34 ( 4.10, 4.62 ) 3.05 ( 2.99, 3.11 )
Melanoma of the Skin 0.05 ( 0.04, 0.07 ) 0.10 ( 0.07, 0.17 ) 0.11 ( 0.10, 0.12 )
Breast 0.95 ( 0.90, 1.02 ) 0.91 ( 0.79, 1.05 ) 1.11 ( 1.07, 1.15 )
Urinary Bladder 0.39 ( 0.35, 0.44 ) 0.31 ( 0.24, 0.42 ) 0.40 ( 0.38, 0.43 )
Kidney and Renal Pelvis 0.33 ( 0.29, 0.36 ) 0.75 ( 0.64, 0.88 ) 0.49 ( 0.47, 0.51 )
Brain and Other Nervous System 0.27 ( 0.25, 0.31 ) 0.25 ( 0.20, 0.33 ) 0.33 ( 0.32, 0.35 )
Thyroid 0.13 ( 0.11, 0.16 ) 0.06 ( 0.02, 0.13 ) 0.09 ( 0.08, 0.10 )
Hodgkin Lymphoma 0.03 ( 0.02, 0.04 ) 0.02 ( 0.01, 0.08 ) 0.05 ( 0.04, 0.06 )
Non-Hodgkin Lymphoma 0.75 ( 0.70, 0.81 ) 0.51 ( 0.42, 0.62 ) 0.77 ( 0.74, 0.80 )
Myeloma 0.28 ( 0.26, 0.31 ) 0.31 ( 0.24, 0.40 ) 0.40 ( 0.37, 0.42 )
Leukemia 0.64 ( 0.59, 0.69 ) 0.53 ( 0.44, 0.66 ) 0.68 ( 0.65, 0.71 )
Acute Lymphocytic Leukemia 0.03 ( 0.03, 0.05 ) 0.03 ( 0.02, 0.08 ) 0.07 ( 0.06, 0.08 )
Chronic Lymphocytic Leukemia 0.06 ( 0.04, 0.08 ) 0.11 ( 0.06, 0.20 ) 0.09 ( 0.08, 0.11 )
Acute Myeloid Leukemia 0.31 ( 0.28, 0.34 ) 0.21 ( 0.16, 0.30 ) 0.25 ( 0.24, 0.27 )
Chronic Myeloid Leukemia 0.03 ( 0.02, 0.05 ) 0.03 ( 0.02, 0.09 ) 0.03 ( 0.03, 0.04 )
Table 1.18 - continued
Lifetime Risk (Percent) of Dying from Cancer by Site and Race/Ethnicity
Both Sexes, Total U.S., 2008-2010

SEE
R C
ancer Statistics Review
1975-2010N
ational Cancer Institute
Devcan Version 6.7.0, June 2013, National Cancer Institute (http://surveillance.cancer.gov/devcan/).Source: NCHS public use data file for the total US.
A percent or confidence interval value of 0.00 represents a value that is below 0.005.
All Races Whites Blacks Site Percent ( 95% C.I. ) Percent ( 95% C.I. ) Percent ( 95% C.I. )
All Sites 22.94 (22.89, 22.98 ) 22.99 (22.94, 23.04 ) 23.65 (23.50, 23.79 )
Oral Cavity and Pharynx 0.38 ( 0.37, 0.39 ) 0.37 ( 0.37, 0.38 ) 0.42 ( 0.40, 0.44 )
Esophagus 0.79 ( 0.78, 0.79 ) 0.82 ( 0.81, 0.83 ) 0.64 ( 0.61, 0.66 )
Stomach 0.50 ( 0.49, 0.51 ) 0.44 ( 0.43, 0.45 ) 0.83 ( 0.80, 0.87 )
Colon and Rectum 2.07 ( 2.06, 2.09 ) 2.04 ( 2.02, 2.05 ) 2.41 ( 2.36, 2.47 )
Liver and Intrahepatic Bile Duct 0.87 ( 0.86, 0.88 ) 0.81 ( 0.80, 0.82 ) 1.04 ( 1.01, 1.07 )
Pancreas 1.34 ( 1.33, 1.35 ) 1.35 ( 1.33, 1.36 ) 1.33 ( 1.29, 1.36 )
Larynx 0.21 ( 0.20, 0.21 ) 0.20 ( 0.19, 0.20 ) 0.32 ( 0.30, 0.34 )
Lung and Bronchus 6.61 ( 6.58, 6.63 ) 6.67 ( 6.65, 6.70 ) 6.59 ( 6.50, 6.67 )
Melanoma of the Skin 0.43 ( 0.42, 0.43 ) 0.49 ( 0.48, 0.50 ) 0.04 ( 0.04, 0.05 )
Breast 0.03 ( 0.03, 0.03 ) 0.03 ( 0.03, 0.03 ) 0.05 ( 0.04, 0.06 )
Prostate 2.71 ( 2.69, 2.73 ) 2.53 ( 2.51, 2.55 ) 4.55 ( 4.47, 4.63 )
Testis 0.02 ( 0.02, 0.02 ) 0.02 ( 0.02, 0.02 ) 0.01 ( 0.01, 0.01 )
Urinary Bladder 0.90 ( 0.89, 0.91 ) 0.95 ( 0.94, 0.96 ) 0.48 ( 0.46, 0.51 )
Kidney and Renal Pelvis 0.61 ( 0.60, 0.62 ) 0.63 ( 0.62, 0.64 ) 0.48 ( 0.46, 0.50 )
Brain and Other Nervous System 0.50 ( 0.50, 0.51 ) 0.55 ( 0.54, 0.55 ) 0.25 ( 0.24, 0.27 )
Thyroid 0.05 ( 0.05, 0.06 ) 0.06 ( 0.05, 0.06 ) 0.04 ( 0.03, 0.04 )
Hodgkin Lymphoma 0.04 ( 0.04, 0.05 ) 0.05 ( 0.04, 0.05 ) 0.03 ( 0.03, 0.04 )
Non-Hodgkin Lymphoma 0.87 ( 0.86, 0.88 ) 0.92 ( 0.91, 0.93 ) 0.49 ( 0.47, 0.51 )
Myeloma 0.46 ( 0.45, 0.47 ) 0.44 ( 0.43, 0.45 ) 0.68 ( 0.66, 0.71 )
Leukemia 1.02 ( 1.01, 1.03 ) 1.07 ( 1.05, 1.08 ) 0.70 ( 0.67, 0.73 )
Acute Lymphocytic Leukemia 0.05 ( 0.05, 0.05 ) 0.05 ( 0.05, 0.05 ) 0.03 ( 0.02, 0.03 )
Chronic Lymphocytic Leukemia 0.24 ( 0.23, 0.24 ) 0.25 ( 0.24, 0.25 ) 0.18 ( 0.17, 0.20 )
Acute Myeloid Leukemia 0.39 ( 0.38, 0.39 ) 0.41 ( 0.40, 0.42 ) 0.23 ( 0.21, 0.24 )
Chronic Myeloid Leukemia 0.05 ( 0.04, 0.05 ) 0.05 ( 0.04, 0.05 ) 0.04 ( 0.03, 0.05 )
Table 1.19
Lifetime Risk (Percent) of Dying from Cancer by Site and Race/Ethnicity
Males, Total U.S., 2008-2010

SEE
R C
ancer Statistics Review
1975-2010N
ational Cancer Institute
Devcan Version 6.7.0, June 2013, National Cancer Institute (http://surveillance.cancer.gov/devcan/).Source: NCHS public use data file for the total US.a Underlying mortality data for American Indian/Alaska Native are based on the CHSDA (Contract Health Service Delivery Area)
counties.b Hispanic is not mutually exclusive from whites, blacks, Asian Pacific Islanders, and American Indians/Alaska Natives.
Underlying mortality data for Hispanics exclude deaths from the District of Columbia, Minnesota, New Hampshire, North Dakotaand South Carolina.A percent or confidence interval value of 0.00 represents a value that is below 0.005.
Asian/Pacific American Indian/Islanders Alaska Nativesa Hispanicsb
Site Percent ( 95% C.I. ) Percent ( 95% C.I. ) Percent ( 95% C.I. )
All Sites 21.16 (20.79, 21.54 ) 18.65 (17.88, 19.47 ) 20.26 (20.03, 20.50 )
Oral Cavity and Pharynx 0.40 ( 0.35, 0.46 ) 0.30 ( 0.22, 0.50 ) 0.29 ( 0.27, 0.32 )
Esophagus 0.44 ( 0.39, 0.50 ) 0.61 ( 0.48, 0.85 ) 0.56 ( 0.52, 0.60 )
Stomach 1.38 ( 1.28, 1.50 ) 0.64 ( 0.52, 0.87 ) 0.96 ( 0.91, 1.02 )
Colon and Rectum 2.19 ( 2.06, 2.34 ) 1.86 ( 1.60, 2.20 ) 2.17 ( 2.08, 2.25 )
Liver and Intrahepatic Bile Duct 1.98 ( 1.88, 2.09 ) 1.27 ( 1.08, 1.54 ) 1.50 ( 1.44, 1.56 )
Pancreas 1.32 ( 1.23, 1.43 ) 0.90 ( 0.74, 1.15 ) 1.27 ( 1.21, 1.34 )
Larynx 0.12 ( 0.09, 0.16 ) 0.24 ( 0.13, 0.47 ) 0.22 ( 0.20, 0.25 )
Lung and Bronchus 5.53 ( 5.33, 5.73 ) 4.76 ( 4.40, 5.21 ) 4.03 ( 3.93, 4.14 )
Melanoma of the Skin 0.06 ( 0.04, 0.09 ) 0.14 ( 0.08, 0.33 ) 0.13 ( 0.11, 0.16 )
Breast 0.03 ( 0.01, 0.06 ) 0.02 ( 0.00, 0.20 ) 0.03 ( 0.02, 0.05 )
Prostate 2.20 ( 2.04, 2.37 ) 2.28 ( 1.93, 2.72 ) 3.14 ( 3.02, 3.27 )
Testis 0.01 ( 0.00, 0.04 ) 0.03 ( 0.01, 0.20 ) 0.02 ( 0.02, 0.04 )
Urinary Bladder 0.60 ( 0.52, 0.70 ) 0.47 ( 0.32, 0.73 ) 0.61 ( 0.56, 0.66 )
Kidney and Renal Pelvis 0.47 ( 0.41, 0.54 ) 0.87 ( 0.72, 1.11 ) 0.63 ( 0.59, 0.67 )
Brain and Other Nervous System 0.32 ( 0.27, 0.37 ) 0.27 ( 0.20, 0.47 ) 0.37 ( 0.34, 0.40 )
Thyroid 0.06 ( 0.05, 0.10 ) 0.03 ( 0.01, 0.21 ) 0.06 ( 0.05, 0.07 )
Hodgkin Lymphoma 0.04 ( 0.02, 0.07 ) 0.03 ( 0.01, 0.21 ) 0.06 ( 0.05, 0.08 )
Non-Hodgkin Lymphoma 0.82 ( 0.75, 0.91 ) 0.48 ( 0.37, 0.69 ) 0.83 ( 0.78, 0.88 )
Myeloma 0.35 ( 0.31, 0.41 ) 0.34 ( 0.24, 0.54 ) 0.46 ( 0.42, 0.50 )
Leukemia 0.72 ( 0.66, 0.80 ) 0.77 ( 0.58, 1.06 ) 0.79 ( 0.74, 0.84 )
Acute Lymphocytic Leukemia 0.04 ( 0.03, 0.07 ) 0.02 ( 0.01, 0.20 ) 0.07 ( 0.06, 0.09 )
Chronic Lymphocytic Leukemia 0.08 ( 0.06, 0.12 ) 0.18 ( 0.08, 0.42 ) 0.10 ( 0.08, 0.13 )
Acute Myeloid Leukemia 0.35 ( 0.31, 0.40 ) 0.28 ( 0.20, 0.49 ) 0.30 ( 0.27, 0.33 )
Chronic Myeloid Leukemia 0.03 ( 0.02, 0.06 ) 0.05 ( 0.02, 0.23 ) 0.05 ( 0.03, 0.07 )
Table 1.19 - continued
Lifetime Risk (Percent) of Dying from Cancer by Site and Race/Ethnicity
Males, Total U.S., 2008-2010

SEE
R C
ancer Statistics Review
1975-2010N
ational Cancer Institute
Devcan Version 6.7.0, June 2013, National Cancer Institute (http://surveillance.cancer.gov/devcan/).Source: NCHS public use data file for the total US.
A percent or confidence interval value of 0.00 represents a value that is below 0.005.
All Races Whites Blacks Site Percent ( 95% C.I. ) Percent ( 95% C.I. ) Percent ( 95% C.I. )
All Sites 19.34 (19.30, 19.38 ) 19.52 (19.48, 19.57 ) 19.24 (19.12, 19.36 )
Oral Cavity and Pharynx 0.18 ( 0.18, 0.19 ) 0.19 ( 0.18, 0.19 ) 0.15 ( 0.14, 0.16 )
Esophagus 0.21 ( 0.21, 0.22 ) 0.21 ( 0.21, 0.22 ) 0.23 ( 0.21, 0.24 )
Stomach 0.34 ( 0.33, 0.34 ) 0.29 ( 0.29, 0.30 ) 0.56 ( 0.54, 0.59 )
Colon and Rectum 1.90 ( 1.88, 1.91 ) 1.86 ( 1.84, 1.87 ) 2.23 ( 2.18, 2.27 )
Liver and Intrahepatic Bile Duct 0.45 ( 0.44, 0.46 ) 0.43 ( 0.42, 0.43 ) 0.48 ( 0.46, 0.50 )
Pancreas 1.32 ( 1.31, 1.33 ) 1.30 ( 1.29, 1.31 ) 1.49 ( 1.45, 1.53 )
Larynx 0.05 ( 0.05, 0.05 ) 0.05 ( 0.05, 0.05 ) 0.07 ( 0.06, 0.08 )
Lung and Bronchus 4.99 ( 4.97, 5.01 ) 5.19 ( 5.17, 5.21 ) 4.14 ( 4.08, 4.20 )
Melanoma of the Skin 0.21 ( 0.20, 0.21 ) 0.24 ( 0.23, 0.24 ) 0.04 ( 0.04, 0.05 )
Breast 2.74 ( 2.72, 2.75 ) 2.71 ( 2.69, 2.73 ) 3.25 ( 3.20, 3.30 )
Cervix Uteri 0.23 ( 0.22, 0.23 ) 0.21 ( 0.20, 0.21 ) 0.39 ( 0.37, 0.41 )
Corpus and Uterus, NOS 0.55 ( 0.55, 0.56 ) 0.52 ( 0.52, 0.53 ) 0.84 ( 0.82, 0.87 )
Ovary 0.99 ( 0.98, 1.00 ) 1.04 ( 1.03, 1.05 ) 0.75 ( 0.72, 0.77 )
Urinary Bladder 0.34 ( 0.33, 0.35 ) 0.34 ( 0.34, 0.35 ) 0.34 ( 0.32, 0.36 )
Kidney and Renal Pelvis 0.34 ( 0.34, 0.35 ) 0.35 ( 0.34, 0.36 ) 0.31 ( 0.29, 0.33 )
Brain and Other Nervous System 0.40 ( 0.39, 0.40 ) 0.43 ( 0.43, 0.44 ) 0.22 ( 0.21, 0.24 )
Thyroid 0.07 ( 0.07, 0.07 ) 0.07 ( 0.07, 0.07 ) 0.07 ( 0.06, 0.08 )
Hodgkin Lymphoma 0.03 ( 0.03, 0.04 ) 0.04 ( 0.04, 0.04 ) 0.03 ( 0.02, 0.03 )
Non-Hodgkin Lymphoma 0.70 ( 0.70, 0.71 ) 0.74 ( 0.73, 0.75 ) 0.40 ( 0.38, 0.42 )
Myeloma 0.37 ( 0.36, 0.37 ) 0.34 ( 0.33, 0.35 ) 0.63 ( 0.61, 0.66 )
Leukemia 0.72 ( 0.71, 0.73 ) 0.75 ( 0.74, 0.76 ) 0.56 ( 0.53, 0.58 )
Acute Lymphocytic Leukemia 0.04 ( 0.04, 0.04 ) 0.04 ( 0.04, 0.04 ) 0.02 ( 0.02, 0.03 )
Chronic Lymphocytic Leukemia 0.15 ( 0.15, 0.16 ) 0.16 ( 0.15, 0.16 ) 0.11 ( 0.10, 0.13 )
Acute Myeloid Leukemia 0.28 ( 0.27, 0.28 ) 0.29 ( 0.28, 0.29 ) 0.20 ( 0.19, 0.21 )
Chronic Myeloid Leukemia 0.03 ( 0.03, 0.03 ) 0.03 ( 0.03, 0.04 ) 0.02 ( 0.02, 0.03 )
Table 1.20
Lifetime Risk (Percent) of Dying from Cancer by Site and Race/Ethnicity
Females, Total U.S., 2008-2010

SEE
R C
ancer Statistics Review
1975-2010N
ational Cancer Institute
Devcan Version 6.7.0, June 2013, National Cancer Institute (http://surveillance.cancer.gov/devcan/).Source: NCHS public use data file for the total US.a Underlying mortality data for American Indian/Alaska Native are based on the CHSDA (Contract Health Service Delivery Area)
counties.b Hispanic is not mutually exclusive from whites, blacks, Asian Pacific Islanders, and American Indians/Alaska Natives.
Underlying mortality data for Hispanics exclude deaths from the District of Columbia, Minnesota, New Hampshire, North Dakotaand South Carolina.A percent or confidence interval value of 0.00 represents a value that is below 0.005.
Asian/Pacific American Indian/Islanders Alaska Nativesa Hispanicsb
Site Percent ( 95% C.I. ) Percent ( 95% C.I. ) Percent ( 95% C.I. )
All Sites 16.77 (16.45, 17.09 ) 16.52 (15.85, 17.23 ) 15.73 (15.54, 15.91 )
Oral Cavity and Pharynx 0.22 ( 0.18, 0.28 ) 0.14 ( 0.09, 0.26 ) 0.13 ( 0.11, 0.16 )
Esophagus 0.16 ( 0.13, 0.20 ) 0.18 ( 0.11, 0.31 ) 0.14 ( 0.12, 0.17 )
Stomach 1.03 ( 0.93, 1.14 ) 0.43 ( 0.32, 0.59 ) 0.69 ( 0.65, 0.74 )
Colon and Rectum 2.02 ( 1.89, 2.17 ) 2.05 ( 1.79, 2.35 ) 1.69 ( 1.62, 1.76 )
Liver and Intrahepatic Bile Duct 1.15 ( 1.06, 1.24 ) 0.71 ( 0.57, 0.90 ) 0.90 ( 0.85, 0.95 )
Pancreas 1.43 ( 1.33, 1.54 ) 0.96 ( 0.79, 1.19 ) 1.33 ( 1.27, 1.39 )
Larynx 0.02 ( 0.01, 0.04 ) 0.03 ( 0.01, 0.13 ) 0.03 ( 0.02, 0.04 )
Lung and Bronchus 3.31 ( 3.17, 3.46 ) 3.96 ( 3.63, 4.34 ) 2.24 ( 2.17, 2.32 )
Melanoma of the Skin 0.05 ( 0.03, 0.08 ) 0.06 ( 0.03, 0.16 ) 0.09 ( 0.08, 0.11 )
Breast 1.73 ( 1.63, 1.84 ) 1.73 ( 1.51, 2.00 ) 2.05 ( 1.99, 2.12 )
Cervix Uteri 0.23 ( 0.20, 0.28 ) 0.38 ( 0.29, 0.53 ) 0.33 ( 0.30, 0.35 )
Corpus and Uterus, NOS 0.45 ( 0.40, 0.51 ) 0.32 ( 0.23, 0.46 ) 0.50 ( 0.47, 0.53 )
Ovary 0.73 ( 0.67, 0.80 ) 0.83 ( 0.68, 1.04 ) 0.82 ( 0.78, 0.87 )
Urinary Bladder 0.23 ( 0.18, 0.29 ) 0.18 ( 0.11, 0.32 ) 0.25 ( 0.22, 0.28 )
Kidney and Renal Pelvis 0.21 ( 0.18, 0.26 ) 0.63 ( 0.49, 0.82 ) 0.37 ( 0.35, 0.41 )
Brain and Other Nervous System 0.24 ( 0.20, 0.28 ) 0.23 ( 0.16, 0.35 ) 0.30 ( 0.28, 0.33 )
Thyroid 0.18 ( 0.15, 0.23 ) 0.07 ( 0.03, 0.20 ) 0.11 ( 0.09, 0.13 )
Hodgkin Lymphoma 0.02 ( 0.01, 0.04 ) 0.01 ( 0.00, 0.10 ) 0.04 ( 0.03, 0.05 )
Non-Hodgkin Lymphoma 0.69 ( 0.62, 0.78 ) 0.53 ( 0.40, 0.71 ) 0.72 ( 0.68, 0.77 )
Myeloma 0.22 ( 0.19, 0.27 ) 0.27 ( 0.19, 0.42 ) 0.35 ( 0.32, 0.38 )
Leukemia 0.58 ( 0.51, 0.65 ) 0.35 ( 0.25, 0.50 ) 0.60 ( 0.56, 0.64 )
Acute Lymphocytic Leukemia 0.03 ( 0.02, 0.05 ) 0.03 ( 0.02, 0.13 ) 0.06 ( 0.06, 0.08 )
Chronic Lymphocytic Leukemia 0.04 ( 0.02, 0.07 ) 0.06 ( 0.02, 0.19 ) 0.09 ( 0.07, 0.11 )
Acute Myeloid Leukemia 0.28 ( 0.24, 0.33 ) 0.15 ( 0.10, 0.26 ) 0.22 ( 0.20, 0.25 )
Chronic Myeloid Leukemia 0.03 ( 0.02, 0.05 ) 0.02 ( 0.00, 0.12 ) 0.03 ( 0.02, 0.04 )
Table 1.20 - continued
Lifetime Risk (Percent) of Dying from Cancer by Site and Race/Ethnicity
Females, Total U.S., 2008-2010

SEE
R C
ancer Statistics Review
1975-2010N
ational Cancer Institute
a US Mortality Files, National Center for Health Statistics, Centers for Disease Control and Prevention. Rates are per 100,000and are age-adjusted to the 2000 US Std Population (19 age groups - Census P25-1130).
b The SEER 18 areas are San Francisco, Connecticut, Detroit, Hawaii, Iowa, New Mexico, Seattle, Utah, Atlanta, San Jose-Monterey,Los Angeles, Alaska Native Registry, Rural Georgia, California excluding SF/SJM/LA, Kentucky, Louisiana, New Jersey andGeorgia excluding ATL/RG.
c Rates for American Indian/Alaska Native (AI/AN) are based on the CHSDA(Contract Health Service Delivery Area) counties.d Asian/Pacific Islander.e Hispanic (Hisp) and White Non-Hispanic (W-NHisp) are not mutually exclusive from whites, blacks, Asian/Pacific Islanders, and
American Indians/Alaska Natives. Mortality data for Hispanics and White Non-Hispanics do not include cases from theDistrict of Columbia, North Dakota, and South Carolina.
- Statistic could not be calculated due to less than 16 cases in the time interval.
Total United Statesa SEER 18 Areasab
Site Total White Black AI/ANc APId Hispe W-NHispe Total White Black AI/ANc APId Hispe W-NHispe
All Sites Both Sexes 176.4 175.8 210.3 160.4 108.8 121.8 179.8 170.9 172.7 210.5 137.6 115.2 123.2 178.4Male 215.3 213.1 276.6 191.0 132.4 152.1 217.3 206.1 206.7 272.7 159.9 140.7 150.7 212.9Female 149.7 149.8 171.2 139.0 92.1 101.2 153.6 146.9 149.2 173.6 121.8 97.4 104.5 154.6
Oral Cavity Both Sexes 2.5 2.4 3.0 2.3 2.0 1.5 2.5 2.5 2.4 3.0 2.2 2.1 1.5 2.6& Pharynx Male 3.8 3.6 5.2 3.4 3.0 2.5 3.7 3.8 3.7 5.2 3.3 3.1 2.4 3.8
Female 1.4 1.4 1.4 1.5 1.2 0.8 1.4 1.4 1.4 1.4 - 1.3 0.8 1.5
Esophagus Both Sexes 4.3 4.4 4.4 3.6 1.8 2.3 4.6 3.9 4.1 4.3 2.8 1.9 2.2 4.3Male 7.6 7.8 7.7 6.1 3.1 4.3 8.1 6.8 7.2 7.3 4.4 3.3 4.1 7.6Female 1.6 1.6 2.1 1.6 0.8 0.8 1.6 1.6 1.5 2.2 1.6 0.9 0.7 1.6
Stomach Both Sexes 3.5 3.1 6.7 5.6 6.6 5.7 2.8 4.1 3.5 7.0 6.5 6.8 6.3 3.0Male 4.9 4.2 9.8 8.1 8.7 7.6 3.9 5.5 4.8 9.9 8.9 8.9 8.4 4.2Female 2.5 2.2 4.7 3.8 5.1 4.4 1.9 3.0 2.5 5.2 4.5 5.4 4.8 2.1
Colon & Both Sexes 16.4 15.9 22.8 16.9 11.2 12.7 16.1 15.9 15.6 22.9 15.9 11.7 12.3 15.9Rectum Male 19.6 19.1 28.7 18.7 13.1 16.1 19.2 19.0 18.6 28.1 18.8 13.9 15.7 18.9
Female 13.9 13.4 19.0 15.4 9.7 10.2 13.6 13.6 13.2 19.5 13.8 10.0 9.7 13.6
Liver & Both Sexes 5.6 5.2 7.4 9.3 9.7 8.5 4.8 6.1 5.4 7.6 9.3 9.8 8.6 4.9Intrahepatic Male 8.3 7.6 11.8 13.2 14.4 12.3 7.1 8.9 7.9 11.9 12.8 14.6 12.2 7.2Bile Duct Female 3.4 3.2 4.1 6.1 6.0 5.4 2.9 3.7 3.4 4.3 6.3 6.0 5.6 3.0
Pancreas Both Sexes 10.9 10.8 13.7 9.2 7.6 8.6 10.9 10.9 10.9 13.9 9.9 8.3 9.2 11.0Male 12.5 12.5 15.3 10.1 8.3 9.6 12.7 12.4 12.5 15.4 10.6 9.1 10.1 12.7Female 9.6 9.4 12.5 8.6 7.1 7.7 9.5 9.6 9.5 12.6 9.2 7.6 8.5 9.7
Larynx Both Sexes 1.1 1.1 2.0 1.0 0.4 0.8 1.1 1.0 1.0 1.7 - 0.5 0.7 1.0Male 2.0 1.9 3.9 2.1 0.8 1.7 1.9 1.8 1.8 3.3 - 0.9 1.5 1.8Female 0.4 0.4 0.7 - 0.1 0.2 0.4 0.4 0.4 0.7 - 0.1 0.2 0.4
Lung & Both Sexes 49.5 50.2 53.5 40.2 25.5 21.3 52.6 45.4 46.6 53.4 29.6 27.0 20.2 50.1Bronchus Male 63.5 63.2 78.5 49.6 35.5 31.3 65.7 57.3 57.4 76.5 36.4 38.0 28.6 61.2
Female 39.2 40.4 37.2 33.1 18.4 14.1 42.7 36.6 38.5 38.1 24.6 19.0 14.2 41.9
Melanoma Both Sexes 2.7 3.1 0.4 1.1 0.4 0.8 3.4 2.6 3.1 0.4 - 0.4 0.8 3.5of the Skin Male 4.1 4.6 0.5 1.7 0.4 1.1 5.0 3.9 4.6 0.6 - 0.5 1.0 5.2
Female 1.7 2.0 0.4 0.8 0.3 0.6 2.1 1.6 2.0 0.3 - 0.3 0.7 2.2
Breast Female 22.6 22.1 30.8 15.5 11.5 14.8 22.7 22.7 22.7 31.3 14.0 12.8 14.9 23.7
Table 1.21U.S. and SEER Death Rates by Primary Cancer Site and Race/Ethnicity, 2006-2010

SEE
R C
ancer Statistics Review
1975-2010N
ational Cancer Institute
a US Mortality Files, National Center for Health Statistics, Centers for Disease Control and Prevention. Rates are per 100,000and are age-adjusted to the 2000 US Std Population (19 age groups - Census P25-1130).
b The SEER 18 areas are San Francisco, Connecticut, Detroit, Hawaii, Iowa, New Mexico, Seattle, Utah, Atlanta, San Jose-Monterey,Los Angeles, Alaska Native Registry, Rural Georgia, California excluding SF/SJM/LA, Kentucky, Louisiana, New Jersey andGeorgia excluding ATL/RG.
c Rates for American Indian/Alaska Native (AI/AN) are based on the CHSDA(Contract Health Service Delivery Area) counties.d Asian/Pacific Islander.e Hispanic (Hisp) and White Non-Hispanic (W-NHisp) are not mutually exclusive from whites, blacks, Asian/Pacific Islanders, and
American Indians/Alaska Natives. Mortality data for Hispanics and White Non-Hispanics do not include cases from theDistrict of Columbia, North Dakota, and South Carolina.
- Statistic could not be calculated due to less than 16 cases in the time interval.
Total United Statesa SEER 18 Areasab
Site Total White Black AI/ANc APId Hispe W-NHispe Total White Black AI/ANc APId Hispe W-NHispe
Cervix Female 2.4 2.2 4.2 3.5 1.9 2.9 2.1 2.4 2.2 4.0 3.1 1.9 3.1 2.0
Corpus & Female 4.3 4.0 7.4 3.2 2.6 3.3 4.0 4.3 4.1 7.1 2.5 2.9 3.4 4.1Uterus, NOS
Ovary Female 8.1 8.4 6.7 7.1 4.8 5.8 8.6 8.2 8.7 6.9 6.9 5.0 6.3 9.0
Prostate Male 23.0 21.2 50.9 20.7 10.1 19.2 21.3 23.1 22.0 49.6 17.5 10.9 19.7 22.1
Testis Male 0.2 0.3 0.1 - 0.1 0.3 0.3 0.2 0.3 0.1 - 0.1 0.3 0.3
Urinary Both Sexes 4.4 4.6 3.7 2.4 1.7 2.4 4.8 4.3 4.6 3.8 2.0 1.8 2.3 4.8Bladder Male 7.7 8.1 5.5 4.1 2.8 4.0 8.4 7.4 8.0 5.8 3.1 3.0 3.9 8.5
Female 2.2 2.2 2.6 1.2 0.9 1.3 2.3 2.2 2.2 2.7 - 1.0 1.3 2.4
Kidney & Both Sexes 4.0 4.1 3.9 6.7 2.0 3.5 4.1 3.8 3.9 3.9 6.2 2.1 3.6 3.9Renal Male 5.8 5.9 5.7 9.5 3.0 5.1 5.9 5.5 5.7 5.8 8.5 3.2 5.2 5.7Pelvis Female 2.6 2.6 2.6 4.4 1.2 2.3 2.6 2.4 2.5 2.5 4.4 1.4 2.4 2.5
Brain & Both Sexes 4.3 4.6 2.5 2.6 1.9 2.8 4.8 4.2 4.7 2.6 1.8 2.0 3.0 5.0Nervous Male 5.2 5.6 3.0 2.8 2.3 3.3 5.8 5.2 5.7 3.1 1.9 2.5 3.4 6.1System Female 3.5 3.8 2.1 2.3 1.6 2.4 3.9 3.4 3.8 2.2 1.6 1.7 2.6 4.0
Thyroid Both Sexes 0.5 0.5 0.5 0.5 0.7 0.6 0.5 0.5 0.5 0.4 - 0.8 0.6 0.5Male 0.5 0.5 0.4 - 0.5 0.5 0.5 0.5 0.5 0.3 - 0.6 0.5 0.5Female 0.5 0.5 0.6 - 0.9 0.7 0.5 0.6 0.5 0.5 - 1.0 0.7 0.5
Hodgkin Both Sexes 0.4 0.4 0.4 - 0.2 0.4 0.4 0.4 0.4 0.4 - 0.2 0.4 0.4Lymphoma Male 0.5 0.5 0.4 - 0.2 0.5 0.5 0.5 0.5 0.5 - 0.2 0.5 0.5
Female 0.3 0.3 0.3 - 0.1 0.3 0.3 0.3 0.3 0.3 - 0.1 0.3 0.3
Non-Hodgkin Both Sexes 6.4 6.7 4.6 4.8 4.1 5.3 6.8 6.3 6.7 4.6 3.6 4.5 5.6 6.7Lymphoma Male 8.2 8.5 5.9 5.4 5.2 6.5 8.6 8.0 8.4 6.1 3.7 5.7 6.8 8.5
Female 5.1 5.3 3.6 4.3 3.4 4.4 5.4 5.0 5.3 3.5 3.4 3.7 4.6 5.4
Myeloma Both Sexes 3.4 3.1 6.4 2.9 1.7 2.8 3.1 3.3 3.1 6.4 1.8 1.9 2.9 3.1Male 4.3 4.0 7.9 3.6 2.3 3.5 4.1 4.2 4.0 7.9 2.3 2.5 3.6 4.0Female 2.7 2.5 5.4 2.4 1.3 2.3 2.5 2.6 2.4 5.5 1.5 1.5 2.5 2.4
Leukemia Both Sexes 7.1 7.3 6.1 4.8 3.9 4.9 7.4 6.9 7.2 6.2 3.8 4.1 4.9 7.4Male 9.5 9.8 8.2 7.0 5.0 6.1 10.0 9.2 9.7 8.2 5.1 5.2 6.2 9.9Female 5.3 5.5 4.8 3.3 3.1 4.0 5.5 5.2 5.4 4.9 2.9 3.3 4.0 5.5
Table 1.21 - continuedU.S. and SEER Death Rates by Primary Cancer Site and Race/Ethnicity, 2006-2010

SEER Cancer Statistics Review 1975-2010 National Cancer Institute
a U.S. 2010 cancer prevalence counts are based on 2010 cancer prevalence proportions from theSEER 9 registries and 1/1/2010 U.S. population estimates based on the average of 2009 and 2010population estimates from the U.S. Bureau of the Census.
b Prevalence estimates are ambiguous for those with multiple cancers, unless the tumorinclusion criteria are understood. Depending on the application, different inclusion criteriamay be appropriate. This table provides three different methods of tumor inclusion:
c (c) First invasive tumor everd (d) First invasive tumor for each cancer site diagnosed during the previous 35 years (1975-2009)e (e) First invasive tumor for each cancer site diagnosed during the previous 5 years (2005-2009)
For definitions (d) and (e) all sites is treated as a separate cancer "site".
Consider a woman who had three invasive cancers: Melanoma in 1981; Breast cancer in 2005;Melanoma in 2006.
In method (c) the melanoma is the woman's first cancer, and is counted for the melanoma andall sites 35-year limited duration prevalence. For 5-year limited duration prevalence, thewoman is not counted at all since her first cancer occurred more than 5 years prior to 1/1/2010.In method (d) the 1981 melanoma is counted for the melanoma and all sites 35-year limitedduration prevalence. The 2005 breast cancer is counted for the breast 5-year and 35-yearlimited duration prevalence.In method (e) the 2005 breast cancer is counted for the breast cancer and all sites 5-yearlimited duration prevalence. The 2006 melanoma is counted for 5-year limited durationprevalence for melanoma.
f Ovary excludes borderline cases or histologies 8442, 8451, 8462, 8472, and 8473.
5-Year Limited Duration 35-year Limited Duration
1st 1st Per Site 1st Per Site 1st 1st Per SiteInvasive in Previous in Previous Invasive in Previous
Site Sex Tumor Everc 35 Yearsd 5 Yearse Tumor Everc 35 Yearsd
All Sites Both Sexes 4,511,266 4,598,344 5,044,168 12,600,627 12,810,577Male 2,332,050 2,366,640 2,584,260 5,990,343 6,060,178Female 2,179,216 2,231,704 2,459,908 6,610,284 6,750,399
Oral Cavity & Both Sexes 102,019 117,112 121,258 264,620 291,343Pharynx Male 71,123 80,929 83,544 175,045 190,951
Female 30,896 36,183 37,714 89,575 100,392
Esophagus Both Sexes 21,268 25,973 26,092 33,702 39,594Male 16,808 20,399 20,447 26,317 30,715Female 4,460 5,574 5,645 7,385 8,879
Stomach Both Sexes 35,420 42,280 42,609 70,821 81,142Male 21,286 25,765 25,901 40,560 46,844Female 14,134 16,515 16,708 30,261 34,298
Colon & Rectum Both Sexes 407,833 471,251 480,046 1,129,666 1,258,620Male 207,302 239,824 244,132 561,245 622,211Female 200,531 231,427 235,914 568,421 636,409
Liver & Both Sexes 30,577 34,834 34,867 40,940 45,832Intrahepatic Male 22,266 25,232 25,265 28,891 32,221Bile Duct Female 8,311 9,602 9,602 12,049 13,611
Pancreas Both Sexes 31,442 38,275 38,275 41,284 49,174Male 15,733 19,467 19,467 20,155 24,367Female 15,709 18,808 18,808 21,129 24,807
Larynx Both Sexes 30,947 37,152 37,518 87,135 98,063Male 25,107 30,036 30,356 70,117 78,586Female 5,840 7,116 7,162 17,018 19,477
Lung & Bronchus Both Sexes 231,996 296,283 304,764 391,564 480,133Male 108,211 140,119 143,487 178,912 220,472Female 123,785 156,164 161,277 212,652 259,661
Melanoma of Both Sexes 276,312 312,334 325,566 884,259 953,581the Skin Male 148,749 171,783 180,200 440,298 480,917
Female 127,563 140,551 145,366 443,961 472,664
Breast Female 842,193 909,424 965,835 2,770,060 2,934,536
Cervix Female 38,963 40,783 40,907 208,065 213,819
Corpus & Uterus, Female 169,126 189,983 190,106 569,448 620,803NOS
Ovaryf Female 57,207 66,063 66,139 169,398 190,511
Table 1.22U.S. Prevalence Counts, Invasive Cancers Only, January 1, 2010a
Using Different Tumor Inclusion Criteriab

SEER Cancer Statistics Review 1975-2010 National Cancer Institute
a U.S. 2010 cancer prevalence counts are based on 2010 cancer prevalence proportions from theSEER 9 registries and 1/1/2010 U.S. population estimates based on the average of 2009 and 2010population estimates from the U.S. Bureau of the Census.
b Prevalence estimates are ambiguous for those with multiple cancers, unless the tumorinclusion criteria are understood. Depending on the application, different inclusion criteriamay be appropriate. This table provides three different methods of tumor inclusion:
c (c) First invasive tumor everd (d) First invasive tumor for each cancer site diagnosed during the previous 35 years (1975-2009)e (e) First invasive tumor for each cancer site diagnosed during the previous 5 years (2005-2009)
For definitions (d) and (e) all sites is treated as a separate cancer "site".
Consider a woman who had three invasive cancers: Melanoma in 1981; Breast cancer in 2005;Melanoma in 2006.
In method (c) the melanoma is the woman's first cancer, and is counted for the melanoma andall sites 35-year limited duration prevalence. For 5-year limited duration prevalence, thewoman is not counted at all since her first cancer occurred more than 5 years prior to 1/1/2010.In method (d) the 1981 melanoma is counted for the melanoma and all sites 35-year limitedduration prevalence. The 2005 breast cancer is counted for the breast 5-year and 35-yearlimited duration prevalence.In method (e) the 2005 breast cancer is counted for the breast cancer and all sites 5-yearlimited duration prevalence. The 2006 melanoma is counted for 5-year limited durationprevalence for melanoma.
5-Year Limited Duration 35-year Limited Duration
1st 1st Per Site 1st Per Site 1st 1st Per SiteInvasive in Previous in Previous Invasive in Previous
Site Sex Tumor Everc 35 Yearsd 5 Yearse Tumor Everc 35 Yearsd
Prostate Male 1,026,391 1,107,903 1,107,977 2,616,190 2,787,286
Testis Male 42,302 43,012 43,616 205,130 207,844
Urinary Bladder Both Sexes 198,998 248,244 253,143 551,278 641,106Male 151,489 190,075 194,009 411,638 479,012Female 47,509 58,169 59,134 139,640 162,094
Kidney & Both Sexes 145,766 177,066 179,051 330,450 385,370Renal Pelvis Male 88,557 108,930 110,317 196,335 230,734
Female 57,209 68,136 68,734 134,115 154,636
Brain & Both Sexes 43,995 46,883 47,345 128,063 132,164Nervous System Male 24,044 25,790 26,033 68,158 70,466
Female 19,951 21,093 21,312 59,905 61,698
Thyroid Both Sexes 165,253 183,524 184,093 494,969 528,131Male 37,076 42,905 43,058 107,747 117,569Female 128,177 140,619 141,035 387,222 410,562
Hodgkin Lymphoma Both Sexes 39,048 41,589 41,611 168,309 172,937Male 21,122 22,557 22,568 87,084 89,522Female 17,926 19,032 19,043 81,225 83,415
Non-Hodgkin Both Sexes 198,946 233,585 235,457 499,712 558,340Lymphoma Male 105,553 125,451 126,442 261,560 292,961
Female 93,393 108,134 109,015 238,152 265,379
Myeloma Both Sexes 49,451 58,292 58,328 77,360 88,490Male 26,622 32,063 32,087 42,092 48,802Female 22,829 26,229 26,241 35,268 39,688
Leukemia Both Sexes 112,120 129,298 129,528 282,150 310,046Male 64,915 75,612 75,711 160,039 176,801Female 47,205 53,686 53,817 122,111 133,245
Acute Both Sexes 16,205 16,686 16,686 66,030 66,759Lymphocytic Male 9,215 9,443 9,443 36,418 36,708Leukemia Female 6,990 7,243 7,243 29,612 30,051
Childhood Both Sexes 63,904 63,977 64,503 304,247 304,716(Ages 0-19) Male 33,948 33,981 34,250 156,819 157,032
Female 29,956 29,996 30,253 147,428 147,684
Kaposi Sarcoma Both Sexes 7,319 7,750 7,750 24,815 25,977Male 6,865 7,208 7,208 23,533 24,518Female 454 542 542 1,282 1,459
Mesothelioma Both Sexes 2,968 3,926 3,938 4,538 5,658Male 1,998 2,761 2,773 2,601 3,467Female 970 1,165 1,165 1,937 2,191
Table 1.22 - continuedU.S. Prevalence Counts, Invasive Cancers Only, January 1, 2010a
Using Different Tumor Inclusion Criteriab

SEE
R C
ancer Statistics Review
1975-2010N
ational Cancer Institute
a U.S. 2010 cancer prevalence counts are based on 2010 cancer prevalence proportions from the SEER 9 registries (San Francisco,Connecticut, Detroit, Hawaii, Iowa, New Mexico, Seattle, Utah, and Atlanta) and 1/1/2010 U.S. population estimates based on theaverage of 2009 and 2010 population estimates from the U.S. Bureau of the Census. Prevalence was calculated using theFirst Malignant Primary Only for a person.
b Cases diagnosed more than 35 years ago were estimated using the completeness index method (Capocaccia et. al. 1997,Merrill et. al. 2000).
c Due to rounding, the sum of the age specific estimates may not equal the all ages estimate.
Age at Prevalence Site/Sex All Agesc 0-9 10-19 20-29 30-39 40-49 50-59 60-69 70+
All SitesMales 6,078,974 18,390 42,087 83,873 155,608 354,801 860,143 1,578,142 2,985,931Females 6,948,940 16,117 36,351 86,197 226,859 636,726 1,276,932 1,684,808 2,984,950
Oral Cavity & PharynxMales 181,084 68 468 1,480 3,518 14,224 43,847 54,509 62,971Females 94,109 90 553 1,470 3,635 8,681 17,691 22,821 39,167
EsophagusMales 26,388 0 0 22 219 1,177 4,653 9,419 10,897Females 7,451 0 0 0 28 256 1,263 1,790 4,114
StomachMales 41,386 0 18 64 607 2,589 7,095 10,242 20,773Females 30,883 4 12 165 568 2,307 4,398 6,312 17,118
Colon & RectumMales 569,930 11 117 1,190 5,632 25,029 80,675 136,002 321,273Females 584,551 0 75 1,251 5,467 23,433 67,578 110,244 376,504
Liver & IntrahepMales 28,967 484 535 554 454 1,582 10,000 9,083 6,274Females 12,437 471 470 312 411 895 2,803 3,028 4,048
PancreasMales 20,293 11 12 127 376 1,616 4,320 6,183 7,649Females 21,316 0 66 155 413 1,376 3,843 5,483 9,980
LarynxMales 71,659 0 0 78 243 1,915 10,556 20,739 38,129Females 17,370 0 0 25 134 1,011 3,256 4,677 8,267
Lung & BronchusMales 183,410 45 90 444 1,184 5,545 24,951 54,888 96,262Females 216,021 31 71 396 1,435 7,883 28,898 59,047 118,261
Melanoma of the SkinMales 452,540 78 656 5,014 18,294 46,766 95,157 122,709 163,865Females 469,240 113 993 10,894 33,972 73,514 109,961 106,450 133,343
Table 1.23U.S. Complete Prevalence Counts, Invasive Cancers Only, January 1, 2010a
By Age at Prevalence

SEE
R C
ancer Statistics Review
1975-2010N
ational Cancer Institute
a U.S. 2010 cancer prevalence counts are based on 2010 cancer prevalence proportions from the SEER 9 registries (San Francisco,Connecticut, Detroit, Hawaii, Iowa, New Mexico, Seattle, Utah, and Atlanta) and 1/1/2010 U.S. population estimates based on theaverage of 2009 and 2010 population estimates from the U.S. Bureau of the Census. Prevalence was calculated using theFirst Malignant Primary Only for a person.
b Cases diagnosed more than 35 years ago were estimated using the completeness index method (Capocaccia et. al. 1997,Merrill et. al. 2000).
c Due to rounding, the sum of the age specific estimates may not equal the all ages estimate.
Age at Prevalence Site/Sex All Agesc 0-9 10-19 20-29 30-39 40-49 50-59 60-69 70+
BreastMales 14,588 0 0 11 89 586 2,018 4,133 7,751Females 2,829,041 0 53 2,740 36,291 216,912 539,229 767,846 1,265,969
CervixFemales 249,496 0 45 2,239 16,405 42,748 59,766 55,248 73,044
Corpus & Uterus, NOSFemales 600,346 0 47 530 5,666 24,621 87,167 157,833 324,482
Ovaryd
Females 186,138 84 1,018 3,453 6,883 18,736 40,700 47,632 67,632
ProstateMales 2,617,682 34 59 101 324 21,033 228,561 740,428 1,627,144
Urinary BladderMales 419,648 45 105 611 2,438 11,535 42,898 99,644 262,372Females 143,992 23 57 217 964 4,266 13,698 30,030 94,737
Kidney & Renal PelvisMales 202,516 1,454 2,505 2,659 5,172 17,901 40,060 57,511 75,253Females 138,989 1,343 2,681 2,851 4,901 12,071 23,973 33,716 57,452
Hodgkin LymphomaMales 93,890 181 2,315 9,272 16,487 24,007 21,438 13,274 6,916Females 88,038 101 1,901 9,617 16,530 23,444 18,638 10,651 7,157
Non-Hodgkin LymphomaMales 266,478 773 3,513 7,582 13,366 29,224 52,496 67,493 92,032Females 242,587 430 1,847 4,348 8,879 20,902 41,030 56,723 108,427
MyelomaMales 42,185 0 6 84 442 2,859 8,141 13,608 17,045Females 35,432 0 0 39 281 2,266 6,273 10,676 15,896
LeukemiaMales 162,651 6,545 12,947 12,388 10,928 13,500 22,064 32,827 51,452Females 125,312 5,438 10,680 10,750 9,514 9,728 14,680 20,623 43,899
Acute Lymphocytic LeukMales 38,239 5,461 11,081 9,597 6,075 3,568 1,238 775 444Females 31,328 4,527 9,014 7,859 5,163 2,755 884 717 408
Table 1.23 - continuedU.S. Complete Prevalence Counts, Invasive Cancers Only, January 1, 2010a
By Age at Prevalence

SEE
R C
ancer Statistics Review
1975-2010N
ational Cancer Institute
Source: SEER 18 areas (San Francisco, Connecticut, Detroit, Hawaii, Iowa, New Mexico, Seattle, Utah, Atlanta, San Jose-Monterey,Los Angeles, Alaska Native Registry, Rural Georgia, California excluding SF/SJM/LA, Kentucky, Louisiana, New Jersey and Georgiaexcluding ATL/RG).
a Top 15 cancer sites selected based on 2006-2010 age-adjusted rates for the race/ethnic group.b Rates are per 100,000 and age-adjusted to the 2000 US Std Population (19 age groups - Census P25-1130).c The APC is the Annual Percent Change over the time interval.
Trends are based on rates age-adjusted to the 2000 US Std Population (19 age groups - Census P25-1130).d Rates for American Indian/Alaska Native are based on the CHSDA(Contract Health Service Delivery Area) counties.e Hispanic is not mutually exclusive from whites, blacks, Asian/Pacific Islanders, and American Indians/Alaska Natives.
Incidence data for Hispanics are based on NHIA and exclude cases from the Alaska Native Registry.f The rates for sex-specific cancer sites are calculated using the population for both sexes combined.g IBD = Intrahepatic Bile Duct. ONS = Other Nervous System.h Ovary excludes borderline cases or histologies 8442, 8451, 8462, 8472, and 8473.* The APC is significantly different from zero (p<.05).- Statistic not shown. Rate based on less than 16 cases for the time interval. Trend based on less than 10 cases for at least
one year within the time interval.
All Races White Black
Rateb APCc Rateb APCc Rateb APCc
2006-2010 2001-2010 2006-2010 2001-2010 2006-2010 2001-2010 All Sites 463.0 -0.6* All Sites 471.9 -0.6* All Sites 483.6 -1.0*Prostatef 68.6 -1.9* Breast 68.0 -1.0* Prostatef 96.3 -2.1*Breast 66.8 -0.8* Prostatef 66.1 -2.0* Lung and Bronchus 69.7 -1.7*Lung and Bronchus 61.4 -1.5* Lung and Bronchus 63.1 -1.4* Breast 69.3 0.3Colon and Rectum 45.0 -2.6* Colon and Rectum 44.2 -2.8* Colon and Rectum 55.3 -2.3*Melanoma of the Skin 21.1 1.5* Melanoma of the Skin 25.0 1.6* Kidney and Renal Pelvis 17.4 2.9*Urinary Bladder 20.7 -0.6* Urinary Bladder 22.5 -0.6* Pancreas 15.8 0.5Non-Hodgkin Lymphoma 19.7 0.1 Non-Hodgkin Lymphoma 20.7 0.1 Non-Hodgkin Lymphoma 14.2 -0.2Kidney and Renal Pelvis 15.3 2.4* Kidney and Renal Pelvis 15.8 2.3* Corpus and Uterus, NOSf 12.7 1.7*Corpus and Uterus, NOSf 13.0 0.6 Leukemia 13.5 -0.5* Urinary Bladder 12.5 -0.2Leukemia 12.8 -0.5* Corpus and Uterus, NOSf 13.3 0.4 Myeloma 11.9 0.3Pancreas 12.2 0.9* Thyroid 13.0 6.4* Stomach 11.6 -1.8*Thyroid 12.2 6.3* Pancreas 12.1 1.0* Leukemia 9.8 -1.7*Oral Cavity and Pharynx 10.8 0.2 Oral Cavity and Pharynx 11.2 0.5* Oral Cavity and Pharynx 9.6 -2.5*Liver & IBDg 7.7 3.6* Brain and ONSg 7.1 -0.2 Liver & IBDg 9.1 3.7*Stomach 7.5 -1.1* Ovaryfh 7.1 -1.9* Thyroid 7.1 5.7*
Asian/Pacific Islander American Indian/Alaska Natived Hispanice
Rateb APCc Rateb APCc Rateb APCc
2006-2010 2001-2010 2006-2010 2001-2010 2006-2010 2001-2010 All Sites 307.4 -0.9* All Sites 323.6 -0.6 All Sites 356.7 -0.9*Breast 50.6 0.3 Lung and Bronchus 42.1 -2.2* Prostatef 55.2 -2.6*Lung and Bronchus 37.6 -1.3* Breast 41.7 -0.6 Breast 48.9 -0.6Colon and Rectum 37.6 -2.4* Colon and Rectum 39.9 -2.3* Colon and Rectum 37.7 -1.7*Prostatef 35.5 -3.7* Prostatef 34.3 -1.9* Lung and Bronchus 32.2 -1.6*Liver & IBDg 14.1 -0.9 Kidney and Renal Pelvis 19.7 3.0* Non-Hodgkin Lymphoma 17.8 0.7Non-Hodgkin Lymphoma 13.1 -0.5 Liver & IBDg 13.5 4.8* Kidney and Renal Pelvis 15.1 2.1*Thyroid 12.1 5.5* Non-Hodgkin Lymphoma 12.3 0.1 Liver & IBDg 12.1 2.8*Stomach 11.9 -3.2* Pancreas 10.9 2.2* Urinary Bladder 11.5 -1.6*Corpus and Uterus, NOSf 10.1 2.4* Corpus and Uterus, NOSf 10.8 2.9 Stomach 11.3 -1.8*Pancreas 9.6 0.7 Stomach 10.0 -3.5 Pancreas 11.3 0.3Urinary Bladder 9.0 -1.0* Urinary Bladder 7.8 1.1 Thyroid 10.5 5.4*Kidney and Renal Pelvis 7.9 2.8* Oral Cavity and Pharynx 7.4 0.2 Corpus and Uterus, NOSf 10.4 1.5*Oral Cavity and Pharynx 7.6 -0.6 Thyroid 7.3 4.8* Leukemia 10.2 -0.2Leukemia 7.4 -0.5 Leukemia 7.3 -1.5 Oral Cavity and Pharynx 6.5 0.4Ovaryfh 5.1 -1.2 Ovaryfh 5.9 -3.9 Ovaryfh 6.1 -2.0*
Table 1.24Age-Adjusted SEER Incidence Rates and Trends for the Top 15 Cancer Sitesa by Race/Ethnicity
Both Sexes

SEE
R C
ancer Statistics Review
1975-2010N
ational Cancer Institute
Source: SEER 18 areas (San Francisco, Connecticut, Detroit, Hawaii, Iowa, New Mexico, Seattle, Utah, Atlanta, San Jose-Monterey,Los Angeles, Alaska Native Registry, Rural Georgia, California excluding SF/SJM/LA, Kentucky, Louisiana, New Jersey and Georgiaexcluding ATL/RG).
a Top 15 cancer sites selected based on 2006-2010 age-adjusted rates for the race/ethnic group.b Rates are per 100,000 and age-adjusted to the 2000 US Std Population (19 age groups - Census P25-1130).c The APC is the Annual Percent Change over the time interval.
Trends are based on rates age-adjusted to the 2000 US Std Population (19 age groups - Census P25-1130).d Rates for American Indian/Alaska Native are based on the CHSDA(Contract Health Service Delivery Area) counties.e Hispanic is not mutually exclusive from whites, blacks, Asian/Pacific Islanders, and American Indians/Alaska Natives.
Incidence data for Hispanics are based on NHIA and exclude cases from the Alaska Native Registry.f IBD = Intrahepatic Bile Duct. ONS = Other Nervous System.* The APC is significantly different from zero (p<.05).- Statistic not shown. Rate based on less than 16 cases for the time interval. Trend based on less than 10 cases for at least
one year within the time interval.
All Races White Black
Rateb APCc Rateb APCc Rateb APCc
2006-2010 2001-2010 2006-2010 2001-2010 2006-2010 2001-2010 All Sites 535.9 -1.1* All Sites 539.1 -1.1* All Sites 610.4 -1.9*Prostate 152.0 -2.3* Prostate 144.9 -2.5* Prostate 228.5 -2.6*Lung and Bronchus 74.3 -2.2* Lung and Bronchus 74.5 -2.2* Lung and Bronchus 95.8 -2.8*Colon and Rectum 52.2 -2.9* Colon and Rectum 51.3 -3.1* Colon and Rectum 64.3 -2.4*Urinary Bladder 36.6 -0.7* Urinary Bladder 39.8 -0.7* Kidney and Renal Pelvis 24.1 2.5*Melanoma of the Skin 27.4 1.8* Melanoma of the Skin 31.9 1.8* Urinary Bladder 21.0 0.4Non-Hodgkin Lymphoma 23.9 0.2 Non-Hodgkin Lymphoma 25.0 0.2 Pancreas 17.6 1.3*Kidney and Renal Pelvis 21.0 2.2* Kidney and Renal Pelvis 21.5 2.2* Non-Hodgkin Lymphoma 17.4 -0.2Leukemia 16.3 -0.8* Leukemia 17.2 -0.8* Stomach 16.1 -2.1*Oral Cavity and Pharynx 16.2 0.2 Oral Cavity and Pharynx 16.7 0.6* Liver & IBDf 15.1 3.7*Pancreas 13.9 0.8* Pancreas 13.8 0.8* Oral Cavity and Pharynx 14.9 -3.1*Liver & IBDf 11.9 3.8* Liver & IBDf 10.4 4.5* Myeloma 14.4 -0.4Stomach 10.4 -1.5* Stomach 9.2 -1.3* Leukemia 12.6 -1.9*Esophagus 7.7 -0.9* Brain and ONSf 8.4 -0.1 Larynx 9.6 -3.7*Brain and ONSf 7.7 -0.3 Esophagus 8.0 -0.2 Esophagus 8.4 -5.0*Myeloma 7.5 0.6* Myeloma 7.1 0.7* Brain and ONSf 4.7 -0.2
Asian/Pacific Islander American Indian/Alaska Natived Hispanice
Rateb APCc Rateb APCc Rateb APCc
2006-2010 2001-2010 2006-2010 2001-2010 2006-2010 2001-2010 All Sites 335.0 -1.8* All Sites 351.3 -0.7 All Sites 409.7 -1.4*Prostate 81.8 -3.8* Prostate 77.8 -2.2* Prostate 125.8 -3.0*Lung and Bronchus 50.7 -1.7* Lung and Bronchus 51.2 -2.3* Colon and Rectum 45.5 -1.7*Colon and Rectum 43.8 -2.7* Colon and Rectum 44.1 -1.2 Lung and Bronchus 40.6 -2.6*Liver & IBDf 21.4 -0.9 Kidney and Renal Pelvis 24.8 2.9 Non-Hodgkin Lymphoma 20.5 0.7Urinary Bladder 16.1 -1.0* Liver & IBDf 20.6 6.1 Urinary Bladder 20.2 -1.5*Non-Hodgkin Lymphoma 16.1 -0.2 Non-Hodgkin Lymphoma 14.1 -1.1 Kidney and Renal Pelvis 20.1 2.1*Stomach 15.5 -3.5* Urinary Bladder 13.7 - Liver & IBDf 18.3 3.2*Kidney and Renal Pelvis 11.0 3.2* Stomach 13.1 -5.4* Stomach 14.9 -1.3*Oral Cavity and Pharynx 11.0 0.4 Pancreas 11.4 - Leukemia 12.2 -0.3Pancreas 10.4 0.3 Oral Cavity and Pharynx 11.1 2.9 Pancreas 12.1 0.9Leukemia 9.0 -0.8 Leukemia 8.8 - Oral Cavity and Pharynx 9.3 -0.1Thyroid 5.3 4.6* Esophagus 6.1 - Myeloma 6.7 -1.3Myeloma 4.3 1.5 Larynx 4.6 - Brain and ONSf 5.9 -1.3*Brain and ONSf 4.2 0.1 Testis 4.5 - Esophagus 5.2 -1.0Esophagus 3.9 -1.3 Melanoma of the Skin 4.1 - Melanoma of the Skin 4.7 -1.2
Table 1.25Age-Adjusted SEER Incidence Rates and Trends for the Top 15 Cancer Sitesa by Race/Ethnicity
Males

SEE
R C
ancer Statistics Review
1975-2010N
ational Cancer Institute
Source: SEER 18 areas (San Francisco, Connecticut, Detroit, Hawaii, Iowa, New Mexico, Seattle, Utah, Atlanta, San Jose-Monterey,Los Angeles, Alaska Native Registry, Rural Georgia, California excluding SF/SJM/LA, Kentucky, Louisiana, New Jersey and Georgiaexcluding ATL/RG).
a Top 15 cancer sites selected based on 2006-2010 age-adjusted rates for the race/ethnic group.b Rates are per 100,000 and age-adjusted to the 2000 US Std Population (19 age groups - Census P25-1130).c The APC is the Annual Percent Change over the time interval.
Trends are based on rates age-adjusted to the 2000 US Std Population (19 age groups - Census P25-1130).d Rates for American Indian/Alaska Native are based on the CHSDA(Contract Health Service Delivery Area) counties.e Hispanic is not mutually exclusive from whites, blacks, Asian/Pacific Islanders, and American Indians/Alaska Natives.
Incidence data for Hispanics are based on NHIA and exclude cases from the Alaska Native Registry.f IBD = Intrahepatic Bile Duct. ONS = Other Nervous System.g Ovary excludes borderline cases or histologies 8442, 8451, 8462, 8472, and 8473.* The APC is significantly different from zero (p<.05).- Statistic not shown. Rate based on less than 16 cases for the time interval. Trend based on less than 10 cases for at least
one year within the time interval.
All Races White Black
Rateb APCc Rateb APCc Rateb APCc
2006-2010 2001-2010 2006-2010 2001-2010 2006-2010 2001-2010 All Sites 411.2 -0.3 All Sites 424.4 -0.3 All Sites 397.5 -0.1Breast 123.8 -0.6 Breast 127.4 -0.8* Breast 121.4 0.4Lung and Bronchus 51.9 -0.7* Lung and Bronchus 54.6 -0.6* Lung and Bronchus 52.2 -0.2Colon and Rectum 39.3 -2.4* Colon and Rectum 38.4 -2.5* Colon and Rectum 49.2 -2.4*Corpus and Uterus, NOS 24.3 0.9* Corpus and Uterus, NOS 25.1 0.7* Corpus and Uterus, NOS 22.2 1.9*Thyroid 18.2 6.5* Melanoma of the Skin 20.0 1.3* Pancreas 14.3 0.0Melanoma of the Skin 16.7 1.2* Thyroid 19.4 6.6* Kidney and Renal Pelvis 12.3 3.2*Non-Hodgkin Lymphoma 16.4 -0.1 Non-Hodgkin Lymphoma 17.3 0.0 Non-Hodgkin Lymphoma 11.8 -0.3Ovaryg 12.5 -1.7* Ovaryg 13.3 -1.7* Thyroid 10.5 6.1*Pancreas 10.9 1.0* Kidney and Renal Pelvis 10.9 2.3* Myeloma 10.2 0.7Kidney and Renal Pelvis 10.6 2.3* Pancreas 10.7 1.1* Ovaryg 9.7 -0.9Leukemia 10.0 -0.4 Leukemia 10.5 -0.4 Cervix Uteri 9.6 -3.0*Urinary Bladder 8.9 -0.9* Urinary Bladder 9.5 -0.9* Stomach 8.7 -1.2Cervix Uteri 7.9 -1.7* Cervix Uteri 7.9 -1.4* Leukemia 7.8 -1.6*Oral Cavity and Pharynx 6.2 -0.2 Oral Cavity and Pharynx 6.3 0.1 Urinary Bladder 7.1 -1.2Brain and ONSf 5.4 -0.4 Brain and ONSf 6.0 -0.4 Oral Cavity and Pharynx 5.4 -1.4
Asian/Pacific Islander American Indian/Alaska Natived Hispanice
Rateb APCc Rateb APCc Rateb APCc
2006-2010 2001-2010 2006-2010 2001-2010 2006-2010 2001-2010 All Sites 291.5 -0.1 All Sites 306.5 -0.4 All Sites 323.2 -0.4*Breast 91.8 0.2 Breast 77.1 -0.5 Breast 90.8 -0.5Colon and Rectum 32.7 -2.0* Colon and Rectum 36.6 -3.3* Colon and Rectum 31.6 -1.8*Lung and Bronchus 28.1 -0.4 Lung and Bronchus 35.7 -2.0 Lung and Bronchus 26.3 -0.6Corpus and Uterus, NOS 18.6 2.4* Corpus and Uterus, NOS 20.3 3.1 Corpus and Uterus, NOS 19.4 1.7*Thyroid 17.9 5.7* Kidney and Renal Pelvis 15.6 3.0 Thyroid 16.4 5.7*Non-Hodgkin Lymphoma 10.9 -0.8 Thyroid 11.0 4.7* Non-Hodgkin Lymphoma 15.6 0.7Ovaryg 9.4 -1.2 Non-Hodgkin Lymphoma 10.8 0.8 Ovaryg 11.3 -1.8*Stomach 9.3 -2.6* Ovaryg 10.7 -3.7 Kidney and Renal Pelvis 11.1 1.9*Pancreas 8.9 1.0 Pancreas 10.5 1.9 Cervix Uteri 10.9 -4.2*Liver & IBDf 8.2 -0.9 Liver & IBDf 7.7 2.8 Pancreas 10.6 -0.2Cervix Uteri 6.6 -3.9* Stomach 7.7 -1.1 Leukemia 8.7 -0.1Leukemia 6.1 0.0 Cervix Uteri 7.3 0.1 Stomach 8.6 -2.3*Kidney and Renal Pelvis 5.5 2.4 Leukemia 6.2 -2.3 Liver & IBDf 6.9 1.8Oral Cavity and Pharynx 4.9 -2.1* Oral Cavity and Pharynx 4.3 - Urinary Bladder 5.2 -2.3*Urinary Bladder 3.9 -0.9 Myeloma 3.7 - Brain and ONSf 4.7 -1.1
Table 1.26Age-Adjusted SEER Incidence Rates and Trends for the Top 15 Cancer Sitesa by Race/Ethnicity
Females

SEE
R C
ancer Statistics Review
1975-2010N
ational Cancer Institute
Source: US Mortality Files, National Center for Health Statistics, Centers for Disease Control and Prevention.a Top 15 cancer sites selected based on 2006-2010 age-adjusted rates for the race/ethnic group.b Rates are per 100,000 and age-adjusted to the 2000 US Std Population (19 age groups - Census P25-1130).c The APC is the Annual Percent Change over the time interval.
Trends are based on rates age-adjusted to the 2000 US Std Population (19 age groups - Census P25-1130).d Rates for American Indian/Alaska Native are based on the CHSDA(Contract Health Service Delivery Area) counties.e Hispanic is not mutually exclusive from whites, blacks, Asian/Pacific Islanders, and American Indians/Alaska Natives.
The 2006-2010 Hispanic death rates do not include deaths from the District of Columbia, North Dakota and South Carolina.The 2001-2010 Hispanic mortality trends do not include deaths from the District of Columbia, Minnesota, New Hampshire,North Dakota and South Carolina.
f The rates for sex-specific cancer sites are calculated using the population for both sexes combined.g IBD = Intrahepatic Bile Duct. ONS = Other Nervous System.* The APC is significantly different from zero (p<.05).- Statistic not shown. Rate based on less than 16 cases for the time interval. Trend based on less than 10 cases for at least
one year within the time interval.
All Races White Black
Rateb APCc Rateb APCc Rateb APCc
2006-2010 2001-2010 2006-2010 2001-2010 2006-2010 2001-2010 All Sites 176.4 -1.5* All Sites 175.8 -1.4* All Sites 210.3 -2.1*Lung and Bronchus 49.5 -1.7* Lung and Bronchus 50.2 -1.6* Lung and Bronchus 53.5 -2.4*Colon and Rectum 16.4 -2.9* Colon and Rectum 15.9 -3.0* Colon and Rectum 22.8 -2.8*Breast 12.7 -2.2* Breast 12.3 -2.2* Breast 18.2 -1.7*Pancreas 10.9 0.5* Pancreas 10.8 0.6* Prostatef 18.0 -3.4*Prostatef 9.0 -2.7* Prostatef 8.3 -2.5* Pancreas 13.7 -0.1Leukemia 7.1 -1.0* Leukemia 7.3 -0.9* Liver & IBDg 7.4 2.4*Non-Hodgkin Lymphoma 6.4 -2.8* Non-Hodgkin Lymphoma 6.7 -2.7* Stomach 6.7 -3.2*Liver & IBDg 5.6 2.4* Liver & IBDg 5.2 2.5* Myeloma 6.4 -1.7*Ovaryf 4.5 -2.0* Ovaryf 4.7 -2.0* Leukemia 6.1 -1.6*Urinary Bladder 4.4 0.1 Brain and ONSg 4.6 -0.4 Non-Hodgkin Lymphoma 4.6 -2.5*Esophagus 4.3 -0.6* Urinary Bladder 4.6 0.3* Esophagus 4.4 -4.8*Brain and ONSg 4.3 -0.5* Esophagus 4.4 0.0 Corpus and Uterus, NOSf 4.4 0.4Kidney and Renal Pelvis 4.0 -1.0* Kidney and Renal Pelvis 4.1 -1.0* Ovaryf 4.0 -1.9*Stomach 3.5 -2.9* Myeloma 3.1 -1.8* Kidney and Renal Pelvis 3.9 -1.1*Myeloma 3.4 -1.8* Melanoma of the Skin 3.1 0.7* Urinary Bladder 3.7 -0.8
Asian/Pacific Islander American Indian/Alaska Natived Hispanice
Rateb APCc Rateb APCc Rateb APCc
2006-2010 2001-2010 2006-2010 2001-2010 2006-2010 2001-2010 All Sites 108.8 -1.2* All Sites 160.4 -0.7* All Sites 121.8 -1.4*Lung and Bronchus 25.5 -1.2* Lung and Bronchus 40.2 -0.7 Lung and Bronchus 21.3 -2.1*Colon and Rectum 11.2 -1.9* Colon and Rectum 16.9 -0.4 Colon and Rectum 12.7 -1.7*Liver & IBDg 9.7 -1.2* Liver & IBDg 9.3 1.5 Pancreas 8.6 0.2Pancreas 7.6 0.5 Pancreas 9.2 2.1 Liver & IBDg 8.5 1.6*Stomach 6.6 -3.4* Breast 8.8 -1.3 Breast 8.2 -1.6*Breast 6.5 -1.5* Prostatef 8.1 -1.0 Prostatef 7.5 -2.6*Non-Hodgkin Lymphoma 4.1 -2.1* Kidney and Renal Pelvis 6.7 -0.2 Stomach 5.7 -2.7*Prostatef 4.1 -2.5* Stomach 5.6 -5.4* Non-Hodgkin Lymphoma 5.3 -1.4*Leukemia 3.9 0.2 Non-Hodgkin Lymphoma 4.8 -3.0 Leukemia 4.9 -0.9*Ovaryf 2.7 -0.5 Leukemia 4.8 -0.1 Kidney and Renal Pelvis 3.5 -1.0Kidney and Renal Pelvis 2.0 1.9 Ovaryf 4.1 -2.3 Ovaryf 3.3 -1.3*Oral Cavity and Pharynx 2.0 -2.5* Esophagus 3.6 -2.0* Myeloma 2.8 -2.0*Brain and ONSg 1.9 -0.1 Myeloma 2.9 -5.0* Brain and ONSg 2.8 -0.2Esophagus 1.8 -0.8 Brain and ONSg 2.6 2.8 Urinary Bladder 2.4 -1.1Myeloma 1.7 0.4 Urinary Bladder 2.4 2.8 Esophagus 2.3 -0.7
Table 1.27Age-Adjusted U.S. Death Rates and Trends for the Top 15 Cancer Sitesa by Race/Ethnicity
Both Sexes

SEE
R C
ancer Statistics Review
1975-2010N
ational Cancer Institute
Source: US Mortality Files, National Center for Health Statistics, Centers for Disease Control and Prevention.a Top 15 cancer sites selected based on 2006-2010 age-adjusted rates for the race/ethnic group.b Rates are per 100,000 and age-adjusted to the 2000 US Std Population (19 age groups - Census P25-1130).c The APC is the Annual Percent Change over the time interval.
Trends are based on rates age-adjusted to the 2000 US Std Population (19 age groups - Census P25-1130).d Rates for American Indian/Alaska Native are based on the CHSDA(Contract Health Service Delivery Area) counties.e Hispanic is not mutually exclusive from whites, blacks, Asian/Pacific Islanders, and American Indians/Alaska Natives.
The 2006-2010 Hispanic death rates do not include deaths from the District of Columbia, North Dakota and South Carolina.The 2001-2010 Hispanic mortality trends do not include deaths from the District of Columbia, Minnesota, New Hampshire,North Dakota and South Carolina.
f IBD = Intrahepatic Bile Duct. ONS = Other Nervous System.* The APC is significantly different from zero (p<.05).- Statistic not shown. Rate based on less than 16 cases for the time interval. Trend based on less than 10 cases for at least
one year within the time interval.
All Races White Black
Rateb APCc Rateb APCc Rateb APCc
2006-2010 2001-2010 2006-2010 2001-2010 2006-2010 2001-2010 All Sites 215.3 -1.8* All Sites 213.1 -1.7* All Sites 276.6 -2.6*Lung and Bronchus 63.5 -2.5* Lung and Bronchus 63.2 -2.4* Lung and Bronchus 78.5 -3.3*Prostate 23.0 -3.4* Prostate 21.2 -3.3* Prostate 50.9 -3.8*Colon and Rectum 19.6 -3.0* Colon and Rectum 19.1 -3.1* Colon and Rectum 28.7 -2.4*Pancreas 12.5 0.4* Pancreas 12.5 0.5* Pancreas 15.3 0.0Leukemia 9.5 -1.0* Leukemia 9.8 -0.9* Liver & IBDf 11.8 3.0*Liver & IBDf 8.3 2.5* Non-Hodgkin Lymphoma 8.5 -2.6* Stomach 9.8 -3.1*Non-Hodgkin Lymphoma 8.2 -2.6* Urinary Bladder 8.1 0.2 Leukemia 8.2 -1.3*Urinary Bladder 7.7 0.1 Esophagus 7.8 0.1 Myeloma 7.9 -1.3*Esophagus 7.6 -0.5* Liver & IBDf 7.6 2.6* Esophagus 7.7 -4.6*Kidney and Renal Pelvis 5.8 -1.0* Kidney and Renal Pelvis 5.9 -1.0* Non-Hodgkin Lymphoma 5.9 -2.0*Brain and ONSf 5.2 -0.5* Brain and ONSf 5.6 -0.4 Kidney and Renal Pelvis 5.7 -1.3*Stomach 4.9 -3.2* Melanoma of the Skin 4.6 1.0* Urinary Bladder 5.5 0.0Myeloma 4.3 -1.4* Stomach 4.2 -3.4* Oral Cavity and Pharynx 5.2 -4.1*Melanoma of the Skin 4.1 0.9* Myeloma 4.0 -1.5* Larynx 3.9 -4.0*Oral Cavity and Pharynx 3.8 -1.3* Oral Cavity and Pharynx 3.6 -0.8* Brain and ONSf 3.0 -0.8
Asian/Pacific Islander American Indian/Alaska Natived Hispanice
Rateb APCc Rateb APCc Rateb APCc
2006-2010 2001-2010 2006-2010 2001-2010 2006-2010 2001-2010 All Sites 132.4 -1.3* All Sites 191.0 -0.4 All Sites 152.1 -1.6*Lung and Bronchus 35.5 -1.6* Lung and Bronchus 49.6 -0.5 Lung and Bronchus 31.3 -2.8*Liver & IBDf 14.4 -1.0* Prostate 20.7 -1.4 Prostate 19.2 -3.0*Colon and Rectum 13.1 -2.3* Colon and Rectum 18.7 -1.5 Colon and Rectum 16.1 -1.4*Prostate 10.1 -2.3* Liver & IBDf 13.2 3.3 Liver & IBDf 12.3 1.9*Stomach 8.7 -3.1* Pancreas 10.1 3.5 Pancreas 9.6 0.5Pancreas 8.3 0.5 Kidney and Renal Pelvis 9.5 0.1 Stomach 7.6 -2.9*Non-Hodgkin Lymphoma 5.2 -2.0* Stomach 8.1 -5.7* Non-Hodgkin Lymphoma 6.5 -1.4*Leukemia 5.0 -0.2 Leukemia 7.0 3.7* Leukemia 6.1 -1.1*Esophagus 3.1 -1.1 Esophagus 6.1 -2.4 Kidney and Renal Pelvis 5.1 -1.5Oral Cavity and Pharynx 3.0 -2.6* Non-Hodgkin Lymphoma 5.4 -1.8 Esophagus 4.3 -0.3Kidney and Renal Pelvis 3.0 3.3* Urinary Bladder 4.1 - Urinary Bladder 4.0 -1.1Urinary Bladder 2.8 -1.0 Myeloma 3.6 -3.6* Myeloma 3.5 -1.9Brain and ONSf 2.3 -1.5 Oral Cavity and Pharynx 3.4 -3.4 Brain and ONSf 3.3 -0.1Myeloma 2.3 3.2* Brain and ONSf 2.8 1.0 Oral Cavity and Pharynx 2.5 -1.9*Soft Tissue including Heart 0.9 1.2 Larynx 2.1 - Larynx 1.7 -2.7*
Table 1.28Age-Adjusted U.S. Death Rates and Trends for the Top 15 Cancer Sitesa by Race/Ethnicity
Males

SEE
R C
ancer Statistics Review
1975-2010N
ational Cancer Institute
Source: US Mortality Files, National Center for Health Statistics, Centers for Disease Control and Prevention.a Top 15 cancer sites selected based on 2006-2010 age-adjusted rates for the race/ethnic group.b Rates are per 100,000 and age-adjusted to the 2000 US Std Population (19 age groups - Census P25-1130).c The APC is the Annual Percent Change over the time interval.
Trends are based on rates age-adjusted to the 2000 US Std Population (19 age groups - Census P25-1130).d Rates for American Indian/Alaska Native are based on the CHSDA(Contract Health Service Delivery Area) counties.e Hispanic is not mutually exclusive from whites, blacks, Asian/Pacific Islanders, and American Indians/Alaska Natives.
The 2006-2010 Hispanic death rates do not include deaths from the District of Columbia, North Dakota and South Carolina.The 2001-2010 Hispanic mortality trends do not include deaths from the District of Columbia, Minnesota, New Hampshire,North Dakota and South Carolina.
f IBD = Intrahepatic Bile Duct. ONS = Other Nervous System.* The APC is significantly different from zero (p<.05).- Statistic not shown. Rate based on less than 16 cases for the time interval. Trend based on less than 10 cases for at least
one year within the time interval.
All Races White Black
Rateb APCc Rateb APCc Rateb APCc
2006-2010 2001-2010 2006-2010 2001-2010 2006-2010 2001-2010 All Sites 149.7 -1.4* All Sites 149.8 -1.3* All Sites 171.2 -1.7*Lung and Bronchus 39.2 -0.9* Lung and Bronchus 40.4 -0.8* Lung and Bronchus 37.2 -1.2*Breast 22.6 -2.0* Breast 22.1 -2.0* Breast 30.8 -1.6*Colon and Rectum 13.9 -3.0* Colon and Rectum 13.4 -3.0* Colon and Rectum 19.0 -3.3*Pancreas 9.6 0.4* Pancreas 9.4 0.6* Pancreas 12.5 -0.1Ovary 8.1 -1.8* Ovary 8.4 -1.8* Corpus and Uterus, NOS 7.4 0.7*Leukemia 5.3 -1.3* Leukemia 5.5 -1.2* Ovary 6.7 -1.7*Non-Hodgkin Lymphoma 5.1 -3.1* Non-Hodgkin Lymphoma 5.3 -3.1* Myeloma 5.4 -2.2*Corpus and Uterus, NOS 4.3 0.5 Corpus and Uterus, NOS 4.0 0.4 Leukemia 4.8 -1.9*Brain and ONSf 3.5 -0.5* Brain and ONSf 3.8 -0.4 Stomach 4.7 -3.5*Liver & IBDf 3.4 1.6* Liver & IBDf 3.2 1.9* Cervix Uteri 4.2 -2.4*Myeloma 2.7 -2.3* Kidney and Renal Pelvis 2.6 -1.2* Liver & IBDf 4.1 0.8Kidney and Renal Pelvis 2.6 -1.3* Myeloma 2.5 -2.3* Non-Hodgkin Lymphoma 3.6 -3.0*Stomach 2.5 -2.7* Urinary Bladder 2.2 -0.4 Urinary Bladder 2.6 -1.9*Cervix Uteri 2.4 -1.5* Stomach 2.2 -2.7* Kidney and Renal Pelvis 2.6 -1.1*Urinary Bladder 2.2 -0.6* Cervix Uteri 2.2 -1.3* Esophagus 2.1 -5.2*
Asian/Pacific Islander American Indian/Alaska Natived Hispanice
Rateb APCc Rateb APCc Rateb APCc
2006-2010 2001-2010 2006-2010 2001-2010 2006-2010 2001-2010 All Sites 92.1 -1.0* All Sites 139.0 -1.1* All Sites 101.2 -1.2*Lung and Bronchus 18.4 -0.5 Lung and Bronchus 33.1 -0.8 Breast 14.8 -1.5*Breast 11.5 -1.7* Breast 15.5 -1.1 Lung and Bronchus 14.1 -1.1*Colon and Rectum 9.7 -1.6* Colon and Rectum 15.4 0.4 Colon and Rectum 10.2 -2.1*Pancreas 7.1 0.5 Pancreas 8.6 0.5 Pancreas 7.7 0.1Liver & IBDf 6.0 -1.5 Ovary 7.1 -2.3 Ovary 5.8 -1.2*Stomach 5.1 -3.7* Liver & IBDf 6.1 -1.1 Liver & IBDf 5.4 0.9*Ovary 4.8 -0.6 Kidney and Renal Pelvis 4.4 -0.7 Non-Hodgkin Lymphoma 4.4 -1.5*Non-Hodgkin Lymphoma 3.4 -2.0* Non-Hodgkin Lymphoma 4.3 -3.8 Stomach 4.4 -2.6*Leukemia 3.1 0.7 Stomach 3.8 -6.0* Leukemia 4.0 -0.6Corpus and Uterus, NOS 2.6 2.3* Cervix Uteri 3.5 -0.4 Corpus and Uterus, NOS 3.3 0.6Cervix Uteri 1.9 -4.6* Leukemia 3.3 -3.4 Cervix Uteri 2.9 -2.3*Brain and ONSf 1.6 1.6 Corpus and Uterus, NOS 3.2 - Brain and ONSf 2.4 -0.4Myeloma 1.3 -2.5 Myeloma 2.4 -6.2 Myeloma 2.3 -2.3*Kidney and Renal Pelvis 1.2 -0.3 Brain and ONSf 2.3 - Kidney and Renal Pelvis 2.3 -0.4Oral Cavity and Pharynx 1.2 -2.4 Gallbladder 2.0 -4.6 Gallbladder 1.3 -1.6
Table 1.29Age-Adjusted U.S. Death Rates and Trends for the Top 15 Cancer Sitesa by Race/Ethnicity
Females

Iowa
Seattle/Puget Sound
San Francisco/
San Jose/Monterey
LosAngeles
NewMexico
Utah
Georgia excluding AT/RG
Detroit Connecticut
Surveillance, Epidemiology, and End Results (SEER) Program: SEER 9, 13, & 18 Geographic Areas
National Cancer Institute, USA
http://seer.cancer.gov
Figure 1.1
Alaska Hawaii
Atlanta
Oakland
Louisiana
Kentucky
New Jersey
SF/SJM/LACalifornia excluding
Rural Georgia
San Francisco/Oakland, Connecticut, Detroit, Hawaii, Iowa, New Mexico, Seattle/Puget Sound, Utah, Atlanta. SEER 9 is this group.San Jose-Monterey, Los Angeles, Alaska Native Registry, Rural Georgia. SEER 13 is this group plus SEER 9.California excluding SF/SJM/LA, Georgia excluding AT/RG, Kentucky,Louisiana, New Jersey. SEER 18 is this group plus SEER 13.
SEE
R C
ancer Statistics Review
1975-2010N
ational Cancer Institute

All MalignantCancers 19.2%
HeartDisease 37.8%
CerebrovascularDiseases 10.3%
Chronic LungDisease 2.3%
Accidents 5.4%
Pneumonia andInfluenza 2.9%
Other Causes 22.0%
All MalignantCancers 23.3%
HeartDisease 24.2%Cerebrovascular
Diseases 5.2%
Chronic LungDisease 5.6%
Accidents 4.9%
Pneumonia andInfluenza 2.0%
Other Causes 34.7%
Figure 1.2
Leading Causes of Death in US, 1975 vs 2010Percent of All Causes of Death
Source: US Mortality Files, National Center for Health Statistics, Centers for Disease Control and Prevention.
1975 2010
SEE
R C
ancer Statistics Review
1975-2010N
ational Cancer Institute

30
40
50
60
70
80
90
100
110
1975 1980 1985 1990 1995 2000 2005 2010500
1000
1500
2000
2500
3000
3500
1975 1980 1985 1990 1995 2000 2005 2010
Figure 1.3
Us Death Rates, 1975-2010Heart Disease compared to Neoplasms, by age at death
Source: US Mortality Files, National Center for Health Statistics, Centers for Disease Control and Prevention.Rates are per 100,000 and age-adjusted to the 2000 US Std Population (19 age groups - Census P25-1103).
Ages Less Than 65 Ages 65 and Over
Heart Disease 26% ofdeathsin 1975
Heart Disease 18% ofdeathsin 2010
Neoplasms 22% ofdeathsin 1975
Neoplasms 27% ofdeathsin 2010
Heart Disease 44% ofdeathsin 1975
Heart Disease 27% ofdeathsin 2010
Neoplasms 18% ofdeathsin 1975
Neoplasms 22% ofdeathsin 2010
Rate per 100,000
Year of Death Year of Death
SEE
R C
ancer Statistics Review
1975-2010N
ational Cancer Institute

Colon & RectumProstate
Lung & Bronchus (Male)LarynxOvary
Cervix UteriStomach
EsophagusLung & Bronchus (Female)
Breast (Female)Urinary BladderAll Cancer Sites
LeukemiaAll Sites Except Lung
Brain & Other Nervous SystemHodgkin Lymphoma
Non-Hodgkin LymphomaOral Cavity & Pharynx
MyelomaTestis
Corpus & Uterus, NOSPancreas
Melanoma of the SkinKidney & Renal Pelvis
Liver & Intrahepatic Bile DuctThyroid
-10 -8 -6 -4 -2 0 2 4 6 8 10
-2.6*-2.3*-2.2*-2.1*-1.7*-1.7*-1.1*-0.9*-0.7*-0.6-0.6*-0.6*-0.5*-0.5*-0.300.10.20.40.6*0.9*0.9*
1.5*2.4*
3.6*6.3*
-10 -8 -6 -4 -2 0 2 4 6 8 10-10 -8 -6 -4 -2 0 2 4 6 8 10
ProstateColon & Rectum
StomachNon-Hodgkin LymphomaLung & Bronchus (Male)
Hodgkin LymphomaLarynx
Breast (Female)Ovary
MyelomaCervix Uteri
All Cancer SitesAll Sites Except Lung
Oral Cavity & PharynxLeukemia
Kidney & Renal PelvisLung & Bronchus (Female)
EsophagusBrain & Other Nervous System
TestisUrinary Bladder
Corpus & Uterus, NOSMelanoma of the Skin
PancreasThyroid
Liver & Intrahepatic Bile Duct
-10 -8 -6 -4 -2 0 2 4 6 8 10
-3.4*-2.9*-2.9*-2.8*-2.5*-2.5*-2.4*-2*-1.8*-1.8*-1.5*-1.5*-1.4*-1.3*-1*-1*-0.9*-0.6*-0.5*-0.30.10.50.5*0.5*
1.2*2.4*
-10 -8 -6 -4 -2 0 2 4 6 8 10-10 -8 -6 -4 -2 0 2 4 6 8 10
Source: SEER 18 areas (San Francisco, Connecticut, Detroit, Hawaii, Iowa, New Mexico, Seattle, Utah, Atlanta, San Jose-Monterey, Los Angeles,Alaska Native Registry, Rural Georgia, California excluding SF/SJM/LA, Kentucky, Louisiana, New Jersey and Georgia excluding ATL/RG) and US Mortality Files, National Center for Health Statistics, Centers for Disease Control and Prevention.Underlying rates are per 100,000 and age-adjusted to the 2000 US Std Population (19 age groups - Census P25-1103).For sex-specific cancer sites, the population was limited to the population of the appropriate sex.The APC is significantly different from zero (p<.05).Ovary excludes borderline cases or histologies 8442, 8451, 8462, 8472, and 8473.
*
Figure 1.4
Trends in SEER Incidence and US Death Ratesby Primary Cancer Site
2001-2010Trends in SEER Incidence Rates Trends in US Cancer Death Rates
Annual Percent Change, 2001-2010 Annual Percent Change, 2001-2010
a
Ovary a
SEE
R C
ancer Statistics Review
1975-2010N
ational Cancer Institute

Lung & Bronchus (Male)Larynx
Lung & Bronchus (Female)Urinary Bladder
OvaryCervix UteriEsophagus
Breast (Female)Colon & Rectum
ProstateNon-Hodgkin Lymphoma
Brain & Other Nervous SystemAll Cancer Sites
Hodgkin LymphomaStomach
LeukemiaMelanoma of the SkinAll Sites Except Lung
Oral Cavity & PharynxMyeloma
TestisPancreas
Corpus & Uterus, NOSKidney & Renal Pelvis
Liver & Intrahepatic Bile DuctThyroid
-4-2.9-2.6-2.2-1.7-1.6-1-0.9-0.7-0.5-0.5-0.5-0.3-0.2-0.2-0.1-0.100.30.40.61
1.52.7
4.76.2
-8 -6 -4 -2 0 2 4 6 8
-4*-2.9*-2.6*-2.2*-1.7*-1.6*-1*-0.9*-0.7*-0.5-0.5*-0.5*-0.3-0.2-0.2-0.1-0.100.30.40.6*1*
1.5*2.7*
4.7*6.2*
-8 -6 -4 -2 0 2 4 6 8-8 -6 -4 -2 0 2 4 6 8
Colon & RectumProstate
Cervix UteriOvary
Lung & Bronchus (Male)Larynx
StomachLeukemia
EsophagusAll Sites Except Lung
All Cancer SitesBreast (Female)
Corpus & Uterus, NOSUrinary Bladder
Oral Cavity & PharynxLung & Bronchus (Female)
Brain & Other Nervous SystemMyeloma
Non-Hodgkin LymphomaTestis
Hodgkin LymphomaPancreas
Kidney & Renal PelvisLiver & Intrahepatic Bile Duct
Melanoma of the SkinThyroid
-8 -6 -4 -2 0 2 4 6 8 10
-3.6*-3.2*-2.4*-1.6*-1.6*-1.5*-1.5*-0.9*-0.9*-0.9*-0.9*-0.40000.10.10.40.5*0.70.90.9*
2.1*2.6*
3.6*6.7*
-8 -6 -4 -2 0 2 4 6 8 10-8 -6 -4 -2 0 2 4 6 8 10
Source: SEER 18 areas (San Francisco, Connecticut, Detroit, Hawaii, Iowa, New Mexico, Seattle, Utah, Atlanta, San Jose-Monterey, Los Angeles,Alaska Native Registry, Rural Georgia, California excluding SF/SJM/LA, Kentucky, Louisiana, New Jersey and Georgia excluding ATL/RG).Underlying rates are per 100,000 and age-adjusted to the 2000 US Std Population (19 age groups - Census P25-1103).For sex-specific cancer sites, the population was limited to the population of the appropriate sex.The APC is significantly different from zero (p<.05).Ovary excludes borderline cases or histologies 8442, 8451, 8462, 8472, and 8473.
*
Figure 1.5
Trends in SEER Incidence Ratesby Age Group and Primary Cancer Site
2001-2010Ages Less Than 65 Ages 65 and Over
Annual Percent Change, 2001-2010 Annual Percent Change, 2001-2010
a
Ovary a
Ovary a
SEE
R C
ancer Statistics Review
1975-2010N
ational Cancer Institute

Non-Hodgkin LymphomaLung & Bronchus (Male)
Hodgkin LymphomaLarynx
Lung & Bronchus (Female)Myeloma
OvaryBreast (Female)
Kidney & Renal PelvisLeukemia
All Cancer SitesStomach
Oral Cavity & PharynxColon & Rectum
All Sites Except LungBrain & Other Nervous System
Melanoma of the SkinCervix Uteri
ProstateEsophagus
Urinary BladderThyroid
TestisPancreas
Corpus & Uterus, NOSLiver & Intrahepatic Bile Duct
-8 -6 -4 -2 0 2 4 6 8
-4.7*-3.9*-3.8*-3.2*-2.8*-2.8*-2.6*-2.6*-2.2*-2.1*-2*-1.8*-1.8*-1.5*-1.5*-1.4*-1.3*-1.2*-1.2*-1*-0.9*-0.300.2*
1.2*3.6*
-8 -6 -4 -2 0 2 4 6 8-8 -6 -4 -2 0 2 4 6 8
ProstateColon & Rectum
StomachCervix Uteri
Lung & Bronchus (Male)Non-Hodgkin Lymphoma
TestisLarynx
Breast (Female)Myeloma
OvaryAll Sites Except Lung
All Cancer SitesHodgkin Lymphoma
Oral Cavity & PharynxLeukemia
Kidney & Renal PelvisEsophagus
Lung & Bronchus (Female)Corpus & Uterus, NOS
Brain & Other Nervous SystemUrinary Bladder
PancreasLiver & Intrahepatic Bile Duct
ThyroidMelanoma of the Skin
-8 -6 -4 -2 0 2 4 6 8
-3.5*-3.4*-3.3*-2.2*-2.1*-2.1*-1.9-1.9*-1.5*-1.5*-1.4*-1.4*-1.3*-1.1*-1*-0.6*-0.4*-0.4*-0.20.10.30.3*0.5*
1.6*1.8*1.8*
-8 -6 -4 -2 0 2 4 6 8-8 -6 -4 -2 0 2 4 6 8
Source: US Mortality Files, National Center for Health Statistics, Centers for Disease Control and Prevention.Underlying rates are per 100,000 and age-adjusted to the 2000 US Std Population (19 age groups - Census P25-1103).For sex-specific cancer sites, the population was limited to the population of the appropriate sex.The APC is significantly different from zero (p<.05).*
Figure 1.6
Trends in US Death Ratesby Age Group and Primary Cancer Site
2001-2010Ages Less Than 65 Ages 65 and Over
Annual Percent Change, 2001-2010 Annual Percent Change, 2001-2010
SEE
R C
ancer Statistics Review
1975-2010N
ational Cancer Institute

Colon & Rectum
Prostate
Larynx
Lung & Bronchus
Stomach
All Cancer Sites
All Sites Except Lung
Esophagus
Leukemia
Urinary Bladder
Brain & Other Nervous System
Hodgkin Lymphoma
Non-Hodgkin Lymphoma
Oral Cavity & Pharynx
Myeloma
Testis
Pancreas
Melanoma of the Skin
Kidney & Renal Pelvis
Liver & Intrahepatic Bile Duct
Thyroid
-10 -8 -6 -4 -2 0 2 4 6 8 10
-2.9*
-2.3*
-2.3*
-2.2*
-1.5*
-1.1*
-1*
-0.9*
-0.8*
-0.7*
-0.3
0.1
0.2
0.2
0.6*
0.6*
0.8*
1.8*
2.2*
3.8*
5.6*
-10 -8 -6 -4 -2 0 2 4 6 8 10-10 -8 -6 -4 -2 0 2 4 6 8 10
Colon & RectumEsophagus
LarynxOvary
Cervix UteriUrinary Bladder
Lung & Bronchus
BreastStomach
LeukemiaBrain & Other Nervous System
All Cancer Sites
Oral Cavity & PharynxAll Sites Except Lung
Non-Hodgkin Lymphoma
Hodgkin LymphomaMyeloma
Corpus & Uterus, NOSPancreas
Melanoma of the Skin
Kidney & Renal PelvisLiver & Intrahepatic Bile Duct
Thyroid
-10 -8 -6 -4 -2 0 2 4 6 8 10
-2.4*
-1.9*
-1.8*
-1.7*
-1.7*
-0.9*
-0.7*
-0.6
-0.6
-0.4
-0.4
-0.3
-0.2
-0.2
-0.1
-0.1
0.1
0.9*
1*
1.2*
2.3*
2.6*
6.5*
-10 -8 -6 -4 -2 0 2 4 6 8 10-10 -8 -6 -4 -2 0 2 4 6 8 10
Source: SEER 18 areas (San Francisco, Connecticut, Detroit, Hawaii, Iowa, New Mexico, Seattle, Utah, Atlanta, San Jose-Monterey, Los Angeles,Alaska Native Registry, Rural Georgia, California excluding SF/SJM/LA, Kentucky, Louisiana, New Jersey and Georgia excluding ATL/RG).Underlying rates are per 100,000 and age-adjusted to the 2000 US Std Population (19 age groups - Census P25-1103).For sex-specific cancer sites, the population was limited to the population of the appropriate sex.The APC is significantly different from zero (p<.05).Ovary excludes borderline cases or histologies 8442, 8451, 8462, 8472, and 8473.
*
Figure 1.7
Trends in SEER Incidence Ratesby Sex and Primary Cancer Site
2001-2010All Races, Males All Races, Females
a
Ovary a
Annual Percent Change, 2001-2010 Annual Percent Change, 2001-2010
SEE
R C
ancer Statistics Review
1975-2010N
ational Cancer Institute

Prostate
Stomach
Colon & Rectum
Larynx
Non-Hodgkin Lymphoma
Lung & Bronchus
Hodgkin Lymphoma
All Cancer Sites
All Sites Except Lung
Myeloma
Oral Cavity & Pharynx
Leukemia
Kidney & Renal Pelvis
Brain & Other Nervous System
Esophagus
Testis
Urinary Bladder
Pancreas
Melanoma of the Skin
Thyroid
Liver & Intrahepatic Bile Duct
-8 -6 -4 -2 0 2 4 6 8
-3.4*
-3.2*
-3*
-2.7*
-2.6*
-2.5*
-2.3*
-1.8*
-1.5*
-1.4*
-1.3*
-1*
-1*
-0.5*
-0.5*
-0.3
0.1
0.4*
0.9*
1.5*
2.5*
-8 -6 -4 -2 0 2 4 6 8-8 -6 -4 -2 0 2 4 6 8
Non-Hodgkin LymphomaColon & Rectum
Hodgkin LymphomaStomach
MyelomaLarynxBreast
OvaryAll Sites Except Lung
Cervix UteriEsophagus
Oral Cavity & Pharynx
All Cancer SitesLeukemia
Kidney & Renal Pelvis
Lung & BronchusUrinary Bladder
Brain & Other Nervous SystemMelanoma of the Skin
Pancreas
Corpus & Uterus, NOSThyroid
Liver & Intrahepatic Bile Duct
-8 -6 -4 -2 0 2 4 6 8
-3.1*
-3*
-2.8*
-2.7*
-2.3*
-2.1*
-2*
-1.8*
-1.6*
-1.5*
-1.5*
-1.5*
-1.4*
-1.3*
-1.3*
-0.9*
-0.6*
-0.5*
-0.2
0.4*
0.5
1.1*
1.6*
-8 -6 -4 -2 0 2 4 6 8-8 -6 -4 -2 0 2 4 6 8
Source: US Mortality Files, National Center for Health Statistics, Centers for Disease Control and Prevention.Underlying rates are per 100,000 and age-adjusted to the 2000 US Std Population (19 age groups - Census P25-1103).For sex-specific cancer sites, the population was limited to the population of the appropriate sex.The APC is significantly different from zero (p<.05).*
Figure 1.8
Trends in US Death Ratesby Sex and Primary Cancer Site
2001-2010All Races, Males All Races, Females
Annual Percent Change, 2001-2010 Annual Percent Change, 2001-2010
SEE
R C
ancer Statistics Review
1975-2010N
ational Cancer Institute

0
50
100
150
200
250
300
350
400
450
500
550
600
650
700
SEER Incidence US Mortality
Black White
010203040506070
Male
0
50
100
150
200
250
300
350
400
450
500
550
600
650
700
SEER Incidence US Mortality
010203040506070
Female
Figure 1.9
SEER Incidence and US Death Rates, 2006-20105-Year Relative Survival, 2003-2009
All Cancer Combined, by Race and Sex
a b
c
Incidence rates are from the SEER 18 areas (San Francisco, Connecticut, Detroit, Hawaii, Iowa, New Mexico, Seattle, Utah, Atlanta, San Jose-Monterey, Los Angeles, Alaska Native Registry,Rural Georgia,California excluding SF/SJM/LA, Kentucky, Louisiana, New Jersey and Georgia excluding ATL/RG) and are age-adjusted to the 2000 US Std Population (19 age groups - Census P25-1103).Death rates are from the US Mortality Files, National Center for Health Statistics, Centers for Disease Control and Prevention and are age-adjusted to the 2000 US Std Population (19 age groups - Census P25-1103).Survival rates are from the SEER 18 areas (San Francisco, Connecticut, Detroit, Hawaii, Iowa, New Mexico, Seattle, Utah, Atlanta, San Jose-Monterey, Los Angeles, Alaska Native Registry, Rural Georgia, California excluding SF/SJM/LA, Kentucky, Louisiana, New Jersey and Georgia excluding ATL/RG).
Males Females
Survival, 2003-2009 Survival, 2003-2009
Rate per 100,000 Rate per 100,000
Percent (%) Percent (%)
a
b
c
SEE
R C
ancer Statistics Review
1975-2010N
ational Cancer Institute

-6 -4 -2 0 2 4 6
Prostate
Colon & Rectum
Stomach
Non-Hodgkin Lymphoma
Lung & Bronchus (Male)
Hodgkin Lymphoma
Breast (Female)
Larynx
Ovary
Myeloma
All Cancer Sites
Cervix Uteri
Kidney & Renal Pelvis
Leukemia
Lung & Bronchus (Female)
Oral Cavity & Pharynx
Brain & ONS
Esophagus
Testis
Urinary Bladder
Corpus & Uterus, NOS
Pancreas
Thyroid
Liver & IBD
White
Black
Figure 1.10
Trends in US Death Rates, 2001-2010All Ages, by Race and Primary Cancer Site
Source: US Mortality Files, National Center for Health Statistics, Centers for Disease Control and Prevention.The APC is the Annual Percent Change over the time interval.Trends are based on rates age-adjusted to the 2000 US Std Population (19 age groups - Census P25-1130).
APC, 2001-2010
SEER Cancer Statistics Review 1975-2010 National Cancer Institute

100
98
96
91
90
86
84
78
77
72
70
69
67
65
64
61
56
44
43
32
26
18
17
15
8
6 5
8
11
13
11
27
40
43
36
50
54
43
56
61
59
62
70
53
65
61
81
79
73
90
97
97
Figure 1.11
5-Year Relative Survival (%)SEER Program, 2003-2009
Both Sexes, by Race and Cancer Site
White Patients Cancer Site Black Patients
Prostate
Thyroid
Testis
Melanoma of the Skin
Breast (Female)
Hodgkin Lymphoma
Corpus & Uterus, NOS
Urinary Bladder
Kaposi Sarcoma
Kidney & Renal Pelvis
Non-Hodgkin Lymphoma
Cervix Uteri
Rectum
Colon
Oral Cavity & Pharynx
Larynx
Leukemia
Ovary
Myeloma
Brain & ONS
Stomach
Esophagus
Lung & Bronchus
Liver & IBD
Mesothelioma
Pancreas
Source: SEER 18 areas (San Francisco, Connecticut, Detroit, Hawaii, Iowa, New Mexico, Seattle, Utah, Atlanta, San Jose-Monterey, Los Angeles, Alaska Native Registry, Rural Georgia, California excluding SF/SJM/LA, Kentucky, Louisiana, New Jersey and Georgia excluding ATL/RG).Ovary excludes borderline cases or histologies 8442, 8451, 8462, 8472, and 8473.a
a
SEER Cancer Statistics Review 1975-2010 National Cancer Institute

19.2
20.7
10.1
50.9
21.2
14.8
15.5
11.5
30.8
22.1
12.7
16.9
11.2
22.8
15.9
21.3
40.2
25.5
53.5
50.2
Figure 1.12
SEER Cancer Incidence and US Death Rates, 2006-2010By Cancer Site and Race/Ethnicity
Source: SEER 18 areas (San Francisco, Connecticut, Detroit, Hawaii, Iowa, New Mexico, Seattle, Utah, Atlanta, San Jose-Monterey, Los Angeles, Alaska Native Registry, Rural Georgia, California excluding SF/SJM/LA, Kentucky, Louisiana, New Jersey and Georgia excluding ATL/RG) and US Mortality Files, National Center for Health Statistics, Centers for Disease Control and Prevention.Rates for American Indian/Alaska Native are based on the CHSDA (Contract Health Service Delivery Area)counties.Hispanic is not mutually exclusive from whites, blacks, Asian/Pacific Islanders, and American Indians/AlaskaNatives.Incidence data for Hispanics are based on NHIA and exclude cases from the Alaska Native Registry.Mortality data for Hispanics exclude cases from the District of Columbia, North Dakota and South Carolina.
b
Incidence Cancer Site MortalityLung and Bronchus
Colon and Rectum
Female Breast
Prostate
White
Black
Asian/Pacific Islander
Am. Indian/Alaska Nat.
Hispanic
63.1
69.7
37.6
42.1
32.2
44.2
55.3
37.6
39.9
37.7
127.4
121.4
91.8
77.1
90.8
144.9
228.5
81.8
77.8
125.8
a
White
Black
Asian/Pacific Islander
Am. Indian/Alaska Nat.
Hispanic
White
Black
Asian/Pacific Islander
Am. Indian/Alaska Nat.
Hispanic
White
Black
Asian/Pacific Islander
Am. Indian/Alaska Nat.
Hispanic
a
a
a
a
b
b
b
b
SEER Cancer Statistics Review 1975-2010 National Cancer Institute
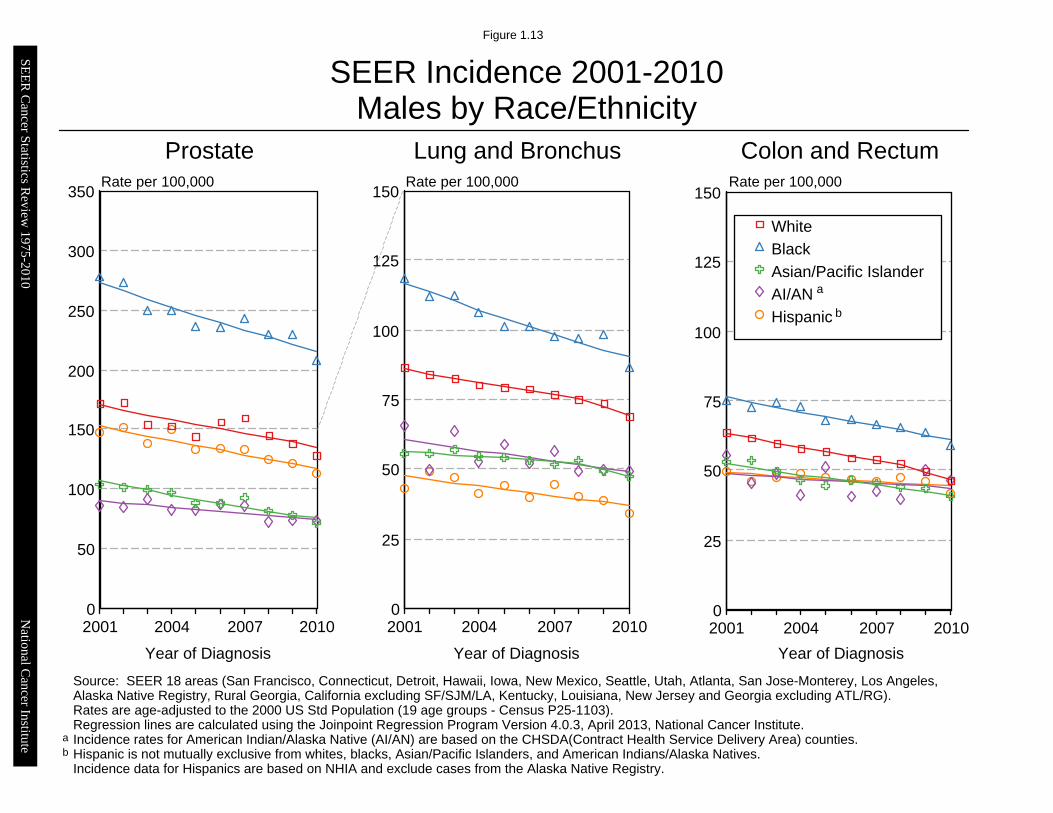
0
50
100
150
200
250
300
350
2001 2004 2007 20100
25
50
75
100
125
150
2001 2004 2007 20100
25
50
75
100
125
150
2001 2004 2007 2010
WhiteBlackAsian/Pacific IslanderAI/ANHispanic
SEER Incidence 2001-2010Males by Race/Ethnicity
Figure 1.13
Source: SEER 18 areas (San Francisco, Connecticut, Detroit, Hawaii, Iowa, New Mexico, Seattle, Utah, Atlanta, San Jose-Monterey, Los Angeles,Alaska Native Registry, Rural Georgia, California excluding SF/SJM/LA, Kentucky, Louisiana, New Jersey and Georgia excluding ATL/RG).Rates are age-adjusted to the 2000 US Std Population (19 age groups - Census P25-1103).Regression lines are calculated using the Joinpoint Regression Program Version 4.0.3, April 2013, National Cancer Institute.Incidence rates for American Indian/Alaska Native (AI/AN) are based on the CHSDA(Contract Health Service Delivery Area) counties.Hispanic is not mutually exclusive from whites, blacks, Asian/Pacific Islanders, and American Indians/Alaska Natives.Incidence data for Hispanics are based on NHIA and exclude cases from the Alaska Native Registry.
Prostate Lung and Bronchus Colon and RectumRate per 100,000 Rate per 100,000 Rate per 100,000
Year of Diagnosis Year of Diagnosis Year of Diagnosis
a
ab
b
SEE
R C
ancer Statistics Review
1975-2010N
ational Cancer Institute

0
20
40
60
80
100
120
140
160
2001 2004 2007 20100
20
40
60
80
100
2001 2004 2007 20100
20
40
60
80
100
2001 2004 2007 2010
White
Black
Asian/Pacific Islander
AI/AN
Hispanic
SEER Incidence 2001-2010Females by Race/Ethnicity
Figure 1.14
Breast Lung and Bronchus Colon and RectumRate per 100,000 Rate per 100,000 Rate per 100,000
Year of Diagnosis Year of Diagnosis Year of Diagnosis
a
Source: SEER 18 areas (San Francisco, Connecticut, Detroit, Hawaii, Iowa, New Mexico, Seattle, Utah, Atlanta, San Jose-Monterey, Los Angeles,Alaska Native Registry, Rural Georgia, California excluding SF/SJM/LA, Kentucky, Louisiana, New Jersey and Georgia excluding ATL/RG).Rates are age-adjusted to the 2000 US Std Population (19 age groups - Census P25-1103).Regression lines are calculated using the Joinpoint Regression Program Version 4.0.3, April 2013, National Cancer Institute.Incidence rates for American Indian/Alaska Native (AI/AN) are based on the CHSDA(Contract Health Service Delivery Area) counties.Hispanic is not mutually exclusive from whites, blacks, Asian/Pacific Islanders, and American Indians/Alaska Natives.Incidence data for Hispanics are based on NHIA and exclude cases from the Alaska Native Registry.
ab
b
SEE
R C
ancer Statistics Review
1975-2010N
ational Cancer Institute

0
20
40
60
80
100
120
140
2001 2004 2007 20100
20
40
60
80
100
120
140
2001 2004 2007 20100
20
40
60
80
2001 2004 2007 2010
WhiteBlackAsian/Pacific IslanderAI/ANHispanic
US Mortality 2001-2010Males by Race/Ethnicity
Figure 1.15
Source: US Mortality Files, National Center for Health Statistics, Centers for Disease Control and Prevention.Rates are age-adjusted to the 2000 US Std Population (19 age groups - Census P25-1103).Regression lines are calculated using the Joinpoint Regression Program Version 4.0.3, April 2013, National Cancer Institute.Mortality rates for American Indian/Alaska Native (AI/AN) are based on the CHSDA(Contract Health Service Delivery Area) counties.Hispanic is not mutually exclusive from whites, blacks, Asian/Pacific Islanders, and American Indians/Alaska Natives.Mortality data for Hispanics excludes cases from the District of Columbia, Maine, Minnesota, New Hampshire, North Dakota, and Oklahoma.
b
Prostate Lung and Bronchus Colon and RectumRate per 100,000 Rate per 100,000 Rate per 100,000
Year of Death Year of Death Year of Death
a
b
a
SEE
R C
ancer Statistics Review
1975-2010N
ational Cancer Institute

0
10
20
30
40
50
2001 2004 2007 20100
10
20
30
40
50
2001 2004 2007 20100
10
20
30
40
50
2001 2004 2007 2010
WhiteBlackAsian/Pacific IslanderAI/ANHispanic
US Mortality 2001-2010Females by Race/Ethnicity
Figure 1.16
Source: US Mortality Files, National Center for Health Statistics, Centers for Disease Control and Prevention.Rates are age-adjusted to the 2000 US Std Population (19 age groups - Census P25-1103).Regression lines are calculated using the Joinpoint Regression Program Version 4.0.3, April 2013, National Cancer Institute.Mortality rates for American Indian/Alaska Native (AI/AN) are based on the CHSDA(Contract Health Service Delivery Area) counties.Hispanic is not mutually exclusive from whites, blacks, Asian/Pacific Islanders, and American Indians/Alaska Natives.Mortality data for Hispanics excludes cases from the District of Columbia, Maine, Minnesota, New Hampshire, North Dakota, and Oklahoma.
b
Breast Lung and Bronchus Colon and RectumRate per 100,000 Rate per 100,000 Rate per 100,000
Year of Death Year of Death Year of Death
a
b
a
SEE
R C
ancer Statistics Review
1975-2010N
ational Cancer Institute

-30 -20 -10 0 10 20 30 40 50 60 70 80 90 100
Prostate
Colon & Rectum
LarynxCervix Uteri
Ovary
Lung & Bronchus
Esophagus
Breast (Female)All Cancer Sites
Stomach
Leukemia
Urinary BladderBrain & ONS
Hodgkin Lymphoma
Oral Cavity & Pharynx
Non-Hodgkin Lymphoma
TestisCorpus & Uterus, NOS
Myeloma
Pancreas
Melanoma of the Skin
Kidney & Renal PelvisLiver & IBD
Thyroid
Burden Risk
Figure 1.17
Incidence Percent Change between 2001 and 2010Numbers (burden) vs Rates (risk)All Races, All Ages, Both Sexes
Percent change (%)Source: SEER 18 areas (San Francisco, Connecticut, Detroit, Hawaii, Iowa, New Mexico, Seattle, Utah, Atlanta, San Jose-Monterey, Los Angeles,Alaska Native Registry, Rural Georgia, California excluding SF/SJM/LA, Kentucky, Louisiana, New Jersey and Georgia excluding ATL/RG).Burden is the change in the number of incidence cases between 2001 and 2010.Risk is the change in the cancer incidence rates between 2001 and 2010.Ovary excludes borderline cases or histologies 8442, 8451, 8462, 8472, and 8473.a
Ovary a
SEE
R C
ancer Statistics Review
1975-2010N
ational Cancer Institute

-40 -30 -20 -10 0 10 20 30 40 50 60
Prostate
Colon & Rectum
Non-Hodgkin Lymphoma
Stomach
Larynx
Hodgkin Lymphoma
Breast (Female)
Cervix Uteri
Lung & Bronchus
Ovary
Myeloma
All Cancer Sites
Leukemia
Oral Cavity & Pharynx
Kidney & Renal Pelvis
Brain & ONS
Esophagus
Urinary Bladder
Melanoma of the Skin
Pancreas
Thyroid
Corpus & Uterus, NOS
Testis
Liver & IBD
Burden Risk
Figure 1.18
Mortality Percent Change between 2001 and 2010Numbers (burden) vs Rates (risk)All Races, All Ages, Both Sexes
Percent change (%)
US Mortality estimates based on US age-specific rates applied to US population.Burden is the change in the number of deaths between 2001 and 2010.Risk is the change in the cancer death rates between 2001 and 2010.
SEE
R C
ancer Statistics Review
1975-2010N
ational Cancer Institute

0 500 1,000 1,500 2,000 2,500 3,000
Testis
Hodgkin Lymphoma
Childhood Ages (0-14)
Cervix Uteri
Corpus & Uterus, NOS
Oral Cavity & Pharynx
Myeloma
Melanoma of the Skin
Urinary Bladder
Stomach
Kidney & Renal Pelvis
Esophagus
Ovary
Prostate
Non-Hodgkin Lymphoma
Brain & ONS
Liver & IBD
Leukemia
Pancreas
Breast (Female)
Colon & Rectum
Lung & Bronchus
14.5
28.4
94.2
103.7
141.1
146
149.2
160.6
166
181.6
206.3
229.6
253.7
272.5
286.2
306.7
347
361.7
545.1
770.5
774.4
2,372.8
0 10 20 30 40 50 60 70 80 90
Prostate
Urinary Bladder
Myeloma
Non-Hodgkin Lymphoma
Pancreas
Colon & Rectum
Lung & Bronchus
Kidney & Renal Pelvis
Esophagus
Stomach
Leukemia
Corpus & Uterus, NOS
Liver & IBD
Oral Cavity & Pharynx
Ovary
Melanoma of the Skin
Breast (Female)
Brain & ONS
Hodgkin Lymphoma
Cervix Uteri
Testis
Childhood Ages (0-14)
9.5
11.3
13.5
14.1
14.8
14.9
15
15.6
15.8
15.9
16
16.8
17.1
17.2
17.4
17.5
18.8
21.7
23.1
26.3
36.3
71.2
Figure 1.19
Source: US Mortality Files, National Center for Health Statistics, Centers for Disease Control and Prevention and 2008 Life Tables.
Person-Years of Life LostDue to Cancer
All Races, Both Sexes, 2010
Average Years of Life LostPer Person Dying of CancerAll Races, Both Sexes, 2010
Years in Thousands Years
SEE
R C
ancer Statistics Review
1975-2010N
ational Cancer Institute

0 2 4 6 8 10 12
Atherosclerosis
Aortic Aneurysm & Dissection
Human Immunodefieciency Virus
Septicemia
Alzheimers Disease
Pneumonia & Influenza
Nephritis & Nephrosis
Cirrohosis
Homicide
Diabetes Mellitus
Suicide & Self-Inflicted Injury
Cerebrovascular
Chronic Lung Disease
Accidents
Heart Disease
All Other Causes
Malignant Neoplasms
0.1
0.1
0.3
0.5
0.5
0.5
0.6
0.7
0.8
1
1.3
1.4
1.6
3.6
7
7.9
8.9
0 10 20 30 40 50 60 70 80
Alzheimers Disease
Atherosclerosis
Pneumonia & Influenza
Cerebrovascular
Nephritis & Nephrosis
Chronic Lung Disease
Heart Disease
Aortic Aneurysm & Dissection
Septicemia
Diabetes Mellitus
Malignant Neoplasms
All Other Causes
Cirrohosis
Accidents
Human Immunodefieciency Virus
Suicide & Self-Inflicted Injury
Homicide
6.4
7.9
10.7
10.8
11.5
11.7
11.7
13.2
14.1
14.6
15.5
15.7
22.9
29.6
31.6
33.8
45.4
Figure 1.20
Source: US Mortality Files, National Center for Health Statistics, Centers for Disease Control and Prevention and 2008 Life Tables.
Person-Years of Life LostDue to Major Causes of Death in US
All Races, Both Sexes, 2010
Average Years of Life Lost Per PersonDue to Major Causes of Death in US
All Races, Both Sexes, 2010
Years in Millions Years
SEE
R C
ancer Statistics Review
1975-2010N
ational Cancer Institute

350
400
450
500
550
600
650
700
1975 1990 2000 2010350
400
450
500
550
600
650
700
1975 1990 2000 2010350
375
400
425
450
1975 1990 2000 2010
Delay-Adjusted IncidenceDelay-Adjusted Incidence
Observed IncidenceObserved Incidence
SEER Observed Incidence and Delay Adjusted Incidence RatesAll Cancer Sites, By Sex
aFigure 1.21
Source: SEER 9 areas. Rates are age-adjusted to the 2000 US Std Population (19 age groups - Census P25-1103).Regression lines and APCs are calculated using the Joinpoint Regression Program Version 4.0.3, April 2013, National Cancer Institute.The APC is the Annual Percent Change for the regression line segments. The APC shown on the graph is for the most recent trend.The APC is significantly different from zero (p < 0.05).
a
*
Both Sexes Male FemaleRate per 100,000 Rate per 100,000 Rate per 100,000
Year of Diagnosis Year of Diagnosis Year of Diagnosis
SEER Incidence APCsDelay Adj, 1998-10 = -0.3*Observed, 1999-10 = -0.5*
SEER Incidence APCsDelay Adj, 2000-10 = -0.8*Observed, 2000-10 = -0.9*
SEER Incidence APCsDelay Adj, 2004-10 = 0.3Observed, 1998-10 = -0.3*
SEE
R C
ancer Statistics Review
1975-2010N
ational Cancer Institute

40
45
50
55
60
65
70
1975 1980 1985 1990 1995 2000 2005 201040
45
50
55
60
65
70
1975 1980 1985 1990 1995 2000 2005 2010
Delay-Adjusted IncidenceDelay-Adjusted Incidence
Observed IncidenceObserved Incidence
SEER Observed Incidence and Delay Adjusted Incidence RatesBoth Sexes
aFigure 1.22
Source: SEER 9 areas. Rates are age-adjusted to the 2000 US Std Population (19 age groups - Census P25-1103).Regression lines and APCs are calculated using the Joinpoint Regression Program Version 4.0.3, April 2013, National Cancer Institute.The APC is the Annual Percent Change for the regression line segments. The APC shown on the graph is for the most recent trend.The APC is significantly different from zero (p < 0.05).
a
*
Lung and Bronchus Colon and RectumRate per 100,000 Rate per 100,000
Year of Diagnosis Year of Diagnosis
SEER Incidence APCsDelay Adj, 2007-10 = -2.1*Observed, 2007-10 = -2.6*
SEER Incidence APCsDelay Adj, 1998-10 = -2.4*Observed, 2008-10 = -5.1*
SEE
R C
ancer Statistics Review
1975-2010N
ational Cancer Institute

0
25
50
75
100
125
150
175
200
225
250
1975 1990 2000 20100
25
50
75
100
125
1975 1990 2000 20100
25
50
75
100
1975 1990 2000 2010
Delay-Adjusted IncidenceDelay-Adjusted Incidence
Observed IncidenceObserved Incidence
Figure 1.23
SEER Observed Incidence and Delay Adjusted Incidence RatesMales
a
Source: SEER 9 areas. Rates are age-adjusted to the 2000 US Std Population (19 age groups - Census P25-1103).Regression lines and APCs are calculated using the Joinpoint Regression Program Version 4.0.3, April 2013, National Cancer Institute.The APC is the Annual Percent Change for the regression line segments. The APC shown on the graph is for the most recent trend.The APC is significantly different from zero (p < 0.05).
a
*
Prostate Lung and Bronchus Colon and RectumRate per 100,000 Rate per 100,000 Rate per 100,000
Year of Diagnosis Year of Diagnosis Year of Diagnosis
SEER Incidence APCsDelay Adj, 2000-10 = -1.8*Observed, 2000-10 = -2.0*
SEER Incidence APCsDelay Adj, 1991-10 = -1.8*Observed, 1991-10 = -1.8*
SEER Incidence APCsDelay Adj, 1998-10 = -2.8*Observed, 2008-10 = -4.8*
SEE
R C
ancer Statistics Review
1975-2010N
ational Cancer Institute

20
40
60
80
100
120
140
160
1975 1990 2000 201020
25
30
35
40
45
50
55
60
1975 1990 2000 201020
25
30
35
40
45
50
55
60
1975 1990 2000 2010
Delay-Adjusted IncidenceDelay-Adjusted Incidence
Observed IncidenceObserved Incidence
SEER Observed Incidence and Delay Adjusted Incidence RatesFemales
aFigure 1.24
Source: SEER 9 areas. Rates are age-adjusted to the 2000 US Std Population (19 age groups - Census P25-1103).Regression lines and APCs are calculated using the Joinpoint Regression Program Version 4.0.3, April 2013, National Cancer Institute.The APC is the Annual Percent Change for the regression line segments. The APC shown on the graph is for the most recent trend.The APC is significantly different from zero (p < 0.05).
a
*
Breast Lung and Bronchus Colon and RectumRate per 100,000 Rate per 100,000 Rate per 100,000
Year of Diagnosis Year of Diagnosis Year of Diagnosis
SEER Incidence APCsDelay Adj, 2004-10 = 0.2Observed, 2004-10 = 0.1
SEER Incidence APCsDelay Adj, 2007-10 = -2.1*Observed, 2007-10 = -2.6*
SEER Incidence APCsDelay Adj, 1998-10 = -2.2*Observed, 2008-10 = -5.1*
SEE
R C
ancer Statistics Review
1975-2010N
ational Cancer Institute

-6 -5 -4 -3 -2 -1 0 1 2
All Other Sites
Melanoma of the Skin
Pancreas
Corpus & Uterus
Non-Hodgkin Lymphoma
Oral Cavity & Pharynx
Overall Increasing Trend
Brain & ONS
Leukemia
Cervix
Stomach
Urinary Bladder
Ovary
Female Breast
Lung & Bronchus
Colon & Rectum
Prostate
Overall Decreasing Trend
Overall Net Trend
Figure 1.25
Partition of Trends in Incidence RatesFor the Time Period 2001-2010
All Races, Both Sexes
Source: SEER 18 areas (San Francisco, Connecticut, Detroit, Hawaii, Iowa, New Mexico, Seattle, Utah, Atlanta, San Jose-Monterey, Los Angeles, Alaska Native Registry, Rural Georgia, California excluding SF/SJM/LA, Kentucky, Louisiana, New Jersey and Georgia excluding ATL/RG).Ovary excludes borderline cases or histologies 8442, 8451, 8462, 8472, and 8473.Percents may not add to 100 due to rounding.
Change in Incidence Rate (Cases/100,000/Year)
65.7%
19.9%
7.0%
4.9%
1.3%
1.1%
0.4%
1.5%
1.7%
1.8%
2.5%
2.8%
12.1%
20.2%
28.0%
28.8%
Overall Decreasing Regression Coefficient : -3.03
% of decreasing
% of increasing
a
Ovary a
SEER Cancer Statistics Review 1975-2010 National Cancer Institute

-8 -7 -6 -5 -4 -3 -2 -1 0 1 2
All Other Sites
Melanoma of the Skin
Pancreas
Non-Hodgkin Lymphoma
Oral Cavity & Pharynx
Overall Increasing Trend
Brain & ONS
Leukemia
Stomach
Urinary Bladder
Colon & Rectum
Lung & Bronchus
Prostate
Overall Decreasing Trend
Overall Net Trend
Figure 1.26
Partition of Trends in Incidence RatesFor the Time Period 2001-2010
All Races, Males
Source: SEER 18 areas (San Francisco, Connecticut, Detroit, Hawaii, Iowa, New Mexico, Seattle, Utah, Atlanta, San Jose-Monterey, Los Angeles, Alaska Native Registry, Rural Georgia, California excluding SF/SJM/LA, Kentucky, Louisiana, New Jersey and Georgia excluding ATL/RG).Percents may not add to 100 due to rounding.
Change in Incidence Rate (Cases/100,000/Year)
55.9%
31.2%
7.5%
3.1%
2.3%
0.3%
1.7%
2.2%
3.1%
21.7%
22.9%
48.2%
Overall Decreasing Regression Coefficient : -6.24
% of decreasing
% of increasing
SEER Cancer Statistics Review 1975-2010 National Cancer Institute

-5 -4 -3 -2 -1 0 1 2
All Other Sites
Corpus & Uterus
Melanoma of the Skin
Pancreas
Overall Increasing Trend
Non-Hodgkin Lymphoma
Oral Cavity & Pharynx
Brain & ONS
Stomach
Leukemia
Urinary Bladder
Cervix
Ovary
Lung & Bronchus
Female Breast
Colon & Rectum
Overall Decreasing Trend
Overall Net Trend
Figure 1.27
Partition of Trends in Incidence RatesFor the Time Period 2001-2010
All Races, Females
Source: SEER 18 areas (San Francisco, Connecticut, Detroit, Hawaii, Iowa, New Mexico, Seattle, Utah, Atlanta, San Jose-Monterey, Los Angeles, Alaska Native Registry, Rural Georgia, California excluding SF/SJM/LA, Kentucky, Louisiana, New Jersey and Georgia excluding ATL/RG).Ovary excludes borderline cases or histologies 8442, 8451, 8462, 8472, and 8473.Percents may not add to 100 due to rounding.
Change in Incidence Rate (Cases/100,000/Year)
70.0%
12.1%
11.7%
6.2%
0.4%
0.5%
0.8%
1.2%
1.4%
2.9%
5.2%
7.9%
12.5%
29.9%
37.2%
Overall Decreasing Regression Coefficient : -1.11
% of decreasing
% of increasing
a
Ovary a
SEER Cancer Statistics Review 1975-2010 National Cancer Institute

-3.5 -3 -2.5 -2 -1.5 -1 -0.5 0 0.5
Pancreas
Melanoma of the Skin
Urinary Bladder
Corpus & Uterus
Overall Increasing Trend
Brain & ONS
Cervix
Oral Cavity & Pharynx
Leukemia
Ovary
Stomach
Non-Hodgkin Lymphoma
Prostate
All Other Sites
Female Breast
Colon & Rectum
Lung & Bronchus
Overall Decreasing Trend
Overall Net Trend
Figure 1.28
Partition of Trend in Death RatesFor the Time Period 2001-2010
All Races, Both Sexes
Source: US Mortality Files, National Center for Health Statistics, Centers for Disease Control and Prevention.Percents may not add to 100 due to rounding.
Change in Death Rate (Deaths/100,000/Year)
69.8%
19.2%
8.2%
2.8%
0.7%
0.7%
1.1%
2.4%
3.1%
3.6%
6.3%
8.4%
11.5%
15.6%
17.1%
29.3%
Overall Decreasing Regression Coefficient : -2.83
% of decreasing
% of increasing
SEER Cancer Statistics Review 1975-2010 National Cancer Institute

-5 -4 -3 -2 -1 0 1
Pancreas
Melanoma of the Skin
Urinary Bladder
Overall Increasing Trend
Brain & ONS
Oral Cavity & Pharynx
Leukemia
Stomach
Non-Hodgkin Lymphoma
All Other Sites
Colon & Rectum
Prostate
Lung & Bronchus
Overall Decreasing Trend
Overall Net Trend
Figure 1.29
Partition of Trend in Death RatesFor the Time Period 2001-2010
All Races, Males
Source: US Mortality Files, National Center for Health Statistics, Centers for Disease Control and Prevention.Percents may not add to 100 due to rounding.
Change in Death Rate (Deaths/100,000/Year)
54.1%
34.6%
11.3%
0.7%
1.3%
2.4%
4.1%
5.5%
9.6%
15.5%
20.6%
40.4%
Overall Decreasing Regression Coefficient : -4.12
% of decreasing
% of increasing
SEER Cancer Statistics Review 1975-2010 National Cancer Institute

-3 -2.5 -2 -1.5 -1 -0.5 0 0.5
Pancreas
Corpus & Uterus
Overall Increasing Trend
Melanoma of the Skin
Urinary Bladder
Brain & ONS
Oral Cavity & Pharynx
Cervix
Leukemia
Stomach
Ovary
Non-Hodgkin Lymphoma
Lung & Bronchus
All Other Sites
Colon & Rectum
Female Breast
Overall Decreasing Trend
Overall Net Trend
Figure 1.30
Partition of Trend in Death RatesFor the Time Period 2001-2010
All Races, Females
Source: US Mortality Files, National Center for Health Statistics, Centers for Disease Control and Prevention.Percents may not add to 100 due to rounding.
Change in Death Rate (Deaths/100,000/Year)
68.6%
31.4%
0.2%
0.6%
0.8%
1.0%
1.7%
3.1%
3.4%
6.8%
7.7%
16.7%
16.9%
20.0%
21.3%
Overall Decreasing Regression Coefficient : -2.2
% of decreasing
% of increasing
SEER Cancer Statistics Review 1975-2010 National Cancer Institute