cannon, f. b. - eric cannon, f. b. ... sample graduating class of 1965 address form xii-27 ... far...
TRANSCRIPT
DOCUMENT RESUME
ED 086 904 CE 000 949
AUTHOR Cannon, F. B.
TITLE West Central Vocational-Technical Education Survey.Final Report and Recommendations.
INSTITUTION New Educational Directions, Crawfordsville, Ind.SPONS AGENCY Indiana State Dept. of Public Instruction,
Indianapolis. Div. of Vocational Education.PUB DATE Apr 73NOTE 209p.
EDRS' PRICE MF-$0.65 HC-$9.87DESCRIPTORS Dropouts; *Educational Needs; Educational Planning;
Program Planning; Regional Cooperation; *RegionalPlanning; School Districts; School Role; *SchoolSurveys; Tables (Data) ; *Technical Education;*Vocational Education
IDENTIFIERS Indiana
ABSTRACTSeventeen West Central Indiana school corporations
cooperated in this study designed to provide them with informationfor decision making regarding vocational-technical education. Sourcesof information were varied and included school corporations records,State agencies, and surveys of secondary teachers, a sampling of highschool students, parents, chamber of commerce representatives, andthe graduates of the class of 1965. The information from th9. surveysis self-report data and is presented in a large number of tables,charts, and maps. Examples of all surveys and questionnaires aregiven and the responses are discussed in detail. Results arepresented in the form of a generalized summary of the responses fromparents, teachers, graduates and students. Trends and generalizationsare indicated, and detailed analyses of the reports from each of theseventeen school corporations are presented. Seven basic areas ofneed were identified and eleven recommendations made covering theestablishment and functioning of an area Board ofVocational-Technical Educational Services (BOVES). Community-based,school-based and other roadblocks to the development of the BOVES arebriefly discussed. (DS)

NEDNEW EDUCATIONAL DIRECTIONS
BOX 307 CRAWFORDSVILLE, INDIANA 47933 (317) 362-8877
STUDENTS
PARENTS
U.S. DEPARTMENT OF HEALTH.EDUCATION & WELFARENATIONAL INSTITUTE OF
EDUCATIONTHIS DOCUMENT HAS BEEN REPRODUCED EXACTLY AS RECEIVED FROMTHE PEPSON OR ORGANIZATION ORIGINATING IT POINTS OF VIEW OR OPINIONSSTATED DO NOT NECESSARILY REPRESENT OF FiC.IAL NATIONAL INSTITUTE OFEDUCA I i0IT POSITION OR POLICY
WEST CENTRAL INDIANAVOCATIONAL-TECHNICALEDUCATION SURVEY
FINAL REPORT andRECOMMENDATIONS
COMMUNITY
Submitted to:Attica Consolidated School CorporationClay Community SchoolsCloverdale Community SchoolsCovington Community School CorporationCrawfordsville Community School CorporationGreencastle Community SchoolsLebanon Community School CorporationNorth Montgomery Community School CorporationNorth Putnam Community SchoolsRockville Consolidated SchoolsSoutheast Fountain School CorporationSouth Montgomery Community School CorporationSouth Putnam Community SchoolsSouth Vermillion Community School CorporationTurkey Run Consolidated School DistrictMSD of Warren CountyWestern Boone County Community School District
TEACHERS
C
Prepared by: F. B. GannonApril, 1973

TABLE OF CONTENTS
PageNumber
Acknowledgetents ivIntroduction I- 1
General Summary II- 2
Identified Needs II- 6
Recommendations II- 9Roadblocks 11-19
History of the Study and Survey Procedures III- 1
Current Programs IV- 1Student Reactions V- 1
Parent Reactions VI- 1Teacher Reactions VII- 1Class of 1965 Survey VIII- 1School Corporation Enrollments, Drop-outs, and Students EnteringPost-secondary Education Programs IX- 1
Corporation Financial Characteristics X- 1
General Population Characteristics and Employment Opportunities. XI- 1Survey Instruments and Documents XII- 1
CHARTSNumber
III-a School Corporations Participating in the West CentralIndiana Vocational and Technical Education Survey . III- 2
IX-a Participating Corporations' Schools Enrolling Studentsin Grades 9-12 IX- 2
IX -b Road System for the Eight County Area IX- 3
XI-a Commuting Patterns Between Counties XI- 7XI-b Planning and Development Regions -- State of Indiana. . XI-13
TABLES
II-a Class of 1965 Responses as a Percent of GraduatingClass and as a Percent of Delivered Forms II- 5
II-b Enrollments, Adjusted Assessed Valuation (AAV) and LandArea for Selected Combinations of ParticipatingCorporations II-10
II-c Ranges of Typical Costs and Service Statistics Basedon Ten Indiana Vocational-Technical Schools as ofApril, 1972 . 11-18
.IV-a Number of Sections, Reimbursed Vocational Programsby Corporation, Grades 7-12 ........ I 0 IV- 2
IV-b Enrollments, Reimbursed Programs by Corporation,Grades 7-12 IV- 4
IV-c Adult Vocational Programs Reimbursed by IndianaDivision of Vocational Education, Number of Sectionsand Enrollments by Corporation 1972-73 IV- 7
IV-d Industrial and Commercial Courses Not Reimbursed bythe State Division of Vocational Education by SchoolCorporation IV- 9
V-a Student Occupational Interest Inventory, StudentResponses in Percent by Corporation, Grade 9 V- 3
V-b Student Occupational Interest Inventory, StudentResponses in Percent by Corporation, Grade 11 V- 7

NumberPage
Number
VI-a Parent Questionnaire, Parent Responses in Percentby Corporation VI- 4
VI-b Number of Parents Indicating Interest in VariousAdult Programs by Corporation VI-10
VI-c Greencastle Parent Questionnaire, Summary in Percent,Parents of Grade 4 & 8 & 10 Students VI-13
VII-a Teacher's Form, Teacher Responses in Percent byCorporation VII- 3
VIII-a Class of 1965 Responses to Mailings by Corporation. . VIII- 2VIII-b Class of 1965 Survey Summary as a Percent of
Respondents by Sex by Corporation VIII- 9IX -a-
IX-q Fall Enrollments, Actual and Projected, by Corporation. .
IX-r Mean High School Drop-outs as a Percent of FallEnrollments for 1967-68 through 1971-72 by Gradeand for Grades 91.12 CoMbined by Corporation
IX-s nigh School Drop-outs as a Percent of Fall Enrollmentsby Grade by Year by Corporation
IX-t 1968 Graduates Entering Post-secondary Education,Percent of those Entering who Completed Programby Corporation
IX-u 1968, 1969, 1970, 1971, 1972 Graduates EnteringPrograms of Post-secondary Education as a Percentof Total Graduates and Those Completing Programsas a Percent of Those Entering
X-a 1971-72 and 1972-73 Average Daily Attendance (ADA) and1971-72 and 1972-73 Corporation Financial Character-istics by Corporation
XI-a General Population Characteristics by County, Basedon the United States Census 1940, 1950, 1960, 1970. . .
XI-bb Employment in County of and Out of County ofResidence for Participating Counties
XI-b Population at Work During the Census Week (1970)by Place of Work
XI-c Indiana Employment Security Occupational Demandin Indiana
XI-d County Employment Patterns, Average for 1971XI-e Work Force Summaries, Annual Averages for 1971
EXHIBITS
IX- 5
IX-24
IX-25
IX-28
IX-29
X- 3
XI- 2
XI- 6
XI- 8
XI-14XI-17XI-18
XII-A Data Gathering Memorandum for School CorporationStudy Coordinators XII- 3
6XII-B Corporation Financial Characteristics Form XII..
XII-Ca Grades 1-6 Fall Enrollments by Year Form XII- 7
XII-Cb Grades 7-9 Fall Enrollments by Year Form XII- 8
XII-Cc Grades 10-12 Fall Enrollments by Year Form XII- 9XII-Da Secondary Drop-outs by Year Form XII-10
XII-Db Secondary Drop-outs by Year Alternate Form XII-12
XII-Ea High School Graduates Entering Programs ofPost-secondary Education by Year Form XII-13
XII-Eb High School Graduates Entering Programs ofPost-secondary Education by Year Alternate Form . XII-15
XII-F Non-reimbursed Programs Form. XII-16
ii

PageNumber Number
XII-G Sample Teacher's Form XII-19XII-H Sample Student Occupational Interest Inventory. . . . XII-23XII-I Sample Parents' Questionnaire XII-25XII -J Sample Graduating Class of 1965 Address Form XII-27XII-K Graduating Class of 1965 Initial Contact Letter XII-28XII-L Sample Graduating Class of 1965 Survey Form XII-29XII-M Graduating Class of 1965 Follow-up Letter KII-31XII-N Sample News Release XII-32
iii

ACKNOWLEDGEMENTS
Appreciation must be expressed to the staffs of the participating
school corporations, parents, and students for their contributions to the
study and for their cooperation throughout the five months of the study.
A number of state agencies and Chamber of Commerce representatives
provided valuable input for the study. Particular gratitude must be
expressed to Donald Peyton and Orville Scribner of the Vocational Educa-
tion Division, State Department of Public Instruction, Theodore Popoff
of the Employment Security Division, and John Birdcell of Indiana Voca-
tional Technical Col:I.ege. Without the contributions of each of them, the
value of the study would surely be lessened.
Finally, the NED staff approached the assignment with an enthusiasm
and dedication which is appreciated, and various of the NED associates
offered valuable advice and counsel at critical points during the devel-
opment and implementation of the study.
F. B. GannonCrawfordsville, IndianaApril, 1973
iv

SECTION I
INTRODUCTION

1-2
Training is everything. The peach was once a bitteralmond; cauliflower is nothing but cabbage with acollege education.
(Mark Twain, Pudd'nhead Wilson)
Seventeen school corporations in west central Indiana who are sin-
cerely concerned with producing as many "peaches" and as few "bitter
almonds" as possible have cooperated in this study. These seventeen
school corporations provide educational opportunities for almost 35,000
students each year. This study was commissioned by those corporations
and funded by the Indiana Department of Vocational Education as a part
of an on-going effort of the participating corporations to make the
educational opportunities as meaningful and appropriate for their clientele
as possible within the limits of their financial and physical resources.
In general, practicing educators and the general public are becoming
increasingly aware of the fact that education appropirate to society's
needs as well as appropriate to the needs of our children must provide
far more than reading, writing, arithmetic, and socialization. The
public schools can anticipate ever increasing criticism unless they
provide those of their students who will enter directly into the labor
pool when they terminate their education by high school graduation or
drop-out with marketable skills. Such preparation must be accomplished
at a level of success at least comparable to the levels they have tradi-
tionally had in preparing the college-bound student.
The study attempted to identify vocational-technical education
needs, to assess the extent vocational-technical programs are now avail-
able, and to determine potential support for expanded programs by the
school's various audiences and consumers. This report is based on the
study and is conceived of as a working document to provide the involved
superintendents, their staffs, and their Boards of Trustees with infor-
mation for decision making and for action.
Youth, whether dropout or graduate, at secondary orpost-secondary levels, has been inadequately preparedto earn a living and to meet the needs of the labormarket, The deficiendy has not been just job skills.In fact, those are often the easiest to supply throughalternate routes such as on-the-job training, It is
those attitudes toward work--those human relationsskills, the knowledge of alternative career choices

1-3
and their implications . that are the majorlack. *
The data gathered during this study seem to indicate that the above
observation is valid for substantial numbers of the youth from west
central Indiana, and the recommendations formulated as a result of this
study are based on that as an assumption.
* * * *
*Career Education: A Handbook for Implementation, U.S. Office of Educa-tion, page 30.

SECTION II
GENERAL SUMMARY, IDENTIFIED NEEDS, RECOMMENDATIONS, and ROADBLOCKS

11-2
GENERAL SUMMARY
Seventeen West Central Indiana school corporations cooperated in this
study designed to provide them information for decision making regarding
vocational-technical education. Sources of information for the study were
varied and included the school corporations' records, state agencies, a
survey of secondary teachers, and surveys of a sampling of high school stu-
dents, the parent community, Chamber of Commerce representatives, and the
Class of 1965 graduates. The information from the surveys is self-report
data. Such information may be offered from an incomplete or "false fac-
tual base" but it is important because it represents the base from which
people operate and make decisions in their day-to-day living.
The comments offered in this section of the report represent trends
and generalizations. The results for specific corporations will be at
variance with these trends and generalizations on some points. Therefore,
the reader is urged to refer to the various other sections of this report
where a more detailed analysis of each area considered in the study is
offered.
Although the eight counties involved in the study account for more
than nine percent of Indiana's land area, less than 31% of the state's pop-
ulation reside in these counties. Thus, the population density per square
mile in these counties is considerably below the average density for the
state. The population,pharacteristics of these counties also tend to be
atypical of the state as a whole in several other areas. For example, the
population of these counties tends to be older than the total population of
the state and the proportion of the population living in urban areas as well
as the growth rates for urban areas are both considerably lower for the
participating counties than the state average.
The unemployment rates for the eight counties range from a low of
three percent to a high of ten percent and approximately one-third of the
total work force commutes outside of its county of residence for its
employment. An inspection of the commuting patterns reveals a great deal
of interdependence of the counties on each other for their work forces.
This circumstance coupled with the stated intent of students to stay in
the area and with the fact that a sizable numbf.ar of the 1965 graduates are
still in the area, appears to argue that there are benefits to be derived
for all of the counties to work together on vocational-technical education
programs. Although the eight counties are generally considered agricul-
tural counties, the major industries in seven of them are trade and manu-

11-3
It appears that the total enrollment for the seventeen corporations
combined will remain stable at just under 35,000 for the next five years.
Not all school districts were able to provide complete information on their
drop-outs and on their graduates who entered various programs of post-sec-
ondary education; therefore, the observations made concerning these twc
matters are made on the basis of incomplete data. It does appear, however,
that the most common reasons for students leaving high school before grad-
uation are marriage and/or pregnancy for girls and lack of interest and
academic failure for boys. The four-year college is the most popular form
of post-secondary education for graduates of the seventeen corporations but
a higher percent of the graduates who enter other forms of post-secondary
education complete their programs than is true of the crraduatee who enter
a four-year program.
The courses which could result in a student learning a marketable
skill offered by the seventeen'corporations represent a great deal of dup-
lication between distticts. These courses fall into two broad groupings- -
those reimbursed and those not reimbursed by the Indiana Department of Vo-
cational Education. Courses in both categories also tend to have smaller
enrollments than high school courses in general which result in a. higher
than average per pupil cost. All of the reimbursed adult programs reported
are in some phase of agriculture. The reimbursed programs available to the
students are in agriculture and six additional areas, and non-reimbursed
programs are available to them in the industrial and commercial areas.
The total adjusted assessed valuation (AAV) for all participating cor-
porations combined is in excess of 383 million dollars. The median AAV is
$23,603,950 and the median average daily attendance is 1854 pupils. The
median AAV per student in ADA stands at $11,840.
All parents of grade 4, 8, and 10 students were provided an opportunity
to express their opinions on several facets of vocational-technical educa-
tion by completing a brief questionnaire. Responding parents generally en-
dorse providing expanded vocational-technical educational opportunities and
tend to be supportive of the concept of an area vocational-technical school.
Their support, however, is not without two serious qualifications. Many
parents indicated support for an area school but only if it were located
in their district and a number of them expressed concern for the costs in-
volved in establishing an area school. The most common parental reasons
stated for encouraging children to enroll in vocational- technical education
were the relevance to living or the practical nature of such education, in

lieu of college attendance, and drop-out prevention. An assumption fre-
quently stated even by parents who endorse vocational-technical education
is that such programs are for the "slower" students and that it is reme-
dial for what are perceived as the failures of traditional education.
All teachers of students in grades seven through twelve were requested
to respond to a series of eleven statements concerning career development
and vocational-technical education. On the basis of their responses to
this exercise, teachers indicate that they are aware of the role vocational-
technical education can play in career training, but they tend to be non-
commital concerning whether or not they have done their share of the total
job of career training. Teachers acknowledge that students need help with
career planning and agree that providing secondary career training oppor-
tunities is as important as providing post-secondary ones. Indeed, some
teachers express concern that many young people, graduates and drop-outs
alike, leave school without marketable skills. When asked to identify the
aspect of the school program most effective in preparing students for the
next phase of their lives, many teachers were noncommital, but of those
who did identify one, the college preparatory course was most frequently
identified in all but one corporation where the commercial course was so
identified. More teachers also were able to indicate that the school's
total program is adequately providing career training for students who
will continue their education after high school than could indicate it for
students who would not be involved in post-secondary education.
From 14.5% to 61.4% of the 1965 graduates and from 15.9% to 84.4% of
those graduates who received questionnaires completed and returned them.
This rate of return is exceptionally good and well may indicate a great
interest in and concern for education by these graduates. The class of
1965 responses indicate that more of the men tend to be satisfied with
their present employment than is true for the women but the reasons for
both satisfaction and dissatisfaction for both sexes center on personal
fulfillment, not money as such. Considerably less than half of the gradu-
ates from many of the corporations indicated that their high school expe-
riences prepared them for their present positions. They did, however, agree
with the teachers by most frequently noting the academic courses as the
most helpful aspect of the school program in work preparation.

TABLE IIa
CLASS of 1965 RESPONSES
as a Percent of Graduating Class and as a Percent of Delivered Forms
M ...4
E-1 z
ZH
<C
ei
zto.
0E.
n
.44
8P
ca
<4
zPLI
LI
00
o-1
H>
-P
MPi
NN
IC
.)z
w ME
.8
.44
1:4
Mpa
oo
oo
E-1 <4
oo
oo
LI
4C
l]co
Cl]
Cl]
II-5
Usable completed returns as a
PERCENT of the graduating class
14.5
38.2
36.847.6
31.7
36.024.4
55.3
34.3
27.661.4
44.3
34.2
46.4
50.9
39.830.8
Usable completed returns as a
PERCENT of those delivered
15.9
49.6
46.7
47.6
56.8
42.9
41.7
77.5
42.2
39.2
64.3
50.5
84.4
52.4
58.3
53.3
41.1
Students currently enrolled in grades nine and eleven were also surveyed concerning various aspects of vocational-.
technical education and career planning.
These students tended to be undecided concerning career goals and post-second-
ary plans.
Those students in both grades who did indicate a career goal most frequently aspired to one of the profes-
sions but a higher percent of eleventh than ninth grade students indicated an interest in the skilled trades.
Their
indicated interest in post-secondary vocational-technical education tends to be low although up to 84% of the grade 9
and up to 81% of the grade 11 students did note an interest in high school courses that would prepare them for employ-
ment.
Even though a substantial percent of each grade did show this interest, most students thought that enough of
their high school courses are directed toward what they wish to do when they leave school.
The four-year college was
the most frequently indicated form of post-secondary education of interest at both grade levels and was the most
common post-secondary program for the 1965 graduates.
11-6
All four groups who were surveyed apparently recognize additional
vocational-technical educational oppertunities as a need for the involved
communities. Both parents and 1965 graduates, however, did appeal that
any attempts at additional vocational-technical education be practice-
oriented and include on-the-job experiences. A number of parents,
teachers, and 1965 graduates suggested that programs utilize community
resources and existing facilities as alternatives to an area school.
They also offered suggestions for organization and staffing including
the use of practitioners for instructors. In addition, teachers support
the idea that a placement service should be a part of a career training
program. Some teachers also noted that the most drop-out prone age is
sixteen and yet vocational-technical education traditionally is not
available for students prior to age sixteen. They therefore suggested
that some vocational preparation be made available prior to grades eleven
and twelve.
Based on the responses of both students and teachers it appears that
substantial segments of the student bodies are ill-informed concerning
the variety of available careers, the training requirements for careers,
and they do not hold realistic career goals by the time they graduate
from high school.
A high level of interest in health careers (i.e., laboratory tech
nician, licensed practical nurse, etc.) was exhibited by both parents
and students. In addition, parents indicated high interest in various
types of clerical and office training while a number of students showed
interest in service careers (i.e., postal, fire, police, etc. services).
NEEDS
As a result of this investigation, seven basic areas of need were
identified.
I. AN IMPROVED BASE FOR ADMINISTRATIVE ANDCURRICULAR DECISION MAKING IS DESIRABLE.
Although the quality and comprehensiveness of the data available
concerning matters such as drop-outs, graduates, and community growth
varies considerably from corporation to corporation, in general, it
could be improved. Without as complete a knowledge as possible of the
relative successes and why of graduates in jobs and in various programs
of post-secondary education, of what happens to secondary school

11-7
drop -outs, and of all of the factors affecting community growth, efforts
in curriculum development and program evaluation must be handicapped.
Administrative and curricular actions made on as complete a factual base
as possible will be of a higher quality than those made on the basis of
incomplete information and supposition.
II. IT IS DESIRABLE TO MINIMIZETHE PRESENT DUPLICATIONS OFPROGRAMS BETWEEN DISTRICTS.
At the present time there is a considerable duplication in both the
reimbursed and non-reimbursed courses which could result in marketable
skills available to students in neighboring districts. These courses
tend to have a low pupil-teacher ratio and to require a relatively high
capital investment for equipment and supplies. The school patrons could
benefit through a more efficient use of their tax dollars and students
could benefit from expanded offerings if the duplications were eliminated
wherever possible. ". . we could profitably and sensibly redirect our
educational investments in order to improve primary and secondary public
education."
III. EXPANDED VOCATIONAL-TECHNICALEDUCATIONAL OPPORTUNITIES ARENEEDED IN THE EIGHT COUNTY AREA.
Providing expanded opportunities to the secondary students in the
area to develop salable skills is important, but in today's society a
vocational-technical program, indeed any educational program, must encom-
pass more. Alvin Toffler writing in Future Shock** notes, "Tomorrow's
illiterate will not be the man who can't read; he will be the man who has
not learned how to learn." Among the things that must be learned are
positive attitudes for continued learning and toward work and the social
skills necessary to working harmoniously with other people. Therefore,
expanded vocational-technical educational opportunities must provide stu-
dents with a salable skill for today's market while also preparing them to
be re-educated for tomorrow's market and imbueing them with positive atti-
tudes toward work itself and toward other people. Jobs appear and dis-
appear with amazing rapidity in today's society, and all indications are
that the pace of change will increase as new needs emerge in some areas
* * * *
*Berg, Ivar, Education and Jobs: The Great Training Robbery, PraegerPublishers, New York, 1970, pg. 189.
**Toffler, Alvin, Future Shock, Random House, Inc., New York, 1970, pg. 414.

11-8
and as nees in other areas diminish. For example, twenty years ago
computers were in their infancy, today a major industry; fifteen years
ago space technology was in its infancy; one year ago airport security
as it exists today was unknown; while pridr to the automation thrust fif-
teen years ago many industries heavily relied on unskilled labor whereas
today's primary need in the same industries is for skilled technicians.
IV. ANY EXPANDED VOCATIONAL-TECHNICAL OFFERINGSSHOULD BE PART OF A FLEXIBLE PROGRAM WHICHCAN BE IMMEDIATELY RESPONSIVE TO COMMUNITYAND STUDENT NEEDS AND AREA EMPLOYMENTOPPORTUNITIES.
Flexibility of general organization and of the curricular offerings
are essential to the development of a vocational-technical organization
which will have long-term lasting usefulness for the West Central Indiana
area. The industrial-business base in the area is diversified but limited
at this time. It would therefore be an easy matter to gut the market with
a particular skill in a relatively short time. For example, there might
be a heavy demand for something like small engine and appliance repair
for a period of time but when that demand is sufficiently met, students
should be so advised and given the opportunity to develop skills in re-
lated areas that will both fit their interests and talents while provid-
ing a reasonable expectation for gainful employment. In addition, of
course, to the flexibility of organization and curriculum, this need can
only be satisfied if there is a constant, on-going, accurate assessment
of the job market (see Needs I),
V. STUDENTS MUST BE PROVIDED A SOUND BASEFROM WHICH TO MAKE WELL-INFORMED EDUCA-TIONAL AND VOCATIONAL DECISIONS.
It appears that large segments of the student populations in the
seventeen school corporations currently are making educational decisions
and are establishing vocational goals on, at best, incomplete, if not
inaccurata, information. If students are going to make decisions as
appropriate as possible for themselves concerning their participation in
a secondary vocational-technical program, an academic program, or a gen-
eral program leading to college or another form of post-secondary educa-
tion, they must have an understanding of the nature of and training re-
quirements for various careers. Iii addition, they also must have an
awareness of the variety of career options available to them and a
knowledge of the advantages and disadvantages of those options.

11-9
VI. COMMUNITY SUPPORT AND UNDERSTANDINGIS ESSENTIAL TO THE SUCCESS OF ANYEXPANDED VOCATIONAL-TECHNICAL PROGRAM.
There are five groups of the general community who must understand
and support vocational-technical educational programs if those programs
are to be of maximum service to students and to the community. These
groups are students, parents, other patrons, the business-Jaldustrial-
labor complex, and the practicing educators. Parents and students must
understand and view vocational-technical education as a viable oppor-
tunity for success and self-fulfillment and not view it, as most pres-
ently do, as an alternative for the failures and near-failures of the
more traditional academically-oriented programs. Other patrons and the
bUsiness-industrial-labor complex must view vocational-technical programs
as a desirable service designed to meet the overall needs of the community.
In addition, it is essential that the business-industrial-labor group
have a sufficient understanding of vocational-technical education that
they can and will provide essential advice and counsel concerning needed
programs and program development. Finally, the existing educational
group must view vocational-technical programs as a valuable complement
to their efforts and must have enough understanding for their expertise
also to be used in program development.
VII. ALL COMMUNITY GROUPS MUST BE CONVINCEDSTUDENTS ARE RECEIVING THE BEST POSSI-BLE VOCATIONAL-TECHNICAL EDUCATION FORTHE TAX DOLLAR SPENT.
School patrons of West Central Indiana tend to be conservative and
generally unimpressed with appearances'as such but do respect results.
This pragmatic attitude must be respected as vocational-technical pro-
grams are developed for the area's students. Therefore, programs must
be developed which provide the best possible return for the time and
dollars invested in them and the community must be convinced this is the
case.
RECOMMENDATIONS
The basic recommendations are built so that they provide one workable
response to the identified needs. Furthermore, the degree of readiness of
the various school districts to participate in a broad-based effort may
vary to such an extent that it may be unrealistic to expect all seventeen

II-10
corporations to endorse the recommendations in their entirety. There-
fore, the recommendations have been built so that any single corporation
or any combination of corporations can implement them in part or in toto.
Of course, the fewer the school districts participating, the smaller the
base of secondary students from which programs can draw and the smaller
the adjusted assessed valuation (AAV) base from which to operate programs.
Table IIb illustrates the way these factors fluctuate for several possi-.
ble combinations of school districts.
TABLE IIb
ENROLLMENTS, ADJUSTED ASSESSED VALUATION (AAV),AND LAND AREA FOR SELECTED COMBINATIONS OF
PARTICIPATING CORPORATIONS
Participating Corporations Grades 9-12,in the counties of 1972 Enrollments AAV
Land Area inSquare Miles
Warren and Vermillion 1,256 56,264,438 631
Boone and Montgomery 4,199 149,715,136 934
Montgomery and Putnam 4,592 161,541,563 997
Putnam and Clay 3,660 104,182,432 854
Parke and Fountain 1,979 73,564,587 842
ALL EIGHT COUNTIES 11,094 383,726,593 3,261
. In the recommendations which follow there is a distinction drawn
between courses and programs. Programs provide students with a series
of related courses and experiences leading to proficiency in a defined
vocational-technical field. For example, a practical nursing program
might include courses in chemistry, zoology, hospital procedures, etc.
as well as practical on-site experiences in a clinical setting.
RECOMIENDATION I - IT IS RECOMMENDED THAT AN AREA BOARDOF VOCATIONAL-TECHNICAL EDUCATIONALSERVICES (BOVES) BE ESTABLISHED.
A BOVES serving the eight-county area, or any part thereof, would
assume primary .responsibility for seven service areas. These areas are:
(a) to provide for the DEVELOPMENT of expanded vocational-technical programs,
(b) to provide for the IMPLEMENTATION of expanded vocational-technical programs,
(c) to provide on-going developmental and supportive RESEARCHservices,

(d) to work With school corporations to provide appropriatePRE - VOCATIONAL EXPERIENCES for students,
(e) to provide PLACEMENT services for graduates of theBOVES programs,
(f) to provide PROGRAM EVALUATION services including aregular follow-ip of program graduates, and
(g) to work with. the various school corporations to REDUCEthe DUPLICATION of vocational-technical OFFERINGS amongschool districts.
The procedures and techniques applied to the establishment, develop-
ment, and services of the BOVES are critical if the organization truly is
to direct its efforts toward successfully alleviating the area's identi-
fied needs rather than becoming merely another officialism. The remain-
ing recommendations, therefore. address themselves to these crucial matters.
RECOMMENDATION II - IT IS RECOMMENDED THAT THE EXPERTISEOF ALL FACETS OF THE COMMUNITIES BESOUGHT AND UTILIZED IN ALL ASPECTSOF THE BOVES OPERATION.
Expertise which is available in the community is frequently untapped
or underutilized in building and operating school programs. It is sugges-
ted that this resource be used by the BOVES in the following ways.
(1) The management skills of school superintendents and labor,
business, and industrial management should be tapped by having these
groups represented on the BOVES Board of Trustees.
(2) Task forces or advisory councils comprised of practitioners
representing labor, business, industry, and educators should be an inte-
gral part of the BOVES operation. Advisory councils need be utilized in
defining vocational-technical needs for the area, The task forces must
be the working groups who, in cooperation with BOVES staff, design the
programs, and define the courses' curricula and identify the experiences
Which will constitute those programs. Of major importance in the develop-
ment of curricula must be attitude development in addition to skill devel-
opment.
(3) Wherever appropriate the experience and skill of talented commu-
nity members should be directly and actively used in the instruction of
students.
Initially the school was an integral part of the community but as
time passed it tended to become an entity insulated from the community.
The adoption of this recommendation would put the school and community
into partnership with shared responsibilities for education.
11-12
RECOMMENDATION III - IT IS RECOMMENDED THAT THE BASICADMINISTRATIVE ORGANIZATION FOREXPANDED VOCATIONAL-TECHNICALPROGRAMS BE A SCHOOL-WITHOUT-VALLS.
The crux of the BOVES operation will he instruction and all of its
efforts will be ultimately directed toward the instructional end. It is
proposed that BOVES instruction be of a quality second to none but that
it basically be accomplished through the utilization of existing school
and other community facilities and personnel resources. To accomplish
this it is suggested that the BOVES must assume responsibility for five
basic tasks:
(1) supervision of a posse staff,
(2) construction of curricula,
(3) identification of existing vocational-technical resourcesto implement programs,
(4) development of new resources, and
(5) coordination of the consolidation of current vocational-technical courses offered in contiguous districts.
In the old West, law was the basic responsibility of a professional
lawman. When, however, he needed assistance in the form of specialists
he deputized a posse. The posse was flexible because the sheriff depu-
tized a tracker only when he needed a tracker. It is proposed that the
same posse concept be applied to staffing the school-without-walls. If
a particular vocational-technical program requires the services of a
master plumber or an MD as an instructor this year, deputize one and have
his instructional activities supervised by the BOVES staff. If the pro-
grams required to meet next year's students' needs require a master
electrician rather then an MD, then an electrician, not an MD, is depu-
tized. Using the posse concept for staffing encourages flexibility be-
cause there are no long-term commitments made to staff or to programs.
A medical technology program could be offered for one to fifteen students
this year if appropriate. If there was no demand for the program for two
or three years, it would not be offered for two or three years thereby
providing the potential for instructional programs of an almost infinite
variety.
It is essential that the curriculum for a school-without-walls be
well-defined and that instructional units used with deputized staff be
11-13
concise and detailed. It will be the responsibility of the BOVES staff
to work with the task forces noted above to develop these materials.
It will be the responsibility of the BOVES to identify all existing
personnel and site resources. Personnel resources will be practitioners
Who are interested in, able to, and willing to instruct in the vocational-
technical programs. It will be a BOVES responsibility to-screen as well
as to supervise deputies. Physical resources will include local businesses,
banks, construction sites, industrial plants, professional offices, hospi-
tals, garages, artisan's shops, the blacksmith's truck, etc. In short,
everything that profitably can be used for instruction will be identi-
fied. The BOVES may subcontract to commercial instructional agencies
such as the Ryder Truck Training Program, International Telephone and
Telegraph technical programs, etc. Such subcontracting, however, will be
done only after the quality of the program has been established and when
subcontracting proves to be the most expeditioUt-ehd economical method
fcr providing a program.
From time-to-time it may be appropriate for the BOVES to develop
resources. It is conceivable, for example, that demand for a beauty
culture program would be such that the best way to offer it is to develop
a portable laboratory in the form of a tractor-trailer rig to travel from
school to school. Both subcontracting and resource development should
be attempted only when all other alternatives have been explored and
found wanting but the BOVES should have sufficient latitude to use these
approaches when they are desirable.
It is envisioned that a considerable part of the BOVES effort will
depend on existing school-based courses end school facilities. There-
fore, it is in the interest of the total effort that the present duplica--
tion of school-based programs be minimized and that the BOVES staff assume
responsibility for coordinating school-based:offerings.
RECOMMENDATION IV - IT IS RECOMMENDED THAT THE DURATIONOF PROGRAMS BEAOETERMINED BY.THENATURE OF THE-PROGRAM AND BY THETARGET GROUP RATHER THAN BY THETINE AVAILABLE.
The primary target group for BOVES plvsgraMs will be regular secondary. _
studente'whose career goals are vocationally--technically oriented. For
this group, dependent on the program, appropriate time spans could range

from one year to four years. Of secondary concern to BOVES, however,
will be providing short-term programs of one to fifteen weeks for the
retraining of adults and to provide secondary drop-wits with marketable
skills. Responsibility for such short-term programs, however, will be
assumed by BOVES only in those areas where IVY Tech or other institu-
tions do not provide the required services to the area.
RECOMMENDATION V - IT IS RECOMMENDED THAT EXTENSIVE USE BEMADE OF THE EXPERIENCE, TALENT, AND RE-SOURCES OF THE VOCATIONAL EDUCATION DI-VISION OF THE DEPARTMENT OF PUBLIC IN-STRUCTION, IVY TECH, AND EXISTING AREASCHOOLS.
To benefit from the mistakes and successes of others is one of the
wisest ways to save both money and time. There are three major groups
with which the BOVES will wish to establish and maintain a close rela-
tionship and whose advice will be sought. These three groups are the
Vocational Education Division, IVY Tech, and existing area schools.
RECOMMENDATION VI - IT IS RECOMMENDED THAT THE BOVESDEVELOP AND MAINTAIN AN ON-GOINGRESEARCH EFFORT.
If BOVES programs are going to be of the highest possible quality,
they must be undergirded in the two general areas of developmental and
support research.
BOVES developmental research will encompass needs assessment of the
current and projected employment market and the obtaining of any infor-
mation required by the various task forces working on program and curric-
ulum development.
Supportive research will include the evaluation of current programs,
and such evaluation must include more than traditional test score meas-
ures which would be totally inadequate as an evaluative tool for these
programs where performance based indices will be the primary short-term
success measure. On a more comprehensive level, success measures will
include criteria such as reductions in the secondary schools' discipline
problems, increases in secondary school holding power, and success in
related subjects. Also included in this category of research will be a
follow-up of graduates at regular intervals to determine career changes,
success in careers, and career satisfaction. A desirable "fringe bene-
fit" for supporting schools will be the possibility of follow-up of all
graduates since the machinery for follow-up will be established already.

11-15
RECOMMENDATION VII - IT IS RECOMMENDED THAT THE BOVESSTAFF WORK WITH LOCAL SCHOOLPERSONNEL ON THE DEVELOPMENT OFCAREER EDUCATION PROGRAMS AND ONSTRATEGIES FOR THE INFUSION OFTHEM INTO THE EXISTING CURRICULA.
Career education appears to offer a needed vehicle to provide stu-
dents with the skills and information needed to make intelligent career
decisions. It has the distinct advantages of not disrupting current
instructional programs, of not adding "courses" to the present offerings,
and of being implementable without unduly increasing school budgets.
Therefore, the ROVES staff will work with local school personnel in de-
veloping career education programs using the model which includes career
awareness activities in grades K-6 with career exploration and develop-
ment activities spanning the junior-senior high school years.
Career education increases the relevance of schoolby focusing on the learner's career choice. It gives
students informed guidance, counseling, and instructionthroughout their school years.
It demands no permanent bondage to a career goal.Rather, it reveals to students their great range of oc-cupational options and helps them to develop positiveattitudes toward work.
Career education will enable nearly all persons whocomplete secondary school to obtain immediate employ-ment or go on to technical school or college. Place-ment services in the school system will assist everystudent, especially the student leaving before he com-pletes the 12th grade, to plan the next step in hisdevelopment. Job entrance will be just as important ascollege entrance to counselors and teachers. Skillcredentials, universally recognized, will be just asvalid as the commonly accepted credentials for collegeentrance.
There will be no "dropouts," only individualswho choose to go to work or to pursue a different kindof education. Entrance and exit requirements will beflexible enough to enable all persons to acquire--atany time they choose--the educational and occupationalexperiences that meet their needs.*
U. S. Office of Education, Career Education, U. S. Printing Office,Washington, 1971.

11-16
RECOMMENDATION VIII - IT IS RECOMMENDED THAT BOVES MAINTAINAN EMPLOYMENT SERVICE AS AN INTEGRALPART OF ITS PROGRAM.
BOVES responsibilities do not end with the training of students. It
is deemed extremely desirable that BOVES work with the State Employment
Service to obtain the best possible placement for the individuals who have
completed its programs. This function is a logical extension of the follow-
up activities noted above.
RECOMMENDATION IX - START SLOWLY AND BUILD WELL!
While the potential for BOVES services is almost infinite, the organ-
ization will realize that potential only if it is built on a firm base.
Therefore, a timetable such as the following is recommended.
A. Year 1 will be devoted to organization, design of programs andcourses, community surveys, establishing community contacts, andgeneral planning.
B. Year 2 sees the implementation of a limited number of programswhich have been identified as having a high probability forsuccess. (These may be in areas such as retailing, constructiontrades, auto and truck mechanics, hospitality trades, andhealth services.)
C. Year 3 plus is devoted to the development of additional programsand to rfining existing programs.
The initial staffing requirements for the BOVES are dependent on the
number of participating corporations. Ideally, participation should be
such as to support a staff of two professionals, one a specialist in
curriculum developMent and one a specialist in research and development,
and a para-professional who can serve both the secretarial and the research
assistant functions. Just as programs are designed to utilize existing
facilities, so the DOVES Organization should be housed wherever corpora-
tions have space to house it.
RECOMMENDATION X - IT IS RECOMMENDED THAT FINANCINGBE SUCH AS TO PROVIDE STABILITYTO THE BOVES ORGANIZATION.
There are a number of possible approaches to the funding of a BOVES.
One school corporation could finance it and chargeother.participating
corporations on the basis of services rendered. All participating corpora-
tions could vote a yearly budget based on either number of students partici-
pating or on assessed valuation. The most desirable approach, however, is
probably to establish the BOVES as an independent corporation with its

11-17
initial capitalization coming frot a fixed amount received from each
corporation with it being self-supporting after the initial capitaliza-
tion. Subsequent income would then be on the basis of fees received
from school districts for BOVES services provided to the districts. If
it aczomplishes its purposes, it will prosper; if it does not, it will
cease to exist.
There will undoubtedly be state and federal funding available for
some BOVES activities but it is recommended that a key guideline for the
development of BOVES programs be that they could be maintainei without
such funds.
RECOMMENDATION XI - IT IS RECOMMENDED THAT APPROVAL BESOUGHT FROM THE DEPARTMENT OF PUBLICINSTRUCTION TO HAVE THE BOVES AND THEVOCATIONAL-TECHNICAL SCHOOL-WITHOUT-WALLS RECOGNIZED AS PILOT PROGRAMS.
There are of course alternatives to the recommendations. Four such
alternatives are discussed briefly below.
Alternative A - do not expand vocational-technical opportunities for
the area's students. To not act is always an alternative and at times
circumstances dictate non-action as the most desirable decision. In this
matter, however, such is not the case and a lack of action will do nothing
toward the end of meeting-any of the identified needs. .
Alternative B - expand the vocational-technical offerings within the
existing framework. Each school district could work independently to
expand their vocational-technical programs. This approach could conceiv-
ably serve to meet at least in part, the identified needs III, IV, V, VI,
and VII but would not begin to attack needs I and II, research for decision
making and a reduction in the duplication of course offerings between
districts,
Alternative C - establish an area vocational-technical school. The
area school is a popular approach for meeting the vocational-technical
needs of an area. This approach, however, has some serious flaws when
considered against the nature.of the eight counties and the identified
needs for the area. Foremost among these flaws are that the approach does
not attack needs I, IV (flexibility of programs), V (decision base for
students), and VII (most for the money spent).

11-18
Determining a central site for an area facility which will permit any
reasonable transportation pattern is a major problem. The secondary school
population base itself is sufficient to support a traditional area school
but that population is spread over a land area of 3261 square miles. Wher-
ever an area school was located in the eight counties, a majority of the
theoretically eligible population would be excluded from anything like a
maximum participation in its programs. It is difficult to imagine a very
enthusiastic support of programs by most school trustees as long as this
situation exists.
Furthermore, the costs which would be involved in establishing and
maintaining a school to serve the eight-county area would be such that it
would be extremely difficult to convince patrons that they are getting the
most for their money. There are four major cost factors to be considered
in association with an area school. These factors are construction costs,
equipment costs, operational expenses including maintenance and staffing,
and student transportation. Table IIc is based on the experiences of ten*
existing area schools and summarizes some key statistics concerning area
vocational-technical schools.
TABLE IIc
Ranges of Typical Costs and Service Statistics Based on Ten IndianaVocational-Technical Area Schools as of April, 1972
LowShelbyville
HighElkhart
Construction Costs 325,000 3,700,000
Year of Construction 1956/1965 1971-72Size (in square feet) 70,000 148,000
Student Capacity 400 1,400
1971-72 Enrollment 400 500
Operating Budget 220,000 370,000
Reimbursement 58,000 148,000
Equipment Costs 106,000 800,000
High Schools Served 6 10
Programs Offered 10 17
Total 9-12 Population 3,035 15,000
Even assuming a 50% reimbursement from state and federal funds to
assist in defraying initial construction and equipment costs and assuming
an optimistic one-third reimbursement on operational costs, an area school
*Elkhart, Anderson, Greenwood, Shelbyville, Ben Davis, New Albany, Bedford,Versailles, Connersville, Washington Township as of April, 1972.

11-19
appears to be an expensive alternative even without the transportation
costs which would be involved in West Central Indiana.
The most damning characteristic of an area school considering the
identified needs for the eight-county area is not costs, however, but
rigidity. Institutionalization in the form of a traditional area school
demands a bricit and mortar commitment and commitments to professional
staff which in turn engender rigidity. Once such commitments axe made,
there sometimes is a tendency to maintain the programs for which facili-
ties and staffing are available even when employment opportunities for
graduates of the programs axe minimal. This situation can result in the
recruiting of students appropriate for existing programs as contrasted to
providing flexible programs appropriate to changing student needs and
changing employment opportunities.
Alternative D - establish area vocational-technical centers. It
would be possible to establish an area vocational-technical school at
three or four regional centers rather than as a single central facility.
For example, if centers were established in Central Fountain County,
Southern Montgomery County, and North Central Clay County with each center
offering programs in the most popular vocational-technical curricula for
the area, transportation problems would be less than for a central facility.
It is likely, however, that some programs would be duplicated in two or
more of the centers. In addition, the observations made above concerning
an area school, with the exception of those concerning.transportation,
would be equally valid for area centers.
ROADBLOCKS
As is true of any new project, there are a number of roadblocks to
the implementation of the recommendations which can be expected. Some of
these can be identified at this time; some cannot be anticipated now; bu.t
none present insurmountable barriers. Among these roadblocks which can
be anticipated are the following ones which, although the categories
overlap, have been classified as community-based, school-based, and
other-based.
Community-based Roadblocks
A. The citizens of West Central Indiana take great pride in their
high school athletic teams and bands. If a vocational-technical program

11-20
is perceived of as interfering with these programs, resistance can be
expected. This is a condition which must be considered in program plan-
ning and every effort need be made to keep the community well informed
in this area.
B. As previously noted, there is a common misunderstanding concern-
ing the nature of vocational-technical education by a substantial part
of the adult community. This could cause difficulties in recruiting the
more able students into vocational-technical programs even where those
programs appear the most appropriate for the involved students. There-
fore, the community must be educated regarding the purposes, objectives,
and nature of vocational-technical education.
C. School patrons exhibit a healthy concern for the costs of educa-
tion. Hence, they must be kept well-informed concerning the values they
are receiving from the programs including a hypothesized increase in
reimbursement for average daily attendance because of the greater holding
power achieved by the programs.
D. Cooperative efforts are frequently thwarted by the very human
suspicion that the "other fellow is getting more than me." There must be
a very real effort made to assure that each member or supporting organi-
zation does indeed .receive its fair share of services.
School-based Roadblocks
A. The implementation of the posse staffing concept and the' utili-
zation of community sites for instruction will require a considerable
reorganization of the school day. Personnel and sites are going to have
to be used for instruction when they are not serving their primary
function. This means that vocational-technical instruction well may be
accomplished only during the early morning or post-dinner-time hours.
In turn, this will require that school-based related instruction be done
at times other than between 8:30 a.m. and 3:30 p.m. The expanded school
day increases school capacities through a more efficient use of the
existing facilities. Such changes, however, can be anticipated to evoke
resistance based on their novelty.
B. The increasing oversupply of teachers may cause them to view
the posse staffing concept as a threat to the profession. If teachers
are actively involved in program planning and are convinced these pro-
grams are intended to complement their efforts, it is to be hoped that

11-21
resistance from this source will be minimized.
C. Not all of the potential cooperating secondary schools are
accredited by the North Central Association. Attempts to consolidate
programs between accredited and non-accredited high schools could fail
to receive approval from that organization. If the efforts, however,
have the status of a pilot project approved by the Department of Public
Instruction, the North Central Association should be willing to permit,
if not endorse, the effort without threat to the schools of the loss of
their accreditation.
D. The problem of certification as it relates to the use of
deputized staff and to their supervision by BOVES staff not necessarily
certified in the area which they are supervising will have to be settled
with the Department of Public Instruction. It is noted, however, that
the proposed situation is not markedly different from the one currently
true for the Industrial Cooperative Training (ICT) Programs so there does
exist a precedent on which to build.
E. It is likely that some of the BOVES programs will not receive
reimbursement from the Division of Vocational Education because they will
not fall within the guidelines for reimbursement. Loss of reimbursement
or failure to obtain it is sometimes fatal to a program. Sponsors must
therefore constantly be aware of the fact that most BOVES programs are
apt to be less expensive than similar reimbursed programs even without
reimbursement.
Other-based Roadblocks
A. Commercial schools are apt to view the BOVES as competition and
therefore oppose its efforts. In reality such competition will be indirect
since the BOVES primary concern will be the in-school population whereas
the commercial schools tend to draw from the out-of-school population.
Nevertheless, to the extent that BOVES programs are successful, the commer-
cial schools' pool of potential customers will decrease.
B. IVY Tech too may consider the BOVES services as a duplication of
their efforts. Such a competitive situation could develop, but if the
BOVES staff has a good liaison with IVY Tech staff and offers programs
for adults and secondary drop-outs only where IVY Tech does not provide
them, competition will not be an issue.

11-22
The recommendations represent a complex but workable program. Key
in whether or not the program does work is the staffing of the ROVES.
It will require flexible, energetic, and creative individuals who will
work harmoniously with a widely-varied assortment of people. The rec-
ommended program's nniqueneds lies not in the parts. Each of the parts
has been tested and proven workable. The uniqueness of the recommenda-
tions is in the way those parts are organized. TO THE EXTENT THAT THE
RECOMMENDATIONS ARE IMPLEMENTED, THE IDENTIFIED NEEDS WILL BE MET, and
the area will be provided a vehicle for the training of artisans as well
as technicians and skilled tradesmen.

SECTION III
HISTORY OF THE STUDYAND
SURVEY PROCEDURES

CHART III a
SCHOOL CORPORATIONS PARTICIPATING IN THE WEST CENTRALINDIANA VOCATIONAL AND TECHNICAL EDUCATION SURVEY
I
1
If
/
1. Boone County2. Clay County3. Fountain County4. Montgomery County5. Parke County6. Putnam County7. Vermillion County8. Warren County
BOONE COUNTYLebanon Community School Corporation
Superintendent---Robert McFryeStudy Coordinator---Willis Pullins
Western Boone County Community School DistrictSuperintendent---James P. FritchStudy Coordinator---Ron McKee
CLAY COUNTYClay Community Schools
Superintendent---Glen E. MunroStudy Coordinator---Carroll (Jack) Stark
FOUNTAIN COUNTYAttica Consolidated School Corporation
Superintendent---George E. HayesStudy Coordinator---George E. Hayes

CURT III-a, con't.
FOUNTAIN COUNTY con't,Covington Community School Corporation
SuperintendentWilliam Holstine, Jr.Study CoordinatorJames Griswold
Southeast Fountain School CorporationSuperintendent---Paul G. IngersollStudy CoordinatorWilliam Boone
MONTGOMERY COUNTYCrawfordsville Community Schools
Superintendent - - -C. Merrill Dailey
Study Coordinator - - -Dr. Charles ArvinNorth Montgomery Community School Corporation
Superintendent---Eual S. McCauleyStudy CoordinatorEual S. McCauley
South Montgomery Community School CorporationSuperintendent -- -Bob JA TandyStudy Coordinator---Bob J. Tandy
PARKE COUNTYRockville Consolidated Schools
SuperintendentRussell GarrigusStudy Coordinator - -- Russell Garrigus
Turkey Run Consolidated School DistrictSuperintendent---Dale DePlantyStudy CoordinatorCyril Johnson
PUTNAM COUNTYCloverdale Community Schools
Superintendent---Arthur L. JohnsonStudy Coordinator---Arthur L. Johnson
Greencastle Community SchoolsSuperintendentFrank A. RossStudy Coordinator---Lloyd Hurst
North Putnam Community SchoolsSuperintendent---Charles D. FrazeeStudy Coordinator---Norman Evans
South Putnam Community SchoolsSuperintendent---Harold C. BooneStudy Coordinator---Lloyd Hqskins
VERMILLION COUNTYSouth Vermillion Community School Corporation
SuperintendentRichard H. NewportStudy Coordinator---Keith Helmes
WARREN COUNTY .
MSD of Warren CountySuperintendent---John R. JohnsonStudy Coordinator---James Hegg

The school corporations of Fountain, Montgomery, Vermillion, and
Warren counties had cooperated in providing special education services
to their constituents prior to the spring of 1972. During the spring
of 1972 these corporations considered the possibility of extending that
cooperation to a study to assess the need for additional vocational-
technical educational opportunities in the area and to determine the
feasibility of various means for providing such additicnal opportuni-
ties including, but not limited to, an area vocational-technical high
school(s). Crawfordsville Community School Corporation initiated con-
tact with the Vocational Education Division of the State Department of
Public Instruction to seek funding for a study. In counsel with the
Vocational Education Division's representatives, four additional coun-
ties with similar interests were identified as Boone, Clay, Parke, and
Putnam.
During July, 1972, representatives from all of the school corpora-
tions in the eight counties were invited to participate in a study and
eighteen* of them did express a desire to participate. (The partici-
pating corporations, superintendents, and local study coordinators are
shown as Chart III-a.) During a July, 1972 meeting representatives of
the eighteen corporations appointed C. Merrill Dailey (Crawfordsville),
Charles Frazee (North Putnam), and William Holstine, Jr. (Covington) to
act as a steering committee and requested that Crawfordsville act as
lead corporation and fiscal agent. Working with Donald Peyton of the
Department of Vocational Education, the steering committee developed a
proposal and in September of 1972 submitted that proposal to the Depart-
ment of Vocational Education for funding. In October, 1972 funding was
approved and F. B. Gannon of New Educational Directions (NED) was re-
tained to complete the study within the state guidelines for a voca-
tional-technical education feasibility study. In addition, a follow-up
survey of the graduating classes of 1965 from the participating corpora-
tions was commissioned. During October and early November the survey
instruments and forms (see Section XII))were developed and printed.
Between November 13 and November 22, 1972, survey materials were deli-
vered and Mr. Gannon met with the local coordinator and/or superintendent
* * * **After the study had commenced, Warren Community School Corporation andWarren Central School Corporation consolidated as the MSD of WarrenCounty. Therefore, the number of corporations on which this report is
based is seventeen.
111-5
in each district to discuss the data gathering forms and to answer ques-
tions concerning procedures. Although the original timetable called for
all forms to be completed and returned prior to the schools' Christmas
recess, the last forms were received by Mr. Gannon during the first
week in April. The processing of data started during the week of Decem-
ber 11, 1972 and continued until April 6, 1973.
During February and March, 1973 an interim report summarizing data
from the "Parents' Questionnaire," the "Student Occupational Interest
Inventory," and the "Teacher's Form" was prepared for and released to
each of the participating corporations. The interim report was intended
to (1) provide feedback to cooperating districts in those three areas
where they had provided "raw" data and (2) to provide the corporations
with a basis for giving additional input to the study prior to the
assembling of the final report and before preparing the recommendations
(zee Section II), When the interim report was issued the covering letter
from Mr. Gannon to the superintendent or local coordinator in part
stated, "After you have had an opportunity to review this report, I will
appreciate an opportunity to discuss its content with you and your staff."
Nine such meetings did take place between March 12 and April 16, 1973
In addition to the meetings with the school people, the study
director met with seven Chamber of Commerce representatives between
March 19 and April 9, 1973. The representatives were as follows:
Domenick J. AvenattiClinton Chamber of Commerce
Frank CorneliusLebanon Chamber of Commerce
Richard FreyCovington Chamber of Commerce
Louise OsgoodBi-county (Fountain and WarrenCounties) Chamber of Commerce
Charles W. BennettCrawfordsville Chamber of Commerce
Jack FlintGreencastle Chamber of Commerce
Austin K. NoblittRockville Chamber of Commerce
In discussions with these Chamber of Commerce representatives, an attempt
was made to assess potential support in the business-industrial community
* * * *
*The school corporations involved were: Clay Community Schools, CovingtonCommunity School Corporation, Crawfordsville Community School Corporation,Greencastle Community Schools, Lebanon Community School Corporation, MSDof Warren County, North Putnam Community School Corporation, Rockville
Consolidated Schools, and South Vermillion Community School Corporation.

111-6
for the tentative recommendations, to determine if there were pending
major business-industrial changes in the area of which the study direc-
tor was unaware, and to obtain a feeling the quality of the school-
community relationship.
In general, both schoolmen and Chamber of Commerce representatives
exhibited a positive attitude toward the tentative recommendations and
school-community relations are apparently very good in the areas sampled.
The Chamber of Commerce representatives were very positive in their atti-
tudes toward the schools' efforts but were not unaware of the relative
strengths and weaknesses of the schools. The general attitude of the
Chamber of Commerce representatives perhaps is best summarized by the
parting remark often heard, "Just tell us what we can do to help and to
keep our young people in the area."
During the month of April, 1973, the tentative recommendations were
refined and modified on the basis of the discussions held between the
project director and the schoolmen and Chamber of Commerce representa-
tivesdand the final report was assembled and issued.

SECTION IV
CURRENT PROGRAMS

TABLE IV-a
N1
NUMBER OF SECTIONS
Reimbursed Vocational Programs
NR
by Corporation
CO
ZGrades 7-12
cz)
z
H I-1>
4I
0 IZ=
h)sZ
I
E4
PVI CODE
TITLE
-4
cl
0th
ZE
4N
Igi
14E
-I..i
aZ
D>
4E
l0
01-4
frlC
O
T..
8i-a
zE
4
E4
QR
.z
nI
PIi t:1
E-I
00C
.)
M=
ME
.A
PcoO i
E.
E1
CC
OC
OQ 0
8
010000 - Agriculture
010100 - Agricultureal
-.
__.
-_
4. i--
(1)
2m
wm
.--
2(1)
Production
110
--
13
--
(1)
--4
44
12
437(1)
010101 - Animal Science
--
--
__
1--M
. OP
M. !I,
OP O
P2
2--
6
010102 - Plant Science
---
--
--
-_
CO
.1..1
--
,......
1--
2
010104 - Farm Business
Management
1--
--
11
14
010151 - Soil Science
--
--
--
--
1
010200 - Agricultural Supplies
and Services
12
--
--
--
--
-.
..-
--
3
010300 - Agricultural
Mechanics1
--
--
--
--
31
__
__
__
__
__
61
12
010302 - Agricultural
Structures
--
--
2--
--
2
010303 - Agricultural Power
and Machines
--
_-
1
010306 - Agricultural Construc-
tion
andMaintainence
--
--
--
2-_
--
__
__
--
2
010307 - Agricultural Elec-
trical Equipment
--
--
__
--
-.
__
11
010600 - Agricultural Resources
--
--
--
1--
'.1
2
010603 - Soil
__
--
--
--
--
--
11
019900 - Other Agriculture
--
--
--
--
--
11
090101 - Comprehensive
Home Economics
2--
4--
62(1)
(5)
2--
1(1)
118(7)
090102 - Child Development
1__
12
2--
21
2--
11
12
11
18
() = Normally reimbursed but disallowed for the 1972-73 Academic year.

TABLE IV-a, con't.
N!:
gi
co
E-1
c..)
E+
ZE
E-1
zM
2r41
0z
1nE
4 Afli
)
Pti
E-.
<4
00
1-4Z
C.)
ZZ
>II
-:c
C.)
4r'')
E-I.
N,:.
'A1:9
Eli
RN
<4
o-4
PVI CODE
TITLE
<4
c..)
090103 - Textiles and Clothing
17
2
090104
Consumer Education- -
Foundations
17
1
090105 - Family Health
1--
090106 - Family Relations
11
090107 - Foods and Nutrition
17
1
030108 - Family Management
1
090109
Housing
16
1
090152 - Interpersonal
Relations
71
090153
Human Development
6--
090154
Orientation to the
World of Work
090202 - Clothing Management
--
140000 - Office Education
140200
Data Processing
Occupations
140303- General Office Clerk
--
140702 - Secretary
1
140902 - Typist
149900 - Other Office
170000 - Trade and Industrial
Education
171300
Drafting
1
279900 - Remedial other than
English, Mathematics,
or Science
(2)
280000
Vocational Guidance
2
290000
Interdisciplinary Coop-
erative Education (ICE)
Programs
c.,c..)
0M
1:::-4 16
14
53
23
2-g--
25
245
13
2--
21
22
13
32?
2--
--
12
--
11
11
--
10
1--
21
--
22
--
21
32
18
1(5)
43(4)
34
--
8(1)
32
51
649(10)
--
--
12
--
2--
--
1--
71
21
--
11
--
--
21
21
121
13
22
12
21
3(1)
--
25(1)
1--
18
22
15
(4)
--
--
--
-_
(4)
11
11
12
7
(1)--
(1)--
1(1)--
(1)--
1(2)1
(1)
--
(1)
--
(1) ---
(1)
1--
--
11
--
(2)
21
5
31
11
6
() = Normally reimbursed but disallowed for the 1972-73 Academic year.

TABLE IV-b
ENROLLMENTS
Reimbursed Vocational
Programs by
Corporation
Grades 7-12
PVI CODE
c.)
8E
-1
O
010000
010100
010101
010102
010104
010151
010200
010300
010302
010303
010306
010307
010600
010603
019900
090101
090102
090103
090104
090105
090106
090107
090108
090109
090152
090153
090154
090202
140000
23
10
26
- -
258
14
1914
2514
2514
--
146--
23
--
__
--
--
125
101--
--
129
--97
96
97
_ -8
27
18
--918
--818
----
26
--
19
24
1524
24
--
18
--
1524
18
--
5636
77
----
--
(91)
--
28
----
(64)
46
--
/No 0M
----
89
56
--
14
6'
--
1356--
150
37
--
43
--
65(41)
--
----
3o
--
5314
35
25
--
36
--
15
--
--
26(21)
236o
--
11
35
6211
1128
--
34
(60)
(6o)
28
33
15
31
----
(113)
21
44
18
65
3818
38
22
48
84
--
--
--
--20
37
388
37
123(?)
3736
48--31
26
35
191033
45
--
4320
32
7115
24
4026--
27
40
34
--
--53
71
3212
48
7o18
144t.
--
28--
38
24
26
--
10
----
18369--48--
229--
--
28
3920
20
15__
98--
15
--24
20
1313
16(13)
970
32
--
45
73
--
24(10)15
11
__
71--
--
--
--
__
22
__
--
----
--
--
--14
--
23
47--
53
--;
----
--
--
4860
620((60 )
107
5355
1545
209
25153624
35
1313
318(147)
298
703
478
149
321
786(132 +)
369(10)
130
4s,7
(64).
190
( ) = Normally reimbursed but disallowed for the 1972-73 Academic year.

TABLE IV-b, con't.
II
>4
(24
.C1
0Pi
1tf)
*:4
zN
-.4E
4E40
00
0z
1..Z
c)=
PVI CODE
il
c.,
0-1>
<4
0C
gc)
01:41
4AG
140200
140303
140702
140902
149900
170000
171300
279900
280000
290000
--
--
ON
O M
_...
?
(22)
46
--
--
34
_..
--
--
(19)
--
26(17)
--
20
24
--
--
--
--
19
77
(20)
(20)
--
eft. ois
_W
I=,
=
(13)
15
^--16
6
arm.=
(19)
26(37)
34
(20)
(13)
20
(22)
89
114
( ) = Normally reimbursed but disallowed for the 1972-73 Academic
year.
? or + indicates enrollments unknown but in excess of figures shown.
Iv -6
Table IV-a summarizes the number of sections of school based voca-
tional programs offered by the various school corporations and reimbursed
by the State Division of Vocational Education for the 1972-73 school
year. Table IV-b presents a summary of the number of students enrolled
in those programs. The course titles used in Table IV-a are those found
in the Vocational Education Data System Manual published by the Division
of Vocational Education, Indiana Department of Public Instruction and
these titles frequently differ from the course designations assigned by
the individual corporations. It must be noted that under many PVI Codes
and titles a number of related courses with different content can be
offered. Therefore, because twelve of the corporations offer thirty-
eight sections under the general heading "Agricultural Production" does
not indicate that the same course is being repeated a total of thirty-
eight times,but neither does it mean there is not a great deal of dupli-
cation of offerings between corporations. A considerable duplication
of efforts indeed does exist.
The per section enrollment for reimbursed courses tends to be lower
than would be expected for most high school offerings. In some cases
the nature of the instruction and safety considerations require a low
pupil-teacher ratio, but in other cases this is not so. A low pupil-
teacher ratio means high per pupil costs. Wherever a low pupil-teacher
ratio is not demanded for safety and where neighboring districts are
offering vocational courses which are essentially duplications of each
others efforts, consideration should be given to developing a cooperative
program. Such a program of cooperation between corporations could lay
the groundwork for expanded vocational-technical offerings with minimal
cost increases through a more efficient utilization of staff and facili-
ties. The cooperative efforts would provide a wider student base but
there would be, of course, some increased transportation costs which
would off-set a part of the financial gain realized by the elimination
of duplication. Nevertheless, the net effect of such cooperation between
districts would"be to release some funds for program expansion.

IV-7
TABLE IV-cADULT VOCATIONAL PROGRAMS REIMBURSED byINDIANA DIVISION OF VOCATIONAL EDUCATIONNumber of Sections ( ) and Enrollments
by Corporation 1972-73
PVI CODE LOCAL Course Title
E0 0>-..
E p X x LIEl z E4 E-4
bd m E- a z1.4 o o o o oo z = z al co x
010000 Records Class, YoungFarmers (1)20
010000 Country Couples, YoungFarmers 1)20
010000 Young Farmers 1)17 (1)24010100 Agricultural Production (4)69010100 Profitable Farming010100 Adult Education, Agri-
cultural010100 Farm Management, Young
Farmers010104 Adult Farm Business
Management010300 Adult Education, Agri-
cUltural Mechanics (1)15010306 Agricultural Welding (1)12
(1)15 (1)15
(1) 24
(1)25
(1)15(1)20
The reimbursed courses offered to adults in the communities served
by the participating school corporations are far more limited in scope
and availability than are reimbursed for students. As of November, 1972,
only five of the seventeen corporations reported offering a total of
sixteen sections of reimbursed adult programs and all of these adult
offerings were in some phase of agriculture. However, as noted in
Section VI, Table VI-b in the adult communities as represented by the
parents of grade 4, 8, and 10 pupils, the potential interest in non-
agricultural areas is probably such that greatly expanded adult vocationally
oriented programs could be considered.
In addition to the courses offered to the student and adult popu-
lations which al-e reimbursed by the Division of Vocational Education,
there are a number of courses offered to both groups which can result
in the development of salable skills although the interest of adults in
such offerings is frequently at the level of developing avocational

IV-8
skills. The availability of such courses for students in the industrial
and commercial areas as reported by the participating school districts
are presented as Table IV-d.
Tnese "non-reimbursed" programs, as is true of the reimbursed
vocational programs, frequently require a considerable capita? invest-
ment for equipment and, for various reasons, have low pupil-teacher ratios.
Furthermore, as was observed to be true for the reimbursed programs
there is a considerable duplication of the courses offered by the various
corporations. Once again the corporations may find that cooperative
efforts focused on reducing such duplication could result in the ability
to expand and diversify offerings in these categories as well as for
reimbursed programs.

TABLE IV-id
INDUSTRIAL and COMMERCIAL COURSES
NOT REIMBURSED BY THE
STATE DIVISION OF VOCATIONAL EDUCATION
by School CorporationM
"4
Mg
N0
pors.
0
1P
EA
NE
-,to
as 0
.4P
"4Z
Z134
A-4
Z
0E
II
Ed
440
PE
-1o-1
o-1.4
C.)
C.)
gFA
rziN
20
N0
ziz
to
Industrial - Beginning
Auto m
echanicsx
xx
xCo-ed industrial arts
xDrafting (drawing and planning,
engineering, architect,
mechanical)
xx
xx
xx
xx
xx
xx
xx
xElectricity
xx
xx
xx
xx
Electronics
xx
xx
Foundry
xGeneral shop
xx
xx
xx
xGraphic arts
xx
XX
X
Industrial materials
xMachine shop (1st year)
xx
xx
xMetals
xx
xx
xx
xx
xx
Plastics
xx
Power (mechanics or systems)
xx
x ,
xx
xx
xx
xPrinting
xx
xx
Small engine repair (air-
cooled engines)
xWelding (arc)
xx
xx
Woods
xx
xx
xx
xx
xx
xx
xx
xx
Industrial - Advanced
Advanced shop

TABLE IV-d, con't.
1-t
07
t-.10
00
c5x
P)zE
2
t-tt-t
Drafting (pechanical
drawing
2nd year)
xx
xx
xx
xx
Electricity (2nd year
xx
Electronics (2nd year
xGraphic arts
xx
xMachine shop (2nd year)
xx
xMetals
xx
xx
xPower (mechanics)
xx
Printing (2nd year)
xx
xx
Welding
xWood (2nd year)
xx
xx
xx
xx
xx
Commercial - Beginning
Basic accounting or
bookkeeping
xx
xx
xx
xx
xx
xx
xx
xx
xBusiness communication or
English
xx
xx
xx
xx
Business law
xx
xx
xx
xx
Business math
xx
Xx
xx
xBusiness or office machines
xx
xx
xx
xx
Business sales and service
xClerical practice
xx
xConsumer economics
xx
General business
xx
xx
xX
xx
xx
xx
xIntroduction to business I
xMarketing
xOffice practice
xx
xx
Secretarial practice
xx
Shorthand (1st year)
xx
xx
xx
xx
xx
xx
xx
xx
Typing (1st year)
xx
xx
xx
xx
xx
xx
xx
xx
x
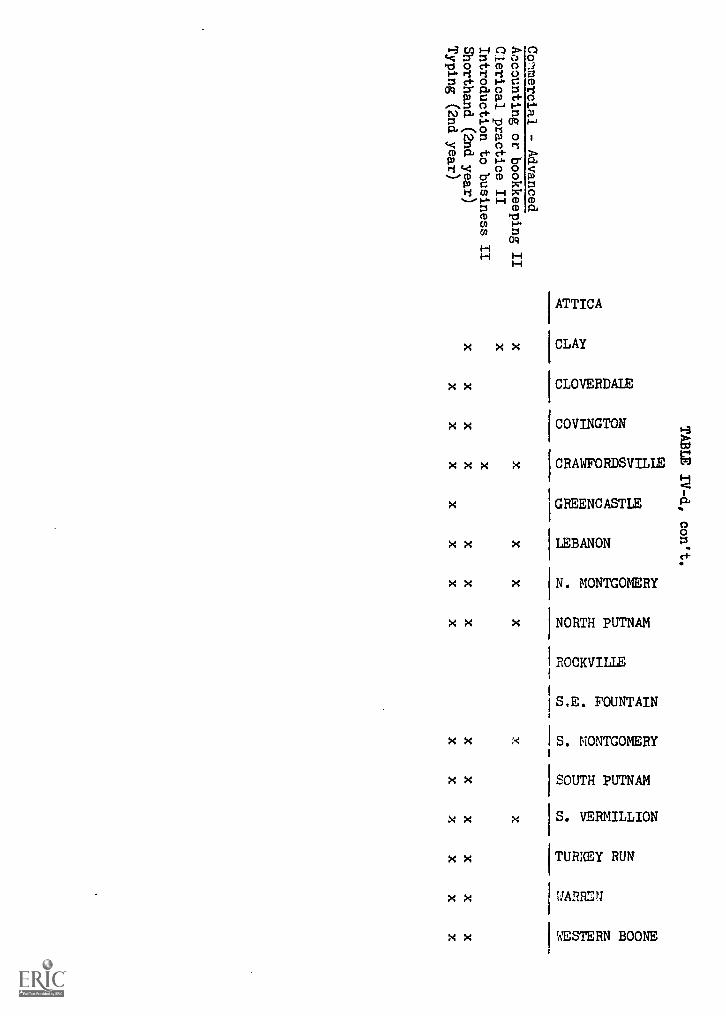
X
II
X X
'ATTICA
'CLAY
X X
(CLOVERDALE
X X
(COVINGTON
XX
X X
'CRAWFORDSVILLE 5
X
'GREENCASTLE
O
X X
'LEBANON
X X N.
MONTGOMERY
X X NORTH
PUTNAM
IROCKVILLE
S.E.
FOUNTAIN
S.
MONTGOMERY
SOUTH
PUTNAM
S.
VERMILLION
(TURKEY
RUN
IWIRREU
kESTERN
BOONE

SECTION V
STUDENT REACTIONS
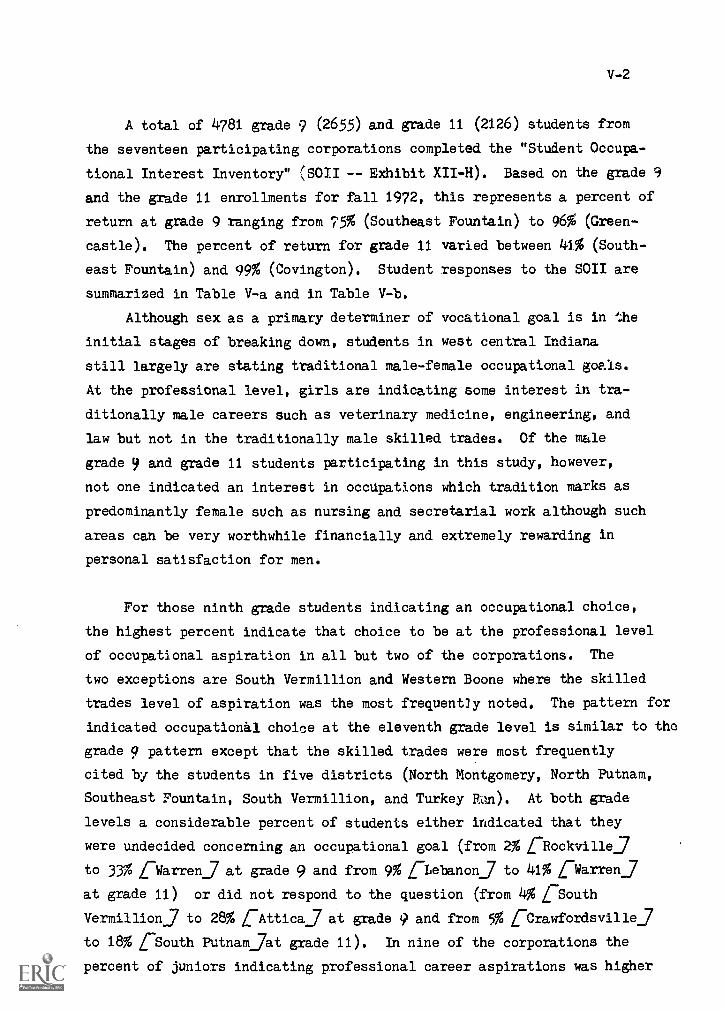
V-2
A total of 4781 grade 9 (2655) and grade 11 (2126) students from
the seventeen participating corporations completed the "Student Occupa-
tional Interest Inventory" (SOII -- Exhibit XII-H). Based on the grade 9
and the grade 11 enrollments for fall 1972, this represents a percent of
return at grade 9 ranging from 75% (Southeast Fountain) to 96% (Green-
castle). The percent of return for grade 11 varied between 41% (South-
east Fountain) and 99% (Covington). Student responses to the SOH are
summarized in Table V-a and in Table V-b.
Although sex as a primary determiner of vocational goal is in the
initial stages of breaking down, students in west central Indiana
still largely are stating traditional male-female occupational goals.
At the professional level, girls are indicating some interest in tra-
ditionally male careers such as veterinary medicine, engineering, and
law but not in the traditionally male skilled trades. Of the male
grade 9 and grade 11 students participating in this study, however,
not one indicated an interest in occupations which tradition marks as
predominantly female such as nursing and secretarial work although such
areas can be very worthwhile financially and extremely rewarding in
personal satisfaction for men.
For those ninth grade students indicating an occupational choice,
the highest percent indicate that choice to be at the professional level
of occupational aspiration in all but two of the corporations. The
two exceptions are South Vermillion and Western Boone where the skilled
trades level of aspiration was the most frequent]y noted. The pattern for
indicated occupational choice at the eleventh grade level is similar to the
grade 9 pattern except that the skilled trades were most frequently
cited by the students in five districts (North Montgomery, North Putnam,
Southeast Fountain, South Vermillion, and Turkey Rim). At both grade
levels a considerable percent of students either indicated that they
were undecided concerning an occupational goal (from 2% (Rockville]
to 33% (Warren] at grade 9 and from 9% (Lebanon] to 41% (Warren]
at grade 11) or did not respond to the question (from 4% (South
Vermillion] to 28% [-Attica.] at grade 9 and from 0 (Crawfordsville]
to 18% (South Putnam_7at grade 11). In nine of the corporations the
percent of juniors indicating professional career aspirations was higher

TABLE V-a
STUDENT OCCUPATIONAL
>4
>4
P;
INTEREST INVENTORY
N11
11-40as
il
.6
Student Responses in Percent
42i
80rz4
E-1
by Corporation
zg
NN
&I
c:4
1co
GRADE 9
EN
g.0
cyl = . .4, g 0
in.H
li'0 0 0-4
00 0 U
NC
.-01 t-i
CY
)....1
P4 -40
-4C
M54 %
0L
eiri
8O
Nto
Nr1
alE
N V
li pi ri 4 HH
W H
= H
MM
C--
HH
Nit O
H>
11licT1H
if 6 II8
ii 8H
p,u
p,ii
Eg
u g II11
HU
)0
Percent of Return (Based on
A0
MC
JZ O
Z r..)
ZZ
ZZ
ZZ
IZZ
enZ C
aZ C
QZ
CQ
Zgrade 9 fall 1972 enroll-
ments)
91.0
86:4
*94.1
5. Do you plan to graduate?
Yes
91.2 96.0 94.3 90.2
No
4.4 0.9
--
3.6
Omit
4.4
3,2
5.7
6.3
6. High School Program:
college preparatory
35.2 41.0 15.7 35.7
business-commercial
4.4 10.6
5.7
4.5
vocational-technical
6.6 10.3
5.7
8.0
general
27.5 32.7 64.3 40.2
other
2.2
1.4
5.7
6.3
omit-multiple
24.2
4.0
2.9
5.4
7. Occupational Choices
professional
18.7 22.9 22.9 21.4
business and sales
2.2 2.3 2.9
0.9
89.9
96.2
89.182.1
98.995.1
96.594.7
0.4
--
1.2
0.6
0.8
4.9
2.4
4.7
39.8
35.013.0
30.0
11.3
7.9
3.9
4.7
5.610.8
2.0
4.7
36.5
36.9
73.6
43.5
1.9
1.0
3.5
4.7
4.9
8.4
3.9
12.4
26.7
19.7
23.2
20.0
2.6
2.0
2.0
1.8
clerical and office
4.4 6.0 11.4
3.6
5.6
4.9
6.3
7.1
skilled
3.3 14.9 14.3 10.7
service
6.6
5.4
8.6 2.7
farming and agriculture
2.2
3.4
1.4
6.3
labor
4.4 1.4 2.9
5.4
marriage
2.2
2.3
1.4
3.6
12.0
13.315.0
16.5
4.5
3.4
4.3
5.3
0.4
2.0
2.0
5.3
1.5
3.9
6.7
5.3
1.9
0.5
4.3
0.6
*fall enrollment was 69 but by December the enrollment had increased.
82.3
94.675.2
87.890.5
92.6
91.678.1
86.4
96.3
97.794.2
93.8
97.696.0
92.1
93.693.8
3.o
2.3
--
0.8
2.5
--
0J3
2.1
0.7
--
5.8
6.3
1.6
1.5
7.9
5.6
4.1
35.6
48.319.4
45.8
36.319.5
36.816.8
26.0
22.2
2.3
5.814.6
9.7
12.015.8
8.8
13.0
27.4
4.6
9.7
9.028.2
15.0
31.6
9.6
13.0
8.9
44.8
52.423.618.6
52.514.5
60.8
38.4
3.o
--
4.9
1.4
2.4
--
1.3
1.6
3.4
3.o
--
7.8
5.6
4.8
1.0
--
2.4
6.2
21.5
32.220.427.8
21.015.5
21.1
18.411.0
--
1.2
--
0.7
4.0
0.5
--
4.8
2.1
11.1
8.1
7.811.8
4.0
9.0
10.5
4.8
8.2
18.528.7
11.7
8.317.7
22.5
18.4
7.2
13.7
5.9
3.4
3.9
4.2
8.1
8.5
1.3
3.2
6.2
4.4
5.7
1.9
0.7
4.8
1.0
3.9
6.4
8.9
0 7
2.3
2.9
4.2
3.2
4.0
2 6
4.0
6.2
3.7
2.3
1.9
0.7
4.o
6.5
1.3
--
3.4

8
>4
01-1p40
TABLE V-a, con't.
cg
C.) O
NH
11
ON
er)H
otiII
r-I
2
DDII
Cr)
C.) 0 0 IrN
CU
rziE
lII g 0r-III
MIA
El
I-IL
s.-r-I
CO
n8
0 0144 0
FAII
c-20 r-I0
CI
tai;1
o0.0L
s.-
Lt1
41
HE-I
W H
7. Occupational Choice (con't.)
OM
OM
OM
C.)1:42g2
21)42C
1]2viz
vizviz
entertainment
1.1
1.1
5.7
0.9
1.1
0.5
3.1
1.8
1.5
1.1
0.8
2.5
--
1.6
2.7
undecided
23.1
22.1
18.6
27.727.8
26.6
25.220.6
25.2
2.3
22.323.617.7
25.0
25.0
32.8
27.4
other
4.4
3.7
4.3
0.9
1.9
3.0
1.6
3.5
0.7
1.1
4.9
0.7
0.8
1.5
2.6
4.8
1.4
omit
27.514.3
5.7
16.1
13.9
20.2
6.312.4
6.7
11.5
22.317.4
13.7
3.5
13.2
12.0
8.9
8. Post-secondary Plans:
vocational-technical school.
1.1
8.910.0
6.3
6.0
6.4
5.1
6.5
9.6
11.5
4.9
6.9
8.1
8.0
7.9
4.8
8.2
business school
2.2
4.3
7.1
1.8
5.3
3.4
5.5
7.1
9.6
4.6
7.8
4.2
4.8
2.5
5.3
5.6
8.2
nursing school
4.4
4.6
1.4
2.7
2.6
3.0
0.8
2.9
3.0
2.3
6.8
0.7
0.8
1.0
3.9
5.6
2.1
junior college
1.1
3.4
1.4
3.6
3.0
2.5
2.8
2.4
1.5
2.3
1.0
1.4
5.7
1.5
--
3.2
0.7
senior college
24.2
27.5
25.7
25.9
33.1
35.5
28.7
24.723.7
25.3
22.325.7
20.226.5
14.5
30.417.8
employment
12.1
5.2
10.0
8.9
8.3
9.9
13.4
11.2
5.2
6.9
11.711.1
16.1
14.0
7.9
8.8
4.8
military
6.6
5.710.0
4.5
6.o
5.9
5.9
6.5
12.6
10.4
8.7
6.3
6.510.5
5.3
4.8
8.9
apprenticeship
--
0.6
1.4
0.9
--
0.5
0.7
--
1.9
0.7
--
1.0
2.6
1.5
2.7
housewife
4.4
3.7
--
5.4
1.5
2.0
4.3
--
3.7
2.3
1.0
2.1
3.2
6.5
1.3
0.8
6.2
undecided
31.9
32.1
27.1
35.7
32.3
28.1
27.2
35.3
27.427.6
32.0
36.829.8
25.0
50.0
32.0
37.0
other
2.2
2.3
5.7
2.7
1.5
2.0
5.9
1.2
2.2
--
1.0
2.1
2.4
2.5
--
2.4
2.1
omit
9.9
1.7
--
1.8
0.4
1.0
0.4
2.4
0.7
6.9
1.0
2.1
2.4
1.0
1.3
--
1.4
9. Enroll in preparation for
employment courses?
Yes
48.4
57.0
84.3
47.3
50.4
50.7
61.0
47.6
43.0
54.0
68.0
57.669.4
57.0
57.9
71.2
65.1
No
44.0
41.3
15.7
49.1
42.1
45.3
37.0
47.6
53.3
44.8
30.1
35.4
30.7
41.5
42.1
27.2
33.6
Omit
7.7
1.7
--
3.6
7.3
3.9
2.0
4.7
3.7
1.2
1.9
6.9
--
1.5
--
1.6
1.4
10. Willing to travel for courses?
Yes
35.2
47.061.4
36.6
51.1
40.4
42.5
35.9
40.0
62.1
37.9
36.1
53.2
51.0
50.0
55.2
48.6
No
46.2
50.4
35.7
58.9
43.2
52.2
55,1
58.8
57.8
24.1
59.2
54.9
44.4
43.5
50.0
43.2
50.0
Omit
18.7
2.6
2.9
4.5
5.6
7.4
2.4
5.3
2.2
13.8
2.9
9.0
2.4
5.5
--
1.6
1.4

rl8
Acn 1-1
ci)E
-t8
5N
g8
51;11
cp
01:4
TABLE V-a, con't.
on
E-1
%..0
E-I 0
0L.--
.ri)4f'87 E
fmU
Et:
glci `C
1tc;
800
0 .-1.-1
0w
.r.11g
1-1z
gi
n3 II 811.111.4
gi8
IIC
1)If
Z C
..)MZ
ZZ
ZZ
viz u;zu;zo;zgz
11. Desired courses now available?
Yes
60.4
65.3
45.7
60.7
59.4
72.969.7
74.7
79.329.9
60.2
79.975.8
68.5
75.0
58.4
56.9
No
26.4
30.7
52.9
34.8
19.5
20.2
26.8
20.6
20.764.4
32.014.6
22.6
29.0
23.7
38.4
42.5
Omit
13.2
4.0
1.4
4.5
21.1
6.9
3.5
4.7
--
5.7
7.8
5.6
1.6
2.5
1.3
3.2
0.7
12.
Current high school program
appropriate?
Yes
60.4
67.6
61.465.2
69.9
70.0
66.5
80.0
78.5
39.1
62.1
79.2
73.4
74.5
78.9
76.0
63.7
No
31.9
30.7
35.7
31.3
23.7
25.6
31.9
17.6
17.0
56.3
34.0
16.7
25.0
23.5
21.122.4
33.6
Omit
7.7
1.7
2.9
3.6
6.4
4.4
1.6
2.4
4.4
4.6
3.9
4.2
1.6
2.0
--
1.6
2.7
13.
Informed about number of
careers?
Yes
49.5
52.7
31.4
72.3
34.6
56.2
47.2
48.828.9
46.0
41.8
66.0
35.5
52.0
50.0
46.4
46.6
No
48.4
47.0
65.726,8
65.4
43.8
52.4
50.6
69.6
54.0
56.3
31.9
63.7
48.0
50.0
53.6
53.4
Omit
2.2
0.3
2.9
0.9
--
0.4
0.6
1.5
--
1.9
2.1
0.8
14.
Informed about training for
careers?
Yes
52.7
51.0
50.0
67.9
32.0
47.3
43.7
47.6
36.329.9
46.6
56.9
37.9
50.5
60.5
43.2
54.8
No
40.7
47.3
44.3
28.6
65.0
47.3
55.5
47.1
60.766.7
50.5
38.2
56.5
46.5
35.5
54.4
43.2
Omit
6.6
1.7
5.7
3.6
3.0
5.4
0.8
5.3
3.0
3.5
2.9
4.9
5.7
3.0
.3.9
2.4
2.1
15.
Distance of adult residence
from current:
within 50 miles
50.5
60.5
45.7
66.1
41.7
50.7
55.1
61.2
51.1
51.7
60.2
75.0
70.2
55.0
63.2
61.6
66.4
50-100 miles
17.6
13.8
31.414.3
14.3
11.3
13.012.4
17.8
24.1
10.7
7.612.1
14.0
21.118.4
9.6
more than 100 miles
19.821.8
20.0
13.4
28.2
23.627.2
18.8
28.2
23.019.4
6.3
12.1
28.013.2
12.817.8
Omit
12.1
4.0
2.9
6.3
15.8
14.3
4.7
7.6
3.0
1.2
9.7
11.1
5.7
3.0
2.6
7.2
6.2

TABLE V-e, con't.
16. Sources of career informationt
Ci
CO
El
Ch
elC
11cn
E-I 0
g*-
ug.
bta
r-IE
br-I
(:) \CI 0 0 0 I"
rr4E
-IC
A.1 C
r)r-I
Mr-I
CO
Esn8n
MoM
oMoM
0gM
04 MM
M
0H1-1O0
L't-1?-1
IIII 8
IIG
T?:
IIII
IIII
UII
2E-1
H
parents
53.8
48.1
35.7
55.4
59.8
52.2
43.3
61.2
40.7
46.0
37.9
49.3
50.8
53.o
44.7
41.6
35.6
teachers
14.3
18.3
24.317.0
19.9
19.2
10.6
13.5
13.325.3
6.8
22.2
25.0
23.5
19.725.6
18.5
counselors
4.4
15.8
4.3
9.8
9.0
15.819.3
5.9
17.8
37.9
43.7
17.4
29.o
3.o 28.9
27.2
19.2
other high school students
12.1
7.7
--
6.3
8.6
7.9
7.1
11.2
5.9
6.9
4.9
4.2
8.9
6.o 13.2
8.o
7.5
older friends
23.1
17.8
8.622.3
26.3
25.1
18.9
19.4
14.125.3
23.3
13.927.4
23.o
18.4
13.6
17.1
other
17.6
17.2
25.7
17.0
20.7
16.724.8
15.910.4
14.9
13.614.6
24.2
18.0
15.817.6
19.9
omit
6.6
3.2
4.3
3.6
2.6
1.0
1.2
2.9
3.0
--
1.0
5.6
2.4
--
--
0.8
2.7
17. Program Interest
(C choices):
Trade and Industrial
16.5
10.3
22.913.4
18.0
7.9
4.714.7
14.1
39.o
15.3
4.2
8.9
4.5
10.516.o
24.o
Business-Merchandising
14.3
15.8
20.0
17.0
19.9
10.816.1
12.9
20.7
24.116.5
10.4
4.8
7.o
6.6
18.411.6
Technologies
16.512.014.3
16.1
17.317.2
13.812.9
11.123.0
15.5
7.621.8
24.5
18.4
27.223.3
Food and Clothing
13.2
8.6
20.0
4.5
15.4
8.418.1
6.5
7.4
16.0
6.8
8.3
8.9
2.5
5.3
10.4
Agriculture
4.4
14.0
30.0
8.o 21.8
8.417.7
14.1
5.9
9.2
7.8
3.5
12.1
24.o
5.3
24.o
8.9
Public Service
30.8
24.9
28.6
23.2
27.4
32.o
27.620.6
27.4
37.9
16.5
21.5
37.1
20.5
28.9
36.8
25.3
Health Services
17.6
23.8
30.0
23.2
26.3
30.022.0
15.3
18.525.3
24.3
20.8
31.5
18.5
32.9
35.2
21.9
Other
16.5
28.7
40.0
23.2
33.1
26.121.3
15.3
30.4
24.1
26.2
9.7
26.6
32.o
13.2
31.2
20.5
18.
First Choice7
Trade and Industrial
40.0
55.6
37.5
26.7
41.7
31.3
25.o
36.o
47.4
64.7
31.3
33.3
45.5
55.6
62.5
45.o
57.1
Business-Merchandising
23.1
40.0
50.0
36.8
37.7
31.8
43.9
31.8
39.3
4.8
17.7
33.3
50.0
50.0
40.0
69.6
35.3
Technologies
20.0
33.3
10.o
55.6
28.3
17.1
42.9
40.926.710.0
37.5
63.6
44.4
53.1
57.1
58.8
29.4
Food and Clothing
8.3
26.7
28.6
--
14.6
17.6
32.6
45.5
20.0
7.1
--
50.0
9.1
40.0
50.0
23.1
45.5
Agriculture
--
34.7
23.8
22.2
24.1
5.9
40.0
25.0
12.5
25 012.5
4o.0
33.3
39.6
--
36.7
--
Public Service
32.1
28.715.0
23.1
30.1
30.8
38.6
42.924.3
18.2
29.4
30.3
47.8
56.1
36.4
28.3
27.0
Health Services
37.5
44.6
19.0
26.9
45.7
59.0
55.4
57.7
36.o
72.7
48.o
26.7
46.2
62.2
60.o
38.6
46.9
Other
33.3
55.o
46.461.5
58.o
52.8
57.4
53.8
61.0
30.8
33.3
35.7
48.5
39.1
20.0
48.7
30.0
*Percent based on number selecting
category as a (C) choice.
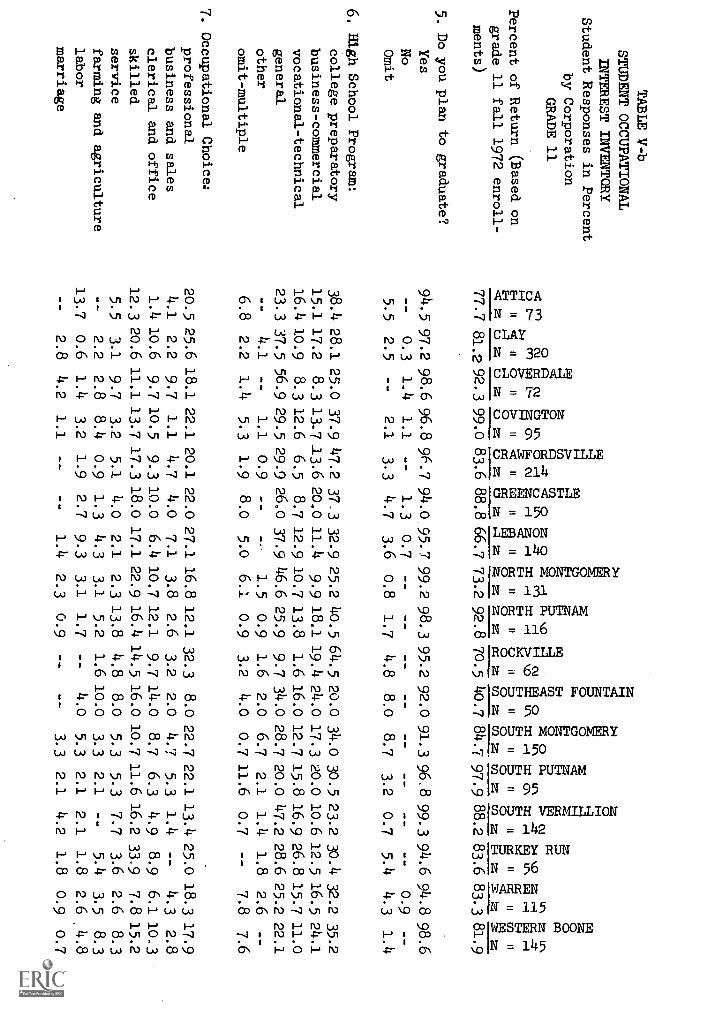
TABLE V -b
STUDENT OCCUPATIONAL
'"
INTEREST INVENTORY
fr-4
r...i
4
Student Responses in Percent
fr-4
0by Corporation
88
E-I
1GRADE 11
NP
iB
En
0%
0 CI
E-I
P4 -1-
<4 Q
0 Z ri
134 0 I-4<
4Z
0 134C
M<
4 enC
kl % C
M 0 liN
0 1-1 u IJA 0 -1-
rnH
1-1C
kl N 0
I.1II\
IAin
-.1->
4 0-1 Z
_4-9 L---(11V
1.--- MO
NC
klM.-I
.--14,--1 rfri
\Oftr\ rfri riO
Nr-IQ
I-1-\ Ws-11H
(Based
Percent of Return
on
Ef
II4-C
II0
II.II
<4
IIcel
IIcat
IIr4
IIr4
IIil
IIIl
IIII
IIE
-rfr-4
fr-40
%%
rx1
00
00
00
0Il
Mti
grade 11 fall 1972 enroll-
<cz um um oz oz oz I-4 z zzzz az caz caz caz caz
z 3 z
zments)
77.7 81.292.3 99.0 83.6
5. Do you plan to graduate?
Yes
94.5 97.2 98.6 96.8 96.7
No
--
0.3 1.4
1.1
--
omit
5.5
2.5
--
2.1
3.3
6. High School Program:
college preparatory
38.4 28.1 25.0 37.9 47.2
business-commercial
15.1 17.2
8.3 13.7_13.6
vocational-technical
16.4 10.9
8.3 12.6
6.5
general
23.3 37.5 56.9 29.5 29.9
other
--
4.1
--
1.1
0.9
omit- multiple
6.8
2.2
1.4
5.3
1.9
7. Occupational Choice:
professional
20.5 25.6 18.1 22.1 20.1
business and sales
4.1
2.2
9.7
1.1
4.7
clerical and office
1.4 10.6
9.7 10.5
9.3
skilled
12.3 20.6 11.1 13.7 17.3
service
5.5
3.1
9.7
3.2
5.1
farming and agriculture
--
2.2
2.8 8.4 0.9
labor
13.7
0.6
1.4
3.2
1.9
marriage
2.8
4.2
1.1
88.8
66.7
73.2
92.8
70.5
40.7
84.797.9
88.2
83.6
83.381.9
94.0
95.799.2
98.3
95.2
92.0
91.396.8
99.394.6
94.898.6
1.3
0.7
--
0.9
--
4.7
3.6
0.8
1.7
4.8
8.o
8.7
3.2
0.7
5.4
4.3
1.4
37.3
32.9
25.2
40.5
64.5
20.0
34.0
30.5
23.2
30.4
32.2
35.2
20.0
11.4
9.9
18.1
19.4
24.017.3
20.0
10.612.5
16.5
24.1
8.7
12.9
10.713.8
1.616.0
12.7
15.8
16.926.8
15.7
11.0
26.0
37.9
46.6
25.9
9.7
34.o
28.7
20.0
47.2
28.6
25.2
22.1
1.5
0.9
1.6
2.0
6.7
2.1
1.4
1.8
2.6
--
8.0
5.0
6.1
0.9
3.2
4.0
0.7
11.6
0.7
--
7.8
7.6
22.0
27.1
16.812.1
32.3
8.0
22.7
22.1
13.4
25.018.3
17.9
4.o
7.1
3.8
2.6
3.2
2.0
4.7
5.3
1.4
--
4.3
2.8
10.0
6.4
10.7
12.1
9.7
14.0
8.7
6.3
4.9
8.9
6.1
10.3
18.0
17.1
22.9
16.414.5
16.0
10.711.6
16.2
33.9
7.8
15.2
4.0
2.1
2.3
13.8
4.8
8.0
5.3
5.3
7.7
3.6
2.6
8.3
1.3
4.3
3.1
5.2
1.610.0
3.3
2.1
--
5.4
3.5
8.3
2.7
9.3
3.1
1.7
--
4.0
5.3
2.1
2.1
1.8
2.6
.4.8
1.4
2.3
0.9
--
3.3
2.1
4.2
1.8
0.9
0.7

TABLE V-b, con't.
7. Occupational Choice (con't.)
entertainment
undecided
other
omit
8. Post-secondary Plans:
vocational-technical school
business school
nursing school
junior college
senior college
employment
military
apprenticeship
housewife
undecided
other
omit
9. Enroll in preparation for
employment courses?
Yes
No
Omit
10. Willing to travel for courses?
Yes
No
omit
1-90
Qm
89'
649
o
RE
Ar_0411.2aN
e,_c4
1/4c)tifiV
-51-`1)4.4ti
g-,1°ci"4
,-4 vo0
P4O
Nrzi
H 11
nasu8nclac4211la
11
11
11
co)
11
r4.11
11
11
cnilcgz ozoz
cpzram
uaz cz cilznz--
1.3
--
3.2
2.3
2.7
0.7
1.5
0.9
4.8
2.0
2.0
1.1
1.4
0.7
17.8
15.9
23.624.2
29.424.0
8.6
17.624.1
22.6
20.0
18.7
24.2
35.2
12.5
40.9
22.1
8.2
0.9
1.4
1.1
4.2
1.3
3.6
3.8
2.6
--
--
2.0
--
4.2
--
6.1
--
16.4
14.1
8.3
8.4
4.7
10.0
12.1
12.2
7.8
6.5
16.0
13.317.9
9.2
7.1
7.0
9.0
16.4
12.5
4.2
8.4
4.7
8.7
8.6
9.2
8.6
3.2
4.o
4.7
7.4
9.919.6 lo.4
8.3
2.7
7.2
6.9
6.3
5.1
5.3
3.6
3.8
3.416.1
16.0
6.o
2.1
1.4
8.9
4.3
8.3
4.1
2.8
1.4
3.2
3.7
0.7
3.6
3.1
0.9
--
2.0
0.7
2.1
4.2
1.8
2.6
0.7
2.7
2.2
2.8
7.4
3.3
4.o
2.1
8.4
1.7
1.6
4.o
6.0
--
2.1
3.6
2.6
--
24.727.5
23.6
15.8
31.8
32.0
29.3
22.1
21.6
50.0
8.o 24.7
28.4
21.1
30.4
20.0
24.1
12.3
10.9
15.3
12.610.3
12.015.0
13.7
14.7
3.2
16.0
14.713.7
16.3
7.111.3
10.3
6:8
5.o 13.9
3.2
5.1
6.o
4.3
1.5
14.7
8.1
16.0
6.o
5.3
7.7
8.9
5.2
10.3
0.6
--
4.2
0.9
1.3
2.1
1.5
2.6
1.6
2.1
1.8
1.7
0.7
4.1
3.4
5.6
2.1
1.9
--
2.9
3.8
1.7
1.6
2.0
3.3
3.2
3.5
1.8
2.6
3.4
23.325.6
26.4
33.7
31.8
28.o
25.o
29.o
26.7
14.5
32.o
28.7
35.8
28.9
16.1
35.7
30.3
2.7
1.6
--
2.1
0.5
1.3
2.9
3.1
1.7
--
2.7
1.1
--
--
3.5
2.1
0.6
1.1
0.9
0.7
0.7
0.8
1.7
--
2.7
1.1
0.7
1.4
53.4
67.2
80.6
65.360.7
64.065.o
64.9
74.1
71.0
68.o
61.3
71.6
71.8
73.2
73.o
66.9
38.4
30.0
19.4
33.7
36.4
33.3
32.9
32.8
24.1
25.828.o
34.o
26.326.1
25.0
25.2
31.7
8.2
2.8
--
1.1
2.8
2.7
2.1
2.3
1.7
3.2
4.0
4.7
2.1
2.1
1.8
1.7
1.4
47.9
50.6
52.8
46.3
53.3
46.0
47.9
27.5
53.4
56.5
34.o
30.0
47.4
57.0
50.0
63.5
46.9
43.8
44.7
44.4
51.6
41.6
51.3
50.7
68.7
44.8
37.162.o
63.3
47.4 40,8-44.6 33.9
51.0
8.2
4.7
2.8
2.1
5.1
2.7
1.4
3.8
1.7
6.5
4.0
6.7
5.3/2.1
A 2.6
2.1
,
?I

secn
81
NR
8pa
TABLE V-b, con' t.
0 AE
-4fn
LA 0
o40
Eg
n..11)4
N20E
Rn
L(.11
.0-*
L`-
Pr)M
C:11 § C
VM
r-Ir-I
.0E
illuo411 811v
nil
IIH
Hv.)
o
<C
Z c.)M
t)Z oZ
c.)Z gZ
AZ
zraz cnz cnz vi z Cnz
11. Desired courses now available?
Yes
NoOmit
12. Current high school program
appropriate?
Yes
No
Omit
13. Informed about number of
careers?
Yes
No
omit
14. Informed about training for
careers?
Yes
No
Omit
15. Distance of adult residence
from currents
within 50 miles
50-100 miles
more than 100 miles
Omit
60.3
60.0
58.3
61.1
58.9
52_763.6
77.9
53.4
51.6
62.0
66.0
57,9
33.1
55.4
50.4
56.6
28.8
35.3
40.3
36.8
38.3
44.o
31.4
16.8
44.o
46.8
30.0
31.3
37.9
63.4
42.9
46.1
42.6
11.0
4.7
1.4
2.1
2.8
3.3
5.o
5.3
2.6
1.6
8.0
2.7
4.2
3.5
1.8
3.5
0.7
67.1
65.6
76.4
51.6
58.4
52.069.3
71.8
63.8
61.3
74.0
62.7
71.6
4c.862.5
61.763.4
30.1
32.8
23.6
47.4
39.3
44.7
28.6
24.4
35.3
37.1
24.o
33.327.4
57.7
37.5
36 5
35.9
2.7
1.6
--
1.1
2.3
3.3
2.1
3.8
0.9
1.6
2.0
4.0
1.1
1.4
--
1.7
0.7
47.9
55.0
62.5
46.346.7
49.360.7
52.7
46.6
38.7
60.0
44.7
55.8
33.160.7
44.3
54.5
49.3
45.0
37.5
52.6
52.3
49.3
38.6
45.8
51.7
61.3
40.0
53.3
44.2
64.1
37.5
55.7
45.5
2.7
--
1.1
0.9
1.3
0.7
1.5
1.7
--
2.0
--
2.8
1.8
--
45.2
52.2
48.6
43.2
45.3
44.0
63.6
61.1
44.o
29.0
50.0
37.3
55.8
38.o
53.6
42.6
55.9
45.2
45.9
51.4
56.8
54.2
54.0
32.9
35.1
53.4
67.7
44.o
56.0
41.1
56.3
42.9
53.9
42.1
9.6
1.9
0.5
2.0
3.6
3.8
2.6
3.2
6.0
6.7
3.2
5.6
3.6
3.5
2.1
64.4
63.4
55.6
63.2
51.4
48.7
66.4
61.8
57.0
43.5
54.0
64.7
63.2
58.5
50.0
48.7
73.8
16.4
15.6
25.o18.9
12.1
13.3
7.1
14.5
21.6
9.7
20.013.3
7.4
18.317.9
19.1
12.4
17.8
15.0
13.9
15.8
26.2
22.717.9
16.8
18.1
22.6
20.0
12.0
20.0
16.2
23.2
25.2
10.3
1.4
5.9
5.6
2.110.3
15.3
8.6
6.9
3.4
24.2
6.o 10.0
9.5
7.0
8.9
7.0
3.4

TABLE V-b
con't.
16. Sources of career informationt
parents
teachers
counselors
other high school students
older friends
other
omit
17. Program Interest (C choices);
Trade and Industrial
Business-Merchandising
Technologies
Food and Clothing
Agriculture
Public Service
Health Services
Other
18. First Choice;*
Trade and Industrial
Business-Merchandising
Technologies
Food and Clothing
Agriculture
Public Service
Health Services
Other
0Q
m8
28
Ncm
E"1
in 8 -2;E
-4II
I0 il
>II
<4
11
ha
Z1-4
0C
40 M
0 M 0 M
0 M26.0 37.2 34.7 32.6 35.5
31.5 21.9 33.3 18.9 19.6
30.1 30.6 19.4 23.2 38.3
19.2 10.3
5.6 13.7 11.2
26.0 22.8 26.4 35.8 23.8
13.7 19.4 18.1 26.3 10.7
--
1.9
--
1.1
0.9
9.6
7.2 30.6
9.5 14.5
9.6
7.2
9.7 15.8 10.3
26.0 17.8 22.2 27.4 19.2
13.7
6.9 13.9
8.4
7.9
9.6 18.1 38.9 15.8 20.6
38.4 29.4 48.6 34.7 37.4
32.9 29.7 25.0 34.7 28.5
16.4 19.4 40.3 35.8 23.4
8.6 39.1 36.4 66.7 64.5
--
30.4 57.1 60.0 27.3
31.6 35.1 18.8 42.3 26.8
10.0 22.7 20.0 12.5 35.3
28.6 36.2 35 7
6.7 27.3
28.6 28.7 31.4 33.3 36.3
45.8 48.4 33.3 48.5 57.4
25.0 50.0 44.8 44.1 62.o
*Percent based on number selecting category as a (C) choice.
N>
-,z
..0
r40
81-1
92
cEilN
98
014
f:)8 2E
gi-,n'ci.o. 20ER
nLr.
m >
-.T
NL
iiNi
2-N
11
gi11
....
H0
8 IIrsi
IIII
nC
4E
-4II
iiii
CO
iIIZ0 M
1-4 M z M
tF-: M IZ
Zcl; M
Cl M
Cl
VIM
gz 3 z Nz
44.7 27.1 27.5 30.2 38.7 50.0 40.7 27.4 43.7 32.1 27.8 31.0
21.3 14.3 21.4 27.6
8.1 18.0 18.0 11.6 18.3 10.7 20.0 21.4
11.3 47.1 42.0 40.5 30.6 44.0 25.3 27.4
9.2 35.7 48.7 35.2
14.7
6.4
7.6
7.8 25.8 22.0 19.3
5.3 13.4
3.6 10.4
7.6
30.0 22.9 23.7 19.8 35.5 30.0 26.0 31.6 35.9 23.2 14.8 26.9
16.0 15.0 14.5 16.4 27.4 16.0 16.7 21.1 26.1 30.4 16.5 20.7
2.7
1.4
2.3
1.7
--
2.0
6.7
2.1
2.8
--
--
2.1
4.o
2.9
4.6 29.3 16.1 28.0
3.3 16.8 10.6 28.6 23.5 33.8
17.3 18.6
9,2
5.2
8.1 10.0
8.0 16.8 16.9
5.4 19.1 10.3
16.0 23.6 13.0 27.6 12.9 26.0
8.7 11.6 30.3 39.3 24.3 22.1
6.7
8.6
1.5 10.3 11.3
6.0
3.3
5.3
3.5
7.1
7.8
8.3
11.3 39.3
6.1 11.2 12.9 14.0
4.7 13.7 21.8 10.7 16.5 20.0
28.0 32.1 16.0 35.3 32.3 32.0 28.7 41,1 33.8 32.1 42.6 40.0
29.3 32.1 20.6 28.4 38.7 16.0 16.7 28.4 29.6 19.6 35.7 26.9
34.7 13.6
7.6 39.7 46.8 22.0
9.3 22.1 25.4 30.4 30.4 32.4
16.7 25.0 16.7 50.0 50 o 64.3 60.0 62.5 33.3 62.5 37.0 34.7
15.4 34.6 50.0
--
20.0
--
33 3 12.5 45.8
--
31.8 33.3
58.3 33.3 41.2
--
12.5
7.7 61.5 18.2 25.6 27.3 42.9 18.8
30.0 25.0
--
8.3 42.9
60.0 20.0
--
22.2
8 3
29.4 34.5 62.5 23.1 25 0
23.1 32.3 16.7 47.4 31.0
21.4 40.0 66.7 26.8 20.0 43.8 20.9 48.7 20.8 38.9 34.7 25.9
56.8 53.3 66.7 18.2 29.2 50.0 26.0 51.9 57.1 81.8 51.2 41.0
48.1 57.9 90.0 37.0 62.1 27.3 50.0 28.6 47.2 58.8 45.7 63.8

than the percent of freshmen in that district noting professional aspi-
rations. A greater percent of the juniors than the freshmen in twelve
of the districts mention the skilled trades as career goals. This trend
may represent a greater degree of reality orientation for the older
students.
From 25% (South Vermillion) tc 50% (Turkey Run) of the freshmen and
from 159 (Rockville) to 36% (South Putnam and Warren) of the eleventh
graders reported being undecided concerning their post-secondary plans.
Senior college was selected by the highest percent of students indicating
post-secondary plans for both grade levels in all instances except for
Rockville's grade 11 students. The Rockville juniors cited business
school, employment, and military service (16% each) twice as frequently
as they did senior college (8%). In all but four cases the percent
of students stating an interest in attending either a four year college,
junior college, or a nursing school exceeded the percent indicating a
professional career goal. The four exceptions to this observation are:
South Montgomery (grade 9) where the percents were equal and Turkey
Run ',grade 9), Rockville (grade 9), and Southeast Fountain (grade 11)
where the number of students indicating plans to attend a four year
college, junior college, or nursing school was less than the number
indicating professional career aspirations. From 30 (Attica) to
19% (North Putnam) of the grade 9 and from 10% (Crawfordsville and
South Putnam) to 29% (Turkey Run) of the grade 11 students indicated a
post-secondary interest in either a vocational-technical school or a
business school.
From 43% 'North Putnam) to 84% (Cloverdale) at grade 9 and from
53% (Attica) to 81% (Cloverdale) at grade 11 of the students surveyed
indicated an interest in enrolling in courses to prepare them for
employment immediately after gradation. In Cloverdale the percent of
eleventh grade students indicating an interest in employment preparation
was slightly leas than the percent for grade 9 students although it
remained at the highest level for all of the corporations. The percent
interested in such courses at Scutheast Fountain remained at 68% in
both grades. In all other corporations, the percent of students ex-
pressing interest was higher for the grade 11 students than for grade 9
students. Approximately 35% (Attica) to 62% (Rockville) of the grade 9

V-12
and 28% (North Montgomery) to 64% (Warren) of the grade 11 students
indicated a willingness to travel to attend preparation for employment
courses. It must be noted, however, that there is some indication that
the grade 9 students were confused concerning these questions as the
percent of Crawfordsville and Rockville freshmen indicating a willingness
to travel for such courses exceeded the percent stating an interest in
those courses.
In fifteen of the corporations half or more of the grade 9 and in
sixteen of the corporations half or more of the grade 11 students
responded that the courses they desire are available to them. For
those students who indicated they would like additional courses pro-
vided, suggestions as to what those courses should be were wide and
varied. In general, these responses can be summed up as "more of"
responses such as more languages, more science, more physical education,
more music, more shop, etc. The expanded curriculum needed to comply
with any significant number of these student suggestions would require
an extremely individualized curriculum which would necessitate a
financial commitment for resources and teacher retraining which may be
unrealistic.
In sixteen of the corporations 60% or more of the grade 9 students
and in thirteen of the districts 60% or more of the grade 11 students
indicated that enough of their high school courses are or will be
directed toward what they want to do when they leave high school. In
view of the rather substantial number of students who are uncertain as
to what their career goals and post-secondary plans are as well as the
surprisingly high percents who indicate both an interest in and a will-
ingness to travel for employment preparation, the validity of their
judgment in this matter nay be questioned. Educators must pause and
wonder how representative of a substantia? number of students is the
articu'ate ninth grade student who wrote, "I'm 15 years old and if
you expect me to know what career I'm going to follow you've got to be
nuts. Whatever career I choose to follow, it will most likely have
absolutely nothing to do with any preparation I received in high school
because it isn't worth a thing except a diploma which works like
a magic wand when you want a job. High school is the most stupid,
senseless, worthless institution in America. High school courses are
worth absolutely nothing."

V-13
At grade 9 from 29% (North Putnam) to 72% (Covington) and at grade 11
from 33% (South Vermillion) to 63% (Cloverdale) of the responding students
alleged they are well informed concerning the number of carvers open to
them. From 30% (Rockville) to 68% (Covington) of the freshmen and from
29% (Rockville) to 64% (Lebanon) of the juniors claimed to to well in-
formed concerning the training or education required for ca,:eers in
which they are interested. Of note, however, is the fact that a lesser
percent of the eleventh grade students than the ninth grade students
stated they were well informed concerning training requirements in
fourteen of the corporations. If the assumption is made that teachers
are accurate in their evaluations of students lack of knowledge concerning
careers (see Section VII), then this trend may reflect an increasing
awareness on the part of students relevant to what they do not know.
The most frequently indicated sourse of career information for
freshmen is parents in all corporations except Southeast Fountain where
44% of them noted the counselors, Eleventh grade students most often
gave as their primary source of career information as parents (seven
corporations), counselors (seven corporations), older friends (two
corporations), and teachers (one corporation). Because an individual
is designated "counselor" does not guarantee that he will be well
informed concerning either career opportunities and training needs or
available sources of information regarding these matters. Nevertheless,
of the various information sources available to students, the counselor
is the only one who generally can be expected to have some training in
these areas. It is therefore somewhat surprising, but based on other
similar studies not atypical, that counselors as a group are not recog-
nized as serving this function for a larger proportion of the student
body. The accuracy and comprehensiveness of career information received
from other sources must be questioned.
It appears that the involved communities will directly benefit
from the efforts of their schools if employment opportunities are
available. A surprisingly low percent of the responding students indi-
cate.a desire to establish their adult residence more than a hundred
miles from their current residence. The highest percents of students
indicating they plan to live as adults more than a hundred miles from
where they presently live are 28% of the freshmen (Crawfordsville,

V -14
North Putnam, and South Vermillion) and 26% of the juniors (Crawfords-
ville).
Public service or health services education are the two areas most
commonly indicated as a "would take if offered" interest by both freshmen
and juniors in all but three corporations. Agriculture was selected
by Lebanon's juniors, trade and industrial was specified by Rockville's
freshmen, and technologies was chosen by Turkey Run's freshmen and
juniors most frequently as their "would take if offered" choice. Student
responses to the "other" categories followed essentially the same pattern
as was noted above for student suggestions of additional courses.
Students enrolled in a college preparatory program tended to note addi-
tional courses more frequently than students enrolled in other programs.
Since students were permitted to select as many "would take if
offered" choices as they cared to indicate, an index of commitment to
those choices is required. Such an index is provided by the percent of
students who classify a "would take if offered" choice as a first choice.
For example, 32% (65 individuals) of Greencastle's freshmen indicated
an interest in public service education and 30% (6lstudents) of them
evidenced interest in health services education. Only twenty (31%) of
the public service group as contrasted to thirty-six (59%) of the health
services group gave their interest a first place ranking. Therefore,
in this instance, the health careers area appears to be the more promising
one for further exploration and possible program development.

SECTION VI
PARENT REACTIONS

VI-2
A total of 2643 parents with children in grades 4, 8, or 10 in the
seventeen participating school corporations responded by completing the
"Parents' Questionnaire" (Exhibit XII-I). Based on the fall 1972 enroll-
ments for these three grades in the participating corporations, the per-
cent of parents responding ranged from 13% (Lebanon) to 53% (South Ver-
million). Forty-one of the responding parents were sufficiently inter-
ested in the project to append additional comments to the questionnaire.
Parent responses to items 2-7 of the questionnaire are summarized in
Table VIa. In addition, ten responses were received from patrons in
Clay County in response to a news release (Exhibit XII-N) by that corpo-
ration.
Although most parents were accurate but unimaginative in stating
their occupations, a few demonstrated humor by reporting such as "little
of bombmaker" or "prowler" (Chemical firm and travel trailer manufac-
turer). Two housewives indicated opposing views of the mother and
homemaker roles as one recorded "domestic engineer" while the other
proclaimed her role to be "SLAVE!!".
On the basis of this sampling, parents appear to feel there is a
definite need for additional vocational-technical education in the area
as from 76% (North Putnam) to 97% (Attica and Cloverdale) of the respond-
ing parents indicated more vocational-technical educational opportunities
are needed. Parents did express concern, however, that any vocational-
technical program must be practical and should result in marketable
skills. "My hope is that those in charge of curriculum planning would
include the practical . . . I think it's foolish to educate children
bookwise only and for them to have so much trouble living." One pragmatic
parent summarized the apparent feelings of many when he wrote, "It
would afford many the opportunity to earn a better livelihood and could
easily be a great factor in attracting new businesses to the area."
Another parent made an appeal to provide special education students
with vocational skills, "If this program could assist the less fortunate
children as well as those apstined to go on to college or ?, I think it
would be a very definite asset to our community." A minority opinion
was stated as, "This wouldn't come as near giving our children grades
1 through 12 a well all around education. The slower or less adjusted
students will be looking for an easy way out and come out with nothing
(not even a full hien school education)."

VI-3
An impressive 74% (North Putnam) to )6% (Cloverdale) of the parents
appear to be supportive of the area vocational-technical school concept
and would encourage their children to enroll in such a school (77% in
North Putnam and South Montgomery to 92% in Cloverdale). It must be
noted, however, that parents are indicating support for the concept with-
out an awareness of the costs which would be involved. It is predicted
that the potential for support would be somewhat less as the patrons
become aware of the capital expenditures required for and the operational
budget needed to maintain an area school. It is likely the parents who
wrote, "I am in favor of vocational and technical training but at this
critical time in the financial situation of our schools today, we should
try to maintain and expand what we already have instead of adding to
the financial strain," or "I believe that technical schools would be a
waste of tax dollars and a great injustice to the student who would
neglect important education to take these courses. If a student takes
advantage of what is offered by the schools and has any desire at all,
he can go almost any place he desires. ." would find a greater following
as expenses become an issue.
On the positive side parental support for an area vocational school
was the stance of a decisive majority of the responding parents. Their
stated reasons for support distilled to relevance:
It seems such a waste of time for so many youngsters to stayin school and just be present with no interest whatever. If
only they could be taught something to do with their hands orgirls maybe to be cooks, or nursing aides, etc. Most of theslower ones could care less for four years of English. We
could have more puactical courses in "math" for the sloweryoungsters.
and in lieu of college: I firmly believe this is neededbecause everyone cannot attend college because of finance,space, or intelligence. A person might be intelligent in onecertain field, however. Thus, this school would be of greatimportance to this person. . . A person could attend thisschool and be of great benefit to himself and his employer inthe future.
and drop-out prevention: Some of the juvenile populationare indeed dropouts from school and had they had vocationaleducation, it is felt that this situation would not have hadto occur in some cases. .

TABLE VIa
PARENT QUESTIONNAIRE
Parent Responses in Percent
by Corporation
Percent Return (based on grada
4 & 8 & 10 fall 1972 enroll-
N0
;NE
II.4
ZI-1
041
0Z
CD
El
.../-E
A 0 C
4...a.
4:4=
a\H
Cn 44
0 k.0C
.).--1
0f-I
CO
en Ht--
M6-1 §
IIn "
$II
> II
tCII
iial
IIg4
ilcz
u8
11
NH
p:,n
p:,I, $ I,
. II44Z
c.)Zc.)Z
8z Elz E
gz i-iz Rz
Zz
C 4 Z
CD
Z C
SZ
Cf1=
Cf1Z
H Z
ZZ
Pg.0hl-4
R2
&0
8E
4.5)
PI
2PI
-I'C V
AP4
ts-C
V>
4 Cr \ Z
CV
\ OM
DC
OiC
O
1-1 W ri =
CIN
= V
IC
T\
rz.71-1
1-1
ments)
43.420.2
24.0
34.4
44.813.7
13.2
35.o
30.1
35.5
27.5
23.8
29.o
52.7
44.6
27.2
30.2
Q2 Present Occupation - FATHER
professicnal
8.1
4.9
6.9
9.1
13.5
12.3
10.9
8.8
6.o
9.3
3.212.2
6.2
4.3
4.o
1.6
3.o
business and sales
9.4
11.4
8.3
8.2
13.214.8
16.8
12.2
6.8 14.4
13.7
9.9
6.2
6.810.1
7.8
8.3
clerical and office
0.7
0.8
1.4
1.8
4.4
6.2
2.5
1.7
1.5
--
0.8
--
2.1
1.2
--
1.6
--
skilled
26.8
29.2
36.1
24.5
30.2
27.2
37.0
24.321.1
27.8
33.1
16.8
42.3
28.822.2
30.5
22.6
service
2.7
4.5
2.8
1.8
3.3
4.9
4.2
3.9
2.3
2.1
0.8
2.3
2.1
4.9
2.0
1.6
2.4
agriculture
5.4
6.4
4.2
11.8
0.8
--
5.0
12.218.8
10.3
9.7
13.0
11.3
5.5
17.2
15.6
15.5
labor
housewife
other
18.8
18.8
18.6
11.7
22.2
11.1
15.5
20.0
12.6
12.1
12.3
16.0
2.5
9.2
15.5
15.5
20.3
15.0
5.2
14.4
17.7
14.5
15.3
19.9
13.4
9.3
23.3
12.9
19.2
15.2
21.1
13.3
26.8
14.9
omit
9.4
12.5
6.9
7.3
9.9
6.2
11.8
6.1
8.3
16.5
6.5
10.7
7.212.3
10.1
7.0
6.5
Q2 Present Occupation- MOTHER
professional
6.o
5.3
2.8
6.4
4.711.1
11.8
6.6
6.8
8.2
3.2
6.1
4.1
6.1
5.1
6.3
6.5
business and sales
2.0
1.9
2.8
2.7
4.4
3.7
4.2
2.8
3.o
3.1
1.6
1.5
3.1
0.6
2.0
4.7
3.0
clerical and office
12.1
9.8
4.2
6.4
10.412.3
11.8
12.2
5.3
7.2
9.7
12.219.6
10.1
5.1
10.213.7
skilled
4.7
7.2
8.3
2.7
3.6
1.2
11.8
4.4
3.o
--
8.1
2.3
5.2
6.4
5.1
7.8
2.4
service
--
4.2
0.9
0.3
0.6
0.8
--
0.8
1.5
--
0.3
agriculture
0.6
0.8
0.8
0.3
0.8
--
labor
15.4
11.0
11.1
14.5
11.5
6.2
10.9
7.7
9.0
17.5
12.1
8.4
7.2
11.0
5.119.5
16.1
housewife
42.3
44.7
58.3
50.0
50.0
54.3
38.7
51.9
52.6
48.5
50.8
49.6
48.5
46.3
60.6
35.2
41.7
other
6.8
6.8
2.e
4.5
7.1
6.2
4.2
4.4
6.8
2.1
4.o
3.8
3.1
4.9
2.0
2.3
6.0
omit
10.7
13.3
5.6
11.8
8.o
4.912.6
8.812.0
13.4
9.713.7
9.3
13.8
15.213,3
10.7

TABLE VIa, con't.
Q3 Need more vocational-techni-
cal education in area?
0\-I'
<4
\O
s II
rz)
E-1
0ca
8
0Ii.
11It,
z oz
<4
fezo
P4rl
1-1'
c-o\II.
0
82
\OC
O
Frr)N
ON
5O
Ncrl
gl0\
WII
1111
911
II
Cr; Z
Cr; z C
r; M
yes
97.3
87.1
97.2
92.792.6
91.491.6
82.3
75.995.9
92.7
90.890.7
93.9
86.988.3
91.1
no
2.0
8.7
1.4
3.6
4.4
4.9
4.213.3
15.8
2.1
3.2
3.8
6.2
4.0
6.1
4.7
7.7
omit
0.7
4.2
1.4
3.6
3.0
3.7
4.2
4.4
8.3
2.1
4.0
5.3
3.1
2.2
7.1
7.0
1.2
Q4 Need area vocational-techni-
cal school?
yes
94.0
87.195.8
94.5
89.8
87.790.8
80.1
..
74.493.8
90.3
84.090.7
92.9
82.885.9
90.5
no
4.0
9.1
1.4
2.7
7.1
7.4
5.0
14.9
15.8
3.1
6.5
9.2
7.2
4.310.1
6.3
6.0
omit
2.0
3.8
2.8
2.7
3.0
4.9
4.2
5.0
9.8
3.1
3.2
6.9
2.1
2.8
7.1
7.8
3.6
Q5 Encourage your child to en-
roll in area school?
yes
89.984.8
91.7
88.2
83.0
81.5
84.9
77.9
77.4
85.686.3
77.1
86.6
91.184.8
86.7
84.5
no
5.4
10.2
5.6
7.311.8
9.9
9.2
15.5
13.5
6.2
8.114.5
7.2
4.9
8.1
6.310.1
omit
4.7
4.9
2.8
4.5
5.2
8.6
5.9
6.6
9.0
8.2
5.6
8.4
6.2
4.0
7.1
7.0
5.4
Q6 Interest in adult class?
FATHER
V
yes
30.2
34.5
45.841.8
31.6
40.727.7
33.727.8
32.0
36.3
44.3
42.3
42.0
'25.341.4
39.3
no
40.9
35.2
31.9
30.9
45.3
35.8
44.5
47.0
48.9
41.2
45.2
40.5
34.0
35.6
50.5
39.1
42,9
omit
28.9
30.3
22.227.3
23.1
23.5
27.719.3
23.3
26.818.5
15.323.7
22.4
24.219.5
17.9
Q6 Interest in adult class?
MOTHER
yes
50.3
42.4
63.9
52.7
50.0
48.1
42.9
39.2
42.9
47.4
42.7
49.6
54.6
55.2
45.5
48.4
50.6
no
37.6
37.9
20.8
28.2
41.5
42.0
41.2
47.0
45.9
39.2
40.3
37.4
28.9
32.5
41.4
32.0
35.7
omit
12.1
19.7
15.319.1
8.5
9.9
16.013.8
11.3
13.416.9
13.016.5
12.3
13.119.5
13.7

TABLE VIa, con't.
(17 Type of Program? FATHER*
regular day school voca-
tional-technical
evening vocational-
technical
comprehensive high school
program
cooperative school-work
program
1-6 week vocational-
technical day program
other
*Q7 Type of Program? MOTHER
regular day school voca-
tional-technical
evening vocational-
technical
comprehensive high school
program
cooperative school-work
program
1-6 week vocational
technical day program
other
N..
'40
Q>
p-4.4
/8
CI)
&I
ooN
0A
El 0
CI
r-I01
r-Ir.,
<4 --1'
H 0 ."1(1\D
I&
1.- E rel
C..9)
c6 8 .::.r-i._,
ii9c'D
.-1M
,r70.`"
czi"r-i
cn,-,tc-"A
-
E-1
IIII
0II
II<
4it
rx1II
fliII
E-I
0li
118 II a ii
iiII
< 4
E.) Z
a.
o ZE
.1 MI-4
xZ u;
viz cn4.4
6.6
3.o
2.2
6.1
3.0
--
4.9
5.4
9.7
2.2
1.7
9.8
82.2
67.0
75.8
62.6
67.063.6
90.990.2
70.3
74.2
68.9
77.6
73.2
6,7
4.4
--
2.2
11.3
6.1
9.1
4.9
8.1
3.2
4.4
3.5
7.3
8.9
3.3
3.0
6.514.8
6.1
6.1
18.0
13.5
3.2
11.1
6.9
14.6
8.9
14.3
9.0
21.7
20.0
12.1
15.2
18.010,6
6.5
20.0
25.9
9.8
6.7
5.5
9.0
4.3
12.2
6.1
3.0
6.6
8.1
3.2
4.4
6.9
--
17.3
15.2
10.9
24.112.6
17.9
15.711.3
15.8
6.5
9.4
10.8
17.0
64.0
46.4
54.3
62.1
45.1
36.0
68.6
54.9
45.6
63.0
43.4
56,9
52.8
9.3
6.3
2.2
8.6
7.7
10.3
7.810.0
12.3
4.3
7.5
7.7
11.3
14.7
15.2
15.2
6.917.0
12.8
23.514.1
1.8
17.418.9
10.8
20.8
20.0
28.6
34.8
20.7
35.2
36.0
17.6
22.5
36.8
17.4
41.5
20.028.3
2.7
5.4
6.5
1.7
6.0
--
5.6
7.0
6.5
5.7
4.6
--
*Percents based on yes responses to question 6.
0ar-1C)%ii
cnZ
8C4
(3
5 iiE
l
Nr%
.(-1II
'..?...
r..4
0alc0
v.1\r").-1
ulII
1.5
4.o
5.7
3.o
78.664.o
79.2
77.3
6.6
8.0
5.7
3.0
3.820.0
11.3
4.5
18.2
24.0
13.2
12.1
2.9
8.0
1.9
3.0
9.4
17.8
4.8
20.0
60.6
57.8
66.1
65.9
9.4
6.7
11.3
5.9
15.0
20.0
16.1
3.5
30.0
26.714.5
28.2
3.3
4.4
4.8
1.2

VI-7
Besides reasons for being in favor of a vocational-technical school,
some parents offered suggestions they would like considered when planning
programs. One parent said that instead of going to the regular school
for a half day and the vocational school for a half day, it would be
better to go to one all day for 2 or 3 days a week. This would cut
transportation costs considerably. Another parent suggested that a
retired specialist in the field be hired to teach courses instead of
o o some teacher green out of college with no practical experience. . ."
One disturbing misconception is illustrated by these otherwise
positive and supportive statements. A frequently stated assumption is
that vocational-technical education is for the "slower" students and
that it is remedial for what is perceived as the failures of traditional
education. If the school corporations are to develop rArong and worth-
while vocational-technical programs, the attitudes underlying this assump-
tion need be negated or two things will inevitably happen. The programs
will never receive the regard necessary to truly serve the community and
capable students who could benefit from the programs will refuse to enroll
in them. It appears likely that concurrent with the development of
programs a major concern should be the "education" of the community to
dispel this misconception and to endoctrinate them concerning the nature
and benefits of vocational-technical education for both th recipients
and for the community.
While many parents are in favor of a vocational-technical area
school, there were those parents who opposed the idea. Many of these
parents felt it would be wiser to do a better job with the present system
than to build another school. "I believe the present school facilities
should be more thoroughly developed in that classes could be smaller so
that more individualism could be given the students. Teachers and/or
instructors should be able to give each and every student personal atten-
tion when it is needed. I feel this should be a prerequisite before
planning another educational unit which would be over-populated and
understaffed as are our present school facilities."
Some parents who expressed negative reactions toward the area
vocational-technical school did not draw a distinction between secondary
and post-secondary vocational-technical training. Their comments seem
to indicate that they envision an area school competing with IVY Tech,
"I feel there is a fine technical school just below Terre Haute and
VI-8
another technical school in the area would be a duplication," or with
commercial schools and on-the-job training opportunities, ". . . there
are many schools in the area which are free, small fees charged, and
many on-the-job training opportunities." Whether or not these parents
would support vocational-technical education at the secondary level if
they more completely understood it and that there would be no competition
with existing adult programs is not answerable from this survey.
Even though some parents are against an area school, they offer
suggestions for improving present facilities. One parent feels that a
study should be made of resources to find the areas of greatest need
because ". . a nation cannot continue to spend as we have beyond our
means. ." Another parent suggests, "Perhaps some kind of apprentice-
ship program could be worked out with industry and private business. . ."
One more interested parent commented, "The academic program in schools
should be up-dated& :lake U.S. History--American Studies--World History- -
World Studies. Also offer mini courses; for example, religion, art
history, or the law and the teenagers o.r what the teacher feels would
be relevant to the students. Also with so many teenage pregnancies and
V.D. there Shoull be an elective course in courtship and marriage."
In addition to many comments either for o.r against an area vocational-
technical school, some parents remarked about other areas of the schools'
operations. One parent feels that the present grade level system is
out-dated and needs to be changed. ". . . Being a welfare caseworker,
I see and hear every day the problems of the 'forgotten' student who is
now an adult and feels their life is a failure. The 'chain' isn't
broken because people in society do not care enough about their fellow
man . . . Put the students where they belong regardless of age or grade!"
FroM 25% (Turkey Run) to 46% (Cloverdale) of the fathers and from
3)% (North Montgomery) to 64% (Cloverdale) of the responding mothers
indicated interest in enroll'ng in adult classes to improve their occupa-
tional skills. Some parents did express a concern that adult programs
would not be used to improve occupations skills, "I do not believe in
adult training as most people take this and then use it as a hobby, etc.,
when they are older and need something to fill their time. If it is extra
training for their present job, this is different. Most people now
enrolled in this program never use it to earn a living." Other parents

VI-9
felt that adult education should be offered but only to the extent that it
did not interfere with a program for high school students, "We think the
children should be considered first then maybe we wouldn't have so many
children without work and just bumming around after high school. If
possible then some courses for adults should be offered for I'm sure
there are several of us who could improve our working conditions." In
contrast, other parents feel that adult education is desperately needed.
". . . it would represent the 'helping hand' for many, many . . . people. .
I certainly trust this questionnaire will result in action and not just
the gathering of useless statistics,"
An occasional parent appeared to be endorsing career education tenets
as defined by the U.S. Office of Education, "It would also give the
school drop-out a chance to learn a skill or even someone who has suddenly
been left to make a living for the first time in their 'ife such as a
widow or someone who has become handicapped in some way. I hope this
schooling can become available in our community."1
Twenty-eight areas of interest were identfied as a first or second
cho'ce by eight or more parents (Table VIb).
Adult programs offered in the indicated areas of interest frequently
would find the corporations in direct competition with the adult offer-
ings of IVY Tech and the commercial schools in the area. Nevertheless,
the indicated areas do provide the corporations with a starting point for
planning any contemplated expansion of their adult programs.
1 "Educators must be bent on preparing students either to become properlyand usefully employed immediately upon graduation from high school orto go on to further formal education. The student should be equippedoccupationally, academically, and emotionally to spin off from the systemat whatever point he chooses--whether at age 16 as a craftsman apprenticeor at age 30 as a surgeon, or at age 60 as a newly trained practicalnurse."
S. P. Marland, Jr.

TABLE VIb
Number of Parents Indicating
Interest in Various Adult
Programs* by Corporation
E-,
0z0
E-1
E-1
1:140
0o
14
Accounting or Bookkeeping
12
28
8-=
33
89
15
--
18
10
41
8
Appliance Repair
23
Im--
15
--
Auto and Truck Mechanics
(non-diesel)
--
10
--
--
15
Auto Body Repair and Service
9
Beauty Culture, Barbering
--
16
13
99
8--
10
--
29
9
Business Machine Operation
11
__
10
--
--
9--
Carpentry
--
16
__
8...
__
17
Commercial and Advertising Art
--
._
12
--
-_
Compqter Programming and Operation
--
8__
__
Data Processing or Keypunch
12
--
11
--
--
18
Dental and Medical Technology
_.
__
11
89
__
__
10
Electricity
9--
--
....
__
__
11
Electronics Technology
__
--
M, df
11
Floriculture
9__
_ .
..
A., ..s
1M_
Food Preparation and Service
8__
__
18
Laboratory Technician
810
8__
__
__
16
Licensed Practical Nursing
11
19
21
18
15
12
9--
10
17
933
Office--Typist, Receptionist,
File Clerk
13
26
--
37
--
914
11
14
11
27
Office Management and Supervision
--
--
22
--
9--
__
12
Plumbing and Heating
--
--
--
8
Radio and Teltdsion Repair
--
9__
__
12
Retailing (Store and Sales Occupa-
tions)
--
8--
--
--
--
8
*Only programs noted by eight or more parents are included.
315
2C

TABLE VIb, con't..
Refrigeration and Air
Conditioning
Secretarial or Stenographic
Work
Small Engine Repair
Upholstering
Welding
Woodworking and Cabinetry
OO0U
)
--- _
--
11
12
19
12
12
8
----
--"-
9
811
99
20
--
89
11
23
12
12
--
19
13
89
10
15
--
89
10
8--

VI-12
Ten Clay County citizens responded to the news release (Exhibit XII-N).
Six of those citizens did not have children in the Clay County schools
but all ten respondents indicated there is a need for additional voca-
tional-technical education in the area and nine of the ten endorsed the
area school concept. The tenth respondent indicated that the additional
training should be offered in the home school, "Serious vocational
training should be available the high school for those who are not
academically inclined. High school facilities could be used for adults
and drop-outs at night and on Saturdays:"
Another Clay County citizen attached a letter to the news release
which in part stated, "I find the need for vocational education to be
most acute in the counties where industry does not exist. There are the
people who must exit to the nearest city foi their employment each day.
Let us send them to the cities with a skill. . . . I believe vocational-
technical education -Is imperat've."

VI-13
After Section VI had been printed, an additional 83 completed
"Parents' Questionnaires" were received from Greencastle Junior High
School. BecauSe of the substantial number of parents involved, the
questionnaires were processed and the statistics reflecting the additional
data are reported below as Table VI-c.
TABLE VI-cGREENCASTLE
PARENT QUESTIONNAIRESummary in Percent
Parents of Grade 4 & 8 & 10 Students(N = 164)
Percent of Return - 27.8*
Q 2. Present Occupation? father motherprofessional 11.0 6.7business & sales 15.9 3.7clerical & office 3.0 10.4skilled 26.2 2.4service 6.7 --
agriculture 1.2 --
labor 12.2 12.8housewife -- 50.0other 17.1 8.5
omit 6.7 5.5
Yes No Omit
Q 3. Need more vocational-technical education in area? 87.8 8.5 3.7
Q 4. Need area vocational-technical school? 83.5 10.4 6.1
Q 5. Encourage your child to enroll in area school? 81.7 11.0 7.3
Q 6, FATHER - Interest in adult class? 37.2 38.4 24,4
Q 6, MOTHER - Interest in adult class? 48.8 39.6 11.6
Q 7. Type of program? (percent based on Yes in (6) above)father mother
a. regular day school vocational-technical 3.3 13.8
b. evening vocational-technical 68.9 47.5
c. comprehensive high school program 6.6 8.8d. cooperative school-work program 13.1 18.8
e. 1-6 week vocational-technical day program 14.8 32.5
f. other 4.9
*Based on grades 4, 8, & 10 fall 1972 enrollments.

SECTION VII
TEACHER REACTIONS

VII-2
Seven hundred twenty-five teachers, administrators, and counselors
who are working with students in grades seven through twelve in the
seventeen participating corporations completed the "Teacher's Form"
(Exhibit XII-G). A high level of interest in the topic of vocational-
technical education was indicated within the school community as approxi-
mately 23% of these individuals took time to share their thinking by
offering additional comments.
Table VIIa summarizes the teacher responses to the statements on
the "Teacher's Form" by corporation. As would be expected, there is a
var'ation in the way teachers responded between corporations. The
general pattern of teacher responses, however, tends to remain similar
across corporations.
The overwhelming majority of the responding teachers (from 73% in
Cloverdee to 98% in Warren) agree that most students require assistance
with career planning. An equally impressive majority of the teachers
(ranging from 77% in Southeast Fountain to 97% in South Montgomery)
support the concept that it is as important to provide career training
opportunities during secondary school as it is to provide post-secondary
career training opportunities.
The majority of teachers making additional comments favored having
additional vocational-technical training opportunities available for
students but most expressed the opinion that an expansion of the current
vocational-technical programs would fulfill student needs better than
building, equipping, and staffing an additional school. "Instead of
building more buildings and equipping them, the money could be better
spent by adding to the services already provided by our public schools.
Through a judicious use of both buildings and personnel more and better
training could be provided." Some teachers, especially those working at
the junior high school level, noted that vocational training should begin
in the junior high school and not be confined to the senior high schools.
Although it varied between corporations, some teachers expressed
concern that the vocational areas offered were hampered by out-dated
facilities and were sometimes training students for jobs that no longer
exist. It must be noted, however, that other teachers while critical of
the facilities indicated that the vocational-technical teachers were doing
an excellent job with what they had available.

TABLE VIIa
TEACHER'S FORM
Teacher Responses in Percent
by Corporation
1. Virtually all high school
students need assistance
with career planning.
Agree
Disagree
Neither Agree nor Disagree
Omit
2. Providing high school career
training opportunities is as
essential as providing post-
secondary career training
opportunities.
Agree
Disagree
Neither Agree nor Disagree
Omit
3. I have done my share of the
total job of career training
for our students.
Agree
Disagree
Neither Agree nor Disagree
Omit
0
0 Z
8"Z
co
caz
Mgi
oH
Io
or.4
g
:4
E-1
9,. i
.
R. . . .
N-I-
E4
CU
:)M
M 71) M
cn X u-N
E-I
SII.8
II61
oo
P)
IIII
00
0Z
ZZ
VI Z
En Z
C' Z
ci2 Zu.
C4
W
88.9
85.372.7
87.595.2
90.2
94.3
95.193.5
96.2
93.388.293.8
92.6
91.3
98.o90.6
--
5.9
9.1
4.2
1.2
3.9
1.9
3.3
6.5
--
3.3
2.9
--
1.9
8.7
--
6.3
11.1
8.818.2
8.3
3.6
5.9
3.8
1.6
--
3.9
3.3
8.8
6.3
5.6
--
2.0
3.1
- -- -
83.3
84.390.9
91.795.2
80.490.6
82.o80.6
92.3
76.797.1
87.5
87.o
82.6
85.7
84.4
5.6
7.8
--
4.2
1.2
5.9
9.4
6.6
6.5
3.9
16.7
--
3.1
3.7
8.7
2.0
3.1
11.1
6.9
9.1
--
3.6 u.8
--
11.512.9
3.9
3.3
2.9
9.4
9.3
4.312.212.5
--
1.0
--
4.2
--
2.0
--
--
3.3
--
--
4.3
--
33.3
29. 431.816.7
24.1
31.424.5
32.8
32.323.126.7
23.5
31.3
31.5
39_122.4
25.0
16.7
20. 631.8
45.825.317.6
30.2
29.5
12.9
30.823.3
23.518.8
20.4
34.818.4
12.5
50.0
48. 0
36.4
37.5
50.6
49.o
39.6
32.8
51.6
46.2
46.7
47.1
43.846.326.1
59.2
56.3
--
2. o
--
2.0
5.7
4.9
3.2
--
3.3
5.9
6.3
1.9
--
6.3

Ca
Pm.
0>4
11
M>I
gi
1Z0Hr.1
ZPio
TABLE VIIa, con't.
zcn
E4
81
1§
80
zPa
C1 A
Qz
E-I
e4
zZ
4:4 c00
CN
.IC
D -.1'
r-I0 cn Z
r-I gpl 1-4 \13rzigz(.4n
:AI
-1.>
4 enm
A4. I am aware of the role voca-
c->
,-4
.F-1
cv M cu § co M uN
IA
..o
NR
eilin gi cv
Ni ..a.
tional/technical education
iin,Insn8ngli.CAn
pill
n118n [sin
nn
npgn$n
mu
ctZ tZ UZ c.,Z C)ZetiZ MZ 'r:Z
'r:Z
(74 Z C
I 2 Z C
12a; :4
C1; Z
E4 Z
rl Zcan play in career training.
Agree
77.8 89.2 90.9 70.8 85.5 90.2 84.9 77.0 90.3 92.3 86.7 82.4 93.8
Disagree
11.1
2.9
--
20.8
7.2
--
5.7 13.1
3.2
--
--
8.8
--
Neither Agree nor Disagree
11.1
7.8
9.1
4.2
7.2
9.8
9.4
8.2
6.5
7.7 13.3
8.8 6.3
Omit--
--
--
4.2
--
--
--
1.6
--
--
--
--
--
5. Our total school program is
adequately providing career
training for those not con-
tinuing their education af-
tEr high school.
Agree
16.7
4.9
9.1
4.2 10.8
7.8
9.4 13.1
3.2
--
10.0 11.8 12.5
Disagree
77.8 82.4 63.2 75.0 74.7 51.0 62.3 55.7 71.3 88.5 60.0 67.6 71.9
Ne.ther Agree nor Disagree
5.6 12.7 22.7 20.8 13.3 41.2 24.5 27.9 25.3 11.5 30.0 17.6 15.b
Omit
--
1.2
--
3.8
3.3
2.9
--
6. Our total school program is
adequately providing career
training for those who will
continue their education af-
ter high school.
Agree
38.9 41.2 54.5 66.7 43.4 49.0 52.8 57.4 41.9 53.9 56.7 73.5 65.6
Disagree
38.9 38.2 22.7 12.5 33.7 15.7 22.6 19.7 25.8 34.6 36.7
8.8 12.5
Neither Agree nor Disagree
22.2 19.6 22.7 16.7 22.9 35.3 20.8 21.3 32.3 11.5
6.7 17.6 21.9
Omit
83.3
82.6
81.6
93.8
3.7
4.3
2.0
6.3
9.3
13.016.3
--
3.7
--
. .m,
3.7
--
16.3
3.1
72.2
87.0
61.2
87.5
22.2
13.0
22.4
9.4
1.9
37.0
47.8
44.9
25.0
27.843.5
30.6
46.9
35.2
8.724.528.1

TABLE VIIa, con't.
ril
F-1P4
M.1
Zg1-1
N.E
7. Students are generally aware
Zco
E-I
8N
2-80
Aof the variety of career
choices open to them by the
0 ,-I
,-I
No
1mE-4
/ 2 i 1.4 ,,,rn
8E-4
.p
5,-i
2h. .
pql;r&
ri _.:9\Z
rr
rai
time they graduate from our
/-/
II 1 II 2 II
8 n
cl
nEs3
ii
11).
ii
it
II
8il
rzl
li
II
It
II
II
II
to
ii
4 4 Z u Z
c..)Z c.)Z
c.) Zt Z
I-4 ZZ
Z =
M cnM
viz ci;Z ctiZ
HZ
3Z.1Z
high school.
Agree
16.7 25.5 36.4 62.5 20.5 41.2 34.0 32.8 38.7 42.3 13.3 23.5 28.1
9.3 26.1 30.6 15.6
Disagree
66.7 51.0 45.5 33.3 51.8 35.3 50.9 47.5 32.3 46.2 63.3 44.1 62.5 59.3 60.9 44.9 62.5
Neither Agree nor Disagree
11.1 23.5 18.2 '4.2 27.7 23.5 13.2 18.0 25.8 11.5 23.3 32.4
9.4 29.6 13.0 24.5 21.9
Omit
5.6
--
--
--
--
--
1.9
1.6
3.2
--
--
--
--
1.9
--
--
8. Students g nerally have a
realistic picture of the
training requirements for
the various career choices
open to them by
the time
they graduate from our
high school.
Agree
5.6 15.7 22.7 41.7 13.3 23.5 13.2 23.0 22.6 15.4
3.3 26.5 12.5
5.6 21.7 26.5
9.4
Disagree
77.8 57.8 63.6 41.7 60.2 39.2 62.3 49.2 48.4 65.4 56.7 44.1 68.8 74.1 52.2 51.0 50.0
Neither Agree nor Disagree
16.7 26.5 13.6 16.7 26.5 37.3 24.5 26.2 29.0 19.2 40.0 29.4 18.8 18.5 26.1 22.4 40.6
Omit
9. Students generally hold a
realistic career gall by
the time they graduate
from our high school.
Agree
11.1 13.7 27.3 20.8 10.8 19.6
7.5 14.8 16.1
3.9
3.3
2.9 6.3 14.8 17.4 20.4 18.8
Disagree
77.8 49.0 59.1 33,3 44.6 41.2 60.4 49.2 54.8 50.0 56.7 61.8 65.6 57.4 56.5 46.9 53.1
Neither Agree nor Disagree
11.1 37.3 13.6 45.8 44.6 39.2 32.1 32.8 29.0 46.2 40.0 35.3 28.1 27.8 26.1 32.7
28.1

TABLE Vila, con't.
10. There is value in incorpora-
ting job placement services
as a part%of high school
career training.
Agree
Disagree
Neither Agree nor Disagree
Omit
11. The program offered by our
school which is MOST effec-
tive in preparing students
for the NEXT PHASE of their
lives is:
commercial courses
general courses
guidance services
vocational courses
college preparatory courses
extra-curricular activities
other
omit
multiple response
;N
f--f
Z8
r+-141
E8
HPI
Cm
C:1
E4
HI-4
0E
-1
8c1,24,94E
4§
or,c,;) E
.74) tAE
Wirx4R
8A%
2M.T
E%
134E
-41.4
II21 u8ugu r
u11
8u
El
gu
cn<
4U
Z U
Z U
Z O
Z 0Z
zz ZZ
C4Z
coMZ
rnZ caZ
HZ
3Z 3Z
66.7
76.5
86.4
83.394.0
86.3
84.9
88.5
87.1
92.3
83.3
88.2
87.5
85.2
87.0
83.7
75.0
5.6
6.9
13.6
4.2
1.2
7.8
1.9
3.3
6.5
--
3.3
2.9
3.1
3.7
--
8.2
--
27.815.7
--
12.5
4.8
5.9
13.2
8.2
6.5
7.713.3
8.8
9.4
11.1
13.0
8.2
25.0
- -
11.1
10.818.2
--
7.2
3.9
7.5
9.819.4
3.9
33.3
8.8
6.3
14.8
--
10.2
9.4
11.1
9.8
--
4.2
7.2
2.0
13.2
11.5
--
7.7
--
8.8
6.3
5.6
13.0
4.1
--
--
3.9
4.5
--
1.2
7.811.3
6.6
--
3.1
1.9
4.312.2
9.4
5.6
3.9
13.6
8.3
6.0
9.8
5.7
4.9
3.2
--
10.0
5.9
9.4
5.6
26.1
6.1
--
22.220.6
22.7
37.528.9
29.426.4
13.125.8
46.2
23.3
35.318.8
35.2
21.716.3
18.8
--
1.0
4.5
12.5
1.2
2.0
1.9
3.3
3.2
3.9
--
--
3.7
8.7
2/,'.0
6.3
16.7
1.0
--
--
1.2
2.0
1.9
1.6
3.2
7.7
--
3.1
--
4.3
12.2
3.1
5.6
19.6
4.5
12.5
10.811.8
5.716.4
16.1
3.9
16.7
11.828.1
7.4
8.7
8.2
28.1
27.8
29.4
31.8
25.0
36.1
31.4
26.4
32.8
29.0
26.9
16.7
29.4
25.0
25.913.0
28.6
25.0

VII-7
From 26% (Turkey Run) to 63% (Western Boone) of the teachers elected
to be non-commital concerning whether or not they are doing their share of
the total job of career training for their students. One area of concern
mentioned by several teachers was the lack of motivation on the part of
the students. "Vocational materials are made available but students
often seem apathetic toward acquiring information concerning vocational
opportunities." Although teachers are generally supportive of increased
vocational - technical training at the secondary level, there are those
who note, "You can't teach students everything about everything," or
"Junior and senior high school should provide general background know-
ledge with an emphasis on communication skills and working with people."
Approximately 71% (Covington) to Q4.9g(3outh Putnam and Western Boone)
of the teachers stated they are aware of the role vocational-technical
education can play in career training but from none (Rockville and Turkey
Run) to only 17% (Attica) agree that their school is adequately providing
career training for those students who will not continue their education
after high school. Teacher concern in this area was reflected in their
ir.itten comments which included the observation that both drop-outs and
graduates often leave school without saleable skills. Teacher suggestions
to aid in alleviating the situation through such as departmental clubs
to help students gain career information and utilizing community resources
and work-study programs for skill development were offered. "I believe
that vocational education should definitely correlate with the on-the-job
experiences that the student will encounter. Therefore, cooperation
with the businesses and industries within the school districts is impor-
tant."
The percent of teachers indicating that their school is adequately
providing career training for those students who will be involved in
some form of post-secondary education (25% in Western Boone to 74% in
South Montgomery) is considerably higher than was noted for those students
for whom high school will be ter,inal education. Even for this group,
however, less than half of the teachers in nine of the corporations
could agree that the school was adequately providing career training.
In general, teachers feel students are not aware of the variety of
career choices (32% in North Putnam to 67% in Attica), are not aware of
the training requirements for career choices (39% in Greencastle to

VII-8
78% in Attica), nor do the students hold realistic career pals by the
time they graduate (33% in Covington to 78% in Attica). A need frequently
identified by teachers is more guidance services leading to more realistic
choices made by more students. "'Realistic' is the place where we are
misleading all types of high school students. Especially those at the
top end of the ladder--they don't realize what is essential preparation
for a certain career. The lower level students need vocational training
which will help them feel they are entering a career which will allow
them to make a worthwhile contribution to society." Another teacher
wrote, "I believe each teacher shou7d endeavor to help gu5de students in
career planning and, more than this, help them ?.earn to get along and
be happy in simple everyday living." These teachers, along with many
others appear to be advocating the infusion of the concepts of career
education into the present system (see Section II-Recommendations).
A substantial number of the teachers (67% in Attica to 94% in
Crawfordsville) indicated that there is value in extending the high
school commitment to career training beyond instruction by incorporating
job placement services in such a program.
When asked to identify the facet of the curriculum which is ". . . MOST
effective in preparing students for the NEXT PHASE of their lives. . ."
teachers tended to be non-commital by either not responding to the item
or by indicating more than one area. College preparatory courses was
the most frequently indicated response of the teachers yho did indicate
a single area in sixteen of the seventeen corporations. The exception
to this pattern was Southeast Fountain where the commercial courses were
identified as the most effective offe.r.ng in preparing students for the
next phase of their lives by one-third of the teachers. One teacher
summarizes the feelings of many others by noting, "I feel very strongly
that our school has always stressed academic courses over vocational
ones. . . I fear we are labeling many students as failures simply
because we do not offer or elow them the vocational courses they could
excel in and through which they could see a purpose for their lives."

SECTION VIII
CLASS OF 1965 SURVEY

TABLE VIII-a
CLASS OF 1965 RESPONSES TO MAILINGS
by Corporation
>..
I.9Z 0E
.pq8
M'
. 4u
E8
P4
t4N,,
§.,,
E0
00
00
0N
CO
U] l
3 . 4
Sent -- 1st mailing
76
314
38
82
287
150
Sent -- 2nd mailing
--
172
26
--
95
90
Returned -- not forwardable
760
8--
122
23
No address
215
18
--
Deceased
--
--
31
Not returned
59
128
42
43
165
163
Returned after processing
cut off
--
--
11
2
Usable completed returns as a
PERCENT of graduating class
14.5
38.2
36.8
47.6
31.7
36.0
205
76
70
58
93
39
--
--
85
44
7
--
22
715
--
12
--
163
69
42
35
32
1--
24.4 55.3 34.3 27.6 61.4 44.3 34.2 46.4 50.9 39.8 30.8
88
122
41
181
53
113
107
53
71
23
105
32
62
--
413
915
318
12
--
238
36
20
22
3--
83
126
41
186
55
112
42
11
2

VIII -3
During the study data were obtained from a sampling of parents,
students, teachers, and various other community sources such as Chamber
of Commerce representatives. Another key group from whom it was deemed
desirable to obtain information was past graduates of the participating
school corporations. The class of 1965 was selected for this follow-up
because it was hypothesized that enough time had elapsed since their
graduation to permit these graduates to become established in their adult
lives. The seven years plus duration provided for completion of most
schooling, military service, and the establishment of a marriage. As
will be noted, there were a number of frustrations connected with an
attempt to follow-up a group for many of whom only seven-year-old addresses
were available. The interest on the part of these graduates as testified
to by the high percents of return and the quality of their comments,
however, made the effort an extremely worthwhile one.
The original intent was to correlate graduates' responses with
their rank in the graduating class (see Exhibit XII-a, page 3, item 11).
Only four of the seventeen corporations were able to provide complete
rank-in-class data for the Class of 1965 and, therefore, the data were
not processed in this manner. Also the original procedures called for
an initial mailing (Exhibits XII-k and XII-1) with a follow-up mailing
(Exhibits XII-1 and XII-m) to non-respondents three to four weeks after
the release of the first mailing. This procedure was followed for twelve
of the corporations but the address lists (Exhibit XII-j) from five
districts were received too late to permit the follow-up mailings for
those districts. There was a wide variety in the quality of the address
lists the schools were able to provide. In some cases graduation lists
without updating were provided while in other instances the lists had
been completely updated through telephone contacts, etc. To some extent
the quality of the address lists is reflected in the usable completed
returns received as a percent of the graduating class (Table VIII-a).
The usable completed returns received as a percent of the graduating
class ranged from 15% (Attica) to 61% (Southeast Fountain) with Clover-
dale representing the median at 37%. The 15% response is typical for
this type of mail survey but from the next lowest percent responding
(24%, Lebanon) up represents a surprisingly high rate of return and as
noted above can probably be interpreted as representing an unusual

VIII-4
interest in and concern for education by this group.
With the exceptions* of Clay, Lebanon, and Warren a higher percent
of the respondents were women than were men. The marriage patterns for
this group identify them as generally typical of the general population.
Assuming that the distribution of students enrolled in the vari-"is high
school curricula in 1965 was parallel to the 1972 enrollments (see Sec-
tion V) all strata of the Class of 1965 appear to be represented.
As would be anticipated for the age group represented, a substan-
tially higher percent of the men than the women are engaged in full time
work. The classification system used to categorize the occupations
reported by the Class of 1965 is identical to the one used to classify
parent occupations (see Section XII, page 24). Somewhat surprising for
the age group is the relatively low percent of women who reported their
occupations as full time housewife. Although the locale for present
employment varies considerably in pattern from corporation to corporation
there does appear to be a tendency for more of the men to have settled
farther from their "home"** county than is true for the women.
Over half of the responding males from all seventeen districts
reported being satisfied with their jobs but less than half Jf the
females from ten of the corporations were able to indicate that they were
satisfied with their jobs. The reasons given by men and women for both
satisfaction and dissatisfaction tended to center on lack of or presence
of personal fulfillment and in general were not concerned with dollar
rewards as such; for example, a man who is in a supervisory position
in a major school district writes, "I am a hack in an over burdened
school system." In addition, a frequent source of dissatisfaction for
women is summarized by the 1965 graduate who wrote,
The attributes I need are to be male and to beunethical . . . I am dissatisfied with my posi-tion and the four positions I have held as afemale executive. Women are not going to besatisfied to continue in lower positions withunequal salaries. Even though I have a MastersDegree, I would face a continuing career of
From this point on, all statistics referred to in Section VIII aresummarized in Table VIII-b.
**Home or neighboring County = county in which individual attended highschool or an adjoining county; state = Indiana but other than home orneighboring county; out of state = anyplace in the world except Indiana.
VIII -5
unequal pay for my skills. I have no intention ofliving this way so T have bought a farm from myearnings . and 'o some dpgree (intend to) de-prive the society that educated me of my skillsand become a non-consumer. My education was aseries of lies. If you want to help the youngpeople now entering school, stop the ridiculouslies that make school a prison and rob us of ourcreativity!
Of course for every viewpoint there is an opposing viewpoint as
illustrated by another 1965 graduate who apparently has little interest
in the equality of the sexes as she commented,
Let the women stay at home with the children whoneed them and let the men have the jobs unless thewoman needs to work for the support of the family.There are lots of women working who don't need towork. Maybe we would have better kids. You knowa mother is better than a baby-sitter any day--orshould be. I know there always will be womenworking because we need some of them as some jobsare not for men just as some are not for women.
Less than half of the responding men or women from any of the corpo-
rations indicated that their high school experience prepared them for
the job they are now doing. In fact, in only four groups of males
(Greencastle, Southeast Fountain, Turkey Run, and Western Boone) did
the percent of respondents who indicated secondary school prepared them
for their current jobs exceed forty. Related to this point a number of
the young men and women from the Class of 1965 offered suggestions such as:
The one thing that stands out in my mind that Ifeel any and all job applicants run into is thatmost, if not all, jobs seemed to require exper-ience--whether you de or do not have specialtraining. The employer wants experience but doesn'twant to provide time or on-the-job-training toacquire it_ . . If a person could get actualexperience while taking - - - courses, I feelthis would enable a person to meet the "exper-ience" qualification of any job application.
Since the primary and unique mission of the public school is formal
instruction, it is not surprising that it is the trend for the respondents
to identify academic, commercial, and vocational classes as the most
helpful of their high school experience. What is surprising, however,
is the extremely small percentage of the responding men and women who
identify sports, social activities, and extracurricular activities es
the most helpful aspect of-their high school experience in preparing

VIII-6
them for work. Sports, social activities, and extracurricular activities
presumably receive a great emphasis because of values to the students but
these values are evidentlj not related to job skills in the minds of the
1365 graduates. Indeed, these three areas are frequently noted as being
the least helpful aspect of the high school programs relative to work
preparation. These areas are nct, however, without their proponents as
illustrated by comments vuch as, ". . . therefore the most helpful aspect
of my high school would probably be social activities at this time but
eventually academic classes will be the more. helpful."
An area not infrequently identified as the least helpful aspect of
the school program was the guidance services as typified by notes such
as, "If I had followed the advice of my high school counselors, I would
not have been able to enter undergraduate school," and
Counseling at - - - - - High School was very poor.Both my husband and I were average students withno particular goals in sight. Neither of us wereat any time advised. We therefore wasted very impor-tant time. My husband later decided to attend
University and found it very difficultdue to his lack of background. Sometimes the"average student" might be worth a little time.
Nevertheless, by contrast some individuals could write, ". . . the
staff were concerned with all of us and early in our schooling stimulated
us to think about and plan for our future," and not all students attri-
buted slow or false starts on careers to the school.
I lost two years in high school and four yeais inthe service not just because I didn't know whatI wanted to do but because I had little skill(couldn't get a job so I went in the service) anda background that didn't give me any desire todevelop one.
Substantial percents of the responding groups indicated a continuing
faith in the value of education by indicating (1) that further education
or training would help them improve their skills or get a better posi-
tion, (2) they are now taking part-time classes in both the job-related
and non-job-related categories, (3) they would be interested in a train-
ing program to improve occupational skills, and (4) would be willing to
travel to a school to receive training.
* * * *
*Response of a now practicing lawyer.

VIII-7
I did quit my job when I started my family and Iam still unemployed. Right now I am interestedin part-time classes. I do not intend to workfor awhile, but do want to continue or keep upmy knowledge in businese--offile or secretarialwork.
All forms of post-secondary education are represented in the group
but the trend is for the four-year college or university to be the most
frequently indicated one for the responding groups.
Additional comments endorsing expanded opportunities for vocational-
technical education were frequently offered. For example,
High schools, I feel, have always catered to thecollege prep student when there are a great manymore students who are not interested in attendingcollege. More technical courses should be avail-able because without vocationally trained peopleour society could not function.
and
(after a glowing endorsement of her high schoolexperience) I do, however, feel that the voca-tional opportunities of the school could havebeen better. I'm sure many of the students mighthave profited from such courses.
and
I have been able to observe Florida's educationalsystem for the past three years. Although they,have many overwhelming problems, I have been veryimpressed with their vocational training oppor-tunities at the high school level.
One respondent gave testimony for vocational training and appealed
for that training to be realistic by writing,
This type of trailing helped me realize the impor-tance of finding the type of job I wanted andhelped me to settle down. High school shouldalso give sone indication of the type of lifefactory work presents ro the children will be ableto have a livelihood in mind before graduating.
Some of the graduates offered support for the concept of expanded
vocational-technical programs but expressed concern that ". . the cost
of buildings alone involved in programs of this nature is great. . . I
know there is a shortage of technically trained, but to start successfully
it must begin in the 9-12 high school. . ."

VIII -8
Lest the impression be conveyed that all of the Class of 1965 either
gave wholehearted or qualified endorsement to expanded vocational-tech-
nical education, the foll4wing quotations represent a minority but not
non-existent opinion, "I am not for any tax supported school, academic
or occupational training," and
My opinion will be disregarded but I feel I mustexpress it, I strongly believe that our schoolsystems need to return to the "3Rs" of educa,tion. . . Vntil we learn to do these well, thenwe cannot go on to snore diffictat subjects. I
feel we need to cut out the social activities,sports, extracurricular activities and spend thetime while at school learning the basics.
Finally, additional training often will be useful and helpful but it
is not a panacea 22E se as noted by the mother who conveys a despair as
she writes,
. . Do you think you can help this boy?.Our son and his wife have separated because hecould not find a civilian job paying a good basicsalary. . . His qualifications are A-1 in compu-ter repair. He is always going-to school. Whenhe was home in September, he tried finding a jobbut starting pay was around $600 a month. Hisbasic pa:, (with his wife, before taxes) is over$900. His rank is E-6. If you think you canheln this boy you could write this address. . . .

TABLE VIII-b
CLASS OF 1965 SURVEY SUMMARY
as a PERCENT of RESPONDENTS
by SEX by CORPORATION
2.
Percent of students
3.
single
married
separated
divorced
omit
4.
High school curriculum:
general
college preparatory
vocational
commercial
other
omit
5a.
Employed full time
Employed part time
nocmit
,Place of employment:
home or neighboring
county
state
out of state
omit
)-.
iC
eNv0
ND
1?co
CM
-1II
Cr\
CI
0C
III
II(N
III
I-4 I" Zffi - II
0. 0tr. z
.13 z...Ili z
.4 z. 4
(N. I z
P :-'i' AZ
nZ
IIE
-4II
IIZ
IIZ
-Z
a z .;.M
Au;
c..1 z .;..Z
u.;(2 z
u;fc
u)2
.i0
Q.
. 0. 0
0 - 00
r IC
. ) -N0
W.
- a)
voA
mi>
4gl)
iiiW
R),
1-1Z
0 1-Iig A
I g2 N
PI II'1))
1-10V
IV
.r I
QG
4cliirt
Ooe
0 cd 0C
.) Z fr.
C t-I 0
0g P4
tl ilgE
2 22 0 er:
MF
MF
MF
14
FM
FM
FM
F14
F
45.5
54.5
52.447.642.9
57.1
30.8
69.2
48.9
51.1
44.4
55,6
58.042.0
80.0
--
18.2
15.0
33.3
25.0
--
7.4
35.6
12.8
20.8
16.7
17.2
14.3
20.0
66.7
81.878.3
66.7
75.0
100
92.6
62.2
83.0
79.260.0
72.4
85.7
--
16.7
--
1.7
--
--
--
6.7
--
16.7
--
5.0
--
2.2
2.1
--
16.7
6.9
--
11..EM
- -3.4
--
20.0
66.7
31.8
13.3
50.0
62.5
25.0
33.3
44.4
17.2
16.7
20.044.8
28.6
60.0
33.3
62.1
56.7
33.3
12.5
66.7
51.9
51.1
74.5
58.3
56.7
48.3
57.1
20.0
--
6.1
1.7
--
8.3
--
4.4
--
20.8
10.0
--
9.5
--
28.3
--
25.0
--
14.8
--
4.3
--
13.3
--
4.8
- _16.7
--
4.2
--
6.9
--
80.0
66.7
90.9
48.3
83.3
37.5
91.7
37.073.3
51.1
75.0
50.0
93.1
47.6
--
16.7
1.5
11.7
16.7
18.5
8.9
10.6
8.310.0
--
9.5
20.0
16.7
1.536.7
--
62.5
8.329.6
17.7
36.2
16.7
40.0
6.9
42.9
06 OM
--
6.1
3.3
--
14.8
- _m
e
40.0
16.7
53.0
31.7
8.3
11.1
42.2
27.7
41.7
16.7
62.1
19.0
20.0
33.3
21.2
10.0
50.0
25.0
33.3
14.8
15.6
14.9
20.8
30.0
6.9
19.0
20.0
16.7
18.2
20.0
50.0
--
50.0
29.6
24.4
19.2
20.8
10.0
24.1
19.0
20.0
33.3
7.6
38.3
--
75.0
8.344.4
17.8
36.2
16.7
43.3
6.9
42.9
*One questionnaire was returned but not completed.
45.2 54.8 25.0 75.0
15.8
8.7 16.7 11.1
79.0 87.0 66.7 83.3
16.7
5.6
5.3
36.8
52.6
5.3
--
4.4
26.1
60.9
--
13.0
50.0
33.3
--
22.2
61.1
--
16.7
5.3
--
16.7
--
94.7
43.5
83.338.9
5.3
13.0
16.7
11.1
--
43.5
--
50.0
- _
63.2
17.4
16.7
5.6
15.8
17.4
50.0
22.2
15.8
21.7
33.3
16.7
5.3
43.5
--
55.6

TABLE VIII-b, con't.
2.
Perc.at of students:
3.
single
married
separated
divorced
omit
4.
High school curriculum:
general
college preparatory
vocational
commercial
other
omit
5a.
Employed full time
Employed part time
noomit
5b.Place of employment:
home or neighboring
county
state
out of state
omit
>4ac
CD
0N Z
OZ
Zw
aw
MF
25.0
75.0
35.264.8
48.1
51.9
7.1
92.9
35.3
64.7
40.7
59.3
51.1
48.9
48.5
51.5
50.0
--
15.8
14.3
23.1
10.7
--
23.1
--
12.7
9.1
6.2
17.4
9.1
25.0
5.9
50.0
75.079.0
82.9
73.1
85.7
100
76.9
96.776.4
63.693.8
78.3
86.475.0
94.1
0111O
m.
41.4.6
--
--
16.7
5.3
2.9
3.9
3.6
--
--
3.3
7.3
27.3
--
4.4
--
--
8.3
--
1.8
25.0
25.0
52.6
22.9
46.2
28.6
--
69.2
43.3
38.2
45.543.8
34.8
22.7
50.0
23.5
50.0
41.7
36.840.0
50.0
42.9
100
23.1
36.7
25.5
27.325.0
52.2
31.843.864.7
25.0
--
r.3
5.7
3.9
--
--
3.3
1.8
27.3
6.2
8.7
13.6
6.3
--
--
33.3
co 28.6
--
25.0
--
7.7
6.7
29.1
--
25.0
4.427.3
--
11.8
----
----
--
6.7
1.8
2.9
--
3.6
3.3
1.3
--
4.6
--
- -
75.0
41.7
89.548.6
88.542.9
100
38.5
96.743.6
100
37.5
87.0
40.9
81.3
35.3
25.0
8.3
5.3
11.4
--
3.6
--
23.1
--
7.3
--
12.5
4.3
4.6
12.5
11,8
--
50.0
5.340.0
11.5
53.6
--
38.5
3.347.3
--
50.0
8.7
54.6
6.2
52.9
- _411.1.
.- _.
- _aft
0M. N
WV
OW
.
75.0
33.347.4
20.0
53.9
28.6
100
38.546.723.6
45.5
25.052.2
18.2
56.2
35.3
--
16.7
10.5
14.3
23.1
14.3
--
23.1
33.3
18.2
9.1
12.5
13.0
13.6
18.8
--
25.0
--
31.6
25.7
11.5
7.1
16.7
9.1
45.5
12.5
26.1
13.6
18.8
5.9
--
50.0
10.5
40.0
11.5
50.0
--
38.5
3.3
47.3
--
50.0
8.7
54.6
6,2
58.8
One questionnaire was ieturned but not completed.

TABLE VIII-b, con't.
5c.
Present occupation:
professional
business and sales
clerical and office
skilled
service
agriculture
labor
housewife
other
omit
5d.
Job satisfaction:
satisfied
dissatisfied
neither satisfied nor
dissatisfied
omit
5e.
Did high school prepare
you for job?
yes
noomit
5f.
Most helpful high
school experience:
academic classes
commercial classes
vocational classes
00
>4
N!E
CO
ND
OD
CV
4c
CV
CM
G
114
II0
CV
1-4N
O' 11
ts Z
\ 0 z
4z
z.
z4 gi
zO
'.f? z
II0
zC
l)II
U0 U
ZZ
gZ
s2 z
zz
gZ
sz
-c
zti
C.,
00 -
Z
11 1M
40.0
__
20.0
20.0
20.0
60.0
20,0
20.0
20.0
60.0
20.0
40.0
20.0
--
F
0
M
6-1F
13
SewM
F8gM
F
33.3
:13.821,3
50.0
22.2
16.7
13.6
..7
--
20.0
--
37.5
--
29.6
16.7
25.8
3.3
66.7
--
8.3
3.7
16.7
3.0
--
16.7
--
33.3
--
--
3.0
--
--
16.7
6.7
16.7
--
1.7
16.7
9.1
38.3
--
62.5
8.344.4
66.7
62.1
45.0
66.7
250066.744.4
--
12.1
3.3
--
8.3
3.7
16.7
16.7
11.7
33.3
12.5
16.7
7.4
16.7
9.1
40.0
--
62.5
8.344.4
33.3
25.821.7
16.7
37.5
16.7
22.2
50.060.6
33.3
83.3
--
66.7
29.6
16.7
13.645.0
--
62.5
16.7
48.1
33.3
42.421.7
33.3
12.5
41.7
29.6
--
6.1
18.3
--
25.0
--
7.4
33.3
12.1
1.7
33.3
--
16.7
3.7
N4C
3
11)!i f3
0w
z wri
grqiq
'64w
rF.g
MF
MF
MF
MF
MF
31.1
36.2
20.8
36.7
20.7
28.6
4.4
--
25.0
--
10.4
4.8
--
10.6
--
20.0
--
9.5
26.7
8.5
4.2
6.7
51.7
14.3
6.7
--
20.8
--
6.9
--
2.2
--
8.3
11.1
6.4
4.2
3.3
3.4
--
3.3
17.8
36.2
16.7
30.0
6.942.9
60.0
53.2
75.0
56.7
75.9
52.4
15.6
2.1
--
6.7
6.9
4.8
4.4
6.4
4.2
--
10.4
--
20.0
36.2
20.8
36.7
6.9
42.9
35.6
23.441.7
23.3
13.8
19.0
48.9
36.2
29.2
40.075.9
38.1
15.6
38.3
29.2
36.7
10.4
42.9
33.3
38.3
37.5
33.3
44.8
28.6
8.9
6.4
4.2
3.3
10.4
9.5
13.3
6.4
12.5
13.3
6.9
--
21.1
43.5
50.0
27.8
5.3
--
4.4
--
16.7
--
16.7
--
5.6
21.1
--
16.7'
--
10.5
4,4
16.7
8.7
--
39.1
--
50.0
794
47.866.7
38.9
10.5
5.6
10.5
4.4
33.3
5.6
-- 47.8
--
50.0
31.6
26.1
33.3
22.2
68.4
26.1
66.7
22.2
--
47.8
--
55.6
26.3
21.7
16.7
5.6
5.3
5.6
31.6
--
16.7
--

TABLE VIII-b, con't.
5c.
Present occupations
professional
business and sales
clerical and office
skilled
service
agriculture
labor
housewife
other
omit
5d.
Job satisfactions
satisfied
dissatisfied
neither satisfied nor
dissatisfied
omit
5e.
Did high school prepare
you for job?'
yes
noomit
5f.
Most helpful high
school experiences
academic classes
commercial classes
vocational classes
(.1
ztr
>4
co
Eat.
4-41"4
(1.1Z
Cs)
-4C
eZ
N'clu
z -4 Z(N
100 0,..4H
N A
-Z
-cl)
00
zsic
EU
)- cttli
rm.
0- 0
a) I-Ico)
u711)
AI g
0Ft 23
gC
M4
gvi
rAw
vig
g w2rA
wrA
PIF ?IF PIF MF PIF
MF
MF
25.0 25.0 15.8
25,0
8.3
5.3
- -
£.3
3.3
25.0
8.3 31.6
25.0
- -
--
10.5
- -
26.3
__
41.7
5.3
75.0 33.3 68.4
- -
5.3
25.0 16.7 21.1
50.0
5.3
25.0 16.7 47.4
50.0 25.0 47.4
25.0 58.3
5.3
25.0 16.7 21.1
- -
16.7 15.8
25.0
--
10.5
20.0
26.9
17.9
--
15.4
36.7
20.0
--
25.0
17.4
13.6 12.5
11.8
2.9
3.9
--
7.7
3.3
--
9.1
--
4.4
-- .18.8
--
20.0
--
17.9
23.6
--
25.0
--
22.7
6.2
17.7
11.4
19.2
10.7
--
23.1
40.0
1.8
27.3
--
39.1
4.6 31.311.8
2.9
7.7
--
3.3
--
27.3
--
8.7
--
6.2
5.9
--
11.5
--
100
18.2
--
2.9
19.2
3.6
--
7.7
13.3
1.8
18.2
--
21.7
9.1 18.8
5.9
- -
40.0
11.5
50.0
--
38.5
3.345.5
--
50.0
8.7
50.0
6.2
47.1
48.661.5
53.6
100
53.973.3
38.2
72.7
50.060.9
45.5 62.5
47.1
2.919.2
--
--
6.7
3.6
9.1
--
4.4
--
18.8
--
8.6
7.7
--
7.7
16.7
9.1
18.2
--
26.1
9.1 12.5
--
40.011.5
46.4
--
38.5
3.347.3
--
50.0
8.7
45.5
6.2
52.9
28.626.9
28.6
--
15.433.3
30.9
45.5
25.013.0
13.6 43.823.5
28.6
61.5
17.9
100
38.5
63.3-18.2
54.5
18.865.240.9 50.0
29.4
42.9
11.5
53.6
--
46.2
3.3
49.1
--
56.2
21.7
45.5
6,2
47.1
14.3
23.1
21.4
--
23.1
23.3
10.9
36.4
12.5
39.1
13.6 31.3
17.7
11.4
23.1
17.9
--
15.4
6.7
23.6
--
18.8
13.0
36.4 12.5
11.8
--
23.1
3.6
--
20.0
1.8
18.2
--
4.4
--
12.5
5.9

TABLE VIII-b, con't.
5f.
(continued)
sports
social activities
58.
5h.
trN z
zai
a -
MF
20.0
--
extracurricular activities --
other
omit
Least helpful high
school experience:
academic classes
commercial classes
vocational classes
sports
social ctivities
extracurricu)Ir activities
other
omit
Would further education
help?
yes
noomit
5j.
Now taking part-time
job- ;elated classes?
yes
no
omit
Ole A
ND
OM
AN
DO
le AN
DO
le OM
OM
AN
DSA
M.
1.51.7
8.3--
- -3.0
--16.7
1.5
3.3
--
--
20.0 16.7 33.3 53.3 33.; 62.5 33.3 59.3
_-
50.0
7.6
--
16.7 11.1
20.0
--
12,1
3.3
--
12.5
8.3 11.1
10.6
6.7 16.7
--
41.7
3.7
- -
33.3 22.7 18.3 16.7 12.5
--
11.1
20.0
15.2
6,7 16.7
--
8.3
3.7
40.0
3.0
J.3
--
- -
3.0
1.7
--
20.0 16.7 25.8 60.0 50.0 75.0 25.0 59.3
lb %ID
-Y
6o.o 66.7 60.6 48.3 83.3 12.5 83.3 33.3
- -
16.7 28.8 11.7 16.7 25.0
8.3 18.5
40.0 16.7 10.6 40.0
--
62.5
8.3 48.1
40.0
11.7 16.7
--
16.7
--
60,0 83.3 71,2 50.0 83.3 37.5 75.0 55.6
- -
16.7
9.1 38.3
--
62.5
8.3 44,4
5;-Z
ci
§g;
-qa7
z4d`24
Gt7
A
gA
N
gN
g c2)o
.M
FM
FN3,4
3.4
3,4
27.6
FM
2.2
4.4
--2.2
35.6
2.1
--2,1
42.6
4.2
--
44.7
3.3
3,3
-
43.3
----
9.5
52.4
10.5
5.3
10.5
10.5
13.3
2.1
8,3
10.013.8
4.8
10.5
2.2
4.3
--
3.3
6.9
9.5
5.3
11.1
6.4
16.710.0
17.2
4.8
5.3
13.3
25.5
8.3
20.0
24,1
19.0
36.8
11.1
--
12.5
10.013.8
--
21.1
11.1
8.5
8.3
3.3
--
4,8
5.3
3.4
--
5.3
37.8
51.1
45.843.3
20.7
57.1
10.5
64,4
38.3
66.7
56.7
65.542.9
73.7
15.621.3
16.7
10.0
24.1
14.3
26.3
20.0
38.3
16.7
33.310.442.9
--
31.1
10.6
25.0
16.7
13.823.8
10.5
48.948.9
58.346.779.3
33.3
89.5
20,0
38.316.7
36.7
6.9
42.9
--
F
z
r
MF
--
----
78.3 66.7
0111. AN
DA
ND
Ole
=W
AN
D
5.65.6
5.6
72,2
--
16.7
5.6
--
--
13.o 33.3
13,0
--
4.416.7
--
--
--
69.6 33.3 66.7
5.6
22.2
43.5 66.7 22.2
8.7 33.3 27.8
47.8
--
50.0
4.4 16.7 11.1
52.2 83.3 38.9
43.5
--
50.0

TA
BL
EVIII-b, con't.
NZ
to>
4C
OC
r \Z
to0
N<
C C
h II0
tr%4-4
N0 N
OII
g-
II1-1 0 II
.-.10
tn II-/' Z
EN
RI
AN
Lq
it71-N
z. Z
NZ
0 .-1 ZI=
II71 Z
0 IIE
III
II.
IIP
:1II
1-- ZB
zuroz -
z -i-iz
-I : 4 Z
-Z
-Z
...I-
0E
l(0
P4
V)
2fa
faI-I
." 4)I.,
-QZ
-NW
?-4- W
Z -m
ZI°
-a)
fi, I-4(1) r-f
0 V) r-4
X 4)
ft)0 I-I e
14 ill gz ")
Ii-V
i8-1g
Au)I
PI 741") 71
° "f"r.
I-1 eI=
I-1 EE
n I-1 =2 4r2)4
Cl;gg
tr;i4r14C
9ggC
13 gr14R
grID4
gggN
gr=1).
MF
MF
MF
MF
MF
MF
MF
MF
5f.
(continued)
sports
--
10.5
--
7.7
--
--
3.3
--
18.2
--
4.4
--
social activities
--
--
--
2.9
--
--
--
3.6
--
--
extracurricular activities
--
--
2.9
3.9
3.6
--
--
--
6.2
--
--
6.2
--
other
--
--
9.1
--
--
--
6.2
5.9
omit
50.0 58.3 42.1 68.6 19.2 53.6 100
61.5 46.7 58.2 18.2 62.5 39.1 50.0 31.3 58.8
5g.
Least helpful high
school experience:
academic classes
25.0 16.7
5.3
2.9
3.9
3.6
--
15.4
6.7 14.6 36.4 12.5
8.7
9.1 12.5
5.9
commercial classes
--
8.3
5.3
5.7
7.7
3.6
--
10.0
3.6 18.2
--
13.0
--
6.2
5.9
vocational classes
25.0
--
5.3
8.6
7.7
3.6
--
7.7 10.0
1.8 18.2
6.2
8.7 13.6 12.5
--
sports
--
16.7 21.1 20.0 19.2 21.4
--
15.4
6.7
9.1
9.1 12.5
8.7
9.1 12.5 35.3
social activities
--
21.1
2.9 23.1
3.6
--
10.0
5.5
9.1
--
13.0
--
12.5
--
extracurricular activities
--
--
5.3
2.9
7.7
3.6
--
7.7 13.3
1.8
9.1
6.2 13.0
--
18.8 -
other
--
3.9
1.8
--
6.2
--
--
--
omit
50.0 58.3 36.8 57.1 26.9 60.7 100
53.9 43.3 60.0
--
56.2 34.8 68.2 25.0 52.9
5h.
Would further education
help?
yes
100
33.3 68.4 28.6 57.7 39.3
--
46.2 70.0 36.4 72.7 18.8 82.6 31.8 50.0 29.4
no
--
8.3 21.1 34.3 30.8 10.7 100
15.4 23.3 12.7 27.3 31.3
4.4 31.8 43.8 23.5
omit
58.3 10.5 37.1 11.5 50.0
--
38.5
6.7 49.1
--
50.0 13.0 36.4 6.2 47.1
5j.
Now taking part-time
job-related classes?
yes
50.0 16.7 10.5 11.4 19.2 14.3
--
33.3 12.7 27.3
--
30.4
--
37.5 17.7
no
50.0 25.0 84.2 48.6 69.2 35.7 100
61.5 63.3 40.0 63.6 50.0 60.9 59.1 50.0 35.3
omit
58.3
5.3 40.0 11.5 50.0
--
38.5
3.3 45.5
9.1 50.0
8.7 40.9 12.5 ':7.1

TABLE VIII-b, con't.
,41:4>-4
0."70
,....N
(.....0
.-iC
ON
ON
O 13I1
CO
CV
1-4-.'
Cr \
CV
IIH
CV
III-I '
IIC
A .tII
ON
HII
tr% Z
NO
Zfra O
Z.-4 Z
> -1. Z
P-1 C
V Z
CV
Z=
.-I ZZ
NO
ZII
III-I
IIZ
IIC
O H
E-0
I/II
0 I/E
lII
Zft
Z..
< Z
ft8
zt;
M z -
co z .z .
0 Z -
Z -
il.iC
OC
OC
Ou)
<4
u)Z
CO
CO
< - a)
- a)2
CO
- a)0 - a)
0 - a)0 - a)
0 - a)- a)
- a)0 C
O r-I
CO
--1(13
r-IZ
CO
r-iC
Or-i
Z C
O r-I
Z C
Orl
0 CO
rl=
CO
r-II-I
CH
ni>
4C
Dcd
a) dcor-I
Ar-I
a9A
CO
r-IE
0ci)
= cd
a)M
r-id7)
IA r-I
aa)r-IA
a)0 d a)
-ct = fr.
0 = ix.
0fr.
c..) = fr.
0 = fr..
r....5 Z fr.
N 0
fr.,
zz fr.
Z Z
fr..M
FM
FM
FM
FF
5k.
Taking part-time non-
job-related classes?
yes
40.0
--
no
60.0 83.3
omit
--
16.7
6.
Have you been enr.Aled in
one of the following
since high school gra-
duation?
trade school
--
--
business school
--
four year in-state state
college or university
80.0 16.7
four year in-state private
college or university
in -state junior college
--
four year out-of-state
college or university
--
--
out -of -state junior
college
Indiana Vocational Tech-
nical College
--
private in-state technical
school
private out-of-state
technical school
--
hospital nursing program
--
union apprentice program
--
other
--
33.3
multi--omit
20.0 50.0
MM
FM
FM
15.2
1.7
16.7
--
25.0
--
13.3
8.5
4.2
6.7
6.9
--
10.5
74.2
56.7
83.3
37.5
66.7
55.6
64.4
51.1
75.0
53.3
79.3
57.1
84.2
10.6
41.7
--
62.5
8.344.4
22.2
38.3
20.8
40.0
13.8
42.9
5.3
1.5
6.7
--
--
8.9
8,5
--
10.0
3,4
14.3
5.3
1.5
6.7
--
--
--
3.7
2.2
10.6
--
10.0
6.9
9.510.5
42.4
45.0
16.7
25.0
41.7
25.9
26.7
25.5
29.2
33.3
13.8
38.1
21.1
3.0
--
--
7.4
8.9
6.4
4.2
3.3
3.4
--
5.3
--
--
--5.3
1.5
1.7
--
--
--
8.9
6.4
--
3.3
6.9
9.5
--
--
--
--
8.3
3.7
--
--
4.2
--
--
10.5
3.0
--
--
--
--
--
3.0
--
--
4,4
2.1
--
--
--
1.5
--
--
--
4.2
--
--
--
1.7
--
--
--
7.4
--
2.1
--
3.3
--
9.5
--
1.5
--
16.7
--
--
--
2.2
2.1
4.2
--
--
--
--
6.1
6.7
16.712.5
8.3
3.7
8.9
6.4
8.3
3.3
6.9
--
5.3
34.9
31.6
50.062.5
41.7
48,2
28.9
27.7
45.8
33.3
58.6
19,0
36.8
FM
F
17.4
--
5.6
39.1 100
44.4
43.5
--
50.0
13.0
--
5.6
4.4
--
16.7
34.8 16.7 16,7
4.4
--
--
----
-
4.4
--
. ---
--
--
--
16.7
--
--
16.7
--
8.7
--
--
4.4
--
--
4.4 16.7
5.6
21.7 33.3 55.6

5k.
TABLE. VIII -b, con't.
Taking part-time non-
job-related classes?
yes
noomit
6.
Have you been enrolled in
one of the following
since high school gra-
duation?
trade school
business school
four year in-state state
college or university
four year in-state private
college or university
in-state junior college
four year out-of-state
college or university
out-of-state junior
college
Indiana Vocational Tech-
nical College
private in-state technical
school
private out-of-state
technicAl school
hospital nursing program
union apprentice program
other
multi--Omit
C\1
..-1z
trNH
erlC
4C
\1>
4G
On
ztrN
C)
c-C
\I
//-4C
Ch It
V0
trl..-1
(\ill0 \ 0 .--111
-4- Zl:3 A
N R
Az ,-. z
. H(\.1 Z
0 <-1 Z
Vz
n Ivz
11
Z .
Z0 11
Z14
11
H Z
11
C4 Z
ZH
Prl
11
Z..
1f,0
CO
8z
v4
(0N
Tto
CO
O2
HC
MS
' 'Z
- a)..
a)>
-1- a)
Z - a)
CO
rial r4
0 (Q 1-4
= al r4
CT
.1(11' r4
CO
r-1M
(40) id[4 ui riE
-I w a)
a)al
-a)
alZ
A g
(ill g; w
(aA
i) gr-1 5
ria4-1 5
C4
fr,c/a =
fr.,co
fr.,cra E
rz,C
O =
fr.,e4 =
CM
Stow
r-i 5N
ow0 ._E
la)
A a)
A a)
o _cd w.
al wA
l a)
MF
MF
MF
MF
MF
MF
MF
MF
--
--
--
19.2
13.3
7.3
9.1
--
17.4
--
25.0
11.8
75.0
41.7
94.7
60.0
65.4
50.0
100
61.576.7
45.591.0
50.073.9
59.1
68.841.2
25.0
58.3
5.3
40.015.4
50.0
--
38.510.0
45.5
--
50.0
8.7
40.9
6.2
47.1
--
--
11.4
--
3.6
--
15.4
--
9.1
18.2
12.5
13.0
9.1
6.217.7
--
8.3
--
8.6
3.9
7.1
--
7.7
--
14.6
--
6.2
--
4.6
6.2--
25.0
50.0
21.1
22.9
26.9
28.6100
15.4
33.340.0
27.3
25.017.413.6
25.029.4
25.0
--
--3.9
--7.7
--1.8
--
- _4.6
--
- _5.3
--
7.7
--
--
3.3
--
4.4
--
--
3.9
--
- ---
1.8
9.1
6.2
4.4
--
0:1M
=,
- ---
3.9
--
- _3.3
--- _
--
5.3
--
6.7
--
9.1
--
--
10.5
--
--
3.3
9.1
--
4.4
2.9
4.6
--
3.9
--
--
8.7
--
6.2
--
--
10.5
--
19.2
3.6
--
10.0
1.8
--
21.7
13.6
6.2
--
50.0
41.7
47.4
54.3
26.9
57.1
--
53.9
40.0
29,1
27.3
50.0
26.1
50.0
50.0
52.9

TABLE VIII-b, con't.
7.
Receive a certificate
or degree?
one year
two year
three year
four year
other
multi--omit
8.
Interest in training
program:
yes
noomit
9.
Willing to travel to an
area school?
yes
no
omit
10.
Type of classes pre-
ferred;
reg. vo./tech. day sch.
vo./tech. -- evening
comp. h.s. program
coop. sch.-work program
ehOrt term.(2-6 weeks)
other
multi--omit
N--
4co
cVI-4
-d-u
02II
H tr\
11
4 r.44-iii z
. -.1- zrn
HZ
-0 Z
2 zC
l)A
viE
401
Cg
0c.,
- 0W
AZ
cnr-IC
i.u.; AI
pi gH
0 r0. -I E
AA
ogg
8geogr,
MF
MF
MF
O
4Et
rf
IIl Z
(1)C
.)Z
1-4W
0
EC
-11411
MF
cVO
NZII
ZZ
-0Fq
ri4e,M
F
--
1.5
6.7
16.7
--
16.7
3.7
6.7
8.5
--
6.7
6.9
9.5
--
13.0
33.3
5.6
20.0
16.7
4.6
3.3
16.7
7.4
6.7
6.4
4.2
3.3
13.8
4.8
5.3
4.4
--
11.1
20.0
--
1.5
3.3
--
--
3.7
--
4.3
--
8.7
--
5.6
60.0
16.7
60.6
36.7
16.7
--
66.7
22.2
48.9
40.4
54.2
36.7
34.5
38.1
26.3
34.8
33.3
33.3
--
6.7
10.6
19.0
16.7
5.6
--
66.7
31.8
50.0
50.0
100
16.7
63.0
31.1
27.7
41.7
53.344.8
28.668.4
39.1
16.7
38.9
40.0
66,7
40.9
41.7
33.3
37.5
58.3
33.3
55.6
36.2
16.7
33.3
62.1
23.8
57.9
43.5
16.7
22.2
60.0
16.7
53.0
51.7
50.0
62.5
41.7
66.7
37.8
59.6
66.7
63.3
31.0
76.2
42.1
52.266.7
72.2
--
16.7
6.1
6.7
16.7
--
6.7
2.1
16.7
3.3
6.9
--
4.4
16.7
5.6
40.0
83.3
31.8
36.7
33.3
25.0
50.0
33.3
53.3
25.5
16.7
23.3
37.9
14.347.4
39.1
16.7
22.2
----
19.7
8.3
--
25.0
41.7
3.7
2.2
14.9
12.5
20.0
17.2
9.5
5.3
4.4
--
--
60.0
16.7
48.5
55.0
66.7
50.0
8.363.0
44.4
57.570.8
56.7
44.876.2
47.4
56.5
83.377.8
--
3.0
3.3
--
--
2.2
4.3
3.4
5.6
20.0
33.3
15.2
11.7
16.7
25.0
16.7
14.8
13.3
6.4
4.2
10.0
20.7
4.8
26.3
30.4
1.5
1.7
--
8.3
--
16.7
5.0
16.7
7.4
8.9
4.3
4.8
5.3
--
--
20.0
--
12.1
6.7
--
3.7
6.7
4.3
--
10.0
--
4.8
15.8
8.7
--
11.1
--
33.3
4.6
10.0
16.7
12.5
8.3
7.4
8.9
17.0
8.3
6.717.2
4.8
10.5
5.6
60.0
33,3
63.6
61.7
66.7
62.5
50.0
66.7
60.0
61.7
87.5
73.3
58.6
80.9
42.1
60.)
83.377.8

TABLE VIII-b, con't.
NZ
tin
>4
(&)
("1z
I"N
DN
.-IH
IC
0sr%
..-iN
N!-'..
11W
0% N
Ci
NR
1"
il.-I
NC
r\11
0 0 11c9, A
N Z
0.-IZ
-W' Z
E-4
.-I ZZ
n 7,. zii. z
rr:A
-0 N
nP:1
II1-, Z
0 Z...
Z -
gz. yi
raZ
ZZ
1-:0
00
E4
0Pi
WW
WI
M2
1-, -.44
- 4)z - cc,
>4
- 4)z -
a)
a)
r-I0 C
O o-I
rzi0 (--1
0 W=05 $
P iri0)P
riN
A' g
N:91i
P iii
i :' ri49 -I 0. g
e=4
cr;il
4'48 il a
tr;24:B
g44)
mg rX
4R
2,2)4M
F14
FM
F
7.
Receive a certificate
or degree?
one year
--
--
10.5
8.6
--
14.3
two year
--
16.7
--
--
3.9
3.6
three year
--
--
5.3
2.9
--
--
four year
50.0
--
21.1 22.9 46.2 25.0
other
--
33.3
--
2.9
--
--
multi -omit
50.0 50.0 63.2 62.8 50.0 57.1
8.
Interest in training
program:
yes
25.0 25.0 36.8 31.4 53.9 21.4
no
50.0 58.3 63.2 68.6 46.2 67.9
omit
25.0 16.7
10.7
9.
Willing to travel to an
area school?
yes
--
16.7 26.3 25.7 46.2 21.4
no
--
8.3 26.3
8.6 19.2 14.3
omit
100 75.0 47.4 65,7 34.6 64.3
10.
Type of classes pre-
ferred:
reg. vo./tech. day sch.
--
5.7
--
vo. /tech. -- evening
21.1
8.6 26.9 14.3
comp. h.s. program
coop. sch.-work program
--
8.3
5.3
--
3.9
--
short term (2-6 weeks)
5.3
8.6
7.7
other
--
5.3
--
15.4
7.1
multi--omit
100
91.7 63.1 77.1 46.2 78.6
MF
MV
Al
FM
FM
F
--
15.4
3.3
10.9
45.5
--
13.0
9.1
12.5
5.9
--
--
10.0
9.1
--
--
13.0
9.1
6.2
5.9
--
--
--
1.818.2
6.2
--
--
6.2
--
100
30.8
36.7
23.6
27.3
25.0
30.413.6
37.5
17.7
--
--
6.7
5.5
--
--
8.7
--
--
--
--
53.9
43.3
47.3
9.1
68.8
34.8
68.2
37.570.6
--
23.1
60.0
30.9
36.4
18.843.5
36.450.0
23.4
100
76.9
33.3
65.5
63.6
81.3
56.5
59.1
50.070.6
--
6.7
1.8
--
4.6
--
--
23.1
30.020.0
36.418.8
30.4
31.843.823.5
10.0
10.9
9.1
12.5
13.0
18.2
6.2
29.4
100
76.9
40.067.3
54.568.8
56.5
50.050.0
47.1
--
3.3
---
--
7.7
26.7
5.518.2
6.2
17.4
9.1
18.8
17.7
--
1.8
--
6.2
4.4
4.6
--
--
7.7
--
10.9
9.1
--
4.4
9.1
6.3
11.8
--
7.720.0
7.3
9.1
6.2
8.7
--
6.3
5.9
100
76.9
50.0
72.763.6
81.365.2
77.3
62.464.7
SECTION IX
SCHOOL CORPORATION ENROLLMENTS, DROP-OUTS,AND STUDENTS ENTERING POST-SECONDARY
EDUCATION PROGRAMS

CHART IX a
PARTICIPATING CORPORATIONS' SCHOOLS ENROLLING STUDENTS IN GRADES 9-12
. _ 4._ Pine Village EL & HSWilliamsport EL & HS
._Seeger Memorial JSHS
----Attica HS
Covington Community JSHSFountain Central HS 1---Thorntown School
Lebanon SHST-
-Clinton HS,
Turkey Run HSRockville HS ----
Staunton El & HS
$.1
L
Lebanon JHS.
Granville WellsJoseph F. Tuttle Xiliorth Montgomery HS
.----------Crawfordsville HS
-South Montgomery JA.1S
-- -North Putnam JSHS
('
Greencastle JHS- . - Greencastle SUS
South Putnam HS
Cloverdale HS
Van Buren School
._Brazil JHSBrazil HS
Clay City El & HS

Ô Tab -0july,ore
arno,Slervi
I0-0 S102,
Car b2e00,e
Kromer
No:- are so 0,
ROAD SYSTEM FOR T:-1E E_TcHT -301T:-:Ty A A
P.ne Vdloge Wi
.
Ir Wes* Lebonv,
Aob Pc,
0. 10...oneso,.
"-^Sve t.,e La esre:,,,'
lc' eSsa
2Ee4s
C 2sr41srl
r
Loaror
See2e,Sto,3
Zozveadc
Che.141.7cn-o GreenlUC!
-,SV,o'hrOP
tnaeper.denee
e:rs.dt.!..% .
obrtr
)
v.re28
Nere,:
. . Koloson
7 -...Y. ,;',!s.'s I
...-- -.,,,.,
Ca f ..40 '-'''. Wre2., 1. 21;
. :3: jis, -N .202'2...........,.
'. '-t., i.,'' i
g
-. ...-.
.:. C'''7' '. X....-,,,4"
soa -
Ne.....,,, , 1.117.7" ..1377-7,77 -55c,00^ ---='..,. B.Srne:
) Wes' L.^.:- "). 1...:.'":,^22C' S
' '8. 4 '-''. -1 \',I. . "4 6,30,-,;:',4','
u..._-
4
.34
e
Ner Fcrr,c,...d
La+cien Borers 9. . -:.. 'kcip \Eirrive .:f;1.-,....L.L.\\\ \..-
*Vint74
Co
Cera . Tnerr2.,43
43,fr.1Co, mg.cr
..71C..jo...Sr3r.2.22,e,
St.,1
-.-
Crawfordsville;
1!C.E4rc,, e
421sarCe
1004
V. 1
.
e. .59
6 P
/o.:eSS,..0 -
7-c..4., :., C 13..ige.:^ crC Eos .324' ,A,...."'Ikr,,,,..-6,."" C...c -or 1, Lern _I, ,,,' ,'.- ,
,."'",C,.-... L....., ,....._
. '11'00:d' s'
t
,,,
[.
-3-=.--J 33 4,Eyellp. V.nr'
,..)
:.:I...I.::-I. .--....-0":
!,ve
lc-op e' .
..- eroo...e
`' Greencastle::
rSo;eBrazil.
.4
o...77.'"",PS'1,
rr- O40
0.1
59
7.009
riorrsr;ve I
4 MeCeOn.CM),
he Eli oei4e
olecge,or
%et,eunsr.ch
SIrknvern roucr
Lebanon Gads,
3,3
St.eprerc
2
. VVe,ritc.e
S'er
5 4 3 2 I 0 5 0 IS 20
Scale of Miles

IX-4
Twenty-seven schools in the seventeen participating corporations
enroll students in grades 9, 10, 11, and/or 12. These twenty-seven
schools are located in all sectors of the eight county area (Chart IX-a).
The average daily attendance for all seventeen corporations combined
approaches 35,000 students enrolled in grades 1-12. These numbers are
comparable to the student population found in a large city such as South
Bend. The population base itself then is ample for the development of all
manner of special programs including programs of vocational-technical
education. Unfortunately, from the standpoint of developing educational
programs, the eight-county area over which that school population is
dispersed covers more than three thousand square miles and accounts for
slightly more than nine percent of the state's total area. For all prac-
tical purposes, however, public transportation between schools is non-
existent and the road system (Chart IX-b) interconnecting the various
schools does not encourage the possibility of extensive daily student
migrations involving any but contiguous districts.
Table IX-a through IX-q present historic and current enrollment data
as well as projections of enrollments through the 1977-78 academic year.
The projections are based on the ten-year enrollment history, where
available, with the most recent three years weighted and with adjust-
ments made for birth rates and major industrial or residential develop-
ment where this information is available. It appears that a reduction
of enrollments in some corporations will be balanced by increasing en-
rollments in other corporations so that the net effect will be for a
relatively stable enrollment pattern for the coming five years when all
corporations are combined. Short of a major disaster, it is unlikely
the school populations will dramatically decrease during the 1973 to
1978 period. It is possible, however, that there are a number of "unfore-
seeable" conditions which could materialize and thereby prove these pro-
jections to be conservative. For example, every Chamber of Commerce
representative interviewed by the study director indicated attempts were
being made to attract various industries into the area served by their
local organizations and there is land open for development in all of the
participating school districts. If some of the more zealous of these
efforts are successful and a rajor industry or industries do(es) locate

Grades
As a % of 1967-68
enrollments
School Year
1-8
9-12
1-8
-12
1977-78
753
331
71.2
92.5
1976-77
778
342
73.6
95.5
1975-76
805
353
76.2
98.6
1974-75
833
366
78.8 102.2
1973-74
861
378
81.5 105.6
1972-73
891
382
84.3 106.7
1971-72
924
356
87.4 99.4
1970-71
964
343
91.2
95.8
1969-70
1036
350
98.0
97.8
1968-69
1036
368
98.0 102.8
1967-68
1057
358
1966-67
1965-66
Data
1964-65
Incomplete
1963-64
TABLE IX-a
ATTICA FALL ENROLLMENTS
1967-68 through 1972-73 ACTUALS
1973-74 through 1977-78 PROJECTED
1514
13
12
011
Tit10
~- -
il?
-*--------------'..-------1--"--*-----+-,______._4
0 28 7 6
co
5 4
g-i
..... ,........
0..
........
.
E3
4
t-i 0 /-1
1Z rzl
1!
ii
i1
I1
1i
itI
Al
63-4
64-
5 65
-6 6
6-7
67-8
68-
9 69
-0 7
0-1
71-2
72-
3 73
-4 7
4-5
75-6
76-7 77
Academic Year
grades 1-8
grades 9-12
ACTUAL
PROJECTED
2

TABLE IX-b
CLAY COUNTY FALL ENROLLMENTS
1969
-70
through
1972
-73
ACTUALS for GRADES 1-8
1964
-65
through
1972
-73
ACTUALS for GRADES
?-12
1973
-74
through
1977
-78
PROJECTED
grades 1-8
grades
9-12
Grades
As a
%of
6a-o
64-5
35-
34-'
33-
4.4
enrollments
School Year
1-8
9-12
1-8
9-12
32-
177-
7834
5315
7711
5.1
11-5
731
-19
76-7
734
6015
8011
5.3
115.
830
-19
75-7
634
6715
8311
5,6
116.
129
-19
74-7
519
73-7
434
,25
1580
33'3
216
2111
4.2
112.
711
5.8
118.
829
-927
-ACTUAL
PROJECTED
1)72
-73
3340
1601
111.
311
7.4
26-
1971
-72
3271
1590
109.
011
5.8
25-
1970
-71
3354
1545
111.
811
3.3
24-
196)
-70
3000
1542
113.
023
-1q
68-6
)I-
115
0211
0.1
22.-
1967
-68
1507
110.
521
-11
66-6
714
7810
8.4
20-
1465
-66
Data
1495
109.
619
-1
)64
-65
1364
1963
-64
Incomplete
I17
-16
-A
,
157
4
14-
131
12 111
a) 1
0 9-2
8-o
7--'
6,-(F1
(y)
3-
i-1
2-1
o0
63-4
64-5
651
-6 6
6-7
671-8
681-
?6:
)-o
1'71-2
Academic Year
72-3
1731
471
1i-5
75
6 76
+-7
77-
8

TABLE IX-c
CLOVERDAIE FALL ENROLLMENTS
1963-64 through 1972-73 ACTUALS
1973-74 through 1977-78 PROJECTED
As a % of 1963-64
Grades
enrollments
School Year
1-8
9-12
1-8
9-12
1977-78
929
387
175.9 172.8
1976-77
887
369
168.0 164.7
1975-76
846
348
160.2 155.4
197'4. -75
807
328
152.8 146.4
1173-74
770
317
145.8 141.5
1972-73
735
302
139.2 134.8
1971-72
681
318
129.0 142.0
1970-71
666
277
126.1 123.7
1969-70
639
263
121.0 117.4
1968-69
633
241
119.9 107.6
1967-68
601
241
113.8 107.6
1966-67
584
223
110.6
99.6
15-
1965-66
541
225
102.5 100.4
14-
1964-65
560
224
106.1 100.0
13-
1963-64
528
224
12-
011-
ritl9-
g 8- 7-
grades 1-8
...-grades 9-12
ACTUAL
PROJECTED
..._......o.-... ...1.
,.a.-.''"
a.'
--
63-4
64-
565-6 66-7 67-8 68-9 69-0 70-1 71-2 72-3 73-4 74-5 75-6 76-7 77-8
Academic Year

TABLE IX-d
COVINGTON FALL ENROLLMENTS
1963-64 through 1972-73 ACTUALS
1973-74 through 1977-78 PROJECTED
As a % of 1963-64
Grades
enrollments
School Year
1-8
9-12
1-8
9-12
1977-78
811
392
84.6 103.7
1976-77
820
396
85.5 104.8
1975-76
830
401
86.5 106.1
1974-75
841
406
87.7 107.4
1973-74
851
403
88.7 106.6
1972-73
861
400
89.8 105.8
1971-72
884
369
92.2
97.6
1970-71
912
383
95.1 101.3
1969-70
903
362
94.2 95.8
1968-69
888
369
92.6
97.6
1967-68
886
396
92.4104.8
1966-67
891
364
92.9 96.3
154
1965-66
956
368
99.7
97.4
1/4-
1964 -65
937
404
97.7 106.9
1 .,-
1963-64
959
378
121
m11-
P,11
0w1
8"
07"6-
-55-
N4-
3-+
-012-
to
ACTUAL
-----grades 1-8
grades 9-12
PROJECTED
....
v.
-4.--
4
63-4 64-5 65-6 66-7 67-8 68-9 69-0 70-1 71-2 72-3 73-4 74-5 75-6 76-7 77-8
Academic Year

TABLE IX-e
CRAWFORDSVILLE FALL ENROLLMENTS
1963-64 through 1972-73 ACTUALS
1973-74 through 1977-78 PROJECTED
Grades
As a % of
enrollments
1963-64
School Year
1-8
9-12
1-8
9-12
-1977-78
1736
1094
80.6
101.2
1976-77
1812
1116
84.2
103.2
1975 -76
1892
1123
87.9
103.9
1974-75
1975
1130
91.7
104.5
1973-74
2015
1097
93.6
101.5
1972-73
2056
1065
95.5
98.5
1971-72
2149
1033
99.8
95.6
1970-71
2440
1272
113.3
117.7
1969-70
2395
1269
110.8
117.4
1968-69
2331
1263
108.3
116.8
1967-68
2367
1255
110.0
118.9
1966-67
2318
1314
107.7
121.6
1965-66
2368
1171
110.0
108.3
1964-65
2289
1155
106.3
106.8
1963-64
2153
1081
North Montgomery and Southmont
opened in 1971-72.
25
24
2322
21
20
1918
17
16
1514 13 12
CD
11
E I
. 0,c
59 8 7 6 5 3 2 1 0
Fr
grades 1-8
.. ....
grades 9-12
ACTUAL
PROJECTED
63-4
64-
5 65
-6 6
6-7
67-8
68-9 69-0 70-1 71-2 72-3 73-4 74-5 75-6 76-7 77-8
Academic Year

School Year
1977-78
1976-77
1975-76
1974-75
1973-74
1972-73
1971-72
1970-71
1969-70
1968-69
1967-68
1966-67
1965-66
1964-65
1963-64
Grades
1-8
9-12
1455
1462
1469
1477
1484
1492
1552
1625
1660
1691
1724
1675
1639
1565
1560
749
753
757
761
765
769
711
716
780
747
736
716
695
687
667
TABLE IX-f
GREENCASTLE FALL ENROLLMENTS
1963-64 through 1972-73 ACTUALS
1973-74 through 1977-78 PROJECTED
As a % of 1963-64
enrollments
1-8
9-12
93.3 112.3
93.7 112.9
94.2 113.5
94.7 114.1
95.1 114.7
95.6 115.3
99.5 106.6
104.2 107.3
106.4 116.9
108.4 112.0
110.5 110.3
107.4 107.3
105.1 104.2
100.3 103.0
201
19,
18-
17-
16-
15-
14-
13
12
11-1 1
,T1104
921 a) f-4
f-4 0 f-1
ET
I
8 7 6-.
s-I
4-1
3-1
24 1-,
0
grades 1-8
grades 9-12
ACTUAL
a.3.
PROJECTED
63-4 61-5 65-6 66 -7 67-8 684 69-0 70-1 71 -2 72-3 73-4 74-5 75-6 76-7 77-8
Academic Year

Grades
As a % of
enrollments
1963-64
School Year
1-8
9-12
1-8
9-12
1977-78
1898
862
83.9
90.0
1976-77
1486
902
87.8
94.2
1975-76
2077
944
91.9
98.5
1)74-75
2172
987
96.1
103.0
1973-74
2272
984
100.5
102.7
1972-73
2377
981
105.1
102.4
1971-72
2487
1052
110.0
109.8
1970-71
2600
1015
115.0
105.9
196?-70
2527
1017
111.8
106.2
1968-69
2333
188
103.2
103.1
1967 -68
2275
951
100.6
?9.3
1966-67
2260
959
100.0
100.1
1965-66
2347
987
103.8
103.0
1964-65
2271
1G12
100.4
105.6
1963-64
2261
958
TABLE IX-g
LEBANON FALL ENROLLMENTS
1963-64 through 1972-73 ACTUALS
1973-74 through 1(77 -78 PROJECTED
grades 1-8
grades 9-12
271
ACTUAL
PROJECTED
26
--------.'"\
1
25
24-
/1
_______---.--
21-
-_,_,,,....,......,_,,,.....,,,
23-
.----.
.......,....______-.
22
20
119
18
11716
15-
14-
13-,
g 8- 7_6
-I-)
5g 4
E3
02
01
C71
063-4 64-5 65-6 66-7 67-8 68-9 691-0 70-1 71-2 72-3 73-4 74-5 75-6 76-7 77-8
Academic Year

to
TABLE IX-h
NORTH MONTGOMERY FALL ENROLLMENTS
1963-64 through 1972-73 ACTUALS
1973-74 through 1977-78 PROJECTED
As a % of 1963-64
Grades
enrollments
School Year
1-8
9-12
1-8
9-12
1977-78
1816
821
110.5 175.4
1976-77
1806
817
107.9 174.6
1975-76
1776
812
109.3 173.5
1974-75
1787
807
108.7 172.4
grades 1-8
1973-74
1777
803
108.1 171.6
grades 9-12
1972-73
1767
799
107.5 170.7
1971-72
1837
818
111.7 174.8
1970-71
1779
547
108.2 116.9
201
1969-70
1729
561
105.2 11 o.9
19
1968-69
1738
534
105.7 114.1
18,
1967-63
1728
497
105.1 106.2
17-i
1966-67
1630
495
99.2 105.8
16-
1965 -66
1604
498
97.6 106.4
151
1964-65
1614
481
98.2 102.8
14-
1963-64
1644
468
13-
12-
11-
41 0-, ?- 8- 7- 6-
+,
45-
g ,93-
2-
P I-
r=3
0t
63-4 64-5 65-6 66-7 67-8 68-9 69-0 70-1 71-2 72-3 73-4 74-5 75-6 76-7 ?7-8
Academic Year
ACTUAL
PROJECTED

TA
BL
E I
X-i
NO
RT
H P
UT
NA
M F
AL
L E
NR
OL
LM
EN
TS
1963
-64
through
1972
-73
AC
TU
A L
S19
73-7
4through
1977
-78
PRO
JEC
TE
D
As a
of 1963-64
Grades
enrollments
School Year
1-8
9-12
1-8
9-12
1977-78
1256
626
126.2
170.1
1976-77
1232
614
123.8
166.8
1r)75-76
1208
602
121.4
163.6
1974-75
1185
590
119.1
160.3
1773
-74.
1162
561
116.8152.4
1172-73
1139
533
114.5
144.8
1971-72
1142
508
114.8
138.0
1970-71
1125
475
113.1
129.1
14)9-70
1082
449
108.7
122.0
1968-69
1081
432
108.6
117.4
1967-68
1034
422
103.9
114.7
1966-67
964
416
96.9
113.0
1965-66
974
411
97.9
111.7
1964-65
1027
401
103.2
100.0
1963-64
995
368
15
14
13
12
m11
izus
l
S4 9
.0 7
5, 6
4.,5
a, E3
.8 2
ti 1
171
0
AC
TU
AL
grades 1-8
grades Q-12
1
PRO
JEC
TE
D
63-4 64-5 65-6 66-7 67-8 68-9 69-0 70-1 71-2 72-3 73-4 74-5 75-6 76-7 77-8
Academic Year

TABLE'IX-j
ROCKVILLE FALL ENROLLMENTS
1963-64 through 1972-73 ACTUALS
1973-74 through 1977-78 PROJECTED
As a I of 1963-64
Grades
enrollments
School Year
1-8
9-12
1-8
9-12
1(477-78
692
370
100.3
111.1
1976-77
644
371
100.6
111.4
1975-76
6g6
372
100.9
111.7
174-75
698
372
101.2
111.7
1373-74
693
367
101.3
110.2
1972-73
701
361
101.6
108.4
1971-72
692
359
100.3
107.8
1970-71
722
358
104.6
107.5
1969-7o
736
345
106.7
103.6
1968-6Q
710
314
102.
34.3
1967-68
679
299
48.4
84.8
1966-67
672
300
97.4
90.1
ig65-66
684
3p
g9.1
101.8
1964-65
688
33o
gg.7
:719.1
1963 -64
690
333
154
14-
13-
121
(011,
1°-
45 91
8-
0 6,
435" 4-
4G
3.
E 3
-r+
2-
o $4
1-
ACTUAL
grades 1-8
grades 9-12
PROJECTED
;
rx1
0
63-4 64-5 65 -6 66-7 67-8 68-) 691-0 70-1 71-2 72-3 73-4 74-5 75-6 76-7 77-8
Academic Year

TABLE IX-k
SOUTHEAST FOUNTAIN FALL ENROLLMENTS
School Year
Grades
1-8
9-12
1,?63-64
1973-74
As a % of 1963-64
through 1972-73 AC1UALS
through 1';77-78 PROJECTED
enrollments
1-8
9-12
1977-78
1240
556
106.0 111,2
1176-77
1243
553
106.2 110.6
1975-76
1246
549
106.5 100.8
1974-75
1248
546
106.7 109.2
1973-74
1240
542
106.0 108.4
1972-73
1232
539
105.3 107.8
1971-72
1218
540
104.1 109.8
1,370-71
1238
543
105.8 108.6
1969-70
1232
531
105.3 106.2
grades 1-8
1968-60
1367-68
1230
1238
526
504
105.1 105.2
105.8 100.8
grades 9-12
1Q66-67
1227
510
104.9 102.0
ACTUAL
PROJECTED
1965-66
1180
517
100.9 103.4
15-
1964-65
1177
487
100.6
97.4
14-
1963 -64
1170
500
13-
12
w11
1
......
...,..... ....
w 5A
.. .. .
..
..
4
21
°11
ozo +
I1
1I
I1
1
1
1t
11
63-4 64-5 65-6 66-7 67-8 68-9 63-0 70-1 71-2 72-3 73-4 74-5 75-6 76-7 77-8
Academic Year
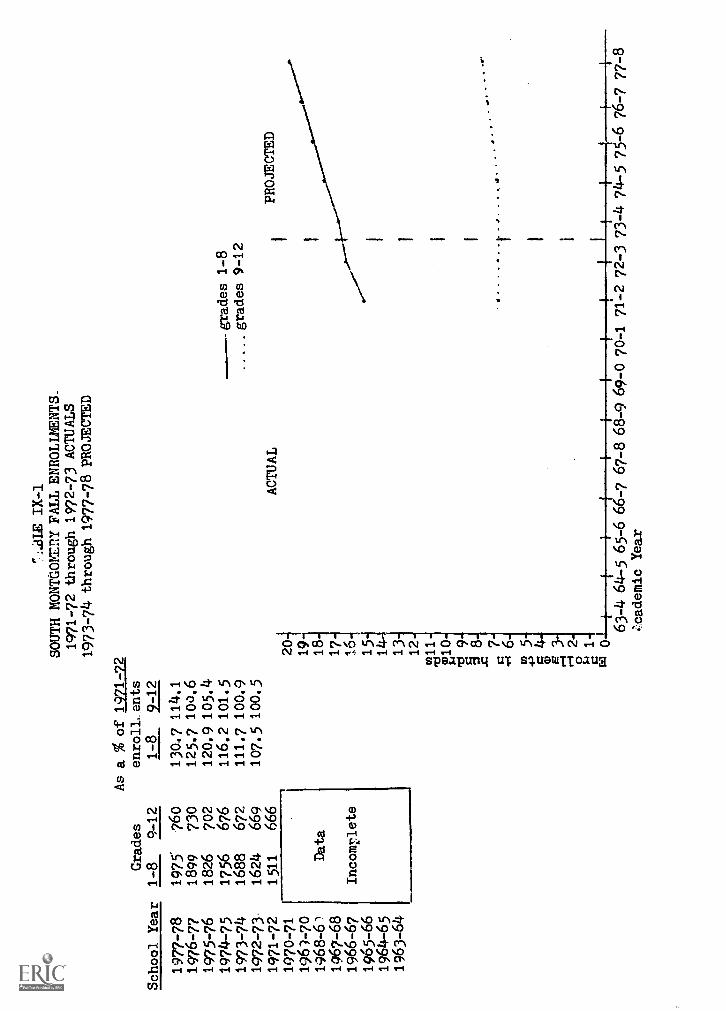
School Year
1977-78
1976-77
1975-76
1974-75
1973-74
1972-73.
1971-72
1970-71
1963-70
1968-61
1967-68
1966-67
1965-66
1964-65
1963-64
17:ALE IX-1
SOUTH MONTGOMERY FALL ENROLLMENTS..
1971-72 through 1972-73 ACTUALS
1973-74 through 1977-78 PROJECTED
Grades
1-8
9-12
As a % of 1971-72
enroll,:ents
1-8
9-12
1975
760
130.7 114.1
1899
730
125.7 100.6
1826
702
120.9 105.4
1756
676
116.2 101.5
grades 1-8
1688
672
111.7 100.9
grades 9-12
1624
669
107.5 100.5
1511
666
ACTUAL
PROJECTED
Data
Incomrlete
20-
19-\
18-
17-
16-
14
13-
12-
m11-
,c1 W10..
rt7 _I
8-
.
7"
.
.
6-1
m 5-
c I-9
3-
,7,1 2-
g1
rx10
iII
I
63-4 64-5 65-6 66-7 67-8 68-9 69-0 70-1 71-2 72-3 73-4 74-5 75-6 76-7 77-8
.'cademic Year

Scho
ol Y
ear
1977
-78
1976
-77
1975
-76
1971
4-75
1973
-74
1972
-73
1971
-72
1970
-71
1969
-70
1968
-69
1967
-68
1966
-67
1965
-66
1964
-65
1963
-64
Grades
1-8
9-12
8914
1470
893
1467
892
146/
4
891
1461
891
/458
890
1455
921
429
911
369
943
367
907
362
950
368
833
361
969
358
9614
358
As
a %
of
1961
enrollments
1-8
9-12
92.7
131
.392
.6 1
30.4
92.5
129
.692
.4 1
28.8
92.1
4 12
7.9
92.3
127
.195
.5 1
19,8
94.5
103
.197
.8 1
02.5
914.
1 10
1.1
98.5
102
.886
.4 1
00.8
100.
5 10
0.0
TA
BL
E I
X-m
SOUTH TAJTNAM FALL ENROLLMENTS
1961
4-65
through
1972
-73
ACTUALS
1973
-714
through
1977
-78
PRO
JEC
TE
D
15 14 07
96 to S3 71 2
0 1.4
1
grades
1-8
grades 9-12
ACTUAL
......
..
a..
PRO
JEC
TE
D
.....
.....
.....
..
..4
.
63-4
64
-5 6
5-6
66-7
67-
8 68
-9 6
9-0
70-1
71L
2 72
-3 7
3-4
74 -
5 75
-6 7
6-7
77-8
Academic Year

TABLE IX-n
SOUTH VERMILLION FALL ENROLLMENTS
1963-64 through 1972-73 ACTUALS
1973-74 through 1977-78 PROJECTED
As a % of 1963-64
Grades
enrollments
School Year
1-8
9-12
1-8
9-12
1977-78
1622
730
108.4
91.7
1976-77
1618
728
108.2
91.5
1975-76
1614
726
107.9
91.2
1974-75
1610
725
107.6
91.1
1973-74
1606
723
107.4
90.8
1972-73
1602
721
107.1
90.6
1971-72
1642
683
109.8
85.8
1970-71
1615
665
108.0
83.5
1969-70
1601
658
107.0
82.7
1968-69
1589
678
106.2
85.2
1967-68
1559
708
104.2
88.9
1966-67
1501
754
100.3
94.7
1965-66
1469
738
98.2
92.7
1964-65
1452
773
97.1
97.1
1963-64
1496
796
20
1918
17
16
15
1 13
12
to 11
410
ACTUAL
grades 1-8
grades 9-12
IPROJECTED
I9
.7
-+ 6 5
63-4 64-5 65-6 66-7 67-8 68-9 69-0 70-1 71-2 72-3 73-4 74-5 75-6 76 -7 77-8
Academic Year

Grades
School Year
1-8
9-12.
1977-78
542
277
1976-77
550
281
1975-76
558
285
1974-75
567
289
1973-74
293
1972-73
297
1971-72
291
1970-71
304
1969-70
310
1968-69
287
1967-68
283
1966-67
235
1965-66
1964-65
1963-64
As a % of 196
enrollment
1-8
9-1
TABLE IX-o
TURKEY RUN FALL ENROLLMENTS
1963-64 through 1972-73 ACTUALS
1973-74 through 1977-78 PROJECTED
3-64
2
83.8 101.8
85.0 103.3
86.2 104.8
87.6 106.3
575
88.9 107.7
584
90.3 109.2
627
96.9 107.0
663
102.5 111.8
615
95.1 114.0
649
100.3 105.5
638
98.6 104.0
660
102.0
86.4
614
251
94.9 92.3
.15
642
262
99.2 96.3
1
647
272
1312
0) 1
1 10 8
.9
6
tO5
a)3
4-1 0r4
2
F-1 a0
ACTUAL
grades 1-8
grades 9-12
PROJECTED
1f
I
63-4 64-5 65-6 66-7 67-8 68-9 69-0 70-1 71-2 72-3 73-4 74-5 75-6 76-7
77-i8
Academic Year

Gra
des
As
a %
of
1963
-64
enro
llmen
tsSc
hool
Yea
r1-
89-
121-
89-
12
1977
-78
1249
524
99.4
96.9
1976
-77
1259
528
100.2
97.6
1975
-76
1269
532
101.
098
.319
74-7
512
7953
610
1.8
99.1
1973
-74
1289
536
102.
69)
.119
72-7
31299
535
103.
498
.919
71-7
213
5951
210
8.2
94.6
1970
-71
1398
503
111.
393
.01969-70
1362
525
108.
497
. 01968-69
1342
533
106.
898
.51967-68
1348
531
107.
398
.21966-67
1364
541
108.
610
0.0
1965-66
1309
549
104.
210
1.5
1964
-65
1278
551
101.
810
1.8
1963-64
1256
541
TA
BL
E I
X-p
WA
RR
EN
CO
UN
TY
FA
LL
EN
RO
LL
ME
NT
S19
63-6
4 th
roug
h 19
72-7
3 A
CT
UA
LS
1973
-74
thrO
ugh
1977
-78
PRO
JEC
TE
D
15-
14
13-
12-
w10 g:c
7- 6- 5-
g4-
e3-
F-1
2-o
1
rzl 0
63I
f
464
I5
65-6
66-
7A
cade
mic
Yea
r
grad
es 1
-8gr
ades
9-1
2
AC
TU
AL
i1
67-8 68-9
a-.
a. I
69-I0
70-1
71
PRO
JEC
TE
D
..r
.
III
II
-2 7
2-3
73-4
74-
5 75
-6 7
6-7
77-8

Grades
TABLE IX-q
WESTERN BOONE FALL ENROLLMENTS
1964-65 through 1972-73 ACTUALS
1973-74 through 1977-78 PROJECTED
As a % of 1964-65
enrollments
School Year
1-8
9-12
1-8
9-12
1977-78
1414
691
96.5
113.5
1976-77
1445
706
98.6
115.9
1975-76
1478
722
100.8
118.6
1974-75
1510
717
103.0
117.7
1973-74
1543
701
105.3
115.1
1972-73
1533
685
104.6
112.5
1971-72
1565
638
106.8104.8
1970-71
1514
620
103.3
101.8
1969-70
1536
681
104.8
111.8
1968-69
1586
641
108.2105.3
1967-68
1646
626
112.3
102.8
1966-67
1512
619
103.1
101.6
1965-66
1552
627
105.9
103.0
1964-65
1466
609
1963-64
F-- Data
Incomplete
20
1918
17 16 15 1 13 12
011
X10
;I 9
.g 8 7
E 0
6 5 3 2 1 0
grades 1-8
grades 9-12
ACTUAL
..
.
..
PROJECTED
.. .
..
63-4
64-5 65-6 66-7 67-8 68-9 69-0 70-1 71-2 72-3 73-4 74-5 75-6 76-7 77-8
Academic Year

IX-22
in one or more of these communities it could inflate the projected
enrollments. The effect such new industries would have on enrollments,
hwrmer, could range from slight to great depending on the size of the
industry and whether it draws its employees from the considerable pool
of unemployed in an area such as Clay County, from high school drop-outs
and graduates entering the labor pool for the first time, from a commuting
group drawn outside of the communities, or from a labor pool from
outside of the area and imported into the community by the employer.
It is the last alternative which would have the greatest impact on school
enrollments,
Another factor which could have a major impact on school enrollments
is the fact that the areas served by the seventeen school corporations
could easily become bedroom communities for one of four major metropo-
litan areas, Lafayette, Indianapolis, Terre Haute, and Danville (Illinois).
Since land closer to these metropolitan areas is becoming scarcer and
therefore more expensive, if there is a development and improvement of
the seconda,:y road system serving the area and/or as land costs become
such that it is more profitable to subdivide land for housing which is
currently committed to cultivation than it is to farm it, dramatic
increases fn school populations could be anticipated without concurrent
dramatic increases in the tax base. Three of the communities involved
in this study are already in the initial stages of being affected by
this phenomenon, South Montgomery's Lake Holiday tract is inflating
their enrollments (Table IX-l) and Cloverdale's Stardust Hills develop-
ment is providing this corporation with the steepest growth curve of
any of U-13 r:_rticipating corporations (Table IX -c). Although the
growth prediction for the Lebanon schools (Table IX-g) varies in nature
from that for Cloverdale and South Montgomery, it may well be the least
accurate of the seventeen predictions because of the following circum-
stances. Since June, 1972, the City of Lebanon has annexed 800 acres,
500 of which are zoned residential and has plotted 523 lots, 112 of
which are "earmarko3" for mobile homes. In addition, 101 new single-
family housing units were sold in 1972 with the school corporation pre-
dicting another 625 such units to be built and sold during the next
five tears.
Prior to the 1971-72 academic year a portion of the secondary students

IX-23
from the North Montgomery (Table IX-h) and the South Montgomery (Table IX-1)
school corporations were accommodated by the Crawfordsville Community
Schools (Table IX-e). The North Montgomery and South Montgomery units
both opened their new secondary facilities for the 1971-72 school year
which is reflected on the tables through an increase in their enroll-
ments and a decrease in the Crawfordsville enrollments for that school
year.
Several of the corporations were unable to provide enrollment data
for the ten-year period as requested. This means that those projections
which are made on an incomplete data base should be interpreted with
caution.
Secondary school students who drop out before graduation have been
and are of concern to the professional educator. Drop-out data for the
participating corporations were obtained by the schools completing one
of two forms; one requested detailed information (Exhibit XII-Da) and
the other required summary data only (Exhibit XII-Db). The available
drop-out data for each district is summarized in Tables IX-r and IX-s.
Six of the corporations were unable to provide complete data for the
entire five year span and six districts were able to provide just
summary data but only five districts were able to provide the detailed.-
information required to complete Exhibit XII-Da.
The drop7out rates for the five year span from 1967-68 through
1971-72 in those eleven districts who provided complete information for
grades 9-12 combined ranged from a low of 2.5% (Greencastle) to a high
of 5.9% (South Vermillion). Drop-out rates, however, should be considered
as providing an index of only one type of school drop-out. In addition
to the physical drop-out, each school corporation has an undetermined num-
ber of young men and women in attendance who have dropped-out psycholo-
gically and who are merely putting in time, in nature not dissimilar to
a convict serving a sentence, until they are "released." A review of
the information concerning reasons for dropping out provided by the
five corporations who furnished the detailed information seems to indi-
cate that increased vocational-technical opportunities per se would not
have much impact by way of any significant reduction in the drop-out
rates. The most frequently noted reasons for female drop-outs, for
example, are either pregnancy and/or marriage -- areas where vocational-

TABLE IX-rMEAN HIGH SCHOOL DROP-OUTS
AS A PERCENT OF FALL ENROLLMENTSfor 1967-68 through 1971-72
by Grade and for Grades 9-12 Combinedby Corporation
Grades 9-12Corporation Grade Grade 10 Grade 11 Grade 12 Combined
ATTICA 2.2 3.4 6.2 3.1 3.6
CLAY * * * * *
CLOVERDALE 2,1 2.7 5.8 6.4 4.1
COVINGTON 3.0 3.9 3.7 3.8 3.6
CRAWFORDSVILLE 2.2 5.8 7.1 4.4 4.8
GREENCASTLE 0.8 3.1 2.7 3.6 2.5
LEBANON 4.0 7.3 5.9 5.0 5.6
NORTH MONTGOMERY * * * * *
NORTH PUTNAM * * * * *
ROCKVILLE 1.8 6.6 7.2 3.2 4.6
SOUTHEAST FOUNTAIN 1.9 2.6 3.6 3.6 2.9
SOUTH MONTGOMERY * * * * *
SOUTH PUTNAM * * * *
SOUTH VERMILLION 5,7 8.4 6.9 2.4 5.9
TURKEY RUN 2.3 3.6 3.0 2.1 2.8
WARREN 2.1 3.2 5.6 3.3 3.5
ASTERN BOONE * * * * *
*Data incomplete,

TABLE IX-s
HIGH SCHOOL DROP-OUTS as a PERCENT of FALL ENROLLMENTS
GRADE 9
by Grade by Year by Corporation
GRADE 10
GRADE 11
GRADE 12
67-
68-
69-
7o-
71-
67-
68-
69-
7o-
71-
67-
68-
69-
70-
71-
67-
68-
69-
7o-
71-
Corporation
68
69
70
71
72
68
69
70
71
72
68
69
70
71
72
68
69
7o
71
72
ATTICA
1.2
--
2.9
5.7
0.9
4.9
2.7
1.4
3.2
4.2
6.1
8.o
8.5
4.5
3.6
6.o
4.2
2.2
1.3
1.6
CLAY
4.4
3.3
3.2
3.7
4.6
5.4
3.1
1.3
4.o
1.9
4.o
3.1
*2.0
1.9
2.2
2.3
CLOVERDALE
1.2
1.6
2.7
3.9
5.6
1.7
2.4
3.3
1.3
5.9
3.9
3.1
3.812.5
3.3
10.0
1.9
8.1
8.1
COVINGTON
2.0
3.1
1.1
2.7
6.5
3.1
3.1
3.2
2.2
7.6
6.9
4.5
1.1
1.1
4.7
3.1
7.4
--
1.1
7.0
CRAWFORDSVILLE
2.9
0.9
1.8
2.9
2.5
5.3
6.7
3.7
7.6
5.9
6.4
9.o
6.3
6.2
7.8
4.6
5.1
5.6
3.6
2.9
GREENCASTLE
1.0
0.5
--
1.7
1-0
3.1
1.0
2.1
5.1
4.2
3.4
3.9
2.0
2.3
2.2
6.0
3.6
5.2
1.8
1.2
LEBANON
3.1
3.7
4.0
6.2
3.2
5.7
7.4
5.5
8.3
9.4
5.8
6.9
6.2
6.4
4.2
9.3
6.o
1.4
2.6
6.1
NORTH MONTGOMERY
NORTH PUTNAM
* ** *
*
1.7
*
2.3
1.6
3.7
* *
* *
*
1.7
*
3.3
1.6
4.o
* *
* *
*
5.6
*
1.8
3.4
1.7
* *
* *
*
6.4
*
2.B
2.3
2.9
ROCKVILLE
3.7
--
3.1
1.0
1.2
5.9
2.5
3.111.8
3.2
7.1
1.5
10.2
12.5
3.3
4.7
4.1
4.6
2.5
1.1
SOUTHEAST FOUNTAIN
0.8
2.8
3.2
2.1
0.7
2.2
3.9
2.3
2.0
2.8
3.8
3.1
4.7
0.8
5.5
2.8
5.6
5.8
--
4.0
SOUTH MONTGOMERY
**
**
2.7
**
**
4.3
**
**
3.3
**
**
4.1
SOUTH PUTNAM
**
2.0
4.0
2.2
**
7.1
5.4
2.0
9.1
*7.0
3.3
6.5
6.7
*2.4
3.5
3.4
SOUTH VERMILLION
5.3
7.0
8.4
4.3
4.o
7.2
15.9
4.5
8.2
7.3
7.0
8.3
9.3
4.2
6.2
1.6
2.4
4.o
0.8
3.4
TURKEY RUN
2.2
1.3
1.3
3.0
4.1
1.5
5.6
3.7
4.8
1.5
5.7
--
4.6
4.2
--
--
1.6
4.8
2.4
1.4
WARREN
0.7
1.4
3.0
2.0
3.2
3.8
1.4
4.9
3.0
2.8
5.3
5.7
3.7
8.7
4.8
2.5
1.6
2.6
7.4
3.3
WESTERN BOONE
**
**
**
**
**
**
**
**
**
**
* Data are either missing or incomplete.

IX-26
technical education are apt to have minimal effect at best. The stated
reasons for the male drop-outs most frequently inferred lack of family
support and academic failure. In the latter case, vocational-technical
opportunities should help reduce the drop-out rate. When, however, a
student's failure in school is largely a manifestation of difficultues
primarily outside of the school's sphere of direct influence, it is
unlikely the school's efforts can anticipate having more than a minimal
impact. The group on which improved vocational-technical education oppor-
tunities is likely to have the most positive impact is the psychological
drop-outs. If this is indeed so, indicators of program success would be
such as reductions in discipline problems and absenteeism as well as
improved overall performance in non-vocational-technical courses for
those individuals involved in the vocational-technical programs.
One measure of the success of a school corporation's programs is
ho.,, effectively they train students for the next phase of their lives.
For many students this next phase will involve additional education.
Therefore, the extent to which graduates complete programs of post-
secondary education that they enter can furnish an indicator of school
effectiveness for that facet of the schools' programs.
As was true in the gathering of information on high school drop-
outs, two forms were provided for schools to furnish data on post-
secondary education for their graduates. The detailed form (Exhibit XII-Ea)
attempted to assess the reasons why students did not complete programs
they entered whereas the shorter alternate form (Exhibit XII-Eb) sought
just the basic facts. Only three corporations were able to provide the
more comprehensive data required for the completion of the detailed form
and ten corporations were unable to provide complete information on the
post-secondary education experiences of their graduates for the five year
period spanning the academic years 1967-68 through 1971-72. Therefore,
any observations which follow are made from an incomplete factual base
and must be interpreted with that as a consideration. The available
information concerning post-secondary education for the graduates of the
participating school districts is summarized in Tables IX-t and IX-u.
For all reporting corporations a substantially higher percent of
their graduates enter a four-year or more college program than all other
programs of post-secondary education combined. Although the proporation

IX-27
of graduates entering non-four-year-or-more post-secondary programs is
smaller than the proportion entering four-year programs, the trend
appears to be for a higher percent of the non-four-year-or-more-post-
secondary-program group to complete their programs.
Knowledge of the facts concerning high school drop-outs and what
happens to young men and women after they graduate is essential both
for a realistic assessment of school programs and for the effective plan-
ning and revision of curriculum. When such facts are not available to
a corporation, assessment and planning, of necessityore done from an
incomplete base and ate likely less effective than could be true if the
data base was more nearly complete. The pattern for the corporations
involved in this study is to run an efficient operation and to keep
the administrative services at a minimum. In general, this is a laudatory
approach but a number of the corporations may wish to consider establish-
ing procedures for obtaining follow-up information concerning graduates
and drop-outs. Such procedures need not be elaborate or exnensive and
once established can be maintained by part-time clerical personnel or
by reliable community volunteers.

TABLE IX-t
1968 GRADUATES ENTERING POST-SECONDARY EDUCATION
PERCENT OF THOSE ENTERING WHO COMPLETED PROGRAM
by Corporation
Nz
CO
50
..4fl
8C
II:
48
NH
zE
1Pa
0M
0 1-1
gE
Ei
r)E
'4 F'4
5iC
)0
14g
00
0R
. . c
7a
C3
..4C
3C
3C
3Z
15V
)M
Number of grad-
uates in 1168
69
351
% of graduates
entering:
4 yr. or more
post-secondary
program
26.1
33.9
other post-secon-
dary program
8.7
11.4
% of graduates
who entered
completing*:
4 yr. or more
post-secondary
program
66.7
69.7
other post-secon-
dary program
100.0 90.0
*or still enrolled.
I = Incomplete data.
55
90
I153
191
I91
66
108
I73
183
54
110
I
20.0
27.8
I37.3
40.8
II
51.5
37.0
I32.9
44.8
33.3
35.5
I
14.5
14.4
I8.5
16.2
II
9.1
9.3
I13.7
12.0
18.5
9.1
I
I48.0
II
67.9
II
82.4
20.0
II
74.4
94.4
61.5
I
100.0
69.2
II
61.3
II
I50.0
I60.0
90.9
100.0-
70.0
I

ATTICA
CLAY
TABLE IX-u
1968, 1969, 1970, 1971, 1972 GRADUATES ENTERING
PROGRAMS OF POST-SECONDARY EDUCATION
AS A PERCENT OF TOTAL GRADUATES
AND THOSE COMPLETING PRCGRANS
AS A PERCENT OF THOSE ENTERING
FOUR YEAR (or more) PROGRAMS
.ALL OTHER PROGRAMS
Year
# of
Entered
Dropped out after
Entered
Dropped
Graduated Graduates
Program
1 yr.
2 yr.
3 yr.
4 yr.
Completed
Program
Out
Completed
1968
69
26.1
27.8
5.6
66.7
'
8.7
100.0
..
1969
81
29.6
12.5
8.3
4.2
**
4.9
100.0
..
1970
87
.I
II
**
*10.3
11.1
88.9
1971
74
.37.8
10.7
**
**
.6.8
100.0
1972
6o
23.3
**
**
*3.3
**
.
1968
351
33.9
7.6
15.1
7.6
69.7
11.4
10.0
90.0
1969
338
.34.9
9.3
18.6
7.6
**
.10.7
11.1
88.9
1970
366
.33.3
11.5
15.6
**
*15.0
9.1
90.9
1971
357
.34.2
11.5
**
**
9.0
**
1972
336
37.8
**
**
*9.5
**
..
CLOVERDALE
1968
55
.20.0
27.3
I14.5
100.0
1969
50
.28.0
14.3
**
6.0
--
100.0
1970
42
.33.3
21.4
7.1
**
*9.5
100.0
1971
60
.20.0
8.3
**
**
11.7
14.3
85.7
1972
64
25.0
**
**
*7.8
**
I = Incomplete data.
* Due to
year of graduation, number of years completed not possible.

TABLE IX-u
con't.
FOUR YEAR(or more) PROGRAMS
LYEL.
COVINGTON
Year
Graduated
h!of
Graduates
'
Entered
Program
Dropped out after
1 yr.
2 yr.
3 yr.
1968
1969
1970
1971
1972
90 84
87
87
85
27.8
48.8
28.7
29.9
29.4
28.o
29.3
32.o
23.1
8.o
20.0
9.8
8.o
7.7
4,o
CRAWFORDSVILLE
1968
II
II
1969
II
II
I
1970
II
I*
1971
1972
I
243
39,1
I *
* *
* *
GREENCASTLE
1968
153
37.3
II
I
1969
158
42.4
II
I
1970
157
35.7
II
*1971
171
42.1
I*
*
1972
166
38.6
**
LEBANON
1968
191
40.8
15.4
7.7
9.0
1969
224
42.0
23.4
17.0
1970
206
39.3
18.5
3.7
1971
206
34.5
15.5
1972
220
42.7
I = Incomplete data.
*Due to year of graduation, number of years completed not possible.
Completed
ALL OTHER PROGRAMS
Entered Dropped
Program
Out
Completed
*48.o
*14.4
3.6
30.8
69.2
100.0
**
2.3
100.0
**
9.2
25.0
*
**
11 8
**
II
II
I
**
II
**
II
* *
* *5.
8* *
* *
II
8.5
II
**
6.3
II
**
5.1
II
**
4.1
**
**
9.o
**
67.9
16.2
15.2
20.9
12.1
11.4
38.7
29.4
37.2
36.0
*
61.3
70.6
62.8
64.o

TABLE IX-u, con't.
FOUR YEAR (or more) PROGRAMS
ALL OTHER PROGRAMS
Year
# of
'Entered
Dropped out After
Entered Dropped
Graduated
Graduates 'Program
1 yr.
2 yr.
31,F,
4 yr.
Completed 'faleas
Out
Completed
NORTH
1968
II
II
II
II
II
MONTGOMERY
1969
II
II
I*
*.
II
I
1970
II
II
**
*.
II
I
1971
II
I*
**
*.
I*
*
1972
175
32.0
**
**
*17.1
6.7
*
:
.
NORTH PUTNAM
1968
91
.I
II
II
II
II
1969
94
.I
II
I*
*I
II
1970
102
.39.2
15.0
5.0
**
*.
2.0
100.0
--
1971
105
31.4
21.2
**
**
.4.8
40.0
60.0
1972
102
29.4
**
**
*4.9
**
..
..
ROCKVILLE
1966
66
51.5
II
II
82.4
9.1
II
:1969
75.
46.7
II
I*
*.
5.3
II
1970
69
.47.8
II
**
*.
1.5
II
1971
84
44.1
I*
**
*7.1
**
1972
90
48.9
**
**
*3.3
**
..
.
SOUTHEAST
1968
108
.37.0
50.0
25.0
5.0
20 0
9.3
50.0
50.0
FOUNTAIN
1969
126
.39.7
50.0
24.0
**
11,9
53.3
46.7
1970
121
39.7
47.9
--
**
*11.6
50.0
50 0
1971
124
39.5
40.8
**
**
.13 7
47.1
52 9
1972
125
40.0
**
**
*12.0
**
I = Incomplete data.
* Due toyear of graduation, number of years completed not possible.

TABLE IX-u, con't.
FOUR YEAR (or more) PROGRAMS
ALL OTHER PROGRAMS
Year
of
: Entered
Dropped out after
Entered
Dropped
.
4!
Graduated
Graduates
Program
1 yr.
2 yr.
3 yr.
A yr._
Completed _Program
Out
Completed
SOUTH
1968
I-
II
II
II
.I
II
MONTGOMERY
1969
I.
II
II
**
.I
II
1970
II
II
**
*I
II
1971
II
I*
**
*.
I*
*1972
140
31.4
13.6
**
**
10.0
**
SOUTH PUTNAM
1968
73
.32.9
II
II
I13.7
10.0
60.0
1969
74
-17.6
II
I*
*I
II
1970
78
-26.9
42.9
I*
**
15.4
16.7
83.3
1971
77
28.6
4.5
**
**
15.6
8.3
91.7
1972
82
.
30-5
**
**
*11.0
**
..
..
SOUTH
1968
183
.44.8
13.4
7.3
4.9
74.4
.12.0
9.1
90.9
VERMILLION
1969
162
37.7
14.8
6.6
8.2
**
13.o
__
100.0
1970
148
40.5
16.7
5.o
**
*11.5
5.9
94.1
1971
129
30.2
15.4
**
**
7.o
11.1
88.9
1972
172
36.6
**
**
*-
8.1
7.1
TURKEY
RU
N1968
54
33.3
--
5.6
94.4
.18.5
....
loo.o
'969
52
.32.3
15.0
**
22.6
21.4
78.6
197o
6o
16.7
20.0
10.0
**
*21.7
23.1
76.9
1971
82
.
26.8
40.9
**
**
20.7
35.3
*
1972
7o
21.4
**
**
*.
11.4
**
.
I = Incomplete data.
* Due to year of graduation, number of years completed not possible

TABLE IX-u, con't.
FOUR YEAR (or more) PROGRAMS
ALL OTHER PROGRAMS
Year
# of
'
Entered
Dropped out after
*Entered
Dropped
Graduated
Graduates
Program
1 yr.
2 yr.Jim
4 yr.
Completed
Program
Out
Completed
WARREN
1968
110
. .35.5
II
II
I9.1
30.0
70.0
1969
121
.27.3
II
I*
*.
15.7
5.3
94.7
1970
110
.28.2
II
**
*16.4
27.8
72.2
1971
119
33.6
10.0
**
**
14.3
17.6
82.4
1972
107
28.0
**
**
*8.4
11.1
*
..
WESTERN
1968
II
II
II
I.
II
I
BOONE
1969
I.
II
II
**
.I
II
1970
I.
II
I*
**
.I
II
1971
II
I*
**
*I
**
1972
II
**
**
*'
1*
*
I = Incomplete data.
Due to year of graduation, number of years completed not possible.

SECTION X
CORPORATION FINANCIAL CHARACTERISTICS

X-2
Based on data for the current school year, the total adjusted assessed valuation
(AAV) for all participating corporations combined is in excess of 383 million dollars.
The AAV for individual districts ranges from $7,393,057 (Cloverdale) to $37,114,841
(Clay County) with the median falling at $23,603,950 (Warren County). The average
daily attendance (ADA) for all corporations combined is 34,830 in grades 1-12. The
ADA span is from 852 (Turkey Run) to 4,838 (Clay County) with a median of 1,854
(Warren County).
The AAV per pupil in ADA varies from $7,224 (Cloverdale) to $14,336 (South
Vermillion) with the median at $11,840 (Covington).
Two of the seventeen participating corporations (South Putnam and Turkey Run)
levy the maximum general fund rate ($4495 adjusted) but all of the other districts
are below the general fund rate ceilings Fourteen of the corporations have debt
service rates ranging from $.01 (South Vermillion) to $1120 (South Putnam). Thirteen
of the corporations have cumulative building funds with rates from $.25 (Crawfords-
ville and North Montgomery) to $1.00 (Attica, Southeast Fountain, and Western Boone)
but none is at the $125 maximum.
While there is a wide variation in the financial commitments of the participat-
ing corporations, in most cases it appears that, if given a high enough priority by
the local school boards, some additional funding could be found to commit to expanded
vocational-technical education opportunities. It must be acknowledged, however,
that this observation is made on the basis of the current academic year. There are
at least two circumstances which must make any financial commitments on the part of
the corporations tenuous. The inflationary cycle with its spiraling costs for
goods, services, and salaries which is currently felt by every segment of the Amer-
ican society is particularly disastrous for school financial planning where funding
must be accomplished within changing guidelines that local school boards and admin-
istrators frequently have only an indirect voice in determining. Not unassoclated
with the inflationary spiral is the uncertainty generated by the tax deliberations
being carried on in the state legislature at the time of this writing. Until
schoolmen have some firm indication as to the "ground rules" under which they must
finance their operations, it is unlikely they will be willing to make substantial
dollar commitments to new or expanded programs not specifically mandated by state
law. Therefore, the actions or lack of actions of the current and subsequent legis-
latures will have more affect on the ability and willingness of the schools to commit
funds to the most worthwhile programs than will the descriptions of current finances
contained in Table X-a.

TABLE X-a
1971-72 and 1972-73 AVERAGE DAILY ATTENDANCE (ADA) and
1971-72 and 1972-73 CORPORATION FINANCIAL CHARACTERISTICS by Corporation
ATTICA
13,743,470
1,279
10,748
CLAY
36.124,035
4,853
7,444
CLOVERDALE
6,270,270
990
6,340
COVINGTON
13,051,750
1,244
10,473
CRAWFORDSVILLE GREENCASTLE
36,806,206
26,170,080
3,168
2,274
11,618
11,507
1.
ADJUSTED Assessed Valuation
1972 Budget (in dollars)
2.
Average Daily Attendance
(1-12) 1971-72
3.
ADJUSTED Assessed Valuation
per ADA 1971-72
(in dollars)
SCHOOL TAX RATES 1972 BUDGET
4.
General Fund (in dollars)
4.38
4.53
4.62
4.26
4.10
4.69
5.
Debt Service (in dollars)
.16
.4]
.83
.18
.76
6.
Cumulative Building (in dollars)
1.00
.50
.75
.....
.25
.40
7.
TOTAL (in dollars)
5.38
5.19
5.78
5.09
4.53
5.85
8.
General Fund Rate Ceiling ($4.95
adjusted) 1972 Budget (in dollars) 4.95
4.95
4.95
4.95
4.69
4.69
9.
ADJUSTED Assessed Valuation
1973 Budget (in dollars)
10.
Average Daily Attendance
16,022,782
37,114,841
7,393,057
15,112,222
36,581,132
26,631,150
(1-12) 1972-73
11.
ADJUSTED Assessed Valuation
1,268
4,838
1,023
1,276
3,127
2,195
per ADA 1972-73 (in dollars)
12,623
7,672
7,224
11,84o
11,698
12,132
SCHOOL TAX RATES 1973 BUDGET
12.
General Fund (in dollars)
4.50
4.58
4.50
4.60
4.5u
4.45
13.
Debt Service (in dollars)
--
.15
.50
.83
.24
.75
14.
Cumulative Building (in dollars)
1.00
.50
.75
--
.25
.40
15.
TOTAL (in dollars)
5.50
5.23
5.75
5.43
4.99
5.60
16.
General Fund Rate Ceiling ($4.95
adjusted) 1973 Budget (in dollars) 5.78
5.73
5.46
5.66
4.6o
4.95

TABLE X-a, con't.
1971-72 and 1972-73 AVERAGE DAILY ATTENDANCE (ADA) and
1971-72 and 1972-73 CORPORATION FINANCIAL CHARACTERISTICS by Corporation
LEBANON
28,150,215'
3,469
8,116
NORTH
MONTGOMERY
29,396,600
2,599
11,310
NORTH PUTNAM
15,267,370
1,632
9,358
ROCKVILLE
9,288,220
1,021
10,000
SOUTHEAST
FOUNTAIN
17,735,930
1,691
10,488
SOUTH
MONTGOMERY
22,961,946
2,233
10,283
1.
ADJUSTED Assessed Valuation
1972 Budget (in dollars)
2.
Average Daily Attendance
(1-12) 1971-72
3.
ADJUSTED Assessed Valuation
per ADA 1971-72 (in dollars)
SCHOOL TAX RATES 1972 BUDGET
4.
General Fund (in dollars)
4.59
4.26
4.00
3.97
4.00
4.42
5.
Debt Service (in dollars)
.80
1.00
1.13
.16
.43
.96
6.
Cumulative Building (in dollars)
.75
.25
--
1.00
.75
7.
TOTAL (in dollars)
6.14
5.51
5.13
4.13
5.43
6.13
8.
General Fund Rate Ceiling ($4.95
adjusted) 1972 Budget (in dollars) 4.78
4.62
4.69
4.95
4.95
4.59
9.
ADJUSTED Assessed Valuation
1973 Budget (in dollars)
29,231,569
32,953,090
20,326,920
9,813,925
22,660,648
24,939,750
10.
Average Daily Attendance
(1-12) 1972-73
3,395
2,570
1,644
1,050
1,723
2,302
11.
ADJUSTED Assessed Valuation
per ADA 1972-73 (in dollars)
8,611
12,822
12,363
10,458
13,151
10,833
SCHOOL TAX RATES 1973 BUDGET
12.
General Fund (in dollars)
4.65
4.40
4.40
4.30
4.77
4.72
13.
Debt Service (in dollars)
.84
1.05
1.00
.18
.4o
.84
14.
Cumulative Building (in dollars)
.75
.25
--
--
1.00
.75
15.
TOTAL (in dollars)
6.24
5.70
5.40
4.48
6.17
6.31
16.
General Fund Rate Ceiling ($4.95
adjusted) 1973 Budget (in dollars) 4.71
4.95
5.60
4.95
6.24
4,95

TABLE X-a, con't.
1971-72 and 1972-73 AVERAGE DAILY ATTENDANCE (ADA) and
1971-72 and 1972-73 CORPORATION FINANCIAL CHARACTERISTICS
SOUTH
SOUTH PUTNAM VERMILLION
1.
ADJUSTED Assessed Valuation
1972 Budget (in dollars)
10,680,532
26,022,492
2.
Average Daily Attendance
(1-12) 1971-72
1,300
2,322
3.
ADJUSTED Assessed Valuation
per ADA 1971-72 (in dollars)
8,217
11,197
TURKEY RUN
9,841,890
897
10,970
by Corporation
MSD of WARREN COUNTY*
WESTERN
WARREN CEN1RAL
WARREN COMMUNITY
BOONE
23,4
82,8
6721,301,145
1,854
2,174
12,665
9,798
SCHOOL TAX RATES 1972 BUDGET
4.
General Fund (in dollars)
4.69
3.63
4.79
5.47
14.9
94.
575.
Debt Service (in dollars)
1.09
--
.16
.6o
6.
Cumulative Building (in dollars)
.85
.75
.75
1.00
7.
TOTAL (in dollars)
6.63
4.38
4.95
6.07
5.74
5.57
8.
General Fund Rate Ceiling ($4.95
adjusted) 1972 Budget (in dollars) 4.69
5.39
4.95
II
4.69
9.
ADJUSTED Assessed Valuation
1973 Budget (in dollars)
12,716,464
32,660,488
9,955,010
23,6
03,9
5026,009,595
10.
Average Daily Attendance
(1-12) 1972-73
1,307
2,278
852
1,854
2,128
11.
ADJUSTED Assessed Valuation,
per ADA 1972-73 (in dollars)
9,730
14,336
11,687
12,732
12,223
SCHOOL TAX RATES 1973 BUDGET
12.
General Fund (in dollars)
5.47
3.77
4.95
5.68
5.10
14.8
1
13.
Debt Service (in dollars)
1.20
.01
.20
.64
14.
Cumulative Building (in dollars)
.85
.75
.45
--
1.00
15.
TOTAL (in dollars)
7.52
4.53
5.60
6.32
5.10
5.81
16.
General Fund Rate Ceiling ($4.95
*adjusted) 1973 Budget (in dollars) 5.47
5.87
4.95
5.80
5.57
5.57
Warren Central Consolidated and Warren Community Schools were not consolidated as
MSD of Warren County until November, 1972.
I = Incomplete data.

SECTION XI
IF:%zh:T POPULATION CHARACTERISTICSAND
EMPLOYMENT OPPORTUNITIES

Area in square miles
TABLE XI-a
GENERAL POPULATION CHARACTERISTICS By County
(Based on the United States Census 1940, 1950, 1960, 1970)
BOONE CLAY FOUNTAIN MONTGOMERY PARKE PUTNAM VERMILLION WARREN TOTAL STATE
427
364
397
507
445
490
263
368
36,097
Population density per square mile
1970
72.3
65.8
46.0
1960
64.5
66.5
47.1
1950
56.2
65.7
44.9
Total population
1970
30,870 23,9:1 18,257
1960
27,543 24,207
18,706
1950
23,993 23,918
17,836
% of population urban
1970
1960
1950
% change
1960-1970 (total)
Urban (1960-1970)
Rural (1960-1970)
1950-1960 (total)
1940-1950 (total)
31.6
34.1
34.6
36.6
31.8
35.3
12.1
-1.1
2.6
-7.8
17.1
2.7
14.8
1.2
8.7
-5.7
37.8
38.o
21.7
- 2.4
- 2.8
-2.2
4.9
-2.5
66.9
63.3
57.4
32.8
55.0
32.8
51.1
34.8
46.8
63.9
67.2
75.0
23.7
23.2
23.2
143.
912
8.9
108.
7
33,93o
14,600 26,932
16,793
8,705
5,193,669
32,089
14,804 24,927
17,683
8,545
4,662,498
29,122
15,674 22,950
19,723
8,535
3,934,224
40.8
44.3
44.1
5.7
-2.7
12.5
10.2
6.9
19.3
32.9
31.8
18.6
34.1
33.o
0.0
30.0
32.8
- 1.4
8.o
2.3
4.1
- 2.2
10.1
- 5.6
8.6
-9.7
10.1
0.0
0.0
0.0
- 5.o
1.9
-8.
6--
- 5.0
1.9
- 10.3
0.1
- 9.5
-5.7
64.9
62.4
59.9
11.4
15.9
4.o
18.5
14.8

TABLE XI-a, con't.
BOONE
CLAY
FOUNTAIN MONTGOMERY
PARKE PUTNAM VERMILLION WARREN
TOTAL STATE
1970
34.9
31.4
34.6
33.9
32.8
31.2
30.5
36.0
35.4
1960
36.1
31.8
34.6
34.1
45.8
31.4
31.8
37.3
36.4
1950
30.9
28.9
31.5
29.2
38.7
26.6
31.2
33.5
30.8
1970
7.9
7.5
8.9
8.1
7.6
6.9
7.6
8.4
8.8
1960
10.8
9.1
10.7
10.9
13.6
9.6
8.9
10.9
11.6
1950
10.3
9.2
9.9
9.9
13.3
8.2
9.4
10.6
10.7
1970
29.6
33.8
30.7
29.1
33.1
27.3
33.9
30.0
27.2
1960
30.4
34.9
31.3
30.5
28.8
27.3
35.8
29.7
28.9
1950
32.5
34.3
32.6
32.2
28.0
30.5
33.1
30.8
30.4

XI-4
The population characteristics for the eight-county area served
by the school corporations participating in this study are atypical of
the total State of Indiana (Table XI-a). Although the land area of the
eight-county region represents more than 9% of the total area for the
state, less than 31% of the state's population reside in these counties.
The 1970 population density for a major metropolitan area such as Marion
County was 2021.2 people per square mile while the average density for
the state that same year was 143.9. By contrast the most densely popu-
lated of the eight-county group is Boone where there was a shade more
than half of the population per square mile (72.3 individuals) and the
least densely populated was Warren where the population density was
less than 17% (23.7 people) of the state average for 1970.
Although the 1970 U.S. Census showed almost 65% of Indiana's popu-
lation to live in urban areas,* the percents living in urban areas in
the eight-county area ranged from no percent in Warren County to approx-
imately 41% in Montgomery County. As a state, Indiana's total population
increased 11.4% between 1960 and 1970 but the rural population increased
only 4%. Half of the eight counties lost population in the same period.
The only county in the eight-county group to equal or exceed the state
average for 1960-1970 growth is Boone County but even in Boone County
the pattern of growth differs from the state as the rural growth was
17.1% as contrasted to urban growth of 2.6% for the ten-year period.
In the eight-county area there are four major urban areas: Brazil
(1970 population, 8163) Crawfordsville (1970 population, 13,842),
Greencastle (1970 population, 8852), and Lebanon (1970 population, 9766).
Commencing with the lessened coal production in the 1950's, Brazil's
population began to level and decline until the period 1960 to 1970
saw a 7.8% population decrease. The Crawfordsville community experienced
steady growth from 1910 to 1960 when the population peaked at 14,231.
* * * *
*The urban population comprises all persons living in urbanized areasand in places of 2,500 inhabitants or more outside urbanized areas. More
specifically, the urban population consists of all persons living in(a) places of 2,500 inhabitants or more incorporated as cities, villages,boroughs (except Alaska), and towns (except in the New England states,New York, and Wisconsin), but excluding those persons living in ruralportions of extended cities; (b) unincorporated places of 2,500 inhabi-tants or more; and (c) other territory, incorporated or unincorporated,included in urbanized areas. The population not classified as urbanconstitutes the rural population. 1970 UNITED STATES CENSUS

XI-5
Between 1960 and 1970, however, Crawfordsville's population declined
2.7%. During the 1960 to 1970 span both Greencastle ( +4.1 %) and Lebanon
(+2.6%) experienced a growth of population, but the percent of growth for
both cities was considerably below the 15.9% increase in urban population
experienced by the state as a whole during the same duration of time.
In 1970 the residents of the eight counties tended to be older as
indicated by the median age than was true for the entire state with
the percent of the eight counties' population below age 5 and below
age 18 being less than was true for the state. The two exceptions to
this observation are Warren County where the percent of the population
under age eighteen was 0.6% higher than the state average and Fountain
County where the percent of the population under age five was 0.1%
higher than the state average.
Myrta Pulliam writing in the March 4, 1973, Indianapolis Star,
reported the following:
Indiana's birth rate is the lowest it has been since1946, putting the state close to "zero populationgrowth" at least momentarily.
The total number of estimated Indiana births for 1972was 86,500. . .
. . . That's a large drop -- 10 percent -- from 1971when Indiana had 94,499 births. . .
. . . the number of women of child-bearing age (15-44) is increasing steadily -- about 20 per cent ayear, so it would be expected that the birth ratewould climb at that rate too. But it hasn't.
"There may be more women ofchild-bearing age butthey aren't having children". . .
. . . Although the population of Indiana is steadilyincreasing, we are still close to zero populationgrowth, which means essentially that each person isonly replacing himself with one child -- or eachcouple has two children.
The total fertility rate for Indiana is estimated at2.08 children a woman.
But just to complicate matters, Indiana also has aconstantly expanding population since there areproportionately more women of child-bearing agethan there are older women. That's because thewomen who were born during the '40s and '50 when

XI-6
the birth rate was extremely high have now reachedchild-bearing age.
But if the total fertility rate of 2.08 is maintainedfor approximately 50 years then we really will havezero population growth. . .
Should the zero or near zero birth rate indeed become the rule, it would
mean that increased population in the eight county area would be primarily
the result of in-migration. This does not indicate necessarily that
there will not be considerable growth in these counties and in the school
populations after 1977. It does indicate that such growth would be less
when based on.in-migration only than it would if area development (see
Section IX) and high birth rates were both growth factors.
Chart XI-a, Table XI-b, and Table XI-bb illustrate the extent to
which the working population of the eight-county area travel outside of
their county of residence for employment.
TABLE XI-bbEMPLOYMENT IN COUNTY of and OUT of COUNTY of
RESIDENCE FOR PARTICIPATING COUNTIES*
ZZH g
0
El E.4 E.' v Eq 0 ::.i H r. p r. g Qfx.1
5,M '-a MR M gg NM , 0 El.., 0 1-4 0 E Ca Q 0 T1 co =C 0 pp4 c) C3 C) ... 0 Ct4 C) 114 C3 M C) 00 t4
Number employed inCounty of Residence 6662 4140 4263 10580 2918 6960 3041 1403 39967
Number employed Out-side County ofResidence 4928 3620 1913 1396 1667 1806 2541 1429 19300
Not Reported 593 478 537 980 269 637 329 221 4044TOTAL Working 12183 8238 6713 12956 4854 9403 5911 3053 63311
Percent Employed inCounty of Residence 54.7 50.3 63.5 81.7 60.1 74.0 51.4 46.0 63.1
*Based on 1970 U.S. Census Fourth Count Summary Tape
In the eight-county area involved in this study, over 1/3 of the
total work force of 63,311 people is employed outside of the county in

L co-'s
493
63
24,2
0831
4
3,63
4
499 25
5
296
NE
W
25°
8. 4
761'
281
1,59
3 53
JAS
PE
781
PORTS
LA °
105
742
2,29
9
74
101 S
T,
1,54
7
5,11
9
449
3
1,33
4
PH
1,03
2
225
54
75 85
1,65
6
54
456
499
185
LR
SL
214
215
274
70
T4
316
156
632
LAG
94 422
NG
I149
737
159
562
108
416
57
RE
E
ti
189
145
140
60
9215
7T
ipU
L A
143
252
i27
1n
TO
NF
166
762
72W
AR
R e
" 309
142
176 0 3
41
285
219
326
642
627
A 1
61
TF
O -
W
114 T
159
982
52
297
71
1219
01 10
2
87 1
1844
"T
I
w 1
47
815 81
1,24
1
101
146
418
6212
4
566
82
588
52
MO
es37
2
8.4
CR
Y
59 530
413
872
9-C
AR
°L
1,46
5
115
374
74
1.07
5
193
181
215
137
351
647
I1,
55
239
186
409
NO
BLE
259
412 0
81 141
4
142
189
1 446
213
726
7
2,62
6
inE
Ypf
166
214
157
643
WA
S S
M
621,
44
45
536
13
571.
458 IA
341
LA
S13
5
5116
7
433
1
200
1,54
4
161
103
82 6838
422
5
323
280
102
R N
T
388
553
91
158
146
2.34
4L30
--C
373
311
7327
5A
LL N
A
296
1,92
3
287
133
25W
L
279
95
92
458
1122
125
693 A
S-
FO
R-/1
328
111=
"420
111
251
3,85
750T
0 "
C
R R
E1.
04°
164
4
86'
el)r(6
225
151
489
2.05
°
50 88
193
6077
11.7
9°
1,08
1
8.99
1 in
221
178
300
8:86
7 IA1.
2..5
125
201
j.09 /41°
2.8"
IN1
8V
18
4M..1
17.
7,.F
145
161
53
NE
N°R
1
283
173
329
66
MO
AN
10,1
3253 11
5
.727
7 6, 1
1
A
1,12
2
2,53
9
34
44 105A
128
108
100
310
74L
262
29 2,08
233
6
285
EL.
182
439
197
218
925
1
606
JA
1:84
8 1,07
3
958
72 99 27
82
749
150
ER
R -
75
143
448
87
R 5
"3
DE
CU
N31
8A
-
130
1,49
471
192
8746
9
AND' PH
104
118
290
260
5254
812
2 (
299
206
64F
AT
r
508
440
341 UN
ION
6559
289
867
575
58

C.F
1 AFr
r -a
z0
1104
,-.1
CO
MM
UT
ING
PA
TT
ER
NS
BE
TW
EE
N C
OU
NT
IES
fAie
mos
sipe
sem
onot
iong
Mni
elea
mm
e44
Cou
nts
of u
nder
50 a
re
omitt
ed b
ut a
relis
ted
in th
e ta
bles
.
Rc-
$::?
31'
'In
dian
a1.
71-
j.C1
;Inc
Ii
IMP

TABLE XI-b
POPULATION at
Residence in Boone County
Place of Work
WORK DURING
the CENSUS WEEK by PLACE of WORK
Residence in Clay County
Place of Work
Indianapolis City---CBD
467
Terre Haute City
1598
Remainder of Indianapolis City
2523
Remainder of Vigo County
452
Remainder of Marion County
867
Sullivan County
53
Hamilton County
251
* Vermillion County
56
Hendricks County
99
*Parke County
26
Johnson County
31
*Putnam County
489
Anderson City
62
Green County
271
Remainder of Madison County
28
Indianapolis City
287
Lafayette City
7o
Remainder of Marion County
125
Remainder of Tippecanoe County
31
*Place of work inside Clay County
414o
Kokomo City
33
Place of work outside Clay County
3620
Clinton County
193
Not reported
478
* Montgomery County
105
* Place of Work inside Boone County
6662
Place of work outside Boone County
4928
Not reported
593
Place of Work in Boone County
Place of Work in Clay County
Residence In
Residence In
Clinton County
96
*Parke County
82
*Montgomery County
85
Vigo County
225
Hendricks County
4o
Greene County
43
Marion County
365
Owen County
82
Hamilton County
112
*PutnaM'County
50
Note:
Fewer than 25 not listed.
*Counties participating in the West Central Indiana Vocational-Technical Education Survey.

Residence in Fountain County
Place of Work
TABLE XI -b, con't.
Residence in Montgomery
Place of Work
County
Warren County
219
Indianapolis City
337
Lafayette City
199
Remainder or Marion County
35
Remainder of Tippecanoe County
86
Lafayette City
436
*Montgomery County
342
Remainder of Tippecanoe County
152
*Parke County
31
* BooneCounty
85
*VermillionCounty
266
* Putnam County
52
Danville City, Illinois
554
* Fountain County
76
Remainder of Vermilion County, Ill.
68
* Place of work inside Montgomery Co.
10580
Indianapolis City
33
Place of work outside Montgomery Co
1396
*Place of work inside Fountain County
4263
Not reported
980
Place of work outside Fountain County
1913
Not reported
537
Place of Work in Fountain County
Residence In
Place of Work in Montgomery County
Residence In
*Tippecanoe County
87
Tippecanoe County
119
Warren County
660
*Fountain County
342
*Vermillion County
147
*Parke County
146
Parke County
101
*Putnam County
212
*Montgomery County
76
Hendricks County
6o
Benton County
37
*Boone County
105
Vigo County
31
Note:
Fewer than 25 not listed.
*Counties participating in the West Central IndianaVocational-Technical Education Survey.

Residence in Parke County
Place of Work
TABLE XI-b, con't.
Residence in Putnam County
Place of Work
Terre Haute City
395
Terre Haute City
81
of Vigo County
171
Indianapolis City
860
*Remainder
Vermillion County
418
Remainder of Marion County
188
*, Eountain County
101
Montgomery County
212
*Montgomery County
146
Hendricks County
165
Putnam County
62
Owen County
28
*Clay County
82
*Clay County
49
Indianapolis City
105
*Place of work inside Putnam County
6960
Vermilion County, Illinois
25
Place of work outside Putnam County
1806
*Place of work inside Parke County
2918
Not reported
637
Place of work outside Parke County
1667
Not reported
269
Place of Work in Parke County
Residence In
Place of Work in Putnam County
Residence In
*Fountain County
31
Montgomery County
52
Vermillion County
81
*Parke County
62
Vigo County
124
*Clay County
489
*Clay County
26
Vigo County
86
Owen County
174
Hendricks County
142
Morgan County
30
Note:
Fewer than 25 not listed.
*Counties participating in the West Central Indiana Vocational- Technical Education Survey.

Residence in Vermillion County
Place of Work
TABLE XI-b, con't.
Residence in Warren County
Place of Work
Terre Haute City
1034
Benton County
72
Remainder of Vigo County
207
Lafayette City
256
*Parke County
81
Remainder of Tippecanoe County
53
*Fountain County
147
*Fountain County
66o
Danville City, Illinois
419
*Vermillion County
176
Remainder of Vermilion County, Ill.
224
Danville City, Illinois
106
*Warren County
4].
Remainder of Vermilion County, Ill.
36
Edgar County, Illinois
172
* Place of work inside Warren County
1403
*Montgomery County
26
Place of work outside Warren County
1429
*Place of work inside Vermillion Co.
3041
Not Reported
221
Place of work outside Vermillion Co.
2541
Not reported
329
Place of Work in Vermillion
Residence In
County
Place of Work in Warren County
Residence In
*Warren County
176
Benton County
32
Sullivan County
6o
*Vermillion County
41
*Clay County
56
*Fountain County
219
* Parke County
418
*Fountain County
266
Vigo County
373
Note:
Fewer than 25 not listed.
*Counties participating in the West Central Indiana Vocational-Technical Education Survey.
Source:
1970 Census Fourth Count Summary Tape as reported in:
COMMUTING PATTERNS -- By Place of Work and Place of Residence
Indiana Employment Security Division
10 North Senate Avenue
Indianapolis, Indiana
46204
September, 1972

XI-12
which they reside. The actual percent of workers employed outside of
their county of residence ranges from a low of approximately 18% (Mont-
gomery County) to a high of 54% (Warren County). As can be observed by
studying Chart XI-a and Table XI-b, the exchange of workers between the
eight counties as well as between other Indiana and Illinois counties
is considerable. It must be noted also that the commuting patterns
between the eight participating counties are such that each is dependent
on others for a substantial portion of its work force. This circumstance
would appear to argue that cooperation between the school corporations of
the eight counties in the area of vocational-technical education will
benefit all counties by providing skilled workers to the general area.
To illustrate, there is enough employment interdependence within the
area so that the Clay County graduates are apt to be employed in Putnam
and conversely Putnam's graduates may well be employed in Clay or in
Montgomery Counties.
The eight counties involved in this study fall into three of the
State of Indiana Planning and Development Regions (Chart XI-b). The
three regions in which these counties fall are 4 (Warren, Fountain, and
Montgomery Counties), 7 (Vermillion, Parke, Putnam, and Clay Counties),
and 8 (Boone County). The projected growth in total employment for the
State of Indiana between 1967 and 1975 is +11.4%.*
The projections for
regions 4, 7, and 8 are +12.7%, +16.2%, and +14.0% respectively. In
spite of the projected increases in employment, the 1971 unemployment
rates ranged from 3.0% (Montgomery County) to 10.1% (Clay County) as
reported in the Indiana Employment Security Division's "Work Force
Summaries for Smaller Counties in Indiana." The 1971 unemploy,ent rates
for the other counties involved in this study are
Fountain = 3.2%Parke = 8,3%Putnam = 5.0%Vermillion = 9.8%Warren = 3.2%.
The unemployment data for Boone County are grouped with HamilLon, Han-
cock, Hendricks, Johnson, Marion, Morgan, and Shelby counties as "Indiana-
polis area."
Table XI-c presents the 1972-73 occupational demand for the involved
area as estimated by the Indiana Employment Security Division. As was
* * * *
*Heller, Martin W., Indiana Regional Employment Projections 1967-1975.State of Indiana Employment Security Division, Indianapolis, May, 1970.

c NaRTL bPlanning and Development Regions
State of Indiana
WON! ILIISIT 'hat'
STINE AISKKI1 Ad KOSCIUSKO
FIVON
Gist ONANO MIN
TIPPECANOE
num MONTCOMINT
COMA
NAVIN
NON
MINNICK'
IMAW
MONROE
OOwIOO ILACKIOND
TIPTON
MAIILEON
MARION
SItLIT SUSI
SilLIKAN
t ANTOCI trump IIVITZENITAD
NANCE
0M1 /I0 KAMM
Established by Executive Order No. HI-..68 andApproved by Governor Roger D. Branigin on Dee.4,1968.

TABLE XI-c
INDIANA EMPLOYMENT SECURITY
OCCUPATIONAL DEMAND IN INDIANA
The Indianapolis office covers the following counties: Boone*, Hamilton,
Hancock, Hendricks, Johnson, Marion, and Morgan.
The Lafayette office covers the following
Clinton, Fountain*, Montgomery *,
The Terre Haute office covers the following
Putnam*, Vermillion
*, and Vigo.
counties: Benton, Carroll,
Tippecanoe, and Warren *.
counties: Clay , Parke* ,
1972-73 RELATIVE NEEDS BY AREAOCCUPATION INDIANAPOLIS LAFAYETTE TERRE HAUTE
Professional Nurse 4 4 2
Medical Technicians 3 5 2
Dental Technicians 2 4 2
Practical Nurses 3 5 X 3Other Medical & Health Workers 3 5 2
Draftsmen 5 X 3 1
Electrical Technicians 2 4 1
Electronic Technicians 1 3 2Mechanical Technicians 3 4 1
Industrial Technicians 3 3 2Chemical Technicians 3 3 1
Programers 4 2 2 X
Secretaries 5 X 5 5 XStenographers 5 X 5 5 XTypists 5 x 5 3Bookkeepers 3 5 3Bookkeeping Machine Operators 2 3 2File Clerks 1 4 2
General Office Clerks 5 5 3Shipping & Receiving Clerks 2 3 1
Stock & Inventory Clerks 2 4 1
Bank Tellers 1 4 1
Cashiers 1 5 1
Telephone Operators 1 1 1
Keypunch Operators & Verifiers 5 4 4
Other Data Processing Occupations 2 3 2
SALESWORKERS (Including Managers,
Asst. Mgrs., Buyers, Salesmen,
Salespersons and Sales Buyers)
By Industry: 4 3
Apparel & Accessories 2 5 2
Food Distribution (grocery stores) 2 4 2
Food Services (restaurants, etc.) 2 4 X 3
*bounties participating in the West Central Indiana Vocational-TechnicalEducation Survey.

TABLE XI-c, con't.
OCCUPATION INDIANAPOLIS LAFAYETTE TERRE HAUTE
General Merchandise
Home Furnishings
Insurance
Other Retail TradeWholesale Trade
1
2
5 x
3
4
5
3
5
4
2
2
1
4 x
2
2
Carpenters 5 x 5 X 2
Cement & Concrete Finishers 3 5 X 2
Electricians, including electronics 5 X 5 X 2
Excavating, Grading & Road Machinery
Operators 3 1 1
Furnace Installers & Repairmen 4 x 3 2
Painters & Paperhangers 4 3 1
Plumbers & Pipefitters 5 X 4 X 2
Structural Metalworkers 4 1 1
Machinists 5 X 2 3
Machine Tool Operators 5 x 3 2
Printing Occupations 1 2 1
Blacksmiths & Forgemen 1 1 1Boilermakers 1 1 2
Millwrights 1 1 2
Molders 3 x 1 2 X
Patternmakers; metal & wood 3 1 1 X
Toolmakers, Diemakers, Setters 3 3 2 X
Appliance Repairmen 1 3 1 X
Electrical Motor Repairmen 3 X 3 2
Industrial Machinery Repairmen 3 X 5 X 3
Motor Vehicle Repairmen: Motor & Body 3 X 4 4 X
Office Machine Repairmen 4 X 2 2
Plastics Craftsmen 1 2 2
Bakers 3 2 1
Barbers 1 1 1
Beauty Operators (Cosmetologists) 2 3 2
Cabinet Makers 4 X 2 1
Cranemen, Derrickmen, Hoistmen 3 1 1
Upholsterers 4 X 1 1
Drivers; bus, truck, tractor 4 5 2
Deliverymen; rnutemen, cab drivers 3 5 3
Asbestos, insulation 2 2 1
Automobile Attendants; gas & parking 3 5 4
Laundry & Dry Cleaning Operators 1 2 2
Meat Cutters, except Meat Packing 2 2 1
Sewers & Stitchers (mfg.) 2 3 4
Welders & Flame Cutters 4 X 4 3 X

TABLE XI-c, con't.
OCCUPATION INDIANAPOLIS LAFAYETTE TERRE HAUTE
Private Househ.)1d Workers 5 X 4 2
Cooks, except private household 4 X 4 X 2 X
Counter & Fountain Workers 3 3 4
Waiters & Waitresses 4 5 X 4
Nurse Aides &Attendants Hospitals &
Other Inst. 3 4 3
Charwomen & Cleaners 3 3 2
Janitors 2 3 3
Grain Farm Workers 2 4 1
Vegetable Farm Workers 3 5 1
Dairy Farm Workers 1 1 1
Landscape Gardeners 4 2 2
Nursery Workers 3 3 1
Park Workers 2 1 1
RELATIVE NEED:
1. Lowest need for workers
2. Moderately low need for workers
3. Moderate need for workers
4. Moderately heavy need for workers
5. Heaviest need for workers
X Indicates the local office estimates supply will be
inadequate to meet demands.
COMMENTS: (1) Indianapolis - Moderate demand continues for workers to enter
apprenticeship programs for machinists, tool and die makers,
meat cutters, and occupations in the building trades and
printing industry.
(2) Lafayette - Training course for maintenance man, factory in
automated plants stressing knowledge of industrial electro-nics, electricity, and mechanical repair of equipment such as
conveyor systems and packers.
(3) Terre Haute - Secretaries need at least two years of trainingand practice in dictation to qualify for local jobs.

XI-17
noted above, however, the commuting patterns for the residents of the
area are such that entire central and west central sectors (planning
regions 4, 5, 7, 8, and 10) could be considered as potential job markets
for some portion of the eight counties' population. Within the eight-
county area there are four major projects which will place heavy demands
on first the building trades and their support occupations and then on the
hospitality and retail occupations. These projects are an amusement
complex and additional motel building in the Lebanon area and motel
expansion in the South Putnam and North Montgomery areas.
Although the 1971 employment was greater than shown in Table XI-d
because small firms are not included in the reported figures, the general
employment patterns are observable.
TABLE XI-dCOUNTY EMPLOYMENT PATTERNS
AVERAGE FOR 1971
t4s
Z r-41 tis 5)
§1 11 81 N El cl§pq 0 0 0 r240 Z o Pi O (14 O 9 U M
TOTAL COVERED EMPLOYMENT 3979 2404 3380 7368 1247 3811 2544 778Mining -- 145 107 87 --
Construction 172 103 40 144 74 96 541 --MANUFACTURING 1583 766 2174 4267 193 1824 1113 --
Fabricated Metals 358 -- -- -- -- -- -- --Stone, Clay, Glass -- 396 -- 396Transportation, Commu-nications, and PublicUtilities 223 171 148 314 140 207 190 --
Trade 1396 788 732 1781 559 935 465 227Finance 181 107 102 274 69 178 58 --
Agriculture andServices 358 291 138 520 163 434 80 --
Local Government m -- 22 30 --
*Source: "1971 County Employment Patterns," Indiana Employment SecurityDivision, Indianapolis, Indiana.

XI-18
TABLE XI-eWORK FORCE SUMMARIESANNUAL AVERAGES 1971
>-1
ova
Eltil P-41Na zn
218 08 28 R8Total Work Force* -- 5740 6265 12775Unemployed
number 580 200 385percent of work force -- 10.1 3.2 3.0
Employed**total -- 5140 6065 12390in non-farm industries -- 3860 4730 10265
Manufacturingtotal 780 2180 4265durable goods 550 2050 1635nondurable goods -- 230 130 2630
Non-manufacturing 3080 2550 6000
aka ran48 P.O PF3
Zr-41
3610 8545 5190 2060
300 430 510 658.3 5.0 9.8 3.2
3310 8115 4670 18952200 6685 3630 1345
195 1840 1140 46530 840 90 20
165 1000 1050 4452005 4845 2480 880
*The work force includes all workers involved in labor-management dis-putes in addition to employed and unemployed workers. Therefore, incounties where the employment figure plus the unemployment figure doesnot equal the work force, the difference is the number of workersinvolved in labor and management disputes.
**Total employed also includes those in agriculture and in all othernon-agricultural employment (self-employed, unpaid family workers,and domestics).
***Data for Boone County are grouped with Hamilton, Hancock, Hendricks,Johnson, Marion, Morgan, and Shelby counties as "Indianapolis area."
Source: "Work Force Summaries for Smaller Counties in Indiana,"Indiana Employment Security Division, Indianapolis, Indiana.
West central Indiana is generally considered to be an agricultural area,
but Tables XI-d and XI-e demonstrate that sizeable numbers of the resi-
dents are employed in non-agricultural activities with trade and manu-
facturing as the first and second major employers in all of the eight
counties except Vermillion County where manufacturing and construction
respectively occupy the first and second positions.
There is an interesting question regarding employment to be pondered.

XI-19
How much greater success would the Chambers of Commerce and the communi-
ties havc in attracting additional business and industries if they could
show prospective businesses and industries a flexible vocational-technical
program to provide those enterprises with highly-skilled workers and
technicians? How many firms would consider relocation to this area to
avoid a situation such as the one described below if a community could
provide a trained work force with the positive Hoosier attitudes as a
bonus?
. . . Another California firm, Plastiglide ManufacturingCorporation, of Santa Monica, finds that its pay ratesfor good tool-makers are going up "like the cost ofmeat." Don Neville, plant manager, explains;
"With one employer bidding against the other, men withexperience go from plant to plant, wherever they canget another 50 cents an hour more.
"Finding people for the second and third shifts is very,very difficult. Today's work force has become indepen-dent. Nobody wants to work at night."
--U.S. News & World Report, April 9,1973, pages 77-78.

SECTION XII
SURVEY INSTRUMENTS and DOCUMENTS

XII -2
Between November 13 and November 22 the study director delivered
the data gathering forms to each of the seventeen participating school
corporations. At that time, the study director met with the superin-
tendent and/ot the individual within the corporation who was to serve
as the local coordinator for the study. During the meeting the study
director went over the "Memorandum for: School Corporation Study Coor-
dinators" (Exhibit XII-A) and each of the data-gathering forms (Exhibits
XII-B through XII-N).
"Corporation Financial Characteristics" (Exhibit XII-B) requested
information readily available in the school offices and apparently
presented no difficulties for most of the participating corporations.
An attempt was made to gather enrollment data by sex (Exhibits
XII-Ca through XI/-Cc) for the academic years 1963-64 through 1972-73.
Although the sex breakdown could be provided by most corporations,
two of them could provide only total enrollment figures and four corpo-
rations were unable to supply enrollment data for the full ten year
period.
Preferred and alternate forms were provided to gather information
on drop-outs (Exhibits XII -Da and XII-Db) and on graduates who entered
a program of post-secondary education (Exhibits XII-Ea and XII-Eb).
In both areas less than half of the corporations were able to provide
the detailed breakdowns required to complete the preferred forms and
therefore submitted the alternate forms.
An attempt was made to assess the availability of all types of
courses such as typing, shorthand, and industrial arts programs which
could result in a student obtaining marketable skills but which are
not reimbursed by the Division of Vocational Education of the Indiana
State Department of Public Instruction. Sohools were requested to
either submit a class schedule with enrollments noted or to complete
the "Non-Reimbursed Programs" form (Exhibit XII-R).

EXHIBIT XII -A
1972 WEST CENTRAL INDIANAVOCATIONAL AND TECHNICAL EDUCATION SURVEY
Box 307, Crawfordsville, Indiana 47933 Telephone:(317) 362-8877
Memorandum for: SCHOOL CORPORATION STUDY COORDINATORS
Subject: Data Gathering From: Fred Gannon
This packet contains all of the forms and questionnaireswhich we currently anticipate as being necessary to have com-pleted by the various school corporations° students, teachers,and parents. Please do not wait until you have all forms com-pleted before returning them. As forms or sets of question-naires are completed, please return them to me. In any event,please make every effort to return all forms prior to Christ-mas recess. A brief comment regarding the various forms fol-lows but if you have any questions or comments as you actuallyuse the forms, please do not hesitate to call me or to dropinto our offices at 501 Whitlock Avenue in Crawfordsville.
1. CORPORATION FINANCIAL CHARACTERISTICS
Two copies of this form are included. Please completeboth copies, return one to us, and retain the otheras your file copy. (green stock, mineo)
2. GRADES 1-6 FALL ENROLLMENTS BY YEAR
Two copies of this form are included for each of yourschools with students enrolled in grades 1-6. Pleasscomplete both copies, return one to us, and retainthe other as a file copy. '(;blue stock, ditto')
3. GRADES 7-9 FALL ENROLLMENTS BY YEAR
Two copies of this form are included for each of yourschools with students enrolled in grades 7-9. Pleasecomplete both copies, return one to us, and retainthe other as a file copy. (pink stock, ditto)
4. GRADES 10-12 FALL ENROLLMENTS BY YEAR
Two copies of this form are included for each of yourschools with students enrolled in grades 10-12.Please complete both copies, return one to us, andretain the other as a file copy. (buff stock, ditto)

EXHIBIT XII-A, con't.
5a. SECONDARY DROP-OUTS (9-12)
One set of these materials for each of your schoolsenrolling students in grades 9-12 is included. Thisform requests a great deal of information which maybe difficult to provides It is information, however,which can be of great value to the study and to futureplanning activities and it is therefore requested thatevery effort be made to complete this form. (pinkstock, mimeo)
5b. SECONDARY DROP-OUTS (9-12) ALTERNATE FORM
Two copies of this form for each of your schoolsenrolling children in grades 9-12 are included. Ifit is possible to complete 5a do NOT use this form.(pink stock, mimeo)
6a. POST-SECONDARY EDUCATION
One set of these materials is included for each ofyour schools with a twelfth grade class. The com-ments made in 5a above apply here. (yellow stock,ditto)
6b. POST-SECONDARY EDUCATION ALTERNATE FORM
Two copies of this form are included for each of yourschools with a twelfth grade class. If it is possibleto complete 6a do NOT use this form. (yellow stock,mimeo)
7. NON-REIMBURSED PROGRAMS
One set of this form is included for each school cor-poration. At the present time it appears we canobtain all necessary information regarding reimbursedprograms from Indianapolis. (blue stock, mimeo)
8. TEACHER'S FORM (Grades 7-12)
This form is to be completed by each teacher, coun-selor and administrator working with students ingrades 7-12. (white stock, mimeo)
9. STUDENT OCCUPATIONAL INTEREST INVENTORY
This form is to be completed by each student in yourcorporation enrolled in grades 9 and 11. (whitestock, offset)

EXHIBIT XII -A, con't.
10. PARENT QUESTIONNAIRE
This form is to be completed by as many of theparent's as possible of students enrolled in grades4, 8, and 10. (white stock, offset)
11. GRADUATING CLASS OF 1965 ADDRESSES
Please provide the best possible current addressesfor your 1965 graduates. To the left of the addressplease indicate the graduate's place in his graduat-ing class as cA = Top 25%
1B = Middle 50%tg = Bottom 25y0
Fred GannonExample: Box 307
C Crawfordsville,Palan61212221_(white stock, mimeo)
12. CLASS OF 1965 QUESTIONNAIRE and LETTER
For information only--no action required by the schoolcorporation.
13. NEWS RELEASE
Action by the school corporation optional.

EXHIBIT XII-B
1972 WEST CENTRAL INDIANAVOCATIONAL AND TECHNICAL EDUCATION SURVEY
CORPORATION FINANCIAL CHARACTERISTICS
School
Form
Corporation:
Completed by:_ Dates
1. ADJUSTED Assessed Valuation 1972 Budget 1.
2. Average Daily Attendance (1-12) 1971-72(fall 1971, Form 30) 2.
3. ADJUSTED Assessed Valuation per ADA 1971-72 3.
SCHOOL TAX RATES 1972 Budget
4. General Fund 4.
5. Debt Service 5.
6. Cumulative Building 6.
7. TOTAL 7.
8. General Fund Rate Ceiling ($4.95 adjusted)1972 Budget 8.
* * * * * * * * * * * * * * * * * * * * * * * *
9. ADJUSTED Assessed Valuation 1973 Budget 9.
10. Average Daily Attendance (1-12 includingspecial education) 1972-73 (fall 1972,Form 30) 10.
11. ADJUSTED Assessed Valuation per ADA 1972-73 11.
* * * * * * * * * * * * * * * * * * * * * * * *SCHOOL TAX RATES 1973 Budget
12. General Fund 12.
13. Debt Service 13.
14. Cumulative Building 14.
15. TOTAL 15.
16. General Fund Rate Ceiling (4.95 adjusted)1973 Budget 16.

EXHIBIT XII-Ca
1972 WEST CENTRAL INDIANAVOCATIONAL AND TECHNICAL EDUCATION SURVEY
Grades 1-6 Fall Enrollments by Year
School
Address
School Corporation
Form Completed by.
GRADES
SchoolYear
1972-73
1971-72
1970-71
1969-70
1968- 11169
1967-68
1966-67
1965-66
1 2 3 4 5 6
F M F F M F M F
1964-65
1963-64
Comments:
Please note any circumstances which may have an effect on thegrades 1-6 school population during the next five years.(i.e., changes in employment opportunities, housing develop-ments, etc.)

EXHIBIT XII -Cb
1972 WEST CENTRAL INDIANAVOCATIONAL AND TECHNICAL EDUCATION SURVEY
Grades 7-9 Fall Enrollments by Year
School
Address
School Corporation
Form Completed by
GRADES
8
School Year
1972-73
1971-72
1970-71
1969-70
1968-69
1967-68
1966-67
1965-66
1964-65
1963-64
Comments:
7 9
Male Female Male Female Male Female
Please note any circumstances which may have an effect onthe grades 7-9 school population during the next five years(i.e., changes in employment opportunities, housing develop-ments, etc.)

EXHIBIT XII-Cc
1972 WEST CENTRAL INDIANAVOCATIONAL AND TECHNICAL EDUCATION SURVEY
Grades 10-12 Fall Enrollments by Year
School
Address
School Corporation
Form Completed by
School Year
1972-73
1971-72
1970-71
1969-70
1968-69
1967-68
1966-67
1965-66
1964-65
1963-64
Comments:
GRADES
10 11
Male Female Male Female
12
Male Female
AO.
rm.11.
AmmEMMMIIIM1160111
Please note any circumstances which may have an effect onthe grades 10-12 school population during the next five years(i.e., changes in employment opportunities, housing develop-ments, etc.)

EX1IBIT XII -La
1972 WEST CENTRAL INDIANAVOCATIONAL AND TECHNICAL EDUCATION SURVEY
SECONDARY DROP-OUTS (9-12) for Academic Years1967-68, 1968-69, 1969-70, 1970-71 and 1971-72
Please enter the requested information on the attached sheetsfor each of your students in grades 9-12 who has CEASED hisformal education prior to graduation. Please, DO NOT INCLUDESTUDENTS WHO HAVE TRANFERRED to another secondary school.
In column:
A = student's name
B = student's sex (M or F)
C = academic year during which the student withdrew(i.e., 1968-1969)
D = student's grade placement at time of withdrawal(i.e., 9, 10, 11, 12)
E = student's grade point average at time of withdrawal(i.e., A, B etc. or 85, 90 etc.)
F = reason why student withdrew (if possible, pleaseindicate more than "lack of interest," "failing," etc.)
G = what is the student now doing (i.e., housewife, farmlabor, unemployed, salesman, etc.)?
THANK YOU
If there are questions, please contact:
Fred GannonNew Educational DirectionsBox 307Crawfordsville, Indiana 47933
(317) 362-8877

EXHIBIT XII -Da, con't.
1972 WEST CENTRAL INDIANAVOCATIONAL AND TECHNICAL EDUCATION SURVEY
SECONDARY DROP-OUTS (9-12) for Academic Years1967-68, 1968-69, 1969-70, 1970-71, and 1971-72
School: Address:
SchoolCorporation: Completed by:
A B C D E FAcademic
Student Name Sex Year Grade GPA Reason
G
Present Status

EXHIBIT XII -Db
ALTERNATE FORM
1972 WEST CENTRAL INDIANAVOCATIONAL AND TECHNICAL EDUCATION SURVEY
SECONDARY DROP-OUTSfor Academic Years
1967-68, 1968-69, 1969-70, 1970-71 and 1971-72
Schools Address:
School Corporation: Completed by:
Please enter the requested information below for each of yourstudents in grades 9-12 who has CEASED his formal educationprior to graduation. Please, DO NOT INCLUDE STUDENTS WHO HAVETRANSFERRED to another secondary school.
AcademicYear Grade
1967-68 91967-68 101967-68 111967-68 12
1968-69 91968-69 101968-69 111968-69 12
1969-70 91969-70 101969-70 111969-70 12
1970-71 91970-71 101970-71 111970-71 12
1971-72 91971-72 101971-72 111971-72 12
Number of Number of FallMales Females Enrollment

EXHIBIT XII -Ea
1972 WEST CENTRAL INDIANAVOCATIONAL AND TECHNICAL EDUCATION SURVEYHigh School Graduates ENTERING Programs of
POST-SECONDARY EDUCATIONClasses of 1968, 1969, 1970, 1971 and 1972
CO Please enter the requested information on the attachedL sheets for each of your graduates during the past fiveU years who have entered a program of any form of post-M secondary training.N
A = student's nameB = student's sex (M or F)C = student's graduating class (i.e., 1968)D = if the student's rank-in-class was:
1. top 25% enter H2. middle 50% enter m3. lower 25% enter L
E = please code the type of post-secondary education programthe student entered as:
7 - four year academic program6 - two or three year academic program including RN5 - two or three year vocational/technical program4 - one year vocational/technical program3 - less than one year vocational/technical program2 - apprentice program1 - other
F = Did the student drop out of his program prior to completion?
If yes, enter YIf no, enter N
If N is entered for column F, do NOT enter anything incolumns G, H, and I.
If Y is entered for column F, please indicate ins
Column G - At what point did the student drop (i.e.,during first year, after second year, etc.)?
Column E - Why did he drop (i.e., academic difficulties,service, etc.)?
Column I - What is the student now doing (i.e., housewife,unemployed, salesman, etc.)?
THANK YOUIf there are questions, please contact:
Fred GannonNew Educational DirectionsBox 307Crawfordsville, Indiana 47933(317) 362-8877

EXHIBIT XII -Ea, con't.
page of
1972 WEST CENTRAL INDIANAVOCATIONAL AND TECHNICAL EDUCATION SURVEYHigh School Graduates ENTERING Programs of
POST-SECONDARY EDUCATIONClasses of 1968, 1969, 1970, 1971 and 1972
A B Ci OF TYPEH.S. POST-
SEX GRAD. GRAD. SEC. PRESENTSTUDENT'S NAME M-F CLASS CLASS E 4 DROP? WHEN? WHY? STATUS?
1

EXHIBIT XII -Eb
ALTFR_NATE FORM
1972 WEST CENTRAL INDIANAVOCATIONAL AND TECHNICAL EDUCATION SURVEY
POST-SECONDARY EDUCATION for Academic Years1967-68, 1968-69, 1969-70, 1970-71 and 1971-72
School: Address:
School Corporation: Completed by:
FOUR YEAR (or more) PROGRAMS,Year Total Entered Dropped out after
Graduated Graduated School 1 yr. 2 yr., 3 yr. 4 yr,, Graduated
1968
1969
1970
1971
1972
ALL OTHER PROGRAMSYear Entered Dropped
Graduated School Out Completed
1968
1969
1970 --
1971
1972

EXHIBIT XII -F
1972 WEST CENTRAL INDIANAVOCATIONAL AND TECHNICAL EDUCATION SURVEY
NON-REIMBURSED PROGRAMS
Please list below all vocational, pre-vocational, orexploratory courses offered in grades 7-12 or for adultsduring the current school year (fall and spring semesters aswell as summer session) BUT FOR WHICH YOUR SCHOOL CORPORATIONDOES NOT RECEIVE REIMBURSEMENT FROM THE DIVISION OF VOCATIONALEDUCATION.
School: Address:
School Corporation:
Form Completed by: Title:
Type of popu-Course lation served
objective (i.e., adult, 1972-73 DurationCourse Grade(s) (one general, spe- Enroll- of courseTitle Enrolled sentence) cial ed. etc.) ment (in hrs.)

NON-REIMBURSED PROGRAMS
Courseobjective
Course Grade(s) (oneTitle Enrolled sentence)
EXHIBIT XII-F, con't.
page of
Type of popu-lation served(i.e., adult, 1972-73 Durationgeneral, spe- Enroll- Of coursecial ed. etc.) went (in hrs.)

XII -18
All teachers, administrators, and counselors in theseventeen participating corporations who work with studentsin grades 7 through 12 were requested to complete a "Teacher'sForm" (Exhibit XII-G). In addition, students in grades 9and 11 were asked to complete the "Student Occupational Inter-est Inventory" (Exhibit XII-H) and parents with students ingrades 4, 8, or 10 were provided the opportunity to completea "Parents' Questionnaire" (Exhibit XII-I). All of the infor-mation gathered through these three instruments are self-report data. Self'- report data are important because theysample the base from which people operate in their day-to-dayliving. Furthermore, there are cross-validations of somepoints built into this study. To illustrate, statements sevenand eight of the "Teacher's Form" are intended to provide acheck on items 13 and 14 of the "Student Occupational InterestInventory."
Teacher S 7:
SOII I 13:
Teacher S 8:
Students are generally aware of the varietyof career choices open to them by the timethey graduate from our high school.
I feel I am well informed about the numloer,of careers (jobs) open to me.
Students generally have a realistic pictureof the training requirements for the variouscareer choices open to them by the timethey graduate from our high school.
SOLI I 14: I am well informed about what training oreducation is required for various careers17617,7717 which I am interested.
The statements in the "Teacher's Form" are positive. Ingeneral, the "neither agree nor disagree" response can beinterpreted as either an unwillingness on the part of theindividual to commit himself to a "stand" on the area coveredin the statement or it is selected as an alternative toomitting a response when the teacher feels his knowledge ofthe circumstances described is too inadequate to select oneof the more definite alternatives.

EXHIBIT XII-G
1972 WEST CENTRAL INDIANAVOCATIONAL AND TECHNICAL EDUCATION SURVEY
TEACHER'S FORM (Grades 7-12)
School__
Grade(s) Taught
Dear Teacher:
Subject(s) Taught
Years as a teacher
A survey is now undertalay in an eight-countyarea in this part of the state to study thepresent and future needs for vocational andtechnical educations As professional educatorsdaily working win the adolescents of the areayour opinions can represent a positiVe contri-bution to the study. If you have additionalcomments pleas-.: add them. Such corn-,ments will be appreciated and will, log read
Please place a check () before the responsewhich best describes your reaction to each ofthe following statements. Thank you!
1. Virtually all high school students need assistance withcareer planning.____agree __disagree neither agree nor disagree
2. Providing high school career training opportunities isas essential as providing post-secondary career trainingopportunities.
agree ____disagree neither agree nor disagree
3. I have done my share of the total job of career trainingfor our students.
agree disagree neither agree nor disagree
4. I am aware of the role vocational/technical education canplay in career training.
agree disagree neither agree nor disagree
5. Our total school program is adequately providing careertraining for those not continuing their education afterhigh school.
agree _disagree _neither agree nor disagree
6. Our total school programtraining for those whoafter high school.
agree __disagree
7. Students arechoices opetihigh school.
agree
is adequately providing careertll continue their education
neither agree nor disagree
generally aware of the variety ofto them by the time they graduate
disagree neither agree nor
careerfrom our
disagree

EXHIBIT XII-G, conc't.
8. Students generally have a realistic picture of the train-= requirements for the various career choices open tothem by the time they graduate from our high school.
agree disagree neither agree nor disagree
9. Students generally hold a realistic career goal by thetime they graduate from our high school.
agree disagree neither agree nor disagree
10. There is value in incorporating job placement servicesas a part of high school career training.
agree disagree neither agree nor disagree
11. The program offered by our school which is MOST effectivein preparing students for the NEXT PHASE of their lives is:
commercial coursesgeneral coursesguidance services
other
vocational coursescollege preparatory coursesextra curricular activities
ADDITIONAL COMMENTS (Use reverse side if additional spaceis required):

During the processing of the "Student Occupational Inter-est Inventory" (SOII) the following procedures were applied.
Item 6: Multiple responses were recorded as omit. Industrialart and home economics were recorded as vocational-technical.
Item 7: "The occupation I think I would like to enter uponcompletion of my education issStudent responses to this item were placed into oneof the following twelve categories.
CATEGORX SA/0,E all - inclusive)
1. PROFESSIONAL Lawyer, engineer, teacher, regis-tered nurse, CPA, pilot.
2. BUSINESS ANDSALES
3. CLERICAL ANDOFFICE
4. SKILLED
5. SERVICE
6. FARMING ANDAGRICULTURE
7. LABOR
Retail management, insurance agent,banker.
Typist, secretary, shipping clerk,bank teller, cashier, bookkeeper.
Laboratory technician, electri-tian, practical nurse, foreman,stewardess, barber.
Guard, military, police, ranger,conservation officer, postalservice.
Florist, greenskeeper, farming(includes direct support servicessuch as equipment and supplysales).
Waitress, store clerk, nurse'saide.
8. ENTERTAINMENT Radio, television, stage (performeror production).
9. MARRIAGE
10. OTHER
11. UNDECIDED
12. OMIT
Full-time housewife.
Noted but unclassifiable (i.e.,self-employed or the name of acompany).
Multiple responses were alsoplaced in this category.
No response.

XII-22
Item 8: Most "other" responses fit one of the standard cate-gories. The most frequent exception to this was theresponse "Bible School" and this response was classi-fied "other" unless it was stated two-year or four-year in which case it was recorded in the "Juniorcollege" or "Four-year college" category. Multipleresponses were classified as "have not yet decided.'
Items 9 - 15: Multiple responses were recorded as omit.
Item 16: Multiple responses were accepted and recorded. Themost frequent responses to "other" were
siblingsreadingpractitionerscareer daysother relatives (aunts, uncles, etc.)self-researchtelevision.
Item 17: Only C responses were recorded. More than oneresponse was accepted.
Item 18: Only responses ranked as a first choice wererecorded.

XII-24
During the pAcessing of the "Parents' Questionnaire"the following procedures were applied.
Item 2: "In what occupation are you presently engaged?Father Mother
Parent responses to this item were placed into oneof the following ten categories.
MUM1. PROFESSIONAL
2. BUSINESS ANDSALES
3. CLERICAL ANDOFFICE
4. SKILLED
5. SERVICE
6. FARMING ANDAGRICULTURE
7. LABOR
8. HOUSEWIFE
9. OTHER
SAMPLE RESPONSES (NOT all - inclusive]
Lawyer, engineer, teacher, regis-tered nurse, CPA, pilot.
Retail management, insurance agent,banker.
Typist, secretary, shipping clerk,bank teller, cashier, bookkeeper.
Laboratory technician, electri-tian, practical nurse, foreman,beautician, plumber, cook.
Guard, military, police, ranger,conservation officer, postalservice.
Florist, greenskeeper, farming(includes direct support servicessuch as equipment and supply sales).
Waitress, store clerk, nurse'saide, machine operator.
Mother, homemaker, housewife (ifa response was, for example, house-wife-secretary, the individual wasclassified as "Clerical and Office").
Noted but unclassifiable (i.e.,self-employed or the name of acompany), multiple responses (i.e.,trucker-farmer).
10. OMIT No response, unemployed, welfare,deceased.
Items 3, 4, 5, and 6: Multiple responses were recorded asomit. The most frequently expressed reasons forencouraging children to enroll in vocational-techni-cal courses (item 5) fell into the following cate-gories:
(a) in lieu of college(b) skill development(c) employability.

XII -26
The most common reasons indicated for a no responseto item 5 were "college as the only choice,' "expenseof the program*" and "present facilities are notadequately used."
Item 7: The most commonly indicated responses for the ''other"classification were short-term specialized programsin the evening and scheduling to accomodate shiftworkers.
Item 8: Only responses ranked as first and second choiceswere recorded and no distinction was made between afirst and a second choice.
Exhibit XII-J is the form on which schools were requestedto report addresses for their 1965 graduates. Exhibit XII-Kis the initial covering letter which was sent to 1965 graduateswith the "Class of 1965 Survey" form (Exhibit XII-L) andExhibit XII.41 is a copy of a follow-up letter sent to non-responding graduates three to eight weeks after the initialmailing. During the processing of the "Class of 1965 Survey"all multiple responses were recorded as "omits."
Exhibit XII-N was provided for those corporations whodesired to alert the local (lommunity to the survey and toprovide the general community an opportunity to give inputfor the study. Only ten responses were received on the basisof this approach.
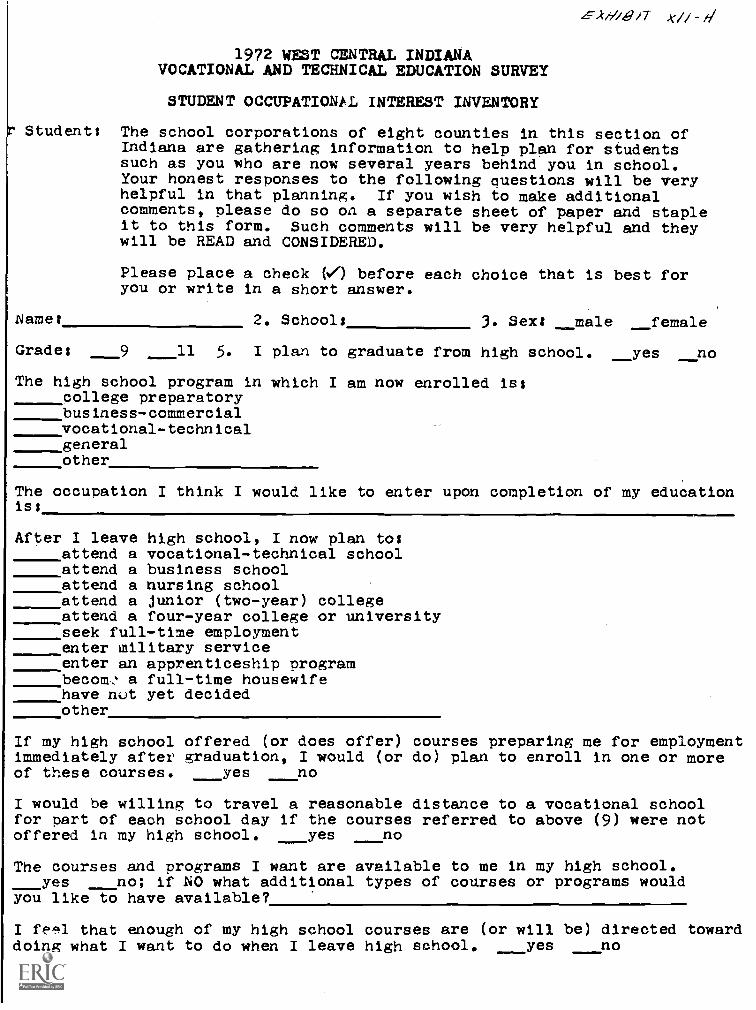
z--,t///g/T
1972 WEST CENTRAL INDIANAVOCATIONAL AND TECHNICAL EDUCATION SURVEY
STUDENT OCCUPATIONAL, INTEREST INVENTORY
Students The school corporations of eight counties in this section ofIndiana are gathering information to help plan for studentssuch as you who are now several years behind you in school.Your honest responses to the following questions will be veryhelpful in that planning. If you wish to make additionalcomments, please do so oz a separate sheet of paper and stapleit to this form. Such comments will be very helpful and theywill be READ and CONSIDERED.
Please place a check 6 before each choice that is best foryou or write in a short answer.
Name: 2. Schools 3. Sexs male female
Grades 9 11 5. I plan to graduate from high school. yes no
The high school program in which I am now enrolled isscollege preparatorybusiness-commercialvocational-technicalgeneralother
The occupation I think I would like to enter upon completion of my educationiss
After I leave high school, I now plan tooattend a vocational-technical schoolattend a business schoolattend a nursing schoolattend a junior (two-year) collegeattend a four-year college or universityseek full-time employmententer military serviceenter an apprenticeship programbecom: a full-time housewifehave not yet decidedother
If my high school offered (or does offer) courses preparing me for employmentimmediately after graduation, I would (or do) plan to enroll in one or moreof these courses. yes no
I would be willing to travel a reasonable distance to a vocational schoolfor part of each school day if the courses referred to above (9) were notoffered in my high school. yes no
The courses and programs I want are available to me in my high school.yes no; if NO what additional types of courses or programs would
you like to have available?
I fec1 that enough of my high school courses are (or will be) directed towarddoing what I want to do when I leave high school, yes no
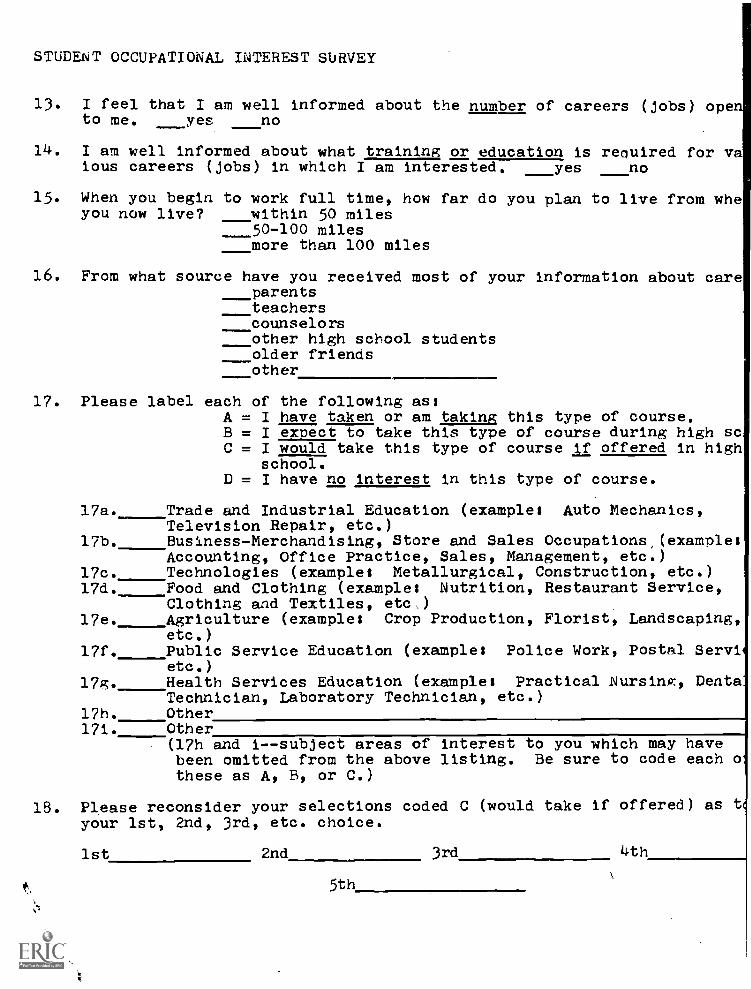
STUDENT OCCUPATIONAL INTEREST SURVEY
13. I feel that I am well informed about the number of careers (jobs) opeto me. yes no
14. I am well informed about what training or education is required for vasous careers (jobs) in which I am interested. yes no
15. When you begin to work full time, how far do you plan to live from wheyou now live? within 50 miles
50-100 milesmore than 100 miles
16. From what source have you received most of your information about careparentsteacherscounselorsother high school studentsolder friendsother
17. Please label each of the following assA = I have taken or am taking this type of course.B = I expect to take this type of course during high scC = I would take this type of course if offered in high
school.D = I have no interest in this type of course.
17a. Trade and Industrial Education (examples Auto Mechanics,Television Repair, etc.)
17b. Business-Merchandising, Store and Sales Occupationsiexample:Accounting, Office Practice, Sales, Management, etc.)
17c. Technologies (examples Metallurgical, Construction, etc.)17d. Food and Clothing (example: Nutrition, Restaurant Service,
Clothing and Textiles, etc..)17e. Agriculture (examples Crop Production, Florist, Landscaping,
etc.)17f. Public Service Education (examples Police Work, Postal Servi
etc.)17g. Health Services Education (examples Practical Nursing, Denta
Technician, Laboratory Technician, etc.)17h. Other171. Other
(17h and 1--subject areas of interest to you which may havebeen omitted from the above listing. Be sure to code each othese as A, B, or C.)
18. Please reconsider your selections coded C (would take if offered) asyour 1st, 2nd, 3rd, etc. choice.
1st 2nd 3rd
5th
4th

BEST COPY AVAILABLE
19?2 WEST CENTRAL IND/AWAVOCATIONAL AND TECHNICAL EDUCATZON SURVEY
PARENTS' QUESTIONNAIRE
Dear Parents&
A survey is now under way by the schools of eight counties in this area to studythe present and future needs and resources for vocational and technical educa-tion to best serve you and your children. You are invited to participate in thisStudy and to express your viewpoints by completing the following questionnaire'/MMEDIATELY and having your child return it to his or her teacher.
am outcome of this study could be an area vocational school. The psi -nary unction of such an area aohool would be to provide high school juniors andseniors with a large variety of specialized courses intended to prepare them tolinter the working world immediately after graduation with a special skill or ;
trade. In most oases the student would attend the area school for a half daywith the other half day spent in his or her home school activities. An areavocational school could also proftde training for high school drop -outs, recentgraduates, and other adults who would like to improve their current skills orearn new skills to be eligible for a different job.
Any additional comments you may wishto make concerning vocational and technicaleducattod for this area may be made on a separate sheet of paper and stapled tothis questionnaire. Such comments will be appreciated and xjalba read and 0411"sidered. THANK YOU for the time and thought you will put into completing thisquestionnaire. Your responses will contribute much to this project and are Oh-cerely appreciated.
1. Number of childrens below school age, in grades 1-8, ...in grades9-12, above sohodnige.
2. In what occupation are you presently engaged?Father Mother
3. Do you believe thers is a need for additional vooational/teohnical educationin this area? __yes no
'4. Do you believe there is a need for an area vooational/teohnioal school asdescribed above? yes no
'5. Would you encourage your children to enroll for courses in an area vooationaltechnical school if it is available when they are high school juniors andseniors? yes no Why?
Would you be interested in an adult class to improve your occupationalskills? Fathers ...yes no Mothers yes ...no
If your answer todesire?Zahn of e
(a)(b)
(d)
(e)
Cr)
VIIMII.INEOPTIMOM
(6) above is YES, what type of program would you most
ZR2 ana day school vocational-technical courses.
Vocational technical classes held in the evening.Comprehensive high school program (academic plus some vocational courses)Cooperative school-work program (parttime in school; parttime at work).Short-term (1-6 weeks) specialized vocational or technicalprogram during the day.Other

PARENTS° QUESTIONNAIRE -2-
8. If your answer to (6) above is YES, please indicate yoL:r inte-rast xn any ofthe following occupational areas ILI which you would like to attend a train-ing program. If you have more than one choice, nlease maIrk th<rm 2, 3,etc. in order of you-- preference. If an area In which you eiaveis not listed, please add it in the blanks provided.
rotheT ?ether
1. Accounting or Bookkeeping
2. Agricultural Machinery Technology
3. Agriculvaral Soles and Service
C. Appliance Repair
5. Auto Mechanics and Truck Mechanics(non-diesel)
6. Br-dy Repair and nervice
7. Aircreft f:`CflE.tJiCS
5. BLauZy Ct.tur.?., Barbering
0. Building Maintenance
10. Business :leonine Oc:cration
11. Carpentry
12. Child Care
13. Corm(trcial and Advertising Art
1, Cc.liter 1=rn.gran;mine and Operation
15. Co.,;74ter Rep,Ar w..d Maintenance
p.nd iini7.tenance Service
17. T--..-c!iess!na or i'-:,'.inch
n- a.lo,1 Technology
20. Drart'..nA on-
21. 711,:trical Arpllance Repair
22. rloctrioii.y
23. Elzotronlcs T-Ichntlogy
2. Operaticn and Management
,,
an,!. Service
2-.
28. L7:,,,I.th At
29. 1-eavy Machinery Opere'.1on
30. Feavy :7ac::1:,cry Repair andMeintenanee
s.-:"een%ousc tirvxe..;:ment
Mother Father
31. Laboratory Technician
32. Landscaping and Horticulture
33. Law Enforcement
34. Licensed Practical Nursing
35. Machine Shop Trades
36. Masonry-Cement. Tile, Brick
37. Office--Typist, ReceptionistFile Cler
38. Chios Managerant and Sups
39. Painting and Finishing
4o. Plartertng
41. Plumbing and Heating
42. .Prectical Nursing
43. Printing Tr*".es
44. Radio end Television Repair
45. Retailing (Store and SalesOcoupations)
46. Refrigeration and Air Condi
47. Secretarial or Stenographic
48. 8±74et metal Work
49. Sma11 Engine Repair
50. Textile Fabrication (ClothManufacture and Rape
Tool and Die Work
Truoking end Truck Driving
Upholstering
Welding
Woodworking and Cabinetry
51.
52.
53.
51.0.
55.
56.
57.
58.
59.
GO.
GRADUATING CLASS OF 1965Page of
EXHIBIT XII-J

NEW EDU ATIONAL DIRECTIONSBowker Gannon and Associates Education Projects
BOX 307 CRAWFORDSVILLE, INDIANA 47933 (317) 362-8877
November 15, 1972
Dear 1965 Graduate:
School corporations of eight counties in west centralIndiana are gathering information to help them plan forserving the youth and adults of the community.
It has been more than seven years since you graduatedfrom high school and we need the benefit of your experience.With YOUR HELP this study can prove valuable in improving andexpanding educational and occupational training programs tomeet the area's increasing demando for trained and skilledworkers. Won't you share your experience with us to helptomorrow's workers?
Please complete the enclosed questionnaire TODAY byfilling in the blanks or making a check ( as appropriateand mailing it in the enclosed postage paid envelope imme-diately.
If you wish to make additional comments, please do soon the back of the enclosed form. Such comments will be veryhelpful and they will be READ and CONSIDERED.
Thank you for your cooperation!
Sincerely,
F. B. GannonExecutive Director
FBG:jt
P.S. Your graduating class is the only one being surveyedso YOUR individual RESPONSE is EXTREMELY IMPORTANT.

EXHIBIT XII -L
1972 WEST CENTRAL INDIANAVOCATIONAL AND TECHNICAL EDUCATION SURVEY
GRADUATING CLASS OF 1965 SURVEY
PLEASE GIVE INDIANA"S FUTUREWORKERS 10 MINUTES OF YOUR
TIME R_GHT NOWt
1. I graduated from High School.
2. I am: male female.
3. I am: single married separated divorced
4. In high school I took a ( general college preparatory____vocational commercial other) course.
5. I am presently employed. yes no
If yes: 5a. full time part time5b. Where are you now working?
county, state5c. What is the title of the job or the kind
of work you do?5d. In general, how do you feel about your job?
satisfied dissatisfied neithersatisfied nor dilgatisfied. Why?
5e. Did your high school prepare you for thisjob? ____yes no
5f. What was the MOST helpful aspect of yourhigh school experience in preparing forwork? academic classes commercialclasses vocational classes sports
social activities extracurricularactivities other (
5g. What was the LEAST helpful aspect of yourhigh school experience in preparing forwork? academic classes commercialclasses vocational classes sports
social activities extracurricularactivities other (----
5h. Would further education or training helpyou to improve your skills or to get abetter position? yes no
51. What additional skills do you wish you had?
5j. Are you now taking part-time classes relatedto your job? yes no
5k. Are you now taking part-time classes NOTrelated to your job? yes no

EXHIBIT XII-L, con't.
GRADUATING CLASS OF 1965 SURVEY
6. Since high school graduation, have you been enrolled inone of the following?
trade school such as beauty or barber schoolbusiness school
_four year in-state college or university such asIndiana State, Ball State, Purduefour year in-state private college or university suchas DePauw, Franklin, or Wabashin-state junior college such as Vincennes Universityfour year out-of-state college or university
_,_.out -of -state junior collegeIndiana Vocational Technical College (IVY TECH)private in-state technical school such as Lincoln Techprivate out-of ..state technical schoolhospital nursing program such as Methodist Hospital- -Indianapolisunion apprentice programother ..1.1111=111C
7. Did you or will you receive a ( one year two year____three year four year) certificate or degree?
8. Whether ynu are employed or unemployed, would you now beinterested in attending a training program to improveyour occupational skills? yes no
9. If your answer to (8) above is YES, would you be willingto travel a reasonable distance to an area school ifnecessary? yes no
10. If your answer to (8) above is YES, what type of classeswould you prefer?
regular vocational/technical day schoolvocational/technical classes held in the eveningcomprehensive high school program (academic plussome vocational/technical classes) held in theeveningcooperative school-work program (part time in schooland part time in employment)short term (2-6 weeks) specialized vocational ortechnical program during the day.other (
THANK YOU for your time and thought.

EXHIBIT XII-M
NEW EDU ATIONAL DIRECTIONSBowker Gannon and Associates Education Projects
BOX 307 CRAWFORDSVILLE, INDIANA 47933 (317) 362-8877
Dear 1965 Graduate:Some weeks ago you received the enclosed materials.
Because of the importance of your responses to the enclosedquestionnaire I am taking the liberty of sending you a secondset of materials.
To adequately )1an for the young men and women who willbe entering the world of work in the future we must know whata substantial number of you are cow doing and how well yourhigh school prepared you for the next step (work, college,technical school, etc.) after you graduated.
Please take a few moments right now to share your thoughtswith us. Thank you very much for your time and cooperation.
Sincerely,
F. B. GannonFBG:sr Executive Director
You may be interested in the school corporations coop-erating in this effort. They are:
1. Western Boone County Community School District2. Lebanon Community School Corporation3. Clay Community Schools4. Attica Consolidated School Corporation5. Covington Community School Corporation6. Southeast Fountain School Corporation7. North Montgomery Community School Corporation8. South Montgomery Community School Corporation9. Crawfordsville Community Schools
10. Rockville Consolidated Schools11. Turkey Run Consolidated School District12. South Putnam Community Schools13. North Putnam Community Schools14. Cloverdale Community Schools15. Greencastle Community Schools16. South Vermillion Community School Corporation17. MSD of Warren County

EXHIBIT XII -N
1972 WEST CENTRAL INDIANAVOCATIONAL AND TECHNICAL EDUCATION SURVEY
News Release
PLEASE GIVE INDIANA'S FUTUREWORKERS 10 MINUTES OF YOUR
TIME RIGHT NOW)
A survey is now under way by the schools in eight counties
of this area of Indiana to study the present and future needs
and resources for vocational and technical education to best
serve this community. You are invited to participate in this
study and to express your viewpoints by completing the follow-
ing questionnaire IMMEDIATELY and mailing it to:
SURVEYBox 307Crawfordsville, Indiana 47933
One possible outcome of this study could be an area
vocational school. The primary purpose of such an area
school would be to provide skilled and trained workers for
the community. It also would provide high school juniors
and seniors with a large variety of specialized courses
intended to prepare them to enter the working world immediately
after graduation with special skills or trades. In most cases,
students would attend the area school for a half day with
the other half day spent in their home high school where they
would take the academic courses necessary for graduation and
participate in other school activities. An area vocational
school could also provide training for high school drop-outs,
recent graduates, and other adults in the community who
would like to improve their current skills or learn new
skills to be eligible for a different job.