canterbury earthquakes 2010-2012: insurance supervision in the
TRANSCRIPT

Canterbury earthquakes 2010-2012: Insurance supervision in the first 2 years Robert Cole
Presented to the NZSA Conference 2012, 1821 November
A brief summary of insurance supervision by the Reserve Bank of New Zealand (“the Bank”)
which directly related to the Canterbury earthquakes of 20102012, during the first 2 years
after the 4 September 2010 earthquake. This period coincided with the commencement of
a three year transition period for the establishment of prudential supervision of insurers in
New Zealand, under the Insurance (Prudential Supervision) Act 2010 (“the Act”). Policy
impacts and considerations relating to the Canterbury earthquakes are excluded.
Introduction
The Canterbury earthquakes of 20102012 are the most significant natural disaster to affect
New Zealand for the past 80 years. New Zealand is fortunate that the levels and rate of
takeup of earthquake insurance coverage are currently extremely high by global standards.
As a result, a substantial proportion of costs will be funded by insurance, and in turn shared
globally by reinsurance. The combined insurance claims costs are equivalent to a top 5 most
expensive insurance event to have occurred anywhere in the world. The impact on the New
Zealand insurance industry is enormous and the aftereffects will be felt for many years.
The first earthquake in the 20102012 Canterbury earthquake sequence, on 4 September
2010, almost exactly coincided with enactment of the Insurance (Prudential Supervision) Act
2010 (“the Act”). This was the commencement of insurance supervision by the Bank,
replacing the lighthanded regime previously in place (in which the Bank had no role).
The Earthquake Commission (“EQC”) is exempted from the insurance prudential regime, and
is therefore not supervised by the Bank. However, any analysis of the insurance sector
involving the Canterbury earthquakes has to take EQC into account due to their large share
of total claims costs, and also significant interaction effects between EQC and other insurers
in respect of residential property claims.
This paper discusses some of the supervisory impacts and considerations relating to the
earthquakes in the first two years.

2
1 Before the Canterbury earthquakes
Until late 2010, insurance supervision in New Zealand was fragmented and very light
handed by international standards. There had been no recent signs of major distress in the
insurance industry and it had been many years since the last insurer failure.
Following several reviews of the sector over several years, the Insurance (Prudential
Supervision) Bill 2010 was prepared. This legislation provided for the Bank to become
regulator and supervisor of all New Zealand insurers (as defined) except for exempted
Government owned insurers, such as ACC and EQC.
It had also been many years since the last major natural disaster in New Zealand. The
Earthquake Commission’s (EQC) largest events had been the 1968 Inangahua earthquake
with 10,500 claims1 and the 1987 Edgecumbe earthquake (when EQC covered commercial as
well as residential property) with claims costs of $135 million2 ($261 million in 2011 $).
EQC’s 460,000 Canterbury earthquake claims with an estimated cost of $12 billion are about
50 times bigger, in both claims volumes and costs, than any prior disaster they (or
predecessors) have dealt with.
The Insurance Council of New Zealand (ICNZ) reports the most costly event for its members,
prior to the Canterbury earthquakes, was the 1987 Edgecumbe earthquake with claims costs
of $192 million ($371 million in 2011 $)3. By comparison the ICNZ’s 2nd and 3rd most costly
events were 1968 Wahine storm at $221 million in 2011 $ and a tie between a 2004 storm
and 1984 Southland floods at $140 million in 2011 $. The Bank’s current estimate of claims
costs for insurers other than EQC, at $20 billion, are about 50 times bigger than the cost of
any prior disaster in 2011 $.
1 Earthquake Commission, “Briefing to the Incoming Minister”, December 2011
2 NZSEE Bulletin 26/4, “Changes to Disaster Insurance in New Zealand”, 1993
3 Insurance Council of New Zealand, http://icnz.org.nz/current/weather/, viewed 13 September 2012

3
2 The Canterbury earthquakes 20102012
Since the first and largest earthquake in the sequence on 4 September 2010, there have
been numerous aftershocks in and near to Christchurch. Figure 2.1 below, from GNS, shows
the location of the main earthquakes and aftershocks in relation to central Christchurch, and
by time period. The most significantly damaging earthquakes are briefly noted below.
Figure 2.1 – map of 20102012 Canterbury earthquakes
Source: GNS
2.1 Darfield 4 September 2010 (“CEQ1”)
At 4:35am on 4 September 2010 a M7.1 earthquake struck with epicentre near Darfield,
approximately 40km west of Christchurch. Despite the distance to Christchurch and the low
magnitude relative to “the big one” (M8+ earthquakes possible on the Alpine Fault, central
New Zealand and off the east coast of the North Island), there was significant damage in
central and eastern portions of Christchurch as well as in Kaiapoi and rural midCanterbury.
This was the first earthquake to cause substantial damage to a major New Zealand urban
area since the 1931 Hawke’s Bay earthquakes. There was no loss of life.
2.2 Lyttelton 22 February 2011 (“CEQ2”)
At 12:51pm on 22 February 2011 a M6.3 earthquake struck with epicentre near Lyttelton,
approximately 5km southeast of central Christchurch. 185 lives were lost, mostly from
falling masonry and the collapse of two large buildings (CTV and PGC) in the central city.
There was widespread damage in Christchurch, and this was much more severe than in
CEQ1.

4
2.3 Sumner 13 June 2011 (“CEQ3”)
At 2:20pm on 13 June 2011 a M6.4 earthquake struck with epicentre near Sumner, less than
10km southeast of central Christchurch. It was preceded by a M5.9 earthquake at 1:01pm.
CEQ3 caused further damage in central and eastern Christchurch.
2.4 Other earthquakes
Moderately damaging earthquakes occurred on 26 December 2010 (“Boxing Day EQ”),
which was located in central Christchurch, and on 23 December 2011 (“New Brighton EQ”),
which measured M6.0 and located just off the coast. These caused moderate damage.
2.5 Summary
EQC has declared 15 events in the first two years of the Canterbury earthquake sequence.
These incorporate grouping of aftershocks when these were within a period of several days.
Table 2.2 – date and earthquake magnitude of EQC events
Source: EQC & GNS
Damage, or cost of insurance claims, is not well correlated with the energy released by each
earthquake (see Box A below for a short explanation of how energy relates to earthquake
magnitude). This is because while energy is required to cause damage, there are other
factors that are also important in determining the extent of damage and its cost. These
other factors in the 20102012 Canterbury earthquake sequence included proximity to
urban area, changed vulnerability, closure of CBD red zone, etc.
Changed vulnerability for buildings is where the weakest were destroyed or heavily
damaged in an early earthquake, and consequently they were not able to be damaged
(much) further in later earthquakes. Conversely some buildings with little apparent damage
in an early earthquake were weakened and more susceptible to major damage in later
earthquakes. These effects are amongst issues being explored by the Canterbury
Earthquakes Royal Commission.
Box A – simple explanation of the relationship between earthquake magnitude and energy
An earthquake that is 2 magnitudes higher than another earthquake has 1,000 times the
energy of the lesser earthquake. Equivalently, a magnitude 7.0 earthquake has about 32
times the energy of a magnitude 6.0 earthquake; a magnitude 6.0 earthquake has about 32
time the energy of a magnitude 5.0 earthquake; and so on. In the case of the Moment
Magnitude Scale (denoted MW) this is an explicit and exact relationship. For other
measures, such as Richter Scale (denoted ML), this relationship is close but not exact.

5
Figure 2.3 – insurance claims costs are not proportional to earthquake energy
Source: GNS, EQC & other insurers4
Over 70% of the energy released in the 20102012 Canterbury earthquake sequence (to 3
September 2012) was for CEQ1 with about 10% each for CEQ2, CEQ3 and other. Note the
energy figures for CEQ1, CEQ2 and CEQ3 include all aftershocks and foreshocks that
occurred on the same day. For insurance claims costs, based on EQC’s published estimates
and private data supplied by other insurers, 5070% of costs are for CEQ2 with 2030% for
CEQ1, and 1020% for all other earthquakes (including CEQ3).
4 Throughout this paper, claims costs for insurers other than EQC are aggregated from private
information supplied to the Bank. The latest figures to 31 August 2012 are used. Ultimate figures are
not yet known and are subject to significant uncertainty.

6
3 New insurance regime The Darfield earthquake occurred on a Saturday. On the following Tuesday the Act received
royal assent, commencing the three year transition period for insurance supervision in New
Zealand. By 7 March 2012, all insurers were required to be licensed and this could be a full
licence, a provisional licence or a s245 runoff provisional licence. By 7 September 2013, all
continuing insurers must have a full licence. Various requirements for insurers, and
supervisory powers of the Bank, come into effect on various dates between September 2010
and 2013.
Therefore, when the Canterbury earthquakes occurred the prudential regime was not yet in
place and the primary focus of the Bank’s insurance supervisory team was on licensing.
Over 100 existing insurers required licences. Consequently, the Bank had little experience,
limited quality information available and stretched resources with which to respond to the
substantial stresses imposed on insurers. The phase in of various powers under the Act also
constrained some actions that might otherwise have been possible.
Compared with Australia and many other jurisdictions, the supervisory regime places more
emphasis on responsibility of insurers and their relevant officers (including directors), as
opposed to a more intrusive supervisory approach.

7
4 Supervision
4.1 Monitoring from 4 September 2010 to 21 February 2011
The general mood of the industry was that while the event was unexpected and large (a
large Wellington earthquake is normally viewed as the extreme exposure to earthquake risk
in New Zealand), no insurers had serious concerns about their capacity to deal with claims
financially or administratively.
Late in 2010 the Bank was consulting with insurers on catastrophe risk calibration for the
draft nonlife insurance solvency standard. An estimate of insurance claims costs for CEQ1
and the retention and limit of catastrophe reinsurance in place were included in the
questionnaire. The early CEQ claims costs estimates reported in the questionnaire were
typically under 10% of the limit of catastrophe reinsurance coverage, but for a few insurers
were between 25% and 45% of the limit.
4.2 Monitoring from 22 February 2011 to early March 2011
The initial media reporting clearly showed CEQ2 had much more severe impacts than CEQ1,
with many deaths and injuries (c.f. no deaths for CEQ1), and more substantial destruction. A
list of insurers that were potentially significantly impacted included property insurers, life
insurers, and other insurers based in Christchurch.
Life insurers were discounted from being materially impacted as information on fatalities,
and in particular of New Zealand residents, became known. For Christchurchbased
insurers, the Bank was sympathetic to requests for more time to provide licensing material
but otherwise acted the same as for insurers not based in Christchurch. Consistent with the
Bank’s role at the time, operational issues were not investigated – for example there was no
follow up of how well business continuity plans had worked in restoring operations and
minimising the effects of disruptions.
We monitored media reports and information directly provided by insurers on gross and net
claims estimates for insurers, reinsurers and total industry (by the Insurance Council of New
Zealand or reinsurance brokers). Some information was obtained from EQC and other
Government sources.
In this period, there was no systematic data collection from insurers, and nor was there any
modelling undertaken by the Bank of expected ultimate claims costs at industry or insurer
level. The view was that claims for private insurers (i.e. excluding EQC) were very likely to be
within reinsurance limits; and this view was primarily based on the earlier estimates of
Darfield earthquake claims costs being generally much less than 50% of reinsurance limits.
The limited progress achieved in assessing claims after CEQ1 and before CEQ2 struck later
created major complications in settling most claims. The costs of damage had to be
assigned to specific earthquakes since:
� earthquakes may fall into separate periods of cover;
� impacts of reinstatement wording affected the cover available for each event; and
� reinsurance recoveries are based on each event.

8
4.3 AMI & Western Pacific notification of distress early March 2011
For the purpose of this paper, except where explicitly stated otherwise AMI refers to “old
AMI” – i.e. Southern Response Earthquake Services Limited (formerly AMI Insurance
Limited), and not the “new AMI” that was purchased by IAG.
AMI was one of the largest nonlife domestic lines insurers in New Zealand, and being based
in Christchurch had an overweight exposure to the Canterbury earthquakes.
Closely following reports of 10,000 severely damaged houses in early March, AMI advised
that they might have insufficient capital and reinsurance to meet claims costs for CEQ2. As a
mutual insurer, there was no parent to call upon for capital support and no realistic means
to promptly raise a material amount of funds from its customer members or anyone else.
AMI requested Crown assistance.
The Bank rapidly developed a model to estimate the amount of shortfall of capital and
reinsurance to claims under various scenarios, and to quantify a plausible range. The
uncertainty was high because less than half of claims had been notified to AMI at that stage
due to the 90 day notification period for EQC. Additionally the claim amounts were unclear
due to the question of how EQC cover applies in respect of damage to the same property
from multiple earthquakes (see Box B below), and uncertainty on how much additional
damage may have occurred to previously damaged properties (referred to as changed
building vulnerability in section 2.5).
The Bank contributed relevant appropriate information for decisions around the eventual
Crown support package informed by discussions with AMI and reviews of estimates
prepared by AMI. On 7 April 2011 a Crown support package of $500 million was announced.
Box B - EQC cover for damage from multiple earthquakes For residential claims where there is an interaction between EQC cover and private
insurance, the cost allocations between earthquakes materially affect the share of total
costs borne by EQC.
As the situation of multiple disasters impacting upon the same area within a short period of
time had not occurred since the predecessor of EQC was established, there was initially
uncertainty as to how much EQC cover was available for second and subsequent damaging
events. Clarity on this question was obtained in September 2011 through a High Court
declaratory judgment5, which ruled EQC cover is reinstated in full following any claim (in
almost all circumstances). This had the effect of shifting several hundred million in claims
costs from private insurers to EQC because there was $100,000 cover for dwelling damage in
respect of each earthquake individually.
At the same time, Western Pacific advised that they had insufficient funds to make
payments required by the reinsurers before they would pay any further reinsurance
recoveries. Western Pacific requested Crown assistance the owners were unwilling or
unable to provide sufficient capital support.
5 http://jdo.justice.govt.nz/jdo/GetJudgment/?judgmentID=196363

9
As a very small insurer with a different mix of business to AMI, the modelling the Bank used
for AMI was not suitable for Western Pacific and a simpler approach was used for scenario
analysis. Various reports and documentation were reviewed by the Bank. Some relevant
information was provided as input to the Government’s decisionmaking.
No Crown support was offered to Western Pacific, and the directors appointed a liquidator
on 1 April 2011. The liquidators obtained funding for the reinsurance premium but soon
identified that CEQ1 and CEQ2 claims exceed reinsurance limits, and that amounts claimed
for nonearthquake claims far exceeds other realisable assets. The liquidation of Western
Pacific is still in progress at time of writing. Western Pacific was not issued a licence, and
consequently the Bank has had no supervision of this insurer.
An interesting development was the Western Pacific liquidators sought directions as to how
to apply reinsurance recoveries. The judgement6 was that creditors whose claims gave rise
to the recovery, along with liquidators’ costs and lending for the reinsurance premium, have
first call on recoveries. The judgement has already changed the actions of another insurer.
4.4 Monitoring from early March 2011
A basic risk assessment was conducted to identify which insurers had greater potential
vulnerability – using market share data, catastrophe reinsurance limits and previously
supplied information through the draft solvency standard quantitative impact studies.
Figure 4.1 illustrates an early simple screen (with made up data to protect confidentiality).
Figure 4.1 – an early simple screen for risk and size (with made up data)
To check if there may be distressed insurers in addition to AMI and Western Pacific, very
high level relevant information was sought from other property insurers. The results were
analysed and a “at risk” register established recording the insurers known to have issues or
thought to have potential for financial stress, along with an indication of the degree of
confidence in the assessment.
6 CIV20114851535

10
A monthly Canterbury earthquake return was established in April 2011 and continues to be
used. The return is deliberately simple to encourage prompt provision of information and to
reflect the limited resources the Bank has available to analyse the returns.
Based on discussions with insurers it was readily apparent that there was scope for initial
claims estimates to be significantly understated. The Bank attempted to ascertain the
degree of conservatism, particularly in respect of insurers prioritised as being higher risk and
with higher potential impacts. In turn, assumed allowances for potential growth in claims
estimates fed into the risk assessments.
4.5 AMI supervision
Monitoring of AMI was more in depth than for other insurers because it was a known
insurer in distress (as opposed to a potentially stressed insurer), and because provisions in
the Crown support deed had various triggers for capital to be paid up and for control to pass
to the Government. One of the triggers was solvency. A special solvency standard for AMI7
was created in April 2011 to allow the unpaid capital provided by the Crown to be
admissible, and to have a finalised standard when the regular nonlife insurance solvency
standard was still in consultation.
The detailed reporting from AMI assisted the Bank in monitoring other insurers by aiding
comparative analyses and benchmarks, and improving our familiarity with issues faced by
insurers.
The 30 June 2011 financial year end work included a solvency assessment by AMI which
revealed that they were in breach of the AMI solvency standard, even allowing for the $500
million of unpaid capital. This was publicly announced on 20 September 2011.
A restructure and sale was initiated by the Government. In summary the restructure
separated AMI into “new AMI” (now called AMI Insurance) and “old AMI” (now called
Southern Response Earthquake Services). Old AMI retained some (lower quality) assets in
excess of the agreed capitalisation of new AMI, reinsurance recoveries, liabilities in respect
of the Canterbury earthquakes and other liabilities that generated a reinsurance recovery.
New AMI received insurance policies, novated and endorsed reinsurance policies, and most
of the assets and nonearthquake liabilities. A conditional sale of new AMI to IAG was
confirmed on 16 December 2011, with completion dependent upon approvals from the
Overseas Investment Office, Commerce Commission and the Bank.
Old AMI was issued a provisional licence as the requirements for a provisional licence are
fairly minimal. The Bank was required to assess and approve the restructure and sale – issue
a full licence to new AMI, approve the transfer of insurance business and assignment of
liabilities from old AMI to new AMI, confirm that it was satisfied that the requirements of a
licensed insurer continued to be met following the change of control of new AMI. These
approvals and confirmation were given on 5 April 2012, and almost all of the transactions
were completed on the same day. Subsequently, the licence of old AMI was cancelled by
way of exemption declaration under s9 of the Act.
7 http://www.rbnz.govt.nz/finstab/insurance/4267910.html

11
4.6 ACS (formerly Ansvar Insurance) supervision
Another insurer which has received significant Bank attention is ACS (formerly Ansvar
Insurance). Ansvar was a niche nonlife insurer specialising in insuring churches, schools and
heritage buildings, and also had a small domestic lines book.
The Bank was concerned about the possibility of claims exceeding reinsurance cover,
whether the thin capitalisation was sufficient to meet additional costs arising due to the
Canterbury earthquakes – such as repeated retentions and reinstatement premiums, and
the extent of additional capital support from the parents.
Since Ansvar had a parent insurer in Australia (also called Ansvar Insurance) and the parent
of the parent in United Kingdom (Ecclesiastical), the Bank as required consulted with APRA
and Financial Services Authority.
Late in 2011 Ansvar made the decision to exit New Zealand. Policies were cancelled at
31 December 2011 and a temporary policy was offered through Ansvar in Australia for the
period until the next renewal was due, but without any cover for earthquake peril.
Early in 2012, Ansvar was renamed ACS. Subsequently, a contingent scheme of
arrangement was established, Ecclesiastical provided some additional reinsurance for ACS to
support increases in estimated claims, and the Canterbury Earthquake Church and Heritage
Trust was created and became the owner of ACS.
The contingent scheme of arrangement is a mechanism approved by the High Court under
Part 15 of the Companies Act 1993, and may encompass an arrangement to reduce
creditors’ claims in a manner prescribed by the scheme document in the event there is a
shortfall of assets to meet liabilities or the company is unable, or may become unable, to
pay its debts as they fall due. Schemes of arrangement are used in United Kingdom and
elsewhere, but to date do not appear to have been used by insurers in New Zealand. For a
scheme to be implemented, creditors must be given information and the opportunity to
vote on it as part of a courtsanctioned process, and court approval obtained to make the
scheme binding on all creditors. Under the Act, the Bank as supervisor of insurers has the
right to participate in the court hearing.
The Bank participated in the scheme of arrangement process by:
� commissioning an independent actuarial report under s126 of the Act, to value
claims and expenses of ACS throughout their runoff;
� providing a report for claimants on the Bank’s view of the scheme8, which detailed
our concerns;
� attending the creditors’ meeting at which the scheme was voted upon; and
� being represented at the court hearings.
One issue raised by some was that the Western Pacific ruling (see section 3.3) probably
created two classes of creditors – those with reinsurance recoveries relating to their claims
8 http://www.rbnz.govt.nz/finstab/insurance/4941101.html

12
and hence a first call on reinsurance funds, and other creditors. To address this,
Ecclesiastical provided ACS with a small reinsurance policy covering all claimants that did not
already have reinsurance associated with their claims.
The scheme was implemented on 20 June 2012, and as at 3 September 2012 had not yet
been triggered. Regular discussions with ACS and active monitoring of their financial
position are continuing.
4.7 Development of insurers’ estimated claims
Insurers’ estimates of claims costs have increased over time. The largest changes in
estimates occurred around full year and half year balance dates (commonly June and
December), or in response to significant news (such as EQC’s announcement in August 2011
of a large increase in their claims estimates).
Figure 4.2 – insurers’ (excluding EQC) total Canterbury earthquake claims
Source: insurers (excluding EQC)
Most of the increases in total Canterbury earthquake claims arose from increased estimates
in respect of CEQ2 (22 February 2011 earthquake), and to a lesser extent CEQ1 (4
September 2010 earthquake). The CEQ3 and New Brighton earthquakes (at 13 June 2011
and 23 December 2011) do not contribute much to the increase in total Canterbury
earthquake claims estimates because estimates for those two earthquakes combined are
under $1 billion excluding EQC.
The next page has graphs showing the development patterns for each insurer’s claims
estimates in respect of the three main Canterbury earthquakes. The estimate at each
month is expressed as a percentage of the estimate approximately 3 months after the
earthquake.

13
Figures 4.3, 4.4, 4.5 – CEQ1, CEQ2, CEQ3 estimated claims costs as % of 3month estimate

14
While there is a wide range of development patterns across insurers, the median and
quartiles illustrate the trends:
� CEQ1 claims estimates at 31 August 2012 as a percentage of the 3 month estimate
have a median of 115%, with upper and lower quartiles of 148% and 97%;
� CEQ2 claims estimates at 31 August 2012 as a percentage of the 3 month estimate
have a median of 165%, with upper and lower quartiles of 178% and 111%;
� CEQ3 claims estimates at 31 August 2012 as a percentage of the 3 month estimate
have a median of 116%, with upper and lower quartiles of 169% and 81%.
Figure 4.6 CEQ1, CEQ2, CEQ3 estimated claims costs as a percentage of 3month estimate
Source: insurers (excluding EQC)
The wide interquartile ranges in recent estimated claims costs as a percentage of 3month
estimates shows there has been considerable differences in the development patterns
between insurers. There also are significant differences in development patterns of
estimated claims costs between the major earthquake events – CEQ2 estimates have
increased much more than CEQ1 estimates or CEQ3 estimates for the median insurer.
Insurers’ estimates for CEQ2 are typically much higher than for CEQ1. The ratio of CEQ2
costs to CEQ1 costs varies between insurers from 30% to almost 2000%. The median ratio is
about 470% with upper and lower quartiles of about 600% and 200%.
With about two thirds of total estimated Canterbury earthquake claims costs still
outstanding as at 31 August 2012, and many issues yet to be resolved, there remains scope
for further significant changes in claims cost estimates.

15
4.8 Bank’s estimate of total insurance claims costs
The Reserve Bank Act requires the Bank to produce a Financial Stability Report9 twice a year
(these are published each May and November). Estimates of total insurance claims
(including some unlicensed insurers such as EQC and now Southern Response Earthquake
Services) are based on the insurers’ earthquake returns, discussions with insurers, and EQC’s
updates on their estimated and paid Canterbury earthquake claims. The latest insurance
claims cost estimate by the Bank that is published in the Financial Stability Report is in
excess of $30 billion.
The Bank’s estimates include assumed future development in the insurers’ estimates. With
hindsight, the Bank’s 2011 estimates of insurance claims costs appear to have been
understated – this can be seen by the assumed future development (bottom row of table
4.7) being less than the actual development to date (top row of table 4.7).
Table 4.7 – development factors for total insurance claims costs (incl EQC)
Note the Bank also publishes estimates of Canterbury earthquake rebuild costs, which is a
materially different measure to insurance claims costs.
4.9 Reinsurance and capital
Since takeup rates and coverage of earthquake insurance in New Zealand is high compared
with other earthquakeprone areas, and also New Zealand property insurers had very high
levels of reinsurance, a very large share of costs of the Canterbury earthquakes are being
borne by reinsurers. This paper does not cover policy issues, such as the calibration of
catastrophe risk requirements in the nonlife solvency standard.
Apart from a small retention borne by insurers, reinsurance is the first, and by far the most
important, source of funds for insurance claims in a disaster. For almost all insurers, the
reinsurance coverage available for CEQ1 is more than sufficient. For CEQ2, however, several
insurers have (or potentially might have) exhausted their reinsurance.
After reinsurance, existing capital is the second important source of funds. Generally (with
few exceptions) the insurers with CEQ2 claims exceeding reinsurance coverage available had
insufficient preexisting capital to meet the net claims costs. There were also some insurers
with earthquake claims well within reinsurance limits but which had insufficient existing
capital to meet the costs of repeated retentions and reinstatement premiums. Fortunately,
in most cases strong parental support has been provided by way of additional capital.
9 http://www.rbnz.govt.nz/finstab/fsreport/

16
Indeed, for insurers other than EQC the new capital injected since September 2010 in
aggregate exceeds the preexisting capital. In figure 4.8 below new capital for AMI includes
Crown support as well as the proceeds of the sale of “new AMI” to IAG.
Figure 4.8 – funding of estimated Canterbury earthquake insurance claims
Source: EQC, insurers & RBNZ
For most insurers there have been two reinsurance renewals since CEQ1. There were
concerns that renewals for many insurers at July 2011 might be problematic due to the high
CEQ2 losses and occurrence of CEQ3 before most of the renewals were finalised. In the
event, almost all insurers successfully renewed their reinsurance including increases to limits
– albeit with increases in retentions and large increase in premiums. The exceptional cases
of issues with renewing reinsurance have resulted in significant changes to the affected
insurers.
There have been a number of actual and potential issues about reinsurance arrangements
which the Bank has identified following the Canterbury earthquake claims. Some with
particular supervisory interests to the Bank are noted below:
� reinstatements – what is prearranged, and are these prepaid?;
� is there a good process for assessing the exposure to catastrophe risk?;
� reinsurance where the New Zealand insurer is not a direct party – there may be
questions about legal certainty of recoveries notwithstanding accounting treatment;
� disputes with reinsurers – will a loss be suffered, how is this provided for in accounts
or solvency?;
� jurisdiction – possible impacts on disputes;
� joint reinsurance programs – losses elsewhere (e.g. Queensland floods) may reduce
cover available to New Zealand;

17
� currency impacts – fixed versus floating exchange rates used in various places,
recoveries may not be in NZD, limits may not be in NZD, gaps may arise between
layers or components of a reinsurance programme due to use of differing measures,
overlaps in cover arising from differing currency measures may have the effect of
reducing total reinsurance cover, etc;
� incomplete or inadequate documentation – potential for disputes;
� high retentions – possible large accumulated losses from multiple events unless an
aggregate or stop loss cover is also in place;
� concentration of reinsurance – vulnerability to credit risk, disputes, failure to renew;
� unrated reinsurers – how to assess the risks?;
� gaps in reinsurance – exclusion clauses (geographic, risks, perils or other) , omitted
classes or perils, missing layers, (sub)limits too low, and so on;
� renewal – able to obtain sufficient reinsurance;
� etc.

18
5 Conclusion
The property insurance sector in New Zealand has been significantly stressed by the
Canterbury earthquakes. This has been an interesting, but very challenging, two years for
insurers and supervisors alike.
Further, and in some cases ongoing, impacts are expected as claims are settled, lessons
learned, possible changes to the provision of EQC cover, and the insurance and reinsurance
markets settle into the new normal. Some of these possible changes could be very
significant and fundamentally alter how earthquake and disaster risks are managed in New
Zealand.
The Canterbury earthquakes have raised questions in respect of how EQC cover operates
that were previously not considered. The terms of reference for a Treasuryled review of
EQC cover have recently been announced. There is potential for there to be major changes
in EQC cover and if this occurs it will have flow on impacts on private insurers.
19
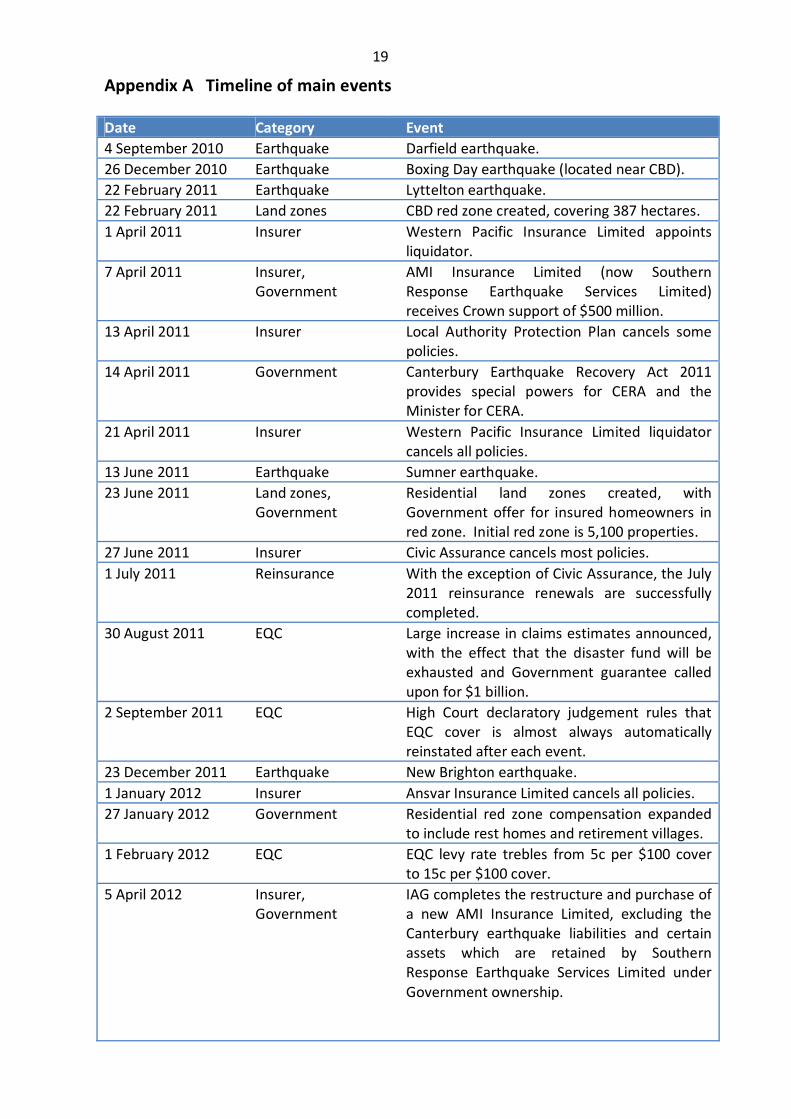
Appendix A Timeline of main events
Date Category Event
4 September 2010 Earthquake Darfield earthquake.
26 December 2010 Earthquake Boxing Day earthquake (located near CBD).
22 February 2011 Earthquake Lyttelton earthquake.
22 February 2011 Land zones CBD red zone created, covering 387 hectares.
1 April 2011 Insurer Western Pacific Insurance Limited appoints
liquidator.
7 April 2011 Insurer,
Government
AMI Insurance Limited (now Southern
Response Earthquake Services Limited)
receives Crown support of $500 million.
13 April 2011 Insurer Local Authority Protection Plan cancels some
policies.
14 April 2011 Government Canterbury Earthquake Recovery Act 2011
provides special powers for CERA and the
Minister for CERA.
21 April 2011 Insurer Western Pacific Insurance Limited liquidator
cancels all policies.
13 June 2011 Earthquake Sumner earthquake.
23 June 2011 Land zones,
Government
Residential land zones created, with
Government offer for insured homeowners in
red zone. Initial red zone is 5,100 properties.
27 June 2011 Insurer Civic Assurance cancels most policies.
1 July 2011 Reinsurance With the exception of Civic Assurance, the July
2011 reinsurance renewals are successfully
completed.
30 August 2011 EQC Large increase in claims estimates announced,
with the effect that the disaster fund will be
exhausted and Government guarantee called
upon for $1 billion.
2 September 2011 EQC High Court declaratory judgement rules that
EQC cover is almost always automatically
reinstated after each event.
23 December 2011 Earthquake New Brighton earthquake.
1 January 2012 Insurer Ansvar Insurance Limited cancels all policies.
27 January 2012 Government Residential red zone compensation expanded
to include rest homes and retirement villages.
1 February 2012 EQC EQC levy rate trebles from 5c per $100 cover
to 15c per $100 cover.
5 April 2012
Insurer,
Government
IAG completes the restructure and purchase of
a new AMI Insurance Limited, excluding the
Canterbury earthquake liabilities and certain
assets which are retained by Southern
Response Earthquake Services Limited under
Government ownership.

20
Date Category Event
15 June 2012 Government Residential red zone compensation expanded
to include properties under construction at 22
February 2011 (which did not have EQC land
cover at the time) and also 5 notforprofit
nonresidential properties.
20 June 2012 Insurer ACS (formerly Ansvar Insurance Limited)
implements a contingent scheme of
arrangement under the Companies Act 1993
after obtaining court approval. As of
3 September 2012 the scheme remains in the
initial scheme period phase and is not yet
triggered.
30 July 2012 Government CBD blueprint announced, including the
compulsory purchase of about 880 properties.
1 August 2012 Insurer China Taiping enters runoff by ceasing to
write new business or renew existing policies.
13 September 2012 Government Residential red zone compensation offer
expanded (on different terms) to vacant land,
uninsured residential properties, insured
leasehold residential properties, and insured
commercial and industrial properties.
18 September 2012 EQC Terms of reference for a Treasuryled review
of the future of EQC are announced.
June 2011 to
October 2012
(expected
completion)
Land zones Updates to zoning of residential land.
Ultimately all residential property will be
zoned either green (with 3 technical
categories) or red. A relatively small number
of properties have been rezoned from red to
green or vice versa upon review.