cao hoc quan tri kinh doanh isb mbus2010 phan thanh si
TRANSCRIPT

8/12/2019 Cao Hoc Quan Tri Kinh Doanh ISB Mbus2010 Phan Thanh Si
http://slidepdf.com/reader/full/cao-hoc-quan-tri-kinh-doanh-isb-mbus2010-phan-thanh-si 1/73
UNIVERSITY OF ECONOMICS HO CHI MINH CITY
International School of Business
--------------------
PHAN THANH SI
KEY FACTORS AFFECTING HOUSE
PURCHASE DECISION OF
CUSTOMERS IN VIETNAM
ID: 60340102
MASTER OF BUSINESS (Honours)
SUPERVISOR: DINH THAI HOANG, Ph.D.
Ho Chi Minh City - Year 2012

8/12/2019 Cao Hoc Quan Tri Kinh Doanh ISB Mbus2010 Phan Thanh Si
http://slidepdf.com/reader/full/cao-hoc-quan-tri-kinh-doanh-isb-mbus2010-phan-thanh-si 2/73

8/12/2019 Cao Hoc Quan Tri Kinh Doanh ISB Mbus2010 Phan Thanh Si
http://slidepdf.com/reader/full/cao-hoc-quan-tri-kinh-doanh-isb-mbus2010-phan-thanh-si 3/73
iii
ABSTRACT
The main purpose of the study is to investigate the effecting of key factors on housing
purchase decision of customers in Vietnam. First, a model which is proposed basedon analyzing of previous literature. Then the model is tested on a pilot test which is
conducted of a small real estate professional group and another group of 15
respondents, and on a larger survey of 263 samples. The study finds out a strong
positive relationship between top two factors, including “living space”, “distance”
and customers’ housing purchase decision. The three weaker positive relationship
factors are “feature”, “finance” and “environment” to housing decision makers. It is
also found that there is no difference in decision making of customers according to
different demographics consisting of gender, age, marital status, monthly income and
education level.
Key works: real estate, purchase factors, Vietnam

8/12/2019 Cao Hoc Quan Tri Kinh Doanh ISB Mbus2010 Phan Thanh Si
http://slidepdf.com/reader/full/cao-hoc-quan-tri-kinh-doanh-isb-mbus2010-phan-thanh-si 4/73
iv
TABLE OF CONTENTS
ACKNOWLEGEMENTS ........................................................................................ ii
ABSTRACT ...........................................................................................................iiiLIST OF TABLES ................................................................................................ vii
LIST OF FIGURES .............................................................................................. viii
ABBREVATIONS ............................................................................................... viii
CHAPTER 1. INTRODUCTION ....................................................................... 1
1.1. BACKGROUND ........................................................................................... 1
1.2. RESEARCH PROBLEMS & RESEARCH QUESTIONS ............................. 1
1.3. RESEARCH PURPOSE ................................................................................ 3
1.4. SCOPE OF THE RESEARCH ...................................................................... 3
1.5. RESEARCH STRUCTURES ........................................................................ 3
CHAPTER 2. LITERATURE REVIEW ........................................................... 4
2.1. LITERATURE REVIEW .............................................................................. 4
2.1.1. Feature ....................................................................................................... 4
2.1.2. Living space ............................................................................................... 4
2.1.3. Finance ....................................................................................................... 5
2.1.4. Distance ..................................................................................................... 5
2.1.5. Environment ............................................................................................... 5
2.1.6. Purchase decision ....................................................................................... 6
2.1.7. Demography ............................................................................................... 6
2.2. CONCEPTUAL FRAMEWORK .................................................................. 7
CHAPTER 3. RESEARCH METHODOLOGY ............................................... 83.1. RESEARCH PROCESS ................................................................................ 8
3.2. SAMPLE SIZE ............................................................................................ 11
3.3. MEASUREMENT SCALE ......................................................................... 11
3.3.1. Measurement scale ................................................................................... 11
3.3.2. Pilot test ................................................................................................... 11
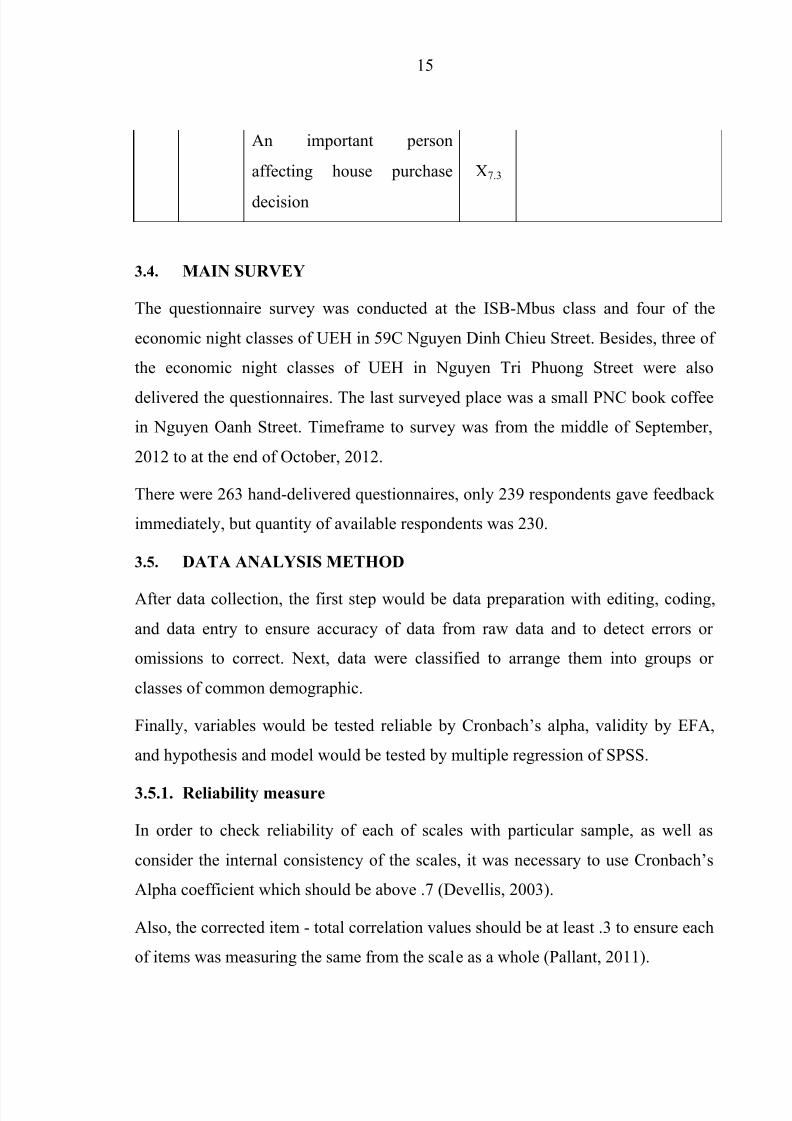
3.4. MAIN SURVEY ......................................................................................... 15

8/12/2019 Cao Hoc Quan Tri Kinh Doanh ISB Mbus2010 Phan Thanh Si
http://slidepdf.com/reader/full/cao-hoc-quan-tri-kinh-doanh-isb-mbus2010-phan-thanh-si 5/73
v
3.5. DATA ANALYSIS METHOD .................................................................... 15
3.5.1. Reliability measure ................................................................................... 15
3.5.2. Validity measure by EFA (Exploratory Factor Analysis) .......................... 16
3.5.3. Multiple regression analysis ..................................................................... 16
CHAPTER 4. DATA ANALYSIS & RESULTS ............................................. 18
4.1. PREPARATION DATA .............................................................................. 18
4.1.1. Editing...................................................................................................... 18
4.1.2. Coding...................................................................................................... 18
4.2. DESCRIPTIVE DATA ................................................................................ 21
4.3. ASSESSMENT MEASUREMENT SCALE ................................................ 234.3.1. Cronbach’s Alpha ..................................................................................... 23
4.3.2. Exploratory Factor Analysis (EFA) .......................................................... 26
4.3.2.1. Assessment of data ................................................................................ 26
4.3.2.2. Defining number of extracted factors .................................................... 27
4.4. HYPOTHESES TESTING BY MULTIPLE REGRESSION ....................... 30
4.4.1. Checking assumption of Multiple Regression ........................................... 30
4.4.1.1. Sample size ........................................................................................... 30
4.4.1.2. Assessment multicollinearity of independent variables .......................... 30
4.4.1.3. Normality, linearity, homoscedasticity & outliers.................................. 30
4.4.2. Evaluating the model ................................................................................ 31
4.4.3. Evaluating the independent of variables ................................................... 31
4.4.4. Checking hypotheses of model ................................................................. 32
4.4.5. Analysis effect of control variables by Multiple Regression ..................... 34
CHAPTER 5. CONCLUSIONS AND IMPLICATIONS ................................ 35
5.1. RESEARCH OVERVIEW .......................................................................... 35
5.2. RESEACH FINDINGS ............................................................................... 35
5.3. MANAGERIAL IMPLICATIONS .............................................................. 36
5.4. RESEARCH LIMITATIONS & DIRECTIONS FOR FUTURE RESEARCH ......... 37

8/12/2019 Cao Hoc Quan Tri Kinh Doanh ISB Mbus2010 Phan Thanh Si
http://slidepdf.com/reader/full/cao-hoc-quan-tri-kinh-doanh-isb-mbus2010-phan-thanh-si 6/73
vi
REFERENCES .................................................................................................... 38
Appendix 1: The first draft of the questionnaire ..................................................... 42
Appendix 2: The English questionnaire ................................................................. 45
Appendix 3: The Vietnamese questionnaire ........................................................... 49
8/12/2019 Cao Hoc Quan Tri Kinh Doanh ISB Mbus2010 Phan Thanh Si
http://slidepdf.com/reader/full/cao-hoc-quan-tri-kinh-doanh-isb-mbus2010-phan-thanh-si 7/73
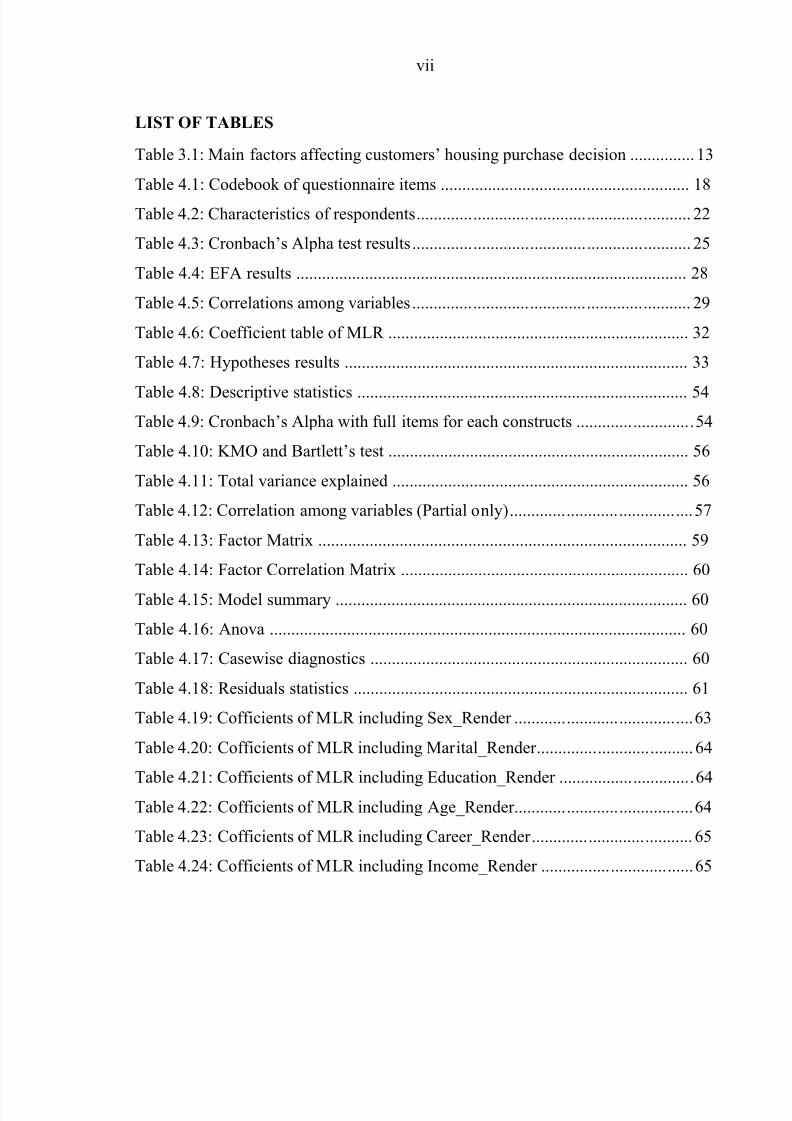
vii
LIST OF TABLES
Table 3.1: Main factors affecting customers’ housing purchase decision ............... 13
Table 4.1: Codebook of questionnaire items .......................................................... 18
Table 4.2: Characteristics of respondents ............................................................... 22
Table 4.3: Cronbach’s Alpha test results ................................................................ 25
Table 4.4: EFA results ........................................................................................... 28
Table 4.5: Correlations among variables ................................................................ 29
Table 4.6: Coefficient table of MLR ...................................................................... 32
Table 4.7: Hypotheses results ................................................................................ 33
Table 4.8: Descriptive statistics ............................................................................. 54Table 4.9: Cronbach’s Alpha with full items for each constructs ........................... 54
Table 4.10: KMO and Bartlett’s test ...................................................................... 56
Table 4.11: Total variance explained ..................................................................... 56
Table 4.12: Correlation among variables (Partial only) .......................................... 57
Table 4.13: Factor Matrix ...................................................................................... 59
Table 4.14: Factor Correlation Matrix ................................................................... 60
Table 4.15: Model summary .................................................................................. 60
Table 4.16: Anova ................................................................................................. 60
Table 4.17: Casewise diagnostics .......................................................................... 60
Table 4.18: Residuals statistics .............................................................................. 61
Table 4.19: Cofficients of MLR including Sex_Render ......................................... 63
Table 4.20: Cofficients of MLR including Marital_Render .................................... 64
Table 4.21: Cofficients of MLR including Education_Render ............................... 64Table 4.22: Cofficients of MLR including Age_Render ......................................... 64
Table 4.23: Cofficients of MLR including Career_Render ..................................... 65
Table 4.24: Cofficients of MLR including Income_Render ................................... 65

8/12/2019 Cao Hoc Quan Tri Kinh Doanh ISB Mbus2010 Phan Thanh Si
http://slidepdf.com/reader/full/cao-hoc-quan-tri-kinh-doanh-isb-mbus2010-phan-thanh-si 8/73
viii
LIST OF FIGURES
Figure 2.1: Conceptual framework .......................................................................... 7
Figure 3.1: Research process ................................................................................. 10
Figure 4.1: Scree plot ............................................................................................ 58
Figure 4.2: Regression standardized residual ......................................................... 62
Figure 4.3: Normal P-P plot ................................................................................... 62
Figure 4.4: Scatterplot ........................................................................................... 63
ABBREVATIONS
EFA : Exploratory Factor Analysis
GSO : Vietnam Government Statistics Office
HCMC : Ho Chi Minh City
Mil. : Million
MLR : Multiple Linear Regression
UEH : University of Economic

8/12/2019 Cao Hoc Quan Tri Kinh Doanh ISB Mbus2010 Phan Thanh Si
http://slidepdf.com/reader/full/cao-hoc-quan-tri-kinh-doanh-isb-mbus2010-phan-thanh-si 9/73
1
CHAPTER 1. INTRODUCTION
1.1. BACKGROUND
As universal population levels continue to rise, the housing shortage in many
developing countries has reached critical levels (Morel, 2001, p. 1119). Real estate
is one of the most important things to citizens, so “the house purchase decision of
them can change their life” (Wells, 1993). The house purchase decisions are
different from other business decisions due to “the innate, durable and long-term
characteristics of real estate”. It is a highly differentiated product with “each
specific site unique and fixed in location” (Kinnard, 1968).In Vietnam, it is known as the third largest population in South East Asia and ranked
the 14th largest in the world in terms of total population. Its population estimated of
89 million in 2010 (GSO, 2011). The annual average growth population of Vietnam
from 2000 to 2010 was approximately 1.03 million people per year or 1.2% annual
growth. Particularly, one of the top economic centers of Vietnam is Ho Chi Minh
City which has around 7.2 million people as in April 2009, but its actual population
is likely to be significantly higher because of unrecorded migration from rural areas.
The real estate market in Vietnam has significantly changed during from the 1990s
to now and it might be seen as three times fever and declining prices in the last 20
years. Up to the end of 2012, the large real estate outstanding loans and a big
number of inventories created a serious crisis. However, according to the Deputy
Minister of Construction Nguyen Tran Nam, he emphasized that “people’s housing
demand is very large and solvency is high, but the real estate market lacked ofinformation”.
1.2. RESEARCH PROBLEMS & RESEARCH QUESTIONS
In general, the real estate in Vietnam has got many difficulties in making effort to
satisfy customer demands. According to incomplete statistics of the Ministry of
Construction surveyed in 44 provinces up to August 30th, 2012, the country now

8/12/2019 Cao Hoc Quan Tri Kinh Doanh ISB Mbus2010 Phan Thanh Si
http://slidepdf.com/reader/full/cao-hoc-quan-tri-kinh-doanh-isb-mbus2010-phan-thanh-si 10/73
2
had 16,469 unsold apartments, in which HCMC was 10,108 unsold apartments and
total number of inventories of low buildings was 4,116, in which HCMC was 1,131
ones (Anh, 2012).
Therefore, the Prime Minister stressed that the solution to rescue real estate market
should be included in the Resolution of the Government. The main reasons of the
crisis were the real estate market supply did not meet customer demands, the
investors lacked of exact information of customer and real estate market conditions.
“There are two main fields of customer research are how customers go about
making decisions and how decisions should be made. In addition, “creating truevalue for customer and customer notion focused approach” is confirmed (Edwards
& Fasolo, 2001). It is found that “customer decision making is one of the most
important areas of customer behavior and it requires gathering a lot of regarding
information” (Bettman et al ., 1998 & Simonson et al ., 2001).
There have been many published academic research about customer house purchase
with variety of both developed and developing countries. However, “the national
and cultural characteristics play a very significant role in house purchase decision,
that mean finding which is applied in specific context may not extend to another
context” (Opoku & Abdul-Muhmin, 2010).
The real estate in Vietnam has got specific characteristics to which connected
customer demands closely. In recent years, researchers, domestic and foreign
companies attracted to real estate field in Vietnam with a number of research works.
However, there has been not enough research into the way customers makingdecision to buy real estate as well as which major factors have got relationship with
customer decision.
Consequently, in the term of real estate purchase decision of customers, the research
questions of the thesis are raised as two following questions:

8/12/2019 Cao Hoc Quan Tri Kinh Doanh ISB Mbus2010 Phan Thanh Si
http://slidepdf.com/reader/full/cao-hoc-quan-tri-kinh-doanh-isb-mbus2010-phan-thanh-si 11/73
3
What are the key factors affecting the house purchase decision of
customers in Vietnam?
How is impact of these factors on house purchase decision of customers
evaluated in Vietnamese context?
Understanding relationship between main factors affecting customer house purchase
decision is an important role for both real estate developers and enterprises to
satisfy customers’ demand and to have available strategies in the real estate field.
1.3. RESEARCH PURPOSE
Based on the research questions, the main purpose of this thesis is to identify what
factors have impact on house purchase dicision of customers and examine how
these factors influence their decision of buying house in Vietnam.
1.4. SCOPE OF THE RESEARCH
The research is conducted in Ho Chi Minh City with the respondents who are the
postgraduates and students of UEH with various careers, as well as customers of a
small book-coffee. The timeframe of research lasts from the middle of September tothe end of October in 2012.
1.5. RESEARCH STRUCTURES
The research is divided into five chapters. The first chapter introduces about
background, research problems, research questions, research purpose, scope of
research and research structures. The second chapter covers literature review of the
previous research and shows hypotheses, as well as the conceptual framework of the
research. The third chapter presents the research process, sampling size,
measurement scale, main survey, and data analysis method. The fourth chapter
concentrates on preparation data, descriptive data, assessment measurement scale
and hypotheses testing. Finally, the fifth chapter points out research overview,
research findings, managerial implications, research limitations and directions for
future research.

8/12/2019 Cao Hoc Quan Tri Kinh Doanh ISB Mbus2010 Phan Thanh Si
http://slidepdf.com/reader/full/cao-hoc-quan-tri-kinh-doanh-isb-mbus2010-phan-thanh-si 12/73
4
CHAPTER 2. LITERATURE REVIEW
This chapter presents overview of previous literatures relating to housing purchase
decision making of customers. Also, a conceptual framework is built up and relative
hypotheses of research are raised.
2.1. LITERATURE REVIEW
2.1.1. Feature
Firstly, “features” of the building structure itself is an important determinant of a
household choice of residence (Quigley, as cited in Haddad, 2011, p. 234). Also, it
is confirmed that “feature” has significant effects on customers’ house purchase
decision making (Sengul et al., 2010, p. 214). The “feature” of house includes
“design”, “house size” and “quality of building” determinants relating to decision
making to buy a house of an individual (Adair et al., 1996; Daly et al., 2003; Sengul
et al., 2010, p.218; Opoku & Abdul-Muhmin, 2010). As a result,
H1. There is a positive impact of house features on customers’ house purchase
decision.
2.1.2. Living space
Secondly, “private living space” is one of most important factors affecting to
“consumer housing decision”. Living space consists of “size of living room”, “size
of kitchen”, “quantity of bathrooms” and “quantity of bedrooms” (Opoku & Abdul-
Muhmin, 2010, p.219). In addition, it is accepted that there is relationship between
the “space customer” and customers’ purchase making process (Graaskamp, 1981).Accordingly,
H2. There is a positive impact of living space on customers’ house purchase
decision.

8/12/2019 Cao Hoc Quan Tri Kinh Doanh ISB Mbus2010 Phan Thanh Si
http://slidepdf.com/reader/full/cao-hoc-quan-tri-kinh-doanh-isb-mbus2010-phan-thanh-si 13/73
5
2.1.3. Finance
Thirdly, “financial” status is much significant to customer house choice (Hinkle and
Combs, 1987, p.375; Kaynak & Stevenson, as cited in Sengul et al ., 2010, p.220).
The “financial” element of real estate requires access to a relative large amount of
“capital” and as well as “borrowing costs” (Xiao & Tan, 2007, p. 865). In addition,
“financial” status bases on combination of “house price”, “mortgage loans”,
“income” and “payment term” (Opoku & Abdul-Muhmin, 2010; Yongzhou, 2009,
p.17). Haddad et al. (2011) finds out the “economic” factor which is consisted of
five variables, such as “income”, “interest rate”, “area”, “conversion” and “taxes”.Moreover, Adair et al.(1996, p.24) and Daly et al. (2003, p.306) group “interest
rate”, “maximum mortgage”, “maximum monthly payment”, and “length of time
payment” into “financial” factor. Consequently,
H3. There is a positive impact of financial status on customers’ house purchase
decision.
2.1.4. Distance
Fourthly, one of the most important factors affecting individual “decision” making
to buy a house is “location” factor (Kaynak & Stevenson, as cited in Sengul et al.,
2010, p.219). The “residential location” has an influence on “people’s housing
choice” (Zabel & Kiel, as cited in Opoku & Abdul-Muhmin, 2010, p.220). Distance
to choose house can be affected by “width of adjacent” and “location to school”
(Opoku & Abdul-Muhmin, 2010). Moreover, “distance to central business”,“distance to school” and “distance to work” are considered (Adair et al., 1996,
p.23 ). In addition, “access to recreational facilities” and “access to main roads” are
proposed (Iman et al., 2012, p.30) . Hence,
H4. There is a positive impact of distance on customers’ house purchase decision.
2.1.5. Environment

8/12/2019 Cao Hoc Quan Tri Kinh Doanh ISB Mbus2010 Phan Thanh Si
http://slidepdf.com/reader/full/cao-hoc-quan-tri-kinh-doanh-isb-mbus2010-phan-thanh-si 14/73

8/12/2019 Cao Hoc Quan Tri Kinh Doanh ISB Mbus2010 Phan Thanh Si
http://slidepdf.com/reader/full/cao-hoc-quan-tri-kinh-doanh-isb-mbus2010-phan-thanh-si 15/73
7
difference in real estate buying decisions to “age” and “gender”, and not to
“educational levels” and “marital status” (Haddad et al., 2011). Correspondingly, in
this study, “gender” and “age” characteristics are considered as control variables sothat investigate whether effect of those demography variables on housing purchase
decision making of customers or not.
2.2. CONCEPTUAL FRAMEWORK
A conceptual framework which is proposed to show the relationship between five
independent variables consisting of “feature”, “living space”, “financial status”,
“distance” and “environment” and one dependent variable, namely “house purchase
decision”. It also shows the effecting of demography including “gender”, “age”,
“marital status”, “income” and “education” as control variables on the dependent
variable. The conceptual framework is shown as the model (see Figure 2.1).
Figure 2.1: Conceptual framework
FEATURE
LIVING SPACE
FINANCIALSTATUS
DISTANCE
HOUSE
PURCHASE
DECISION
- Gender
- Age
- Marital
- Income
- Education
- Career
Control
H1+
H2+
H +
H3+
ENVIRONMENTH +

8/12/2019 Cao Hoc Quan Tri Kinh Doanh ISB Mbus2010 Phan Thanh Si
http://slidepdf.com/reader/full/cao-hoc-quan-tri-kinh-doanh-isb-mbus2010-phan-thanh-si 16/73
8
CHAPTER 3. RESEARCH METHODOLOGY
This chapter showed all steps of the research process, the minimum sample size,
measurement scale, main survey and data analysis method.
3.1. RESEARCH PROCESS
The research process was summarized as following steps.
Step 1: Define the research problems, research questions and research purposes.
Step 2: Review the literature background from the previous research, then a
conceptual model was set up and hypotheses were proposed.Step 3: Made and revise the draft questionnaire.
A draft questionnaire with the measurement scales based on the previous research
was set up. Next, the draft questionnaire was delivered to 02 real estate
professionals, 03 management officers to respond, and a discussion about the draft
questionnaire was carried out later. The aim of the pilot phase was to modify and
clear the measure scale.After that, the revised questionnaires were delivered to another small group of 15
persons to test about clear understanding of the questionnaire. Finally, a main
survey was conducted with 263 receivers.
Step 4: Conduct the main survey and collect data within 4 weeks.
The questionnaires were directly sent to 263 persons. The main respondents were
postgraduates of master programs or students who have been studying to get thesecond business certification in the University of Economic. Besides, a small group
about 24 persons with a wide variety of careers was also delivered questionnaires at
a book coffee in Ho Chi Minh City. Finally, there were 239 respondents giving their
feedbacks, but 230 cases were available only.
Step 5: Edit, code and adjust missing data before testing reliable and validity of
data.

8/12/2019 Cao Hoc Quan Tri Kinh Doanh ISB Mbus2010 Phan Thanh Si
http://slidepdf.com/reader/full/cao-hoc-quan-tri-kinh-doanh-isb-mbus2010-phan-thanh-si 17/73
9
In order to prepare the data to analysis, data were edited, coded and adjusted for
missing data. Next, reliability of measuring instrument was analyzed by calculation
Cronbach’s alpha which was required above .7 (Hair et al., 2010). In addition,validity of measuring instrument was evaluated due to define the number extracted
factors based on the Eigenvalue value over than 1 and changing of the slope in the
Scree plot (Hair et al., 1998; Tabachnick & Fidell, 2001).
Step 6: Test the hypotheses of research and define relationship of factors in model
through the Multiple linear regression analysis.
The Multiple linear regression analysis was applied to evaluate the relationship between five independent variables, including “feature”, “living space”, “finance”,
“distance” and “environment” and one dependent variable, namely “decision”.
Moreover, defining whether there was any significant contributory of control
variables consisting of “gender”, “age”, “marital”, “income”, “education” and
“career” on customers’ housing purchase decision was also analyzed by the multiple
linear regression. All steps were illustrated by the following Figure 3.1.

8/12/2019 Cao Hoc Quan Tri Kinh Doanh ISB Mbus2010 Phan Thanh Si
http://slidepdf.com/reader/full/cao-hoc-quan-tri-kinh-doanh-isb-mbus2010-phan-thanh-si 18/73
10
Figure 3.1: Research
rocess
Research Problems
Theoretical Framework
- Variables identified & labeled- Hypotheses generated
Research Proposal
Research Design
Pilot testing
Data Analysis & Interpretation
Deduction
- Hypotheses substantiated?
- Research questions answered?
Report Writing
Report Presentation
Data Collection & Preparation
Data CollectionDesign
SamplingDesign
Type, purpose, time frame, scope, environment
Instrument Development

8/12/2019 Cao Hoc Quan Tri Kinh Doanh ISB Mbus2010 Phan Thanh Si
http://slidepdf.com/reader/full/cao-hoc-quan-tri-kinh-doanh-isb-mbus2010-phan-thanh-si 19/73
11
3.2. SAMPLE SIZE
The reliable and validity of variables were tested by using Cronbach’s Alpha and
EFA, after that the multiple regression was applied to test model and hypotheses.
First of all, the sample size was required to have enough quantity for the analysis.
The minimum sample size was 100 and not less than five times of items (Hair et al.
2010), thus:
n > 100 and n = 5k (where k is the number of items).
Thus, the minimum sample size was 5x34 = 170 samples.
In addition, based on five independent factors of the conceptual model, the multiple
regression analysis required sample size at least (Tabachnick & Fidell, 2007):
50 + (8xm) = 50 + (80x5) = 90 samples.
Where m: is the number of independent factors of the model.
Consequently, the minimum sample size should be 170. Based on the actual
collection data, the quantity of available respondents from the questionnaire survey
estimated 230, so that samples met the requirements above.
3.3. MEASUREMENT SCALE
3.3.1. Measurement scale
In order to operate concepts, it was necessary to measure them in some manners, so
different variables were required to choose an appropriate scale. The independent
variables were applied interval scale with five - point of Likert scale consisting of
totally unimportant (1), unimportant (2), neutral (3), important (4), very important(5); beside, the dependent variable was applied the same measure consisting of
strongly disagree (1), disagree (2), neutral (3), agree (4) and strongly agree (5).
3.3.2. Pilot test
In order to test logistics of the questionnaires prior collection data on large cover, a
pilot test was carried out with a small group consisting of two real estate

8/12/2019 Cao Hoc Quan Tri Kinh Doanh ISB Mbus2010 Phan Thanh Si
http://slidepdf.com/reader/full/cao-hoc-quan-tri-kinh-doanh-isb-mbus2010-phan-thanh-si 20/73
12
professionals of Sacomreal and three management officers of Hoa Binh
Corporation. All of them had much knowledge and many experience years in the
real estate field.
Firstly, the aim of the pilot test was explained to all of them; moreover, the
questionnaires and relative documents were also sent to them. After that, a
discussion with them was conducted to define which parts would be deleted or
which parts would be added. The results were presented in Appendix 01.
For items of the “house feature” factor, the item “type of finishing” and “quality of
finishing” should be deleted because their content was inside the content of“construction quality”.
While all items of “private living size” factor were agreed, the item “tax” of
“Finance” factor should be changed into “the registration fee”.
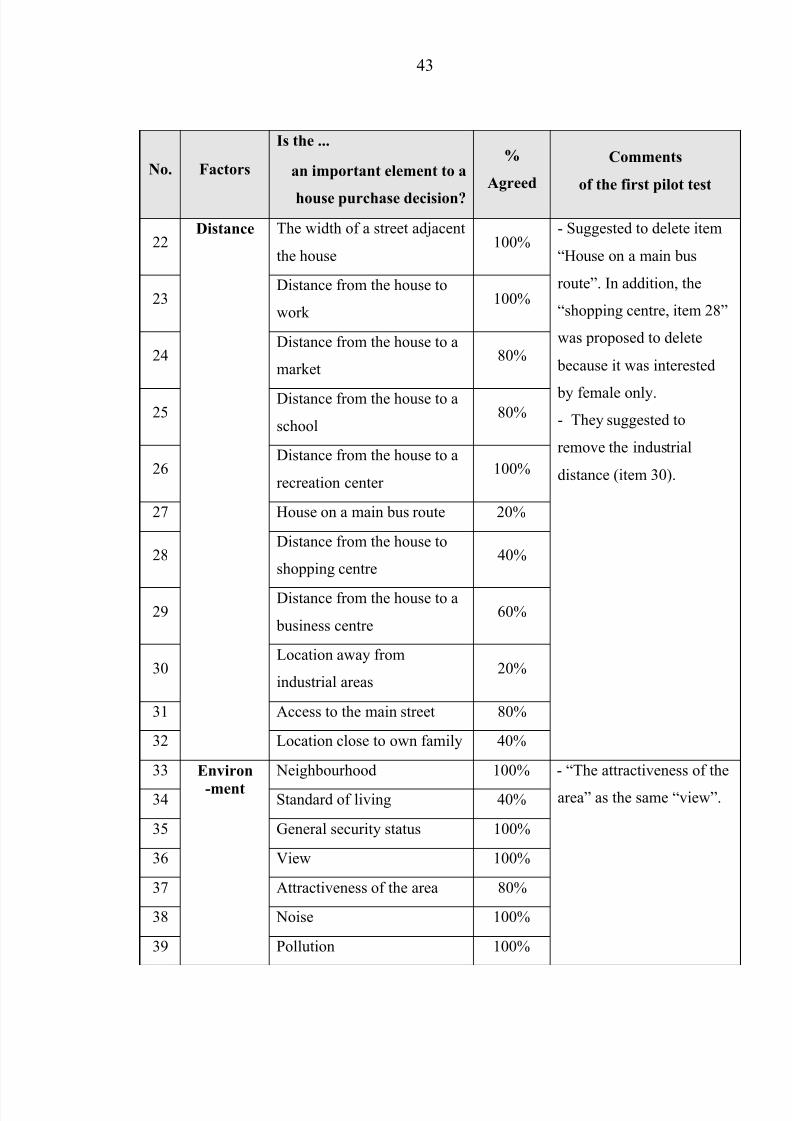
For “distance” factors, the “house on a main bus route” item should be deleted
because this item was not paid attention by customers. The “distance from the house
to shopping centre” item was also proposed to delete because it was too specific andrelated to female only. In addition, the group recommended that customers had got
tendency to ignore the “location away from industrial areas” item so this item
should be removed.
For “environment” factor, its “the attractiveness of the area” item had got the same
meaning of “view” item, so “the attractiveness of the area” should be deleted.
The last “decision” factor, it should change “I will want to buy a new house” into “Iwill make my effort to buy a new house”.
Finally, after adjusting the first questionnaire table, a small sample size of fifteen
convenient colleagues was delivered the questionnaires to recognize whether any
parts of its unclear to understand or misunderstand. However all of them understood
meaning of questionnaires quite well and knew the way to answer, so the

8/12/2019 Cao Hoc Quan Tri Kinh Doanh ISB Mbus2010 Phan Thanh Si
http://slidepdf.com/reader/full/cao-hoc-quan-tri-kinh-doanh-isb-mbus2010-phan-thanh-si 21/73
13
questionnaire was the last version to carry out in the massive areas. After that, a
main survey was conducted.
From above discussion above, a summary table of main factors affecting customer’
housing decision making is presented as following Table 3.1.
Table 3.1: Main factors affecting customers’ housing purchase decision
No. F a c t o r
Variables Code Reference
1
F e a t u r e o f H o u s e
House size X1.1
Adair et al. (1996), Daly et
al. (2003), Kaynak &
Tevenson (1982), Haddad
et al. (2011), Opoku &
Abdul-Muhmin (2010),Ratchatakulpat (2009),
Sengul et al. (2010), Xiao
& Tan (2007)
House’s legal status X1.2
Interior design X1.3
External design X1.4
Construction quality X1.5
Construction duration X1.6
Type of house X1.7
2
P r i v a t e L i v i n g S p a c e
Kitchen size X2.1
Quantity of bedroom X2.2
Quantity of bathroom X2.3
Living room size X2.4
Storey of house X2.5
3
F i n a n c i a l s t a t u s
House price X3.1 Adair et al. (1996), Daly et
al. (2003), Kaynak &
Tevenson (1982), Haddad
et al. (2011), Opoku
(2010), Ratchatakulpat
Maximum mortgage X3.2
Maximum monthly
repaymentX3.3
Interest rate X3.4

8/12/2019 Cao Hoc Quan Tri Kinh Doanh ISB Mbus2010 Phan Thanh Si
http://slidepdf.com/reader/full/cao-hoc-quan-tri-kinh-doanh-isb-mbus2010-phan-thanh-si 22/73
14
Income X3.5 (2009), Sengul et al.
(2010), Xiao & Tan (2007)Payment duration X3.6
The registration fee X3.7
4
D i s t a n c e
Width of adjacent street X4.1 Adair et al. (1996), Daly et
al. (2003), Haddad et al.
(2011), Opoku & Abdul-
Muhmin (2010),
Ratchatakulpat (2009),
Sengul et al. (2010), Xiao
& Tan (2007)
Distance to work X4.2
Distance to market X4.3
Distance to school X4.4
Distance to recreation centre X4.5
Distance to the central business district
X4.6
Access to the main street X4.7
5
E n v i r o n m e n t
Neighbour’s condition X5.1 Adair et al. (1996), Daly et
al. (2003), Haddad et al.
(2011), Opoku & Abdul-
Muhmin (2010),Ratchatakulpat (2009)
General security X5.2
View X5.3
Noise X5.4
Pollution X5.5
Nearby traffic X5.6
6
D e m
o g r a p h i c
Gender X6.1 Adair et al. (1996), Daly et
al. (2003), Haddad et al.
(2011), Mateja (2009),
Ratchatakulpat (2009),
Sengul et al. (2010), Xiao
& Tan (2007)
Age X6.2
Marital X6.3
Income X6.4
Education X6.5
Career X6.6
7
D e c i s i o n
Planning to buy a new house X7.1 Ajzen (1991), Han & Kim,
(2010), Kunshan & Yiman,
(2011)
Making effort to buy a new
houseX7.2
8/12/2019 Cao Hoc Quan Tri Kinh Doanh ISB Mbus2010 Phan Thanh Si
http://slidepdf.com/reader/full/cao-hoc-quan-tri-kinh-doanh-isb-mbus2010-phan-thanh-si 23/73

8/12/2019 Cao Hoc Quan Tri Kinh Doanh ISB Mbus2010 Phan Thanh Si
http://slidepdf.com/reader/full/cao-hoc-quan-tri-kinh-doanh-isb-mbus2010-phan-thanh-si 24/73
16
3.5.2. Validity measure by EFA (Exploratory Factor Analysis)
In order to evaluate the validity and the correlation among variables to identify
underlying factors or define number of extracted factors, EFA was applied with the
oblique approach using the Promax method. However, some requirements of EFA
should be satisfied (Pallant, 2011):
- The minimum of sample size should be at least 100 and rate of observations per
items of models should be five cases for each of the items, so that meant the
minimum required sample size should be at least 5m = 5x34 = 170 cases (where m:
quantity of items from the conceptual model). The actual sample size was 230, bigger than 170 so it met the requirement.
- The correlations of r of the correlation matrix should show at least .3.
- Kaiser-Meyor-Olkin (KMO) test must be equal or above .6 (Tabachnick & Fidell,
2007).
- Barllett’s test of sphericity should have significant less than 5%.
- In order to extract factors, the eigenvalue of factors must be greater than 1 (Kaiser,
1956).
3.5.3. Multiple regression analysis
To explore the relationship between independent variables, consisting of “features”,
“living space”, “finance”, “distance” and “environment”, and dependent variable,
namely “decision” as well as to evaluate the importance of those independent
variables in the framework model, the multiple regression analysis was conducted.
The multiple regression analysis required that some following conditions should be
satisfied:
- The minimum sample size based on the formula:
n > 50 + 8m = 50 + 8x5 = 90 samples, where m: number of independent variables
in the conceptual model

8/12/2019 Cao Hoc Quan Tri Kinh Doanh ISB Mbus2010 Phan Thanh Si
http://slidepdf.com/reader/full/cao-hoc-quan-tri-kinh-doanh-isb-mbus2010-phan-thanh-si 25/73
17
The actual quantity of cases was 230, so this condition was satisfied.
- The multicollinearity did not exist, so r value, the correlated score was less than .9.
- The collinearity test on variables was via two values “tolerance” and “VIF”,
particularly the VIF should not be less than .1, or above 10.
- The Normal probability plot (P-P) was required with most of the scores
concentrated in the centre (along the 0 point).
- The presence detection of outliers was considered from the Scatterplot.
The multiple regression was used to test hypotheses, to explore the relationship between five INDEPENDENT VARIABLEs and one dependent variable, and to
consider whether control variables supported or not to dependent variable. The
generalized equation (Donald & Pamela, 2006) was:
Y = o + 1X1 + 2X2 + 2X2 + … +nXn +
Where:
o = a constant, the value of Y when all X values are zero
1 = the slope of the regression surface (the represents the regression coefficient
associated with each Xi)
= an error term, normally distributed about a mean of 0

8/12/2019 Cao Hoc Quan Tri Kinh Doanh ISB Mbus2010 Phan Thanh Si
http://slidepdf.com/reader/full/cao-hoc-quan-tri-kinh-doanh-isb-mbus2010-phan-thanh-si 26/73
18
CHAPTER 4. DATA ANALYSIS & RESULTS
This chapter presented data preparation with editing, coding, and data entry from
raw data to correct errors. Then data were described through frequency tables about
the general information. Using Cronbach’s alpha to test the reliability of variables
and EFA to test their validity, then the multiple regression was run to explore the
relationship between independent variables and dependent variable, and to test
hypotheses.
4.1. PREPARATION DATA
4.1.1. Editing
After collection 239 cases from respondents, all cases were checked first. There
were 03 cases of blank sheets, 02 cases of filling in half of I part only, 01 case of no
filling in the general information part, and 03 cases of filling almost choosing
number 1 or 3 or 4. The last available numbers of cases was 230, and each of all
cases was marked a reference number on it to find easily. Others did not have any
cases of missing data for contend of INDEPENDENT VARIABLEs and dependentvariable.
4.1.2. Coding
Answers were assigned numbers of symbols so that the responses were grouped into
a limited number of categories (see Table 4.1).
Table 4.1: Codebook of questionnaire items
No. Factors Code Description
Varia-
ble
name
Coding/
Creating Dummy
1 Feature House size Fea01 Record respondents’ numbers
2 House’s Legal Status Fea02
3 Interior Design Fea03

8/12/2019 Cao Hoc Quan Tri Kinh Doanh ISB Mbus2010 Phan Thanh Si
http://slidepdf.com/reader/full/cao-hoc-quan-tri-kinh-doanh-isb-mbus2010-phan-thanh-si 27/73
19
4 External Design Fea04
5 Construction Quality Fea05
6 Construction Duration Fea06
7 Type of House Fea07
8
Private
Living
Space
Kitchen Size Liv01 Record numbers
9 Quantity of Bedroom Liv02
10 Quantity of Bathroom Liv0311 Living room size Liv04
12 Storey of House Liv05
13 Finance House Price Fin01 Record numbers
14 Maximum mortgage Fin02
15Maximum monthly
repayment
Fin03
16 Interest rate Fin04
17 Income Fin05
18 Payment duration Fin06
19 The registration fee Fin07
20Distance Width of adjacent
street
Dis01 Record numbers
21 Distance to work Dis02
22 Distance to market Dis03
23 Distance to school Dis04
24Distance to recreation
centre
Dis05
25 Distance to the central Dis06

8/12/2019 Cao Hoc Quan Tri Kinh Doanh ISB Mbus2010 Phan Thanh Si
http://slidepdf.com/reader/full/cao-hoc-quan-tri-kinh-doanh-isb-mbus2010-phan-thanh-si 28/73
20
business district
26
Access to the main
street
Dis07
27Environ-
ment
Neighbour’s
condition
Env01 Record numbers
28 General security Env02
29 View Env03
30 Noise Env04
31 Pollution Env0532 Nearby Traffic Env06
33 Decision Plan to buy a new
house
Dec01 Record numbers
34 Making effort to buy
a new house
Dec02
35 An important person
to make decision to
buy a new house
Dec03
36 Demogra-phy
Gender Sex01 Creating dummy variables
1= Females
0 = Males
37 Age Age01 Creating dummy variable1 = “less than 35”; 0 = “above
35”
38 Marital Mar01 Creating dummy variable
1 = “Single”; 0 = “Married”
39 Income Inc01 Creating dummy variable

8/12/2019 Cao Hoc Quan Tri Kinh Doanh ISB Mbus2010 Phan Thanh Si
http://slidepdf.com/reader/full/cao-hoc-quan-tri-kinh-doanh-isb-mbus2010-phan-thanh-si 29/73

8/12/2019 Cao Hoc Quan Tri Kinh Doanh ISB Mbus2010 Phan Thanh Si
http://slidepdf.com/reader/full/cao-hoc-quan-tri-kinh-doanh-isb-mbus2010-phan-thanh-si 30/73
22
Table 4.2: Characteristics of respondents
Characteristics Frequency % Cumulative %
Gender 230
- Male 76 33.0 33.0
- Female 154 67.0 100.0
Marital status 230
- Single without children 191 83.0 83.0
- Single with children 2 .9 83.9
- Married without children 16 7.0 90.9- Married with children 20 8.7 99.6
- Divorce 1 .4 100.0
Education 230
- High school 2 .9 .9
- Colleague 14 6.1 7.0
- University 141 61.3 68.3
- Postgraduate 73 31.7 100.0
Age 230
- <=25 year olds 111 48.3 48.3
- 26-35 year olds 117 50.9 99.1
- 36-45 year olds 2 .9 100.0
Career 230
- Officer 202 87.8 87.8- Management/ Manager 9 3.9 91.7
- Others 19 8.3 100.0
Income 229
- Less than 5 mil./month 70 30.4 30.4
- 5 - 9 mil./month 105 45.7 76.1

8/12/2019 Cao Hoc Quan Tri Kinh Doanh ISB Mbus2010 Phan Thanh Si
http://slidepdf.com/reader/full/cao-hoc-quan-tri-kinh-doanh-isb-mbus2010-phan-thanh-si 31/73
23
Characteristics Frequency % Cumulative %
- 10 - 14 mil./month 31 13.5 89.6
- 15 -24 mil./month 18 7.8 97.4
- 25 - 40 mil./month 3 1.3 98.7
- more than 40 mil./month 3 1.3 100.0
House Size Choosing 229
- less than 50 m2 22 9.6 9.6
- 51-75 m2 93 40.6 50.2
- 76-100 m2 78 34.1 84.3
- 101-150 m2 24 10.5 94.8
- more than 150 m2 12 5.2 100.0
House Price choosing 229
- Less than 20 mil./m2 200 87.3 87.3
- 21-32 mil./m2 21 9.2 96.5
- more than 32 mil./m2 8 3.5 100.0
House type choosing 227
- Apartment 49 21.6 21.6
- Single house 167 73.6 95.2
- Villa 11 4.8 100.0
4.3. ASSESSMENT MEASUREMENT SCALE
In order to evaluate appropriation of a measurement scale, the scale should be
checked its reliability and validity. The reliability was tested by Cronbach’s Alpha
and the validity was tested by EFA.
4.3.1. Cronbach’s Alpha
Refer to the Case processing summary of all variables of five concepts, the number
samples of each concepts was valid with 230 available cases.

8/12/2019 Cao Hoc Quan Tri Kinh Doanh ISB Mbus2010 Phan Thanh Si
http://slidepdf.com/reader/full/cao-hoc-quan-tri-kinh-doanh-isb-mbus2010-phan-thanh-si 32/73
24
Based on the Reliability Statistics Table 4.3 and Table 4.9, all Cronbach’s Alpha
values of all concepts were above .7 after deleting items that the “Corrected item-
Total correlation” values of them were less than .3.
For “feature” concept, both “Fea06_Construction duration” item and “Fea07_Type
of house”, their “Corrected item-Total correlation” values were .253 and .08. For
meaning consideration, the “feature” concept could be measured by remaining
items, so both of them should be deleted. After they were removed, the Cronbach’s
Alpha value increased from .748 to .830.
For “private living space” concept, the “Corrected item - Total correlation” value of“Liv04_Living room size” item was low with .371, of “Liv05_Storey of house”
item was .012. All other items ensured the content of “living space”, so those two
items should be deleted and the Cronbach’s Alpha value of “private living space”
increased from .619 to .739, this value was not high, but it could be acceptable.
For “finance” concept, the “Corrected item - Total correlation” value of
“Fin07_Registration Fee” item was .013, less than 0.3, so this item was deleted.
Also, “Corrected item - Total correlation” value of “Fin02_Max Mortgage” item
was quite low .36, it should be also deleted. The Cronbach’s Alpha value of “private
living space” increased from .726 to .865, this value was so quite good.
For “distance” concept, the “Corrected item - Total correlation” value of
“Dis06_Business Distance” item and “Dis07_Main Access” which were .139 and
.202. Those values were too low compared with .3, so they should be deleted.
Beside, the “Corrected item - Total correlation” value of “Dis05_Recreation
Distance” was .377, it also should be deleted. The Cronbach’s Alpha value of
“Distance” concept was increased from .765 to .890.
For “environment” concept, the “Corrected item - Total correlation” value of
“Env03_View” item and “Env06_Nearby traffic” which were .284 and .272. Those
values were less than .3 and the “Env06_Nearby Traffic” and “View” could be

8/12/2019 Cao Hoc Quan Tri Kinh Doanh ISB Mbus2010 Phan Thanh Si
http://slidepdf.com/reader/full/cao-hoc-quan-tri-kinh-doanh-isb-mbus2010-phan-thanh-si 33/73
25
explained by characteristics of “Noise”, “Pollution”, “Neighbour Condition”, and
“Security” of the environment, so they were removed. The Cronbach’s Alpha value
of “environment” concept was increased from .767 to .846 after deleting two itemsabove.
Finally, “decision” concept had got all the “Corrected item - Total correlation”
value of all items were above .4, and its Cronbach’s Alpha value was .816, those
values were quite good.
Table 4.3: Cronbach’s Alpha test results
Variables
Scale
Mean if
Item
Deleted
Scale
Variance
if Item
Deleted
Corrected
Item-Total
Correlation
Cronbach's
Alpha if
Item Deleted
FEATURE: Alpha= .830
Fea01_House Size 15.39 3.933 .791 .744
Fea02_House's Legal Status 16.97 4.536 .484 .848
Fea03_Interior Design 16.09 4.927 .601 .805
Fea04_External Design 15.53 5.325 .458 .838
Fea05_Construction Quality 16.29 4.094 .874 .724
LIVING SPACE: Alpha= .739
Liv01_Kitchen Size 9.89 3.774 .524 .659
Liv02_Bedroom Quantity 9.85 3.882 .586 .630
Liv03_Bathroom Quantity 10.42 3.398 .583 .622FINANCE: Alpha= .865
Fin01_House Price 16.38 9.476 .654 .846
Fin03_Max Repayment 17.15 7.463 .781 .812
Fin04_Interest rate 16.93 7.737 .790 .808
Fin05_Income 16.52 8.862 .734 .827

8/12/2019 Cao Hoc Quan Tri Kinh Doanh ISB Mbus2010 Phan Thanh Si
http://slidepdf.com/reader/full/cao-hoc-quan-tri-kinh-doanh-isb-mbus2010-phan-thanh-si 34/73
26
Fin06_Payment Duration 17.04 9.614 .506 .878
DISTANCE: Alpha= .890
Dis01_Adjacent Street 11.00 6.677 .638 .900Dis02_Work Distance 10.87 4.830 .759 .876
Dis03_Market Distance 11.28 5.774 .878 .818
Dis04_School Distance 11.33 5.793 .825 .835
ENVIRONMENT: Alpha= .846
Env01_Neighbour Condition 12.50 3.168 .727 .796
Env02_Security 12.35 3.573 .622 .840
Env04_Noise 12.14 2.289 .754 .786
Env05_Pollution 11.83 2.598 .735 .783
DECISION: Alpha= .816
Dec01_Plan to buy 6.33 1.691 .794 .617
Dec02_Try to buy 6.07 3.013 .461 .928
Dec03_Important Person 6.26 2.141 .819 .598
4.3.2. Exploratory Factor Analysis (EFA)
Exploratory factor analysis was carried out through three steps consisting of the 1st
step was evaluation the suitability of data for factor analysis, the 2 nd step was factor
extraction, and the 3rd step was factor rotation and interpretation (Pallant, 2011).
4.3.2.1. Assessment of data
Sample size
Sample size and the strength of the relationship among the variables were required
to test suitability of data (see Table 4.12). The sample size was 230 available cases
and shown detail in chapter 3 that this requirement was met the minimum required
sample size.

8/12/2019 Cao Hoc Quan Tri Kinh Doanh ISB Mbus2010 Phan Thanh Si
http://slidepdf.com/reader/full/cao-hoc-quan-tri-kinh-doanh-isb-mbus2010-phan-thanh-si 35/73
27
Factorability of the correlation matrix
From the pattern matrix, low communality values should be removed to increase the
total explained variance. Removing some low communality variables and repeatingthe same analysis, the result of EFA was presented in the Table 4.4. From the partial
Correlation Matrix Table 4.5, some of the correlation coefficients between variables
each others were above .3.
The KMO value was .779, exceeding value of .6 and Bartlett’s test of Sphericity
value was .000, that means less than the statistically significant at p < .05 (see Table
4.10).
Therefore, the condition about the factorability of the correlation matrix was
appropriated with assumptions of EFA.
4.3.2.2. Defining number of extracted factors
From Total variance explained value in Table 4.11, there were first six components
with eigenvalues above 1 including following values: 6.335; 3.099; 2.860; 2.259;
1.647 and 1.166. And those components explained total 64.26% of the variance,
exceeding than 50% explained total, so this value was appropriate.In addition, the Scree Plot Figure 4.1 showed that there was hard break from
components 2 and 3, and both of components 1 and 2 xplained 36.64% than four
remaining components. However, there was slight break after component 6, so the
number of extracted factors was six.
From the Factor Matrix Table 4.13, the first component presented most of the items
loaded on it while the second three components loaded quite the same, and the final
two components loaded the least.
In the Pattern Matrix Table 4.4, all items loading on six components were above .4.
Besides, there were five items loading on component 1, four items loading on
component 2, five items loading on component 3, three items loading on component
4, four items loading on component 5, and four items loading on component 6.

8/12/2019 Cao Hoc Quan Tri Kinh Doanh ISB Mbus2010 Phan Thanh Si
http://slidepdf.com/reader/full/cao-hoc-quan-tri-kinh-doanh-isb-mbus2010-phan-thanh-si 36/73
28
Table 4.4: EFA results

8/12/2019 Cao Hoc Quan Tri Kinh Doanh ISB Mbus2010 Phan Thanh Si
http://slidepdf.com/reader/full/cao-hoc-quan-tri-kinh-doanh-isb-mbus2010-phan-thanh-si 37/73
29
From the Correlation Table 4.5, the information about samples was enough with N
equal 230 available cases. Also, the direction of the relationship between the
variables, the correlations values were positive, that means one variable waschanged, the others would change follow the same direction. All the Pearson
Correlation values were less than .7 compared with the permitted range from -1 to
1, and should less than .7 (Pallant, 2011). Moreover, the significant level almost less
than .05, except the significant of correlation between Finance variable and Feature
variable, along with Finance variable and LivSpace variable, so all variables had got
a quite strong correlation and supported to explain together.
Table 4.5: Correlations among variablesFeature Finance Space Distance Environ
mentDecision
Feature
PearsonCorrelation
1 .118 .303** .216** .144* .156*
Sig. (2-tailed) .075 .000 .001 .029 .018
N 230 230 230 230 230 230
Finance
Pearson
Correlation .118 1 .092 .205**
.175**
.189**
Sig. (2-tailed) .075 .165 .002 .008 .004
N 230 230 230 230 230 230
Liv-Space
PearsonCorrelation
.303** .092 1 .287** .307** .399**
Sig. (2-tailed) .000 .165 .000 .000 .000 N 230 230 230 230 230 230
Distance
PearsonCorrelation
.216** .205** .287** 1 .411** .574**
Sig. (2-tailed) .001 .002 .000 .000 .000 N 230 230 230 230 230 230
Environment
PearsonCorrelation
.144* .175** .307** .411** 1 .214**
Sig. (2-tailed) .029 .008 .000 .000 .001 N 230 230 230 230 230 230
Decision
PearsonCorrelation
.156* .189** .399** .574** .214** 1
Sig. (2-tailed) .018 .004 .000 .000 .001
N 230 230 230 230 230 230

8/12/2019 Cao Hoc Quan Tri Kinh Doanh ISB Mbus2010 Phan Thanh Si
http://slidepdf.com/reader/full/cao-hoc-quan-tri-kinh-doanh-isb-mbus2010-phan-thanh-si 38/73
30
4.4.1.3. Normality, linearity, homoscedasticity & outliers
In the Normal Probability Plot (P-P) of the Regression Standardised Residual, mostof scores concentrated in the centre and along the 0 point (see Table 4.3). Also, the
Scatterplot Figure 4.4 showed that almost the presence of outliers were from -2 to
+2, there were only few of outline less than -3.0, so those value were acceptable. In
order to discover which items had got their values exceed permitted range (-3; 3),
the Casewise Diagnostics Table 4.17 was checked and recognized that the case 105
with a standard residual value of minus 3.23 and the case 205 with a standard
residual value of minus 3.37, those values less than minus 3 and fell outside the
normally distributed sample. However, this value was less than 1 percent of cases
to fall outside the range of below minus 3.0 or above 3.0, so the Normality
condition was appropriated.
Outliers were checked through the Mahal. Distance value of Residual Statistics
Table 4.18. This research had got five independent variables, so the critical value
4.4. HYPOTHESES TESTING BY MULTIPLE REGRESSION
4.4.1. Checking assumption of Multiple Regression
4.4.1.1. Sample sizeThe actual cases with 230 available respondents were more than the 90 minimum
required sample size of the multiple regression based on Item 3.2 in Chapter 3, so
the required sample size of multiple regression was available.
4.4.1.2. Assessment multicollinearity of independent variables
From the Coefficient Table 4.6, the tolerance indicators were quite high from .782
to .943 and those values were higher than the required value of .10. Also, the VIFvalues which were inversed of the Tolerance values and required not above 2 were
less than 2, so those VIF values were quite good. Conclusion, the multicollinearity
among independent variables did not violate.

8/12/2019 Cao Hoc Quan Tri Kinh Doanh ISB Mbus2010 Phan Thanh Si
http://slidepdf.com/reader/full/cao-hoc-quan-tri-kinh-doanh-isb-mbus2010-phan-thanh-si 39/73
31
was 24.32 (Tabachnick & Fidell, 2007). In this study, although the maximum value
was 34.23, the mean of outliers was 4.98, hence the outliers could be acceptable.
Consequently, all assumptions of the multiple regression were available.
4.4.2. Evaluating the model
From the Model Summary box (see Table 4.15), the R Square value of .356 shown
that there was 35.6 percent of the variance in the Decision dependent variable
explained by the model. From the Anova Table 4.16, the significance of the result
was .000, this means p < .0005, so the significance of the model was available.
4.4.3. Evaluating the independent of variables
Refer to the Cofficient Table 4.6, the Standardised coefficients labeled Beta showed
each of different variables have been converted to the same scale to compare the
contribution to explain “decision” dependent variable of independent variables. The
strongest contribution to explain “decision” was “distance” with the largest Beta
.522, the second strongest contribution was “living space” with the Beta .186. On
the contrary, “feature”, “finance” and “environment” were very small contributionto explain the “decision” dependent variable, they were considered to be explained
by “living space” and “distance”.
Moreover, according to the significant column, the significant values of “living
space” and “distance” were less than .05, while the significant value of “feature”,
“finance” and “environment” were greater than .05. Therefore, “living space” and
“distance” made a significant unique contribution to the prediction of the dependent
variable; otherwise, ‘feature”, “finance” and “environment” did not make a
significant unique contribution to the prediction of ‘decision” dependent variable.

8/12/2019 Cao Hoc Quan Tri Kinh Doanh ISB Mbus2010 Phan Thanh Si
http://slidepdf.com/reader/full/cao-hoc-quan-tri-kinh-doanh-isb-mbus2010-phan-thanh-si 40/73
32
Table 4.6: Coefficient table of MLR
4.4.4. Checking hypotheses of model
For hypothesis H1, the relationship between “feature” and “house purchase
decision” was the positive relationship with the “zero-order” correlation value of
positive .167. However, the significant value of “features” was .951, bigger .05 and
its Beta value was .003, so “feature” did not support to predict the “decision”
dependent variable.
Refer to hypothesis H2, there was a strong contribution of the “living space”
independent variable to the “decision” dependent variable because the correlation
zero-order value of .329, and the significant was .002, less than .05. In addition, the
Beta value of “living space” was .186, so it strongly supported to predict “decision”
dependent variable.

8/12/2019 Cao Hoc Quan Tri Kinh Doanh ISB Mbus2010 Phan Thanh Si
http://slidepdf.com/reader/full/cao-hoc-quan-tri-kinh-doanh-isb-mbus2010-phan-thanh-si 41/73
8/12/2019 Cao Hoc Quan Tri Kinh Doanh ISB Mbus2010 Phan Thanh Si
http://slidepdf.com/reader/full/cao-hoc-quan-tri-kinh-doanh-isb-mbus2010-phan-thanh-si 42/73
34
on house purchase
decision
dependent variable because
the significant value was
above .05
H4 There is a positive
impact of distance on
house purchase decision
.522 .566 .000 Positive impact,
very strong support for
explaining dependent variable
H5 There is a positive
impact of local
environment on house
purchase decision
-
.048
.233 .425 Positive impact,
no support for explaining
dependent variable because
the significant value was
above .05
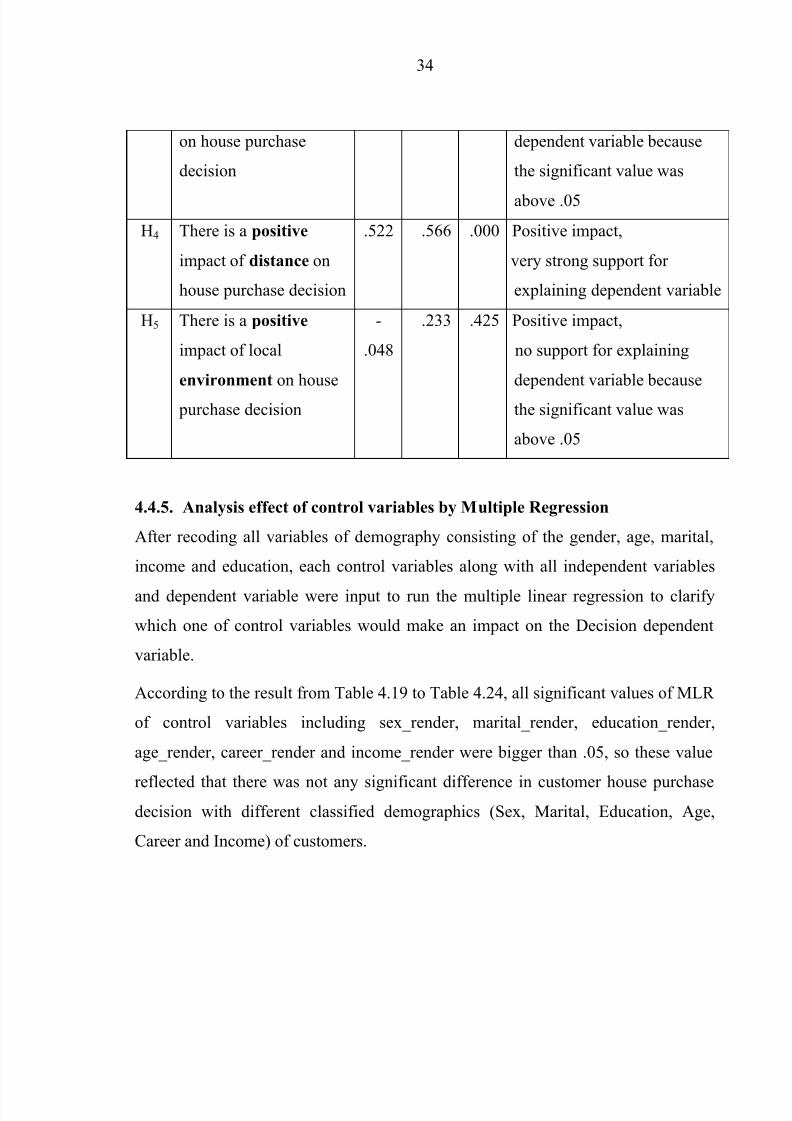
4.4.5. Analysis effect of control variables by Multiple Regression
After recoding all variables of demography consisting of the gender, age, marital,
income and education, each control variables along with all independent variables
and dependent variable were input to run the multiple linear regression to clarify
which one of control variables would make an impact on the Decision dependent
variable.
According to the result from Table 4.19 to Table 4.24, all significant values of MLR
of control variables including sex_render, marital_render, education_render,
age_render, career_render and income_render were bigger than .05, so these value
reflected that there was not any significant difference in customer house purchasedecision with different classified demographics (Sex, Marital, Education, Age,
Career and Income) of customers.

8/12/2019 Cao Hoc Quan Tri Kinh Doanh ISB Mbus2010 Phan Thanh Si
http://slidepdf.com/reader/full/cao-hoc-quan-tri-kinh-doanh-isb-mbus2010-phan-thanh-si 43/73
35
CHAPTER 5. CONCLUSIONS AND IMPLICATIONS
This chapter summarizes the main areas covered in the thesis, presents the key
findings of the research, proposes managerial implication, shows the research
limitation and recommends for the future research.
5.1. RESEARCH OVERVIEW
The research defined the key factors on which the real estate agents, companies or
investors should focus when they expected to know on which regarding areas with
customers’ housing purchase decision making.
Based on the previous research, main variables were chosen and divided into groups
and a framework model was created to express the relationship between five
independent variables consisting of “feature”, “finance”, “living space”, “distance”,
“environment” and one “decision” dependent variable.
The study was begun with using the pilot test to adjust the questionnaire and to
check the clear meaning of the revised questionnaire, continued with data analysis
of reliability by using Cronbach’s Alpha analysis and of validity by using
Exploratory Factor Analysis, and ended with model and hypotheses testing by using
the multiple regression; moreover, the effect of demography on the dependent
variables was considered as well.
5.2. RESEACH FINDINGS
The multiple regression of the study shows that “house feature”, “finance”, “living
space”, “distance” and “environment” make a positive impact on “house purchasedecision”. The research results also shows that there are main 21 items which are
included in independent variables of the model affecting decision making to
purchase real estate of customers. These findings were shown that “house features”
are not consisted of “outdoor space” including “presence of garden” and “size of
garden” of Opoku & Abdul-Muhmin (2010, p.223), that can be explained by
shortage of land in Ho Chi Minh City in Vietnam. Also, “environment” of research

8/12/2019 Cao Hoc Quan Tri Kinh Doanh ISB Mbus2010 Phan Thanh Si
http://slidepdf.com/reader/full/cao-hoc-quan-tri-kinh-doanh-isb-mbus2010-phan-thanh-si 44/73
36
results are agreed with “environment” result of Adair et al. (1996, p.22), but there is
different with “slope/topography of the land” and “wooded area/ tree coverage”
from “environment” variables of Adair et al. (1996, p.22). Those differences caused by the tree factor are not paid much attention in Vietnam and many Vietnamese
environmental indicators are below average as announced by the World Economic
Forum in 2012.
The findings of the study show that customer demands with house price less than 20
million per square meter are very much at the rate of 87.9 percent of respondents,
and from 21 to 32 million per square meter are 9.1 percent of respondents. Hence,the low-medium income market is very large and need to be concentrated on it. The
most priority of customers is single house with small size of 72.6 percent, and the
second one is apartment of 21.3 percent. The research findings agree with the result
toward the small house of consumers in Saudi Arabia (Opoku & Abdul-Muhmin,
2010, p.224).
On the other hand, the results of the study has found that the demography consisting
of gender, marital status, education, ages, career and income are not support to
explain dependent variable and no difference of customer decision making in the
different multi-group analysis between gender, age, marital status, income and
education level. The findings of this study are contrary to Haddad (2011, p.234)
where there are significant differences in customer decision due to gender and age.
It is explained by customers of age less than 36 of the research are at the rate of 99.1
percent. In addition, there is a strict “gender” separation in Saudi Arabia, adjacentJordan country (Opoku & Abdul-Muhmin, 2010, p.222).
5.3. MANAGERIAL IMPLICATIONS
The better knowledge of real estate consumer and their household decision making
will lead prediction of decision making in the real estate, it is important role for
both managerial board of real estate enterprises and investors. Also, this study has
got practical implications for individual and decision makers in organizations to

8/12/2019 Cao Hoc Quan Tri Kinh Doanh ISB Mbus2010 Phan Thanh Si
http://slidepdf.com/reader/full/cao-hoc-quan-tri-kinh-doanh-isb-mbus2010-phan-thanh-si 45/73
37
decide suitable strategies in marketing or investment to attract, especially segment
of low-medium income customers with priority to small houses than apartments is
very high.
It creates a general picture about customer demands for government to develop right
housing programs. From the research finding, it is suggested to concentrate on
programs for low-medium income citizens due to their huge demands for house.
Moreover, the real estate agencies or enterprises can use the model and list of items
as the checklist to consider during house purchase decision-making process of
customers.
5.4. RESEARCH LIMITATIONS & DIRECTIONS FOR FUTURE
RESEARCH
Data of the research are surveyed in Ho Chi Minh City with a few main
postgraduates and student groups of UEH with limited characteristics of
demography. Therefore, it is recommended to conduct a survey with different areas
in Vietnam with lager target population. It will be useful to extend ages level of
respondents of above than 36 so that comparing with many different age levels will be better. Also, it will be interesting to investigate decision-making of husband and
wife parties solely on which of the factors.
Moreover, it is recommended that future research will concentrate on exploring
detail of customer choosing with each type of houses separately such as apartments,
villas, commercial buildings, officers. Besides, it is concerned to have more
research about real estate officers and companies to meet their demands to rent
officers, commercial buildings or villas.
In the multiple regression analysis, although in the theory of the previous research,
there is contribution to explain dependent variable from the independent variables
of ‘feature”, “finance” and “environment”, but their beta values and significant of
the research showed that they are not contribute to explain the main dependent
variable of house purchasing decision, so this result needs to be noted in the future
research.

8/12/2019 Cao Hoc Quan Tri Kinh Doanh ISB Mbus2010 Phan Thanh Si
http://slidepdf.com/reader/full/cao-hoc-quan-tri-kinh-doanh-isb-mbus2010-phan-thanh-si 46/73
38
REFERENCES
Adair, A., Berry, J., & McGreal, S. (1996). Valuation of residential property:
Analysis of participant behaviour. Journal of Property Valuation & Investment , 14(1), 20-35.
Ajzen, I. (1991). The theory of planned behavior. Organizational Behavior and
Human Decision Processes, 50, 179-211.
Anh, V. (2012). Minister of construction: Currently in ventories are nearly 16,500
apartments. Retreived Dec 22, 2012, from
http://dangcongsan.vn/cpv/Modules/News/NewsDetail.aspx?co_id=0&cn_id=552238
Bargh, J. A. (2002, September). Losing consciousness: Automatic influences on
consumer judgment, behavior and motivation. Journal of Consumer
Research, 29, 280-285.
Bettman, J. R., Luce, M. F., & Payne, J. W. (1998). Constructive consumer choice
processes. Journal of Consumer Research, 25(3), 187-217.
Cronbach, L. J. (1951). Coefficient alpha and the internal structure of tests.
Psychometrika, 16(3), 297-334.
Daly, J., Gronow, S., Jenkins, D., & Plimmer, F. (2003). Consumer behaviour in the
valuation of residential property: A comparative study in the UK, Ireland and
Australia. Property Management , 21(5), 295-314.
Dawson, S., Bloch, P., & Ridgway, N. (1990). Shopping motives, emotional states
and retail outcomes. Journal of Retailing , 66, 408-427.
DeVellis, R. F. (2003). Scale Development: Theory and application (2nd ed.).
California: Thousand Oaks.
Donald, R. C., & Pamela, S. S. (2006). Business research methods (9th ed.). New
York: McGraw-Hill.

8/12/2019 Cao Hoc Quan Tri Kinh Doanh ISB Mbus2010 Phan Thanh Si
http://slidepdf.com/reader/full/cao-hoc-quan-tri-kinh-doanh-isb-mbus2010-phan-thanh-si 47/73
39
Edwards, W., & Fasolo, B. (2001). Decision technology. Annual Review of
Psychology, 52, 581-606.
Erdener, K., & Lois, S. (1982). Comparative study of home buying behaviour of
atlantic canadians. Management Research News, 5(1), 3-11.
Gabriel, A., & Rosenthal, S. (1989). Household location and race: Estimates of a
multinomial logit model. The Review of Economics and Statistics, 71(2),
240-249.
Gattiker, U. E., Perlusz, S., & Bohmann, K. (2000). Using the internet for B2B
activities: A review and future directions for research, internet research. Electronic Networking Applications and Policy, 10, 126-140.
Gibler, K. M., & Nelson, S. L. (2003). Consumer behavior applications to real
setate education. Journal of Real Estate Practice and Education, 6(1), 63-83.
Graaskamp, J. A. (1981). The fundamentals of the real estate development process.
Washington: The Urban Land Institute.
Haddad, M., Judeh, M., & Haddad, S. (2011). Factors affecting buying behavior of
an apartment and empirical investigation in Amman, Jordan. Applied
Sciences, Engineering and Technology, 3(3), 234-239.
Hair, J. F., Anderson, R. E., Tatham, R. L., & Black, W. (1998). Multivariate data
analysis. New York: Prentice-Hall.
Hair, J. F., Black, B., Babin, B., Anderson, R. E., & Tatham, R. L. (2010).
Multivariate data analysis: A Global Perspective. New York: Pearson
Education.
Han, H., & Kim, Y. (2010). An investigation of green hotel customer’s decision
formation: Developing an extended model of the theory of planned behavior.
International Journal of Hospitality Management , 29 (4), 659-668.
Harris, I., & Young, S. (1983, June). Buyer motivations: Human needs. Real Estate
Today, 29-30.

8/12/2019 Cao Hoc Quan Tri Kinh Doanh ISB Mbus2010 Phan Thanh Si
http://slidepdf.com/reader/full/cao-hoc-quan-tri-kinh-doanh-isb-mbus2010-phan-thanh-si 48/73
40
Hinkle, T. F., & Combs, E. R. (1987). Managerial behaviour of home buyers.
Journal of Consumer Studies & Home Economics, 11 (4), 375-386.
Iman, N., Ahmad, S., & Ahmadreza, V. (2012). Housing valuation model: An
investigation of residential properties in Tehran. International Journal of
Housing Markets and Analysis, 5(1), 20-40.
Kaiser, H. F. (1958). The Varimax Criterion for Analytic Rotation in Factor
Analysis. Psychometrica, 23, 187-200.
Kinnard, W. N. (1968). Reducing uncertainty in real estate decisions. The Real
Estate Appraiser , 34(7), 10-16.Kunshan, W., & Yiman, T. (2011). Applying the extended theory of planned
behavior to predict the intention of visiting a green hotel. African Journal of
Business Management, 5(17), 7579-7587.
Mateja, K. K., & Irena, V. (2009). A strategic household purchase: Consumer house
buying behavior. Managing Global Transitions, 7(1), 75-96.
Morel, J. C., Mesbah, A., Oggero, M., & Walker, P. (2001). Building houses with
local materials: Means to drastically reduce the environmental impact of
constructions. Building Environment , 36, 1119-1126.
Morwitz, G., & David, S. (1992). Using segmentation to improve sales forecasts
based on purchase intent: Which “intenders” actually buy? Journal of
Marketing Research, 29(11), 391-405.
Opoku, R., & Abdul-Muhmin, A. (2010). Housing preferences and attribute
importance among low-income consumers in Saudi Arabia. Habitat
International , 34, 219-227.
Quigley, J. M. (1976). Housing demand in the short run: An analysis of
polychromous choice. Explorations in Economic Research, 3, 76-102.
Quigley, J. M. (1985). consumer choice of dwelling, neighborhood and public
services. Regional Science and Urban Economics, 15, 41-63.
8/12/2019 Cao Hoc Quan Tri Kinh Doanh ISB Mbus2010 Phan Thanh Si
http://slidepdf.com/reader/full/cao-hoc-quan-tri-kinh-doanh-isb-mbus2010-phan-thanh-si 49/73
41
Pallant, J. (2011). SPSS survival manual. A step by step guide to data analysis using
SPSS (4th ed.). Australlia: Allen & Unwin.
Ratchatakulpat, T., Miller, P., & Marchant, T. (2009). Residential real estate
purchase decision: Is it more than location. International Real Estate Review,
12(3), 237-294.
Sengul, H., Yasemin, O., & Eda, P. (2010). The assessment of the housing in the
theory of Maslow’s hierarchy of needs. European Journal of Social Sciences,
16(2), 214-219.
Simonson, I., Carmon, Z., Dhar, R., Drolet, A., & Nowlis, S. (2001). Consumerresearch: On search of identity. Annual Review of Psychology, 52, 249-275.
Tabachnick, B. G., & Fidell, L. S. (2001). Using Multivariate Statistics. Boston:
Pearson Education.
Tabachnick, B. G., & Fidell, L. S. (2007). Using Multivariate Statistics (5th ed.).
Boston: Pearson Education.
Xiao, Q., & Tan, G. (2007). Signal extraction with kalman filter: A study of the
Hong Kong property price bubbles. Urban Studies, 44(4), 865-888.
Yalch, R., & Spangenberg, E. (1990). Effects of store music on shopping behavior.
The Journal of Consumer Marketing, 7(2), 55-63.
Yongzhou, H. (2009). Housing price bubbles in Beijing and Shanghai. International
Journal of Housing Markets and Analysis, 3(1), 17-37.
Zhang, X., Prybutok, V., & Strutton, D. (2007). Modeling influences on impulse
purchasing behavior during online marketing transation. Journal of
Marketing Theory and Practice, 15, 78-89.
Wells, W. D. (1993). Discovery oriented consumer research. Journal of Consumer
Research, 19(4), 489-504.

8/12/2019 Cao Hoc Quan Tri Kinh Doanh ISB Mbus2010 Phan Thanh Si
http://slidepdf.com/reader/full/cao-hoc-quan-tri-kinh-doanh-isb-mbus2010-phan-thanh-si 50/73
42
Appendix 1: The first draft of the questionnaire
No. Factors
Is the ...
an important element to a
house purchase decision?
%Agreed
Commentsof the first pilot test
1House
Feature
Area of usable floor of the
house100%
- The item “finishing”
(3&4) should be deleted
because its content was
inside the content of
“construction quality”.
2 Status of house legal 100%
3 Type of finishing 20%
4 Quality of finishing 40%
5Interior design and
decoration100%
6 External design 80%
7 Construction quality 100%
8 Construction duration 80%
9Type of house (Town house,
apartment, villa)100%
10 Private
Living
Size
Size of kitchen 100% - Agreed with all items of
the “private living size”.11 Quantity of bedrooms 100%
12 Quantity of bathrooms 80%
13 Size of living room 100%
14 Storey of house 80%
15 Finance House price 100% - It should be added item
“the registration fee’ based
on “tax” item.
16 Maximum mortgage 100%
17 Maximum monthly payable 80%
18 Interest rate 100%
19 Your monthly income 100%
20 Payment duration 100%
21 The registration fee 80%
8/12/2019 Cao Hoc Quan Tri Kinh Doanh ISB Mbus2010 Phan Thanh Si
http://slidepdf.com/reader/full/cao-hoc-quan-tri-kinh-doanh-isb-mbus2010-phan-thanh-si 51/73

8/12/2019 Cao Hoc Quan Tri Kinh Doanh ISB Mbus2010 Phan Thanh Si
http://slidepdf.com/reader/full/cao-hoc-quan-tri-kinh-doanh-isb-mbus2010-phan-thanh-si 52/73
44
No. Factors
Is the ...
an important element to a
house purchase decision?
%
Agreed
Comments
of the first pilot test
40 Nearby traffic 60%
41 Decision I have got a plan to buy a
new house.100%
- Agreed with all of items.
42 I will make my effort to buy
a new house100%
43 I am an important person
affecting house purchase
decision of my family.
100%

8/12/2019 Cao Hoc Quan Tri Kinh Doanh ISB Mbus2010 Phan Thanh Si
http://slidepdf.com/reader/full/cao-hoc-quan-tri-kinh-doanh-isb-mbus2010-phan-thanh-si 53/73
45
Appendix 2: The English questionnaire
Dear Sir/ Madam,
In period of economic crisis at present, the business status of Vietnamese enterprises has
been facing with many difficulties and big challenges. One of departments has been
seriously affected most is the real estate with the quantity of exchanges decreased
seriously.
It is necessary and useful for both business enterprises of real estate partially and relative
real estate companies generally to measure right the key factors affecting house purchase
decision of customers.
You are pleased to give some your worth time to answer the following questionnaire. All
information from this questionnaire will be secret and used for research purpose only.
Thank you.
THE QUESTIONNAIRE
PART 1: THE MAIN FACTORS AFFECTING HOUSE PURCHASE DECISION
Please consider carefully each variable, then basing on your knowledge and experience,you will measure the important rate of each variables affecting your house purchase
decision by circle which one you consider it as the best.
Scale from 1 to 5:
1 2 3 4 5
Totally Unimportant Very Important (sentence 1 to 31 )
Strongly Disagree Strongly Agree (sentence 32 to 34)
No.Is the ...
an important element to a house purchase decision? Important level
1 Area of usable floor of the house 1 2 3 4 5
2 Interior design and decoration 1 2 3 4 5
3 House price 1 2 3 4 5
4 Construction duration 1 2 3 4 5

8/12/2019 Cao Hoc Quan Tri Kinh Doanh ISB Mbus2010 Phan Thanh Si
http://slidepdf.com/reader/full/cao-hoc-quan-tri-kinh-doanh-isb-mbus2010-phan-thanh-si 54/73

8/12/2019 Cao Hoc Quan Tri Kinh Doanh ISB Mbus2010 Phan Thanh Si
http://slidepdf.com/reader/full/cao-hoc-quan-tri-kinh-doanh-isb-mbus2010-phan-thanh-si 55/73
47
No.Is the ...
an important element to a house purchase decision? Important level
33 I will make my effort to buy a new house 1 2 3 4 5
34I am an important person affecting house purchase decision of my
family.1 2 3 4 5
PART II: GENERAL INFORMATION
Please stick a cross (x) into the appropriate blanks
1. Gender Male:
Female:
2. Marital
Single without children ( ) Married with children ( )
Single with children ( ) Divorced ( )
Married without children ( )
3. Education
Highchool ( ) University ( )
Colleague ( ) Postgraduate ( )
4. Ages
≤ 25: ( ) 26-35: ( ) 36-45: ( ) 46-55: ( ) Above 55 ( )
5. Career
Worker
Officer
Business owner/ Manager Other (Please specify): …………..
6. Your monthly income
< 5 million VND ( ) 15-24 million VND ( )
5-9 million VND ( ) 25-40 million VND ( )

8/12/2019 Cao Hoc Quan Tri Kinh Doanh ISB Mbus2010 Phan Thanh Si
http://slidepdf.com/reader/full/cao-hoc-quan-tri-kinh-doanh-isb-mbus2010-phan-thanh-si 56/73

8/12/2019 Cao Hoc Quan Tri Kinh Doanh ISB Mbus2010 Phan Thanh Si
http://slidepdf.com/reader/full/cao-hoc-quan-tri-kinh-doanh-isb-mbus2010-phan-thanh-si 57/73

8/12/2019 Cao Hoc Quan Tri Kinh Doanh ISB Mbus2010 Phan Thanh Si
http://slidepdf.com/reader/full/cao-hoc-quan-tri-kinh-doanh-isb-mbus2010-phan-thanh-si 58/73
50
TT
Yếu tố....
có quan trọng đến quyết định mua nhà không?
Mức độ
quan trọng
1 Diện tích sử dụng của ngôi nhà 1 2 3 4 5
2 Thiết kế và trang trí bên trong 1 2 3 4 5
3 Giá của ngôi nhà 1 2 3 4 5
4 Thời gian xây dựng ngôi nhà 1 2 3 4 5
5 Kiến trúc bên ngoài ngôi nhà 1 2 3 4 5
6 Diện tích phòng khách 1 2 3 4 5
7 Khả năng thế chấp tối đa 1 2 3 4 5
8 Khả năng thanh toán nợ hàng tháng tối đa 1 2 3 4 5
9 Lãi suất vay 1 2 3 4 5
10 Thu nhập của Anh (Chị) 1 2 3 4 5
11 Chiều rộng của lòng đường gần nhà 1 2 3 4 5
12 Lối đến trục đường chính 1 2 3 4 5
13 Khoảng cách từ chỗ nhà đến nơi làm việc 1 2 3 4 5
14 Khoảng cách từ nhà đến các khu vực kinh doanh trung tâm 1 2 3 4 5
15 Diện tích của nhà bếp 1 2 3 4 5
16 Số lượng phòng ngủ 1 2 3 4 5
17 Hàng xóm xung quanh 1 2 3 4 5
18 Tình hình an ninh 1 2 3 4 5
19 Thời gian thanh toán nợ vay 1 2 3 4 5
20 Tình trạng pháp lý của ngôi nhà 1 2 3 4 5

8/12/2019 Cao Hoc Quan Tri Kinh Doanh ISB Mbus2010 Phan Thanh Si
http://slidepdf.com/reader/full/cao-hoc-quan-tri-kinh-doanh-isb-mbus2010-phan-thanh-si 59/73
51
TTYếu tố....
có quan trọng đến quyết định mua nhà không?
Mức độ
quan trọng
21 Lệ phí trước bạ mua nhà 1 2 3 4 5
22 Số lượng phòng tắm 1 2 3 4 5
23 Chất lượng xây dựng 1 2 3 4 5
24 Loại nhà (Nhà phố, nhà chung cư, biệt thự) 1 2 3 4 5
25 Số tầng của ngôi nhà 1 2 3 4 5
26 Cảnh quang xung quanh 1 2 3 4 5
27 Tiếng ồn xung quanh 1 2 3 4 5
28 Ô nhiễm của môi trường xung quanh 1 2 3 4 5
29 Khoảng cách từ nhà đến chợ 1 2 3 4 5
30 Khoảng cách đến trường học 1 2 3 4 5
31 Khoảng cách đến khu vui chơi giải trí 1 2 3 4 5
32 Tôi đang có kế hoạch để mua nhà. 1 2 3 4 5
33 Tôi sẽ cố gắng để mua nhà. 1 2 3 4 5
34 Tôi là người quan trọng để đóng góp vào quyết định mua nhà. 1 2 3 4 5
PHẦN II: THÔNG TIN CHUNG
Xin Anh/ Chị vui lòng đánh dấu vào các ô trống thích hợp:
1. Giới tính Nam: Nữ:
2. Tình trạng hôn nhân
Độc thân, không có con ( ) Đã lập gia đình, đã có con ( )
Độc thân, có con ( ) Đã ly hôn ( )
Đã lập gia đình, chưa có con ( )

8/12/2019 Cao Hoc Quan Tri Kinh Doanh ISB Mbus2010 Phan Thanh Si
http://slidepdf.com/reader/full/cao-hoc-quan-tri-kinh-doanh-isb-mbus2010-phan-thanh-si 60/73
52
3. Tình trạng học vấn
Trung học ( ) Đại học ( )
Cao đẳng ( ) Trên đại học ( )
4. Tuổi
≤ 25: ( ) 26-35: ( ) 36-45: ( ) 46-55: ( ) trên 55: ( )
5. Nghề nghiệp
Công nhân Nhân viên
Doanh nhân/ Nhà quản lý Khác (Xin ghi rõ): ……………..
6. Thu nhập hàng tháng của Anh (Chị)
< 5 triệu ( ) 15-24 triệu ( )
5-9 triệu ( ) 25-40 triệu ( )
10-14 triệu ( ) Trên 40 triệu ( )
7. Anh (Chị) đã mua hay dự định mua nhà với kích cỡ nhà ở như thế nào?
< 50 m2 ( ) 101-150 m2 ( )
51-75 m2 ( ) >150 m2 ( )
76-100 m2 ( )
8. Anh (Chị) đã mua hay dự định mua nhà với giá nhà trong khoảng nào?
< 4 triệu/m2 ( ) 15-20 triệu/m2 ( ) 33-38 triệu/m2 ( )
5-8 triệu/m2 ( ) 21-26 triệu/m2 ( ) 39-45 triệu/m2 ( )
9-14 triệu/m2 ( ) 27-32 triệu/m2 ( ) ≥ 45 triệu/m2 ( )
9. Anh (Chị) đã mua hay dự định mua loại nhà nào?
Chung cư ( ) Biệt thự đơn lập ( )

8/12/2019 Cao Hoc Quan Tri Kinh Doanh ISB Mbus2010 Phan Thanh Si
http://slidepdf.com/reader/full/cao-hoc-quan-tri-kinh-doanh-isb-mbus2010-phan-thanh-si 61/73
53
Nhà phố đơn lập ( ) Biệt thự song lập ( )
Nhà phố song lập ( ) Loại khác:…………….. ( )
10. Nếu đã mua, Anh (Chị) đã mua nhà năm nào dưới đây:
Trước năm 2000 ( ) 2007-2009 ( )
2001-2003 ( ) 2010-2012 ( )
2004-2006 ( )
Xin chân thành cám ơn sự giúp đỡ của Anh (Chị).
Trân trọng kính chào!
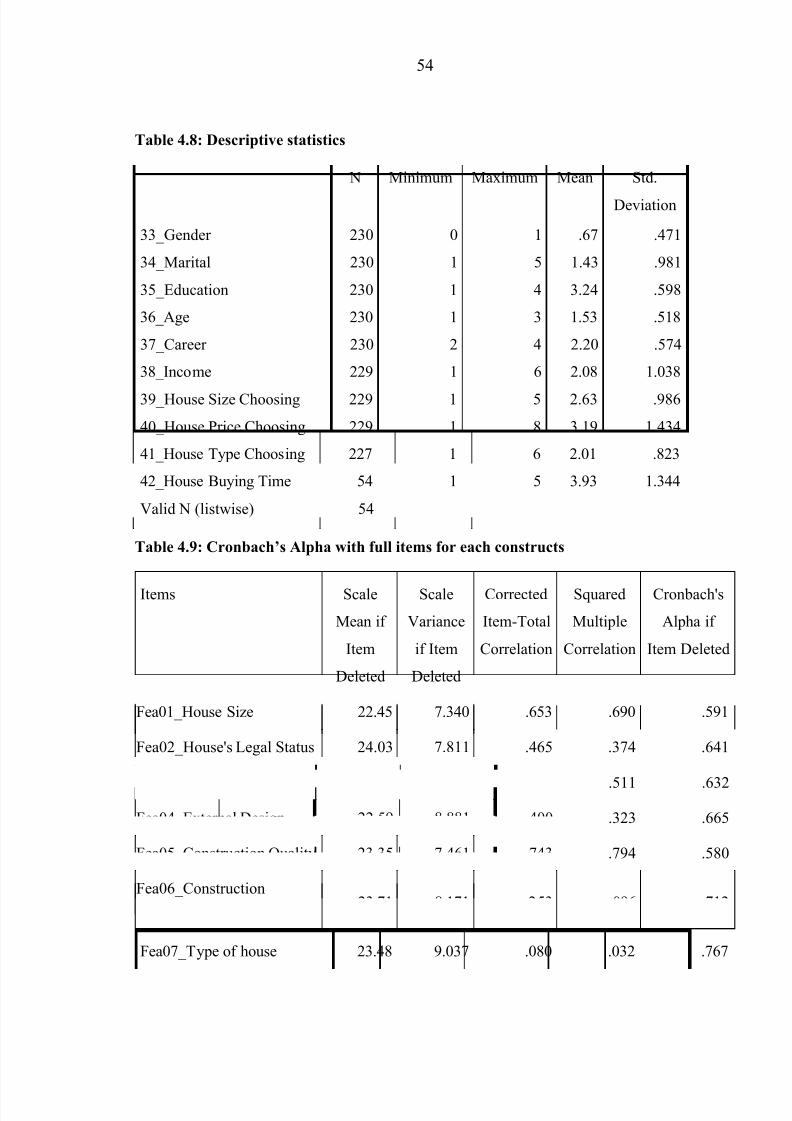
8/12/2019 Cao Hoc Quan Tri Kinh Doanh ISB Mbus2010 Phan Thanh Si
http://slidepdf.com/reader/full/cao-hoc-quan-tri-kinh-doanh-isb-mbus2010-phan-thanh-si 62/73
54
Table 4.8: Descriptive statistics
N Minimum Maximum Mean Std.
Deviation
33_Gender 230 0 1 .67 .471
34_Marital 230 1 5 1.43 .981
35_Education 230 1 4 3.24 .598
36_Age 230 1 3 1.53 .518
37_Career 230 2 4 2.20 .574
38_Income 229 1 6 2.08 1.038
39_House Size Choosing 229 1 5 2.63 .986
40_House Price Choosing 229 1 8 3.19 1.434
41_House Type Choosing 227 1 6 2.01 .823
42_House Buying Time 54 1 5 3.93 1.344
Valid N (listwise) 54
Table 4.9: Cronbach’s Alpha with full items for each constructs
Items Scale
Mean if
Item
Deleted
Scale
Variance
if Item
Deleted
Corrected
Item-Total
Correlation
Squared
Multiple
Correlation
Cronbach's
Alpha if
Item Deleted
Fea01_House Size 22.45 7.340 .653 .690 .591
Fea02_House's Legal Status 24.03 7.811 .465 .374 .641
Fea03_Interior Design 23.15 8.319 .557 .511 .632
Fea04_External Design 22.59 8.881 .400 .323 .665
Fea05_Construction Quality 23.35 7.461 .743 .794 .580
Fea06_Construction
Duration23.71 8.171 .253 .096 .712
Fea07_Type of house 23.48 9.037 .080 .032 .767

8/12/2019 Cao Hoc Quan Tri Kinh Doanh ISB Mbus2010 Phan Thanh Si
http://slidepdf.com/reader/full/cao-hoc-quan-tri-kinh-doanh-isb-mbus2010-phan-thanh-si 63/73
55
Liv01_Kitchen Size 13.38 4.638 .468 .366 .497
Liv02_Bedroom Quantity 13.34 4.714 .536 .382 .473
Liv03_Bathroom Quantity 13.91 4.249 .520 .340 .461Liv04_Living room Size 12.58 4.856 .371 .188 .549
Liv05_Storey of House 13.09 6.158 .012 .002 .726
Fin01_House Price 23.59 14.391 .587 .588 .734
Fin02_Max Mortgage 24.77 13.975 .360 .174 .782
Fin03_Max Repayment 24.36 11.673 .767 .750 .682
Fin04_Interest rate 24.14 12.356 .714 .708 .698
Fin05_Income 23.73 13.445 .705 .684 .710
Fin06_Pay Duration 24.26 14.357 .489 .295 .748
Fin07_Registration Fee 24.45 17.323 .013 .020 .834
Dis01_Adjacent Street 22.66 12.278 .578 .670 .719
Dis02_Work Distance 22.53 9.831 .700 .859 .680
Dis03_Market Distance 22.93 11.197 .772 .877 .677
Dis04_School Distance 22.98 11.030 .767 .772 .676
Dis05_Recreation Distance 22.05 13.569 .377 .155 .756
Dis06_Business Distance 22.96 14.239 .139 .041 .806
Dis07_Main Access 22.78 13.824 .202 .053 .794
Env01_Neighbour
Condition20.83 5.970 .700 .653 .696
Env02_Security 20.67 6.537 .583 .534 .728
Env03_View 19.91 6.773 .284 .116 .785
Env04_Noise 20.47 4.791 .728 .710 .664
Env05_Pollut ion 20.15 5.306 .677 .649 .685
Env06_Nearby Traffic 20.96 6.300 .272 .114 .807
Dec01_Plan to buy 6.33 1.693 .794 .785 .617
Dec02_Try to buy 6.07 3.013 .461 .213 .928
Dec03_Important person 6.26 2.141 .819 .786 .598

8/12/2019 Cao Hoc Quan Tri Kinh Doanh ISB Mbus2010 Phan Thanh Si
http://slidepdf.com/reader/full/cao-hoc-quan-tri-kinh-doanh-isb-mbus2010-phan-thanh-si 64/73
56
Table 4.10: KMO and Bartlett’s test
Table 4.11: Total variance explained

8/12/2019 Cao Hoc Quan Tri Kinh Doanh ISB Mbus2010 Phan Thanh Si
http://slidepdf.com/reader/full/cao-hoc-quan-tri-kinh-doanh-isb-mbus2010-phan-thanh-si 65/73
57
Table 4.12: Correlation among variables (Partial only)
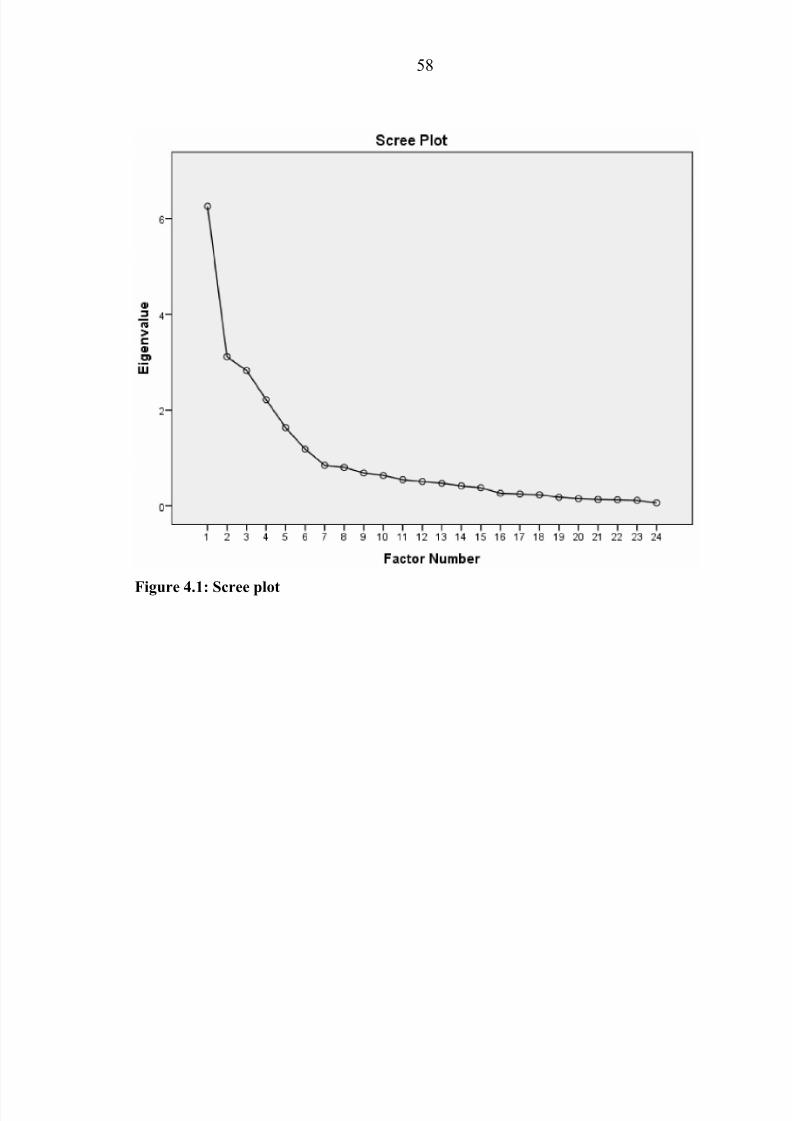
8/12/2019 Cao Hoc Quan Tri Kinh Doanh ISB Mbus2010 Phan Thanh Si
http://slidepdf.com/reader/full/cao-hoc-quan-tri-kinh-doanh-isb-mbus2010-phan-thanh-si 66/73

8/12/2019 Cao Hoc Quan Tri Kinh Doanh ISB Mbus2010 Phan Thanh Si
http://slidepdf.com/reader/full/cao-hoc-quan-tri-kinh-doanh-isb-mbus2010-phan-thanh-si 67/73
59
Table 4.13: Factor Matrix

8/12/2019 Cao Hoc Quan Tri Kinh Doanh ISB Mbus2010 Phan Thanh Si
http://slidepdf.com/reader/full/cao-hoc-quan-tri-kinh-doanh-isb-mbus2010-phan-thanh-si 68/73
60
Table 4.14: Factor Correlation Matrix
Table 4.15: Model summary
Table 4.16: Anova
Model Sum of
Squares
df Mean
Square
F Sig.
1
Regression 55.385 5 11.077 24.717 .000 b
Residual 100.385 224 .448
Total 155.770 229
a. Dependent Variable: Decision
b. Predictors: (Constant), Environment, Feature, Finance, LivSpace, Distance
Table 4.17: Casewise diagnostics

8/12/2019 Cao Hoc Quan Tri Kinh Doanh ISB Mbus2010 Phan Thanh Si
http://slidepdf.com/reader/full/cao-hoc-quan-tri-kinh-doanh-isb-mbus2010-phan-thanh-si 69/73
61
Table 4.18: Residuals statistics
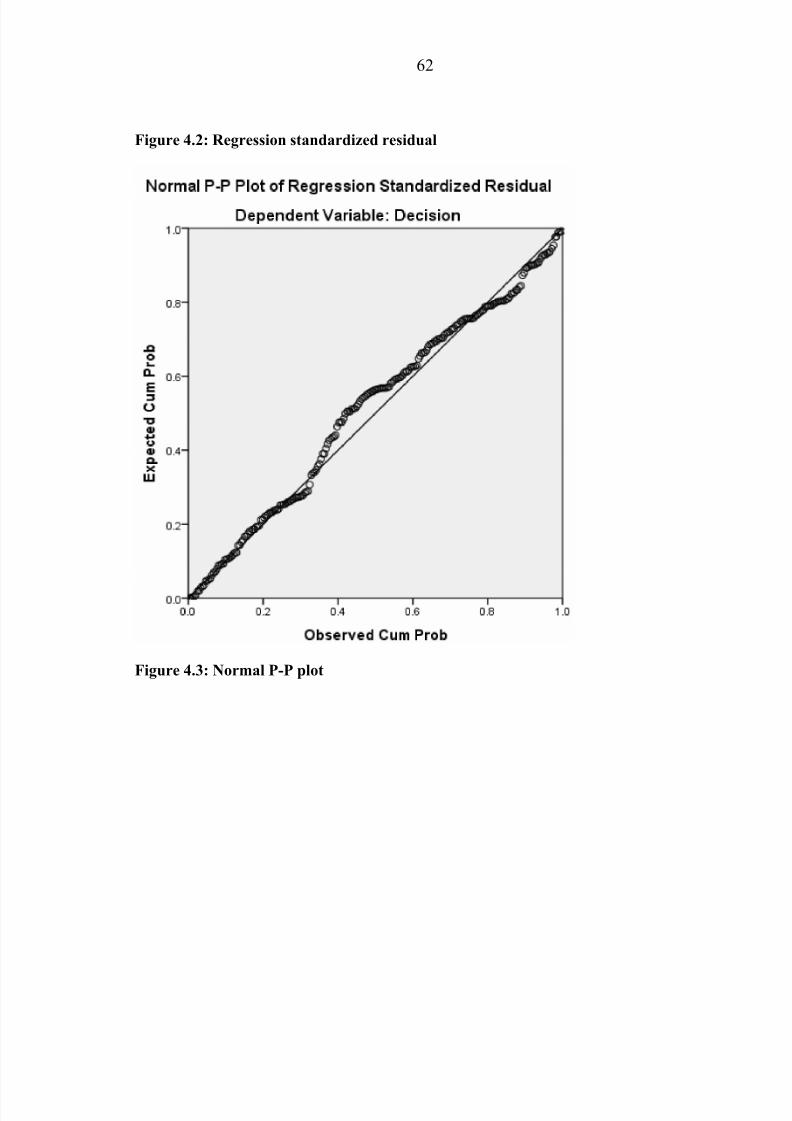
8/12/2019 Cao Hoc Quan Tri Kinh Doanh ISB Mbus2010 Phan Thanh Si
http://slidepdf.com/reader/full/cao-hoc-quan-tri-kinh-doanh-isb-mbus2010-phan-thanh-si 70/73
62
Figure 4.2: Regression standardized residual
Figure 4.3: Normal P-P plot

8/12/2019 Cao Hoc Quan Tri Kinh Doanh ISB Mbus2010 Phan Thanh Si
http://slidepdf.com/reader/full/cao-hoc-quan-tri-kinh-doanh-isb-mbus2010-phan-thanh-si 71/73
63
Figure 4.4: Scatterplot
Table 4.19: Cofficients of MLR including Sex_Render

8/12/2019 Cao Hoc Quan Tri Kinh Doanh ISB Mbus2010 Phan Thanh Si
http://slidepdf.com/reader/full/cao-hoc-quan-tri-kinh-doanh-isb-mbus2010-phan-thanh-si 72/73
64
Table 4.20: Cofficients of MLR including Marital_Render
Table 4.21: Cofficients of MLR including Education_Render
Table 4.22: Cofficients of MLR including Age_Render

8/12/2019 Cao Hoc Quan Tri Kinh Doanh ISB Mbus2010 Phan Thanh Si
http://slidepdf.com/reader/full/cao-hoc-quan-tri-kinh-doanh-isb-mbus2010-phan-thanh-si 73/73
65
Table 4.23: Cofficients of MLR including Career_Render
Table 4.24: Cofficients of MLR including Income_Render