cap-op energy british columbia oil and gas methane ... · british columbia oil and gas methane...
TRANSCRIPT

Cap-Op Energy British Columbia Oil and
Gas Methane Emissions Field Study
Prepared For: BC CAS ECCC BC OGC BC MEMPR
Prepared By: Cooper Robinson Keith Driver Mike D’Antoni
Ryan Liu Brenna Barlow Wes Funk Arvind Ravikumar
DISCLAIMER
While reasonable effort has been made to ensure the accuracy, reliability and completeness of the
information presented herein, this report is made available without any representation as to its use in
any particular situation and on the strict understanding that each reader accepts full liability for the
application of its contents, regardless of any fault or negligence of Cap-Op Energy, Inc.
Executive Summary
The British Columbia Methane Emissions Field Study was undertaken in order to inform the modeling
parameters used in time-series methane emission modeling. An advisory team comprising the British
Columbia Ministry of Environment and Climate Change Strategy – Climate Action Secretariat (BC CAS), the
British Columbia Oil and Gas Commission (BC OGC),
Environment and Climate Change Canada (ECCC), and the
Ministry of Energy, Mines and Petroleum Resources
(MEMPR) was established in order to engage directly with
the project team comprising Cap-Op Energy, Greenpath
Energy, DXD Consulting and Dr. Arvind Ravikumar. BC
OGC inspectors also contributed to the data collection.
The study gathered a broad spectrum of methane
emissions data at 266 locations (wells and batteries)
across British Columbia, encompassing fugitive emissions, equipment venting emissions, pneumatic
inventory and emissions estimates, as well as episodic and other sources of methane emissions. The data
were compiled and analyzed to characterize British Columbia’s oil and gas operations from a methane
emissions perspective. In order to align with current and projected production centres, coverage of tight
wells and batteries in the Montney was prioritized. The collection of sites sampled was determined to be
1 Some sources were quantified using visual estimation (e.g. inaccessible fugitives), or factors (e.g. pneumatic control instruments). Methane content of sources was not determined.
Scope of Field Survey
Total Sites Visited
266
Production/Facility Types Represented
12
Total Quantifiable Methane Emission Sources (#, volume)1
1,000 sources,
366 m3/hour

British Columbia Oil and Gas Methane Emissions Field Study
Page 2 of 70
representative of the available population, based on recent production rates – both within each
production/facility type category as well as overall.
Analysis of field survey results identified key similarities as well as key differences between British
Columbia and other jurisdictions.
The findings from the field survey aligned with other similar studies where a small number of sources were
found to be responsible for a large portion of the methane releases.3 Specifically, 51% of emissions
resulted from the top 8.7% of equipment fugitives. The vast majority of sites (186 of 266 sites visited) had
no vents or leaks detected (excluding pneumatics).
Methane emissions from natural gas-driven pneumatic devices (66% of total) represent significant sources
methane emissions at BC wells and batteries. Non-emitting control instruments and chemical injection
pumps (e.g. solar electric or air-driven) were observed to be very common in BC. Of all pneumatic or
pneumatic-equivalent devices observed in the study, 65% were non-emitting; a recent pneumatic
inventory in Alberta found <5% non-emitting.
Tanks contributed a significant proportion of total
emissions (12% including vents and leaks). Tanks were
responsible for 65% of total non-pneumatic venting
emissions (2 other equipment types, Reciprocating
Compressor and Surface Casing Vents, combined with
tanks represent 94% of overall non-pneumatic venting
emissions). This includes hydrocarbon venting from
Produced Water Tanks (25% of total tank venting).4 Thief
Hatches, a tank-specific component, also have the highest
average, median, and site level leak rates which suggests
that Thief Hatches are currently responsible for a
significant portion of methane leak emissions (3% of overall leak sources, 17% of overall leak emissions).
While compressor stations were not a specific focus of the study, 69 compressors units were observed at
batteries. These were catalogued and found to exhibit average emission rates consistent with population-
wide figures from the US Greenhouse Gas Inventory (see Sections 2.1.3 and 1.2.5.2).
In addition to the field survey, a Corporate Data Request was distributed in order to solicit additional
insight into data that are not possible to observe with a one-time site visit, including fugitive survey and
repair history, and episodic or other sources of methane emissions. These data were used to develop time
series modeling parameters such as the Leak Occurrence Rate. These parameters are derived by
combining historical data with direct observations from the field survey in order to better characterize the
temporal aspect of methane emissions.
2 Excluding pneumatic venting 3 Brandt, A.R., G.A. Heath, D. Cooley (2016). Methane leaks from natural gas systems follow extreme distributions. Environmental Science & Technology. DOI: 10.1021/acs.est.6b04303 4 Compositional data was not obtained for any emission sources; venting from Produced Water Tanks may include significantly less methane than other vent sources and are distinguished within the scope of this report.
Summary of Field Survey Findings
Total Leak-free and Vent-free Sites2 Surveyed
186 (70%)
Total Natural Gas-Driven Pneumatic Devices
725 (34%) (242 m3/hour est.)
Venting Emissions 101 (63 m3/hour)
Equipment Fugitive Emissions
284 (61 m3/hour)
British Columbia Oil and Gas Methane Emissions Field Study
Page 3 of 70
In January 2019, following the presentation of the draft study results, a workshop led by DXD Consulting
Inc. (DXD) was conducted to consider the experience of oil and gas industry experts on factors that could
influence certain parameters of interest. Input was solicited from these representatives for the purposes
of adding context to numerical results of forecasting and backcasting time-series methane modeling.
Three temporal states – distant past, recent past, and future – were interrogated across six specific focus
areas in terms of the direction and relative magnitude of change from the “present” observed in the field
study. The workshop sought to bring context and industry experience to the forefront to guide changes to
modeling parameters over different time periods. The principal objective of the industry workshop was to
solicit expert feedback on operator practices and historical and future design considerations that may
impact methane emissions from upstream facilities. This uniquely collaborative session between industry
and regulators was intended as an opportunity to extract technical feedback from industry experts on how
their operations have evolved over time. Insights into key drivers that might influence parameters of
interest for time-series modelling was determined through focused small-group discussions. It is expected
that others can benefit from these insights when completing emissions modelling assessments over
various time periods.
The data generated by the BC Methane Emissions Field Study encompass varied geographic, facility,
production, and temporal coverage and were analyzed using transparent methodologies. The insights and
results are presented herein with additional commentary and context, along with the anonymized raw
data.

British Columbia Oil and Gas Methane Emissions Field Study
Page 4 of 70
1 Table of Contents
DISCLAIMER .......................................................................................................................................... 1
Executive Summary ................................................................................................................................. 1
Glossary .................................................................................................................................................. 6
Background and Context ........................................................................................................................ 10
Scope .................................................................................................................................................... 11
Facility Types ..................................................................................................................................... 11
Production Types ............................................................................................................................... 11
Source Types ..................................................................................................................................... 12
Time Period ........................................................................................................................................ 12
Approach ............................................................................................................................................... 12
Site Selection ..................................................................................................................................... 12
Representativeness ........................................................................................................................ 14
Target and Actual Sample Sets ....................................................................................................... 17
Field Data Collection .......................................................................................................................... 17
Data Schema .................................................................................................................................. 18
Use of Existing Factors ................................................................................................................... 19
Fugitive History and Repair Data Collection ........................................................................................ 19
Episodic and Other Sources of Methane Emissions Data Collection.................................................... 19
Temporal Trends ................................................................................................................................ 20
Workshop Objectives ...................................................................................................................... 20
Workshop Methodology................................................................................................................... 20
1 Chapter 1: Field Observations ......................................................................................................... 22
1.1 Analytical Approach ................................................................................................................ 22
1.2 Results ................................................................................................................................... 26
1.2.1 Major Equipment Counts ................................................................................................. 26
1.2.2 Component Counts ......................................................................................................... 28
1.2.3 Pneumatic Devices ......................................................................................................... 33
1.2.4 Equipment Fugitive Emissions......................................................................................... 38
1.2.5 Vents .............................................................................................................................. 48
1.3 Chapter 1 Summary ................................................................................................................ 52
2 Chapter 2: Comparison to Contemporary Studies ............................................................................ 52
2.1.1 Estimated Pneumatic Venting Emissions ......................................................................... 52
2.1.2 Fugitive Emissions .......................................................................................................... 53
2.1.3 Compressor Emissions ................................................................................................... 54
2.1.4 Pneumatic Demographics ............................................................................................... 55

British Columbia Oil and Gas Methane Emissions Field Study
Page 5 of 70
2.2 Chapter 2 Summary ................................................................................................................ 55
3 Chapter 3: Fugitive and Episodic Emissions Management Practices ................................................ 56
3.1 Leak Repair Times.................................................................................................................. 56
3.2 Leak Occurrence Rate ............................................................................................................ 57
3.3 Other Sources and Controls .................................................................................................... 59
3.4 Chapter 3 Summary ................................................................................................................ 60
4 Chapter 4: Long Term Methane Emission Drivers ............................................................................ 60
4.1 Temporal State Definition........................................................................................................ 60
4.1.1 Distant Past .................................................................................................................... 60
4.1.2 Recent Past .................................................................................................................... 61
4.1.3 Future ............................................................................................................................. 61
4.2 Assessment of Drivers ............................................................................................................ 61
4.2.1 Equipment to Facility Ratios ............................................................................................ 62
4.2.2 LDAR Inspection Frequency ............................................................................................ 63
4.2.3 Prevalence of High Bleed Pneumatics ............................................................................. 64
4.2.4 Prevalence of Methane Mitigation Technologies .............................................................. 65
4.2.5 Level of Preventative Maintenance .................................................................................. 66
4.2.6 Prevalence of Non-Emitting Pneumatic Devices .............................................................. 67
4.3 Potential for Incentivization ..................................................................................................... 68
4.4 Chapter 4 Summary ................................................................................................................ 69
Closing .................................................................................................................................................. 69
Appendix A: Data Tables........................................................................................................................ 70

British Columbia Oil and Gas Methane Emissions Field Study
Page 6 of 70
Glossary
• Advisory Team: Project representatives from BC CAS, BC OGC, MEMPR, ECCC
• BC CAS: British Columbia Ministry of Environment and Climate Change Strategy – Climate Action Secretariat
• BC OGC: British Columbia Oil and Gas Commission
• CAPP: Canadian Association of Petroleum Producers
• Components: Relevant to the classification and attribution of methane emission sources; in order to enable application of component-to-equipment ratios from previous research, definitions and component types match those employed by Clearstone et al (2018):5
o Compressor Seals: ▪ Reciprocating: Packing systems (seals) are used on reciprocating compressors to
control leakage around the piston rod on each cylinder. A reciprocating compressor is deemed to have one seal associated with each compressor cylinder regardless of whether it is a single or tandem seal.
▪ Centrifugal: Centrifugal compressors generally require shaft-end seals between the compressor and bearing housings. Either face-contact oil-lubricated mechanical seals or oil-ring shaft seals, or dry-gas shaft seals are used. A centrifugal compressor has two seals, one on each side of the housing where the shaft penetration occurs.
o Connector: Each threaded, flanged, mating surface (cover) or mechanical connection is counted as a single connector. Welded or backwelded connections are not counted.
o Control Valve: A valve equipped with an actuator for automated operation to control flow, pressure, liquid level or other process parameter.
o Meter: A flow measurement device is counted as a single component. The connections on the upstream and downstream sides of the device are counted as separate components.
o Open-Ended Line: Each valve in hydrocarbon service that has process fluid on one side and is open to the atmosphere on the other (either directly or through a line) is counted as an open-ended line. If the open side of the valve is fitted with a properly installed cap, plug, blind flange or second closed block valve, or is connected to a control device, then it is no longer considered to be open-ended.
o Pressure Relief Valves and Pressure Safety Valves (PRV/PSV): Each pressure-relief valve that discharges directly to the atmosphere or through a vent system is counted as a single component.
o Pump Seal: Each pump in hydrocarbon service may leak from around the pump shaft and is typically controlled by a packing material, with or without a sealant. It may be used on both the rotating and reciprocating pumps (and includes pneumatic injection pumps). Specially designed packing materials are available for different types of service. The selected material is placed in a stuffing box and the packing gland is tightened to compress the packing around the shaft.
5 Clearstone Update of Equipment Component and Fugitive Emission Factors for Alberta Upstream Oil and Gas Study (https://www.aer.ca/documents/UpdateofEquipmentComponentandFugitiveEmissionFactorsforAlber-1.pdf). See Section 8.3 for additional detail on components.

British Columbia Oil and Gas Methane Emissions Field Study
Page 7 of 70
o Regulator: Most regulators are equipped with a vent where gas is released in the event the diaphragm inside becomes damaged.
o Thief Hatch: Storage tanks connected to a VRU or flare do not emit gas unless the internal tank pressure exceeds the PRV or thief hatch set pressures (and intermittent venting occurs). When the tank pressure drops, the PRVs return to a closed position and typically don’t leak. However, once opened, thief hatches remain partially open until an operator closes the hatch. Gas loss from partially open thief hatches is unintentional and therefore classified as a leak. Gas losses from storage tanks open to the atmosphere (i.e., not connected to a VRU or flare) are classified as a process vent (not a leak).
o Valve: A valve that is not a control valve.
• Control Instrument: Any device used for process control (measurement and control of process variables) such as switches and controllers; predominantly includes the classifications:
o Pressure controller: a device which continuously monitors pressure and outputs a corrective signal to the final control element based on the deviation from set point pressure
o Pressure switch: a sub-type of pressure controller, capable of on/off output at preset pressure
o Level controller: a device which continuously monitors fluid level and outputs a corrective signal to the final control element based on the deviation from set point level
o Level switch: a sub-type of level controller, capable of on/off output at preset level o Positioner: a device which modulates the supply pressure to the control valve actuator to
maintain a position based on the control signal o Temperature controller: a device which continuously monitors temperature and outputs
a corrective signal to the final control element based on the deviation from desired temperature
o Transducer: a combination of a sensor and a transmitter; converts physical signal (e.g. pressure) into electric signal (e.g. millivolts)
• Crude Oil Single-Well Battery: A production facility for a single oil well.6
• Crude Oil Multiwell Group Battery: A production facility consisting of two or more flow-lined oil wells having individual separation and measuring equipment but with all equipment sharing a common surface location.6
• Crude Oil Multiwell Proration Battery: A production facility consisting of two or more flow-lined oil wells having common separation and measuring equipment. Total production is prorated to each well based on individual well tests. Individual well production tests can occur at the central site or at remote satellite facilities. 6
• ECCC: Environment and Climate Change Canada
• Excessive Pneumatic Venting: includes any gas release from pneumatic equipment that does not reflect normal operation, such as a release from the seal on the device casing. These types of releases were isolated during analysis as a separate category since they are treated differently under different regulations.
• Facility: Any site/location may be considered a facility within this report, including wellsites, but for analytical purposes facilities are batteries.
• Fuel Gas: See natural gas as the same definition was used for the purpose of this study.
6 Facility definitions excerpted from the Petrinex British Columbia Inclusion Project – Industry Readiness Handbook available at https://www.petrinex.ca/Initiatives/Documents/PBCIP_Industry_Readiness_Handbook.pdf
British Columbia Oil and Gas Methane Emissions Field Study
Page 8 of 70
• Fugitive Emissions (Equipment Fugitives): The field collection team employed the following definition for distinguishing equipment fugitives (leaks) from vents: “A leak is the unintentional loss of process fluid past a seal, mechanical connection or minor flaw at a rate that is in excess of normal tolerances allowed by the manufacturer or applicable health, safety and environmental standards. An equipment component in hydrocarbon service is commonly deemed to be leaking when the emitted gas can be visualized with an infrared (IR) leak imaging camera or detected by other techniques with similar or better detection capabilities.”5 OGI was the only detection technology used in this study. Equipment fugitives were attributed to component types listed above including connectors, valves, control valves, PRV/PSV, meters, regulators, pump seals, thief hatches. During analysis some equipment fugitives were further sub-classified (e.g. Excessive Pneumatic Venting).
• Gas Multiwell Effluent Measurement Battery: A production reporting entity consisting of two or more gas wells where estimated production from gas wells in the battery is determined by the continuous measurement of multiphase fluid from each well (effluent measurement). Commingled production is separated and measured then prorated back to wells based on the estimated production. 6
• Gas Multiwell Group Battery: A production reporting entity consisting of two or more gas wells where production components are separated and measured at each wellhead. Production from all wells in the group is combined after measurement and then delivered to a gas gathering system or other disposition. 6
• Gas Single Well Battery: A production facility for a single gas well where production is measured at the wellhead. Production is delivered directly and is not combined with production from other wells prior to delivery to a gas gathering system or other disposition. 6
• Heavy Liquid: Process fluid that is a hydrocarbon liquid at the operating conditions and has a vapour pressure of less than 0.3 kPa at 15◦C.5 No heavy liquid service was encountered in the study.
• Large Facility: Refers to Compressor Stations and Gas Plants. 6
• LDAR: Leak Detection and Repair
• Leak Occurrence Rate: An important parameter used in time-series modeling to establish the fugitive emission factor magnitude, which considers the number of detected leaking components by type, the number of leaks detected but not repaired from the previous survey, the number of months since the last survey, and the number of components and facilities of each type. See Section 3.2 for calculation details.
• Light Liquid: Process fluid that is a hydrocarbon liquid at the operating conditions and has a vapour pressure of 0.3 kPa or greater at 15◦C. Light/medium crude oil, condensate and natural gas liquids (NGLs) fall into this category. 5
• MEMPR: British Columbia Ministry of Energy, Mines, and Petroleum Resources
• Natural Gas: The Petroleum and Natural Gas Act (PNG) defines as all fluid hydrocarbons, before and after processing, that are not defined as petroleum, and includes hydrogen sulfide, carbon dioxide, and helium produced from a well.7 In the scope of this study, typically refers to fuel gas or instrument gas that is (or was assumed to be) predominantly methane.
• Pneumatics (Pneumatic Devices): Refers to control instruments and pumps, including non-pneumatic (e.g. electric drive) equipment according to the classifications above.
7 Oil and gas Glossary and Definitions Version 1.11: February 2019, BC OGC (Available at https://www.bcogc.ca/node/11467/download)

British Columbia Oil and Gas Methane Emissions Field Study
Page 9 of 70
• Pneumatic Pump: Any device used for chemical injection at wellsites, compressor stations, batteries or gas plants; no sub-classification was employed in this report although the observed pump types include diaphragm positive displacement pumps and electric drive positive displacement pumps.
• Process Gas: Process fluid that is a hydrocarbon gas at the subject operating condition.5 For the purpose of the analysis process gas was defined as natural gas.
• Project Team: Cap-Op Energy, including its subcontractors Greenpath Energy, DXD Consulting, and Dr. Arvind Ravikumar
• OGI: optical gas imaging using infrared (IR) leak imaging camera
• Reporting Facility: Refers to a facility with a Reporting Facility ID from the BC OGC.
• Site Classification (or Facility Types): Sites, or facilities, were classified according to existing BC OGC classification schemes including gas wells, oil wells, single well batteries, and others as further delineated in Facility Types
• Venting Emissions: An intentional release of hydrocarbon gas directly to the atmosphere. Venting does not include partial products of combustion that might occur during flaring or other combustion activities. Vents were attributed to component types including open-ended line, compressor seal, and thief hatch.
British Columbia Oil and Gas Methane Emissions Field Study
Page 10 of 70
Background and Context British Columbia (BC) launched its Climate Action Plan in 2008 as one of the first jurisdictions in North
America to formally address anthropogenic climate change with GHG emission reduction targets and a
suite of programs to achieve them.8 In 2016, BC’s Climate Action Plan included programs launched to
specifically target methane emissions from upstream natural gas production, including a reduction target
of 45% by 2025 and a commitment to investing in infrastructure to power natural gas projects with clean
electricity.9 In December 2018, BC confirmed their methane emissions reduction target in the CleanBC
Plan.10 At a high level, BC’s upstream methane emission reduction target is aligned with sub-national
policies in neighbouring Alberta,11 states including Colorado, California,12 Ohio, Pennsylvania, and
Wyoming as well as federally in Canada, the US, and Mexico.13
Methodologies have been established to model methane emission sources, including certain defined
parameters (e.g. facility types, and equipment types). Inputs for these modelling methodologies should
represent local operating configurations and production types, however they are often generic historical
factors, developed in different jurisdictions. This study aimed to develop modelling parameters specific to
BC operations.
The Province of British Columbia along with Environment and Climate Change Canada proposed and
supported the field study and subsequent analysis to translate observations from the field to the defined
time-series modeling parameters.
Following a description of the scope and approach, reporting of results is structured as follows:
CHAPTER TITLE SOURCE OF INFORMATION
CHAPTER 1 Field Observations Field Survey Data CHAPTER 2 Comparison to Contemporary Studies Field Survey Data, Other Studies CHAPTER 3 Fugitive and Episodic Emission Management
Practices Field Survey Data, Corporate Data Request
CHAPTER 4 Long Term Methane Emission Drivers Expert Workshop
8 British Columbia Climate Action Plan, 2008 (Available at https://www2.gov.bc.ca/assets/gov/environment/climate-change/action/cap/climateaction_plan_web.pdf) 9 British Columbia Climate Leadership Plan, August 2018 (Available at https://www2.gov.bc.ca/assets/gov/environment/climate-change/action/clp/clp_booklet_web.pdf) 10 CleanBC, March 2019 (Available at https://blog.gov.bc.ca/app/uploads/sites/436/2019/02/CleanBC_Full_Report_Updated_Mar2019.pdf) 11 Alberta Climate Leadership Plan, Implementation Plan 2018-2019 (Available at https://open.alberta.ca/dataset/da6433da-69b7-4d15-9123-01f76004f574/resource/b42b1f43-7b9d-483d-aa2a-6f9b4290d81e/download/clp_implementation_plan-jun07.pdf) 12 Proposed Short-Lived Climate Pollutant Reduction Strategy, California Air Resources Board, April 2016 (Available at https://www.arb.ca.gov/cc/shortlived/meetings/04112016/proposedstrategy.pdf) 13 Joint Statement on North American Climate Leadership, Environment and Climate Change Canada, September 2018 (Available at https://www.canada.ca/en/environment-climate-change/news/2018/09/joint-statement-on-north-american-climate-leadership1.html)

British Columbia Oil and Gas Methane Emissions Field Study
Page 11 of 70
Scope Facility Types
Upstream oil and gas production is generally comprised of wells, batteries, gathering and transportation
systems, and upstream processing facilities. Since facility sizes tend to increase further down the supply
chain, the upstream sector is characterized by large numbers of small facilities (9,191 active wells and 327
active batteries)14 which can be highly diverse in their operating practices and the type of equipment found
on site. Diversity at upstream sites is also a result of diverse operators, design and operating practices,
facility ages, and product characteristics. For example, the presence of liquids can alter the equipment
and operating practices of upstream sites.
Characterizing the upstream sector accurately is challenging because large sample sizes are required for
statistical significance but field data collection costs scale with both sample size and facility
size/complexity. In order to ensure sufficient sample sizes, Compressor Stations and Gas Plants (Large
Facilities) were excluded in order to focus on wells and batteries, however some compressors were
observed at smaller facilities. Specifically, the study considered the following facility types (consistent with
Petrinex definitions):
• Wells (W)
• Single-Well Batteries (SWB)
• Multiwell Group Batteries (MGB)
• Multiwell Proration Batteries (MPB)
• Multiwell Effluent Measurement Batteries (MEM)
Production Types British Columbia produces oil and gas from the northwest end of the Western Canadian Sedimentary
Basin. Oil production, comprising light crude oil and natural gas condensates, is secondary to gas
production in most areas, and both are produced from a mix of older legacy wells (“Conventional”) as well
as newer Shale and Tight wells. Based on the BC OGC records, very few facilities are classified as producing
“Shale Gas” as distinct from “Tight Gas” and so these were combined to form a single production category
(Tight Gas (T)). Tight Gas was distinguished from Conventional Gas (C), and a single Oil (O) category was
considered to include sites classified as either Tight Oil or Conventional Oil.
Specifically, the study considered the following categories of facility and production types:
• Well Site
• Gas Single Well Battery
• Gas Multiwell Group Battery
• Gas Multiwell Effluent Measurement Battery
• Crude Oil Single-Well Battery
• Crude Oil Multiwell Proration Battery
• Crude Oil Multiwell Group Battery
14 “Active” was defined based on May 2018 production reporting.

British Columbia Oil and Gas Methane Emissions Field Study
Page 12 of 70
Source Types Upstream methane sources result from intentional or unintentional releases to atmosphere, or from
combustion. Combustion emission sources such as flares were considered outside the scope of the study.
Intentional (venting) sources of emissions were attributed to pneumatic devices and other specific pieces
of equipment wherever possible (see Sections 1.2.5.2 and 1.2.4.2, respectively). Unintentional (equipment
fugitive) emissions were attributed to specific components (see Section 1.2.3.2 for examples).
Time Period Field data collection occurred during the month of September 2018, with a single inspection at each
location (snapshot survey). Between October 2018 and February 2019, historical site-level data was
acquired concerning emissions and activities that occurred between 2016 and February 2019. In January
2019, expert opinion was solicited regarding past, present, and future time trends and their impacts on
emissions (see Chapter 4).
Approach A field protocol and sampling plan were developed to facilitate the development of numerical results on
a per-facility basis (emitting and non-emitting equipment counts), per-component basis (fugitives, where
possible) and including the quantification of emitting equipment.
Greenpath lead the development of the field protocol for on-site data collection methodologies, in
consultation with Cap-Op and the advisory team, with particular focus on:
1) Methodology employed to estimate equipment and component counts/inventories where applicable
2) Methodology employed to quantify emissions from fugitives and emitting equipment
The protocol that was selected balanced time and resource constraints with the granularity and accuracy
of data collected. The protocol required a two-person team, including contractors and BC OGC Inspectors,
who were tasked with the following:
• Inventory of pneumatic devices, process equipment and other potential vent sources and fate of vent sources (compressor packing, tank controls)
• Inspection via OGI Camera and quantification of leaks and vents via High Flow Sampler
• Collection of supplemental information to aid in quantification
Concurrently, Cap-Op lead the development of the sampling plan, in consultation with Greenpath and the
advisory team, with particular focus on:
3) Types of facilities to be considered for study (e.g. Wells, Batteries) 4) Production types to be considered for study (e.g. Tight Gas, Conventional Oil) 5) Representation of the population using randomly selected sample sets of sites
Site Selection Participation in the study was voluntary, but was structured as “opt-out” instead of opt-in. This allowed
the project team to select sites randomly in order to form a robust sample. The sites visited were selected
British Columbia Oil and Gas Methane Emissions Field Study
Page 13 of 70
through the process detailed below before any contact with producers. All but one producer selected
allowed the field survey to take place which prevented or minimized a “coalition of the willing” effect that
may introduce bias to studies relying only on voluntary participation.
Site selection was done using a quasi-random process, seeking to balance the statistical benefits of
random selection with logistical challenges presented by visiting a large number of geographically
dispersed locations, and the limited amount of time available for both site selection and field data
collection. Filtered data were provided by BC OGC which contained records of the most recent available
month of production reporting, the facility type categories and production type categories as well as other
identifying information.
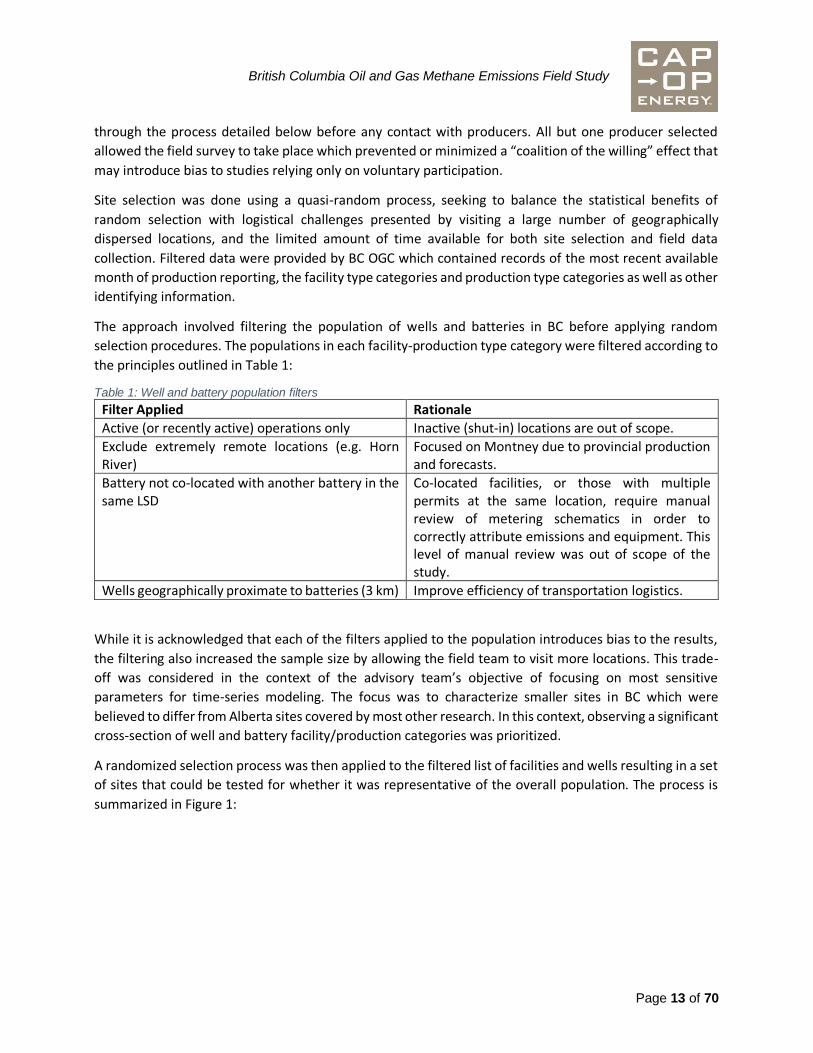
The approach involved filtering the population of wells and batteries in BC before applying random
selection procedures. The populations in each facility-production type category were filtered according to
the principles outlined in Table 1:
Table 1: Well and battery population filters
Filter Applied Rationale
Active (or recently active) operations only Inactive (shut-in) locations are out of scope.
Exclude extremely remote locations (e.g. Horn River)
Focused on Montney due to provincial production and forecasts.
Battery not co-located with another battery in the same LSD
Co-located facilities, or those with multiple permits at the same location, require manual review of metering schematics in order to correctly attribute emissions and equipment. This level of manual review was out of scope of the study.
Wells geographically proximate to batteries (3 km) Improve efficiency of transportation logistics.
While it is acknowledged that each of the filters applied to the population introduces bias to the results,
the filtering also increased the sample size by allowing the field team to visit more locations. This trade-
off was considered in the context of the advisory team’s objective of focusing on most sensitive
parameters for time-series modeling. The focus was to characterize smaller sites in BC which were
believed to differ from Alberta sites covered by most other research. In this context, observing a significant
cross-section of well and battery facility/production categories was prioritized.
A randomized selection process was then applied to the filtered list of facilities and wells resulting in a set
of sites that could be tested for whether it was representative of the overall population. The process is
summarized in Figure 1:

British Columbia Oil and Gas Methane Emissions Field Study
Page 14 of 70
Figure 1: Site selection iterative review process
The number of sites visited in a given category was driven by the facility type (size considerations), the
relative focus (Tight Gas prioritized over Conventional) and the available population size. The following
table summarized sample sizes as % coverage of the available population:
Table 2: Coverage ratios - sample size as percent of available population15 Oil Conventional Tight Average
Wells 38% 47% 52% 46%
SWB 19% 24% 100% 48%
MGB 100% 21% 45% 55%
MPB 19%
19%
MEM
16% 22% 19%
Avg 46% 20% 56% 35%
Representativeness
Representativeness was quantitatively assessed using the Kolmogorov-Smirnoff goodness-of-fit test (K-S
test). The basis that was used for the K-S testing was the distribution of normalized energy production
rates, which was characterized for both the sample sites and the available population of sites (two-sample
K-S test). The test is designed to assess whether the two samples represent the same underlying
population and was run using a significance level of alpha = 0.05.16 Regardless of the alpha selected, small
sample sizes due to time and resource constraints may have an effect on the utility of the K-S test since
the threshold for pass/fail increases with fewer samples to compare.
15 Available population refers to the set of wells and batteries that passed the filtering criteria described in Table 1. Note that coverage of wells only refers to wells within 3km of selected batteries as per Table 1. 16 Alpha level is the probability of rejecting the null hypothesis when the null hypothesis is true.

British Columbia Oil and Gas Methane Emissions Field Study
Page 15 of 70
The K-S test was applied at the level of each individual combination of facility type and production type,
as well as on the entire selection. The entire selection was then assessed against the “available population”
of wells and batteries after application of the filtering criteria above. All assessments passed the K-S test.
The available population was also assessed against the overall population of all active wells and batteries
in BC. Figure 2 illustrates the effect of the filtering process:
Figure 2: Distribution of normalized energy production rates before and after application of site selection filters
Energy production rates are accessible and present as a reasonable characteristic with which to assess
representativeness, although emissions are not necessarily robustly correlated with energy production
rates, and so additional considerations for diversity were included qualitatively on the entire selection:
• Age, represented by date of first production
• Operator mix
The date of first production was determined using BC OGC records. For facilities, the available population
included first production dates covering 30 years, from 1989-2018 and the target sample included facilities
representing 22 (73%) of these first production years spanning 1989-2017. For wells, 37 distinct years
were represented from 1958 to 2017. Figure 3 shows the distribution of first production years among the
visited wells:

British Columbia Oil and Gas Methane Emissions Field Study
Page 16 of 70
Figure 3: Year of first production - visited wells
A total of 47 operator names were represented in the available population of facilities, of which 21
operated facilities that were visited (45%). The participation rate of each operator varied between 1 and
47 sites with approximately half of the operators having 10 or more sites each.
BC OGC records include redundant
information within the facility type
classifications that also indicates
production type (e.g. Gas Single Well
Battery and Crude Oil Single Well
Battery are different Facility Types).
These were grouped logically where
possible (e.g. all Single Well Batteries)
and then re-stratified using the more detailed production characterization that is available within each
facility’s record (e.g. Tight Gas, Non-Associated (Conventional) Gas, etc.). A classification scheme for site
selection (and analysis/reporting) was developed which combines the facility type and production type as
explained in Figure 4.
0
5
10
15
20
25
Surveyed Well Ages
Site Classification (Study Code): [Facility/Site Type] + [Production Category]
e.g. MGBT: Multiwell Group Battery – Tight Gas SWBO: Single-Well Battery – Oil
Figure 4: Site classification used for selection and results analysis includes facility type and production type
British Columbia Oil and Gas Methane Emissions Field Study
Page 17 of 70
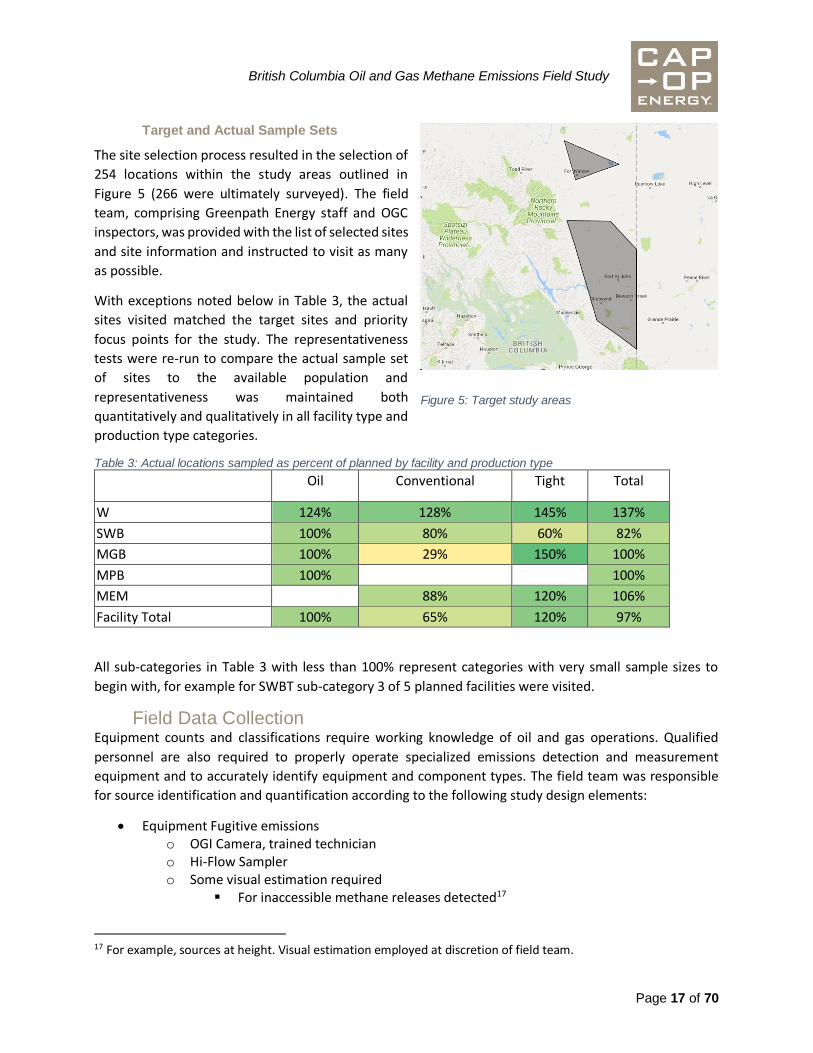
Target and Actual Sample Sets
The site selection process resulted in the selection of
254 locations within the study areas outlined in
Figure 5 (266 were ultimately surveyed). The field
team, comprising Greenpath Energy staff and OGC
inspectors, was provided with the list of selected sites
and site information and instructed to visit as many
as possible.
With exceptions noted below in Table 3, the actual
sites visited matched the target sites and priority
focus points for the study. The representativeness
tests were re-run to compare the actual sample set
of sites to the available population and
representativeness was maintained both
quantitatively and qualitatively in all facility type and
production type categories.
Table 3: Actual locations sampled as percent of planned by facility and production type
Oil Conventional Tight Total
W 124% 128% 145% 137%
SWB 100% 80% 60% 82%
MGB 100% 29% 150% 100%
MPB 100% 100%
MEM 88% 120% 106%
Facility Total 100% 65% 120% 97%
All sub-categories in Table 3 with less than 100% represent categories with very small sample sizes to
begin with, for example for SWBT sub-category 3 of 5 planned facilities were visited.
Field Data Collection Equipment counts and classifications require working knowledge of oil and gas operations. Qualified
personnel are also required to properly operate specialized emissions detection and measurement
equipment and to accurately identify equipment and component types. The field team was responsible
for source identification and quantification according to the following study design elements:
• Equipment Fugitive emissions o OGI Camera, trained technician o Hi-Flow Sampler o Some visual estimation required
▪ For inaccessible methane releases detected17
17 For example, sources at height. Visual estimation employed at discretion of field team.
Figure 5: Target study areas
British Columbia Oil and Gas Methane Emissions Field Study
Page 18 of 70
• Venting emissions o OGI Camera, trained technician o Hi-Flow Sampler o Some visual estimation required
• Major equipment inventory o Direct observation (count) o Emitting or non-emitting determination o Emission control observation
• Pneumatic equipment inventory18 o Direct observation (inventory) o Emitting or non-emitting determination
• Component counts o Derived from Clearstone 2018 where possible o Otherwise direct observation (count)
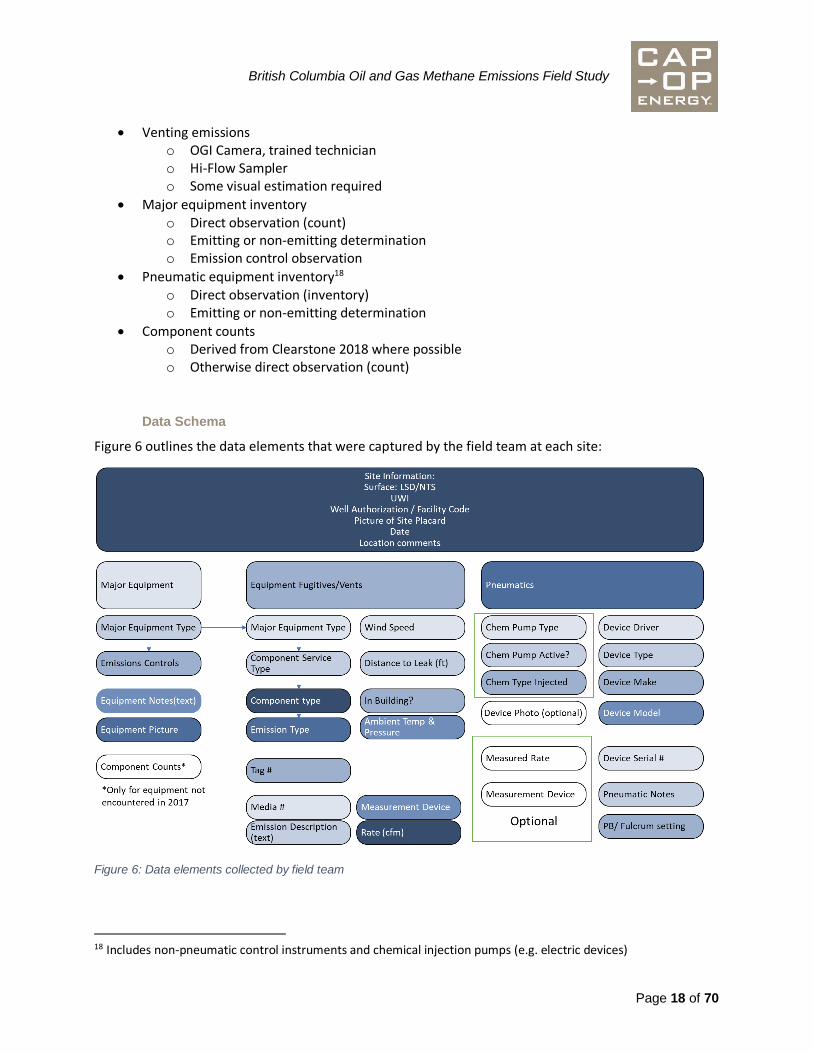
Data Schema
Figure 6 outlines the data elements that were captured by the field team at each site:
Figure 6: Data elements collected by field team
18 Includes non-pneumatic control instruments and chemical injection pumps (e.g. electric devices)

British Columbia Oil and Gas Methane Emissions Field Study
Page 19 of 70
Where possible, existing component-to-equipment ratios were leveraged for this study (see below). Some
equipment was observed in BC that was not observed in Alberta during Clearstone 2018, and these
equipment types were subject to component counts on an exception basis, as further delineated below
and in Table 6 of Section 1.1. See Section 1.1 Analytical Approach for additional details.
Use of Existing Factors
The scope was determined to ensure representative results from the facility and production types visited.
Existing factors were employed for two data points (where possible): component counts and pneumatic
device vent rates.
It was determined that component-per-equipment ratios from existing literature could be combined with
observed equipment counts in order to develop results that represent BC operations. This approach
avoided the need to directly acquire component count information which is highly time consuming. The
number of components per piece of major equipment is expected to be the same in Alberta and BC. As
such, observed equipment counts were combined with published average components per major
equipment / process block to determine the total number of components per facility type. These
component counts are used in combination with the detected leaks to characterize fugitive emissions
from the facilities visited during the survey. Clearstone 2018 was used as it developed representative
component counts per major equipment type for AB.
Release rates from pneumatic control instruments and pumps were not measured during this study, but
estimated based on the observed makes and models in order to facilitate comparisons between source
release type (e.g. venting emissions and fugitive emissions) as well as comparisons to other studies. The
pneumatic controller release rates from recent studies were used; including early work by Cap-Op and
Greenpath (Prasino Study, 2014)19 as well as more recent measurements campaigns by Spartan Controls
and Greenpath Energy.20 Other meta-analysis of existing fieldwork has also been done.21
Fugitive History and Repair Data Collection A Corporate Data Request (CDR) was developed in order to obtain data needed for time-series modeling
parameter development that could not be obtained from the site visit observations.
The CDR solicited historical information regarding the most recent fugitive survey and any associated leak
repair information. Company logs were requested for the same set of sites as was visited by the field team.
Episodic and Other Sources of Methane Emissions Data Collection The Corporate Data Request solicited historical information regarding episodic and other sources of
methane emissions based in part on Cap-Op’s 2017 report for Environment and Climate Change Canada
(ECCC)22. Company logs were requested for the same set of sites as was visited by the field team.
19 Final Report For Determining Bleed Rates for Pneumatic Devices in British Columbia, The Prasino Group (now Cap-Op Energy), December 2013 (Available at http://www.bcogris.ca/sites/default/files/ei-2014-01-final-report20140131.pdf) 20 Pneumatic Vent Gas Measurement, Brian Van Vliet and Spartan Controls, April 2018 (Available at https://auprf.ptac.org/wp-content/uploads/2018/05/Pneumatic-Vent-Gas-Measurement.pdf) 21 Osman, A. (2016). Determining Pneumatic Controller and Pumps Release Rates, available by request from ECCC. 22 Available from www.capopenergy.com

British Columbia Oil and Gas Methane Emissions Field Study
Page 20 of 70
Episodic emissions are from non-continuous or highly variable emission sources, and include:
• Blowdown, purging, and other de-pressure events
• Liquids loading/unloading from tanks
• Compressor starts (gas starts)
• Flare operational issues (e.g. unlit flares)
Temporal Trends A variety of elements confound the acquisition of objective, accurate, comprehensive and comparable
datasets on temporal trends in methane emissions. Constraints include changes in reporting regulations
over time (and differences between jurisdictions), inaccessible or nonexistent recordkeeping, asset
acquisition/divestitures, and employee turnover. That said, for a time-series model to back-cast and
forecast methane emissions accurately it is necessary to better understand the direction and magnitude
of change.
Workshop Objectives
In January 2019, following the presentation of the draft study results, a workshop led by DXD Consulting
Inc. (DXD) was conducted to consider the experience of oil and gas industry experts on factors that could
influence certain parameters of interest. Input was solicited from these representatives for the purposes
of adding context to numerical results of forecasting and backcasting time-series methane modeling. The
incorporation of industry knowledge to the MEFS is intended to enhance stakeholder understanding of
the study results and to offer guidance on temporal implications to BC’s emissions performance for time-
series modeling applications.
The principal objective of the industry workshop was to solicit expert feedback on operator practices and
historical and future design considerations that may impact methane emissions from upstream facilities.
A key outcome of the workshop was for BC OGC, ECCC and the government of British Columbia through
BC CAS and MEMPR to gain a better understanding from industry representatives, of how British Columbia
oil and gas facilities and operating practices (regarding methane release drivers and management
practices) may have differed in the past and how they may change in the future due to various factors.
Workshop Methodology
The workshop was designed to build upon the presentation of current operational practices and emission
profiles as observed during the BC Methane Emissions Field Study. The workshop participant list targeted
oil and gas producers with operations in BC that were visited during the Study, as well as Federal and BC
provincial regulators.
The workshop focused on gaining industry insights on six factors that could influence modeling
parameters, or modeling drivers, that impact time-series methane emissions modeling. Specifically,
industry experts were asked to comment on how their facilities and operating practices (as they could
impact methane management) were different in the past and would be different in the future, with
respect to these six drivers. Participants were asked to characterize these differences in terms of
directionality (i.e., more or less than current practices) and magnitude as banded into 5 categories.
Magnitude categories ranged from not applicable to neutral (0-15%) to high (>= 100%). Table 4 shows the
six drivers considered, and Table 5 shows the scale for analysis of these drivers.

British Columbia Oil and Gas Methane Emissions Field Study
Page 21 of 70
Table 4: Modeling Driver
1 Equipment to Facility Ratios
2 LDAR inspection frequencies
3 Prevalence of high bleed pneumatic devices
4 Level of implementation of mitigation technologies, (for example, flares, vapour recovery)
5 Level of preventative maintenance conducted
6 Prevalence of non-emitting pneumatic devices
Table 5: Scale for characterizing the directionality and magnitude of change for each driver
Directionality and
Magnitude of Change Estimated Percent Change to Driver (or Equipment Ratios)
↑↑↑ (3) > 100%
↑↑ (2) 50% to 100%
↑ (1) 15% to 50%
--- Neutral - No Change (+/- 15%)
NA Not Applicable (doesn't exist)
↓ (-1) 15% to 50%
↓↓ (-2) 50% to 85%
↓↓↓ (-3) >85% (didn't exist in past or doesn't exist in future)
Notably, a neutral or no-change scenario was given a range of zero change to 15% change in either
direction. A change of -3 indicates that a practice essentially did not exist in the past or will not exist in the
future.
The workshop was designed to gain industry knowledge of how those drivers, with respect to operations
and practices, have changed over the past several years, and how they are expected to change, relative
to current day, in the future. To collect this information over time, the following periods were defined for
the purposes of the workshop:
Distant Past: this period is defined as pre-2009 and pre-dates the requirements for GHG reporting in
British Columbia.
Recent Past: this period is defined as 2010 to 2015 and reflects the growing influence of unconventional
gas production and potential liquefied natural gas overseas sales channels.
Current: this period is defined as 2016 to 2019. This period pre-dates the implementation of federal
methane regulations and British Columbia methane regulations.

British Columbia Oil and Gas Methane Emissions Field Study
Page 22 of 70
Future: this period is defined as 2020 to 2030. This period begins after the implementation of federal and
provincial methane regulations. It was not considered practical to characterize industry practices and
operations beyond 2030.
Initially, two future states were considered:
Future – Compliance: this state assumes that industry is compliant with the currently proposed provincial
and federal regulations and that market and regulatory conditions remains as they are currently.
Future – Best-In-Class Methane Emissions Reductions: this state assumes that industry is not only
compliant but exceeding the regulations and leading the world in methane emissions reductions. During
the facilitated workshop, this state was considered to be redundant, because federal and provincial
regulations is expected to position BC-based oil and gas production as leading the global industry in
methane emissions reductions.
Based on feedback during the workshop, these two future states were considered to be the same, and the
single future state in which Producers were compliant with the federal and provincial regulations was
evaluated during the workshop. Participants were asked to characterize projected operations and
behaviours for the future state, including anticipating practices or changes in operations that have no
defined certainty of occurring in the future.
The following guidance was provided:
• The magnitude and directionality of change are always in relation to the current state, and not the state before or after it.
• The future state assumes that BC is compliant with methane regulations.
• Only British Columbia oil and gas production was to be considered.
To conduct the workshop, the participants were put into three groups, with even representation of
producers and regulators/government in each group. Groups were first asked to define the conditions and
activities associated with each temporal state. This exercise ensured a common understanding of the
temporal state prior to investigating each of the six modeling drivers. Subsequently, for each model driver
noted above, the groups assigned directionality and magnitude of change relative to current operations
for all six drivers across three temporal states: distant past, recent past and future. Commentary framing
each rating was collected and results of each time period were presented and discussed as a group. Finally,
for the future state, the three groups came together to integrate diverging points of view, resulting in
workshop-wide general agreement on broad trends.
1 Chapter 1: Field Observations 1.1 Analytical Approach
1.1.1.1 Major Equipment Survey
Major equipment was counted during the field survey at all sites that were visited. The list of major
equipment considered are listed in Table 7. Recent field work to determine component counts for various
major equipment types has been undertaken in Alberta (Clearstone 2018). It is not expected that these

British Columbia Oil and Gas Methane Emissions Field Study
Page 23 of 70
component counts will differ between operations in BC and Alberta as the equipment shares common
manufacturers and is often designed and installed by similar firms. If major equipment was found during
the field survey which did not have associated component counts in Clearstone 2018, its components were
counted. Site-level component count averages are determined by multiplying the total major equipment
counts by their respective component count from either Clearstone 2018 or from the field survey. Further
details on major equipment types are provided in Table 6 and below. Overall component count averages
are a combination of the Clearstone 2018 study and the field survey (for unique equipment) shown in
Table 6.
Table 6: Major Equipment Component Count from Survey and Clearstone 201823
Major Equipment – Component Counts from Field Study
Major Equipment – Component Counts from Clearstone 2018
Dehydrator - Dessicant Catalytic Heater
Gas Sweetening: Sulfinol Dehydrator - Glycol
Heat Trace System Flare KnockOut Drum
Sand Separator Gas Boot
Stabilization Tower Gas Metering Building
Thermal Electric Generator Gas Pipeline Header Gas Sweetening: Amine Incinerator
LACT Unit Line Heater Liquid Pipeline Header Liquid Pump Pig Trap - Gas Service Pig Trap - Liquid Service Pop Tank Power Generator (natural gas fired) Process Boiler Production Tank Fixed Roof - Light Liquid Reciprocating Compressor Reciprocating Compressor - Electric Driver Screw Compressor Screw Compressor - Electric Driver Separator Storage Bullet Treater Well Pump Wellhead (Gas Flow) Wellhead (Gas Pump)
23 Equipment definitions available in Clearstone 2018 Section 8.4

British Columbia Oil and Gas Methane Emissions Field Study
Page 24 of 70
Wellhead (Oil Flow) Wellhead (Oil Pump)
Major equipment is categorized under each site classification to determine average major equipment per
site classification for the surveyed sites. Some site classifications (e.g., WT) are extensively surveyed (WT
had 123 sites surveyed), whereas some site classifications had very low sample sizes (e.g., 2 MGBC sites
visited). This will affect the accuracy and reliability of the average major equipment per site calculations
as smaller sample sizes may not accurately account the differences between sites with the same
classification.
1.1.1.2 Leaks and Vents Quantification
Leaks and vents observed during the field surveyed were measured if possible and estimated if
measurement was not possible, at the discretion of the field team based on safe operating practices. The
ambient conditions during measurement or estimation were also recorded. Using the ambient conditions
and measured/estimated volumetric rates, a corrected leaks/vent rate is calculated using the combined
gas law below.
Equation 1,
𝑃𝑖𝑉𝑖
𝑇𝑖=
𝑃𝑓𝑉𝑓
𝑇𝑓
Where,
Pi, Vi, and Ti, = the initial Pressure, Volumetric flow rate, and Temperature recorded in kPa, m3/hr, and °C
respectively (temperatures recorded in °C but converted to °K throughout)
Pf and Tf, = Pressure and Temperature at standard conditions (101.325 kPa and 15°C respectively)
Vf = Corrected volumetric flow rate in m3/hr
Leaks and vents are classified and analyzed based on source component, major equipment, site
classification, volumetric flow rate magnitude, and whether they were estimates or measurements.
Field staff classified excessive pneumatic venting as open-ended lines (OELs) during data collection. These
releases have been re-classified as excessive pneumatic venting to better represent the source of the
observed emissions. These sources may have been categorized as open ended lines in previous studies.
Therefore, for purposes of multiple different jurisdictions and differences in regulations around treatment
of these emissions, these 42 leaks have been re-assigned from open-ended lines to excessive pneumatic
venting to allow parties to determine their own methods to treat these emissions. these excessive
pneumatic venting instances could not be attributed to a specific make and model at the site for a variety
of reasons (e.g., instrument vent header leaks associated with multiple devices). Emissions categorized by
the field team as open-ended line venting was not observed to be related to the operation of pneumatics.
Venting from OELs mostly resulted from wellheads (surface casing vent flows) at ~75% of OEL vent sources.

British Columbia Oil and Gas Methane Emissions Field Study
Page 25 of 70
1.1.1.3 Pneumatic Count and Pneumatic Venting
Pneumatics were counted during the field survey with data on device type, drive type (e.g., electric, solar,
fuel gas (natural gas), etc.), chemical injection type, and make and model. Some limited data were also
gathered regarding flow rates and pressures, but pneumatic vents were not directly measured. Any
devices that may be pneumatically actuated (e.g. lube oil pumps) that were not classified as control
instruments or chemical injection pumps were included in the major equipment inventory and not in the
pneumatic inventory, in the same way that gas starter units would not be inventoried separately from
compressors.
Pneumatics that were not fuel gas driven were assumed not to vent methane as part of normal operation.
These pneumatics drives include electric, instrument air, solar, and propane. Pneumatic counts were
analyzed and classified based on drive type and pneumatic device type from the following list;
• Pump,
• Level Controller,
• Transducer,
• Level Switch,
• High Level Shut Down Switch,
• Positioner,
• High Pressure Shut Down Switch,
• Pressure Controller,
• Pressure Switch,
• Plunger Lift Controller,
• Temperature Switch, and
• Other
Fuel gas pneumatics makes and models were verified so that estimates for pneumatic venting could be
calculated. Pneumatic vent rates were estimated using available data from Alberta Environment and Parks
Quantification Protocol for GHG Emission Reductions from Pneumatic Devices – Table C2,24 WCI 2013,25
the Prasino Study,19 Alberta Energy Regulator’s Manual 15,26 PTAC Level Controller Study,27 and in some
cases manufacturer’s specifications. Pneumatic vent data was matched based on the make and model of
the fuel gas pneumatics surveyed. This method to estimate pneumatic venting requires reliance on
available public studies that typically have varying vent rate results for pneumatic makes and models.
Other analyses can be done based on the make and models of the pneumatics determined from the field
survey and analysis in this study to determine a possible range of vent rates.
24 Quantification protocol for greenhouse gas emission reductions from pneumatic devices (version 2.0), Alberta Environment and Parks, January 2017 (Available at https://open.alberta.ca/publications/9781460131633) 25 WCI Quantification Method 2013 Addendum to Canadian Harmonization Version, Western Climate Initiative, December 2013 (Available at https://www2.gov.bc.ca/assets/gov/environment/climate-change/ind/quantification/wci-2013.pdf) 26 Estimating Methane Emissions, Alberta Energy Regulator, December 2018 (Available at https://www.aer.ca/documents/manuals/Manual015.pdf) 27 Level Controller Emission Study Fisher L2 and Improved Relays, Norriseal 1001As and EVS, Greenpath Energy, October 2018 (Available at https://auprf.ptac.org/wp-content/uploads/2018/10/Final-Report-Level-Controller-V8-20181003.pdf)

British Columbia Oil and Gas Methane Emissions Field Study
Page 26 of 70
Excessive pneumatic venting is not included in this section, as it is considered in the section on fugitive
emissions. Current regulation surrounding excessive pneumatic venting varies across jurisdictions and
excessive pneumatic venting is classified as either a vent or a leak in different regulations. This study
adopts BC’s requirements under the Drilling and Production Regulation by classifying this source as a
fugitive emission.
1.2 Results 1.2.1 Major Equipment Counts
Major equipment in hydrocarbon service were counted for each location surveyed. The counts included
both operating and pressurized non-operating equipment from the list in Table 7 and Table 8. The average
(mean) process equipment count for a given facility subtype or well status is determined using the
following relation:
Equation 2,
𝑁 ̅M𝐸 = 𝑁M𝐸 /𝑁F/W
Where,
N̅ME = average (mean) major equipment count for a given site classification,
NME = total number of process equipment surveyed for a given site classification,
NF/W = total number of sites visited of the considered site classification (12 site classifications)
Average and total major equipment counts per facility subtype are presented in Table 7 and Table 8
respectively.
Table 7: Average Major Equipment per Facility Type
Site Classification (Number of Sites Surveyed)
Major Equipment List WT (123)
WO (31)
WC (51)
SWBT (3)
SWBO (7)
SWBC (4)
MPBO (7)
MGBT (15)
MGBO (4)
MGBC (2)
MEMT (12)
MEMC (7)
Catalytic Heater 1.50 0.52 2.00 2.00 1.71 1.75 7.29 5.93 4.00 1.00 15.75 4.29
Catalytic Incinerator 0.02 0.14 0.07
Dehydrator - Dessicant 0.25 0.20 0.29
Dehydrator - Glycol 0.02 0.25 0.57 0.40 1.17 0.29
Expansion Tank 0.14
Flare KnockOut Drum 0.04 0.39 0.33 0.29 0.25 1.43 0.93 0.75 1.50 0.86
Gas Boot 0.14 0.07 0.08
Gas Metering Building 0.01 0.06 0.14
Gas Pipeline Header 0.03 0.02 0.14 0.25 0.57 0.40 0.75 0.50 0.17 0.14
Gas Sample and Analysis System
0.02 0.07 0.25 0.29
Gas Sweetening Scavenger 0.02
Gas Sweetening: Amine 0.07 0.08
Gas Sweetening: Sulfinol 0.13
Heat Trace System 0.01 0.33 0.25
Incinerator 0.29 0.20 0.25 0.08
LACT Unit 0.29
Line Heater 0.08 0.03 0.31 0.14 0.50 0.07 0.17 0.14
Liquid Pipeline Header 0.02 0.13 0.71 0.20 0.08
Liquid Pump 3.57 0.73 0.42 0.43
Lube Oil Tank 0.14
Meter Building 0.10 0.37 0.25 0.14 0.20 0.50 0.17 0.14

British Columbia Oil and Gas Methane Emissions Field Study
Page 27 of 70
Site Classification (Number of Sites Surveyed)
Major Equipment List WT (123)
WO (31)
WC (51)
SWBT (3)
SWBO (7)
SWBC (4)
MPBO (7)
MGBT (15)
MGBO (4)
MGBC (2)
MEMT (12)
MEMC (7)
Pig Trap - Gas Service 0.19 0.47 0.67 0.43 0.50 1.00 2.87 0.75 0.50 3.08 1.00
Pig Trap - Liquid Service 0.05 0.32 0.02 0.14 0.25 0.86 0.50 0.08 0.14
Pneumatic Panel 0.14
Pop Tank 0.01 0.13 0.43 0.71 0.07 0.75
Power Generator (natural gas fired)
0.02 0.25 0.43 0.67 0.50 1.33 1.00
Process Boiler 0.43 0.13 0.43
Production Tank - Water 0.04 0.43 0.25 1.14 2.20 0.75 2.75 0.57
Production Tank Fixed Roof - Light Liquid
0.03 0.13 0.02 0.67 0.86 0.25 3.57 0.73 1.50 1.67 0.71
PumpJack 0.03
Reciprocating Compressor - Electric Driver
0.03 0.14 0.86 0.67 1.83 1.29
Reciprocating Compressor –
Natural Gas 0.14 0.27 0.14
Sand Separator 0.15 0.03 0.33 0.33
Screw Compressor - Electric Driver
0.33
Screw Compressor - Natural
Gas 0.71 0.20 0.17
Separator 0.31 0.26 0.10 0.33 0.86 1.50 3.43 2.33 1.50 0.50 2.75 1.86
Shipping Pump 0.14
Stabilization Tower 0.07
Storage Bullet 0.03 0.10 0.27 0.29 0.14 0.17
Thermal Electric Generator 0.15 0.10 0.49 0.67 0.43 0.27 0.50 0.50 0.17 0.43
Treater 0.86 0.07
Unit Heater 0.01
Water Storage Unit 0.03
Well Pump 0.68 0.02 0.71 0.50 0.14
Wellhead (Gas Flow) 1.01 0.16 1.14 0.33 0.14 0.43 0.60 0.08
Wellhead (Gas Pump) 0.03
Wellhead (Oil Flow) 0.26 0.43 0.50 0.14
Wellhead (Oil Pump) 0.58 0.02 0.43 0.14
Wellhead (Water Injection) 0.07
Table 8: Total Major Equipment by Facility Type
Site Classification (Number of Sites Surveyed)
Major Equipment List WT (123)
WO (31)
WC (51)
SWBT (3)
SWBO (7)
SWBC (4)
MPBO (7)
MGBT (15)
MGBO (4)
MGBC (2)
MEMT (12)
MEMC (7)
Catalytic Heater 185 16 102 6 12 7 51 89 16 2 189 30
Catalytic Incinerator 1 1 1
Dehydrator - Dessicant 1 3 2
Dehydrator - Glycol 2 1 4 6 14 2
Expansion Tank 1
Flare KnockOut Drum 5 20 1 2 1 10 14 3 18 6
Gas Boot 1 1 1
Gas Metering Building 1 3 1
Gas Pipeline Header 4 1 1 1 4 6 3 1 2 1
Gas Sample and Analysis System 2 1 3 2
Gas Sweetening Scavenger 2
Gas Sweetening: Amine 1 1
Gas Sweetening: Sulfinol 2
Heat Trace System 1 5 3
Incinerator 2 3 1 1
LACT Unit 2
Line Heater 10 1 16 1 2 1 2 1
Liquid Pipeline Header 3 4 5 3 1
Liquid Pump 25 11 5 3
Lube Oil Tank 1
Meter Building 12 19 1 1 3 1 2 1
Pig Trap - Gas Service 23 24 2 3 2 7 43 3 1 37 7
Pig Trap - Liquid Service 6 10 1 1 1 6 2 1 1

British Columbia Oil and Gas Methane Emissions Field Study
Page 28 of 70
Site Classification (Number of Sites Surveyed)
Major Equipment List WT (123)
WO (31)
WC (51)
SWBT (3)
SWBO (7)
SWBC (4)
MPBO (7)
MGBT (15)
MGBO (4)
MGBC (2)
MEMT (12)
MEMC (7)
Pneumatic Panel 1
Pop Tank 1 4 3 5 1 3
Power Generator (natural gas fired)
2 1 3 10 2 16 7
Process Boiler 3 2 3
Production Tank - Water 5 3 1 8 33 3 33 4
Production Tank Fixed Roof - Light Liquid
4 4 1 2 6 1 25 11 6 20 5
PumpJack 1
Reciprocating Compressor - Electric Driver
1 4 1
Reciprocating Compressor – Natural Gas
4 1 6 10 22 9
Sand Separator 18 1 1 5
Screw Compressor – Natural Gas 1
Screw Compressor - Electric Driver
5 3 2
Separator 38 8 5 1 6 6 24 35 6 1 33 13
Shipping Pump 1
Stabilization Tower 1
Storage Bullet 4 3 14 2 1 2
Thermal Electric Generator 19 3 25 2 3 4 2 1 2 3
Treater 6 1
Unit Heater 1
Water Storage Unit 1
Well Pump 21 1 5 2 1
Wellhead (Gas Flow) 124 5 58 1 1 3 9 1
Wellhead (Gas Pump) 4
Wellhead (Oil Flow) 8 3 2 1
Wellhead (Oil Pump) 18 1 3 1
Wellhead (Water Injection) 1
1.2.2 Component Counts
Major equipment counts were matched with average component-to-equipment ratios. Component-to-
equipment ratios were derived either from Clearstone 2018 or actual component counts on major
equipment for which there were no existing ratios (as outlined in Table 6). This approach was used to
determine average component counts for the various site types considered in this study. Component
counts in the field were acquired for process equipment observed in the field that was not in Clearstone
2018. Some components serviced different gas and liquid types (process gas, fuel gas, light liquid, and
heavy liquid), which is differentiated in Table 9 and Table 10. No heavy liquid service was encountered in
the study. Below is the list of all component types considered:
• Compressor Seals,
• Connector,
• Control Valve,
• Meter,
• Open-Ended Line,
• Pressure Relief Valves and Pressure Safety Valves (PRV/PSV),
• Pump Seal,
British Columbia Oil and Gas Methane Emissions Field Study
Page 29 of 70
• Regulator,
• Thief Hatch, and
• Valve.
The thief hatch component type was added because their emission release characteristics are poorly
represented by other component types. It was observed that the leaker and population leak factors
differed significantly from connectors and OELs resulting in the creation of a separate component
category. This component type may not be considered in other, similar studies. Historically, thief hatches
were counted as a valve or a PRV. Because the leaker and population leak factors presented below for
thief hatches are different than connectors and OELs (excessive pneumatic venting), separate components
types are justifiable.
Gas component services included fuel gas and process gas, but fuel gas is aggregated with process gas.
This is consistent with methods used in other fugitive emission factor studies.28 Average (mean)
component counts are calculated for each process equipment type using Equation 3 and are presented in
Table 9 and Table 10.
Equation 3,
𝑁 ̅𝐶𝐶 = 𝑁𝐶𝐶/𝑁F/W
Where,
N̅𝐶𝐶 = average component count for a given facility subtype or well status,
NCC = total number of components for a given facility subtype or well status (Clearstone 2018 or field
survey),
NF/W = total number of a given facility subtype or well status surveyed.
Clearstone 2018 provides ranges for confidence intervals for their average components per major
equipment type calculations, which are particularly wide for major equipment with few sample sizes.
Some major equipment component counts, such as catalytic heaters (650 observed in Clearstone 2018),
have tight confidence intervals ranging from 7-29% and 8-32% for lower and upper confidence intervals
of multiple component types. These tighter confidence intervals are due to large sample sizes and less
variation in component accounts across all catalytic heaters. However, there are also examples of large
confidence intervals such as flare knockout drums (29 observed in Clearstone 2018), which have
confidence intervals ranging from 45-100% and 58-308% for lower and upper confidence intervals of
multiple component types. Which is a due to a combination of smaller sample sizes and large variability
between component counts for individual flare knockout drums. The confidence intervals from the
Clearstone study would conceptually carry over to the estimates of component counts for this study.
28 Update of Fugitive Equipment Leak Emission Factors, CAPP 2014 (https://www.capp.ca/-/media/capp/customer-portal/publications/238773.pdf?modified=20180910181053)

British Columbia Oil and Gas Methane Emissions Field Study
Page 30 of 70
As an example, current average gas connecter counts for wells (WT, WO, WC) are at 90-135 connectors
per well. The factors that went into estimating the connectors for wells from the Clearstone 2018 study
and the average major equipment per site classification. In the Clearstone 2018 study, a wellhead (which
should be present at every well location) has 44 connectors, and accounts for ~30-40% of total connectors
at a well (WT, WO, WC) in this study. Other major equipment that accounts for a significant portion of the
average connector count for wells in this study include separators (25-30%), line heaters (4-24%), Flare
Knockout Drum (16% for WC), and some reciprocating compressors (16% for WT). In the Clearstone 2018
study, there are 2 reciprocating and 3 screw compressors that were determined to be located on well sites
for comparison. Clearstone 2018 surveyed 440 unique wells. This suggests that outliers may have
significant impacts on average component calculations and qualitatively confirms the wide confidence
intervals determined by others.

British Columbia Oil and Gas Methane Emissions Field Study
Page 31 of 70
Table 9: Average Component Counts for Site Classifications
Site Classification (Number of Sites Surveyed)
Average Component Counts WT
(123)
WO
(31)
WC
(51)
SWBT
(3)
SWBO
(7)
SWBC
(4)
MPBO
(7)
MGBT
(15)
MGBO
(4) MGBC (2)
MEMT
(12) MEMC (7)
Compressor Seal Process Gas 0.121
0.533
3.984 3.274
6.940 5.154
Connector Fuel Gas 0.014 0.003 0.015 0.021 0.016 5.958 0.016 11.158 0.016 0.016 0.318 6.848
Connector Light Liquid 33.551 87.356 43.051 58.709 156.122 149.706 896.869 353.374 166.894 37.203 427.718 263.286
Connector Process Gas 128.750 94.786 136.466 207.814 307.817 397.255 1730.206 1,230.841 378.599 119.572 2,075.041 1,323.392
Control Valve Fuel Gas
0.042
0.033
0.048
Control Valve Light Liquid 0.389 0.469 0.667 0.708 1.340 1.270 6.088 3.152 1.119 0.364 4.157 2.697
Control Valve Process Gas 0.451 0.243 0.297 1.078 1.226 2.142 8.988 5.866 2.703 0.672 9.608 5.713
Meter Fuel Gas
0.042
0.033
0.048
Meter Light Liquid 0.152 0.120 0.065 0.180 0.360 0.631 4.742 1.405 0.631 0.210 1.351 1.033
Meter Process Gas 0.498 0.342 0.358 0.731 1.151 2.204 6.278 3.927 2.062 0.813 5.170 3.124
Open-Ended Line Fuel Gas 0.016
0.667
0.500
Open-Ended Line Light Liquid 0.037 0.132 0.270 0.245 0.645 0.178 2.393 0.773 1.301
1.070 0.017
Open-Ended Line Process Gas 0.111 0.067 0.038 0.447 0.239 0.326 1.764 1.032 0.285 0.104 1.993 1.135
PRV/PSV Fuel Gas 0.008
0.125
0.433
0.250 0.143
PRV/PSV Light Liquid 0.000 0.002 0.000 0.008 0.010 0.003 2.519 0.459 0.018
0.275 0.271
PRV/PSV Process Gas 0.961 0.747 0.611 2.422 2.629 3.960 15.587 10.182 3.323 1.039 15.840 10.074
Pump Seal Light Liquid
0.631 0.021
0.466
3.889 0.767
0.436 0.448
Regulator Fuel Gas 0.117 0.052 0.222 0.382 0.194 0.083
0.749 0.227 0.227 0.437 0.289
Regulator Light Liquid 0.018 0.004
0.040
0.040
Regulator Process Gas 3.710 2.948 4.868 3.837 7.734 11.473 36.953 24.572 12.551 2.809 49.472 24.608
Thief Hatch Light Liquid 0.013 0.052 0.008 0.267 0.343 0.100 1.429 0.293 0.600
0.667 0.286
Thief Hatch Process Gas 0.008 0.033 0.005 0.173 0.222 0.065 0.924 0.190 0.388
0.431 0.185
Valve Fuel Gas
1.000
2.267
1.143
Valve Light Liquid 6.949 19.933 9.491 11.618 32.151 28.580 189.719 69.018 33.655 7.000 76.025 45.945
Valve Process Gas 27.673 18.226 31.738 25.024 50.185 72.769 223.016 170.630 78.501 30.277 244.432 136.396

British Columbia Oil and Gas Methane Emissions Field Study
Page 32 of 70
Table 10: Total Component Counts for Site Classifications
Site Classification (Number of Sites Surveyed)
Total Component
Counts WT (123) WO (31) WC (51)
SWBT
(3)
SWBO
(7)
SWBC
(4)
MPBO
(7)
MGBT
(15)
MGBO
(4)
MGBC
(2)
MEMT
(12)
MEMC
(7)
Compressor Seal Process
Gas
15
4
28 49
83 36
Connector Fuel Gas 2 0 1 0 0 24 0 167 0 0 4 48
Connector Light Liquid 4,127 2,708 2,196 176 1,093 599 6,278 5,301 668 74 5,133 1,843
Connector Process Gas 15,836 2,938 6,960 623 2,155 1,589 12,111 18,463 1,514 239 24,900 9,264
Control Valve Fuel Gas
0
1
0
Control Valve Light Liquid 48 15 34 2 9 5 43 47 4 1 50 19
Control Valve Process Gas 55 8 15 3 9 9 63 88 11 1 115 40
Meter Fuel Gas
0
1
0
Meter Light Liquid 19 4 3 1 3 3 33 21 3 0 16 7
Meter Process Gas 61 11 18 2 8 9 44 59 8 2 62 22
Open-Ended Line Fuel Gas 2
10
6
Open-Ended Line Light
Liquid
5 4 14 1 5 1 17 12 5
13 0
Open-Ended Line Process
Gas
14 2 2 1 2 1 12 15 1 0 24 8
PRV/PSV Fuel Gas 1
1
7
3 1
PRV/PSV Light Liquid 0 0 0 0 0 0 18 7 0
3 2
PRV/PSV Process Gas 118 23 31 7 18 16 109 153 13 2 190 71
Pump Seal Light Liquid
20 1
3
27 12
5 3
Regulator Fuel Gas 14 2 11 1 1 0
11 1 0 5 2
Regulator Light Liquid 2 0
0
1
Regulator Process Gas 456 91 248 12 54 46 259 369 50 6 594 172
Thief Hatch Light Liquid 2 2 0 1 2 0 10 4 2
8 2
Thief Hatch Process Gas 1 1 0 1 2 0 6 3 2
5 1
Valve Fuel Gas
4
34
8
Valve Light Liquid 855 618 484 35 225 114 1,328 1,035 135 14 912 322
Valve Process Gas 3,404 565 1,619 75 351 291 1,561 2,559 314 61 2,933 955

British Columbia Oil and Gas Methane Emissions Field Study
Page 33 of 70
1.2.3 Pneumatic Devices
1.2.3.1 Pneumatic Device Counts
Pneumatic devices driven by natural gas, propane, instrument air, solar, and electric were inventoried
at each location surveyed during the study. 2120 pneumatic devices were observed in the field survey
and inventoried, with 725 gas driven pneumatics, 891 instrument air, 419 electric, 11 propane, 59 solar,
and 6 were classified as ‘other’. Figure 7 below delineates the pneumatic inventory by device type and
driver type. The majority (1395 of 2120) of devices are not driven by natural gas and as such will not
contribute to site or facility level methane emissions. The pneumatic device types considered are the
following:
• Pump,
• Level Controller,
• Transducer,
• Level Switch,
• High Level Shut Down Switch,
• Positioner,
• High Pressure Shut Down Switch,
• Pressure Controller,
• Pressure Switch,
• Plunger Lift Controller,
• Temperature Switch, and
• Other
Figure 7 and Figure 8 presents the distribution of pneumatics by drive and device type. The most
common pneumatic device types are pumps, level controllers, and transducers, with a majority of them
running on instrument air or electric drives.

British Columbia Oil and Gas Methane Emissions Field Study
Page 34 of 70
Figure 7: Observed Pneumatic Devices and Equivalents
Figure 8: Pneumatic Device Distribution by Drive Type
Table 11 and Table 14 present the average pneumatic devices per site type for all, high bleed gas, low
bleed gas, and no bleed (electric, solar, propane, air, other) drive type pneumatics. The majority (65%)
of pneumatics are no bleed and are assumed to not emit natural gas from normal operation. For the
no bleed pneumatics, 16 were fueled by propane, and are aggregated with no-bleed pneumatics as
0
50
100
150
200
250
300
350
400
450
Electric Instrument Air Fuel Gas Propane Propane/Fuel Gas Solar Other
Instrument Air Fuel Gas (Natural Gas) Electric Solar Propane Other

British Columbia Oil and Gas Methane Emissions Field Study
Page 35 of 70
they would not emit methane. The make and models of all fuel gas pneumatics are included in
Appendix A: Data Tables.
High and low bleed designations were based on the vent rate used, and not necessarily manufacturer
specifications. The latest studies such as Spartan 2018 re-affirm manufacturer static bleed rates, but
quantification of release rates using other than manufacturer specifications was included for
completeness and comparison to other studies (see Section 2.1.4).
Table 11: Average Pneumatic Types by Site Classification (All Drives) Site Classification (Number of Sites Surveyed)
Site Average Pneumatic Device Types WT
(123)
WO
(31)
WC
(51)
SWBT
(3)
SWBO
(7)
SWBC
(4)
MPBO
(7)
MGBT
(15)
MGBO
(4)
MGBC
(2)
MEMT
(12)
MEMC
(7)
Level Controller 0.55 0.32 0.18 1.33 1.43 1.50 8.00 5.60 2.25 9.67 3.71
Transducer 0.49 0.07 0.41 1.67 2.25 5.29 5.53 1.50 6.17 6.43
Level Switch 0.30 0.13 0.24 0.67 0.43 1.50 0.57 2.27 1.00 4.50 5.43
Pump 1.04 0.58 1.57 2.33 1.29 1.25 4.14 4.20 2.00 1.00 4.92 2.14
High Level Shut Down 0.25 0.03 0.18 0.67 0.43 0.25 0.86 3.40 6.67 0.57
Positioner 0.25 0.07 0.12 1.00 2.86 1.93 1.25 2.75 1.43
High Pressure Shut Down 0.10 0.48 0.10 0.67 1.86 0.25 0.71 1.53 0.50 0.33 0.43
Pressure Controller 0.13 0.13 0.10 1.57 0.75 5.71 1.13 1.00 2.67 2.43
Pressure Switch 0.32 0.03 0.57 0.43 1.13 0.25 0.27
Plunger Lift Controller 0.01 0.03 0.06 0.13
Temperature Switch 0.11 0.03 0.39 0.14 1.25 1.14 0.27 2.00 1.14
Other 0.02 0.07 0.04 0.14
Table 12: Average High Bleed Pneumatics by Site Classification (Natural Gas Drive Only) Site Classification (Number of Sites Surveyed)
Site Average HB Pneumatics WT
(123)
WO
(31)
WC
(51)
SWBT
(3)
SWBO
(7)
SWBC
(4)
MPBO
(7)
MGBT
(15)
MGBO
(4)
MGBC
(2)
MEMT
(12)
MEMC
(7)
Level Controller 0.35 0.13 0.12 1.33 0.86 0.57 1.40 0.75
Transducer 0.29 0.03 0.26 0.33 0.25 0.13 1.25 0.43
Level Switch 0.03 0.33 0.29
High Level Shut Down 0.02 0.14
Positioner 0.21 0.03 0.08 0.40
High Pressure Shut Down
Pressure Controller 0.12 0.07 0.06 1.43 0.75 0.86 0.60 0.50 0.50
Pressure Switch
Plunger Lift Controller
Temperature Switch
Other 0.02
Table 13: Average Low Bleed Pneumatics by Site Classification (Natural Gas Drive Only) Site Classification (Number of Sites Surveyed)
Site Average LB Pneumatics WT
(123)
WO
(31)
WC
(51)
SWBT
(3)
SWBO
(7)
SWBC
(4)
MPBO
(7)
MGBT
(15)
MGBO
(4)
MGBC
(2)
MEMT
(12)
MEMC
(7)
Level Controller 0.07 0.13 0.04 0.29 0.75 0.29 0.87 0.50 1.00
Transducer 0.13 0.03 0.08 1.33 0.73
Level Switch 0.02 0.06 0.25 0.07 0.50
High Level Shut Down 0.07 0.03 0.16 0.14 0.25 0.14 0.07 0.50
Positioner
High Pressure Shut Down 0.07 0.45 0.06 0.67 1.29 0.47
Pressure Controller
Pressure Switch 0.28 0.45 0.07
Plunger Lift Controller
Temperature Switch 0.11 0.03 0.35 0.14 1.00 0.07
Other
Table 14: Average No Bleed Pneumatics by Site Classification Site Classification (Number of Sites Surveyed)

British Columbia Oil and Gas Methane Emissions Field Study
Page 36 of 70
Site Average NB29 Pneumatics WT
(123)
WO
(31)
WC
(51)
SWBT
(3)
SWBO
(7)
SWBC
(4)
MPBO
(7)
MGBT
(15)
MGBO
(4)
MGBC
(2)
MEMT
(12)
MEMC
(7)
Level Controller 0.07 0.13 0.02 0.29 0.75 7.14 3.20 0.75 8.67 3.71
Transducer 0.07 0.03 0.06
2.00 5.14 4.67
6.17 6.00
Level Switch 0.25 0.13 0.10 0.33 0.14 1.00 0.57 2.07 1.00
4.00 5.43
Pump 0.53 0.36 1.14 0.67 0.57 1.00 2.14 1.40 0.75 1.00 2.17 0.86
High Level Shut Down 0.16
0.02 0.67 0.14
0.71 3.20
6.17 0.57
Positioner 0.03
0.02
2.86 1.53 0.25
2.75 1.43
High Pressure Shut Down 0.01 0.03 0.02
0.29
0.29 0.67 0.50
0.33 0.43
Pressure Controller 0.01
0.02
0.14
4.86 0.53 0.50
2.17 2.43
Pressure Switch 0.04 0.03 0.10
0.43 1.07
0.25 0.29
Plunger Lift Controller
Temperature Switch
0.25 1.14 0.20
2.00 1.14
Other 0.01 0.07 0.14
Figure 9 compares high and low bleed pneumatics by controller type. High bleed are assumed for
pneumatic makes and models with vent rates over 0.17 m3/hour, with low bleed being below 0.17
m3/hour. As outlined above, a similar methodology to determine vent rates used in Clearstone 2018
was applied. There are a total of 725 gas-driven pneumatics, with 403 high bleed, 321 low bleed, and
one was unknown as the make and model was not discernable.
Figure 9: High Bleed and Low Bleed Pneumatics by Control Instrument Type
1.2.3.2 Pneumatics Control Instrument Venting
In this study, vented emissions from pneumatic devices were not measured during the field study.
Pneumatic venting was calculated using available literature and publicly available data on normal
operational vent rates based on the make and model of the pneumatics which provides a method to
29 Drive Types: Electric, Solar, Propane, Air
0
10
20
30
40
50
60
70
80
90
100
Level Controller Transducer Level Switch High Level ShutDown
Positioner High PressureShut Down
PressureController
Pressure Switch Plunger LiftController
TemperatureSwitch
High Bleed Low Bleed

British Columbia Oil and Gas Methane Emissions Field Study
Page 37 of 70
perform site level comparisons. This method is similar compared to other studies such as Clearstone
2018 and Greenpath 2016. There are a wide variety of published pneumatic device vent rates. The
pneumatic venting results below are based on the considered sources described in Section 1.1. Only
fuel gas pneumatics were assumed to vent methane as part of normal operations. Pneumatic venting
rates are summarized below in Table 15 which indicates the weighted average of the estimated vent
rates for each type of device and site.
Table 15: Average Natural Gas Pneumatic Device Vent Rates (m3/hour) Site Classification (Number of Sites Surveyed)
Average Estimated Pneumatic
Venting (m3/hour)
WT
(123)
WO
(31)
WC
(51)
SWBT
(3)
SWBO
(7)
SWBC
(4)
MPBO
(7)
MGBT
(15)
MGBO
(4)
MGBC
(2)
MEMT
(12) MEMC (7)
Level Controller 0.21 0.14 0.36 0.26 0.20 0.01 0.18 0.16 0.16 0.01 Transducer 0.31 0.26 0.47 0.17 0.37 0.14 0.15 0.33 0.51
Level Switch 0.19 0.00 0.10 0.26 0.05 0.09 0.09 0.01 Pump 0.73 0.71 0.44 0.47 0.77 0.14 0.67 0.61 0.58 0.75
High Level Shut Down 0.03 0.01 0.02 0.05 0.05 0.01 0.09 0.01 Positioner 0.51 0.40 0.55 0.14 0.54 0.14 High Pressure Shut Down 0.06 0.06 0.05 0.05 0.06 0.14 0.14 0.09 Pressure Controller 0.67 0.17 0.58 0.91 1.09 1.53 0.36 0.21 0.21 Pressure Switch 0.04 0.05 0.02 Plunger Lift Controller 0.14 0.14 0.14 0.14 Temperature Switch 0.04 0.04 0.05 0.04 0.04 0.04 Other 0.14 0.14 0.14 Overall Average 0.35 0.22 0.24 0.25 0.40 0.27 0.64 0.27 0.30 0.10 0.65
1.2.3.3 Pneumatic Pumps
Table 16 and below present data on average pneumatic pumps per site classification. Due to limitations
during the field survey, the chemical injection rates were not available (for example, many inactive
pumps during September). The average vent rate for pneumatic pumps was determined in the same
method as the other pneumatic devices described in Section 1.1 as no vent rates were measured during
the field survey. This was done to facilitate comparison of site level vent rates from pneumatic pumps.
The type of chemical injected is available and summarized in Table 17 and Table 18 below by the
number of pumps observed per chemical injection and site classification. Chemical type may imply
whether pumps are seasonal or continuous, but this was not been quantitatively assessed within the
scope of this study.
Table 16: Average Chemical Injection Pumps per Site
Site Classification (Number of Sites Surveyed)
Average Pumps per Site WT
(123) WO (31)
WC (51)
SWBT (3)
SWBO (7)
SWBC (4)
MPBO (7)
MGBT (15)
MGBO (4)
MGBC (2)
MEMT (12)
MEMC (7)
Total Methanol Pumps 0.68 0.19 0.90 1.00 0.86 0.75 0.71 1.00 1.50 0.50 1.00 0.43
Total Other Chemical Pumps 0.33 0.35 0.65 1.33 0.43 0.50 1.43 1.47 0.50 0.50 1.42 1.00
Gas Driven Methanol Pumps 0.28 0.16 0.29 1.00 0.71 0.25 0.60 1.25 0.08 0.29
Gas Driven Other Chemical Pumps 0.20 0.03 0.14 0.67 0.47 0.17 0.29
No Bleed Methanol Pumps 0.40 0.03 0.61 0.14 0.50 0.71 0.40 0.25 0.50 0.92 0.14
No Bleed Other Chemical Pumps 0.13 0.32 0.51 0.67 0.43 0.50 1.43 1.00 0.50 0.50 1.25 0.71
Table 17: Overall Number of Pneumatic Pumps by Chemical Injection Type Chemical Type Injected Number of Gas Driven Pumps Number of Non-Emitting Pumps
Corrosion Inhibitor 20 55
Methanol/Corrosion Inhibitor mix 13 4
Methanol 69 105
Other 23 50
Scale Inhibitor 0 1

British Columbia Oil and Gas Methane Emissions Field Study
Page 38 of 70
Scavenger 2 1
Table 18: Number of Pumps by Chemical Injection Type and Site Classification
Site Classification
Chemical Type Injected Number of Gas Driven
Pumps Number of Non-Gas
Driven Pumps Average Release Rate of Gas-
driven (m3/hr)
WT Corrosion inhibitor 10 12 0.80
WT Methanol/Corrosion
Inhibitor mix 6 3 0.67
WT Methanol 29 46 0.77
WT No chemical in Tank 0 1
WT Other 13 2 0.84
WT Scale Inhibitor 0 1
WT Scavenger 1 0 0.93
WO Corrosion inhibitor 0 4
WO Methanol 5 1 0.90
WO Other 1 6 0.57
WC Corrosion inhibitor 5 19 0.62
WC Methanol/Corrosion
Inhibitor mix 3 0 1.02
WC Methanol 12 31 0.69
WC Other 2 7 0.80
SWBT Corrosion inhibitor 0 1
SWBT Methanol/Corrosion
Inhibitor mix 2 0 0.93
SWBT Methanol 1 0 0.57
SWBT Other 2 1 0.98
SWBO Corrosion inhibitor 0 3
SWBO Methanol 5 1 0.75
SWBC Corrosion inhibitor 0 1
SWBC Methanol 1 2 1.02
SWBC Other 0 1
MPBO Methanol 0 5
MPBO Other 0 10
MGBT Corrosion inhibitor 1 4 0.93
MGBT Methanol/Corrosion
Inhibitor mix 2 0 0.93
MGBT Methanol 7 6 0.78
MGBT Other 5 10 0.78
MGBT Scavenger 1 1 0.57
MGBO Corrosion inhibitor 0 1
MGBO Methanol 5 1 0.75
MGBO Other 0 1
MGBC Corrosion inhibitor 0 1
MGBC Methanol/Corrosion
Inhibitor mix 0 1
MEMT Corrosion inhibitor 2 5 0.78
MEMT Glycol 0 0
MEMT Methanol 1 11 0.57
MEMT Other 0 10
MEMC Corrosion inhibitor 2 4 0.78
MEMC Methanol 2 1 0.67
MEMC Other 0 1
1.2.4 Equipment Fugitive Emissions
In the data received from the field survey, all detected methane emissions (excluding normal
pneumatic operation) were classified into two categories; leaks (equipment fugitive sources) and vents
(venting sources). In the field survey, 284 leaks were detected and quantified.

British Columbia Oil and Gas Methane Emissions Field Study
Page 39 of 70
A summary of the equipment fugitives detected and quantified at different site types is outlined in
Table 19.
Table 19: Equipment Fugitives Summary by Site Type
Site Class-
ification
Number of Sites Visited
Sites with one or more leaks
Average Leak Rate
(Leaker Population)
Average Leak Rate (General
Population)
Main Contributor to
Leak Rate
Most Common Leak Type
(%) (m3/day/site)
WT 123 17% 9.29 1.59
Open-ended Lines
(Excessive Pneumatic
Venting)
Connectors
WO 31 39% 8.68 3.36 Thief Hatches Connectors
WC 51 55% 5.6 3.07 Valves Connectors
SWBT 3 67% 30.9 20.6 Valves
Valves and Open-ended
Lines (Excessive Pneumatic Venting)
SWBO 7 57% 14.13 8.08
Open-ended Lines
(Excessive Pneumatic
Venting)
Open-ended Lines
(Excessive Pneumatic Venting),
Connectors, and Valves
SWBC 4 75% 7.17 5.38 Valves Valves
MPBO 7 71% 34 24.29 Thief Hatches Valves and Connectors
MGBT 15 67% 20.33 13.55
Open-ended Lines
(Excessive Pneumatic
Venting)
Connectors
MGBO 4 25% 17.93 4.48
Open-ended Lines
(Excessive Pneumatic
Venting)
Open-ended Lines
(Excessive Pneumatic
Venting) and Connectors
MGBC 2 0% 0 0
MEMT 12 83% 33.69 28.08 Connectors Connectors

British Columbia Oil and Gas Methane Emissions Field Study
Page 40 of 70
Site Class-
ification
Number of Sites Visited
Sites with one or more leaks
Average Leak Rate
(Leaker Population)
Average Leak Rate (General
Population)
Main Contributor to
Leak Rate
Most Common Leak Type
(%) (m3/day/site)
MEMC 7 71% 19.69 14.07 Connectors Connectors
1.2.4.1 Leak Distribution
Figure 10 presents the number of leaks detected per site. 166 of the 266 sites surveyed had no leaks
detected. And most (88 of 101) of the remaining sites had fewer than 4 leaks per site. 13 sites had 5 or
more leaks per site, with 3 sites having more than 10 leaks (11, 11, and 16 leaks for those 3 sites).
Figure 10: Distribution of leaks observed per facility survey
Figure 11 presents the maximum, minimum, and average leaks detected per site type. The two average
bars indicate the average per leaking site and the average per site type overall which includes sites with
no leaks. The average amount of leaks per site classification (where leaks are detected) is under 5 for
all site types with an overall average of 2.8 leaks per site where leaks are detected, or an overall average
of 1.1 leaks per site (includes sites with no leaks detected).
0
20
40
60
80
100
120
140
160
180
0 1 2 3 4 5 6 7 8 9 10+
# o
f Si
tes
# of Leaks
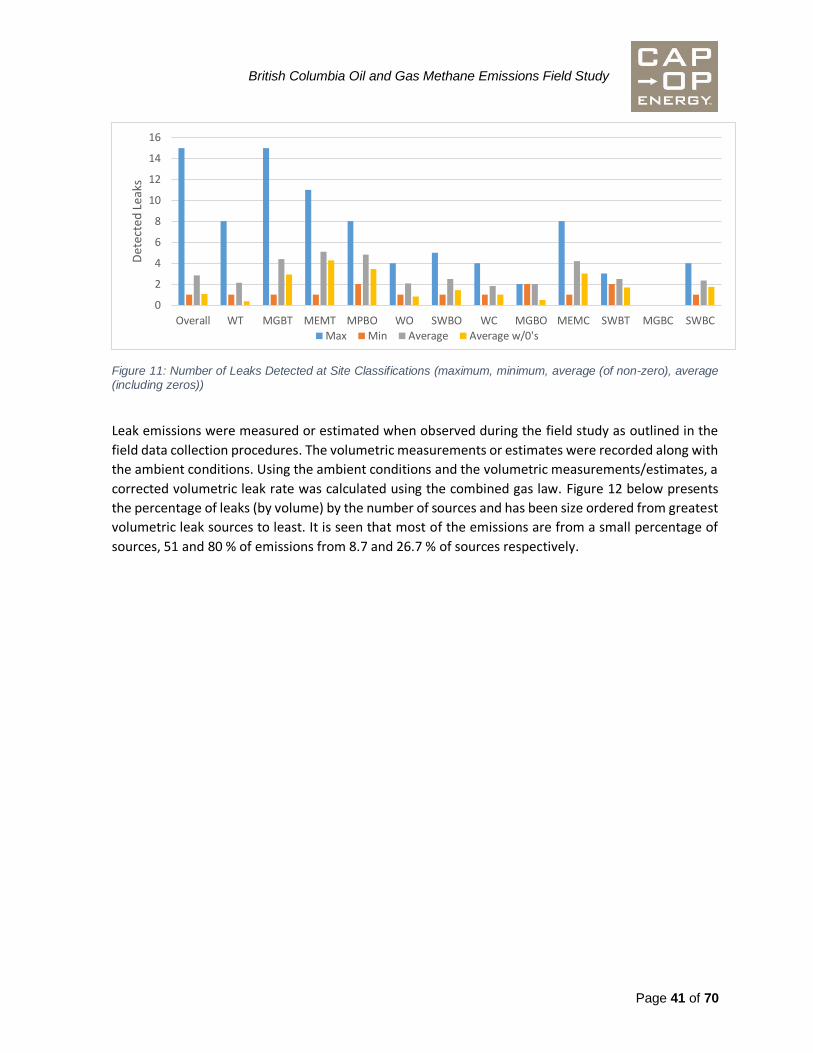
British Columbia Oil and Gas Methane Emissions Field Study
Page 41 of 70
Figure 11: Number of Leaks Detected at Site Classifications (maximum, minimum, average (of non-zero), average (including zeros))
Leak emissions were measured or estimated when observed during the field study as outlined in the
field data collection procedures. The volumetric measurements or estimates were recorded along with
the ambient conditions. Using the ambient conditions and the volumetric measurements/estimates, a
corrected volumetric leak rate was calculated using the combined gas law. Figure 12 below presents
the percentage of leaks (by volume) by the number of sources and has been size ordered from greatest
volumetric leak sources to least. It is seen that most of the emissions are from a small percentage of
sources, 51 and 80 % of emissions from 8.7 and 26.7 % of sources respectively.
0
2
4
6
8
10
12
14
16
Overall WT MGBT MEMT MPBO WO SWBO WC MGBO MEMC SWBT MGBC SWBC
Det
ecte
d L
eaks
Max Min Average Average w/0's
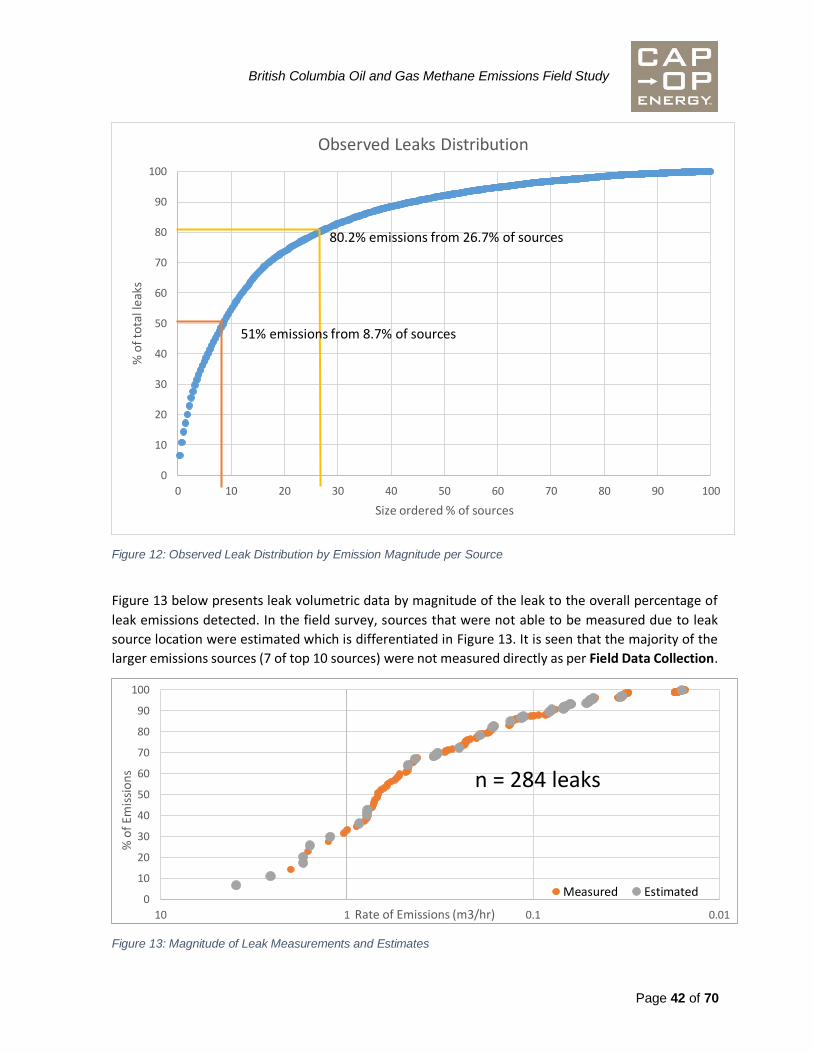
British Columbia Oil and Gas Methane Emissions Field Study
Page 42 of 70
Figure 12: Observed Leak Distribution by Emission Magnitude per Source
Figure 13 below presents leak volumetric data by magnitude of the leak to the overall percentage of
leak emissions detected. In the field survey, sources that were not able to be measured due to leak
source location were estimated which is differentiated in Figure 13. It is seen that the majority of the
larger emissions sources (7 of top 10 sources) were not measured directly as per Field Data Collection.
Figure 13: Magnitude of Leak Measurements and Estimates
0
10
20
30
40
50
60
70
80
90
100
0 10 20 30 40 50 60 70 80 90 100
% o
f to
tal l
eak
s
Size ordered % of sources
Observed Leaks Distribution
51% emissions from 8.7% of sources
80.2% emissions from 26.7% of sources
0
10
20
30
40
50
60
70
80
90
100
0.010.1110
% o
f Em
issi
on
s
Rate of Emissions (m3/hr)
Measured Estimated
n = 284 leaks

British Columbia Oil and Gas Methane Emissions Field Study
Page 43 of 70
Table 20 below presents the number of leaks per component type surveyed. There are two types of gas
and liquid services (Process Gas & Fuel Gas, Light Liquid & Heavy Liquid although Heavy Liquid was not
observed). There were only 4 emissions that were categorized as fuel gas. Therefore, fuel gas and
process gas fugitive emissions were combined as ‘gas’ component service. There was no information
collected which could offer insight into sour and sweet gas fugitives as it was out of the scope of the
study. No leaks were detected for heavy liquid component service, and therefore all liquid service leaks
(only connectors) are in light liquid service.
The leaker factor, total leakage, and average/median leak magnitude are also presented in Table 20.
The median is shown to illustrate that the majority of leaks are smaller than the average, but large leaks
significantly increase the average leak rate which is shown in Figure 12 and Figure 13. Leaker factor is
the ratio of the number of leaks detected over the estimated total amount of the considered
component type. An estimated 38% of thief hatches were leaking, whereas all other component types
are under 6%, with the lowest leaker factor being .007% (liquid connectors). Thief Hatches also have
the highest average, median, and site level leak rates which suggests that Thief Hatches are currently
responsible for a significant portion of overall methane leak emissions (3% of overall leak sources, 17%
of overall leak emissions).
Table 20: Summary of Leak Field Survey and Results
Component
Type
Component
Service
Total
Components
Number of
Leaks
Leaker
Factor
Total
Leakage
(m3/hr)
Avg Leak
rate
(m3/hr)
Median
Leak
(m3/hr)
Connector Gas 96,823 154 0.0016 17.96 0.12 0.05
Connector Liquid 30,259 2 0.00007 0.25 0.12 0.12
Control
Valve Gas 420 18 0.04 5.84 0.32 0.20
Meter Gas 307 6 0.02 1.222 0.20 0.03
Excessive
Pneumatic
Venting Gas 725 42 0.06 14.55 0.35 0.17
PRV/PSV Gas 764 2 0.002 1.20 0.60 0.60
Regulator Gas 2,405 24 0.01 5.34 0.22 0.13
Thief Hatch Gas 21 8 0.38 10.07 1.26 0.62
Valve Gas 14,776 22 0.001 2.24 0.10 0.07
Pump Seal Gas 71 4 0.06 0.43 0.11 0.07

British Columbia Oil and Gas Methane Emissions Field Study
Page 44 of 70
1.2.4.2 Leak Emissions Intensity
Methane emissions from the field survey, other than regular pneumatic operations, are classified as either leaks or vents. The results from
the leaks are summarized below in Table 21 classified by component type and component service. Component service has been summarized
as either gas or liquid (process and fuel gas are combined as gas; only light liquid component service leaks were observed). Table 22
summarizes the leak rate results into five considered components for time series modeling parameters, the mapping to these five components
is displayed in the third column. Table 23 splits the results of Table 22 for each site classification. Confidence intervals were not determined
for Table 23 as sample sizes were too small to confidently determine confidence intervals.
Confidence intervals for leaking components were determined using an empirical bootstrap analysis. This analysis is based on the principle
that as the sample size increases, the histogram of many samples from a population converges to the probability histogram for that
population. Consequently, the confidence interval bands narrow as the sample size increases. In this analysis, we use 10,000 bootstrapped
samples (sampling with replacement) to calculate the 95% confidence interval around the sample mean. The results are presented in the
tables below.
Table 21: Component Leak Rate Results and Component Mapping
Component Type
Component
Service
Modeling
Parameter
Component
Mapping
Total
Components
Number of
Leaks
Total Leakage
(m3/hr)
Avg Leak
rate
(m3/hr)
Median
Leak
(m3/hr)
CI Low (2.5th
percentile)
(m3/hr)
CI High
(97.5th
Percentile)
(m3/hr)
Connector Gas Connector 96,823 154 17.36 0.11 0.05 0.09 0.16
Connector Liquid Connector 30,259 2 0.24 0.12 0.12 0.12 0.13
Control Valve Gas Valve 420 18 5.64 0.31 0.19 0.17 0.57
Meter Gas Connector 307 6 1.18 0.20 0.03 0.04 0.84
Open-Ended
Line* Gas
Excessive
Pneumatic
Venting N/A* 42
14.06 0.33 0.16 0.24 0.49
PRV/PSV Gas PRV/PSV 764 2 1.16 0.58 0.58 0.33 0.82
Regulator Gas Valve 2,405 24 5.16 0.21 0.13 0.06 0.19
Thief Hatch Gas Valve 21 8 9.73 1.22 0.60 0.15 0.33
Valve Gas Valve 14,776 22 2.17 0.10 0.07 0.53 2.35
Pump Seal Gas Connector 71 4 0.41 0.10 0.07 0.06 0.17
*The Open-Ended Line category was exclusively used to characterize excessive or exceptional pneumatic venting, so calculating the number of components is not meaningful

British Columbia Oil and Gas Methane Emissions Field Study
Page 45 of 70
Table 22: Component Leak Rate Results – Mapped
Component
Total
Components
Number of
Leaks
Total
Leakage
(m3/hr)
Avg Leak rate
(m3/hr)
Median
Leak rate
(m3/hr)
CI Low (2.5%,
m3/hr)
CI High
(97.5%, m3/hr)
Connector 127,502 166 18.55 0.12 0.05 0.09 0.15
Valve 23,948 66 12.59 0.19 0.08 0.14 0.28
Excessive Pneumatic
Venting N/A 42 13.59 0.33 0.16 0.23 0.47
PRV/PSV 794 2 1.12 0.56 0.56 0.32 0.80
Thief Hatch 54 8 9.40 1.18 0.58 0.51 2.26
Table 23: Mapped Component Leak Rate Results by Site Classification
Site
Classification Component Type
Total
Components
Number of
Leaks
Total Leakage
(m3/hr)
Avg Leak Rate
(m3/hr)
Median Leak
(m3/hr)
WT
Compressor Seal 14.9 0
Connector 15,899.2 24 1.33 0.06 0.05
Valve 3,459.2 8 0.71 0.10 0.07
Excessive Pneumatic
Venting 177.0 13 5.54 0.43 0.43
PRV/PSV 589.9 0
Thief Hatch 2.7 0
WO
Compressor Seal 0.0 0
Connector 2,945.2 12 0.74 0.06 0.05
Valve 572.1 7 0.92 0.14 0.03
Excessive Pneumatic
Venting 13.0 4 0.46 0.12 0.02
PRV/PSV 115.9 0
Thief Hatch 2.0 2 2.07 1.03 1.03
WC
Compressor Seal 0.0 0
Connector 6,978.8 33 2.50 0.08 0.07
Valve 1,633.8 15 2.65 0.17 0.07
Excessive Pneumatic
Venting 36.0 3 1.16 0.39 0.44
PRV/PSV 290.7 0
Thief Hatch 0.7 0

British Columbia Oil and Gas Methane Emissions Field Study
Page 46 of 70
Site
Classification Component Type
Total
Components
Number of
Leaks
Total Leakage
(m3/hr)
Avg Leak Rate
(m3/hr)
Median Leak
(m3/hr)
SWBT
Compressor Seal 0.0 0
Connector 625.7 1 0.05 0.05 0.05
Valve 78.3 2 1.74 0.87 0.87
Excessive Pneumatic
Venting 8.0 2 0.71 0.35 0.35
PRV/PSV 19.9 0
Thief Hatch 1.3 0
SWBO
Compressor Seal 3.7 0
Connector 2,162.8 3 0.73 0.24 0.13
Valve 359.9 3 0.37 0.13 0.08
Excessive Pneumatic
Venting 20.0 3 0.85 0.28 0.16
PRV/PSV 73.9 0
Thief Hatch 4.0 1 0.32 0.32 0.32
SWBC
Compressor Seal 0.0 0
Connector 1,621.8 1 0.12 0.12 0.12
Valve 303.8 6 0.75 0.13 0.03
Excessive Pneumatic
Venting 4.0 0
PRV/PSV 62.6 0
Thief Hatch 0.7 0
MPBO
Compressor Seal 27.9 0
Connector 12,147.6 7 0.53 0.08 0.05
Valve 1,623.1 7 1.31 0.18 0.03
Excessive Pneumatic
Venting 10.0 4 0.30 0.08 0.06
PRV/PSV 367.3 2 1.16 0.58 0.58
Thief Hatch 15.3 4 3.56 0.89 0.48
MGBT
Compressor Seal 49.1 0
Connector 18,689.3 33 2.83 0.09 0.02
Valve 2,681.9 4 1.93 0.48 0.53
Excessive Pneumatic
Venting 49.0 7 3.42 0.49 0.19
PRV/PSV 539.1 0
Thief Hatch 7.3 0
MGBO
Compressor Seal 0.0 0
Connector 1,518.8 1 0.03 0.03 0.03
Valve 324.4 0

British Columbia Oil and Gas Methane Emissions Field Study
Page 47 of 70
Site
Classification Component Type
Total
Components
Number of
Leaks
Total Leakage
(m3/hr)
Avg Leak Rate
(m3/hr)
Median Leak
(m3/hr) Excessive Pneumatic
Venting 13.0 1 0.69 0.69 0.69
PRV/PSV 64.2 0
Thief Hatch 3.3 0
MGBC
Compressor Seal 0.0 0
Connector 240.8 0
Valve 61.9 0
Excessive Pneumatic
Venting 0.0 0
PRV/PSV 0.0 0
Thief Hatch 0.0 0
MEMT
Compressor Seal 83.3 0
Connector 24,966.2 38 8.34 0.22 0.06
Valve 3,048.4 7 0.69 0.10 0.11
Excessive Pneumatic
Venting 8.0 4 0.65 0.16 0.16
PRV/PSV 792.0 0
Thief Hatch 13.3 1 3.79 3.79 3.79
MEMC
Compressor Seal 36.1 0
Connector 9,333.8 13 1.94 0.14 0.06
Valve 1,003.1 7 1.93 0.28 0.24
Excessive Pneumatic
Venting 7.0 1 0.10 0.10 0.10
PRV/PSV 245.8 0
Thief Hatch 3.3 0

British Columbia Methane Emissions Field Study
Page 48 of 70
1.2.4.3 Dehydrator Leaks
18 leaks from glycol dehydration systems were observed during the survey (and one vent, see Section
1.2.5.4). The composition of glycol dehydrator gas release is unknown and may include increased
concentrations of non-methane gas. Dehydrator leaks originated from two component types, connectors
and valves (8 valve, 10 connector sources) and are summarized in Table 24.
Table 24: Dehydrator Leaking Summary m3/hour Total Equipment Count Number of Leaks Total Leak Rate Average leak Rate Average Leak rate for total population
Dehydrator - Glycol 29 18 2.854 0.159 0.098
1.2.5 Vents
Venting emissions, along with leaks, were measured or estimated during the field survey. 101 vents were
measured/estimated during the survey and originate from 4 component types (Open-Ended Line Gas +
Liquid service, Thief Hatch, and Compressor Seals), compared to the 10 component types logged for leaks.
1.2.5.1 Vent Distribution
Figure 14 below presents the number of sites with how many vents were detected and
measured/estimated excluding normal pneumatic venting. The vast majority of sites (186 of 266 sites
visited) had no vents detected excluding pneumatics, with 67 sites having a single vent detected and the
remaining having 2-5 vents per site.
Figure 14: Number of Sites with Number of Detected Vents
Figure 15 below presents the maximum, minimum, average, and average with no detected vent sites
included. The overall results are similar to those in Figure 11 for Leaks. It is seen that compared to leaks,
most site types had fewer vents across the board, with the maximum vents at a single site being 5.
0
20
40
60
80
100
120
140
160
180
200
0 1 2 3 4 5
# o
f Si
tes
# of Vents

British Columbia Methane Emissions Field Study
Page 49 of 70
Figure 15: Number of Observed Vents
The source of vents is summarized by major equipment in Figure 16. Four major equipment types (Light
Liquid and Water Production Tanks, Reciprocating Compressor, and Gas Flow Wellheads (Surface Casing
Vents)) are responsible for ~94% of overall venting emissions with Tanks being the largest major
equipment emitter (at 65% of total venting emissions, 25% of which were from Water Production Tanks).
All other major equipment that perform regular venting that were captured during the survey did not
contribute significantly to overall venting emissions. What is not reflected in this data are operations that
release methane episodically unless an episodic release was occurring during the survey. Episodic
methane venting emissions by nature are not continuous, and difficult to measure and quantify through
surveys such as the one performed in this study as they are snapshots at a point in time, not continuous
monitoring.
0
1
2
3
4
5
6
Overall WT MGBT MEMT MPBO WO SWBO WC MGBO MEMC SWBT MGBC SWBC
Nu
mb
er o
f V
ents
Max Min Average Average w/0's

British Columbia Methane Emissions Field Study
Page 50 of 70
Figure 16: Venting Emissions by Major Equipment Source
1.2.5.2 Tank Venting
Tanks were one of the largest individual sources of emissions that were detected during the MEFS field
survey, with a total of 12 vents and 12 leaks detected. 6 of these vents, from Light Liquid Tanks, accounted
for nearly 48% of the total observed vented emissions across all sites, and the other 6 vents were observed
from Produced Water Tanks. Venting from Produced Water Tanks was confirmed to be hydrocarbon and
not steam, but gas compositions were not assessed during the study. CAPP (2005)30 suggests negligible
hydrocarbon emissions from Produced Water Tanks so further study may be required to determine or
update gas composition from these sources. The summary of the tank venting and leaking is summarized
in Table 25 and Table 26 below. The observed tank vents are uncontrolled and the observed tank fugitives
30 A National Inventory of Greenhouse Gas (GHG), Criteria Air Contaminant (CAC) and Hydrogen Sulphide (H2S) Emissions by the Upstream Oil and Gas Industry, Volume 3 Methodology for Greenhouse Gases, CAPP, 2005 (Available at https://www.capp.ca/publications-and-statistics/publications/86223)
47.83%
19.44%
17.52%
9.14%
1.82%
1.27% 1.26% 0.46% 0.38% 0.32%0.30%
0.25%
Production Tank Fixed Roof - Light Liquid Reciprocating Compressor Production Tank - Water
Wellhead (Gas Flow) Separator Dehydrator - Glycol
Flare KnockOut Drum Wellhead (Oil Flow) Wellhead (Oil Pump)
Gas Sample and Analysis System Reciprocating Compressor - Electric Driver Meter Building
Total Emissions: 62.7 m3/hr
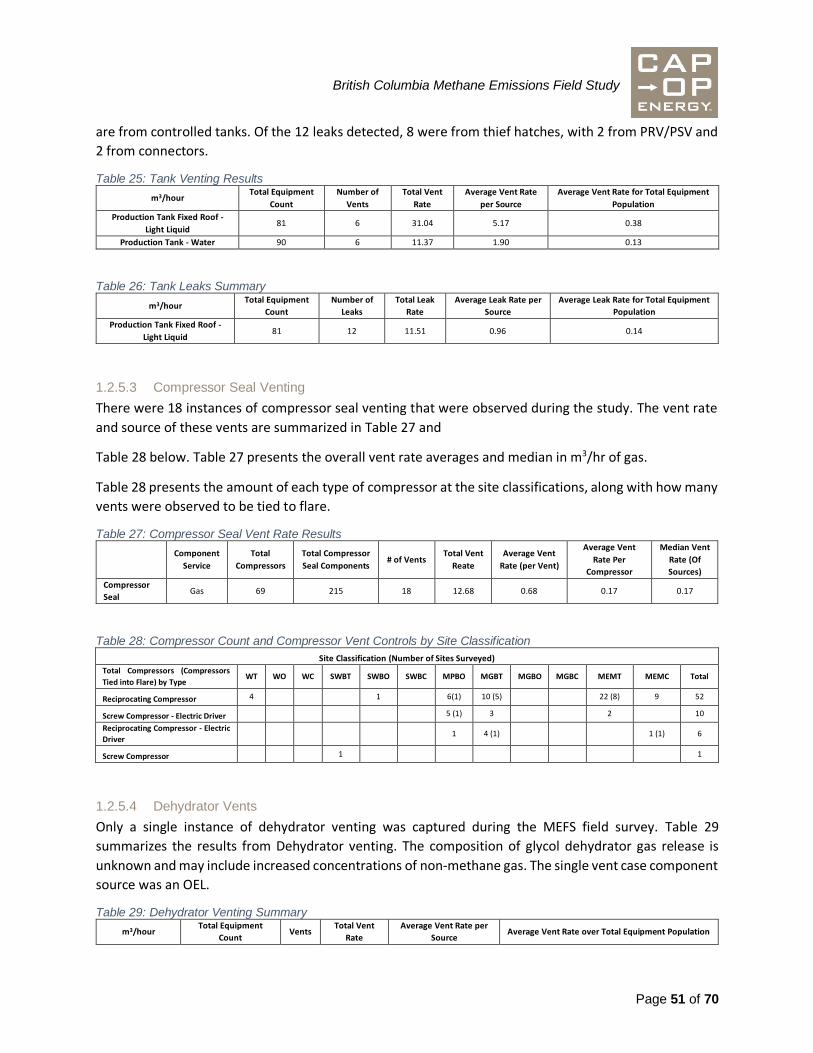
British Columbia Methane Emissions Field Study
Page 51 of 70
are from controlled tanks. Of the 12 leaks detected, 8 were from thief hatches, with 2 from PRV/PSV and
2 from connectors.
Table 25: Tank Venting Results
m3/hour Total Equipment
Count
Number of
Vents
Total Vent
Rate
Average Vent Rate
per Source
Average Vent Rate for Total Equipment
Population
Production Tank Fixed Roof -
Light Liquid 81 6 31.04 5.17 0.38
Production Tank - Water 90 6 11.37 1.90 0.13
Table 26: Tank Leaks Summary
m3/hour Total Equipment
Count
Number of
Leaks
Total Leak
Rate
Average Leak Rate per
Source
Average Leak Rate for Total Equipment
Population
Production Tank Fixed Roof -
Light Liquid 81 12 11.51 0.96 0.14
1.2.5.3 Compressor Seal Venting
There were 18 instances of compressor seal venting that were observed during the study. The vent rate
and source of these vents are summarized in Table 27 and
Table 28 below. Table 27 presents the overall vent rate averages and median in m3/hr of gas.
Table 28 presents the amount of each type of compressor at the site classifications, along with how many
vents were observed to be tied to flare.
Table 27: Compressor Seal Vent Rate Results
Component
Service
Total
Compressors
Total Compressor
Seal Components # of Vents
Total Vent
Reate
Average Vent
Rate (per Vent)
Average Vent
Rate Per
Compressor
Median Vent
Rate (Of
Sources)
Compressor
Seal Gas 69 215 18 12.68 0.68 0.17 0.17
Table 28: Compressor Count and Compressor Vent Controls by Site Classification
Site Classification (Number of Sites Surveyed)
Total Compressors (Compressors
Tied into Flare) by Type WT WO WC SWBT SWBO SWBC MPBO MGBT MGBO MGBC MEMT MEMC Total
Reciprocating Compressor 4 1 6(1) 10 (5) 22 (8) 9 52
Screw Compressor - Electric Driver 5 (1) 3 2 10
Reciprocating Compressor - Electric
Driver 1 4 (1) 1 (1) 6
Screw Compressor 1 1
1.2.5.4 Dehydrator Vents
Only a single instance of dehydrator venting was captured during the MEFS field survey. Table 29
summarizes the results from Dehydrator venting. The composition of glycol dehydrator gas release is
unknown and may include increased concentrations of non-methane gas. The single vent case component
source was an OEL.
Table 29: Dehydrator Venting Summary
m3/hour Total Equipment
Count Vents
Total Vent
Rate
Average Vent Rate per
Source Average Vent Rate over Total Equipment Population

British Columbia Methane Emissions Field Study
Page 52 of 70
Dehydrator -
Glycol 29 1 0.825 0.825 0.028
1.3 Chapter 1 Summary Upstream oil and gas wells and batteries in BC share certain characteristics with other jurisdictions,
including the most common methane emission sources in pneumatic control instruments, chemical
injection pumps, tanks and compressors. As has been found elsewhere, the distribution of methane
emissions among BC operations is highly skewed, with small numbers of sources contributing a large
proportion of total emissions and wide confidence intervals on average values.
For a variety of potential reasons, BC operations also exhibit particular unique characteristics including a
significant population of non-emitting process control and chemical injection equipment. Routine venting
does not appear to occur at most wells and batteries in BC.
2 Chapter 2: Comparison to Contemporary Studies Comparing emissions across components and equipment between different studies is difficult for two
main reasons. First, survey practices and operators use different definitions and categorization of
components that are not standardized across studies. Second, source detection technologies exhibit
significant performance variations based on weather conditions and operator expertise. Studies done with
the same technology but under varying seasonal weather will exhibit different leak-size distributions.
Due to methodological similarities a comparison to Clearstone 2018 is more adjacent than some other
studies. Total natural gas released from all sources in that study comprised 33% pneumatics, 28% from
production tanks, 20% from equipment fugitives, and 16% from heavy oil well casing vents in Alberta. This
compares with the results of this study corresponding to 66% from pneumatics, 15% from production
tanks,31 and 17% from other equipment fugitives. Note: the remaining emissions were from other sources
(e.g. non-tank venting).
2.1.1 Estimated Pneumatic Venting Emissions
Figure 17 shows the device-level emissions in this study (red) compared to the Greenpath 201632 study
(blue). While most vented emissions are similar, two components stand out – the pressure controller
where BC has almost double the emissions of AB, and pump-related emissions where BC has 40% lower
emissions than AB. In addition, many pneumatic device types in AB were assumed to emit “significantly
lower” than 0.17 m3/hr, while the BC data implies that these small sources can have non-trivial emissions
(e.g., plunger lift controllers).
31 15% comprises 9% venting from light liquids tanks, 3% venting from produced water tanks, and 3% tank fugitives. 32 Greenpath 2016 Alberta Fugitive and Vented Emissions Inventory Study, Greenpath Energy, 2016 (Available at https://www.aer.ca/documents/GreenPathAER%20Survey-Methane.pdf)

British Columbia Methane Emissions Field Study
Page 53 of 70
Figure 17: Comparison of vented emissions between this study (red) and Greenpath 2016 study in AB (blue).
2.1.2 Fugitive Emissions
Leaks or fugitive emissions exhibit varied behavior. Across all component types analyzed, BC emissions
are uniformly lower than AB emissions. However, it should be noted that fugitive emissions that were
unable to be measured directly were estimated, which can lead to significant discrepancies in total
emissions measurements. This is mitigated to the extent possible by the fact that the same contractor
(Greenpath Energy) conducted both surveys and employed the same estimation methodology.
Furthermore, the error bars for each component-level emissions source is large (2 – 3x the measured
emissions) because of two reasons – (a) the sample size is typically small, and (b) total emissions are
dominated by a few very large emitters, resulting in a larger upper bound on the estimates.
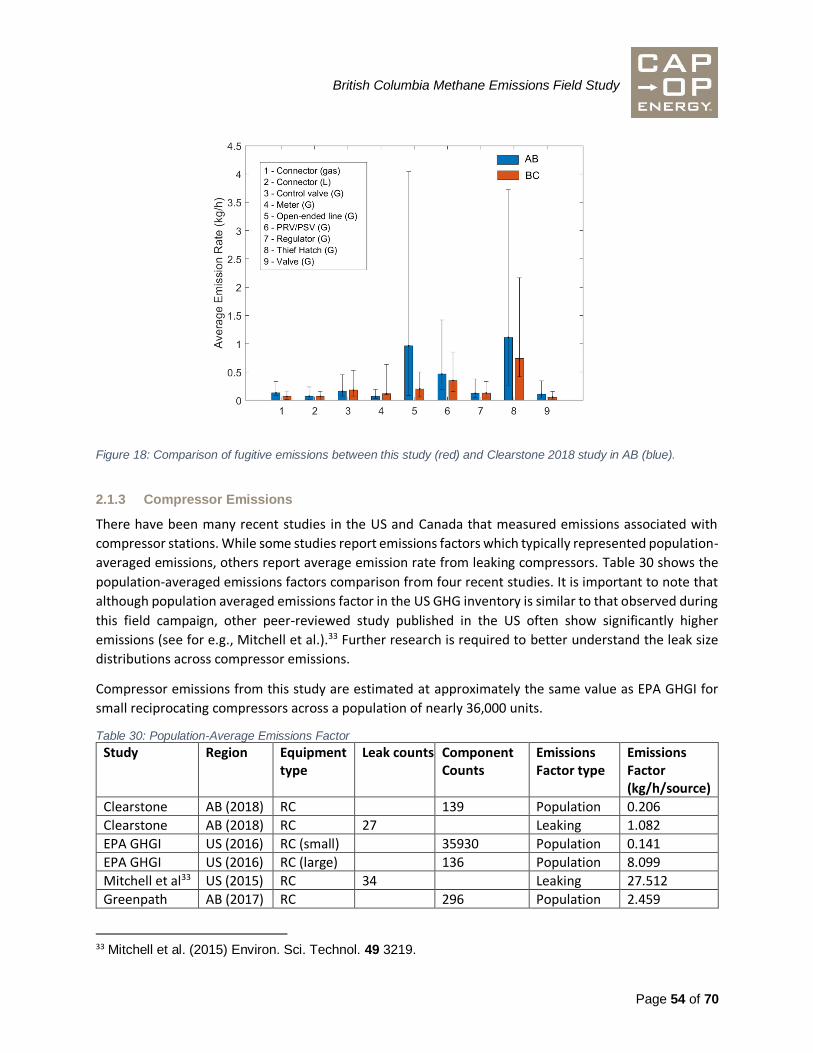
British Columbia Methane Emissions Field Study
Page 54 of 70
Figure 18: Comparison of fugitive emissions between this study (red) and Clearstone 2018 study in AB (blue).
2.1.3 Compressor Emissions
There have been many recent studies in the US and Canada that measured emissions associated with
compressor stations. While some studies report emissions factors which typically represented population-
averaged emissions, others report average emission rate from leaking compressors. Table 30 shows the
population-averaged emissions factors comparison from four recent studies. It is important to note that
although population averaged emissions factor in the US GHG inventory is similar to that observed during
this field campaign, other peer-reviewed study published in the US often show significantly higher
emissions (see for e.g., Mitchell et al.).33 Further research is required to better understand the leak size
distributions across compressor emissions.
Compressor emissions from this study are estimated at approximately the same value as EPA GHGI for
small reciprocating compressors across a population of nearly 36,000 units.
Table 30: Population-Average Emissions Factor
Study Region Equipment type
Leak counts Component Counts
Emissions Factor type
Emissions Factor (kg/h/source)
Clearstone AB (2018) RC 139 Population 0.206
Clearstone AB (2018) RC 27 Leaking 1.082
EPA GHGI US (2016) RC (small) 35930 Population 0.141
EPA GHGI US (2016) RC (large) 136 Population 8.099
Mitchell et al33 US (2015) RC 34 Leaking 27.512
Greenpath AB (2017) RC 296 Population 2.459
33 Mitchell et al. (2015) Environ. Sci. Technol. 49 3219.

British Columbia Methane Emissions Field Study
Page 55 of 70
BC MEFS BC (2019) RC34 69 Population 0.14
BC MEFS BC (2019) RC34 18 Leaking 0.40 *RC = Reciprocating Compressors (rod packing)
2.1.4 Pneumatic Demographics
Figure 19 below presents a comparison of the split between pneumatic device types between the
Greenpath study performed in 2016 in Alberta and this survey in BC but excludes the BC pumps count. It
is interesting to note that the ratios of each pneumatic device type are different in BC and AB, for example,
there are more level controllers in the overall pneumatic device population compared to BC. In the BC
study, pneumatic device types in Figure 19 excludes pressure switches (10%), level switches (4.6%), and
other unidentified pneumatics (0.7%) as those were not included in Greenpath’s 2016 pneumatics
classification.
Figure 19: Pneumatic Device Type Ratio Comparison Between Alberta Greenpath Study and BC MEFS
2.2 Chapter 2 Summary Direct comparison across studies with differing methodologies, timeframes, field teams, and other
elements is often difficult. Due to methodological similarities a comparison to Clearstone 2018 is more
adjacent than some other studies.
Relative to that study, pneumatic venting was estimated to represent a higher proportion of total venting
in BC, despite the prevalence of non-emitting equipment, partly as a result of methodological differences
(certain types of gas-driven pneumatic control instruments were assigned vent rates of zero in Clearstone
2018), and partly as a result of some a small number of extremely large emissions from surface casing
vent flows and thief hatches. Overall the studies generally agree on the dominant emission sources in
upstream oil and gas, with important differences.
34 Size of compressors was not recorded, assumed to be biased towards smaller equipment since none of the sites surveyed were registered as compressor stations. Note average methane concentration assumed to be 86%.
0%
10%
20%
30%
40%
50%
Level Control PressureControl
High LevelShutdown
High PressureShutdown
Transducer Plunger LiftControl
Positioner TemperatureControl
Per
cen
tage
of
tota
l Pn
eum
atic
D
evic
es (%
)
Alberta, Greenpath (2016) British Columbia (Excluding Pumps)

British Columbia Methane Emissions Field Study
Page 56 of 70
Fugitive emissions are inherently difficult to compare due to large confidence intervals in most datasets,
but again generally agrees across many component types.
Compressor emissions from this study were estimated at approximately the same value as EPA GHGI for
small reciprocating compressors across a population of nearly 36,000 units.
3 Chapter 3: Fugitive and Episodic Emissions Management Practices
In Chapter 1, modeling parameters that could be determined from the field survey data were developed.
Supplementing snapshot field observations with historical records was included in the study design in
order to support the development and refinement of policy/scenario modeling parameters. Temporal
variation and impacts to emission sources over time should be accounted for when parameters are
developed. The modeling parameters for certain emission sources can have an explicit temporal
component that considers emissions variation over time (e.g. months/years), which would not be
observed by the snapshot exercise of field observation.
To obtain these data on longer term variations a voluntary Corporate Data Request (CDR) was prepared
for the participating companies to provide historical fugitive emission management data, as well as other
types of methane emission information that was not possible to observe while on-site. The data that were
received included information on fugitive repair times, fugitive history, and other sources of methane
emissions (including information on episodic emissions and emission control systems). This information
supplemented the field observations, where applicable, in order to account for temporal variations in
modeling parameter development.
The analytical approach largely follows the description in Section 1.1 Analytical Approach, in addition to
the descriptions provided herein.
3.1 Leak Repair Times A total of 11 CDR responses were received which covered 51 of the 266 locations surveyed in this study’s
survey. A histogram of repair times for leaks is presented in Figure 20. Not all facilities from the CDR
included repair times, 12 sites, which represented repair intervals from a total of 36 repairs. The most
common timeframe to perform a repair is within 16 days, with the average repair time of the reported
facilities at 45 days. The data provided, while it offers insight into timeframe to perform repairs, may not
be representative of broader industry practices due to a small sample size and limited information
contextualizing the types of repairs required.

British Columbia Methane Emissions Field Study
Page 57 of 70
Figure 20: Histogram of Reported Repair Times from CDR
3.2 Leak Occurrence Rate The leak occurrence rate was calculated based on the facilities that reported a ‘last Fugitive Survey’ in the
CDR. The following equation was used to calculate the leak occurrence rate;
(𝐿𝑀𝐸𝐹𝑆 − 𝐿𝐿𝐿)
𝑀𝑀𝐸𝐹𝑆−𝐿𝐿
Where,
LMEFS = Number of leaks detected during the MEFS field survey
LLL = Number of leaks detected and not repaired during the previous LDAR survey
MMEFS-LL = Months between the MEFS field survey and the previous LDAR survey
The results of the leak occurrence rate by facility is presented in Table 31 below. All leaker factors labelled
as ‘Negative’ in Table 31 have a negative leaker factor because the non-repaired leaks from the previous
LDAR survey is more than the number of leaks detected during the MEFS field survey. This likely reflects
a limitation of the repair information provided. There are 4 instances where the leaker factor is not
calculated, and the cell has been left blank. These 4 facilities either performed their “previous” LDAR
survey after the MEFS field survey or reported the MEFS field survey as their last LDAR survey.

British Columbia Methane Emissions Field Study
Page 58 of 70
Table 31: Leak Occurrence Rate based on CDR Reported Facilities
Anonymous
Identifier
Facility
Type
Leaks from
BC MEFS
Study
Leaks Detected
from CDR
Responses
Leaks Repaired
from CDR
Responses
Leaks Not
Repaired from
CDR Responses
Months between
Last LDAR and BC
CAS Survey
Leaker Factor
(leaks/month)
188 MPBO 0 0 0 0 2 Negative35
252 MPBO 7 2 0 2 23 0.22
55 MEMC 8 7 0 7 0
125 WC 2 0 0 0 24 0.08
25 WC 3 0 0 0 23.5 0.13
17 MPBO 3 2 0 2 0.5 2.00
192 MEMT 3 1 0 1 21 0.10
111 MEMC 7 3 0 3 19 0.21
44 MEMT 11 17 0 17 9.5 Negative
72 WC 1 4 0 4 20 Negative
169 WC 0 0 0 0 23.5 Negative
102 MEMC 0 1 0 1 1 Negative
107 MEMT 2 4 4 0 17 0.12
152 MEMT 4 4 3 1 0
14 MEMT 5 4 4 0 7 0.71
15 MEMT 11 7 0 7 1 4.00
69 MEMT 6 4 0 4 13 0.15
143 MGBT 1 2 2 0 9 0.11
145 MGBT 1 2 2 0 18 0.06
245 MEMT 1 4 0 4 23 Negative
71 MEMT 3 1 0 1 1 2.000
162 MGBT 2 4 3 1 0
253 WC 0 0 0 0 25 Negative
80 WC 4 0 0 0 24 0.17
167 WC 2 0 0 0 26 0.08
86 WC 2 0 0 0 26 0.08
172 WC 3 1 0 1 24 0.08
88 WC 1 1 0 1 23 Negative
33 MGBO 0 7 7 0 7 Negative
224 MGBT 2 3 2 1 5 0.20
165 SWBO 2 7 4 3 7 Negative
178 MGBT 4 3 3 0 2 2.00
133 WT 0 6 1 5 21 Negative
186 WT 1 5 5 0 7 0.14
225 WC 0 0 0 0 25 Negative
45 WT 1 1 1 0 7 0.14
6 MGBC 0 1 0 1 22 Negative
42 SWBT 0 0 0 0 23.5 Negative
240 WT 0 1 1 0 17 Negative
103 WT 3 0 0 0 23 0.13
249 WT 0 2 2 0 7 Negative
223 WT 0 9 7 2 5 Negative
190 WT 0 1 0 1 18 Negative
251 WT 3 3 3 0 0
Generally, component-specific detail was not provided but if we assume that all leaks from the previous
LDAR survey to the MEFS survey are repaired, it is possible to calculate a leak occurrence rate based on
35 Indicates likely repair data gap – number of unrepaired leaks from prior survey higher than observed number of leaks in subsequent (MEFS) survey

British Columbia Methane Emissions Field Study
Page 59 of 70
the equation below by component type, as those data are available from the MEFS survey.36 A leak
occurrence rate for PRV/PSV’s was not able to be calculated as no leaks were detected during the MEFS
field survey at the 51 facilities that provided CDR responses.
Equation 4,
𝐿𝑒𝑎𝑘 𝑂𝑐𝑐𝑢𝑟𝑒𝑛𝑐𝑒 𝑅𝑎𝑡𝑒𝑏𝑦 𝑐𝑜𝑚𝑝𝑜𝑛𝑒𝑛𝑡 𝑡𝑦𝑝𝑒 = ∑ (𝐶𝑙𝑖 − 𝐶𝑙𝑖,𝑡−1)/𝑀𝑖
𝑁𝑖=1
∑ 𝐶𝑡𝑖𝑁𝑖=1
Where, 𝐶𝑙𝑖 = are the number of leaking components by type detected from the ith facility inspection, 𝐶𝑙𝑖,𝑡−1 = are the number leaks detected but not repaired from the inspection previous to the ith
facility inspection. Note: (𝐶𝑙𝑖 − 𝐶𝑙𝑖,𝑡−1)>=0,
𝑀𝑖 = is the number of months since the last inspection from the ith facility, 𝐶𝑡𝑖 = is the total number of components by type at the ith facility, and
N = is the total number of facilities for which field study data is available. The leak occurrence factors by each component type are presented in Table 32 below. The calculation assumes that Cli,t-1 is equal to 0 (all previously detected repairs were repaired) to be able to calculate a leak occurrence rate with the available responses. The sample size is also provided for context. Table 32: Leak Occurrence Rate by Component Type*
Thief
Hatch PRV/PSV Valve Connector
Excessive Pneumatic Venting
(Previously OELs)
Leaker Factor (Leaks/Month) 0.0115 0 0.0013 0.0004 0.0064
Sample Size (# of leaks used for
calculation) 4 0 16 67 5
*These results assume that all leaks from the previous LDAR survey to the MEFS survey are repaired and that all detected leaks during the MEFS survey are new.
3.3 Other Sources and Controls In Cap-Op’s 2017 report Other Sources of Methane Emissions in the Oil and Gas Sector a number of less
significant methane sources were identified.37 The CDR included information on these, including episodic
emissions such as depressure events and compressor gas starts, as well as information regarding emission
control systems associated with these events. Very few responses provided information so these data are
summarized at a very high level as follows:
• More compressor gas start systems were controlled than not o Control via tie-in to flare, air-start (instrument air) or electric drive
• Wide variability in number of compressor starts per year
• More dehydrators were controlled than not o Control via flare, vapor recovery unit
36 This assumption is supported by the company reported information as it typically reported the same number of leaks detected as leaks repaired, when information was available, however these data represent a very small subset of the study sites. 37 Other Sources of Methane Emissions in the Oil and Gas Sector, Cap-Op Energy, 2017. Available by request from ECCC or Cap-Op Energy.

British Columbia Methane Emissions Field Study
Page 60 of 70
• More depressure events were controlled than not o Control via flare
• Average reported volume per depressure event was less than 10 m3/event
3.4 Chapter 3 Summary Obtaining highly specific historical data on fugitive and episodic emissions is influenced by a number of
factors including a wide variety of emission management practices and reporting systems. By matching
voluntarily provided corporate historical data with field observations a high-level characterization of the
performance of fugitive emissions management at specific sites can be understood over time.
Understanding episodic emissions and the different ways they are being managed by companies provides
an additional layer of context for time-series modeling.
4 Chapter 4: Long Term Methane Emission Drivers Note: All results are based on discussions from the workshop participants as Cap-Op and DXD intentionally
assumed an objective, observational role in the working discussions. Cap-Op and DXD input to the sessions
was limited to clarification, facilitation and guidance.
4.1 Temporal State Definition 4.1.1 Distant Past
The distant past temporal state was defined as pre-2009 and, importantly, this was effectively prior to the
current level of greenhouse gas reporting in British Columbia. Participants broadly viewed this period as
the “single well pad era” and agreed that production in British Columbia was dominated by single-well oil
and gas production. While some groups accounted for production in the 1980s and 1990s, others provided
their experience from the 2000s. Less pipeline infrastructure was in place and conventional production
(without hydraulic fracturing) was most common. This period was also characterized by appraisal and
exploration of the natural fields in British Columbia (especially the Horn and Montney basins). While
individual companies may have piloted certain methane abatement technologies and CAPP Best
Management Practice for Fugitive Emissions Management (CAPP BMP)38 was beginning to be used
(around 2007), focused attention to methane management across industry was limited. Sour gas
management and facilities design, not methane emissions awareness, drove conservation behaviour that
may have otherwise been absent in sweet gas regions. Production was driven by economics and basic
compliance with the regulations of the day. This was noted in slight contrast to current conditions, where
more comprehensive consideration is also given to regulations, emissions, climate change and social
factors that may have a future impact on operations. Participants agreed that the regulatory environment
was very different than the one observed in today’s production. Dry gas, not wet gas, was the dominant
product and, relative to today, more field compression and less processing occurred. It was also noted
that some drivers may have counter-balanced influence, for example the prevalence of single-well pads
would drive up equipment to facilities ratios but lower numbers of processing facilities and gas plants in
the field would drive ratios down.
38 Best Management Practice for Fugitive Emissions Management, CAPP, 2007. Available at https://www.capp.ca/publications-and-statistics/publications/116116
British Columbia Methane Emissions Field Study
Page 61 of 70
4.1.2 Recent Past
The recent past temporal state was defined as the period from 2010 to 2015. This period was marked by
a shift from dry gas to liquids rich gas and the development of the Montney. Horizontal drilling technology
had significantly improved, and very little conventional drilling was occurring. This period, referred to as
the “multi well pad era,” also saw dramatic increases in the use of multi-well pads, driving down
equipment to facility ratios. Pipeline infrastructure increased to meet development needs and Producers
began to pilot programs and design infrastructure to drive efficiencies. In contrast to the distant past, this
period saw that factors beyond economics had to be given consideration. Social issues, movements
against hydraulic fracturing, environmental activism and climate change began to impact the industry.
Leak Detection and Repair (LDAR) had been implemented at some large facilities and some producers had
implemented full LDAR programs across their fleets, in part driven by CAPP BMP and other publications.
This period was also volatile economically. By 2010/2011, the industry had begun to recover from the
global economic crash in the late 2000s and by 2012, the industry in BC was seeing an increase in
exploration and drilling. However, 2014 saw another economic downtown in the oil and gas industry of
Western Canada that impacted BC producers. Opportunities surrounding coastal liquefied natural gas
(LNG) facilities grew and contracted with the market; several proposed LNG projects extended into the
current and future time periods.
4.1.3 Future
The future temporal state was defined as a post-methane regulation implementation scenario, between
2020 and 2030, where all producers would be operating to achieve compliance with applicable
regulations, and that equivalency of provincial programs has been completed and approved. LNG and the
potential growth of the industry associated with it dominates this period. In addition to being a driver for
new assets, LNG development could bring legacy assets back online. Producers will continue to maximize
the efficiency of multi-well pad design, further decoupling production and footprint. Liquids rich
production and horizontal drilling practices are expected to continue, with even better horizontal drilling
technology coming online. There is the potential that the Clean Fuel Standard (CFS) may drive the
stabilization of domestic demand and the price of natural gas. As producers consistently show proactive
compliance with the regulations, the focused interest that Non-Governmental Organizations (NGOs) and
governments currently have on methane emissions from oil and gas operations may begin to ease.
Additionally, as producers and regulators see full implementation of the regulations, year over year, there
is the potential that LDAR requirements may decrease, as more data is available to inform efficient yet
effective emissions reductions.
4.2 Assessment of Drivers Results of the workshop were assessed for each modeling driver. Each group’s assessment was plotted
over time, showing their interpretation of the directionality and magnitude of change of these drivers for
each temporal period.
Issues that make temporal forecasting difficult include acquisitions/sales, as well as change in ownership
and working interest partners. In addition to making factors like equipment counts and prevalence of low
bleed pneumatics (in other words, physical factors), changes in ownership also generally result in “legacy

British Columbia Methane Emissions Field Study
Page 62 of 70
staff” no longer being associated with sites and facilities. For example, while field assets may be acquired,
it is not always the case that the operators working on those sites go with the sale.
4.2.1 Equipment to Facility Ratios
Participants identified multiple factors that impact equipment to facility ratios:
• Level of gas processing required, related to dry gas vs. wet gas;
• Prevalence of gas plant facilities;
• Trend from single-well pads in the past to multi-well pads (i.e., concentration of equipment and/or prevalence of larger pad-level equipment);
• Amount of compression occurring in the field; and
• Fundamentally different equipment for different products (sweet or sour; dry gas or wet gas).
Distant Past: some characteristics of pre-2009 operations would translate to more distinct pieces of
equipment, and some would translate to fewer. In general, the consensus was that the dominance of
single-well pads meant more equipment in the field, per well pad.
Recent Past: this period saw a concentration of equipment on smaller footprints with the shift to multi-
well pads and industry participants generally felt that equipment to facility ratios were lower than the
pre-2009 period. However, in general, equipment to facility ratios were higher relative to current
operations with a shift to wet gas from dry gas, as field processing facilities became more prevalent.
Future: future operations will continue to see a trend towards centralized facilities, which will result in
more and larger equipment per facility, but fewer facilities. If growth is seen due to LNG, absolute amounts
of equipment in the field will increase. Electrification (dual feed) will require more processing and
abatement equipment. Increased processing and fractionation will result in increased equipment, as more
oil and water are handled. On a per-well basis, amount of equipment will decrease; however, more
intense processing will result in larger equipment and likely higher equipment ratios.
Workshop consensus on directionality and magnitude of change in the future: ↑(1)
3
1
0
1
PRE-2009 2010-2015 TODAY 2020-2030
Particpant Group 1
3
10
-1PRE-2009 2010-2015 TODAY 2020-2030
Participant Group 2
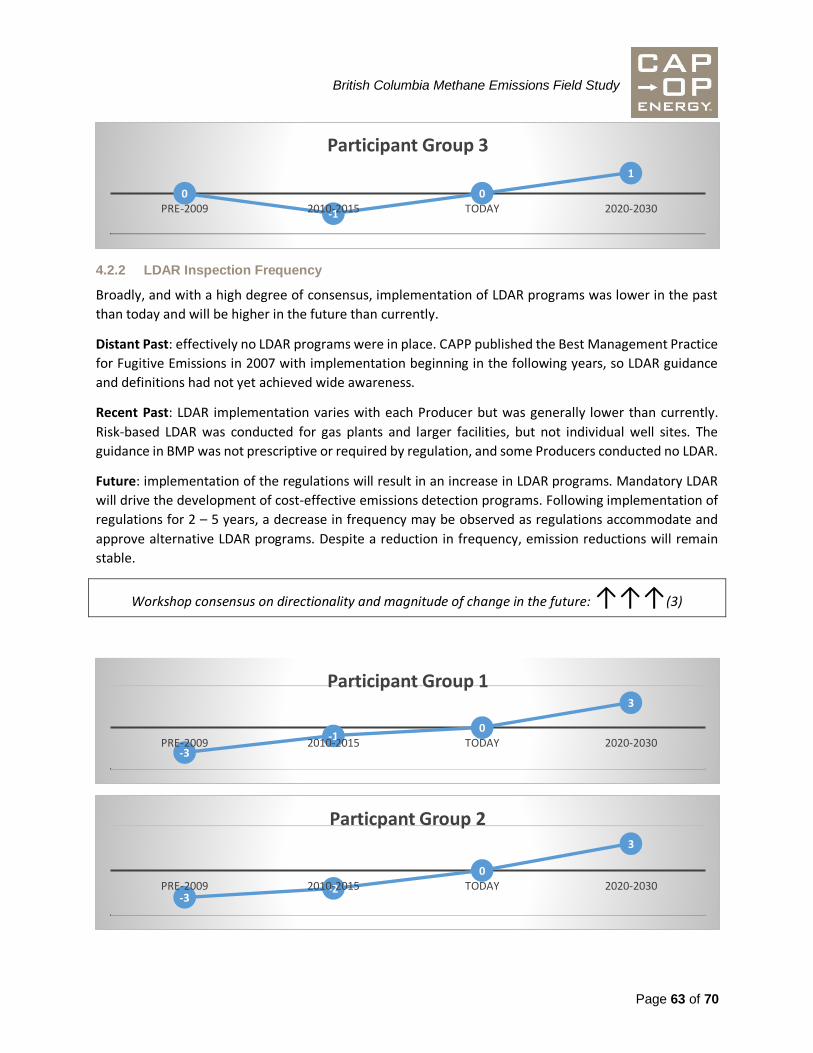
British Columbia Methane Emissions Field Study
Page 63 of 70
4.2.2 LDAR Inspection Frequency
Broadly, and with a high degree of consensus, implementation of LDAR programs was lower in the past
than today and will be higher in the future than currently.
Distant Past: effectively no LDAR programs were in place. CAPP published the Best Management Practice
for Fugitive Emissions in 2007 with implementation beginning in the following years, so LDAR guidance
and definitions had not yet achieved wide awareness.
Recent Past: LDAR implementation varies with each Producer but was generally lower than currently.
Risk-based LDAR was conducted for gas plants and larger facilities, but not individual well sites. The
guidance in BMP was not prescriptive or required by regulation, and some Producers conducted no LDAR.
Future: implementation of the regulations will result in an increase in LDAR programs. Mandatory LDAR
will drive the development of cost-effective emissions detection programs. Following implementation of
regulations for 2 – 5 years, a decrease in frequency may be observed as regulations accommodate and
approve alternative LDAR programs. Despite a reduction in frequency, emission reductions will remain
stable.
Workshop consensus on directionality and magnitude of change in the future: ↑↑↑(3)
0
-1
0
1
PRE-2009 2010-2015 TODAY 2020-2030
Participant Group 3
-3
-10
3
PRE-2009 2010-2015 TODAY 2020-2030
Participant Group 1
-3-2
0
3
PRE-2009 2010-2015 TODAY 2020-2030
Particpant Group 2

British Columbia Methane Emissions Field Study
Page 64 of 70
4.2.3 Prevalence of High Bleed Pneumatics
The prevalence of high bleed pneumatics was much higher in the distant past relative to current
operations, and Participants were aligned on this model driver.
Distant Past: far more high bleed pneumatics were in operation than current practices, as they were cost
effective and no regulation in place to limit their use. In a number of applications, low-bleed pneumatics
were not commercially available. However, some participants noted that in the past, more sour gas was
being produced, and, due to safety concerns, sour production is often no-bleed; this consideration shifted
one group’s rating from a magnitude of 3 to 2.
Recent Past: use of high bleed pneumatics in recent years had decreased as new builds began to include
low bleed pneumatics and energy efficient programs/pilots were implemented. Retro-fits were not yet
common. One market-dominant supplier of control instruments began manufacturing high-quality low
bleed pneumatics, which became increasingly cost effective, and towards the end of the time period some
high-bleed models were phased out entirely.
Future: once the regulations have been implemented, only certain legacy high bleed pneumatics will be
in operation. The absolute magnitude of the reduction of high bleed use depends on any given producer’s
inventory. For producers with low numbers of high bleed pneumatics, the absolute magnitude will be
small but the relative magnitude will approach 100%. Participant Group 1 intentionally left this blank but
discussed the context of their answer with the group.
Workshop consensus on directionality and magnitude of change in the future: ↓↓↓(-3)
-2-1
0
3
PRE-2009 2010-2015 TODAY 2020-2030
Particpant Group 3
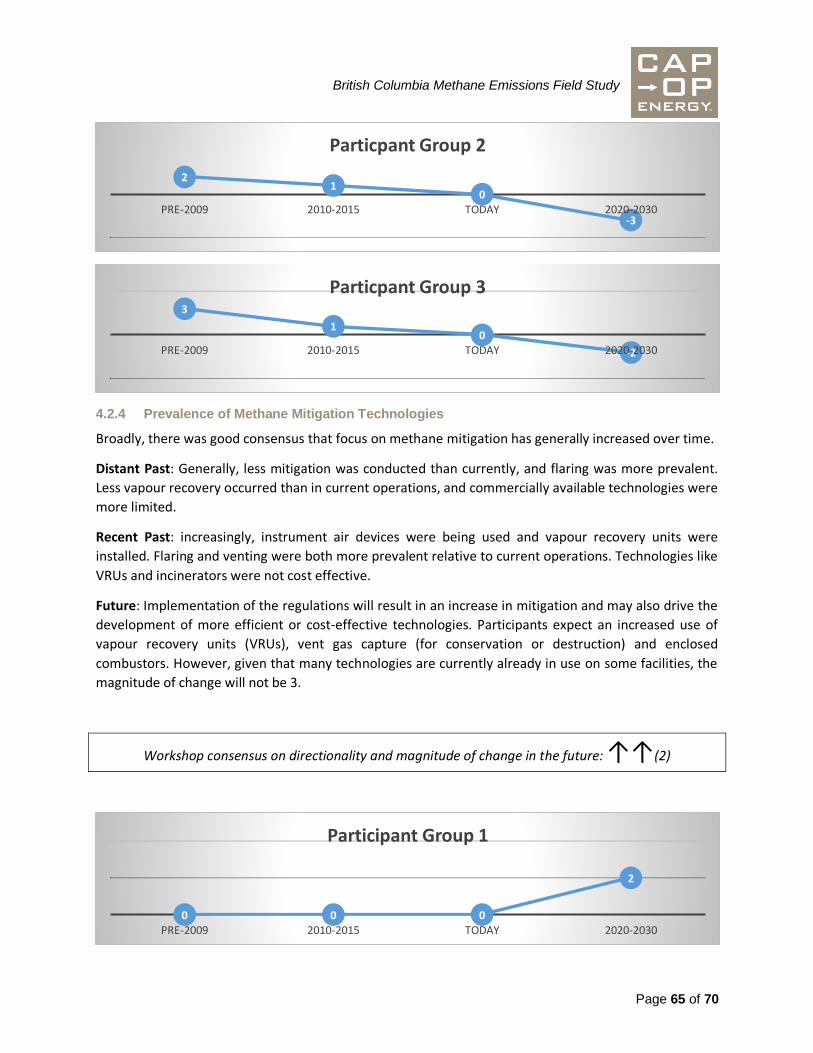
British Columbia Methane Emissions Field Study
Page 65 of 70
4.2.4 Prevalence of Methane Mitigation Technologies
Broadly, there was good consensus that focus on methane mitigation has generally increased over time.
Distant Past: Generally, less mitigation was conducted than currently, and flaring was more prevalent.
Less vapour recovery occurred than in current operations, and commercially available technologies were
more limited.
Recent Past: increasingly, instrument air devices were being used and vapour recovery units were
installed. Flaring and venting were both more prevalent relative to current operations. Technologies like
VRUs and incinerators were not cost effective.
Future: Implementation of the regulations will result in an increase in mitigation and may also drive the
development of more efficient or cost-effective technologies. Participants expect an increased use of
vapour recovery units (VRUs), vent gas capture (for conservation or destruction) and enclosed
combustors. However, given that many technologies are currently already in use on some facilities, the
magnitude of change will not be 3.
Workshop consensus on directionality and magnitude of change in the future: ↑↑(2)
21
0
-3PRE-2009 2010-2015 TODAY 2020-2030
Particpant Group 2
3
10
-2PRE-2009 2010-2015 TODAY 2020-2030
Particpant Group 3
0 0 0
2
PRE-2009 2010-2015 TODAY 2020-2030
Participant Group 1

British Columbia Methane Emissions Field Study
Page 66 of 70
4.2.5 Level of Preventative Maintenance
Participants identified that the level of preventative maintenance any given Producer achieves will not
likely change over time as it is typically driven by things like safety as opposed to emissions. Preventative
maintenance will vary from Producer to Producer, but any given Producers maintenance program will
generally remain constant over time. Regular turnarounds have always occurred and will continue, for a
variety of reasons unrelated to methane emission reductions.
Distant Past: no change.
Recent Past: no change.
Future: Only within the context of the future did Participants anticipate a change in preventative
maintenance programs. As new technologies are brought in to service a growing industry, preventative
maintenance programs may increase in magnitude. Additionally, mandatory LDAR may be an incentive
for Producers to implement regular maintenance in advance of detection surveys. The use of big data
management and analytics was seen as a potential shift that would create more efficient preventative
maintenance.
Workshop consensus on directionality and magnitude of change in the future: ↑(1)
-2 -2
01
PRE-2009 2010-2015 TODAY 2020-2030
Particpant Group 3

British Columbia Methane Emissions Field Study
Page 67 of 70
4.2.6 Prevalence of Non-Emitting Pneumatic Devices
There was broad consensus in the workshop that the prevalence of non-emitting pneumatic devices
increases through time, although magnitude of change can depend on many factors, including operations
of individual Producers.
Distant Past: Significantly fewer non-emitting pneumatic devices were in operation pre-2009. Some
Participant Groups indicated that, generally, non-emitting pneumatics were not in operation at all.
Recent Past: Over this period, well electrification projects became more prevalent, as did solar-powered
devices and other remote power options such as thermoelectric generators.
Future: Most new builds will have non-emitting pneumatics. Having access to cost-competitive electricity
from the grid is a significant consideration in increasing non-emitting pneumatics. Assuming that by 2022,
pneumatics will be switched out, this driver will only experience a small magnitude increase as new
technologies come online. Most new facilities will be non-emitting in their control and chemical injection
systems, equivalent to a magnitude of 3 decrease; however, legacy facilities with some emitting
pneumatic devices will continue to exist resulting in a magnitude of 2 decrease.
0 0 0
1
PRE-2009 2010-2015 TODAY 2020-2030
Participant Group 1
0 0 0 0PRE-2009 2010-2015 TODAY 2020-2030
Particpant Group 2
0 0 0
1
PRE-2009 2010-2015 TODAY 2020-2030
Particpant Group 3

British Columbia Methane Emissions Field Study
Page 68 of 70
Workshop consensus on directionality and magnitude of change in the future: ↑↑(2)
4.3 Potential for Incentivization In closing the afternoon, participants were individually asked to provide general opinions on potential
types of future market conditions or incentives that may drive implementation or a reduction technology
or method sooner than the implementation of regulations, or to a magnitude that goes beyond what is
required for compliance.
Electricity
- Collaboration between Producers and various levels of government to get Producers access to cost-competitive electricity; and
- Access to cost-competitive electricity from the grid is a key component of success and growth in the BC fields.
Incentives
-3-2
0
3
PRE-2009 2010-2015 TODAY 2020-2030
Participant Group 1
-3
-10
2
PRE-2009 2010-2015 TODAY 2020-2030
Particpant Group 2
-1 -1
0
1
PRE-2009 2010-2015 TODAY 2020-2030
Particpant Group 3

British Columbia Methane Emissions Field Study
Page 69 of 70
• Offer carbon offsets as an incentive;
• Use programming structures already utilized by other programs, such as the Clean Infrastructure Royalty Credit Program;
• Expand the flexibility of current and future incentives to allow for the combination of different incentives programs to drive increase in participation;
• Offer incentives for condensing wells to superpads (lower footprint);
• Offer incentives for research and development that will drive lower production costs; and
• Offer incentives for early adopters of technology or programs.
4.4 Chapter 4 Summary Three temporal states – distant past, recent past, and future – were interrogated across six specific focus
areas in terms of the direction and relative magnitude of change from the “present” observed in the field
study. The workshop leveraged industry experience to guide subjective changes to modeling parameters
over different time periods, including forecasting and backcasting of methane emissions in British
Columbia.
Broad agreement, especially with historical time periods, was achieved within the workshop in terms of
defining a narrative of oil and gas production in the province and defining a potential future scenario.
Assessment of methane emission modeling drivers was evaluated from a variety of perspectives, and
insights into key drivers that might influence parameters of interest for time-series modelling was
determined.
Closing The British Columbia Methane Emissions Field Study incorporated a broad scope of field data, corporate
data, and temporal trends in order to inform time-series modeling of methane emissions in British
Columbia. The development of BC-specific methane emissions parameters can also improve
understanding of the characteristics that make the province unique, those which are consistent with other
jurisdictions, and can elicit the next round of questions to be answered for further improvement.

British Columbia Methane Emissions Field Study
Page 70 of 70
Appendix A: Data Tables See supplemental attachment.
Cap-Op Energy
610-600 6th Ave SW
Calgary, AB, Canada
T2P 0S5
403.457.1029