capabilities, competitive advantages, and performance of apparel
TRANSCRIPT
HA-BROOKSHIRE, JUNG E. Ph.D. Capabilities, Competitive Advantages, and Performance of Apparel Import Intermediaries in a Hyper-dynamic Market Environment Directed by Dr. Barbara Dyer. 233pp.
Structural changes in the global apparel industry have led to a new market
environment in which part of the apparel channel members (specifically, apparel import
intermediaries or AIIs) have had to assume new market responsibilities and have taken
different approaches to their conventional functional activities. The purpose of this study
was to investigate the basic nature of these firms� business operations, that is, the
relationships among AIIs� capabilities, competitive advantages, and performance in the
hyper-dynamic market environment of the apparel industry. In order to do so, this study
(a) developed an integrative model of AIIs� capabilities, competitive advantages, and
performance; and (b) conducted an empirical assessment of the model, using survey
methodology.
Drawing from the first phase qualitative interview studies, extant theory, and
literature in the strategy, marketing, and organizational management disciplines, the
study proposed an integrative model of AIIs� capabilities, competitive advantages, and
performance. A survey was developed to test the causal relationships of these three major
constructs of interest. Subsequently, 807 firms were randomly drawn from
ReferenceUSA, an Internet-based firm database that includes U.S. apparel manufacturers
and wholesalers. Out of an adjusted sample of 736 firms, a total of 159 firms returned
usable surveys, resulting in a 21.6% response rate. Structural Equation Modeling was
employed for data analysis using LISREL 8.72 and tested the causal relationships among
AIIs� capabilities, competitive advantages, and performance.

Overall, the study�s findings supported the predicted positive impact between
AIIs� capabilities of market interpretation, sourcing, and service and the competitive
advantages of cost, product, and service. The results also supported the predicted positive
impact between AIIs� competitive advantages and their relationship performance with
domestic clients and foreign suppliers. Consistent with the resource-advantage theory of
competition, the study supported the role of competitive advantages as the direct
antecedents of AII performance and the role of functional capabilities as the indirect
antecedents of performance. This study concluded with research contributions and
implications, study limitations, and directions for future research.

CAPABILITIES, COMPETITIVE ADVANTAGES, AND PERFORMANCE
OF APPAREL IMPORT INTERMEDIARIES IN A
HYPER-DYNAMIC MARKET ENVIRONMENT
by
Jung E. Ha-Brookshire
A Dissertation Submitted to the Faculty of the Graduate School at
The University of North Carolina at Greensboro in Partial Fulfillment
of the Requirements for the Degree of Doctor of Philosophy
Greensboro
2007
Approved by
______________________________ Committee Chair

UMI Number: 3259663
32596632007
Copyright 2007 byHa-Brookshire, Jung E.
UMI MicroformCopyright
All rights reserved. This microform edition is protected against unauthorized copying under Title 17, United States Code.
ProQuest Information and Learning Company 300 North Zeeb Road
P.O. Box 1346 Ann Arbor, MI 48106-1346
All rights reserved.
by ProQuest Information and Learning Company.

© 2007 by Jung E. Ha-Brookshire

ii
APPROVAL PAGE
This dissertation has been approved by the following committee of the Faculty of
The Graduate School at the University of North Carolina at Greensboro.
Committee Chair ____________________________________ Barbara Dyer, Ph.D.
Committee Members ____________________________________ Nancy J. Nelson Hodges, Ph.D.
____________________________________ Carl L. Dyer, Ph.D.
____________________________________ Richard M. Luecht, Ph.D.
___________________________________ Date of Acceptance by Committee ___________________________________ Date of Final Oral Examination

iii
ACKNOWLEDGEMENTS
The journey of completing this dissertation has been simply amazing. From the
planning step to the final stage, I owe enormous debt to my colleagues, teachers, advisers,
and family. Without them, I would not stand here today. My very sincere and heartfelt
thanks go to Dr. Barbara Dyer, my dissertation committee chair, for endless hours of her
time to correct, suggest, and guide my writing, thoughts, and perspectives. She has shown
me the path to take as an academician. Very special thanks, too, go to Dr. Nancy Nelson
Hodges for her consistent encouragement and support throughout my graduate study. She
has guided me to open up my eyes to the qualitative world. To Drs. Carl Dyer and
Richard Luecht, I cannot express enough how much I have learned from them to become
a successful researcher, yet honoring integrity.
In addition to my dissertation committee members, there are many people to
whom I owe deepest appreciation. I thank my new family, the Brookshires, who have
welcomed me into the family circle from the very first day. From my high school
teachers back in Korea to my graduate school colleagues at Baruch College and the
University of North Carolina at Greensboro, I send sincere appreciation for their never-
ending praise and firm support. Particularly, my earnest thanks go to my mother, Hyun
Son Nam, my grandmother, Jung Jung Myo, my uncle, Hyun Mu Hwan, and my brother
Ha Hyun Jae, who have never doubted my abilities. Without them, I could not have
pursued my life-time dream. Finally, to my dearest husband, Richard Wesley Brookshire,
I dedicate this work with immeasurable sarang and unfathomable gamsa.

iv
TABLE OF CONTENTS
Page
LIST OF TABLES���������������.. ����������.....vii
LIST OF FIGURES��..������������������������..ix
CHAPTER
I. INTRODUCTION��������������������..����.��1
Significance of the Study�������������....������..�.1 Gaps in the Research�����������������������..4 Statement of the Research Questions�����������������.5 Statement of the Research Objectives�����������������6 Research Assumptions����������������������...9 Definition of the Key Terms������������������..�..10 Organization of the Study��������������������....14
II. REVIEW OF LITERATURE����.������������...����...15
Theoretical Framework��...����������������..��...15 Market Environment�������...������������..��...29 Firm Performance����������...��������..����...36 The Global Apparel Industry��������������..�����.40 Apparel Import Intermediaries��������������..����..44 Summary����������������������..�����62
III. RESEARCH CONCEPTUAL MODEL����������������.....66
Relevant Empirical Research�������.....����������......66 Gaps in the Research..������������������..����74 Research Conceptual Model����������������................76 Research Hypotheses������������������..����.82
IV. REARCH METHODOLOGY�����������.���������...84
Research Design and Survey Instrument Development��������.�.84 Sample������������������������.��.��98 Data Collection Procedures��������������������101 Data Analysis Techniques��������������������..103
v
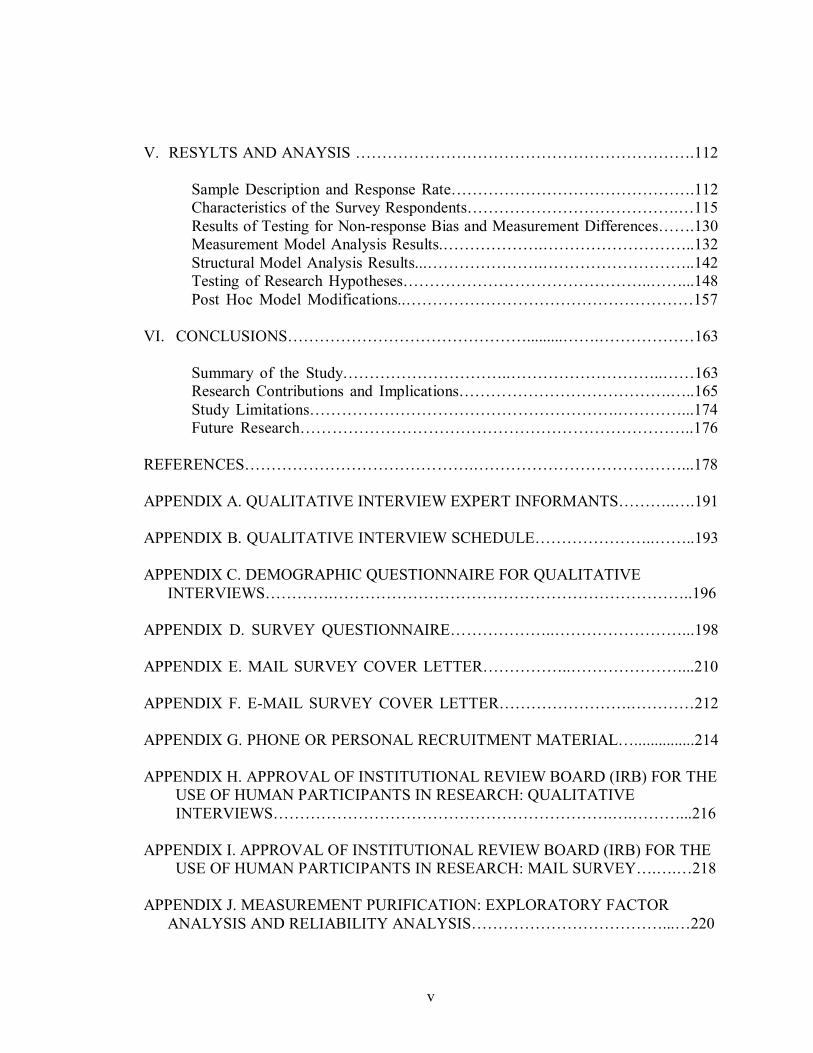
V. RESYLTS AND ANAYSIS ���������������������.112
Sample Description and Response Rate���������������.112 Characteristics of the Survey Respondents�������������.�115 Results of Testing for Non-response Bias and Measurement Differences��.130 Measurement Model Analysis Results.������.���������..132 Structural Model Analysis Results...�������.���������..142 Testing of Research Hypotheses���������������..��...148 Post Hoc Model Modifications..������������������157
VI. CONCLUSIONS���������������.........��.������163
Summary of the Study����������..���������..��163 Research Contributions and Implications�������������.�..165 Study Limitations�������������������.����...174 Future Research������������������������..176
REFERENCES��������������.�������������...178
APPENDIX A. QUALITATIVE INTERVIEW EXPERT INFORMANTS���..�.191
APPENDIX B. QUALITATIVE INTERVIEW SCHEDULE�������..��..193
APPENDIX C. DEMOGRAPHIC QUESTIONNAIRE FOR QUALITATIVE
INTERVIEWS����.����������������������..196
APPENDIX D. SURVEY QUESTIONNAIRE������..��������...198
APPENDIX E. MAIL SURVEY COVER LETTER�����..�������...210
APPENDIX F. E-MAIL SURVEY COVER LETTER��������.����212
APPENDIX G. PHONE OR PERSONAL RECRUITMENT MATERIAL�...............214
APPENDIX H. APPROVAL OF INSTITUTIONAL REVIEW BOARD (IRB) FOR THE USE OF HUMAN PARTICIPANTS IN RESEARCH: QUALITATIVE INTERVIEWS���������������������.�.���...216
APPENDIX I. APPROVAL OF INSTITUTIONAL REVIEW BOARD (IRB) FOR THE
USE OF HUMAN PARTICIPANTS IN RESEARCH: MAIL SURVEY�.�.�218
APPENDIX J. MEASUREMENT PURIFICATION: EXPLORATORY FACTOR ANALYSIS AND RELIABILITY ANALYSIS������������...�220

vi
APPENDIX K. PERMISSION TO REPRINT��������......������..232

vii
LIST OF TABLES TABLE Page
2.1 Dimensions of the Environment������������������� ...5
2.2 Wholesaler and Retailer Descriptions by the U.S. Census Bureau����...��46
2.3 Commonly Used Academic and Practitioner Terms for Intermediaries����...50
2.4 Limitations of Extant Terms for Identifying AIIs��������.....................52
2.5 Summary of Literature Review���������������.....................64
3.1 Findings on the Antecedents of Export and Export Intermediaries�
Performance���������������������������..67
4.1 Survey Constructs, Item Sources, and Development������������90
5.1 Sample Response Rate�����������������������113
5.2 Breakdown of Domestic Manufacturing and Retailing Operations for the Survey Respondents����������������............................................117
5.3 Geographic Location of the Survey Respondents������������...121
5.4 Business Operations Characteristics for the AII Survey Respondents����...123
5.5 Business Characteristics of the AII Survey Respondents���������...127
5.6 MANOVA Test for Non-response Bias (Early and Late Responses)�����.130
5.7 MANOVA Test for Measurement Differences (With-follow-up and Without-
follow-up Responses)��������������������...��...131
5.8 Measure Means, Standard Deviations, and Correlations�....................................136
5.9 Measurement Model��������..����������...����..137
5.10 Inter-factor Correlations, Standard Errors, and t-Values in the Measurement Model�������������������������...���...138
5.11 Structural Model.�������.��.�����..���������...143

viii
TABLE (Continued) Page
5.12 Standardized Indirect Effects of Explanatory Variables on Outcome Variables����������������������������.147
5.13 Summary of Hypotheses Tests��������������������156
5.14 Alternative Structural Model 1 (Adding Direct Paths from the Three Capabilities to
the Two Performance Outcome Variables)���������������.158
5.15 Alternative Structural Model 2 (Deleting the Three Statistically Non-significant Paths from the Original Structural Model)������������..�...�160

ix
LIST OF FIGURES
FIGURE Page
2.1 A Schematic of the Resource-Advantage Theory of Competition �����..�26
2.2 Changed Roles of U.S. Apparel Firms in a New Market Environment����....45
2.3 The Functions of AIIs in a Hyper-dynamic Environment������.���..58
2.4 AIIs� Success and Their Secrets to Success in a Hyper-dynamic Environment�...61
3.1 Conceptual Model������������������..������...81
3.2 Research Hypotheses��������.���������������...83
5.1 Measurement Model with Standardized Solutions����..�����...��139
5.2 Structural Model with Standardized Solutions��������...�����144
5.3 Structural Model with Unstandardized Solutions and the Research Hypotheses...149

1
CHAPTER I
INTRODUCTION
Chapter I contains the following sections: (a) Significance of the Study, (b) Gaps
in the Research, (c) Statement of the Research Questions, (d) Statement of the Research
Objectives, (e) Research Assumptions, (f) Definition of the Key Terms, and (g)
Organization of the Study.
Significance of the Study
The study investigated the important firm operation issues on import intermediary
firms that link domestic clients and foreign suppliers in the global apparel supply chain.
Due to globalization, the world has become extremely interconnected and people across
the world have developed strong interdependent relationships in all phases of their lives
(Kunz & Garner, 2006). From the business perspective, globalization means that firms
must seek ever-increasing levels of profits necessary to continue their businesses in a
global economy. For example, U.S. firms are now importing products from most of the
countries in the world and the importing of products has been increasing exponentially.
Between 2000 and 2005, the value of U.S. imports has risen from $1.45 trillion to $2.0
trillion in nominal dollars, or by 38% (Progressive Policy Institute, 2006, April).
Particularly, the amount of apparel in world trade was extremely significant as it
accounted for $276 billion, or 13.8%, in 2005 (World Trade Organization [WTO], 2006).

2
This increase in importing is expected to be more intensified in the future, driven by
strong consumerism in U.S. society.
From consumers� perspectives, globalization has provided a greater chance of
access to a wider range of apparel products at better prices than ever before. Currently,
there are many studies that suggest U.S. consumers, in fact, have financially benefited
from the constantly escalating volume of products at lower prices imported from
developing countries (Kunz & Garner, 2006). For example, U.S. importers have paid
approximately $2 billion per year to bring in over a billion units of infant wear, while the
cost of these clothes to them has fallen by 30% since 1997 (Progressive Policy Institute,
2003, November). More specifically, the average cost of a dozen units of infant wear has
fallen from approximately $28.00 in 1997 to $20.15 in 2003. The data also reveal that
U.S. consumers have purchased more units of infant wear as the volume of imports have
doubled from 43 million units in 1997 to a likely 100 million units in 2003 (Progressive
Policy Institute, 2003, November). This pattern has been seen in most other apparel
product items.
Given that the apparel industry is the most globalized of all industries, it is clear
that it plays a significant role in the U.S. economy as well as in the global economy
(Dicken, 2003). On January 1, 2005, fueled by the elimination of the U.S. quota system,
which covered 45 countries and 79% of U.S. textile and apparel imports in 2004, the
United States accounted for approximately a third of the world�s apparel trade, or $78
billion, in clothing imports (Progressive Policy Institute, 2006, February; U.S.
International Trade Commission [USITC], 2006). Although some portion of the apparel

3
imports are handled directly by U.S. retailers (such as Wal-Mart or Target) or marketeers
(such as Nike or Reebok), it is clear that other firms must be assuming the major
responsibility for this explosive increase in apparel imports, that is, the linking of foreign
manufacturers and domestic clients (Ellis, 2007). For the purposes of this study, these
firms are given the name of apparel import intermediary firms (AIIs), and, because of a
significantly changed market environment, there is a strong need to understand AIIs and
their business operations.
By examining U.S. AIIs in the global apparel supply chain, this study made
several important contributions to the body of knowledge. First, the study empirically
supported the resource-advantage theory of competition and suggested important
theoretical implications for intermediary firm operations in a global economy. Second,
the study�s findings provided critical insights into AIIs� capabilities, competitive
advantages, and performance that may help AIIs with practical business solutions. Third,
the study presented a new definition of AIIs, highlighting the issue of AIIs� identity, and
provided a much needed descriptive business profile of U.S. AIIs to help to understand
the reality of industry phenomena and recognize changes in the global apparel industry.
Finally, the study confirmed the unique nature of the U.S. apparel industry environment
and emphasized that great care should be taken in adapting extant measurement scales
developed in other industries or disciplines. Thus, the study suggested different meanings
regarding AIIs� capabilities and performance than those typically associated with
intermediary firms in the apparel industry.
4
Gaps in the Research
Dictionary of Business by Oxford University Press defines an intermediary as any
firm in a distribution channel whose job is to help other firms find customers or make
sales to them. Past interest in intermediary studies has focused on exports, as exporting is
a critical channel for foreign market entry and sales expansion (Bello, Chelariu, & Zhang,
2003; Cavusgil & Zou, 1994; Morgan, Kaleka, & Katsikeas, 2004; Souchon &
Diamantopoulous, 1997). As a result, an export intermediary (EI) research stream has
developed, which has looked at trading companies, manufacturers� representatives, or
distributors with a focus on export management companies or export trading companies
(Balabanis, 2000, 2001; De Noble, Castaldi, & Moliver, 1989).
In particular, Peng and his colleagues have specifically stressed that more
rigorous research on EIs is necessary to recognize firms that deal with not only their own
goods as export departments of manufacturers, but also other manufacturers� or
wholesalers� goods as middlemen (Peng & Ilinitch, 1998; Peng & York, 2001; Peng, Hill,
& Wang, 2000). They have defined export intermediaries as [domestic] specialized
service firms bridging the gap between domestic manufacturers and foreign customers.
Although EI research has become an active research area in recent years, research in this
area could be characterized as relatively new (when compared with other strategic
management literatures) and focused in large part on the roles, service, and functions of
EIs. These studies have not directly considered the role of importers.
While a body of import literature exists, most import studies found in the
literature have been related to importers� behavior as it would help foreign exporters.

5
Importers in these studies have been viewed as ultimate buyers of foreign products and
analyzed from the foreign sellers� perspective in an effort to increase their international
sales (Deng & Wortzel, 1995; Reichel, 2000). Thus, importers� behavior research has
been interested in importers� motives and barriers in the selection/rejection of foreign
supplier alternatives, the decision-making process for choosing foreign suppliers, and
importers� relations with foreign suppliers (Overby & Servais, 2004).
As the United States has transitioned from a net exporter to a net importer in the
apparel trade, the contributions of AII firms have shifted in importance. Today�s AIIs
provide vital functions for both domestic clients and foreign suppliers in the global
apparel supply chain. Despite this critical shift in importance, most academics and policy-
makers have continued to focus on manufacturing and exporting when analyzing the
apparel industry, with little attention to these important channel members. The result has
led to a critical gap in our understanding of vital supply chain members in a global
economy�apparel import intermediaries.
Statement of the Research Questions
In order to fill the gaps in the import intermediary literature, this study explored
the basic nature of AIIs� business operations, that is, the capabilities and performance of
AII firms in the hyper-dynamic apparel market environment, with a special focus on the
role of competitive advantages as the direct antecedents of AIIs� performance.
Specifically, the study examined the impact of AIIs� competitive advantages�cost,
product, and service advantages, respectively�on various AIIs� performance outcomes,
including economic, non-economic strategic, and relationship performance. Once the

6
roles of AIIs� competitive advantages have been identified, the study investigated the
possible impact of AIIs� functional capabilities�design, marketing, sourcing, and service
capabilities�on these competitive advantages to examine the indirect effects of AIIs�
capabilities on their performance.
Statement of the Research Objectives
In order to address the research questions and deal with a lack of extant research
on AIIs, the study took place in two steps: (a) a first phase qualitative interview study and
(2) a second phase quantitative mail survey study. First, as part of dissertation preparation,
the researcher conducted in-depth qualitative interviews with 13 executives of U.S. AII
firms and completed two preparatory research manuscripts. The first manuscript
investigated AIIs� environment, development, and functions in a hyper-dynamic market
environment (see Ha-Brookshire and Dyer [2006] for details). The second manuscript
explored the meaning of success and the secrets to success described by AII participants
(see Dyer and Ha-Brookshire [in press] for details).
The first preparatory study reported that U.S. AII firms carry out unique
functional activities when linking domestic clients and foreign suppliers in the global
apparel supply chain. Specifically, the hyper-dynamic apparel market environment has
shaped AIIs� functional activities into unique apparel firm activities, including
interpretation-oriented design, on-the-floor-experiential marketing, relationship-oriented
sourcing, and 24/7-intimate customer service. The second preparatory study suggested
that the AII expert informants described success as reaching a long-term presence, a
platform, from which they could impact the industry through creative expression. This

7
result was far different from traditional views of success that focus on firms� sales or
growth. AIIs� creative impact on the market, in turn, was seen to help AIIs build their
competitive advantages in a hyper-dynamic market environment. AIIs� three main
success factors emerged from the data were (a) immersion knowledge management, (b)
simultaneous dual relationship management, and (c) flexibility saturation.
Built upon the first phase qualitative interview studies, the second phase
quantitative mail survey study was designed to expand part of the interview study
findings to a larger, nationwide population of U.S. AIIs. As the first step to understand
these firms, the survey study targeted the basic and fundamental interests in AII firms�
operations and performance, seeking to empirically test the relationships among AIIs
capabilities, competitive advantages, and performance in a hyper-dynamic market
environment. Consequently, this part of dissertation study was designed to (a) develop an
integrative model of AIIs� capabilities, competitive advantages, and performance in a
hyper-dynamic market environment; and (b) conduct an empirical assessment of the
model.
In developing an integrative model of AIIs� capabilities, competitive advantages,
and performance in a hyper-dynamic market environment, resource-based view of the
firm and the resource-advantage theory of competition were used as the study�s
theoretical framework. These frameworks helped to understand the characteristics of AII
firms and the process of AIIs� competition in a hyper-dynamic environment. The role and
concept of market environment and firm performance discussed in the current
management, marketing, and international business literature were also important for the
8
study as they laid out a foundation for understanding the relationships among firms�
behavior, environment, and performance. An overview of the global apparel industry was
necessary to formally define and correctly identify AIIs in this new environment,
especially given the changed roles of apparel channel members in today�s market
environment.
Once an integrated model of AIIs� capabilities, competitive advantages, and
performance was developed, an empirical assessment of the model was conducted, using
the mail survey technique. The self-administered survey is a useful research technique to
estimate the distribution of characteristics in a population, and it allows researchers to
sample a great number of respondents over a wide geographic area (Dillman, 2000). A
survey was developed based on the results of the first phase qualitative interview studies
on AIIs and the extant empirical research in the export performance literature. The first
phase qualitative interview studies offered important insights into AIIs� functional
activities and their secrets to success. The extant export performance research provided
what little insight on performance was available due to limited research in the import
performance literature.
The initial survey instruments were refined through face validity assessment by
five academic researchers in the areas of consumer, apparel, and retail studies and
educational research methodology. The survey instruments were further polished through
pre-testing by 15 to 20 industry experts, including 13 AII firm executives who
participated in the first phase qualitative interview studies. This process, participation
confirmation, helped to increase the exploratory interview studies� validity (Nelson,

9
Labat, & Williams, 2002). Finally, a full mail survey was administered to a nationwide
sample of U.S. apparel import firms that were randomly selected from the ReferenceUSA
database. The survey results were analyzed through exploratory factor analysis and
structural equation modeling (SEM), using LISREL 8.72. Post-hoc model modifications
were also explored.
Research Assumptions
As with all research, a number of assumptions underlay this study. The mail
survey study was constructed based on several common assumptions. First, because the
study employed survey methodology, it assumed that survey respondents were capable of
answering survey questions knowledgeably and accurately. The study also assumed that
corporate executives were expert informants and, having been used in numerous firm
performance research studies for their ability to provide the insights or experience
necessary to answer specific survey questions, were appropriate for answering this
study�s research questions. In addition, survey methodology in general assumed that what
respondents answer was representative of what they actually do.
Next, the study made additional assumptions based on the data analysis tool
selected�structural equation modeling. Because the study estimated structural
relationships among the study variables using Maximum Likelihood (ME) estimation, it
assumed multivariate normal distributions of the study variables. This was a very basic
assumption, as the validity of ME, though it is the most widely used normal theory
estimator, in general, does not hold under extreme non-normal distributions (Hoyle,
1995). Moreover, SEM assumes linear relationships, or unidirectional causal

10
relationships, between the study�s indicator and latent variables, as well as between latent
variables. This was a notable assumption as well, especially when the relationships of the
variables of interest are not known (Hoyle, 1995).
Definition of the Key Terms
Below are the definitions for the key terms that used throughout the text.
Apparel Import Intermediary (AII)
Refers to a domestic apparel service firm that links domestic
wholesalers/retailers and foreign distributors/manufacturers to
facilitate import transactions in the global apparel supply chain
(Ha-Brookshire & Dyer, 2006).
Apparel Industry Typically refers to the industry segment involved in the
manufacture of garments and certain accessories (Dickerson,
1999), expanded in this study to include the industry segment
with companies that design, manufacture, market, and/or license
brands for men's, women's, and/or children's clothing, footwear,
and accessories (Bitpipe.com).
Competitive Advantage
A firm is said to have a competitive advantage, when it is
implementing a value creating strategy not simultaneously being
implemented by any current or potential competitors (Barney,
1991). Competitive advantages are composed of a firm�s relative
value that was produced by its resources and relative resource
costs for producing such value (Hunt, 2000).

11
Domestic Clients Refers to an intermediary firm�s domestic business partners,
including retailers or other wholesalers (study definition).
Export Intermediary
Refers to a domestic specialized service firm bridging the gap
between domestic manufacturers and foreign customers (Peng &
Ilinitch 1998; Peng & York 2001; Peng, Hill, & Wang, 2000).
Firm Refers to a collection of productive resources, seeking to achieve
above-normal returns (Barney, 1991; Conner, 1991). This
definition is based on the resource-based view of the firm.
Firm Capabilities Refers to complex bundles of skills and accumulated knowledge,
exercised through organizational processes that enable firms to
coordinate activities and make use of their assets (Day, 1994).
Firm capabilities are part of firm resources.
Firm Performance Refers to the outcome of firms� structure, strategies, planning,
and any other activities. Firm performance is multi-dimensional
and can be assessed via economic, subjective, strategic, and
other measures (Cavusgil & Zou, 1994; Dess & Robinson,
1984).
Firm Resources Refers to the tangible and intangible entities available to the firm
that enable it to produce efficiently and/or effectively a market
offering that has value for some market segments (Hunt, 2000. p.
138). Resources are heterogeneous and imperfectly mobile
(Hunt, 2000).

12
Foreign Suppliers Refers to an intermediary firm�s foreign business partners,
including manufacturers or other distributors (study definition).
Globalization The process whereby the world�s people and businesses are
becoming increasingly interconnected in all phases of their lives
and actions (Kunz & Garner, 2006).
Hyper-dynamism Refers to a market environment which incorporates high levels
of the four dimensions of environment�complexity, dynamism
or turbulence, competitive resource availability, and an
accelerated business cycle (Dyer & Ha-Brookshire, in press).
Manufacturers Refers to establishments engaged in the mechanical, physical, or
chemical transformation of materials, substances, or components
into new products. The assembling of component parts of
manufactured products is considered manufacturing, except
construction (U.S. Census Bureau, 2006, February).
Resource-advantage Competition
Refers to a constant struggle (the process of competition) among
firms for relative advantages in resources that will yield
marketplace positions of competitive advantage for some market
segment(s) and, thereby, superior financial performance (Hunt,
2000).

13
Retailers Refers to establishments engaged in selling merchandise,
generally without transformation, and rendering services
incidental to the sale of merchandise to the ultimate consumer.
Retailers sell merchandise in small quantities to the general
public (U.S. Census Bureau, 2005b, p. B-1).
Sourcing Refers to the process of determining how and where
manufactured goods or components will be obtained (Dickerson,
1999).
Supply Chain A set of three or more entities (organizations or individuals)
directly involved in the upstream and downstream flows of
products and/or services from a source to a customer (Mentzer,
DeWitt, Keebler, Min, Nix, Smith, and Zacharia, 2001).
Wholesalers Refers to establishments engaged in wholesaling merchandise,
generally without transformation, and rendering services
incidental to the sale of merchandise to another channel member.
Wholesalers sell or arrange the purchase or sale of (a) goods for
resale to other wholesalers or retailers, (b) capital or durable
non-consumer goods, or (c) raw or intermediate materials or
supplies used in production (U.S. Census Bureau, 2005c, p. B-
1).

14
Organization of the Study
This dissertation study is divided into six chapters. Chapter I presents the
importance of the study, gaps in the research, statement of the research questions,
statement of the research objectives, research assumptions, definition of the key terms,
and the organization of the study. Chapter II provides the literature review pertaining to
firm performance and apparel import intermediaries in the global apparel supply chain,
including theories of the firm, resource-advantage theory of competition, market
environment, firm performance, an overview of the global apparel industry, and apparel
import intermediaries. Chapter III discusses empirical research relevant to AIIs�
capabilities, competitive advantages, and performance, research gaps, the study�s
conceptual model, and the research hypotheses. Chapter IV presents the research
methodology, including the research design and survey instrument development, sample,
data collection procedures, and data analysis techniques. Chapter V presents the study�s
results and analysis, including sample description and response rate, characteristics of the
survey respondents, results of testing for non-response bias and measurement differences,
measurement model analysis results, structural model analysis results, testing for research
hypotheses, and post hoc model modifications. Finally, Chapter VI offers a summary of
the study, research contributions and implications, study limitations, and future research.

15
CHAPTER II
REVIEW OF LITERATURE
This chapter contains the following sections: (a) Theoretical Framework, (b)
Market Environment, (c) Firm Performance, (d) The Global Apparel Industry, (e)
Apparel Import Intermediary, and (f) Summary.
Theoretical Framework
As an economy becomes globalized and the meaning of national borders begins to
blur, the nature of firms� functions and activities in a global economy may also change.
In the past, economics, finance, management, and marketing have all put forward
theoretical frameworks to provide systematic structures to adequately explain and predict
the existence and behavior of firms�theories of the firm (Vibert, 2004). In addition, as
competition among firms has heightened in ever-challenging market environments, firm
strategy researchers have been specifically interested in the nature of firm competition,
leading to a new research stream�economic theories of firm competition. While
emphasis has largely been focused on the outcomes of competition for society and
economic efficiency, most economic theories of competition have sought deeper insights
into firms� competitive advantages over their rivals to explore the role of firm strategy
and action in the process of competition (Grimm, 2006). Particularly, the resource-
advantage theory of competition has been proposed to explain and predict the process of
dynamic firm competition in today�s market environment (Hunt & Morgan, 1995, 1997).

16
In order to investigate AII firms� behavior and their competitive advantages in a
highly complex global market, the resource-advantage theory of competition drawn from
resource-based theory of the firm offers important insights. These theories were reviewed
in order to provide a framework for exploration of this study�s research questions.
Theories of the Firm
Theories of the firm are interested in the very nature of the firm, exploring such
questions as why firms exist, why certain firms perform better than others, and why firms
behave as they do (Conner, 1991; Vibert, 2004). The topic of theories of the firm has
been much discussed in the organization and business strategy literature and has resulted
in various perspectives of the firm. In the current literature, four unique perspectives of
theories of the firm have been identified. They were (a) economic theories, (b) functional
organization theories, (c) interpretive and social constructionist perspectives, and (d)
radical humanist and structuralist perspectives (Vibert, 2004). The vast majority of theory
development and empirical testing has been focused on the economic perspective.
Economic Theories of the Firm
Economic theories of the firm, the most widely and intensely discussed in the
literature, are managerially oriented and functional in nature (Vibert, 2004). Economic
theorists often seek to predict the future behavior of the firm in a given market. Thus,
firm performance often becomes the bottom-line measure for the firm�s existence or
survival in the future environment (Grant, 1996). These theories also aim to establish the

17
firm�s objectives and set frameworks to analyze consequent firm strategies (Seth &
Thomas, 1994).
Within the economic theories of the firm, numerous approaches were taken to
explain different firm behaviors and firm objectives. Different researchers classify them
differently as the purpose of their classification might vary (for example, Conner, 1991;
Vibert, 2004). Seth and Thomas (1994), in particular, were interested if extant economic
(including finance) theories of the firm would help strategy researchers. Consequently,
they reviewed and classified current economic theories of the firm into seven categories.
They were (a) the neoclassical theory of the firm, (b) the traditional industrial economics,
(c) the new industrial economics, (d) the behavioral theory of the firm, (e) the managerial
view and resource-based view of the firm, (f) agency theory and the firm, and (g) the
transactions cost framework.
First, in the neoclassical theories of the firm, firms exist to produce products or
services by two inputs: capital and labor. The right �mix� of capital and labor in perfect
competition would yield the best combination of prices and quantities of particular
products, thus the firm�s main objective is to maximize profits (Conner, 1991; Hunt,
2000; Vibert 2004). In this context, the firm represents a production function that would
lead to maximum profits by optimizing its labor and capital allocations. The focus of this
perspective, therefore, is to calculate the marginal utility of each additional input,
assuming all the resources freely move and are completely divisible. In this view, all the
firms in the market are relatively homogeneous and small, and gaining an understanding

18
of the firm�s internal characteristics is deemed to be extremely difficult (Conner, 1991;
Hunt, 2002; Seth & Thomas, 1994).
Second, the traditional industrial organization (IO) economics assumes a
unidirectional causal flow from industry structure through firm conduct to firm
performance�the Structure-Conduct-Performance (SCP) paradigm (Seth & Thomas,
2004). Typically, firm behavior is ignored under assumed perfect competition. While
firm managers� perceptions about the industry structure vary within an industry, however,
different conduct by different firms becomes a focus. Industry structures that are
important for firm performance in the traditional IO theories may include the degree of
concentration, diversification, barriers to entry, the presence of scale economies, and
product differentiation (Seth & Thomas, 1994). Naturally, the majority of traditional IO
theorists have been interested in public policy, suggesting the normative-oriented nature
of this perspective (Seth & Thomas, 1994). Although, the traditional IO perspective
provided an importance of firm managers� perceptions about the industry structure for
firm behavior and performance, it shares most of the basic assumptions with the
neoclassical economic theories of the firm, including profit maximization as the firm�s
ultimate objective (Conner, 1991).
Third, the new IO economics perspective, although it accepts the SCP paradigm,
focuses on formal theoretical analyses of the industry structure and the behavior of firms,
including firms� market strategies and internal organization (Tirole, 1988). For example,
Encaoua, Geroski, and Jacquemin (1986, as cited in Seth & Thomas, 1994) argued firms�
current market strategies or conduct not only directly impact its rival�s behaviors, but also
19
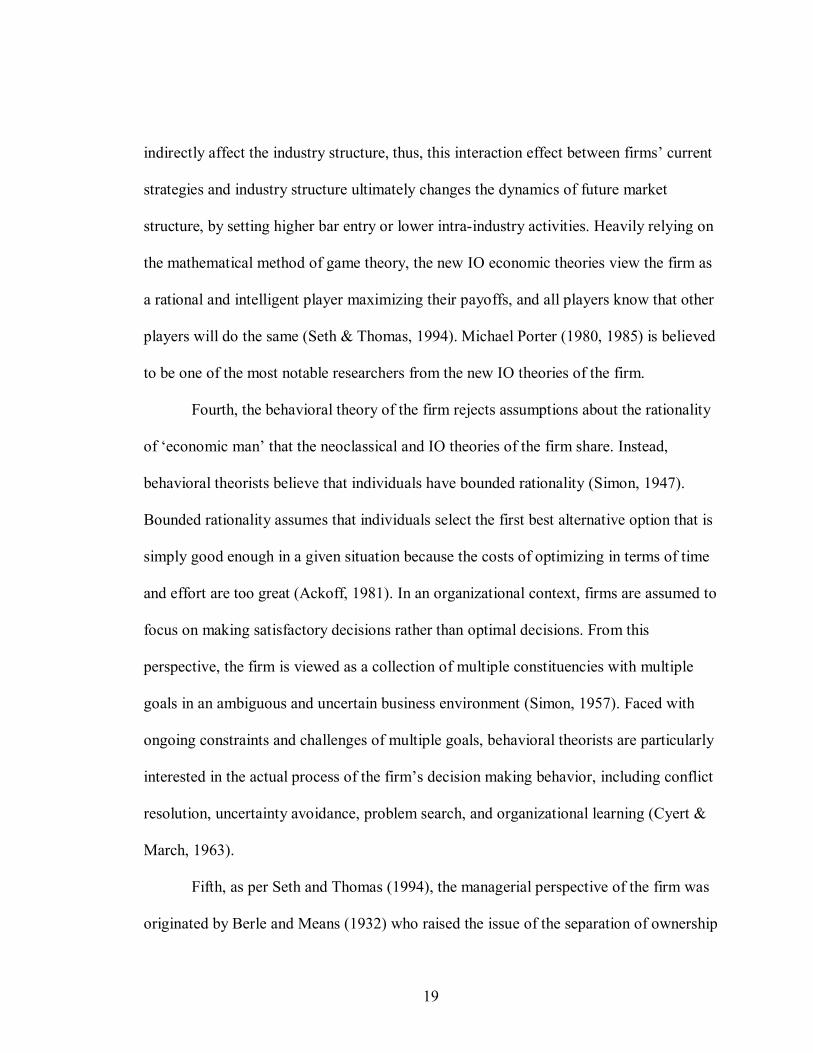
indirectly affect the industry structure, thus, this interaction effect between firms� current
strategies and industry structure ultimately changes the dynamics of future market
structure, by setting higher bar entry or lower intra-industry activities. Heavily relying on
the mathematical method of game theory, the new IO economic theories view the firm as
a rational and intelligent player maximizing their payoffs, and all players know that other
players will do the same (Seth & Thomas, 1994). Michael Porter (1980, 1985) is believed
to be one of the most notable researchers from the new IO theories of the firm.
Fourth, the behavioral theory of the firm rejects assumptions about the rationality
of �economic man� that the neoclassical and IO theories of the firm share. Instead,
behavioral theorists believe that individuals have bounded rationality (Simon, 1947).
Bounded rationality assumes that individuals select the first best alternative option that is
simply good enough in a given situation because the costs of optimizing in terms of time
and effort are too great (Ackoff, 1981). In an organizational context, firms are assumed to
focus on making satisfactory decisions rather than optimal decisions. From this
perspective, the firm is viewed as a collection of multiple constituencies with multiple
goals in an ambiguous and uncertain business environment (Simon, 1957). Faced with
ongoing constraints and challenges of multiple goals, behavioral theorists are particularly
interested in the actual process of the firm�s decision making behavior, including conflict
resolution, uncertainty avoidance, problem search, and organizational learning (Cyert &
March, 1963).
Fifth, as per Seth and Thomas (1994), the managerial perspective of the firm was
originated by Berle and Means (1932) who raised the issue of the separation of ownership

20
from management in the large, publicly-held firm. Firm managers in public firms may
pursue activities that are beneficial to managers themselves rather than public
shareholders. Thus, a manager�s motivation may not be profit-maximization, but more
realistic or personal. This view was challenged by Penrose (1959) who proposed that a
firm (or a firm manager) does have incentives to enhance the productivity of resources,
despite the separation of ownership from management, because there would be no
conflict between managers and shareholders. Thus, as per Penrose, �the firm is much
more than an administrative unit; it is also a collection of productive resources utilized in
the firm�s operations� (as cited in Seth & Thomas, 1994). This perception of the firm has
become the foundation of the resource-based view of the firm later. The resource-based
view of the firm argues that firms seek to achieve above-normal returns by distinctive
products or lower price and, thus, unique and costly-to-copy resources are critical to
sustain above-normal returns (Barney, 1991; Conner, 1991).
Sixth, the agency theory perspective of the firm, developed in financial economics,
focuses on a long-term wealth maximization of the firm to its shareholders (Seth &
Thomas, 1994). This perspective is particularly interested in the contractual relationships
between principals and their agents, or the shareholders and the firm�s managers. That is
because these contractual relationships are believed to constrain managerial judgment and
promote actions in the shareholders� best interests. Thus, the primary focus of agency
theory is the effects of various factors in the contracting environment on the firm�s
contractual relations with its employees, suppliers, customers, creditors, and other
stakeholders (Seth & Thomas, 1994). The important factors in the contracting

21
environment may include uncertainty, information asymmetry, risk and effort preferences
of agents, cost of monitoring and bonding devices, and so on. From this view, firms exist
because of the advantages of team production and firms are controlled by a series of
contractual relationships, not by authority (Alchian & Demsetz, 1972; Jenson &
Meckling, 1976). Thus, the firm is regarded as �a nexus for a set of contracting
relationships among individuals� that often have conflicting objectives, and firm
managers act to minimize agency costs (i.e., monitoring costs by the principal, bonding
costs by the agent, or the residual loss) in their own interests (Jensen & Meckling, 1976,
p. 310).
Finally, the transaction cost perspective of the firm was developed by Williamson
(1976, 1985, 1988), built upon Coase�s (1937) market failures framework. Market failure
refers to a situation where transaction costs become excessive, resulting in too few firms
or individuals participating in the market (Geroski, Machin, & Walters, 1997).
Transaction costs are defined as the costs of operating the economic system or the costs
of consumption over and above the purchase price of a product or service (Williamson,
1976). Transactions costs arise in a contractual setting either because the nature of the
good or service is complex or because the exchange partner (the other firm) is
untrustworthy. Because human actors exercise both bounded rationality (intentionally
rational, but in a limited sense) and opportunism (they will not fully disclose truth upon
requests), firms face extreme difficulties to write and enforce contracts. From this
perspective, the firm is viewed as a governance structure that is crafted to minimize
transaction costs by efficient ways of negotiating, monitoring, and enforcing contracts.

22
Although there is much discussion about the differences between agency theory
perspective and transaction cost perspective (for example, Williamson, 1988), these two
perspectives are viewed as complementary to understand how internal activities of the
firm are organized (Seth & Thomas, 1994).
Functional Organization Theories of the Firm
Similar to economic theories of the firm, functional organization theories are also
implicitly manager-oriented and explicitly examine regularities and relationships that
lead to generalizations in the behavior and performance of the firm (Gioia & Pitre, 1990).
Functional organization theories, however, are different from economic theories of the
firm in several ways. Functional theories analyze organizations, not just business
enterprises. Firm performance in functional theories is not limited to corporate bottom
line or economic market measures; rather it includes other forms of performance, such as
survival or legitimacy. Additionally, functional theories do not consider organizations as
singular decision makers. They focus on internal organizational structures and the
relationships between constituent units and departments (Grant, 1996; Pfeffer, 1982).
Vibert (2004) categorized several perspectives under the category of functional
organization theories, including those of bureaucracy, contingency, strategic choice,
resource dependence, population ecology, institutions, and chaos theory.
Interpretive and Social Constructionist Perspectives of the Firm
Interpretive and social constructionist perspectives of the firm originated from the
paradigm of interpretivism. Both economic and functional theories of the firm view

23
organizational members as over-socialized, passive, determined role-takers, while
interpretivists view them as under-socialized, active role-makers (Vibert, 2004). Thus,
people in firms are self-ruling and capable of making choices on their own. These
perspectives also believe that organizational realities are socially and symbolically
constructed and sustained by people (Gioia & Pitre, 1990). Therefore, descriptions,
insights, and explanations of events are important to interpret and understand modern
organizations. Examples of these approaches are symbolic interactions, dramaturgy, the
use of metaphors, sense-making, organizational rules, and culture perspectives (Vibert,
2004).
Radical Humanist and Structuralist Perspectives of the Firm
Unlike economic, functional, and interpretive perspectives to theories of the firm,
radical humanist and structuralist perspectives confront and critique extant beliefs,
assumptions, and institutions (Vibert & Hurst, 2004). Radical humanism seeks to �free
organization members from sources of domination, alienation, exploitation, and
repression by critiquing existing social structure with the intent of change� (Gioia & Pitre,
1990, p. 588). From this view, firms are examined from the perspective of
postmodernism, critical theory, and configuration theory. Meanwhile, radical
structuralism seeks �to remove from society, industries, and organizations the sources of
domination forced on lower members of the social hierarchy by dominant elites� (Vibert
& Hurst, 2004, p. 154). Firms are examined from the perspective of the Marxist and
poststructuralist feminism.
24
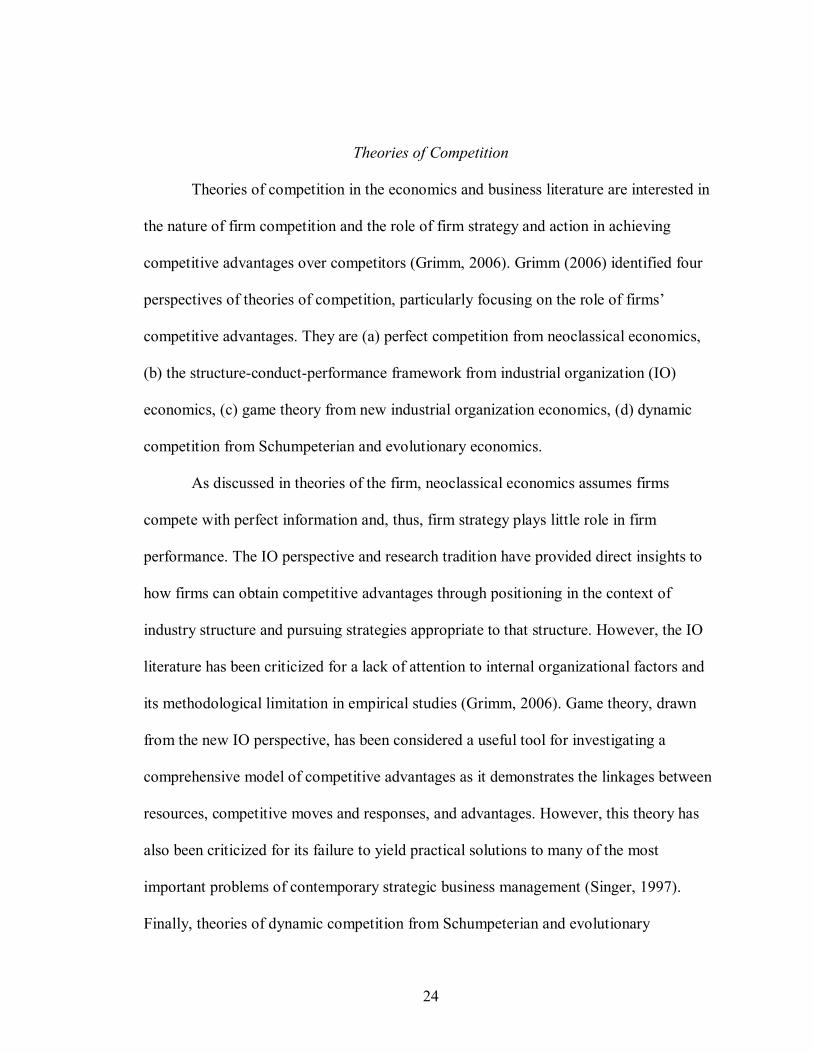
Theories of Competition
Theories of competition in the economics and business literature are interested in
the nature of firm competition and the role of firm strategy and action in achieving
competitive advantages over competitors (Grimm, 2006). Grimm (2006) identified four
perspectives of theories of competition, particularly focusing on the role of firms�
competitive advantages. They are (a) perfect competition from neoclassical economics,
(b) the structure-conduct-performance framework from industrial organization (IO)
economics, (c) game theory from new industrial organization economics, (d) dynamic
competition from Schumpeterian and evolutionary economics.
As discussed in theories of the firm, neoclassical economics assumes firms
compete with perfect information and, thus, firm strategy plays little role in firm
performance. The IO perspective and research tradition have provided direct insights to
how firms can obtain competitive advantages through positioning in the context of
industry structure and pursuing strategies appropriate to that structure. However, the IO
literature has been criticized for a lack of attention to internal organizational factors and
its methodological limitation in empirical studies (Grimm, 2006). Game theory, drawn
from the new IO perspective, has been considered a useful tool for investigating a
comprehensive model of competitive advantages as it demonstrates the linkages between
resources, competitive moves and responses, and advantages. However, this theory has
also been criticized for its failure to yield practical solutions to many of the most
important problems of contemporary strategic business management (Singer, 1997).
Finally, theories of dynamic competition from Schumpeterian and evolutionary

25
economics have provided important insights into firm innovation, first-mover advantages,
competitive behavior, as well as a more dynamic view of firm strategy. These theories
distinctively avoid equilibrium and sustainability and, therefore, are considered
particularly applicable for today�s and tomorrow�s fast-paced competitive environments
(Grimm, 2006).
Resource-advantage Theory of Competition
In order to properly explain the process of dynamic firm competition in today�s
market environment, Hunt and Morgan (1995) proposed the resource-advantage (R-A)
theory of competition, combining the resource-based theory of the firm, heterogeneous
demand theory, and theories of dynamic competition from Schumpeterian and
evolutionary economics. Based on the resource-based theory of the firm, R-A theory
views the firm as a seeker of unique, costly-to-copy productive assets to sustain above-
normal returns, emphasizing unique, heterogeneous resources and capabilities (Barney,
1991; Conner, 1991). Consistent with heterogeneous demand theory, R-A theory views
that demand is heterogeneous as consumers� tastes and preferences are significantly
different and, thus, different products and services would be required to satisfy different
group of consumers within the same industry (Alderson, 1957). While rejecting perfect
competition theory from neoclassical economics, R-A theory shares the foundational
premises of the dynamic, disequibrilating, and evolutionary nature of competition with
those of Schumpeterian and evolutionary economics.
Consequently, R-A theory defines firm competition as �a constant struggle among
firms for comparative advantages in resources that will yield marketplace positions of

26
competitive advantage for some market segment(s) and, thereby, superior financial
performance� (Hunt, 2000, p. 136; Hunt & Arnett, 2003; Hunt & Morgan, 1997). Figure
2.1 displays a schematic of the R-A theory of competition. R-A competition is of
particular interest to this study in addressing the research questions.
Figure 2.1. A Schematic of the Resource-Advantage Theory of Competition1
Note. Competition is the disequilibrating, ongoing process that consists of the constant struggle among firms for a comparative advantage in resources that will yield a marketplace position of competitive advantage and, thereby, superior financial performance. Firms learn through competition as a result of feedback from relative financial performance �signaling� relative market position, which, in turn, signals relative resources. 1 From �Resource-Advantage Theory: A Snake Swallowing Its Tail or a General Theory of Competition?� by S.D. Hunt and R.M. Morgan, 1997, Journal of Marketing, 61(October), p. 78. Copyright 1997 by American Marketing Association. Reprinted with Permission from the authors and the American Marketing Association. See Appendix J for Copyrighter�s permission to reprint.
Societal Societal Institutions
Resources ! Comparative advantage ! Parity ! Comparative Disadvantage
Market Position ! Competitive advantage ! Parity ! Competitive Disadvantage
Financial Performance
! Superior ! Parity ! Inferior
Public Policy ConsumersCompetitors-Suppliers

27
R-A theory views firms as �combiners of heterogeneous, imperfectly mobile
resources� (Hunt, 2000, p. 148). Firm resources are defined as �the tangible and
intangible entities available to the firm that enable it to produce efficiently and/or
effectively a market offering that has value for some market segment(s)� (Hunt, 2000, p.
138). Because each firm has different resources or resource assortments (heterogeneous
resources), firms are different in sizes, scope, and performance. Because all firms cannot
have superior resources at the same time and it takes time for resources to transfer from
one firm to another�imperfectly mobile resources�firms would yield different market
positions, thereby, different performance. In other words, each firm consists of different
or a different mix of resources. This difference in resources would result in different
competitive positions in marketplace. If a firm has more advantages in its resources
compared to its competitors, the firm would be more competitive, thus more likely to
achieve superior financial performance. If a firm has disadvantages in its resources, the
firm would be less competitive, thus less likely to achieve superior financial performance.
As per R-A theory, the differences among various firms� resources can be
explained by the differences in the life span of its associated resources. Internally, a
firm�s comparative (or relative) advantage in resources can be dissipated, weakened, or
wasted (a) by simply failing to reinvest or continue reinvesting, (b) by failing to
recognize or understand the sources of the firm�s superior financial performance, and/or
(c) by failing to adjust the firm�s resources or assortment of resources in response to a
changed environment. Externally, a firm�s comparative (or relative) advantage in
resources can be enhanced, neutralized, or destroyed (a) by changes in societal resources

28
and institutions; and/or (b) by the actions of consumers, government, suppliers, or
competitors.
Relative advantages in firm resources do not guarantee better performance. Firms
must produce superior value with their resources. Competitive advantages in R-A theory
of competition are composed of the firm�s relative value produced by its resources and
the relative resource costs for producing such value. Values are the benefits that
consumers perceive from particular products or services that the firm offers. If a firm has
an efficiency advantage due to its lower production costs or its products� superior value,
it is expected to generate superior financial returns. If a firm has positions of competitive
disadvantage due to its higher production costs or its products� inferior value, it is
expected to produce inferior returns.
The feedback loops in Figure 2.1 highlight that firms learn by competition itself
as a result of feedback from relative financial performance, signaling relative market
position, which in turn signals relative resources. With this learning process, firms then
would have different resources or a different mix of resources. Additionally, because not
all firms can have superior performance at the same time, firm resources or a different
mix of firm resources are constantly changing and, thus, there is no end-stage, only a
never-ending process of change in R-A competition.
External environments also play an important role in R-A competition. A firm�s
environment influences its resources and competitive market position, thereby, ultimately
its performance. R-A theory of competition indicates six important environmental factors,
including the societal resources on which the firm draws, the societal institutions that

29
dominate the market in which the firm operates, the actions of competitors, the actions of
suppliers, the behaviors of consumers, and public policy decisions.
In sum, R-A theory argues that a firm�s (combiner of resources) market position is
an outcome of firm resource management. Firm resources include tangible and intangible
elements, such as capabilities and skills embedded in the people, teams, relations, or
networks available to the firm. These resources are combined in very complex ways to
produce unique firm strategies, actions, and responses and the way the firm responds to
its environments. Based on this explanation, R-A theory offers an excellent opportunity
for a realistic and relevant explanation of the market competition to which AIIs have
responded.
Market Environment
Role of Environment on Firm Performance
As the R-A theory of competition recognizes and emphasizes the role of
environment on firms� resources, strategies, and actions, the external environment has
been considered a major source of contingencies that a firm must manage (Hunt, 2000;
Tosi & Slocum, 1984). The role of environment has been well discussed in the strategy,
marketing, management, and organizational behavior literature. Traditionally, many
researchers have viewed the external environment as a given, or a set of conditions to
which the firm can only react or adjust and, thus, a key determinant of the firm�s decision
making processes and activities (Morris, Shindehutte, & LaForge, 2002). This
perspective of the firm environment is based on a key underlying assumption of
neoclassical economic theories, that is, stable, static, homogeneous, and equilibrium-

30
provoking environments strictly determine firms� conduct and performance (Hunt, 2000;
Hunt & Arnett, 2003).
For example, with regard to the impact of environment on a firm�s conduct,
Fredrickson and his colleagues argued that certain conducts of the firm were essentially
determined by environmental characteristics (Fredrickson, 1984; Frederickson & Iaquinto,
1989; Fredrickson & Mitchell, 1984). According to them, a firm�s rational
comprehensive processes would only work in stable environments, not in dynamic
environments because a time-consuming rational comprehensive process are simply
inappropriate as data are not available, relationships are not obvious, and the future is
unpredictable in a fast-changing dynamic or uncertain environment. With regard to the
impact of environment on the firm�s performance, Kotha and Nair (1995) found that
certain environmental characteristics, such as environmental munificence, positively
related to both firms� return on sales and growth. In addition, the increasing number of
import activities within the Japanese machinery industry negatively impacted domestic
Japanese machinery firms� performance.
On the other hand, some researchers have recently taken the opposite view of
market environment�the explanatory or moderating role of firm environments on firms�
conduct and performance�suggesting that firm environments are direct antecedents to
firm performance. For example, Miller and Friesen (1982) argued that the more dynamic,
competitive, and diverse the environment, the greater the need for innovation and the
more likely it is that firms would be innovative. Similarly, Goll and Rasheed (1997)
supported the moderating roles of environmental munificence and dynamism in the
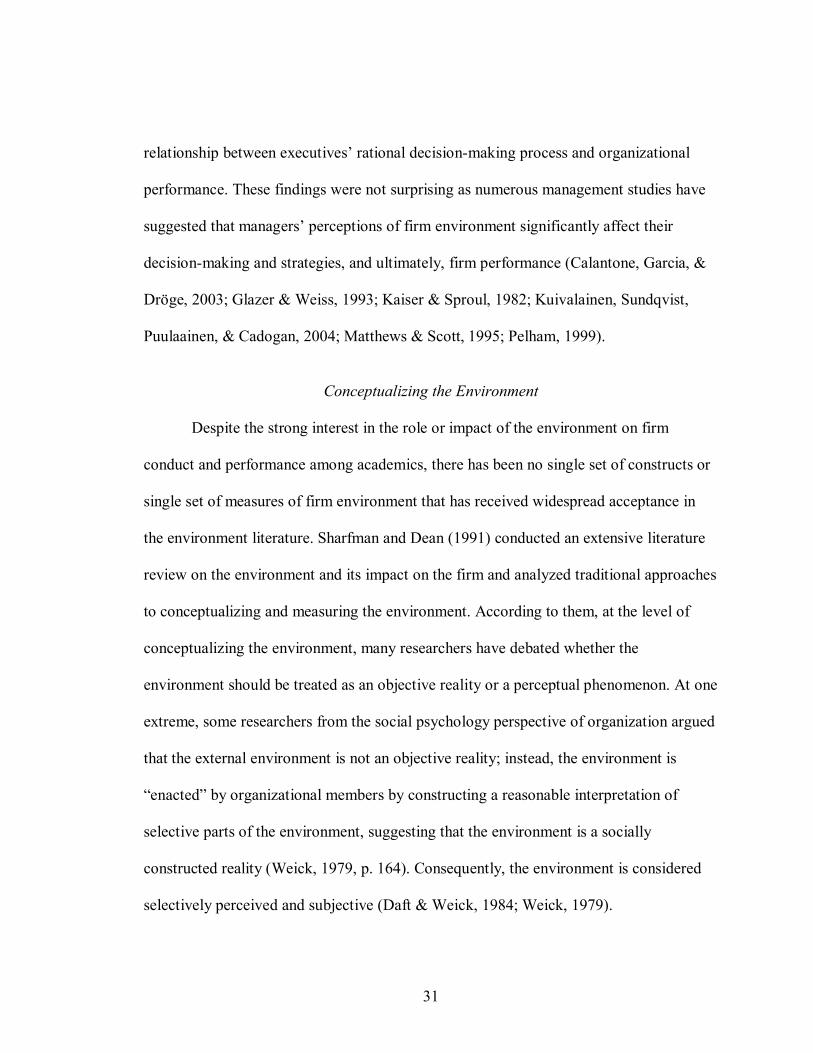
31
relationship between executives� rational decision-making process and organizational
performance. These findings were not surprising as numerous management studies have
suggested that managers� perceptions of firm environment significantly affect their
decision-making and strategies, and ultimately, firm performance (Calantone, Garcia, &
Dröge, 2003; Glazer & Weiss, 1993; Kaiser & Sproul, 1982; Kuivalainen, Sundqvist,
Puulaainen, & Cadogan, 2004; Matthews & Scott, 1995; Pelham, 1999).
Conceptualizing the Environment
Despite the strong interest in the role or impact of the environment on firm
conduct and performance among academics, there has been no single set of constructs or
single set of measures of firm environment that has received widespread acceptance in
the environment literature. Sharfman and Dean (1991) conducted an extensive literature
review on the environment and its impact on the firm and analyzed traditional approaches
to conceptualizing and measuring the environment. According to them, at the level of
conceptualizing the environment, many researchers have debated whether the
environment should be treated as an objective reality or a perceptual phenomenon. At one
extreme, some researchers from the social psychology perspective of organization argued
that the external environment is not an objective reality; instead, the environment is
�enacted� by organizational members by constructing a reasonable interpretation of
selective parts of the environment, suggesting that the environment is a socially
constructed reality (Weick, 1979, p. 164). Consequently, the environment is considered
selectively perceived and subjective (Daft & Weick, 1984; Weick, 1979).

32
Agreeing that it is managers� perceptions on the environment that shape their
decisions, several researchers focused on how these managerial perceptions are formed to
explain how these managers make their decisions (Duncan, 1972; Lawrence & Lorsch,
1967). These studies were, however, later disputed by other studies showing managers�
perceptions and objective measures of the environment were, in fact, little related
(Downey, Hellreigel, & Slocum, 1975; Tosi, Aldag, & Storey, 1973). For example,
Aldrich (1979) argued that managers� perceptions often over-generalize their isolated
environmental events, interpreting them as the overall state of the market environment,
and, thus, may bias their perceptions of the environment.
There have been a few attempts to integrate perceptual and objective perspectives
of the environment into a single framework (for example, Tung, 1979). Among those,
Aldrich�s (1979) classification of environmental dimensions became the most influential,
particularly, in pursuit of measures of the objective environment. His classification
assumed the existence of an objective environment and, thus, it was possible for
researchers to make predictions about its impact on the firm. His classification was
attractive for strategy researchers whose mission was to measure and predict the role of
the environment on firm behavior. Dess and Beard (1984) later developed a set of
measures of the objective environment and these measures, in turn, became the primary
basis for later research, examining the relationship between the firm and its environment.
Most recently, Sharfman and Dean (1991) refined and extended Dess and Beard�s
objective measures by incorporating objective measures with managerial perceptions and

33
developing a set of conceptualizations and objective measures of the environment that
would be more consistent with existing theory as well as with managerial perceptions.
Multidimensional Concept of the Environment
Sharfman and Dean (1991) identified three most widely used terms or dimensions
to describe the key characteristics of the environment: complexity, dynamism, and
resource scarcity. Complexity refers to the number and heterogeneity or diversity of
factors and components in the environment with which the firm has to deal in decision
making (Dess & Beard, 1984; Tung, 1979). The terms, heterogeneity or diversity, are
related to complexity. Instability or dynamism refers to the rate and unpredictability of
environmental change (Dess & Beard, 1984). The terms, turbulence, uncertainty, or
routineity are related to dynamism. Resource availability refers to the level of resources
available in the environment (Sharfman & Dean, 1991). The terms, hostility, munificence,
and capacity, are related to resource availability.
In addition to the various, inconsistent usage of terms to describe the environment,
these environment researchers had a tendency to use a different mix of dimensions to
explain and measure the environment. For example, March and Simon (1958) used a
single dimension, resource munificence, of the environment in their research. Thompson
(1967) used two dimensions to describe the environment: heterogeneity/homogeneity and
stability/dynamism. Child (1972) used three dimensions of the environment: complexity,
variability, and illiberality. The three dimensions of the environment used by Child
appeared to be the most accepted among researchers. Recently, Sharfman and Dean
(1991) refined and extended Dess and Beard�s (1984) three dimensional measures of the

34
environment�complexity, dynamism, and competitive threat. According to them, these
measures provided a sufficient predictive power given that their measures accounted for
approximately 38% of the variance in their set of industry performance variables.
Although extant dimensions provided important characteristics of the
environment, they tended to focus on the rate of unpredictable change (for example,
turbulence and dynamism) or the range of uncertain and ambiguous information (for
example, complexity). Consequently, even when the three major dimensions are
combined, they still seem to fail to capture another important facet of the environment. In
response, Dyer and Ha-Brooskhire (in press) introduced a new dimension of the
environment�acceleration. The authors defined acceleration as the environmental
characteristic describing predictable, but accelerated, business cycles. Acceleration of the
business cycle could be said to be an issue for most business concerns dealing with
today�s technology changes, consumer demands, global competition, and a host of factors
that have created time pressures. According to the authors, hyper-dynamism describes the
unique nature of a market environment that incorporates high levels of the three
established dimensions of environment�complexity, dynamism or turbulence, and
competitive resource availability�but also includes the new dimension of acceleration,
defined as the speed of predictable business cycles. Hyper-dynamism includes a heady
blend of all of the chaotic elements that contribute to the modern business environment�
but at hyper-speed. Table 2.1 displays the major dimensions of the environment that have
been found in the current literature.

35
Table 2.1. Dimensions of the Environment2
Terms
Definitions Complexity:
Complexity
The number and heterogeneity or diversity of factors and components in the environment that the focal unit has to contend with in decision making (Dess & Beard, 1984; Tung, 1979). Related terms include heterogeneity (Aldrich, 1979; Thompson, 1967) and diversity (Mintzberg, 1979).
Turbulence: Turbulence (1) The high rate of inter-period change (in magnitude and/or direction)
in the �levels� or values of key environmental variables; and (2) the extent of uncertainty and unpredictability as to the future values of these variables (Dess & Beard, 1984; Glazer & Weiss, 1993).
Dynamism The rate and unpredictability of environmental change (Dess & Beard, 1984).
Routineity The consistency of variability and analyzability of the stimuli confronting the organizational unit (Tung, 1979).
Uncertainty The firm�s inability to understand or to predict the state of the environment due to a lack of information or a lack of understanding of the interrelationships among environmental elements (Milliken, 1987; Matthews & Scott, 1995).
Resource availability:
Hostility
Intense competition for scarce environmental resources (Mintzberg, 1979). Related terms include illiberality (Child, 1972) and competitive threat (Sharfman & Dess, 1991).
Munificence
The extent to which environmental resources can support sustained growth of an organization based on resource availability (Aldrich, 1979; Dess & Beard, 1984). Related terms include capacity (Aldrich, 1979).
Acceleration:
Acceleration The speed of predictable business cycles (Dyer & Ha-Brookshire, in press).
2 From �Apparel Import Intermediaries� Secrets to Success: Redefining Success in a Hyper-dynamic Environment,� by B. Dyer and J.E. Ha-Brookshire, in press. Copyright 2007 by Emerald Group Publishing, Limited. Reprinted with permission of the authors.
36
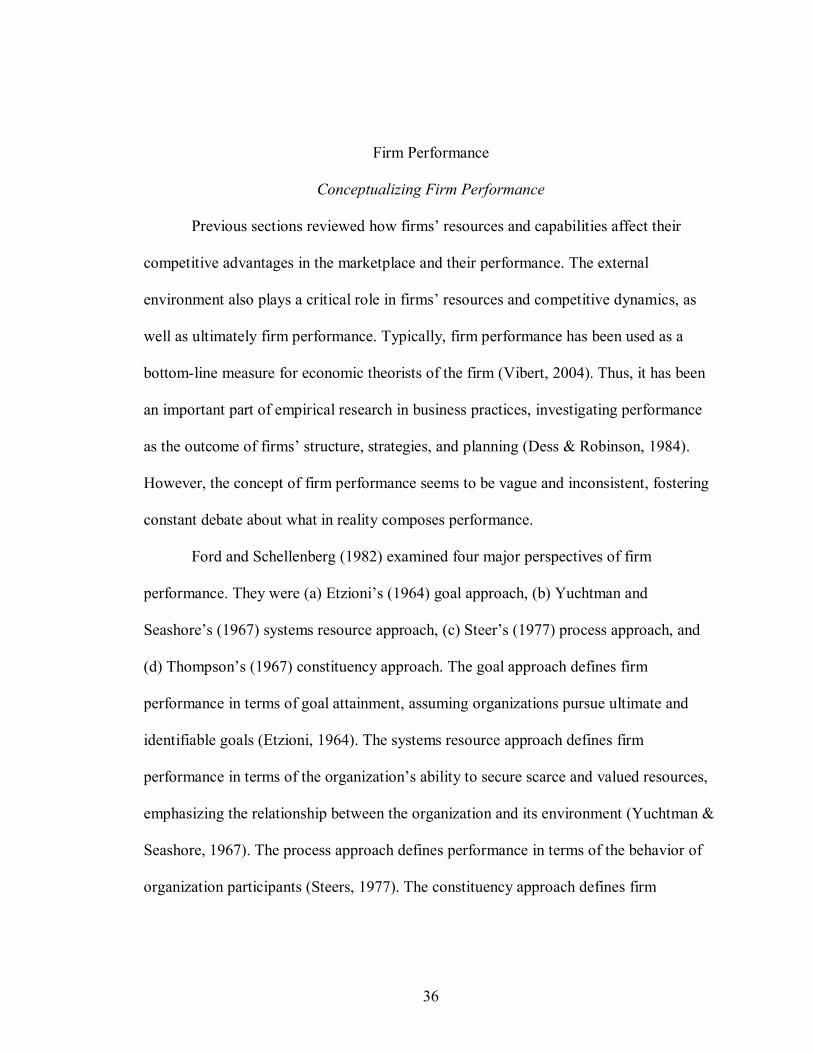
Firm Performance
Conceptualizing Firm Performance
Previous sections reviewed how firms� resources and capabilities affect their
competitive advantages in the marketplace and their performance. The external
environment also plays a critical role in firms� resources and competitive dynamics, as
well as ultimately firm performance. Typically, firm performance has been used as a
bottom-line measure for economic theorists of the firm (Vibert, 2004). Thus, it has been
an important part of empirical research in business practices, investigating performance
as the outcome of firms� structure, strategies, and planning (Dess & Robinson, 1984).
However, the concept of firm performance seems to be vague and inconsistent, fostering
constant debate about what in reality composes performance.
Ford and Schellenberg (1982) examined four major perspectives of firm
performance. They were (a) Etzioni�s (1964) goal approach, (b) Yuchtman and
Seashore�s (1967) systems resource approach, (c) Steer�s (1977) process approach, and
(d) Thompson�s (1967) constituency approach. The goal approach defines firm
performance in terms of goal attainment, assuming organizations pursue ultimate and
identifiable goals (Etzioni, 1964). The systems resource approach defines firm
performance in terms of the organization�s ability to secure scarce and valued resources,
emphasizing the relationship between the organization and its environment (Yuchtman &
Seashore, 1967). The process approach defines performance in terms of the behavior of
organization participants (Steers, 1977). The constituency approach defines firm

37
performance based on the fulfillment level of the firm�s internal and external
constituencies� needs (Thompson, 1967).
Though each of these perspectives has advantages in explaining firm performance,
each has been criticized for uni-dimensionality. Instead, Connolly, Conlon, and Deutsch
(1980) have proposed a multiple constituency approach to firm performance, highlighting
multiple and subjective evaluative criteria, both directly and indirectly associated with the
firm. Under this view, the firm is an open system and a coalition of diverse constituencies,
each possessing different levels of performance expectations for continued membership
in the coalition. Supporting this, Ambler and Kokkinaki (1997, p. 665) concluded, after
reviewing success-related articles in the recent leading marketing journals, that �success
is both particular, against specific objectives, and subjective, in the sense of who selects
which goals and which performance benchmarks.� This statement suggests a wide-spread
acceptance of the multi-dimensional approach to firm performance in the firm
performance literature.
Measuring Firm Performance
Despite its complex and multidimensional nature, most researchers have used
economic or financial indicators to measure firm performance. Return on assets and
growth in sales have been two of the most popular economic measures in the literature
(Dess & Robinson, 1984). When it comes to multi-industry firms and private firms, it is
especially harder to evaluate firm performance due to complicated methodological and
data availability issues. As per Dess and Beard (1984), the biggest problems in assessing
firm performance in smaller, privately-held firms are the lack of specificity to define

38
�success� or �failure,� and the difficulty of obtaining performance data. Even if the data
are available, their uncertain accuracy is more problematic due to possible errors in
accounting procedures. Thus, the authors suggested subjective measures along with
economic measures for broader dimensions of firm performance. They empirically
showed that subjective measures were sufficient in evaluating firm performance when
economic dimensions were not available.
As international business becomes intensified, a focus on export performance has
also been on the rise in the literature during the last three decades. It is not surprising that
export performance scholars have had similar dilemmas with regard to objective
measures of export performance. Aaby and Slater (1988) reviewed 55 empirical studies
on export performance in the management literature published from 1978 to 1988 and
reported that the most commonly used dimensions of export performance were rate of
growth in export sales and percentage of total sales. There were also other variables such
as propensity to export, export problems, level of exports, perceptions toward exports, or
barriers to export, yet these measures alone were just intermediate indicators of export
performance, not explaining sustained profitability. Consequently, in their conclusions,
Aaby and Slater called for a multiple criteria model of export performance that would
allow effects on different types of performance measures within the organization.
Encouraged by Aaby and Slater, Cavusgil and Zou (1994) criticized previous
studies that operationalized performance in terms of sales or profits, without any
consideration of a firm�s strategic and competitive goals. The authors defined exporting
as �a firm�s strategic response to the interplay of internal and external forces given

39
intense international competition,� and concluded the strategic dimension is critical to
assess export performance (p. 2). Several scholars followed Cavusgil and Zou�s argument
and applied the strategic dimension along with an economic measure to capture export
performance (Bello et al., 2003; Morgan et al., 2004; Richey & Myers, 2001).
Consequently, though economic and financial measures have been the most popular in
assessing firm performance, firms� subjective or strategic measures are also considered
necessary or often sufficient for various purposes of performance evaluation, particularly
when assessing small, privately-held firms and export firms.
Up to this point, the study has reviewed a general understanding of theories of the
firm, theories of competition, market environment, and firm performance with the goal of
drawing an integrative theoretical model of AIIs� capabilities, competitive advantages,
and performance in a hyper-dynamic market environment. These topics provided
important foundations to understand the characteristics of the global apparel industry and
investigate the nature and the behavior of AIIs within the global apparel supply chain.
Theories of the firm, particularly the resource-based view of the firm, helped to
conceptualize AIIs as a combiner of critical firm resources. Theories of competition,
particularly the resource-advantage theory of competition, offered a theoretical
framework for the context and the process of AIIs� competition. The market environment
literature helped to recognize the unique nature of the accelerating apparel business cycle
and analyze the new apparel market environment as a multi-dimensional concept�hyper-
dynamism. Finally, firm performance studies provided opportunities to investigate
performance outcomes in multiple perspectives, unlike the traditional view of firm�

40
performance that is highly centered on economic bottom-line measures. With this
understanding, the next sections discussed the key characteristics of today�s global
apparel industry and the nature and the behavior of apparel import intermediaries in more
details.
The Global Apparel Industry
The apparel industry has played a unique and key role in the development of
world trade as one of the initial industries driving the industrial revolution in the
eighteenth and nineteenth centuries in Britain and Western Europe (Dicken, 2003). The
simple technologies and low-skill labor requirements of the apparel manufacturing
process have rendered it perfectly suited to the early stages of industrialization and,
consequently, the geographical concentration of production has spread quickly from
industrialized countries to newly industrializing countries (Alder, 2004; Dicken, 2003;
Scheffer & Duineveld, 2004; Taplin & Winterton, 2004). Ultimately, the apparel industry
has become the most geographically dispersed of all industries (Appelbaum &
Christerson, 1997). This unique nature of the apparel industry and its environment offer
an excellent opportunity to learn extant firms� or newly created firms� behavior and
performance in a changed market environment due to globalization. Supporting this,
Bonacich, Cheng, Chinchilla, Hamilton, and Ong (1994, p. 13) argued that they �predict
that many of the methods used in the globalization of apparel production will be followed
by other industries, and thus the apparel industry may be a portent of things to come.�

41
Reordering of the Global Apparel Industry
The world apparel market accounted for $276 billion in trade in 2005�a number
that captures its economic importance but does little to express the industry�s upheaval in
terms of growth and geographic relocation; that is, apparel trade volume in recent years
has increased tremendously and production has shifted significantly in geographic
location (Appelbaum & Christerson, 1997; WTO, 2006). In 1963, world apparel trade
was $2.2 billion with only 14% of dollar volume generated by developing economies. By
2005, however, 47% of world apparel products were exported by just four leading
exporters, all of which were developing economies: China, Turkey, India, and Mexico
(WTO, 2006).
Today, two distinctive patterns have emerged (a) the dominance of Chinese
apparel exports and (b) the United States� role as the largest single apparel importer in the
world. As per the World Trade Organization (2006), from 1980 to 2003, China�s portion
of world apparel exports grew from 4% to 29% (if Hong Kong�s domestic exports are
excluded), while the U.S. portion of world apparel imports increased from 16% to 28%.
In particular, the United States imported up to $80 billion of apparel products in 2005.
Although some domestic retailers like Wal-Mart and Target import apparel on their own,
many retailers rely on other apparel import intermediary firms to source apparel for them
from foreign manufacturers (Ellis, 2007).
These changes in the world apparel industry have been partly due to rapid
advances in information technology. While the production technology in apparel
manufacturing processes has changed little, still requiring labor-intensive and labor-cost

42
sensitive operations, the socio-economic environment of the apparel industry has been
revolutionized (Alder, 2004; Appelbaum & Christerson, 1997; Jones & Hayes, 2004).
The innovations in information technology such as electronic communication or
electronic point-of sale inventory systems have provided retailers with a great deal of
flexibility in responding to rapid market changes and have enabled suppliers to expand
their manufacturing activities to virtually anywhere, ultimately, turning the apparel
industry into one of the most economically integrated industries across the world�s
trading entities (Alder, 2004; Appelbaum & Christerson, 1997; Dicken, 2003).
Changes in the European and the U.S. Apparel Industries
With regard to the European apparel industry, Taplin and Winterton (2004, p.
257) described the response to such shifts as �restructuring and reconfiguration� of the
industry. That is, job losses or decline in high-wage economies such as the European
Union has flown into new job growth or development, often in distant low-wage
economies. For example, Jones and Hayes (2004, p. 273) argued that the U.K. apparel
industry has transitioned to �more traditionally male-oriented jobs,� including product
development, market research, design, buying, importing, sourcing, advertising, and
promotion. Similarly, Alder (2004, p. 313) stressed that the Germen apparel firms have
become �service-oriented clothing enterprises,� focusing on organization, qualifications,
co-operation, and communication as a result. In this vein, Scheffer and Duineveld (2004)
emphasized that wholesaling and retailing have become much more important activities
within the Dutch apparel industry as clothing companies have been forced from a
manufacturing orientation to a design orientation.

43
The U.S. apparel industry has not been an exception to this worldwide structural
transition (Baughman, 2004; Cline, 1990). Although the U.S. apparel industry has
received comprehensive and consistent protection by the U.S. government for in the three
decades (Cline, 1990), substantial efforts by both government law makers and industry
advocates have been unable to prevent the transformation of the United States from one
of the world�s largest apparel producers and exporters to the world�s largest apparel
importer (WTO, 2006). Naturally, these changes have forced U.S. apparel firms to
assume different roles in the global apparel supply chain.
Hyper-dynamic Environment of the U.S. Apparel Industry
Ever increasing number of imported apparel products in the United States, intense
global competition, and strong consumerism in the U.S. apparel industry has led to a
hyper-dynamic market environment that today�s apparel firms must face (Dyer & Ha-
Brookshire, in press). The U.S. apparel industry is typically characterized by rapid
technology change in capital investments and communication management, increasing
information intensity, extremely short production cycles, myriad small batch production
demands, and fragmentation of businesses processes. This environment has been fueled
by globalization of production, language and culture management, and legal and ethical
matters. In addition, the U.S. apparel industry presents a uniquely challenging
environment where, next to the food industry, firms must respond to the shortest product
life cycles of any consumer products with punishing business cycles driven by the
standard eight, and possibly up to monthly, market seasons (Michelle, 2004).
Consequently, the U.S. apparel industry clearly provides a unique market environment,

44
incorporating high levels of complexity, dynamism or turbulence, competitive resource
availability, and accelerated business cycles�hyper-dynamism. This hyper-dynamic
market environment in the global apparel industry has set the stage for
assumption/transformation of the activities performed by apparel firms.
Apparel Import Intermediaries
One of the most significant responses that the U.S. apparel industry has made to
its hyper-dynamic market environment can be said to be the development and growth of
intermediary firms who help domestic clients perform successful import transactions.
This study defined apparel import intermediaries (AIIs) as domestic apparel service firms
that link domestic wholesalers/retailers and foreign distributors/manufacturers to
facilitate import transactions in the global apparel supply chain (Ha-Brookshire & Dyer,
2006). Figure 2.2 describes a �new� market environment characterized by intense global
competition, consumerism, and highly fragmented processes that have created a market
vacuum to which apparel firms must respond. These transformational forces and
consequent shifts in firm responsibilities reflect the new market needs, implying that new
market needs may not be efficiently or effectively addressed by the old market structure,
that is, by the previous roles of extant domestic retailers, foreign manufacturers,
wholesalers, or other intermediary firms.

45
Figure 2.2.
Changed Roles of U.S. Apparel Firms in a New Market Environment3
3 From �Apparel Import Intermediaries: The Impact of a Hyper-dynamic Environment on U.S. Apparel Firms,� by J.E. Ha-Brookshire and B. Dyer, 2006. Adapted with permission of the authors.
Defining the Apparel Import Intermediary Issues Involving U.S. Government Descriptions and Classification Schemes
Despite the reordering of the global apparel industry and consequent changed
roles of apparel firms, identifying AIIs and grasping their economic contributions in the
U.S. apparel industry seem to be extremely difficult. That is partly because governments
and trade organizations (for example, WTO) track the movements of apparel trade around
the world, however, the data picture available on apparel product movement once inside
U.S. borders is not readily available. Two major reasons for this are: (a) description
issues clouding government classifications and (b) misclassifications occurring due to
New Market Conditions
▪ Global manufacturing ▪ Intense competition ▪ Fragmented process ▪ Strong consumerism
Industry Response
Changed role of apparel firms
Transformation
Market Vacuum
Old Market Conditions
▪ Domestic manufacturing ▪ Light competition ▪ Consolidated process ▪ Weak consumerism

46
firms� misperceptions of their own identities. Particularly, the U.S. government uses the
term, wholesaler when identifying and tracking intermediary firms domestically. Table
2.2 presents various types of businesses and descriptions of each business type as defined
by the U.S. Census Bureau (2005a, 2005c).
Table 2.2.
Wholesaler and Retailer Descriptions by the U.S. Census Bureau4
Business Type
Description
Wholesaler (NAICS 42)
Engaged in wholesaling merchandise, generally without transformation, and rendering services incidental to the sale of merchandise. Wholesalers are organized to sell or arrange the purchase or sale of (a) goods for resale to other wholesalers or retailers, (b) capital or durable nonconsumer goods, or (c) raw or intermediate materials or supplies used in production (U.S. Census Bureau, 2005c, p. B-1).
Merchant wholesaler (or wholesale distributor)
Primarily buys and sells on its own account (takes title to goods) for resale, including jobber, distributor, own-brand marketer, and own-brand importer/exporter (U.S. Census Bureau, 2005a, 2005c).
Manufacturers� sales branch or sales office
Primarily buys or sells goods manufactured in the United States. It may or may not take title to goods (U.S. Census Bureau, 2005a, 2005c).
Merchandise agent, broker, or electronic market
Primarily buys or sells goods for others on a commission basis. It does not take title to goods (U.S. Census Bureau, 2005a).
Retailer (NAICS 44-45) Engaged in retailing merchandise, generally without transformation, and rendering services incidental to the sale of merchandise. Retailers are organized to sell merchandise in small quantities to the general public (U.S. Census Bureau, 2005b, p. B-1).
4 From �Apparel Import Intermediaries: The Impact of a Hyper-dynamic Environment on U.S. Apparel Firms,� by J.E. Ha-Brookshire and B. Dyer, 2006. Adapted with permission of the authors.
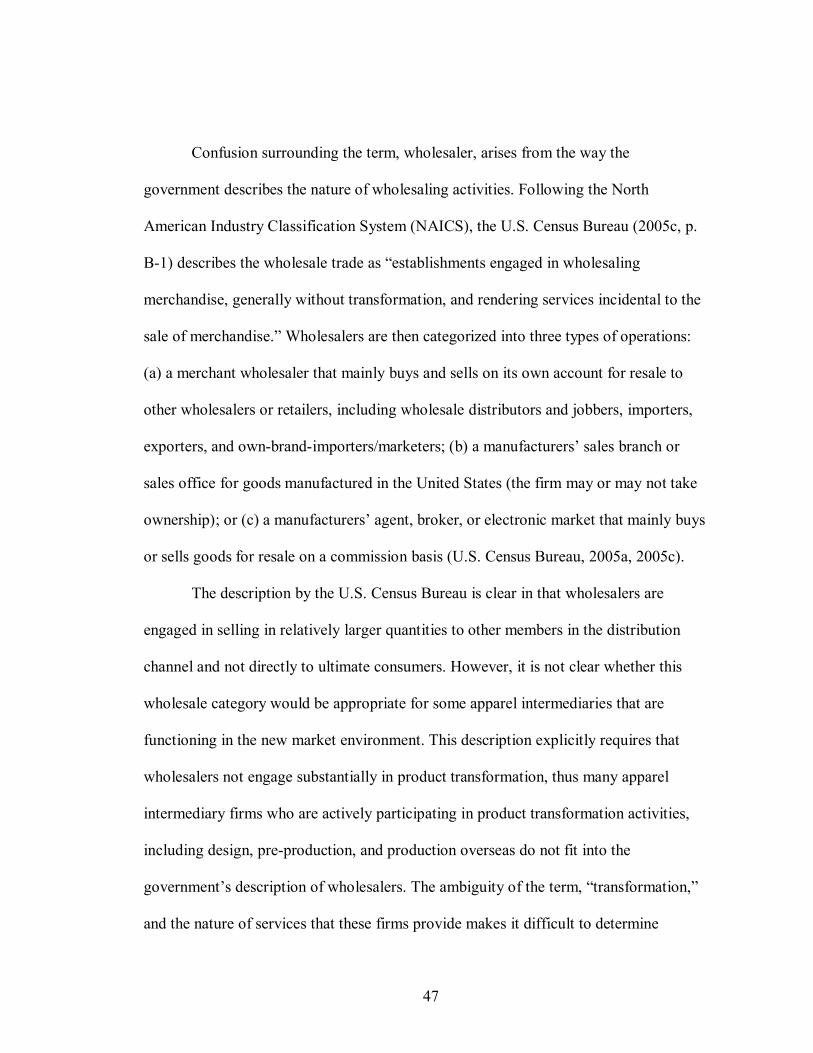
47
Confusion surrounding the term, wholesaler, arises from the way the
government describes the nature of wholesaling activities. Following the North
American Industry Classification System (NAICS), the U.S. Census Bureau (2005c, p.
B-1) describes the wholesale trade as �establishments engaged in wholesaling
merchandise, generally without transformation, and rendering services incidental to the
sale of merchandise.� Wholesalers are then categorized into three types of operations:
(a) a merchant wholesaler that mainly buys and sells on its own account for resale to
other wholesalers or retailers, including wholesale distributors and jobbers, importers,
exporters, and own-brand-importers/marketers; (b) a manufacturers� sales branch or
sales office for goods manufactured in the United States (the firm may or may not take
ownership); or (c) a manufacturers� agent, broker, or electronic market that mainly buys
or sells goods for resale on a commission basis (U.S. Census Bureau, 2005a, 2005c).
The description by the U.S. Census Bureau is clear in that wholesalers are
engaged in selling in relatively larger quantities to other members in the distribution
channel and not directly to ultimate consumers. However, it is not clear whether this
wholesale category would be appropriate for some apparel intermediaries that are
functioning in the new market environment. This description explicitly requires that
wholesalers not engage substantially in product transformation, thus many apparel
intermediary firms who are actively participating in product transformation activities,
including design, pre-production, and production overseas do not fit into the
government�s description of wholesalers. The ambiguity of the term, �transformation,�
and the nature of services that these firms provide makes it difficult to determine

48
whether they are wholesalers or not. In addition, the term, wholesalers, is generally
associated with firms who simply buy and resell goods at a profit without any value-
added activities unlike many of today�s apparel intermediary firms. In this light,
Scheffer and Duineveld (2004, p. 344) argued that �the term wholesaling
underestimates the importance of design, branding, marketing and logistics.�
Another source of confusion surrounding the term, wholesaler, results from firms�
misperceptions of their own identities. In particular, it appears that many apparel firms
might inaccurately classify themselves as manufacturers despite their heavy reliance on
import operations. For example, Baughman (2004) laid out the current status of apparel
firms� domestic manufacturing activities and argued that all of the 14 leading U.S.
apparel firms that are currently classified as manufacturers (NAICS 315) are, in fact,
importing or sourcing their products for domestic sales. VF Corporation, the second
largest U.S. apparel firm, reported $5.2 billion of net apparel sales in 2003. Yet, 95% of
their products sold in the United States were imported. Similarly, Phillips-Van Heusen
Corporation, Russell Corporation, and Oxford Industries, Inc. also reported that 93%,
99%, and 97% of their merchandise sold in the United States, respectively, was imported
in 2003. As per the most recent economic census conducted in 2002, the apparel
manufacturing sector (NAICS 315) accounted for $44.5 billion, while the apparel
wholesale trade was over $106 billion, approximately twice as large as the apparel
manufacturing industry in the United States (U.S. Census Bureau, 2005d, 2005e).

49
Issues Involving Academics� and Practitioners� Terms
In identifying and tracking intermediary firms, academics and some business
practitioners often do so based on what firms do, especially relative to doing business
with those firms. Consequently, a range of confusing terms has arisen among academics
and practitioners describing the set of firms who play intermediary roles in the supply
chain. Table 2.3 clarifies various terms for intermediaries that are commonly used by
academics and practitioners.
Importer is one of the most commonly used terms for firms that bring goods or
services into the country from abroad (Soanes & Stevenson, 2004). However, the term,
importer, might be too broad for some of today�s apparel intermediary firms, given that
the term importer may include both an import retailer (selling goods directly to
consumers) and an import wholesaler (selling goods to other wholesalers or retailers). A
similar problem occurs with the term �marketeer,� offered by Applebaum and Gereffi
(1994, p. 44) to describe many of today�s firms that design, market, and sell their
products, yet do not own any factories domestically�firms such as Nike, The Gap,
Reebok, and Liz Claiborne. This term creates ambiguity as it focuses on firms� functions
as brand marketers and does not differentiate among firm types. For example, The Gap is
an import retailer; however, Liz Claiborne may be classified as either an import
wholesaler or an import retailer.

50
Table 2.3.
Commonly Used Academic and Practitioner Terms for Intermediaries5
Business Type
Definition/Description
Importer
Any firm that brings goods or services into the country from abroad (Soanes & Stevenson, 2004).
Import/export merchant Merchant wholesaler engaged in import/export trades (adopted from U.S. Census Bureau, 2005c).
Import/export agent or broker
Merchandise agent or broker in import/export trades (adopted from U.S. Census Bureau, 2005c).
Import retailer
Retailer who imports goods for the purpose of domestic retailing activities (adopted from U.S. Census Bureau, 2005b).
Jobber
A dealer in shares or commodities who holds a stock of the asset and trades as a principal (Lehman & Phelps, 2002). As per U.S. Census Bureau (2005), a jobber is classified as a merchant wholesaler.
Marketeer
Any firm that designs, markets, and sells products without owning factories, such as Nike, The Gap, Reebok, and Liz Claiborne (Applebaum & Gereffi, 1994).
Trading company
Any firm that buys and sells goods, currency, or stocks (McKean, 2005).
5 From �Apparel Import Intermediaries: The Impact of a Hyper-dynamic Environment on U.S. Apparel Firms,� by J.E. Ha-Brookshire and B. Dyer, 2006. Adapted with permission of the authors.
The term, apparel jobber, appears to be one of the most confusing terms used in
the apparel industry as every group seems to have a different �take� on what these firms
do. Olsen (1978, p. 99) described some apparel jobbers as performing design, sampling,
and marketing activities, representing �the entrepreneurial functions of a normal
manufacturing operation.� However, he also stated that many jobbers are mainly engaged
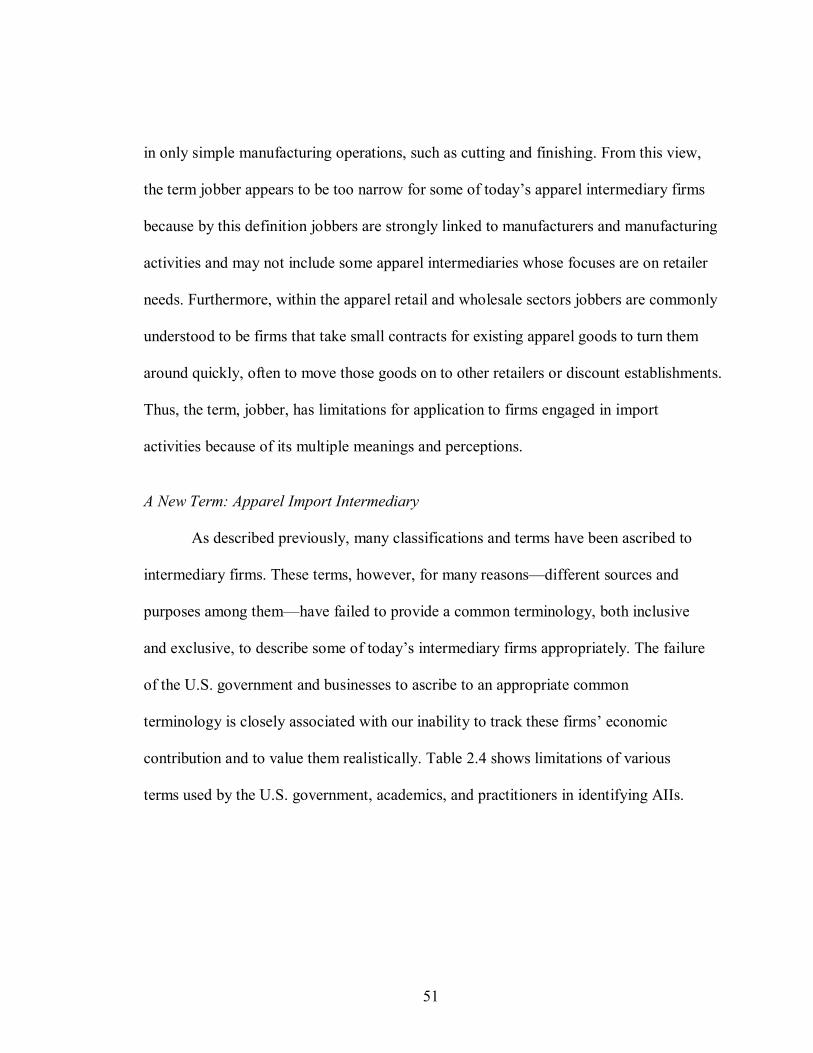
51
in only simple manufacturing operations, such as cutting and finishing. From this view,
the term jobber appears to be too narrow for some of today�s apparel intermediary firms
because by this definition jobbers are strongly linked to manufacturers and manufacturing
activities and may not include some apparel intermediaries whose focuses are on retailer
needs. Furthermore, within the apparel retail and wholesale sectors jobbers are commonly
understood to be firms that take small contracts for existing apparel goods to turn them
around quickly, often to move those goods on to other retailers or discount establishments.
Thus, the term, jobber, has limitations for application to firms engaged in import
activities because of its multiple meanings and perceptions.
A New Term: Apparel Import Intermediary
As described previously, many classifications and terms have been ascribed to
intermediary firms. These terms, however, for many reasons�different sources and
purposes among them�have failed to provide a common terminology, both inclusive
and exclusive, to describe some of today�s intermediary firms appropriately. The failure
of the U.S. government and businesses to ascribe to an appropriate common
terminology is closely associated with our inability to track these firms� economic
contribution and to value them realistically. Table 2.4 shows limitations of various
terms used by the U.S. government, academics, and practitioners in identifying AIIs.
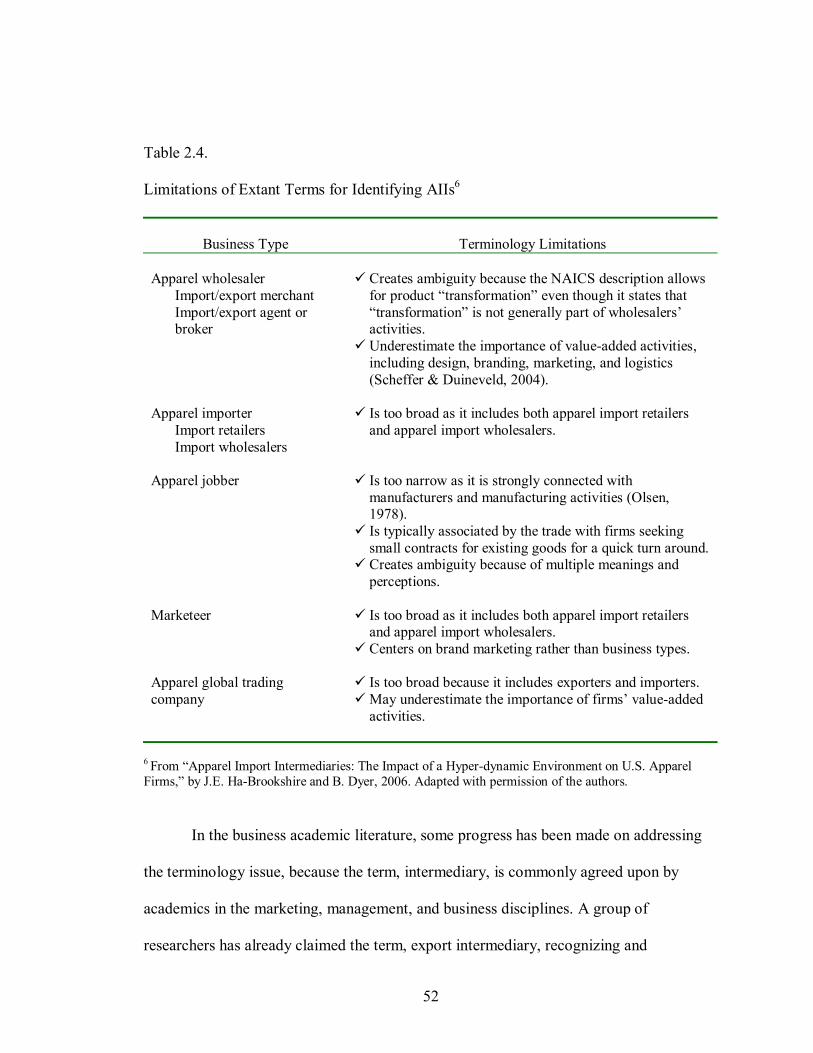
52
Table 2.4.
Limitations of Extant Terms for Identifying AIIs6
Business Type
Terminology Limitations
Apparel wholesaler
Import/export merchant Import/export agent or broker
" Creates ambiguity because the NAICS description allows
for product �transformation� even though it states that �transformation� is not generally part of wholesalers� activities.
" Underestimate the importance of value-added activities, including design, branding, marketing, and logistics (Scheffer & Duineveld, 2004).
Apparel importer
Import retailers Import wholesalers
" Is too broad as it includes both apparel import retailers and apparel import wholesalers.
Apparel jobber
" Is too narrow as it is strongly connected with manufacturers and manufacturing activities (Olsen, 1978).
" Is typically associated by the trade with firms seeking small contracts for existing goods for a quick turn around.
" Creates ambiguity because of multiple meanings and perceptions.
Marketeer
" Is too broad as it includes both apparel import retailers and apparel import wholesalers.
" Centers on brand marketing rather than business types.
Apparel global trading company
" Is too broad because it includes exporters and importers. " May underestimate the importance of firms� value-added
activities.
6 From �Apparel Import Intermediaries: The Impact of a Hyper-dynamic Environment on U.S. Apparel Firms,� by J.E. Ha-Brookshire and B. Dyer, 2006. Adapted with permission of the authors.
In the business academic literature, some progress has been made on addressing
the terminology issue, because the term, intermediary, is commonly agreed upon by
academics in the marketing, management, and business disciplines. A group of
researchers has already claimed the term, export intermediary, recognizing and

53
establishing the importance of the role of export intermediary firms in a global economy.
They have defined export intermediaries as [domestic] specialized service firms bridging
the gap between domestic manufacturers and foreign customers (Peng & Ilinitch 1998;
Peng & York 2001; Peng, et al., 2000). In the United States, Peng and his colleagues
specifically stressed that more rigorous research on export intermediaries is necessary to
explain successfully export performance in a global economy, and they sought the
important determinants of their performance. In the United Kingdom, Balabanis (2000,
2001) investigated export intermediaries� behavior to help inexperienced or less-
resourceful exporters with selecting, assessing, or evaluating them. The missions of
export intermediary research, however, is still centered on the role of �exporters,� as
exporting is a significant means of foreign market entry and sales expansion for firms
(Morgan et al., 2004).
Although some export researchers have recognized �overseas-based import
intermediaries� who are located overseas and help U.S. manufacturers� foreign sales
(Peng & Ilnitch, 1998, p. 610), the term, import intermediary, has not been introduced
into the academic literature for similar domestic firms. Instead, the behaviors of importers
can be found in the literature; yet, importers in these studies have been viewed as ultimate
buyers of foreign products, thus have been analyzed from the foreign suppliers�
perspective as an effort to help to increase their international sales. For example, Deng
and Wortzel (1995) looked at the purchasing behavior of U.S. importers to help Asian
exporters� sales to U.S. markets. Reichel (2000) investigated the internationalization
process in Swedish importing companies so that foreign exporters could learn the pattern

54
of Swedish importers� transaction behavior. In sum, Overby and Servais (2004)
concluded that currently there are three main topics of importer behavior research. They
are (a) motives and barriers in the selection/rejection of foreign supplier alternatives, (b)
the decision-making process for choosing foreign suppliers, and (c) importers� relations
with foreign suppliers.
To identify and track import intermediaries in the global apparel industry and to
fill the gap in our understanding of import intermediaries in the international business
literature, it is extremely important to establish the term, apparel import intermediary.
As defined earlier, AIIs are domestic apparel service firms that link domestic
wholesalers/retailers and foreign distributors/manufacturers to facilitate import
transactions in the global apparel supply chain. In the apparel industry, these
intermediary firms have assumed changed responsibilities and activities during the
process of globalization. According to Ha-Brookshire and Dyer (2006), AIIs have been
developed via either a transformation path or a birth path. The transformation path
represents existing domestic apparel manufacturers that transformed themselves into
import intermediary firms by utilizing foreign production subcontractors. The birth path
was initiated by groups of opportunity-seeking individuals, or entrepreneurs, who
leveraged unique sets of resources to create new import intermediary firms. The term,
AII, is inclusive in that it would include all apparel service firms that have acted as
intermediaries in the past, such as import wholesalers, import jobbers, import merchant
wholesalers, import agents or brokers, import trading companies, foreign
manufacturer�s sales offices or sales branches. The term, AII, would also include new

55
intermediary firm types that have resulted from the changes in the apparel industry. The
term, AII, however, be exclusive in that it would exclude apparel import retailers who
make direct sales to ultimate consumers.
As a new term, AII would help today�s apparel intermediary firms (a) establish a
sense of identity, reflecting the reality of their true responsibilities and activities; (b)
help apparel-related academic researchers comprehend a clear understanding of this
important subset of the apparel industry; (c) give non-apparel academics (for example,
export intermediary researchers) substantive familiarity with the term in the
international business literature; and (d) provide the flexibility to include future
intermediaries that develop as a result of shifts in market needs.
AIIs� Functions and Success Factors
After clarifying and defining the term, AII, this study conducted, first, in-depth
qualitative interviews to explore AIIs� operations and their success factors: (a) AIIs�
environment, development, and functions; and (b) AIIs� secrets to success. The
researcher conducted qualitative in-depth interviews with 13 executives of a cross-section
of U.S. AII firms, mainly located in New York City during the summer of 2005 (see
Appendix A for the Demographic Information of the Expert Informants, Appendix B for
the Qualitative Interview Schedule, and Appendix C for the Demographic Questionnaire
for Qualitative Interviews). Each interview lasted from 20 to 60 minutes and was
analyzed based on interpretive analysis under the philosophical hermeneutic framework.
Complete information on the first phase qualitative interview studies is available in Ha-
Brookshire and Dyer (2006) and Dyer and Ha-Brookshire (in press).

56
AIIs� Functions in a Hyper-dynamic Environment
The first qualitative interview study reported that U.S. AIIs carry out specific
functional activities linking domestic clients and foreign suppliers in the global apparel
industry. This study highlighted the significant impact that the dynamic and turbulent
apparel industry environment has had on the functional activities needed and demanded
by the new apparel market. This was made manifest through the shaping of AIIs� core
functional activities, including design, marketing, sourcing, and service. Each of these
activities specifically metamorphosed as the external environment forced unique
implementations to meet new market needs.
First, AIIs were reported to implement their design activities in terms of trend
interpretation, rather than trend-setting or trend-leading. Their design activities sought
mass acceptance of familiar concepts�not slavish devotion to top designer styles�with
creativity taking a second seat to interpretive ability for design personnel. Second, AIIs in
this study described their marketing activities as (a) scanning/analyzing the market
environment by �being out there,�(b) gaining a reputation as the �go-to people� for both
partners, and (c) leveraging relationships to acquire the most practical/profitable
information in the most efficient way. In other words, AIIs carried out marketing
activities with emphasis on personal, intimate environmental scanning that bore little
resemblance to traditional managerial information analysis. In addition, AII personnel
sought an intuitive real-time grasp of the fashion flow experience only after years of
personal immersion in industry phenomena.

57
Third, the sourcing activities detailed by AIIs in this study included four
dimensions�the right product, the right quality, the right price, and the right time�
managed simultaneously. Surprisingly, AIIs in this study expressed the relative lack of
importance assigned price. Although price matters, other considerations, such as time
(being on time) and quality (having an appropriate level for the product), appeared to be
more pressing concerns. To achieve better performance of their sourcing activities, AIIs
in this study implemented two critical kinds of expertise: (a) knowing �who to go to� in
terms of the supplier selection process and (b) maintaining healthy working partnerships
with foreign suppliers. This finding suggested that relationship establishment and
maintenance for AIIs were influenced by the environment, resulting in a focus on
extraordinary nurturing measures to compensate for managing more numerous
relationships that were faster shifting, project-based, culturally embedded, and more time
sensitive.
Finally, a very interesting finding was the importance of service as AIIs in this
study described service as the key differentiator between their firms and competitors. It
has been estimated informally in the apparel industry that there are 10,000 �touches,� or
steps, to make a single garment, implying that there are 10,000 places where something
can go wrong. Consequently, AIIs in this study were reported that they calmed problem-
filled surroundings by personally being there 24/7 to help their clients. AIIs� service was
characterized as (a) relationship-specific adaptations by intermediaries�expressed as
�no-hassle, no-problem, the smooth process�; and (b) information exchange�described
as �always there for you.�
58
Figure 2.3 presents an overview of the first preparatory study findings on U.S.
AIIs� functional activities in a hyper-dynamic apparel market environment. This model
also highlights that all of AIIs� four functional activities must be well integrated,
simultaneous, and coordinated to carry out the liaison functions effectively.
Figure 2.3.
The Functions of AIIs in a Hyper-dynamic Environment7
7 From �Apparel Import Intermediaries: The Impact of a Hyper-dynamic Environment on U.S. Apparel Firms,� by J.E. Ha-Brookshire and B. Dyer, 2006. Reprinted with permission of the authors.
Sourcing:▪ Knowing to whom to go.
▪ Maintaining true partnerships. ▪ Delivering the right product, right quality, right price, at the
right time.
Service: ▪ Providing smooth transactions.
▪ Maintaining intimate relationships. ▪ Creating an easier life for the client.
Marketing: ▪ Scanning the environment. ▪ Becoming �go-to people.� ▪ Exercising people skills.
Design:▪ Interpreting trends for
the target market.▪ Increasing mass adoption

59
AIIs� Success Factors in a Hyper-dynamic Environment
The second qualitative interview study explored the meaning of AIIs� success and
their success factors in a hyper-dynamic market environment. In reviewing the meaning
of AIIs� success, this study found that instead of focusing on sales- or profit-oriented
performance, the interview participants described success as reaching a long-term
presence, a platform, from which they could impact the industry through creative
expression by �being able to be who I am.� AIIs� creative impact on the market, in turn,
appeared to help to build their competitive advantages in a hyper-dynamic market
environment.
Next, in investigating AIIs� secrets to success, three key success factors emerged
among the AII study informants. They were: (a) immersion knowledge management, (b)
simultaneous dual relationship management, and (c) flexibility saturation. First, AIIs in
this study described that knowledge of the marketplace surfaced with a sense of extreme
immediacy that may be unique to the hyper-dynamic apparel market environment, and
that immediacy seemed to render traditional marketing strategies ineffective. Moreover,
the knowledge needed was described as only being acquired through years of personal
experience and immersion on the floor, either on retailers� store floors or manufacturers�
production floors. This, in turn, implied that success in AIIs appeared to be unusually tied
to personnel management. Literally, your firm personnel �can make you or break you.�
Second, this study also revealed that AIIs have two equally critical business
channel members, retailers and manufacturers, both of whom have the power to impact
their very existence. Consequently, they have faced a distinctive challenge to establish

60
and maintain two equally important types of business-to-business (B2B) relationships
simultaneously. That is, AIIs must manage a B2B relationship with their domestic clients
and a B2B relationship with foreign suppliers, exercising a multiple personality approach
of being both buyer and seller at the same time while managing two vastly unequal power
positions. These unique B2B relationships sought on one hand proactive, personal, non-
contractual relationships with domestic clients and on the other contractual, trust-building,
long-term partnerships with foreign manufacturers.
AIIs� flexibility in this study was expressed as free movement from country to
country to meet demands�or what might be called �market choices without boundaries.�
At a deeper level, however, AIIs� flexibility was described as proactive (taking full
initiative to convert market uncertainties into market opportunities), rather than reactive
(adapting to environmental uncertainty). Thus, to AIIs, environmental uncertainties
represented a pool of new opportunities that could be anticipated unafraid. Furthermore,
the concept of flexibility was expressed as a firm mindset, a whole organizational culture,
that informed every activity of the firm, rather than as capabilities aligned only with
certain actions, personnel, or areas of the firm. This flexibility saturation was manifested
as versatility, suggesting that these firms leveraged a wide range of resources to carry out
firm actions�to the extent that �if you can imagine it, you can make it happen.�
Figure 2.4 presents an overview of the second preparatory study findings on U.S.
AIIs� success and secrets to success in the hyper-dynamic apparel market environment.
This model demonstrates that a hyper-dynamic market environment, including extremely
fast-paced change, high levels of hostility, complex market relationships, and

61
unpredictable market demands forced AIIs to set new meanings for success, and thereby,
implement new secrets to success that were all strongly tied to firm personnel and their
internalized personal characteristics. Acquiring and keeping personnel with such
characteristics seemed to have strong implications for firm strategies, including hiring,
management style, firm size, and opportunity analysis. The feedback loop in this model
also highlights that the chain relationships in AIIs� environment, meaning of success, and
secrets to success are a constantly changing, on-going process, affecting each other
within what is generally seen as an increasingly complex and competitive business
environment.
Figure 2.4.
AIIs� Success and Their Secrets to Success in a Hyper-dynamic Environment8
8 From �Apparel Import Intermediaries� Secrets to Success: Redefining Success in a Hyper-dynamic Environment,� by B. Dyer and J.E. Ha-Brookshire, in press. Copyright 2007 by Emerald Group Publishing, Limited. Reprinted with permission of the authors.
AIIs�* Hyper-dynamic Environment
! Extremely fast-paced
change ! High levels of hostility ! Complex market
relationships ! Unpredictable market
demands
AIIs� Meaning of Success
! To achieve a stable, long-
term presence in the market
! To freely impact the market creatively
AIIs� Secrets to Success
! Immersion knowledge
management ! Simultaneous dual
relationship management
! Flexibility saturation
*AII: Apparel Import Intermediary
62
Summary
Chapter II reviewed various theories of the firm, theories of firm competition, and
market environment and firm performance studies. These theories and research provided
a basic foundation to understand the nature and the behavior of apparel import
intermediary firms in a global economy. With this understanding, this chapter reviewed
structural changes in the global apparel industry in recent years and identified AIIs after
clarifying current business classification systems and definitions of business types. The
chapter then further detailed the characteristics of U.S. AIIs� functional activities and
their success factors in the hyper-dynamic apparel market environment.
Based on the resource-based view of the firm, this study conceptualized AII firms
as combiners of critical resources�design, marketing, sourcing, and service
capabilities�and defined them as domestic apparel service firms that link domestic
wholesalers/retailers and foreign distributors/manufacturers to facilitate import
transactions in the global apparel supply chain. Under the resource-advantage theory of
competition framework, the study argued that the hyper-dynamic apparel market
environment has forced AIIs to seek different meanings of success, and, thus, take
different strategic actions to succeed. In addition, under the R-A theory framework, the
study emphasized that AIIs� unique success factors seemed to originate from AIIs�
different resources or a different mix of resources, resulting in different competitive
advantages over other firms.
63
A review of the market environment literature highlighted the need to recognize a
unique dimension of the apparel industry�an accelerated business cycle�and to define
a multi-dimensional concept of the environment�hyper-dynamism�to describe the
unique U.S. apparel market environment. Finally, the literature review of firm
performance studies provided a multiple-constituency approach, reflecting the nature of
multiple dimensions of firm performance beyond the firm�s economic performance.
Given that AIIs may be one of the most important outcomes of the apparel industry�s
strategic responses to change and that these firms have undergone �identity crisis� due to
various issues surrounding governments�, academics�, and practitioners� terms, the multi-
dimensional approach to firm performance provided an appropriate fit for the study�s
research questions. Research reviewed in this chapter is summarized in Table 2.6.

64
Table 2.5.
Summary of Literature Review
Theoretical Framework Ackoff (1981)
Alchian & Demsetz (1972) Alderson (1957) Barney (1991) Berle & Means (1932) Coase (1937) Conner (1991) Cyert & March (1963) Encaoua, Geroski, & Jacquemin (1986) Gioia & Pitre (1990) Geroski, Machin, & Walters (1997) Grimm, Lee, & Smith (2006) Hunt (2000) Hunt & Arnett (2003) Hunt & Morgan (1995, 1997)
Jenson & Meckling (1976) Grant (1996) Porter (1980) Porter (1985) Penrose (1959) Pfeffer (1982) Seth & Thomas (1994) Simon (1947) Singer (1997) Tirole (1988) Vibert (2004) Vibert & Hurst (2004) Williamson (1976) Williamson (1985) Williamson (1988)
Market Environment
Aldrich (1979) Calantone, Garcia, & Dröge (2003) Child (1972) Daft & Weick (1984) Dess & Beard (1984) Downey, Hellreigel, & Slocum (1975) Duncan (1972) Dyer & Ha-Brookshire (in press) Fredrickson (1984) Frederickson & Iaquinto (1989) Fredrickson & Mitchell (1984) Glazer & Weiss (1993) Goll & Rasheed (1997) Hunt (2000) Hunt & Arnett (2003) Kaiser & Sproul (1982) Kotha & Nair (1995)
Kuivalainen, Sundqvist, Puulaainen, & Cadogan (2004) Lawrence & Lorsch (1967) March & Simon (1958) Matthews & Scott (1995) Miller & Friesen (1982) Milliken (1987) Mintzberg (1979) Morris, Shindehutte, & LaForge (2002) Pelham (1999) Sharfman & Dean (1991) Thompson (1967) Tosi, Aldag, & Storey (1973) Tosi & Slocum (1984) Tung (1979) Weick (1979)
(table continues)

65
Table 2.5. (continued)
Firm Performance Aaby & Slater (1988)
Ambler & Kokkinaki (1997) Bello, Chelariu, & Zhang (2003) Cavusgil & Zou (1994) Connolly, Conlon, & Deutsch (1980) Dess & Beard (1984) Dess & Robinson (1984)
Ford & Schellenberg (1982) Etzioni (1964) Morgan, Kaleka, & Katsikeas (2004) Richey & Myers (2001) Steer (1977) Thompson (1967) Yuchtman & Seashore (1967)
The Global Apparel Industry & Apparel Import Intermediaries Alder (2004)
Appelbaum & Christerson (1997) Applebaum & Gereffi (1994) Balabanis (2000) Balabanis (2001) Baughman (2004) Bonacich, Cheng, Chinchilla, Hamilton, & Ong (1994) Cline (1990) Deng & Wortzel (1995) Dyer & Ha-Brookshire (in press) Dicken (2003)
Ellis (2007) Ha-Brookshire & Dyer (2006) Jones & Hayes (2004) Morgan, Kaleka, & Katsikeas (2004) Olsen (1978) Overby & Servais (2004) Peng & Ilinitch (1998) Peng, Hill, & Wang (2000) Peng & York (2001) Reichel (2000) Scheffer & Duineveld (2004) Taplin & Winterton (2004)

66
CHAPTER III
RESEARCH CONCEPTUAL MODEL
Chapter III presents the following sections: (a) Relevant Empirical Research, (b)
Gaps in the Research, (c) Research Conceptual Model, and (d) Research Hypotheses.
Relevant Empirical Research
Due to a dearth of import studies, particularly investigating import performance, a
review of empirical research on export or export intermediaries� performance comprised
the relevant extant literature for this study, as it shares the similar context of international
business dealing with foreign markets and business partners. Much has been discussed
about export performance in the last three decades as larger manufacturers have looked
for new markets overseas. Consequently, there has been a growing body of literature
concerned with the management influences on export performance, especially the
antecedents of export performance. Given that this study�s objectives were to develop
and empirically test a model of AIIs� capabilities, competitive advantages, and
performance, an understanding of previous empirical studies related to export
performance provided an appropriate foundation. Table 3.1 summarizes the findings of
previous empirical studies that were specifically focused on the antecedents and
consequences of export and export intermediaries� performance.
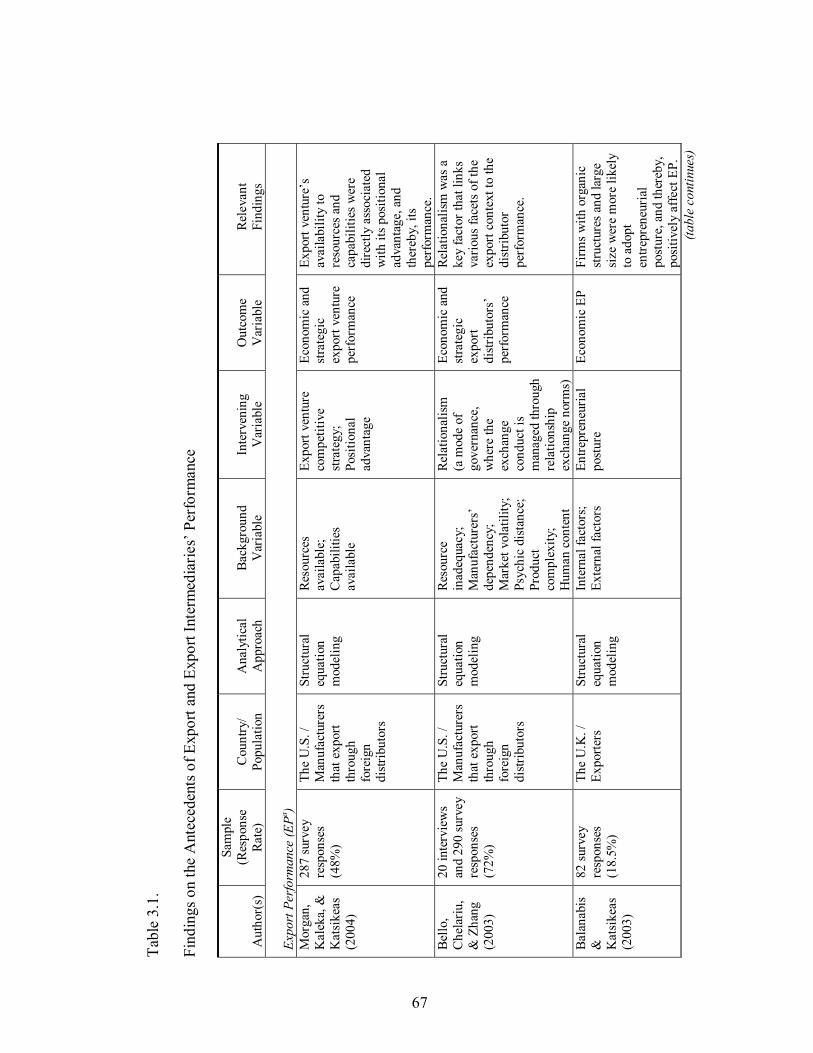
67
Tabl
e 3.
1.
Find
ings
on
the
Ant
eced
ents
of E
xpor
t and
Exp
ort I
nter
med
iarie
s� P
erfo
rman
ce
A
utho
r(s)
Sam
ple
(Res
pons
e Ra
te)
C
ount
ry/
Popu
latio
n
A
naly
tical
A
ppro
ach
Ba
ckgr
ound
V
aria
ble
In
terv
enin
g V
aria
ble
O
utco
me
Var
iabl
e
Re
leva
nt
Find
ings
Ex
port
Perfo
rman
ce (E
Pa ) M
orga
n,
Kal
eka,
&
Kat
sike
as
(200
4)
287
surv
ey
resp
onse
s (4
8%)
The
U.S
. /
Man
ufac
ture
rs
that
exp
ort
thro
ugh
fore
ign
distr
ibut
ors
Stru
ctur
al
equa
tion
mod
elin
g
Reso
urce
s av
aila
ble;
C
apab
ilitie
s av
aila
ble
Expo
rt ve
ntur
e co
mpe
titiv
e st
rate
gy;
Posi
tiona
l ad
vant
age
Econ
omic
and
st
rate
gic
expo
rt ve
ntur
e pe
rfor
man
ce
Expo
rt ve
ntur
e�s
avai
labi
lity
to
reso
urce
s and
ca
pabi
litie
s wer
e di
rect
ly a
ssoc
iate
d w
ith it
s pos
ition
al
adva
ntag
e, a
nd
ther
eby,
its
perf
orm
ance
. Be
llo,
Che
lariu
, &
Zha
ng
(200
3)
20 in
terv
iew
s an
d 29
0 su
rvey
re
spon
ses
(72%
)
The
U.S
. /
Man
ufac
ture
rs
that
exp
ort
thro
ugh
fore
ign
distr
ibut
ors
Stru
ctur
al
equa
tion
mod
elin
g
Reso
urce
in
adeq
uacy
; M
anuf
actu
rers
� de
pend
ency
; M
arke
t vol
atili
ty;
Psyc
hic
dist
ance
; Pr
oduc
t co
mpl
exity
; H
uman
con
tent
Rela
tiona
lism
(a
mod
e of
go
vern
ance
, w
here
the
exch
ange
co
nduc
t is
man
aged
thro
ugh
rela
tions
hip
exch
ange
nor
ms)
Econ
omic
and
st
rate
gic
expo
rt di
strib
utor
s�
perf
orm
ance
Rela
tiona
lism
was
a
key
fact
or th
at li
nks
vario
us fa
cets
of t
he
expo
rt co
ntex
t to
the
distr
ibut
or
perf
orm
ance
.
Bala
nabi
s &
K
atsi
keas
(2
003)
82 su
rvey
re
spon
ses
(18.
5%)
The
U.K
. /
Expo
rters
St
ruct
ural
eq
uatio
n m
odel
ing
Inte
rnal
fact
ors;
Ex
tern
al fa
ctor
s
Entre
pren
euria
l po
stur
e Ec
onom
ic E
P Fi
rms w
ith o
rgan
ic
stru
ctur
es a
nd la
rge
size
wer
e m
ore
likel
y to
ado
pt
entre
pren
euria
l po
stur
e, a
nd th
ereb
y,
posi
tivel
y af
fect
EP.
(ta
ble
cont
inue
s)

68
Tabl
e 3.
1. (c
ontin
ued)
A
utho
r(s)
Sa
mpl
e (R
espo
nse
Rate
)
C
ount
ry/
Popu
latio
n
A
naly
tical
A
ppro
ach
Ba
ckgr
ound
V
aria
ble
In
terv
enin
g V
aria
ble
O
utco
me
Var
iabl
e
Re
leva
nt
Find
ings
Ex
port
Perfo
rman
ce (E
Pa ) Ri
chey
&
Mye
rs
(200
1).
12 in
terv
iew
s an
d 40
4 su
rvey
re
spon
ses
(21.
9%)
The
U.S
. /
Man
ufac
ture
r ex
porte
rs
Con
firm
ator
y fa
ctor
ana
lysi
s O
rgan
izat
iona
l fa
ctor
s;
Envi
ronm
enta
l fa
ctor
s;
Stra
tegi
c fa
ctor
s
Mar
ket
info
rmat
ion
use
Econ
omic
and
st
rate
gic
EP
Stra
tegi
c,
envi
ronm
enta
l, an
d or
gani
zatio
nal f
acto
rs
wer
e dr
iver
s of f
irms�
m
arke
t inf
orm
atio
n us
e, a
nd th
ereb
y, le
d to
hig
her E
P.
Souc
hon
&
Dia
man
topo
ulos
(1
997)
12 in
terv
iew
s &
39
surv
ey
resp
onse
s (2
6%)
The
U.K
. /
Briti
sh
expo
rters
AN
OV
A
Aw
aren
ess o
f Ex
port
info
rmat
ion
sour
ces;
Ex
port
info
rmat
ion
over
load
Expo
rt in
form
atio
n ac
quis
ition
m
odes
Econ
omic
, su
bjec
tive,
and
co
mpa
rativ
e EP
The
leve
l of
man
ager
s� a
war
enes
s on
exp
ort i
nfor
mat
ion
sour
ces a
ffect
ed th
eir
info
rmat
ion
acqu
isiti
on m
odes
, an
d th
ereb
y, le
d to
po
sitiv
e EP
. C
avus
gil
& Z
ou
(199
4)
202
inte
rvie
ws
and
20
2 su
rvey
s
The
U.S
. /
Expo
rting
fir
ms a
cros
s 16
diffe
rent
in
dustr
ies
Con
firm
ator
y fa
ctor
ana
lysi
s In
tern
al fo
rces
; Ex
tern
al fo
rces
Expo
rt m
arke
ting
stra
tegy
Econ
omic
and
st
rate
gic
EP
Mar
ketin
g str
ateg
y,
firm
�s in
tern
atio
nal
com
pete
nce,
and
m
ater
ial c
omm
itmen
t w
ere
key
succ
ess
fact
ors.
Wal
ters
&
Sam
iee
(199
0)
145
surv
ey
resp
onse
s (2
9.5%
)
The
U.S
./ Sm
all e
xpor
t fir
ms a
cros
s in
dustr
ies
Ex
port
com
mitm
ent;
Expo
rt str
ateg
y;
Expo
rt ad
min
istra
tive
arra
ngem
ent
N/A
Ec
onom
ic E
P Ex
port
com
mitm
ent,
expo
rt str
ateg
y, a
nd
expo
rt ad
min
istra
tive
arra
ngem
ent h
ad
stro
ng a
ssoc
iatio
ns
with
EP.
(ta
ble
cont
inue
s)
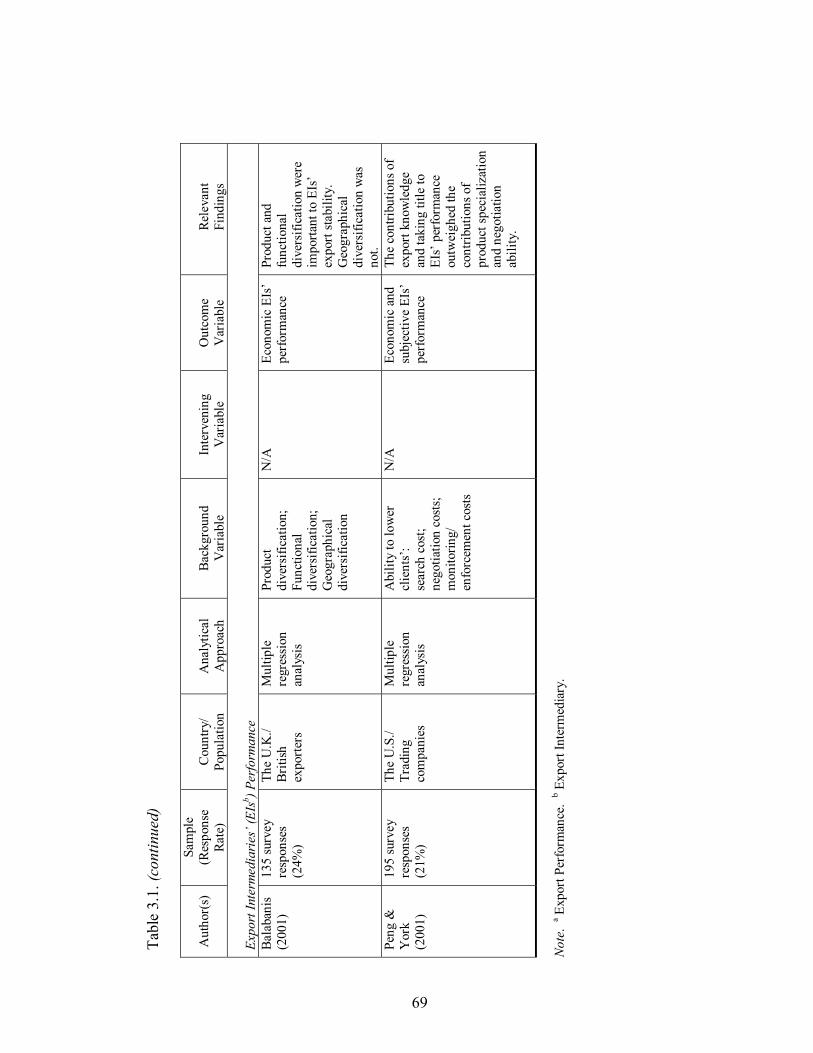
69
Tabl
e 3.
1. (c
ontin
ued)
A
utho
r(s)
Sa
mpl
e (R
espo
nse
Rate
)
C
ount
ry/
Popu
latio
n
A
naly
tical
A
ppro
ach
Ba
ckgr
ound
V
aria
ble
In
terv
enin
g V
aria
ble
O
utco
me
Var
iabl
e
Re
leva
nt
Find
ings
Ex
port
Inte
rmed
iarie
s� (E
Isb ) P
erfo
rman
ce
Bala
bani
s (2
001)
13
5 su
rvey
re
spon
ses
(24%
)
The
U.K
./ Br
itish
ex
porte
rs
Mul
tiple
re
gres
sion
an
alys
is
Prod
uct
dive
rsifi
catio
n;
Func
tiona
l di
vers
ifica
tion;
G
eogr
aphi
cal
dive
rsifi
catio
n
N/A
Ec
onom
ic E
Is�
perf
orm
ance
Pr
oduc
t and
fu
nctio
nal
dive
rsifi
catio
n w
ere
impo
rtant
to E
Is�
expo
rt sta
bilit
y.
Geo
grap
hica
l di
vers
ifica
tion
was
no
t.
Peng
&
Yor
k (2
001)
195
surv
ey
resp
onse
s (2
1%)
The
U.S
./ Tr
adin
g co
mpa
nies
Mul
tiple
re
gres
sion
an
alys
is
Abi
lity
to lo
wer
cl
ient
s�:
sear
ch c
ost;
nego
tiatio
n co
sts;
m
onito
ring/
en
forc
emen
t cos
ts
N/A
Ec
onom
ic a
nd
subj
ectiv
e EI
s�
perf
orm
ance
The
cont
ribut
ions
of
expo
rt kn
owle
dge
and
taki
ng ti
tle to
EI
s� p
erfo
rman
ce
outw
eigh
ed th
e co
ntrib
utio
ns o
f pr
oduc
t spe
cial
izat
ion
and
nego
tiatio
n ab
ility
.
N
ote.
a Exp
ort P
erfo
rman
ce.
b Exp
ort I
nter
med
iary
.

70
The earliest work on export performance can be traced to Tookey (1964). Since
that time, numerous empirical studies have examined the interrelationships among the
antecedents of export performance and their outcomes. Katsikeas, Leonidou, and Morgan
(2000) reviewed over 100 journal articles related to export performance at the firm level
and found three groups of variables that were most commonly used until the late 1990s.
The first group was background variables, that is, managerial, organizational, and
environmental forces that more likely indirectly affect export performance. The second
group was intervening variables, that is, targeting and marketing strategy factors that
directly affect export performance. The third group was outcome variables that have
centered on firms� export performance.
As to the managerial factors among background variables, managers�
commitment and the level of managers� awareness of export information sources were
reported as either directly or indirectly related to export performance (Souchon &
Diamantopoulos, 1997; Walters & Saimees, 1990). Organizational factors among
background variables, the firm�s international competence, the degree of organic
structure, and planning for future export venture, were found to impact export
performance indirectly (Balabanis & Kastikeas, 2003; Cavusgil & Zou, 1994; Richey &
Myers, 2001). Among environmental factors as background variables, market volatility
was found to relate positively to the firm�s use of market information and, ultimately,
export performance (Richey & Myers, 2001), while environmental hostility was reported
to affect export performance negatively (Balabanis & Katskeas, 2003).

71
With regard to intervening variables, targeting and marketing strategy factors
have been heavily investigated in the export performance literature. Targeting factors
refer to the critical strategies of identifying, selecting, and segmenting international
markets (Kotabe & Helsen, 1998). Although little empirical attention was given to these
factors, export expansion strategy (selecting markets) and foreign market segmentation
were found to be significantly related to the firm�s export performance (Amine &
Cavusgil, 1986; Lee & Yang, 1990). Export marketing strategy essentially refers to the
means by which a firm responds to internal and external forces to meet its objectives,
including product, promotion, pricing, and distribution strategies (Cavusgil & Zou, 1994).
Cavusgil and Zou (1994) concluded that export marketing strategy was influenced by the
firm�s internal (firm and product characteristics) and external (industry and export market
characteristics) factors and had a positive association with export performance.
Export performance has been typically considered the dependent variable in the
export literature. Export performance has been defined as the outcome of a firm�s
activities in export markets, and, thus, most research has focused on the firm�s economic
or financial performance using objective measures of export performance (Kastikeas et
al., 2000). For example, the most common economic performance measures have been
export sales intensity, export sales growth, export profitability, export sales volume, and
export sales intensity growth. Both sales-related measures and profit-related measures
have been criticized because these measures might be affected by factors other than
successful exporting operations, without reflecting the true competitive dimensions of
export success (Kirpalani & Balcome, 1987).

72
Over the past decade and a half, the export literature has matured and changes
have been made in the approaches that researchers have taken. In addition to managerial,
organizational, and environmental factors, very recently, the availability and quality of
the firm�s resources have been investigated as indirect antecedents of export performance,
perhaps indicative of a stronger focus on a resource-based view of the firm (Bello et al.,
2003; Morgan et al., 2004).
Also, other intervening variables, including entrepreneurial posture, relationalism,
and positional advantages have been addressed and empirically evaluated as the direct
antecedents of performance. For example, entrepreneurial posture, the firm�s propensity
to take risks, innovate, and be proactive, was found to have a direct positive relationship
with export performance (Balabanis & Katsikeas, 2003). Relationalism, the mode of the
firm�s governance, where exchange conduct between the two committed parties is
managed through relationship exchange norms, was shown to be a key factor that links
various facets of the export context to distributor performance (Bello et al., 2003).
Competitive (or positional) advantages were also empirically found to be direct
antecedents of export venture performance because the relative superiority of an export
venture�s value offering may affect target customers� buying behavior and the outcomes
of this behavior for the export venture (Morgan et al., 2004).
As the outcome variable, the construct of export performance has required new
perspectives. Particulary, Cavusgil & Zou (1994, p. 2) argued that exporting is �a firm�s
strategic response to the interplay of internal and external forces,� thus export
performance must incorporate strategic measures to investigate export performance.

73
Since this definition of exporting, most export performance studies have adopted multi-
dimensional assessments of export performance (Bello et al., 2003; Morgan et al., 2004;
Richey & Myers, 2001; Souchon & Diamantopoulos, 1997).
Compared with the export performance literature, the topic of export
intermediaries (EIs) has developed only recently, and empirical research on export
intermediaries� performance has been very limited. Of the two empirical studies found,
Balabanis (2000) investigated the impact of product, functional, and geographical
diversification on the sales, exports, and profitability of U.K. export intermediaries. His
survey results showed that EIs� product diversification (the diversity of unrelated
products that EIs carry) and unrelated functional diversification (EIs� involvement in
other areas, including financing, manufacturing, transportation, insurance, and so on)
were important for EIs� stable financial performance. However, geographical
diversification, the diversity of geographical markets to which export intermediaries
export their products, was not.
Taking a more theoretically grounded approach, Peng and York (2001)
hypothesized that export intermediaries� abilities to reduce clients� cost of search,
negotiation, and monitoring/enforcement directly affected their performance on the basis
of agency theory of the firm, transaction cost theory of the firm, and a resource-based
view of the firm. Although their hypotheses were all supported, their empirical study
results showed that the contributions of export knowledge and taking title to products
outweighed the contribution of product specialization and negotiation ability to
performance.

74
Interestingly, both studies concluded that in order to achieve stable economic
performance, EIs should focus on relatively simple, undifferentiated, commodity
products rather than high-tech, differentiated products. This finding was somewhat
contradictory to their definition of EIs�specialized service firms bridging the gap
between domestic manufacturers and foreign customers because it suggested that EIs
might provide specialized service but not specialized products. These research studies
sampled export companies from the Directory of Export Buyers in the UK or U.S. trading
firms from the Exporter Yellow Pages, respectively. Although the authors argued that
these directories were the best source to generate their study samples, firms listed in these
directories might not have represented true EIs as defined by the studies� authors.
Additionally, both studies were narrowly centered on the impact of firms� specific
strategies or resources on their performance, without considering intervening variables
that might help to explain the interrelationships between the firms� strategies or resources
and their performance.
Gaps in the Research
Although export intermediary research began in earnest in the mid to late 1990s, it
has become an active research area in recent years. Research in this area could be
characterized as relatively immature (when compared with other strategic management
literatures) and focusing in large part on the roles, service, and functions of EIs. These
studies have not directly considered the role of importers. Most importer studies found in
the literature have been related to importers� behavior as it could help foreign exporters.
Importers in these studies have been viewed as ultimate buyers of foreign products and

75
analyzed from the foreign sellers� perspective in an effort to increase their international
sales (Deng & Wortzel, 1995; Reichel, 2000). Thus, importers� behavior research has
been interested in importers� motives and barriers in the selection/rejection of foreign
supplier alternatives, the decision-making process for choosing foreign suppliers, and
importers� relations with foreign suppliers (Overby & Servais, 2004).
As the United States has transitioned from a net exporter to a net importer in the
apparel trade, the contributions of import intermediary firms, however, have shifted in
importance. Despite these changes, most academics and policy-makers have continued to
focus on manufacturing and exporting when analyzing the apparel industry. The result is
a critical gap in our understanding of important supply chain members in a global
economy�apparel import intermediaries (AIIs). Given that very little is known about the
operations of these firms, this study explored the very basic issues of their capabilities,
competitive advantages, and performance. The study�s findings offered important
information about these newly influential firms that facilitate import transactions between
domestic clients and foreign suppliers in a global economy.

76
Research Conceptual Model
Previous models and studies in export and export intermediaries� performance
provided an excellent starting point for the study�s conceptual model�a model of AIIs�
capabilities, competitive advantages, and performance in a hyper-dynamic market
environment.
Antecedents of AIIs� Performance
AIIs� Functional Capabilities
This study adopted a resource-based view of the firm to explain the nature of the
firm and, thus, AIIs� resources�firm capabilities�were selected as the specific focus of
the study (Barney, 1991; Conner, 1991). Among firm resources, capabilities have been a
special focus for strategy researchers investigating firm performance. Day (1994, p.38)
made a specific distinction of capabilities from other asset-oriented resources and defined
firm capabilities as �complex bundles of skills and accumulated knowledge, exercised
through origination processes.� He argued that firm capabilities differ from firm assets in
that capabilities cannot be easily tracked by a monetary value, while other tangible plant
and equipment can. Firm capabilities are seen to be deeply embedded in the
organizational routines and practices that cannot be easily traded or imitated, while other
physical asset resources can. Firm capabilities can be manifested through typical business
activities, including order fulfillment, new product development, or service delivery.
Supporting this, Morgan and his colleagues (2004) empirically assessed the role of firm
capabilities in their export venture performance research and showed that export

77
managers should focus their efforts not only on resource acquisition but also capability
building as capabilities form a set of critical antecedents for export performance.
In the context of AIIs, four critical functional activities have been discussed. AIIs
have been found to play a liaison role between their domestic clients and foreign
suppliers, offering design, marketing, sourcing, and service assistance to domestic clients
in the apparel marketplace. Furthermore, each functional activity was reported as
requiring unique implementation capabilities (Ha-Brookshire & Dyer, 2006). For
example, AIIs� design capabilities were manifested through product development for
specific target markets via unique trend interpretation. AIIs� marketing capabilities were
exercised through informational search knowledge via personal immersion in unique
trade activities, while AIIs� sourcing capabilities were expressed as relationship building
and management skills approached from multiple perspectives simultaneously. Finally,
AIIs� service capabilities were described as extensive and prompt customer service
management abilities via 24/7 kid-glove treatment.
AIIs� Competitive Advantages
Based on a resource-advantage theory of competition perspective, the study
proposed that AIIs� competitive advantages would be the direct antecedents of AII
performance (Anderson, Fornell, &Lehman, 1994; Cavusgil & Zou, 1994; Morgan et al.,
2004; Piercy, Kaleka, & Katsikeas, 1998; Morgan et al., 2004). Thus, AIIs would utilize
their firms� capabilities (resources) effectively and efficiently to obtain competitive
advantages among their competitors and, in turn, achieve superior performance (Hunt,
2000). In other words, because not all firms have the same capabilities at the same time,
78
this heterogeneity in firm capabilities would result in variations in its competitive
advantages in the marketplace, and, in turn, its performance (Barney, 1991; Hunt, 2000).
A firm is said to have a competitive advantage when it is implementing a value
creating strategy not simultaneously being implemented by any current or potential
competitors (Barney, 1991). Competitive advantages are composed of a firm�s relative
value that has been produced by its resources and relative resource costs for producing
such value (Hunt, 2000). In the export performance literature, three types of competitive
advantage have been identified, that is, cost advantage, product advantage, and service
advantage. Cost advantage involves a monetary cost in producing, marketing, and
delivering firms� value offering, which affects their price and perceived value in the
marketplace (Kotha & Nair, 1995; Morgan et al., 2004; Porter, 1985). Product advantage
explains quality, design, and other product attributes that distinguish firms� value
offerings from those of their competitors (Kim & Lim, 1988; Morgan, et al., 2004; Porter,
1985; Song & Parry, 1997). Service advantages refers to firms� superior value derived
from their service activities of their value offering, including delivery speed, reliability,
and extensive service management (Dyer & Ha-Brookshire, in press; Kim & Lim, 1988;
Li & Dant, 1999; Morgan, et al., 20004). These three types of competitive advantages
were expected to be relevant for AIIs� as well.

79
Outcomes of AIIs� Performance
The study�s outcome variable, performance, included three measures�economic,
strategic, and relationship performance�based on a multiple constituency approach
(Connolly et al., 1980; Sharfman & Dean, 1994). The economic performance measures
used to assess the achievement of AIIs� economic goals, such as import sales volume,
market share, and profitability (Cavusgil & Zou, 1994; Richey & Myers, 2001; Souchon
& Diamantopoulos, 1997), have been the most commonly used indicators in the firm
performance literature.
The strategic performance measures were designed to evaluate the achievement of
AIIs� non-economic strategic goals, including AIIs� creative contributions to the market,
recognition as market experts, development of critical business relationships with
suppliers and clients, and pursuit of long-term stability (Dyer & Ha-Brookshire, in press).
The approach used to assess firms� non-economic strategic performance has been well
supported by numerous firm and export performance research since Cavusgil and Zou
(1994).
The relationship performance measures were intended to capture the level of the
achievement of AIIs� relationship goals relative to their business partners, including
domestic clients� and foreign suppliers� impression, retention, and loyalty (Katsikeas et
al., 2000; Morgan et al., 2004). The relationship performance was discussed to be
particularly important for AIIs as these firms manage two asymmetrical, yet critical,
business relationships simultaneously. Thus, AII business partners� evaluations, attitudes,

80
and behaviors were considered important performance objectives (Cavusgil & Zou, 1994;
Peng & York, 2001).
AIIs� Market Environment
Apparel import intermediaries do not operate in a vacuum and must consider and
respond to their context, the hyper-dynamic environment of the fashion industry where
production is driven by fashion cycles, short production runs, and consumers� insatiable
desire for something new. As discussed in the market environment literature, this
environment creates high levels of complexity, turbulence, resource competition, and
accelerated business cycles which blend together and force firms to change their
objectives and consequent business conduct (Dyer & Ha-Brookshire, in press). Such on-
going changes in AIIs� environment and objectives then force these firms to rearrange
their functional capabilities either by acquiring new resources, reallocating extant
resources, or improving their capabilities through learning. The interrelationships among
the market environment, firm activities, firm objectives, and learning were consistent
with a resource-advantage theory of competition perspective and have been empirically
evaluated in the literature (Calantone et al., 2003; Day, 1994; Dyer & Ha-Brookshire, in
press; Glazer & Weiss, 1993; Hunt, 2000; Kaiser & Sproul, 1982; Kuivalainen et al.,
2004; Matthews & Scott, 1995; Miller & Friesen, 1982; Pelham, 1999; Sharfman &
Dean, 1991; Tosi & Slocum, 1984).

81
Summary
In sum, the study proposed that AIIs achieve competitive advantages in the import
marketplace through their functional capabilities and, in turn, gain superior multi-
dimensional performance. AIIs� performance, over time, would in turn affect the market
environment in which they operate, and, thus, AIIs would pursue a new set of objectives
in the changed market environment. This iterative process of competition is an on-going
struggle to survive and achieve economic, strategic, and relationship goals. Figure 3.1
describes the integrative, conceptual model of the antecedents and consequences of AIIs�
performance in a hyper-dynamic market environment.
Figure 3.1.
Conceptual Model
Proposed theoretical relationships
Key contextual factors
AIIs� Functional
Capabilities
AIIs� Competitive Advantages
AIIs� Performance
Outcomes
Hyper-dynamic Market
Environment
AIIs� Strategic
Objectives
(Feedback loop)
(Feedback loop)

82
Research Hypotheses
Based on the study�s conceptual model developed from the resource-based view
of the firm, the resource-advantage theory of competition, the market environment
literature, previous exploratory qualitative studies on AIIs, and empirical studies in the
export performance literature, the following six research hypotheses were developed to
present the expected theoretical relationships of AII capabilities, competitive advantages,
and performance outcomes (see Figure 3.2):
H1a: AIIs� cost advantages positively impact their performance.
H1b: AIIs� capabilities positively impact their cost advantages.
H2a: AIIs� product advantages positively impact their performance.
H2b: AIIs� capabilities positively impact their product advantages.
H3a: AIIs� service advantages positively impact their performance.
H3b: AIIs� capabilities positively impact their service advantages.
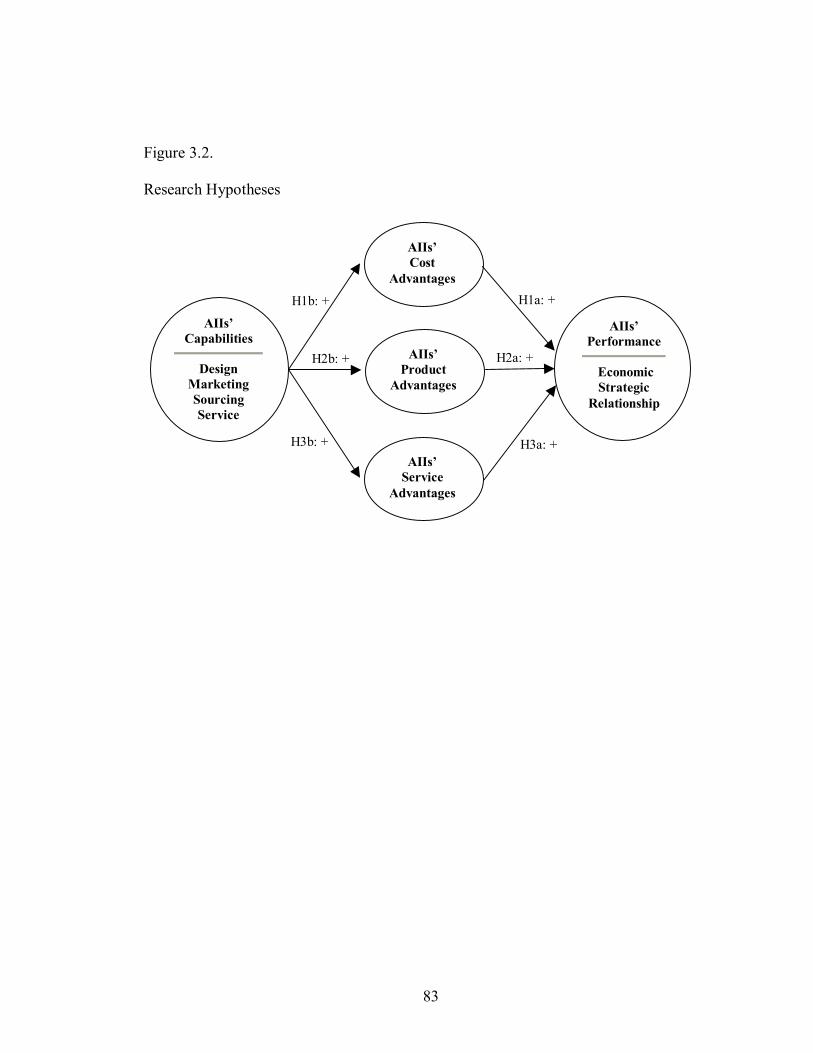
83
Figure 3.2.
Research Hypotheses
AIIs� Performance
Economic Strategic
Relationship
AIIs� Capabilities
Design Marketing Sourcing Service
H1a: +H1b: +
AIIs�Cost
Advantages
AIIs�Service
Advantages
AIIs�Product
Advantages
H2b: +
H3b: +
H2a: +
H3a: +

84
CHAPTER IV
RESEARCH METHODOLOGY
Chapter IV provides the following sections: (a) Research Design and Survey
Instrument Development, (b) Sample, (c) Data Collection Procedures, and (d) Data
Analysis Techniques.
Research Design and Survey Instrument Development
A survey instrument was developed to collect data to empirically test the
interrelationships among AIIs� capabilities, competitive advantages, and performance in a
hyper-dynamic market environment, as proposed by the study�s conceptual model. The
study�s survey instrument was designed by incorporating the findings from the first phase
qualitative interview studies with relevant scales established in the export performance
literature (Cavusgil & Zou, 1994; Dyer & Ha-Brookshire, in press; Ha-Brookshire &
Dyer, 2006; Morgan et al., 2004; Richey & Myers, 2001).
85
AIIs� Capabilities
The study developed a survey instrument for AIIs� design, marketing, sourcing,
and service capabilities based on the first phase qualitative interview studies and Morgan
and his colleagues� (2004) measurement scales from the export performance literature.
The first phase qualitative interview studies suggested that AIIs� design capabilities were
manifested through product development for specific target markets via unique trend
interpretation. This interpretation of AIIs� design capabilities were mainly consistent with
Morgan and his colleagues� product development capabilities construct; however,
appropriate assessment of AIIs� design capabilities needed to include trend interpretation.
Therefore, the study added a question to Morgan and his colleagues� scale to address
AIIs� capabilities to interpret trends to satisfy end-user customers. This appropriate
adaptation aimed to increase the reliability of the scale and validate the interpretations
from the qualitative research.
AIIs� marketing capabilities were reported to be exercised through market
scanning and unique implementation of informational search capabilities that involved
personal immersion in the apparel industry. Morgan and his colleagues� firm information
capabilities construct was generally consistent with AIIs� marketing capabilities; however,
AIIs� focus on personal immersion in the market was not addressed. Therefore, the study
added a question, assessing AIIs� capability to interpret market information through
personal �on the floor� experience. This appropriate adaptation was intended to increase
the reliability of the scale and validate the interpretations from the qualitative research.

86
Given that AIIs deal with overwhelmingly powerful domestic retail and wholesale
clients and highly competitive foreign suppliers simultaneously, AIIs� sourcing
capabilities were described as relationship building and managing these two different
power structures. This understanding of AIIs� sourcing capabilities was similar to
Morgan and his colleagues� (2004) relationship building capability construct, originally
developed to investigate export performance. Because this measure was designed for
exporters who focus their business relationships on foreign customers only, the study
modified Morgan and his colleagues� survey items to address both AIIs� business
partners�domestic retail and wholesale clients and foreign suppliers. For example, the
original survey question, �Compared with main competitors, our firm�s ability to
establish and maintain close overseas distributor relationships is� was adapted and
developed into two separate questions: (a) �Compared with main competitors, our firm�s
ability to establish and maintain close domestic client relationship is�; and (b) �Compared
with main competitors, our firm�s ability to establish and maintain close foreign supplier
relationship is.�
Finally, AIIs� service capabilities were reported to be intensive, requiring prompt
customer service management capabilities with an �always there for you 24/7� approach
and a goal of long-term service relationships with domestic clients. This explanation was
reflective of Morgan and his colleagues� service differentiation strategy construct.
Consequently, their service differentiation strategy construct was used to assess AIIs�
service capabilities in this study, indicating the importance of AIIs� ability to differentiate
their service offering to create a successful competitive position. The study adopted

87
Morgan and his colleagues� scale for AIIs� service capabilities, adding a question that
would capture AIIs� capabilities to develop a long-term domestic client service
relationship. This appropriate adaptation sought to increase the reliability of the scale and
validate the interpretations from the qualitative research.
As a result, the study developed survey scales to measure four different constructs
dealing with AIIs� capabilities: (a) a four-item scale for AIIs� design capabilities; (b) a
six-item scale for AIIs� marketing capabilities; (c) a four-item scale for AIIs� sourcing
capabilities; and (d) a four-item scale for AIIs� service capabilities.
AIIs� Competitive Advantages
The scales for firms� price, product, and service advantages were substantively
adapted from Morgan and his colleagues (2004). While comparing the definition of each
construct with the survey questions, it was also necessary to add or modify questions to
accurately assess AIIs� competitive advantages. For example, with regard to product
advantages, the study added the question, �our firm�s products, in terms of fashion appeal,
are,� emphasizing the critical importance of fashion appeal in apparel products. With
regard to service advantages, some of the original questions lacked a firm operation
context. Thus, the study modified the original question, �Compared with main
competitors, our firm�s product accessibilities are,� to �Compared with main competitors,
our firm�s established import connections to provide effective product accessibility are.�
Similarly, �Compared with main competitors, our firm�s product line breadth is� was
changed to �Compared with main competitors, our firm�s established import connections
to provide a wide range of product accessibility are.� Finally, any original questions that

88
were double-barreled were separated into two questions to assess a single concept at one
time. For example, the original question, �Compared with main competitors, our firm�s
delivery speed and reliability are,� was separated into two questions: (a) �Compared with
main competitors, our firm�s delivery speed is�; and (b) �Compared with main
competitors, our firm�s delivery reliability is.�
As a result, the study organized survey scales to measure three different
constructs representing AIIs� competitive advantages: (a) a four-item cost advantage
scale, (b) a four-item product advantage scale, and (c) a six-item service advantage scale.
AIIs� Performance Outcomes
AIIs� performance outcomes were divided into three dimensions: (a) economic
performance, (b) strategic performance, and (c) relationship performance. The three-item
economic performance scale consisted of an export sales volume item drawn from
Cavusgil and Zou (1994), an export market share item drawn from Morgan and his
colleagues, and a profitability scale item drawn from Richey and Myers (2001).
Because there were no relevant scales available to assess AIIs� strategic performance, the
study developed a new five-item scale based on the first phase qualitative interview
findings. Finally, the AIIs� relationship performance scale was adopted from Morgan and
his colleagues� scale of distributor evaluation of export performance, originally designed
to examine attitudes and behaviors of distributors with whom export ventures do business.
Two major modifications, however, were made to assess the AII context more accurately
and clearly. First, the original questions were structured to ask export managers�
perceptions of how their distributors would evaluate their firm�s service quality, the

89
quality of their relationship, or the product/service offering with scale anchors ranging
from 1 �much worse� to 7 �much better.� In order to deliver the core message of these
questions more easily and more clearly, they were reorganized as �Our domestic clients
are impressed with our firms� service quality� with scale anchors from 1 �strongly
disagree� to 7 �strongly agree.� Second, because the original questions were designed to
focus on foreign business partners only, the survey questions were modified to address
AIIs� dual business partners, domestic retail and wholesale clients and foreign suppliers.
As a result, the study developed survey scales to measure three different
dimensions of AIIs� performance outcomes: (a) a three-item economic performance scale,
(b) a five-item non-economic strategic performance scale, and (c) a ten-item relationship
performance scale. Table 4.1 shows the survey constructs, item sources, and scale
development.

90
TAB
LE 4
.1.
Surv
ey C
onst
ruct
s, Ite
m S
ourc
es, a
nd D
evel
opm
ent
C
onst
ruct
s
Mea
sure
men
t Ite
ms
So
urce
Dev
elop
men
t A
IIs�
Des
ign
Cap
abili
ties
(4 it
ems)
V1
� D
evel
opin
g ne
w p
rodu
cts
V2
� Bu
ildin
g th
e pr
oduc
t to
desi
gnat
ed o
r rev
ised
sp
ecifi
catio
n V
3 �
Util
izin
g ne
w m
etho
ds a
nd id
eas i
n th
e m
anuf
actu
ring
proc
ess
V4
� In
terp
retin
g tre
nds t
o sa
tisfy
end
-use
r cus
tom
ers
Mor
gan
et a
l. (2
004)
H
a-Br
ooks
hire
&
Dye
r (20
06)
Ada
pted
from
the
scal
e of
pro
duct
de
velo
pmen
t cap
abili
ties u
sed
in th
e ex
port
vent
ure
perf
orm
ance
lite
ratu
re
A n
ew it
em d
evel
oped
from
the
first
ph
ase
qual
itativ
e in
terv
iew
stud
y A
IIs�
Mar
ketin
g C
apab
ilitie
s (6
item
s)
V5
� Id
entif
ying
pro
spec
tive
dom
estic
clie
nts
V6
� C
aptu
ring
impo
rtant
mar
ket i
nfor
mat
ion
V7
� A
cqui
ring
impo
rt m
arke
t-rel
ated
info
rmat
ion
V8
� M
akin
g co
ntac
ts in
the
impo
rt m
arke
t V
9 �
Mon
itorin
g co
mpe
titiv
e pr
oduc
ts in
the
impo
rt m
arke
t V
10 �
Inte
rpre
ting
mar
ket i
nfor
mat
ion
thro
ugh
pers
onal
�on
the
floor
� ex
perie
nce
Mor
gan
et a
l. (2
004)
H
a-Br
ooks
hire
&
Dye
r (20
06)
Ada
pted
from
the
scal
e of
in
form
atio
nal c
apab
ilitie
s use
d in
the
expo
rt ve
ntur
e pe
rfor
man
ce li
tera
ture
A
new
item
dev
elop
ed fr
om th
e fir
st
phas
e qu
alita
tive
inte
rvie
w st
udy
AII
s� S
ourc
ing
Cap
abili
ties
(4 it
ems)
V11
� U
nder
stan
ding
dom
estic
clie
nts�
requ
irem
ent
V12
� U
nder
stan
ding
fore
ign
supp
liers
� req
uire
men
t V
13 �
Est
ablis
hing
and
mai
ntai
ning
clo
se fo
reig
n su
pplie
r rel
atio
nshi
ps
V14
� E
stab
lishi
ng a
nd m
aint
aini
ng c
lose
dom
estic
cl
ient
rela
tions
hips
Mor
gan
et a
l. (2
004)
Ada
pted
from
the
scal
e of
rela
tions
hip
capa
bilit
ies u
sed
in th
e ex
port
vent
ure
perf
orm
ance
lite
ratu
re
(ta
ble
cont
inue
s)

91
TAB
LE 4
.1. (
cont
inue
d)
Con
stru
cts
M
easu
rem
ent I
tem
s
Sour
ce
D
evel
opm
ent
AII
s� S
ervi
ce
Cap
abili
ties
(4 it
ems)
V15
� A
chie
ving
and
mai
ntai
ning
on-
time
prod
uct
deliv
ery
V16
� A
chie
ving
and
mai
ntai
ning
pro
mpt
resp
onse
to
dom
estic
clie
nts�
ord
ers
V17
� O
ffer
ing
exte
nsiv
e 24
/7 d
omes
tic c
lient
ser
vice
V
18 �
Dev
elop
ing
a lo
ng-te
rm d
omes
tic c
lient
serv
ice
rela
tions
hip
Mor
gan
et a
l. (2
004)
H
a-Br
ooks
hire
&
Dye
r (20
06)
Ada
pted
from
the
scal
e of
ser
vice
di
ffer
entia
tion
stra
tegy
use
d in
the
expo
rt ve
ntur
e pe
rfor
man
ce li
tera
ture
A
new
item
dev
elop
ed fr
om th
e fir
st
phas
e qu
alita
tive
inte
rvie
w st
udy
AII
s� C
ost
Adv
anta
ges
(4 it
ems)
V19
� C
ost o
f raw
mat
eria
l V
20 �
Pro
duct
ion
cost
per
uni
t V
21 �
Cos
t of g
oods
sold
V
22 �
Sel
ling
pric
e to
dom
estic
clie
nts
Mor
gan
et a
l. (2
004)
A
dapt
ed fr
om th
e sc
ale
of p
rice
posit
iona
l adv
anta
ge u
sed
in th
e ex
port
vent
ure
perf
orm
ance
lite
ratu
re
AII
s� P
rodu
ct
Adv
anta
ges
(4 it
ems)
V23
� P
rodu
ct q
ualit
y V
24 �
Pac
kagi
ng
V25
� D
esig
n an
d st
yles
V
26 �
Pro
duct
s in
term
s of f
ashi
on a
ppea
l
Mor
gan
et a
l. (2
004)
H
a-Br
ooks
hire
&
Dye
r (20
06)
Ada
pted
from
the
scal
e of
pro
duct
po
sitio
nal a
dvan
tage
use
d in
the
expo
rt ve
ntur
e pe
rfor
man
ce l
itera
ture
A
new
item
dev
elop
ed fr
om th
e fir
st
phas
e qu
alita
tive
inte
rvie
w st
udy
AII
s� S
ervi
ce
Adv
anta
ges
(6 it
ems)
V27
� E
ffec
tive
Prod
uct a
cces
sibi
lity
V28
� A
wid
e ra
nge
of p
rodu
ct a
cces
sibi
lity
V29
� T
echn
ical
supp
ort f
or d
omes
tic c
lient
s V
30 �
Afte
r sal
es s
ervi
ce fo
r dom
estic
clie
nts
V31
� D
eliv
ery
spee
d V
32 �
Del
iver
y re
liabi
lity
Mor
gan
et a
l. (2
004)
Ada
pted
from
the
scal
e of
ser
vice
po
sitio
nal a
dvan
tage
use
d in
the
expo
rt ve
ntur
e pe
rfor
man
ce li
tera
ture
(ta
ble
cont
inue
s)

92
TAB
LE 4
.1. (
cont
inue
d)
Con
stru
cts
M
easu
rem
ent I
tem
s
Sour
ce
D
evel
opm
ent
AII
s� E
cono
mic
Pe
rfor
man
ce
(3 it
ems)
V33
� Im
port
sale
s vol
ume
V34
� M
arke
t sha
re
V35
� P
rofit
abili
ty
Cav
usgi
l & Z
ou
(199
4)
Mor
gan
et a
l. (2
004)
R
iche
y &
Mye
rs
(200
1)
Ada
pted
from
thre
e ex
tant
scal
es
AII
s� S
trate
gic
Perf
orm
ance
(5
item
s)
V36
� C
reat
ive
cont
ribut
ions
V
37 �
Rec
ogni
tion
as a
n ex
pert
V38
� E
stab
lishm
ent o
f crit
ical
bus
ines
s rel
atio
nshi
ps
V39
� A
ccom
plis
hmen
t of b
usin
ess s
trate
gic
goal
s V
40 �
Lon
g-te
rm st
abili
ty
Dye
r & H
a-Br
ooks
hire
(in
pre
ss)
New
item
s de
velo
ped
from
the
first
ph
ase
qual
itativ
e in
terv
iew
stud
y
AII
s�
Rel
atio
nshi
ps
Perf
orm
ance
(1
0 ite
ms)
V41
� S
ervi
ce q
ualit
y pe
rcei
ved
by d
omes
tic c
lient
s V
42 �
The
qua
lity
of re
latio
nshi
p pe
rcei
ved
by
dom
estic
clie
nts
V43
� R
eput
atio
n pe
rcei
ved
by d
omes
tic c
lient
s V
44 �
Ove
rall
tota
l pro
duct
/ser
vice
off
erin
g pe
rcei
ved
by d
omes
tic c
lient
s V
45 �
Dom
estic
clie
nts�
loya
lty to
AII
s V
46 �
Ser
vice
qua
lity
perc
eive
d by
fore
ign
supp
liers
V
47 �
The
qua
lity
of re
latio
nshi
p pe
rcei
ved
by fo
reig
n su
pplie
rs
V48
� R
eput
atio
n pe
rcei
ved
by fo
reig
n su
pplie
rs
V49
� O
vera
ll to
tal p
rodu
ct/s
ervi
ce o
ffer
ing
perc
eive
d by
fore
ign
supp
liers
V
50 �
For
eign
supp
liers
� loy
alty
to A
IIs
Mor
gan
et a
l. (2
004)
Ada
pted
from
the
scal
e of
dist
ribut
or
expo
rt pe
rfor
man
ce u
sed
in th
e ex
port
vent
ure
perf
orm
ance
lite
ratu
re

93
Survey Scales
The directions in the survey instructed the respondent to think about the firm�s
main competitors and then indicate his/her views on those capabilities, competitive
advantages, and performance. Specifically, the firm�s performance measures instructed
the respondent to base his/her answers on the firm�s performance over the past 12 months
to set a consistent timeframe for the performance evaluation period. A seven-point
Likert-type scale (for example, 1=much worse, 7=much better; 1=strongly disagree or
7=strongly agree; or 1=extremely poor, 7=extremely successful) was used throughout the
survey. Likert-type scales use numbers to assess objects on certain attributes and assume
equal increments of the attribute being measured. This type of interval scale was
desirable for most statistical operations as it is possible to compute an arithmetic mean
from interval-scale measures (Aacker, Kumar, & Day, 1995). In addition, Likert-type
scales asking a relative assessment on a continuum have been commonly used for
primary data collection in empirical strategy research and, more generally, in
management and marketing research (Ward, McCreery, Pitzman, & Sharma, 1998).
Other General Questions
Other general questions were used to obtain AIIs� business classifications,
geographic locations, business operations characteristics, and other business
characteristics information. Particularly, given that AIIs are currently facing �an identity
crisis� due to classification or definitional issues, it was critical to identify AIIs based on
the study�s definition. In order to correctly classify AIIs based on the study definition, the
survey questionnaire included items asking the percentage of products that the

94
respondent�s firm domestically manufactured or the percentage of goods directly
imported by his/her firm. The survey also asked if the respondent�s firm currently owns
retail stores making direct sales to end-user consumers. If his/her firm does, the survey
asked what percentage of his/her firm�s total products would be directly sold to end-user
consumers.
Additionally, for an overall picture of geographic locations, business operations
and other business issues of the firms that participated in this study, the study�s survey
questionnaire included the following questions: years of major import operations, the
number of countries from which his/her firm imports products, the average number of
suppliers per country, the number of domestic clients to which his/her firm supplies
products, the number of employees including overseas staff, the percentage of overseas
staff, his/her firm�s business classification, his/her firm�s major product category, annual
gross sales, and the title of the respondent. This information was not directly used in the
main statistical analysis; however, it was included in Chapter V, Results and Analysis, to
provide more detailed contextual information about the study participants.
Survey Instrument Refinement
The survey instrument was refined, modified, and pre-tested through a series of
processes before being finalized. First, to ensure face or content validity, a preliminary
survey instrument was evaluated by five academic professors in the areas of consumer,
apparel, and retail studies and education research methodology. During this process,
survey questions were re-stated, using a common introduction to introduce the general
question. This procedure significantly reduced redundancy with regard to questions and

95
spaces. The response brackets of firms� various demographic information (for example,
11%-20%) were also revised to be intuitively more familiar and clear (for example, 10-
19%). All other suggested revisions were editorial and were implemented.
Next, in order to evaluate individual item content, clarity of instructions, and
response format, the revised survey was further refined through pre-testing. The pre-test
questionnaire was sent in an envelope designed for the full survey package. A total of 15-
20 apparel import firm managers received the pre-test questionnaire, including the 13
executives who participated in the first phase qualitative interview studies. Seven of them
replied. No systematic problems were identified. Relevant editorial changes were
implemented. This process of participation confirmation sought to enhance the validity of
the results of the qualitative interview studies (Nelson et al., 2002). Appendix D presents
the final version of the survey.
Survey Package
To improve the accuracy of response and to encourage completion of the
questionnaire, the format of the questionnaire was designed to be brief and easy-to-read.
The physical format of the questionnaire was taken into consideration. The questionnaire
was printed on standard-sized 8 ½� x 11� paper and folded in half to form a respondent-
friendly booklet format. The survey package included (a) a personalized cover letter on
letterhead stationery; (b) a consent form to act as a human participant; (c) a copy of the
questionnaire booklet; and (d) a self-addressed, first-class postage stamped envelope for
returning the questionnaire.

96
Letterhead stationery is typically considered important, partly because of its
integral connection to personalization efforts (Dillman, 2000). The study prepared the
cover letter on letterhead stationery from the Department of Consumer, Apparel, and
Retail Studies at the University of North Carolina at Greensboro (UNCG) to solicit firms�
participation proactively. This cover letter was folded in half in a way that when the
packet is unfolded, the respondent would simultaneously see the letter personally
addressed to them. In Paxson, Dillman, and Tarnai�s (1995) study, surveys addressed to
individual persons achieved much higher response rates compared to those addressed to
the company. The cover letter also stated that should the addressee not be the most
qualified individual at the firm to answer the survey, to please forward the survey to the
most qualified individual for completion.
Additionally, the cover letter included the purpose of the survey, directions on
how to respond to the survey questionnaire, confidentiality issues concerned with the
survey study, and an incentive. Upon participants� request, as an incentive, the study
offered a detailed Advanced Executive Summary of the results, including relevant and
applicable information that may help the respondents with practical business problems.
No other type of incentive was provided. Respondents were also requested to complete
the survey and return it to the researcher before a specific deadline (three weeks from
mailing). The average time to complete the survey was 15 to 20 minutes. Examples of the
survey questionnaire and the cover letters are presented in Appendix D, Appendix E, and
Appendix F.

97
A long version of the consent form to act as a human participant, approved by the
UNCG Institutional Review Board, was printed in the size of 5 ½� x 8 ½� to be
consistent with the size of the survey questionnaire booklet. Next, a copy of the
questionnaire booklet followed the consent form. Finally, a self-addressed, first-class
postage stamped return envelope completed the survey package. Several experimental
studies indicated that a stamped return envelope significantly helped to increase response
rates and generated faster responses compared to a business reply envelope, perhaps
affecting statistical significance analysis (Armstrong & Luske, 1987; Dillman, Clark, and
Sinclair, 1995). As per Dillman (2000), when the respondents see an uncancelled postage
stamp placed on a return envelope, they recognize monetary value has been given to
them; they may have a positive and helpful attitude to survey responses. It might also
encourage the respondents to trust that the questionnaire is important, thus they are more
likely to pay attention to the survey. Additionally, it might be culturally difficult for many
people to throw away something that has monetary value.
The entire material was arranged in the order described above and inserted in a
6½� x 9 ½� booklet-size envelope. Similar to official letterhead stationery, the outgoing
envelope was specially prepared with an official logo of the department and university
and full contact information to emphasize personalized efforts. The survey package was
sent out during November 2006, by first-class postage. According to Dillman (2000),
first-class postage is superior to bulk rate mail in survey response rates. Bulk rate mail is
delivered at a lower priority than first-class mail and may look inconsistent with the
image of importance that the study may seek. Dillman also argued that first-class postage

98
mail could be sufficient motivation for the respondents to open the envelope when it is
delivered.
Sample
The study drew its sample frame through ReferenceUSA, an Internet-based
reference service from the Library Division of infoUSA (ReferenceUSA, 2006).
ReferenceUSA provides detailed information on more than 14 million U.S. businesses,
including an address, phone number, estimated sales, number of employees, and other
information. It also has powerful search options to find firms by specific industries
according to SIC or NAICS codes.
Due to AIIs� �identity issues� reported in the first phase qualitative interview
studies, the study�s sample was generated from the population of U.S. apparel
manufacturers and wholesalers that are currently importing apparel products for the
purpose of reselling goods to other wholesalers or retailers. The study did not include U.S.
apparel retailers that import apparel products to make direct sales to individual consumers.
Consequently, the study generated a list of potential sample firms under NAICS codes
315 (apparel manufacturers), 42432 (men�s and boys� clothing and furnishing merchant
wholesalers), and 42433 (women�s and girls� clothing and furnishing merchant
wholesalers).
Footwear wholesalers (NAICS 42434) or piece goods and notion wholesalers
(NAICS 42431) were excluded from the study�s sample frame as their major products are
other than apparel. Although the study�s definition of AIIs included apparel merchandise
agents and brokers who trade apparel products on a commission basis without taking title

99
to goods, it was not possible to identify these firms as unique entities under the current
NAICS codes. Today, the NAICS tracks wholesale agents and brokers under the category
of nondurable goods (NAICS 4251204) without further specifying other types of
nondurable goods. Furthermore, the proportion of this category within the wholesale
sector was relatively small, and, thus this particular business type did not seem to make
significant contributions in the overall wholesale sector. As per the 2002 economic
census, nondurable goods wholesale agents and brokers (NAICS 4251204) accounted for
only 9.9% of nondurable goods merchant wholesalers (NAICS 424) (U.S. Census Bureau,
2006, February 15). Thus, exclusion of apparel merchandise agents and brokers was
deemed appropriate.
In business survey research, it is particularly important to specify what constitutes
a separate organization or firm for purposes of the survey because different people may
have different perspectives on the boundary of an organization (Dillman, 2000).
Consequently, the study clarified the unit of the study�s investigation as (a) each firm
with a name and location in a particular community as a separate business; and (b) each
division within the multi-divisional corporation as a separate business, regardless of its
location. For example, if a firm has multiple offices performing similar functions across
the nation, each office in a different community was considered a separate business as
each office is believed to utilize independent firm capabilities, to achieve different
competitive advantages, and to produce various performance outcomes (Dillman, 2000).
If a firm is an extremely large corporation with multiple divisions, such as men�s,
women�s, and children�s, each division was regarded as a separate business as these

100
divisions are believed to be mutually exclusive enough for their independent capabilities,
different competitive advantages, and various performance outcomes. In order to avoid
possible information duplication that might be caused by multiple responses from a single
unit of a firm, the study specifically solicited only one response from each firm.
As a result, a list of 19,595 firms including both apparel manufacturers and
apparel wholesalers was generated as the study�s sample population as of September 25,
2006. This list was arranged in alphabetical order of the firms� names within each state.
Then, the group of states was placed in alphabetical order. To ensure randomness of
sample selection, every fifteenth firm was chosen, resulting in a list of approximately
1,175 firms nationwide as the study�s initial sample frame.
Next, the researcher contacted each firm in the list of apparel firms via phone or
email to confirm whether the firm was currently operating and engaged in apparel
importing as well as to verify the contact information and its current mailing address. The
target respondents for the survey were firm executives with titles such as president, chief
executive officer, chief operating officer, vice president of merchandising, vice president
of sales, vice president of international operation, head of production/sourcing
department, head of merchandising department, head of sales department, chief
merchandiser, and chief designer. These executives are, in general, believed to be the
most knowledgeable about broad-based firm characteristics and those most capable of
making reasonable judgments about their firm�s strategic operations, competitive
advantages, and performance in recent years (Cavusgil & Zou, 1994; Morgan et al.,
2004). This verification process was repeated until the study reached to a list of 807 firms

101
across the nation as the study�s final sample frame. It was anticipated that this sample
frame would produce sufficient survey responses for the purpose of the study by using
Dillman�s (2000) Mixed-mode Survey technique. This technique is discussed in the Data
Collection Procedures section in more detail.
Data Collection Procedures
The self-administered survey is a useful research technique to estimate the
distribution of characteristics in a population, and it allows researchers to sample a large
number of respondents over a wide geographic area (Dillman, 2000). Therefore, the study
employed the self-administered survey using Dillman�s Mixed-mode Survey technique,
suggesting various modes of follow-up contacts for data collection to enhance the survey
response rate. The study surveys were mailed to a total of 807 U.S. apparel firms in mid
November 2006 after pre-verification of the apparel firms� addresses as described earlier.
A full package of the survey included an individual cover letter, human subject consent
form, and prepaid envelope.
Three weeks after the initial mailing of the survey, the researcher made follow-up
contacts via phone calls, e-mail, and personal visits to the firms who had not yet
responded. The researcher conducted follow-up contacts at least twice per firm. This type
of Mixed-Mode Survey technique has become more popular as people�s ability to screen
telephone interviews and personal e-mail communications have increased. By using
similar techniques, Mooney, Giesbrecht, and Shettle (1993) increased an initial response
rate ranging from 63 to 79% to an overall response rate of 88% in their study of the
National Survey of College Graduates. Although the target respondents were firm
102
executives, not college students, the study aimed to achieve high response rates by
incorporating Dillman�s (2000) technique.
A follow-up survey replacement, where still interested firms had not received, had
lost, or could not find the original mailing, was also made by mailing, emailing, or
personal handouts as requested. As an additional effort to increase the study�s response
rate, the study offered different options of survey responses when providing replacement
of the survey. If requested, the researcher sent replacement of the survey either by mail or
e-mail based on potential respondents� preferences. Groves and Khan (1979) argued that
people prefer different modes of response and if such preferences are important to them,
it may affect their willingness and desire to respond. Thus, this type of switching
response modes were believed to draw new possibilities for communicating greater
rewards, lower costs, and increased trust by emphasizing the importance of the study and
encouraging participation (Dillman, 2000).
As a final step, a postcard or an e-mail message was sent out to all respondents to
express appreciation for their participation and provide those requesting the study results
with a tentative date of provision of the executive summary.

103
Data Analysis Techniques
Descriptive Data Analysis and Response Rates
Once the survey results arrived, each survey response was tracked by the date it
arrived and by whether the response was a result of follow-up contacts. Survey responses
were then transferred into an Excel file for initial descriptive data analysis, including
response rates, the basic characteristics of the sample respondents, non-response bias, and
measurement differences. Comparisons were made using frequencies and percentages to
obtain the general characteristics of the survey respondents.
Non-response Bias and Measurement Differences
To assess potential non-response bias in the data, a comparison between early and
late responses was made with respect to each construct measure (Armstrong & Overton,
1977; Lambert & Harrington, 1990). Any responses returned within three weeks from
initial mailing were considered early responses. Any responses after three weeks were
categorized as late responses. In order to check potential non-response bias, the sample
was split into two groups�early responses and late responses�and tested for statistically
significant differences between the two groups, using Multivariate Analysis of Variance
(MANOVA) for the study�s construct measures.
In addition to non-response bias in the data, the study examined measurement
differences, possibly caused by the Mixed-mode Survey technique. As per Dillman
(2000), this technique might help to increase response rates; however, it could also raise a
few issues, such as the possibility that people may give different answers when different
modes of distribution for the survey or different modes of follow-up contacts are made.

104
This issue may create potential measurement differences. Consequently, to check
potential measurement differences in the data, the sample was split into two groups�
without follow-up responses and with follow-up responses�and tested for statistically
significant differences between the two groups, using Multivariate Analysis of Variance
(MANOVA) for the study�s construct measures.
Measurement Model Estimation
After completing initial descriptive data analysis, first, the study�s construct
measures were purified, employing exploratory factor analysis (EFA) and reliability
analysis (Morgan et al., 2004). Measurement purification was particularly important for
this study as the scales adopted from the export literature and new scales drawn from the
first phase qualitative interview studies have never been applied to the AII setting. In
general, the goal of factor analysis is to refine the variables in the most parsimonious
number of factors and, thus, factor analysis is designed to find the variables with high
correlations among themselves but low correlations with all other variables (Rencher,
2002). Particularly, EFA is a useful tool to determine how many factors are necessary to
explain the relationships among the observed indicators when the number of factors is
absolutely unknown (Raykov & Marcoulides, 2000).
Initially, all 50 variables were divided into three groups representing the study�s
constructs: (a) 18 items for AIIs� capabilities (from V1 to V18); (b) 14 items for
competitive advantages (from V19 to V32); and (c) 18 items for AIIs� performance (from
V33 to V50). Next, EFA using the oblique rotation method was conducted for each
construct separately as this rotation method is the most appropriate when the researcher�s

105
goal is to obtain several theoretically meaningful factors or constructs (Hair et al., 1998).
When analyzing the results of EFA, both latent root criterion (eigenvalues greater than 1)
and the percentage of variance criterion were used to obtain the most significant and
theoretically meaningful number of factors for each construct. That is because, often,
decisions based on eigenvalues greater than 1 alone are not the most effective when there
are fewer than 20 variables, as these decisions have a tendency to extract too few factors
(Hair et al., 1998). During the analysis, individual items were also examined. Items with
low item-to-total correlations, low loadings on the intended factors, and high cross-
loadings were removed. Additional EFA was conducted to reach a set of items with
theoretically meaningful, high loadings on the intended factors, low cross-loadings, and
high reliability coefficients for each construct.
Once the number of underlying factors of each construct was identified by EFA,
the measurement model was assessed using LISREL 8.72 (Jöreskog and Sörbom,
Scientific Software International) with variance-covariance input. In general, the
measurement model (a) specifies the indicators for each construct in a confirmatory mode
and (b) assesses the reliability and validity of each construct (Hair, Anderson, Tatham, &
Black, 1998). Thus, the measurement model was necessary to ensure a satisfactory level
of measurement reliability and validity for the underlying variables and their respective
factors in the model before examining the causal relationships among the latent variables.
Each measurement model was assessed using maximum likelihood (ML) estimation, as
ML is the most widely used estimation technique (Hair et al., 1998). Additionally, ML
has been recently found to perform reasonably well under various less-than-optimal

106
analytic situations, such as small sample size and excessive kurtosis (Hoyle & Panter,
1995). It is generally accepted that the minimum sample size to ensure appropriate use of
ML estimation is 100 to 150 (Hair et al., 1998). The variance-covariance matrix was
recommended for data analysis because it is considered an appropriate data form for
validating causal relationships (Hair et al., 1998).
The first step in evaluating the study�s measurement model was to assess
�offending estimates,� including negative error variance, standardized coefficients
exceeding or very close to 1.0, or very large standard errors associated with any estimated
coefficient (Hair et al., 1998, p. 610).
The second step of the study�s measurement model evaluation was to examine an
overall model fit with one or more goodness-of-fit measures (Hair et al., 1998).
Goodness-of-fit measures the correspondence of the actual or observed input matrix with
that predicted from the proposed model (Hu & Bentler, 1995). However, there seemed to
be unanimous agreement among SEM researchers that not all estimation methods and fit
indices lead to the same inferential outcome when evaluating structural equation models
(Hu & Bentler, 1995). Thus, a number of indices were used for the study�s overall model
fit evaluation.
Among absolute fit indices, the value of chi-square statistics was evaluated for an
overall model fit as it is reported to be promising when the sampling distribution is
known, despite its sensitivity to sample size and the multivariate normality distribution
assumption (Hoyle & Panter, 1996; Hu & Bentler, 1995). This statistic was reported with
degrees of freedom, sample size, and p-value. The Root Mean Square Error of
107
Approximation (RMSEA) was also used as it is a popular index of an overall model fit
and takes into account model complexity, reflected in the degrees of freedom.
Additionally, unlike the chi-square value, the RMSEA is not sample-dependent (Raykov
& Marcoulides, 2000). RMSEA values below 0.05 typically indicate a very good fit to
the data, while values below 0.08 suggest a generally good fit to the data. The upper
acceptable threshold of the RMSEA value is 0.10 (Hair et al., 1998).
The Goodness-of-Fit Index (GFI) was another absolute fit index that the study
used. GFI represents the proportion of variance and covariance that the proposed model
explains (similar to R2 in a regression analysis). Although the GFI is moderately
associated with sample size, it provides intuitive interpretations because that is analogous
to the familiar R2 value reported in regression analysis (Tanaka, 1993). It is generally
accepted that models with a GFI above .90 present a reasonably good approximation of
the data, however, there is no absolute threshold level of acceptability that has been
established (Hair et al., 1998).
In addition to absolute fit indices, Hoyle and Panter (1995) suggested at least two
incremental fit indices. The study reported Tucker & Lewis�s (TLI), also called the
Nonnormed Fit Index (NNFI), and the Comparative Fit Index (CFI). As per Hu and
Bentler (1995), TLI estimates the degree to which a particular exploratory factor model is
an improvement over a zero factor model when assessed by ML, and NNFI was proposed
after generalizing TLI to all types of covariance structure models under various
estimation methods. TLI or NNFI both perform well when ML estimation is used (Hoyle
& Panter, 1995). Finally, CFI estimates the relative reduction in lack of fit as estimated

108
by the noncentral chi-square statistic of a target model versus a baseline model (Hoyle &
Panter, 1995). In general, TLI/NNFI and CFI with values above .90 indicate a good fit to
the data.
The third step in evaluating the study�s measurement model was to examine the
measurement model fit. In other words, once the overall model fit had been evaluated, the
measurement of each construct was assessed for reliability and validity (Hair et al., 1998).
Reliability of measurement instruments in SEM is particularly important as structural
equation models with unreliable measures may suggest exaggerated effects and magnify
the degree of parameter estimate effects (Kaplan, 2000). Reliability refers to the internal
consistency of a set of measurements or a measuring instrument. Thus, the indicators of
highly reliable constructs are highly inter-correlated, suggesting that they all are
measuring the same latent construct (Hair, et al., 1998). In the study�s measurement
model, composite reliability coefficients of the constructs were computed, using the
following Spearman-Brown formula:
rqrq
)1(1 −+=α
where r is the average pairwise correlation for the observed measures being aggregated
and q is the number of measures loading on the composite trait (DeVellis, 1991).
Reliability does not ensure validity because the measures might be quite reliable,
yet, they might not measure a valid construct. (Hair et al., 1998). Validity refers to the
extent to which the indicators accurately measure what they are supposed to measure.

109
The study discussed and evaluated three types of validity�content validity, convergent
validity, and discriminant validity�that are most commonly discussed in the literature.
Content validity, also called face validity, assesses the correspondence of the
variables to be included in a summated scale and its conceptual definition (Hair et al.,
1998). To include theoretical and practical considerations, the correspondence between
the individual items and the concept is often subjectively evaluated by expert judges,
pretests, or other similar methods (Morgan et al., 2004). In this study, content validity of
the survey was grounded by combining relevant extant scales and qualitative research
findings on apparel import intermediaries. Additionally, the preliminary survey
instrument was evaluated by five academic researchers in the apparel business and
educational research methodology areas, who served as expert judges. The process of
pre-testing and revising survey items helped to ensure the content validity of the survey.
Convergent validity refers to the degree to which two measures of the same
concept are correlated (Hair et al., 1998). High convergent validity indicates that the scale
is measuring its intended concept. Thus, whether all indicators load significantly on
designated constructs is a good way of assessing convergent validity. The study reviewed
items loadings and t-values of each loading to evaluate the significance of each loading.
If a t-value of an item loading is greater than the critical value of 1.96, then the study
considered that item loading to be statistically significant at a 95% confidence level
(Fornell & Larcker, 1981).
Discriminant validity refers to the degree to which two conceptually similar
concepts are distinct (Hair et al., 1998). In other words, different indicators are used to
110
measure different constructs and the indicators of different constructs should not be
highly correlated. Thus, discriminant validity analysis refers to testing statistically
whether two constructs differ. In this study, discriminant validity among all of the study
measures was assessed by examining the correlations between each possible pair of
constructs. Any correlations of inter-factors with values exceeding .80 were examined for
possible multicollinearity (Hair et al., 1998). The confidence interval of 2 standard errors
around the correlation between each possible pair of constructs was also reviewed to see
whether it included 1.0. If it does, then the researcher failed to demonstrate discriminant
validity (Carr & Pearson, 2002).
Structural Model Estimation
Once the measurement model had been evaluated and the study measures had
been validated, the structural model (or structural regression model) was examined to test
the plausibility of hypothetical relationships among latent variables (Raykov &
Marcoulides, 2000). This two-step approach�the measurement model and the statistical
model�have been preferred by many researchers because they believe that accurate
representation of the reliability of the indicators is best accomplished in two steps to
avoid the interaction of measurement and structural models (Hair et al., 1998).
Similar to an overall fit evaluation of the measurement model, multiple fit indices,
including the chi-square statistic, RMSEA, GFI, TLI/NNFI, and CFI were assessed for an
overall structural model fit based on ML estimation. Path coefficient estimates, t-values,
and significance levels for the structural paths were evaluated to investigate the causal
relationships among the study�s constructs as proposed in the integrative model of AIIs�

111
capabilities, competitive advantages, and performance in a hyper-dynamic market
environment. The direct effect of AIIs� positional advantages and the indirect effect of
AIIs� functional capabilities on AIIs� performance outcomes were also explored.
Finally, post hoc model modifications were conducted to provide alternative
models. This involved the comparison of model results to determine the best fitting
model from a set of models (Hair et al., 1998). As a part of a model development
strategy, the study started with an initial model and engaged in a series of model re-
specifications, each time hoping to improve the model fit while maintaining accordance
with the underlying theory. A number of measures were used to compare models,
including the overall model fit in absolute terms, a series of parsimonious fit measures,
the comparison of the chi-square values for the different models, and the effect of adding
or deleting one or more causal relationships (Hair et al., 1998).

112
CHAPTER V
RESULTS AND ANALYSIS
Chapter V presents the following sections: (a) Sample Description and Response
Rate, (b) Characteristics of the Survey Respondents, (c) Results of Testing for Non-
response Bias and Measurement Differences, (d) Measurement Model Analysis Results,
(e) Structural Model Analysis Results, (e) Testing of Research Hypotheses, and (f) Post
Hoc Model Modifications.
Sample Description and Response Rate
A total of 165 responses to the study survey had been received by the end of
December 2006. Table 5.1 presents the sample response rate.

113
Table 5.1.
Sample Response Rate
Frequency
Percentage
Initial sample frame
807
100%
Firms not participating for the following reasons:
Not interested or a �no survey� policy Not reachable (e.g. closed, moved, or wrong address)
65
23 42
8.1%
2.9% 5.2%
Returned surveys: Apparel import intermediaries Apparel manufacturers (2 incomplete responses) Apparel retailers
165
159
5 1
20.4% 19.7%
0.6% 0.1%
Adjusted sample frame: 742
Adjusted response rate: 22.2% (165/742)
Adjusted sample frame of AIIs: 736 Adjusted effective response rate with the AII respondents: 21.6% (159/736)
Requests for the study results: 33.9% (56/165)
Out of the randomly selected 807 possible survey participants, despite the pre-
verification of the firm�s addresses and contact information of apparel wholesale firms
via phone calls and email, 65 (8.1%) firms were excluded from data collection as they
were not interested in the study or were not reachable by the end of December 2006.
Twenty-three (2.9%) firms openly refused to participate in the survey. These firms�
executives or their secretaries expressed that either they were not interested in the study
or their firm had a �no-survey� policy. Forty-two (5.2%) firms were not reachable as they

114
seemed to have closed for business or had moved with no forwarding address or phone
number between the time of the researcher�s verification contact and the time when the
survey was delivered. This statistic implied that over 5% of apparel firms closed or
moved during the last quarter of 2006, suggesting a highly dynamic and accelerated
business environment in today�s U.S. apparel industry.
After subtracting the 65 firms that would not be participating in the survey, the
study yielded an adjusted sample size of 742. By the end of the data collection, a total of
165 responses had been received, indicating an adjusted response rate of 22.2%. Based on
the percent of the firm�s total sales from domestic manufacturing and the percent of the
firm�s total sales from direct retailing, the study classified 159 firms as AIIs, 5 firms as
apparel manufacturers, and 1 firm as an apparel retailer. This classification resulted in the
study�s effective response rate of 21.6%, excluding apparel manufacturers and apparel
retailers. More detailed information on respondents� business classification is discussed
in the next section, the characteristics of the survey respondents.
The overall quality of the responses was excellent. Only two responses were
returned incomplete. These two respondents expressed that part of the survey questions
were irrelevant for their business practices as they were strictly involved with apparel
manufacturing without any import operations. Consequently, these responses were not
included in the later data analysis which used only responses from AIIs. The survey
respondents� interest in this study was also clear. Fifty six out of 165 (33.9%)
respondents indicated that they would like to receive an advanced executive summary of
the study findings. Additionally, some respondents provided information on the size of

115
their companies, detailed information on their products, and gave special encouragement
to the researcher for pursuing the study.
Characteristics of the Survey Respondents
Identifying AIIs
Considering the suspected �identity crisis� among AIIs, one of the critical
processes of the data analysis was to properly identify AIIs by the study�s definition. First,
the study evaluated the firm�s ownership status of domestic manufacturing facilities and
the degree of manufacturing operations to isolate apparel manufacturers from AIIs.
Second, the study assessed the firm�s ownership status of direct retail stores and the
degree of retailing operations to differentiate apparel retailers from AIIs. Third, the
results of the business classifications based on the study�s definition were compared with
those based on the responses by the survey participants. Table 5.2 describes the
breakdown of domestic manufacturing and retailing operations of the survey respondents.
No other apparent stratification variables were considered in the data analysis.
First, in investigating the firm�s involvement with domestic manufacturing
operations, 11 out of 165 (6.7%) firms indicated that they owned domestic apparel
manufacturing facilities, whereas the majority of the respondents, 154 out of 166 (93.3%)
firms, indicated that they did not own domestic apparel manufacturing facilities. Among
the 11 firms that owned domestic manufacturing facilities, the percent of total sales
generated from their domestic manufacturing facilities was then explored to assess the
degree of the firm�s domestic manufacturing operations. Six out of 11 (54.5%) firms with
manufacturing facilities generated less than 30% of their sales from these domestic

116
manufacturing facilities. Only 5 out of 11 (45.5%) firms had over 50% of their total sales
generated from their own domestic manufacturing facilities. None of the respondents
indicated the firm�s domestic manufacturing operations in the range of 30% to 49%. It
seemed that 30% of domestic manufacturing operation was a natural breakpoint in
distinguishing AIIs from apparel manufacturers who base over 50% of their sales on their
domestic operations. This comparison suggested that over half of U.S. apparel firms that
own domestic manufacturing facilities may be, in fact, involved in other than domestic
manufacturing operations, such as wholesaling or importing.
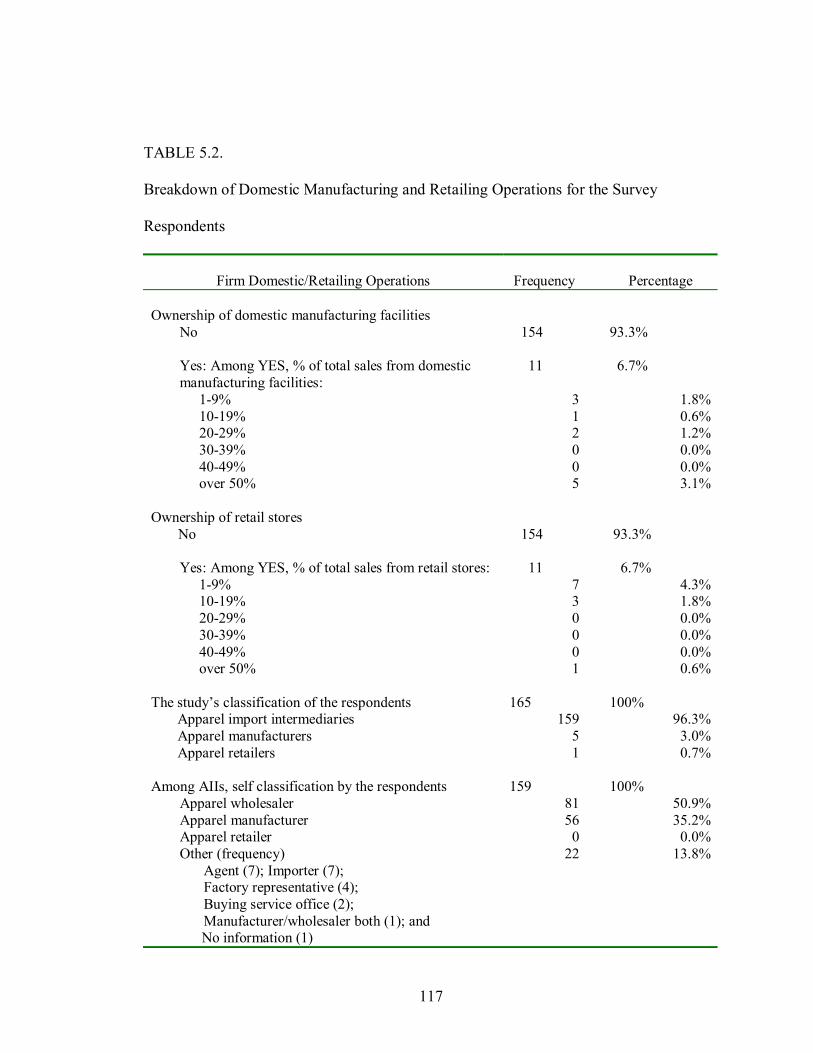
117
TABLE 5.2.
Breakdown of Domestic Manufacturing and Retailing Operations for the Survey
Respondents
Firm Domestic/Retailing Operations
Frequency
Percentage
Ownership of domestic manufacturing facilities
No Yes: Among YES, % of total sales from domestic manufacturing facilities:
1-9% 10-19% 20-29% 30-39% 40-49% over 50%
154
11
3 1 2 0 0 5
93.3% 6.7%
1.8% 0.6% 1.2% 0.0% 0.0% 3.1%
Ownership of retail stores No Yes: Among YES, % of total sales from retail stores:
1-9% 10-19% 20-29% 30-39% 40-49% over 50%
154
11
7 3 0 0 0 1
93.3%
6.7%
4.3% 1.8% 0.0% 0.0% 0.0% 0.6%
The study�s classification of the respondents Apparel import intermediaries Apparel manufacturers Apparel retailers
165 159
5 1
100%
96.3% 3.0% 0.7%
Among AIIs, self classification by the respondents Apparel wholesaler Apparel manufacturer Apparel retailer Other (frequency)
Agent (7); Importer (7); Factory representative (4); Buying service office (2); Manufacturer/wholesaler both (1); and No information (1)
159 81 56 0
22
100%
50.9% 35.2% 0.0%
13.8%

118
Second, in order to distinguish AIIs from apparel retailers, the study evaluated the
responses on the firm�s ownership of retail stores making direct sales to end-users. While
11 out of 165 (6.7%) firms stated that they own retail stores, 10 out of 11 (91%) firms
indicated that the percent of their total sales generated from their retail stores was less
than 20%. Only 1 out of 11 (9%) firms had over 50% of its sales coming from its own
direct retailing operations. None of the respondents indicated that their retail sales fell in
the range of 20% to 49%. It seemed that generating 20% of sales from retailing
operations seemed to be a natural breakpoint in distinguishing AIIs from apparel retailers
who base over 50% of their total sales on direct retailing operations. This comparison
suggested that a small portion of AIIs are involved with retailing, however, in general
retailing activities appeared to be relatively insignificant.
Using the above heuristics, the study further refined the initial screening of firms
in order to include only firms that met the study definition of AIIs. The survey
respondents under these additional heuristics were classified into three categories,
resulting in 1 retailer, 5 apparel manufacturers, and 159 AIIs. Some AIIs generated less
than 30% of their sales via domestic manufacturing facilities, others made less than 20%
of total sales from retailing operations. The majority of AIIs were engaged in neither
domestic manufacturing nor retailing activities. This finding was consistent with that of
the first phase qualitative interview studies.
Third, once identified based on the study�s definition; the survey respondents� self
classification on their firms� business types was reviewed. Consistent with the first phase
qualitative interview studies, the survey respondents indicated various types of business

119
classifications for their firms� major business operations. Among 159 AII respondents
based on the study�s definition, 56 (35.2%) respondents classified themselves as apparel
manufacturers. Of the 56, 50 actually had no domestic manufacturing operations
whatsoever, while 6 of the 56 did have domestic manufacturing facilities, but produced
less than 30% of their sales from these facilities. Based on this, the vast majority of their
business activities were from import operations, and they should be classified as AIIs. It
was clear that the study participants were confused with their identities as manufacturers.
Twenty-two out of 159 (13.8%) AII respondents indicated �other� as their firms�
business classifications, including agents (7 responses), importers (7 responses), factory
representatives (4 responses), and buying service offices (2 responses). One respondent
specifically expressed that his or her firm is a manufacturer/wholesaler both. Another
respondent did not specify his or her firm�s business type at all. These findings were
particularly interesting in that some executives of apparel agents, importers, factory
representatives, or buying service offices did not consider themselves to be wholesalers
despite the fact that the government classification system describes them as wholesalers.
In conclusion, consistent with the first phase qualitative interview studies, the
findings suggested that nearly 50% of AII executives seemed to be confused about their
business types. Some were convinced that they were manufacturers despite little domestic
manufacturing involvement. Others did not identify themselves as any of the business
types described by the U.S. government classification system.

120
Geographic Locations
Initial surveys were sent to 28 states across the United States after pre-verification
of qualified firms� addresses and contact information via phone calls and email. Of the
807, 667 (82.7%) surveys were sent to the state of New York given that New York
dominated AIIs business operations. By the end of the data collection, the survey
responses were received from 16 states with 76.4% of the total responses from the state
of New York.
The response rate was also reviewed per state. Over 50% of the responses came
from firms in the states of Maryland, Illinois, Oklahoma, Tennessee, Philadelphia,
Louisiana, Virginia, and Colorado. Between 14.3% and 37.5% of the responses were
obtained from firms in the states of New York, California, New Jersey, North Carolina,
Georgia, Minnesota, Missouri, and Texas. Table 5.3 displays the geographic locations of
the survey respondents� business operations in order of the percentage of total responses.
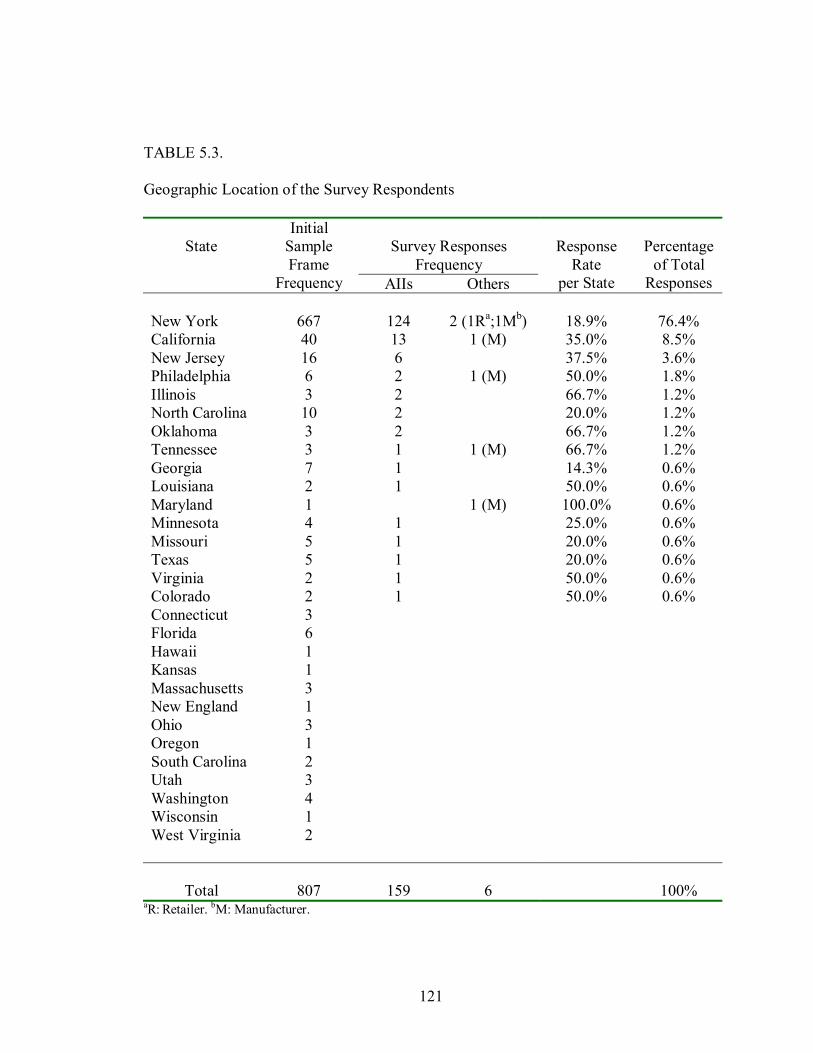
121
TABLE 5.3.
Geographic Location of the Survey Respondents
State
Survey Responses
Frequency
Initial Sample Frame
Frequency AIIs Others
Response
Rate per State
Percentage
of Total Responses
New York California New Jersey Philadelphia Illinois North Carolina Oklahoma Tennessee Georgia Louisiana Maryland Minnesota Missouri Texas Virginia Colorado Connecticut Florida Hawaii Kansas Massachusetts New England Ohio Oregon South Carolina Utah Washington Wisconsin West Virginia
667 40 16 6 3 10 3 3 7 2 1 4 5 5 2 2 3 6 1 1 3 1 3 1 2 3 4 1 2
124 13 6 2 2 2 2 1 1 1
1 1 1 1 1
2 (1Ra;1Mb)
1 (M)
1 (M)
1 (M)
1 (M)
18.9% 35.0% 37.5% 50.0% 66.7% 20.0% 66.7% 66.7% 14.3% 50.0% 100.0% 25.0% 20.0% 20.0% 50.0% 50.0%
76.4% 8.5% 3.6% 1.8% 1.2% 1.2% 1.2% 1.2% 0.6% 0.6% 0.6% 0.6% 0.6% 0.6% 0.6% 0.6%
Total
807
159
6
100%
aR: Retailer. bM: Manufacturer.

122
Business Operations
The characteristics of AIIs� business operations dealing with domestic clients and
foreign suppliers were manifested through various survey questions, including the
percent of total sales from import operations, years of import operations, the number of
countries from which the firm imports products, the number of suppliers per country, and
the number of domestic clients to which the firm made sales. Table 5.4 summarizes
detailed information on the business operations characteristics of the AII study
respondents.
First, it was clear that most AII firms were deeply engaged in apparel import
operations. Approximately 85% of the AII respondents claimed that over 90% of their
total sales were generated from their own import operations. Only 5% of the AII
respondents indicated that less than half of total sales came from their own import
operations, implying a significant portion of domestic product purchasing. In other words,
most AIIs appeared to be heavily involved with importing, directly dealing with foreign
suppliers; yet only a small portion of AIIs seemed to make wholesaling transactions
domestically. This finding provided direct empirical support for the study�s position of
the need for a new term, apparel import intermediaries, to identify a segment of today�s
apparel supply channel members properly. As these statistics indicated, AIIs appeared to
be clearly different from traditional supply channel members such as wholesalers or
jobbers who are generally considered to make domestic transactions among domestic
manufacturers, retailers, and other wholesalers with little focus on import operations.

123
TABLE 5.4.
Business Operations Characteristics of the AII Survey Respondents
Business Operations
Frequency
Percentage
Percent of total sales from direct import operations:
Less than 49% 50 � 59% 60 � 69% 70 � 79% 80 � 89% Over 90%
159
8 7 4 1 4
135
100%
5.0% 4.4% 2.5% 0.6% 2.5%
84.9% Years of import operations:
Fewer than 9 years 10 � 19 years 20 � 29 years 30 � 39 years 40 � 49 years Over 50 years
159
30 51 47 25 5 1
100%
18.9% 32.1% 29.6% 15.7% 3.1% 0.6%
Number of countries from which the firm imports products:
Fewer than 4 5 � 9 10 � 14 15 � 19 20 � 24 Over 25
159
49 69 39 2 0 0
100%
30.8% 43.4% 24.5% 1.3% 0.0% 0.0%
Number of suppliers per country from which the firm imports products:
Fewer than 4 5 � 9 10 � 14 15 � 19 20 � 24 Over 25
159
122 29 8 0 0 0
100%
76.7% 18.2% 5.0% 0.0% 0.0% 0.6%
Number of domestic clients to which the firm sell products:
Fewer than 4 5 � 9 10 � 14 15 � 19 20 � 24 Over 25
157
14 36 41 32 5
31
100%
8.8% 22.6% 25.8% 20.1% 3.1%
19.5%
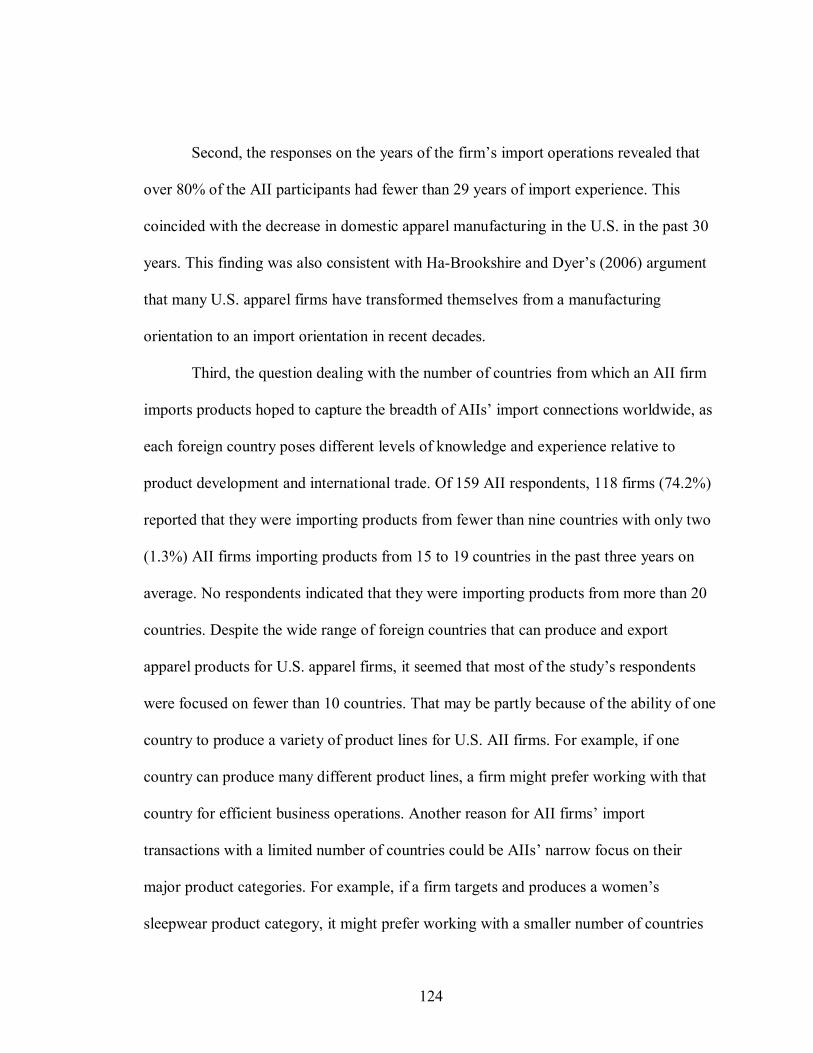
124
Second, the responses on the years of the firm�s import operations revealed that
over 80% of the AII participants had fewer than 29 years of import experience. This
coincided with the decrease in domestic apparel manufacturing in the U.S. in the past 30
years. This finding was also consistent with Ha-Brookshire and Dyer�s (2006) argument
that many U.S. apparel firms have transformed themselves from a manufacturing
orientation to an import orientation in recent decades.
Third, the question dealing with the number of countries from which an AII firm
imports products hoped to capture the breadth of AIIs� import connections worldwide, as
each foreign country poses different levels of knowledge and experience relative to
product development and international trade. Of 159 AII respondents, 118 firms (74.2%)
reported that they were importing products from fewer than nine countries with only two
(1.3%) AII firms importing products from 15 to 19 countries in the past three years on
average. No respondents indicated that they were importing products from more than 20
countries. Despite the wide range of foreign countries that can produce and export
apparel products for U.S. apparel firms, it seemed that most of the study�s respondents
were focused on fewer than 10 countries. That may be partly because of the ability of one
country to produce a variety of product lines for U.S. AII firms. For example, if one
country can produce many different product lines, a firm might prefer working with that
country for efficient business operations. Another reason for AII firms� import
transactions with a limited number of countries could be AIIs� narrow focus on their
major product categories. For example, if a firm targets and produces a women�s
sleepwear product category, it might prefer working with a smaller number of countries

125
that have sufficient resources and proper, effective labor skills for the women�s sleepwear
product category.
Fourth, the statistics on the number of suppliers per country from which an AII
firm imports products were also intended to canvass the intensity of AIIs� import
connections within a given foreign country. A small number of suppliers within a given
country might not be helpful for a large volume of products in a short time, while they
might be very helpful for an AII firm with efficient communication given that less
training and learning would be involved. Too many suppliers within a given country
might cause unnecessary competition among foreign suppliers for limited resources,
affecting U.S. AIIs� reputations for their business practices among foreign suppliers and
foreign suppliers� loyalty to U.S. AIIs in the long term. Interestingly, 122 out of 159
(76.7%) AII respondents indicated that they had dealt with fewer than four suppliers per
country in the past three years on average. Only 8 (5%) AII respondents reported that
they had 10 to 14 suppliers per country, and there was no response to having more than
15 suppliers per country. This finding also suggested that AIIs preferred working with a
limited number of business partners in a given country for a healthy long-term
relationship, as well as for efficient and effective business communication.
Finally, the number of domestic clients to which an AII firm sells products was
explored to ascertain the range of product lines and target markets that AII firms handle.
Contrary to the findings of the number of foreign suppliers as AIIs� business partners,
123 out of 159 (77.4%) AII respondents indicated that they have sold products to up to 19
different domestic clients in the past three years on average and 31 out of 159 (19.5%) of

126
AII respondents indicated they have sold to over 25 domestic clients. Compared to the
number of countries that AIIs focus on for their import operations, the number of AIIs�
domestic clients is much larger, suggesting AIIs are more actively seeking a variety of
domestic clients than they are a broad range of foreign suppliers. Considering different
clients representing different segments of consumers and products, AIIs appeared to be
strongly involved with domestic market research for a wide range of domestic clients in
the United States.
Business Characteristics
The characteristics of the survey respondents� businesses were assessed to provide
a better understanding of their basic nature. The questions included the number of
employees, the portion of overseas staff if any, annual gross sales, product category of
the firm�s major business, and title of the respondent�s position within the firm. Table 5.5
reports the characteristics of the AII firms participating in the study survey.
First, the number of employees (including overseas staff) was requested to obtain
an overview of the participant�s firm size in terms of the number of employees. Out of
159 AII respondents, 80 (50.3%) AIIs had fewer than 49 employees and 46 (28.9%) AIIs
employed 50 to 149 people, resulting in almost 80% of the AII respondents having fewer
than 149 employees. This finding suggested that a significant portion of U.S. AIIs would
be classified as relatively small business operations.

127
TABLE 5.5.
Business Characteristics of the AII Survey Respondents
Business Characteristics
Frequency
Percentage
Number of employees (including overseas staff):
Fewer than 49 50 � 149 150 � 299 300 � 499 500 � 749 Over 750
159
80 46 15 13 2 3
100%
50.3% 28.9% 9.4% 8.2% 1.3% 1.9%
Percent of overseas staff, if any:
0% 1 � 9% 10 � 19% 20 � 29% 30 � 39% Over 40%
159
76 45 16 0 3
19
100%
47.8% 28.3% 10.1% 0.0% 1.9%
11.9% Annual gross sales figure in US dollars:
Less than 4.9 million 5 � 24.9 million 25 � 49.9 million 50 � 99.9 million 100 � 499 million Over 500 million
159
29 30 22 24 49 5
100%
18.2% 18.9% 13.8% 15.1% 30.8% 3.1%
Product category of the firm�s major business:
Women�s Men�s Children�s and Infants� Sleepwear/underwear Fur/Leather Other: All of the above (2); Women�s and Men�s (1)
159
65 28 31 28 4 3
100%
40.9% 17.6% 19.5% 17.6% 2.5% 1.9%
Position title:
CEO/President General manager Vice President Division manager Other: Owner (9); Designer (2); Merchandiser (1)
159
63 13 46 25 12
100%
39.6% 8.2%
28.9% 15.7% 7.5%

128
Second, the percent of overseas staff out of the firm�s total number of employees
helped to grasp the intensity of AIIs� international business activities as keeping overseas
staffs may require a strong involvement and commitment in a given foreign market. More
than half of the AII respondents (52.2%) indicated that they did have overseas staff. Out
of 159 AII respondents, 61 (38.4%) had up to 19% of their employees operating overseas
and 19 (11.9%) had over 40% of their employees working overseas. This high percentage
of overseas staff among AIIs suggested an intensive involvement and commitment with
foreign supply markets, actively seeking personal hands-on information available only
from overseas partners.
Third, the firm�s annual gross sales figure in U.S. dollars was assessed to gage the
overall size of the participant�s firm in dollar terms. Out of 159 AII respondents, 81
(50.9%) reported that their annual sales figure was less than 49.9 million dollars,
coinciding with the 80 percent of AII respondents whose firm sizes were less than 49
employees. Meanwhile, 49 (30.8%) AII respondents generated annual sales between 100
million and 499 million dollars, with only 5 (3.1%) AII firms over 500 million dollars in
annual sales.
Fourth, the product category of the firm�s major business was asked for in order
to understand the types of products that the study participants handled. Out of 159 AII
respondents, 65 (40.9%) reported that their major business was related to women�s
apparel, 31 (19.5%) with children�s and infants� wear, 28 (17.6%) with men�s wear and
sleepwear/underwear respectively, and 4 (2.5%) with fur/leather and other product
categories. Three respondents indicated either all of the above or both men�s and

129
women�s. These statistics suggested that a wide variety of product categories were
handled by AIIs between foreign suppliers and domestic clients.
Finally, the title of the participant�s position within the firm was questioned to
ensure that the participant was qualified to respond to the survey questions as intended in
the study design. Out of 159 AII respondents, 63 (39.5%) were Chief Executive Officers
or Presidents, 46 (28.9%) were Vice Presidents, 25 (15.7%) were Division Managers, and
13 (8.2%) were General Managers. 12 (7.5%) specified themselves as other, including
Owners, Designers, and Merchandisers. These results confirmed that the survey
respondents were executives who were qualified to provide their firms� strategies and
performance.

130
Results of Testing for Non-response Bias and Measurement Differences
Non-response Bias and Measurement Differences
Out of total 159 AII respondents, 60 (37.7%) responses were categorized as early
responses and 99 (62.3%) were categorized as late responses. For each and all constructs
of AIIs� capabilities, positional advantages, and performance, the MANOVA test
statistics indicated that there were no statistically significant differences between the
early and late response groups with p-values all being higher than .10. The results
suggested that non-response bias should not be a problem in this study. Table 5.6 presents
the MANOVA test results for non-response bias.
Table 5.6.
MANOVA Test for Non-response Bias (Early and Late Responses)
Test Statistics
Construct Wilks�
Lambda Pillai�s Trace
Hotelling�s Trace
Roy�s Greatest
Root
F Value (d.f.)
p-Value
AIIs� Capabilities
Positional Advantages
AIIs� Performance
.995
.988
.995
.005
.012
.005
.005
.013
.005
.005
.013
.005
0.86 (1,157)
1.97 (1,157)
0.85 (1,157)
.356
.162
.357
Entire Constructs
.985 .015 .015 .015 0.79 (3,155) .502

131
Out of the total 159 AIIs responses, 63 (39.6%) responses were categorized as
without-follow-up responses and 96 (60.4%) were with-follow-up responses. For each
and all constructs assessing AIIs� capabilities, positional advantages, and performance,
the MANOVA test statistics indicated that there were no statistically significant
differences between the without-follow-up group and the with-follow-up group. P-values
were all higher than .10. The results suggested that measurement differences possibly
caused by different follow-up methods should not be a problem in this study. Table 5.7
details the MANOVA test results for measurement differences.
Table 5.7.
MANOVA Test for Measurement Differences (With-follow-up and Without-follow-up
Responses)
Test Statistics
Construct Wilks�
Lambda Pillai�s Trace
Hotelling�s Trace
Roy�s Greatest
Root
F Value (d.f.)
p-Value
AIIs� Capabilities
Positional Advantages
AIIs� Performance
.997
.999
.998
.003
.000
.002
.003
.000
.002
.003
.000
.002
0.44 (1,157)
0.00 (1,157)
0.30 (1,157)
.510
.980
.586
Entire Constructs
.984 .016 .016 .016 0.84 (3,155) .475
132
Measurement Model Analysis Results
Exploratory Factor Analysis
As a result of measure purification, the study obtained (a) three factors for AIIs�
capabilities (cumulative percentage of variance = 83.2%); (b) three factors for
competitive advantages (cumulative percentage of variance = 87.8%); and (c) two factors
for AIIs� performance (cumulative percentage of variance = 90.5%). Appendix J details
the full results of the EFA and reliability analyses.
Three interesting points were observed. First, only three significant factors
emerged for AIIs� capabilities. Many of the capability items adopted from the extant
literature performed poorly and were, thus, dropped from future data analysis. For
example, three items designed to capture firms� design capabilities turned out to be less
meaningful in the study. It was believed that the questions originally developed for
exporting manufacturers might not be successfully applicable to the AIIs� setting. �New
design� or �new product� in the apparel industry could mean simply new patterns or
styles for the extant product category, rather than a brand-new product category that had
never been introduced before, often requiring new manufacturing processes. Many of the
AII marketing capability items had similar problems, with EFA leading to only three
unique items explaining AIIs� capabilities in marketing. In short, conventional
terminology or understanding of a firm�s marketing capabilities did not successfully
translate to the AII setting. Instead, two items developed from the first phase qualitative
studies were found to be highly important variables. Thus, the study renamed �AIIs�

133
marketing capabilities� �AIIs� market interpretation capabilities� to more accurately
capture the critical meaning of the factor for AIIs.
Second, the initial EFA results of competitive advantages suggested only two
factors (cost and product advantages) were statistically significant based on latent root
criterion (eigenvalues greater than 1). However, the cumulative percentage of variance
with two factors was less than 80%, and this result contradicted extant theory that
overwhelmingly suggests service advantages represent an additional distinctive factor.
Furthermore, when reviewing the items to ensure face validity of these factors, it was
clear that service advantages represented by AIIs� technical support and after sales
service were distinctively different from cost or product advantages. Furthermore, service
advantages were particularly emphasized by the executive informants from the first phase
qualitative interview studies. Consequently, AIIs� competitive advantages were finalized
with three factors�cost, product, and service�for further data analysis.
Third, and interestingly, the EFA results revealed only two significant factors for
AIIs� performance�relationship performance with domestic clients and relationship
performance with foreign suppliers. Eight items detailing both AIIs� economic and
strategic performance factors were extremely highly correlated with the items of AIIs�
relationship performance with domestic clients. This finding implied that if a firm has a
good relationship with its domestic clients, then a firm is more likely to have positive
economic and strategic performance. Consequently, it was concluded that AIIs�
performance could be successfully manifested through their relationship performance
with both domestic and foreign business partners.

134
As a result, 22 measurement items of representing eight factors were retained for
further data analysis. The final eight factors were: (a) three factors for AIIs�
capabilities�market interpretation, sourcing, and service; (b) three factors for positional
advantages�cost, product, and service; and (c) two factors for AIIs� performance�
relationship performance with domestic clients and relationship performance with foreign
suppliers. The corresponding items for each factor are presented in Table 5.10.
Measurement Model Estimation
The set of 22 measurement items representing eight factors were subjected to
measurement model analysis (or confirmatory factor analysis), using maximum
likelihood estimation and variance-covariance matrix, to verify the proposed factor
structure. The relationships between the observed variables and their factors were
specified in the measurement model. Each factor in the model was allowed to covary
with each other factor. Additionally, the errors of each set of the observed variables V41
and V46, V43 and V47, and V44 and V48 were allowed to covary as these questions
were organized exactly the same, yet asked performance evaluations from two different
business partners�domestic clients and foreign suppliers, respectively. It was expected
that the errors for each set of questions would be correlated.
Table 5.8 displays correlations, measure means, and standard deviations used in
the study�s measurement model. The variables in the model are elaborated in Table 4.1 in
Chapter IV. Table 5.9 shows the results of the study�s measurement model analysis,
including the construct names, observed variables, standardized factor loadings, t-values
from unstandardized solutions, and composite reliability coefficients. Table 5.10 details

135
the inter-factor correlations in the measurement model and Figure 5.1 illustrates the
measurement model with standardized parameter estimates.

136
Tabl
e 5.
8.
Mea
sure
Mea
ns, S
tand
ard
Dev
iatio
ns, a
nd C
orre
latio
ns
VA
R
V4
V
9
V10
V12
V13
V14
V16
V18
V19
V20
V21
V24
V25
V26
V29
V30
V41
V43
V44
V46
V48
V49
V4
V9
V10
V
12
V13
V
14
V16
V
18
V19
V
20
V21
V
24
V25
V
26
V29
V
30
V41
V
43
V44
V
46
V48
V
49
1.
000
.702
.6
01
.253
.2
19
.337
.3
10
.373
.3
15
.194
.3
21
.443
.5
05
.532
.5
03
.594
.3
17
.270
.3
72
.206
.2
25
.255
1.
000
.704
.4
46
.374
.3
59
.362
.3
49
.481
.4
30
.439
.5
29
.490
.5
54
.580
.5
75
.270
.2
50
.348
.2
97
.233
.2
95
1.
000
.275
.1
57
.378
.4
26
.392
.2
76
.264
.3
14
.457
.5
18
.561
.5
62
.538
.2
86
.230
.3
21
.108
.1
06
.115
1.
000
.818
.4
78
.453
.3
36
.609
.5
91
.503
.3
75
.420
.4
58
.290
.3
42
.269
.3
53
.306
.4
22
.507
.5
17
1.
000
.399
.3
66
.337
.5
32
.482
.4
37
.408
.3
71
.413
.2
53
.273
.2
11
.308
.2
55
.516
.6
42
.653
1.
000
.717
.7
15
.461
.4
46
.523
.4
75
.567
.5
88
.570
.6
13
.601
.5
59
.548
.3
15
.272
.2
78
1.
000
.721
.4
84
.511
.5
75
.416
.4
75
.480
.5
47
.542
.5
03
.558
.5
59
.339
.3
68
.341
1.
000
.390
.3
67
.515
.6
00
.618
.5
90
.672
.5
76
.542
.5
87
.602
.4
16
.397
.4
45
1.
000
.931
.7
64
.400
.4
86
.456
.4
43
.428
.4
43
.460
.4
61
.342
.3
95
.427
1.
000
.810
.3
37
.413
.3
97
.427
.3
60
.428
.4
62
.451
.3
86
.405
.4
05
1.
000
.343
.4
46
.460
.5
07
.454
.4
31
.491
.4
72
.365
.3
51
.367
1.
000
.709
.7
54
.574
.4
66
.500
.4
84
.516
.3
64
.408
.4
71
1.
000
.898
.6
97
.595
.5
73
.545
.6
37
.332
.3
42
.419
1.
000
.628
.6
08
.572
.5
63
.610
.3
77
.410
.4
51
1.
000
.729
.5
42
.519
.5
80
.361
.3
15
.358
1.
000
.524
.4
48
.488
.3
35
.273
.2
98
1.
000
.864
.8
46
.584
.4
93
.528
1.
000
.822
.5
92
.637
.6
03
1.
000
.569
.5
07
.620
1.
000
.843
.8
48
1.
000
.904
1.
000
ME
AN
5.62
3 5.
616
5.61
6 5.
591
5.69
8 5.
925
6.01
3 5.
925
5.06
3
5.10
7 5.
428
5.38
4 5.
975
5.88
1 5.
541
5.77
4 5.
950
5.95
6 5.
962
5.60
4 5.
780
5.72
3
S.D
. 1.
256
1.30
6 1.
257
1.04
5 1.
173
0.96
5 0.
907
1.04
7 1.
035
1.07
7 1.
093
1.19
5 1.
073
1.02
1 1.
236
1.19
0 0.
986
1.01
5 0.
999
1.10
8 1.
071
1.05
5
Not
e. U
nder
linin
g in
dica
tes t
he c
orre
latio
n is
not
stat
istic
ally
sign
ifica
nt a
t p <
.05.
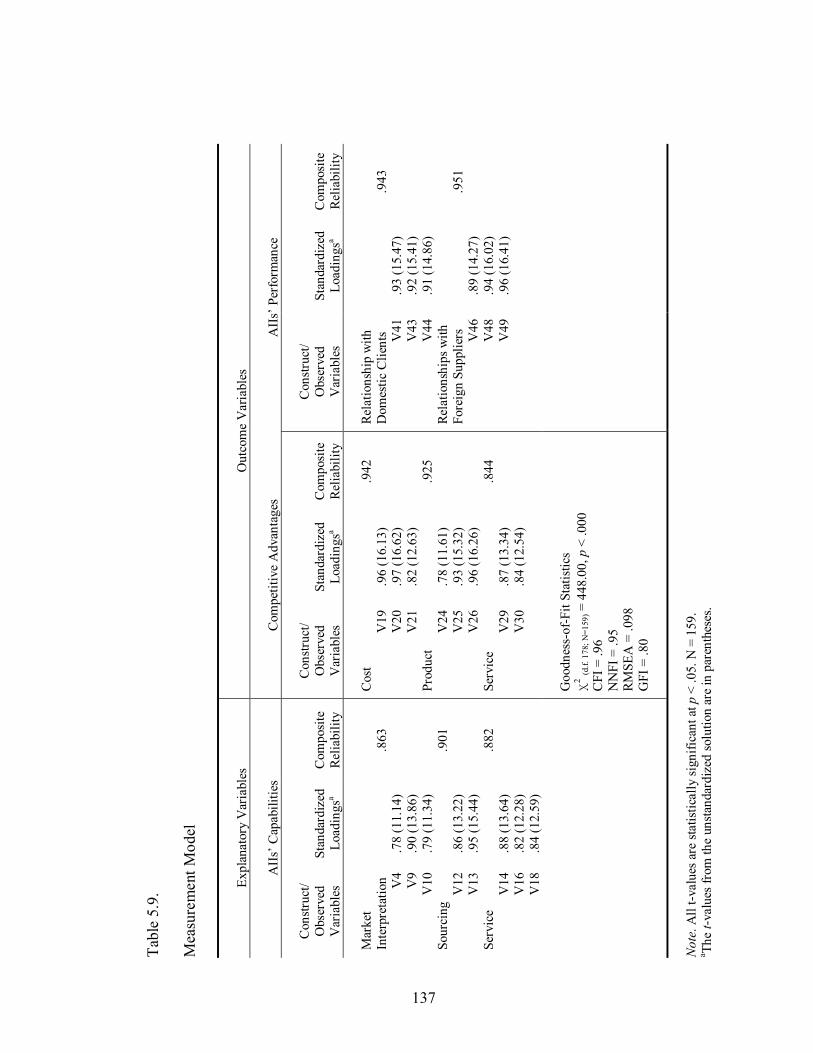
137
Tabl
e 5.
9.
Mea
sure
men
t Mod
el
Expl
anat
ory
Var
iabl
es
O
utco
me
Var
iabl
es
A
IIs�
Cap
abili
ties
C
ompe
titiv
e A
dvan
tage
s
AII
s� P
erfo
rman
ce
C
onstr
uct/
Obs
erve
d V
aria
bles
St
anda
rdiz
ed
Load
ings
a
C
ompo
site
Re
liabi
lity
C
onstr
uct/
Obs
erve
d V
aria
bles
St
anda
rdiz
ed
Load
ings
a
C
ompo
site
Re
liabi
lity
C
onstr
uct/
Obs
erve
d
Var
iabl
es
St
anda
rdiz
ed
Load
ings
a
C
ompo
site
Re
liabi
lity
Mar
ket
Inte
rpre
tatio
n V4
V9
V10
So
urci
ng V
12
V13
Se
rvic
e V
14
V16
V
18
.7
8 (1
1.14
) .9
0 (1
3.86
) .7
9 (1
1.34
)
.86
(13.
22)
.95
(15.
44)
.8
8 (1
3.64
) .8
2 (1
2.28
) .8
4 (1
2.59
)
.8
63
.9
01
.8
82
Cos
t V
19
V20
V
21
Prod
uct
V24
V
25
V26
Se
rvic
e
V29
V
30
.9
6 (1
6.13
) .9
7 (1
6.62
) .8
2 (1
2.63
)
.78
(11.
61)
.93
(15.
32)
.96
(16.
26)
.8
7 (1
3.34
) .8
4 (1
2.54
)
.9
42
.9
25
.8
44
Rela
tions
hip
with
D
omes
tic C
lient
s V41
V
43
V44
Re
latio
nshi
ps w
ith
Fore
ign
Supp
liers
V
46
V48
V
49
.9
3 (1
5.47
) .9
2 (1
5.41
) .9
1 (1
4.86
)
.89
(14.
27)
.94
(16.
02)
.96
(16.
41)
.9
43
.9
51
G
oodn
ess-
of-F
it St
atis
tics
χ2 (d
.f. 1
78; N
=159
) = 4
48.0
0, p
< .0
00
CFI
= .9
6 N
NFI
= .9
5 RM
SEA
= .0
98
GFI
= .8
0
Not
e. A
ll t-v
alue
s are
stat
istic
ally
sign
ifica
nt a
t p <
.05.
N =
159
. a Th
e t-v
alue
s fro
m th
e un
stand
ardi
zed
solu
tion
are
in p
aren
thes
es.

138
Tabl
e 5.
10.
Inte
r-fa
ctor
Cor
rela
tions
, Sta
ndar
d Er
rors
, and
t-V
alue
s in
the
Mea
sure
men
t Mod
el
C
onstr
uct
M
ICa
SR
C
SV
C
C
A
PA
SA
RP
D
RP
F M
arke
t Int
erpr
etat
ion
Cap
abili
ties (
MIC
) So
urci
ng C
apab
ilitie
s (S
RC)
Serv
ice
Cap
abili
ties
(SV
C)
Cos
t Adv
anta
ges (
CA
) Pr
oduc
t Adv
anta
ges (
PA)
Serv
ice
Adv
anta
ges (
SA)
Rela
tions
hip
Perf
orm
ance
w
ith D
omes
tic C
lient
s (R
PD)
Rela
tions
hips
Pe
rfor
man
ce w
ith
Fore
ign
Supp
liers
(RPF
)
1.
00
.3
9 (.0
8)
.5
0 (.0
7)
.4
5 (.0
7)
.6
7 (.0
5)
.7
8 (.0
5)
.3
7 (.0
8)
.2
8 (.0
8)
1.
00
.4
9 (.0
7)
.5
9 (.0
6)
.4
7 (.0
7)
.3
5 (.0
8)
.3
2 (.0
8)
.6
8 (.0
5)
1.
00
.5
6 (.0
6)
.6
9 (.0
5)
.8
1 (.0
4)
.7
2 (.0
5)
.4
3 (.0
7)
1.
00
.4
7 (.0
6)
.5
1 (.0
7)
.5
1 (.0
6)
.4
4 (.0
7)
1.
00
.7
8 (.0
4)
.6
6 (.0
5)
.4
7 (.0
7)
1.
00
.6
6 (.0
6)
.4
0 (.0
8)
1.
00
.6
3 (.0
5)
1.
00
Not
e. A
ll t-v
alue
s are
stat
istic
ally
sign
ifica
nt a
t p <
.05.
N =
159
. a St
anda
rd e
rror
of t
he c
orre
latio
n is
in p
aren
thes
es.

139
Figure 5.1.
Measurement Model with Standardized Solutions
Note. Inter-factor correlations are displayed in Table 5.11. All parameter estimates are statistically significant at p < .05. N=159.
.40
.19
.38
.26
.10
.23
.30
.09
.32
.39
.13
.07
.24
.30
.13
.15
.18
.21
.11
.08
.33
.06
V4
V9
V10
V12
V13
V14
V18
V19
V21
V24
V25
V26
V29
V30
V41
V43
V44
V46
V48
V49
V16
V20
.07
.06
.07
Market Interpretation Capabilities
Sourcing Capabilities
Service Capabilities
Cost Advantages
Product Advantages
Relationship Performance with Domestic Clients
Relationship Performance with Foreign Suppliers
Service Advantages
.90
.78
.79
.86
.95
.88
.82
.84
.96
.97
.82
.96
.93
.87
.84
.93
.92
.91
.89
.94
.96
.78
1.00
1.00
1.00
1.00
1.00
1.00
1.00
1.00

140
Measurement Model Evaluation
Problematic Estimates
The measurement model was evaluated as described in Chapter IV. There were no
problematic (offending) estimates present, such as negative error variance, standardized
coefficients exceeding or very close to 1.0, or very large standard errors with any
estimated coefficients. Thus, it was considered appropriate to proceed with assessment of
the overall model fit for the measurement model.
Overall Model Fit
An overall model fit was examined with multiple goodness-of-fit measures.
Among absolute fit indices, the chi-square value of the measurement model was 448.00
with 178 degrees of freedom, sample size of 159, and p-value less than .000. Although
the chi-square statistic alone showed that significant differences may exist, other absolute
fit indices suggested otherwise. RMSEA had a value of .098, falling just under the upper
acceptable threshold of .10. The GFI value of .80 was also marginally acceptable as no
absolute threshold levels for acceptability have been established for this measure (Hair et
al., 1998). Additionally, among incremental fit indices, NNFI had a value of .95 and the
CFI value was .96, indicating an excellent fit of the overall model. Thus, a mix of the
various fit indices supported that the model was at least marginally acceptable and was
sufficient to proceed to the next stage of data analysis.

141
Measurement Model Fit
The measurement fit was evaluated by examining both the reliability and validity
of the survey instrument. First, the composite reliability measures of all three explanatory
variables and five outcome variables ranged from .844 to .951, all exceeding well above
the acceptable threshold level of .60 (De Vellis, 1991). The results suggested that the
observed variables of each construct were highly inter-correlated, measuring the same
latent construct.
Second, convergent validity was assessed by examining the magnitude and sign of
the factor loadings of observed variables onto the proposed latent (construct) variables.
As seen in Table 5.9, all observed variables were statistically significant for the proposed
constructs, given that all t-values of the factor loadings from unstandardized solutions
were higher than 1.96, indicating statistical significance at a 95% confidence level.
Additionally, all factor loadings showed positive signs, suggesting the positive
relationships between the observed variables and their respective constructs.
Consequently, the data supported the study�s observed variables as effectively measuring
the proposed constructs.
Third, discriminant validity was addressed by the correlation between each
possible pair of constructs. All of the inter-factor correlation coefficients were less than
the value of .80, except the correlation coefficient of .81 between the two constructs,
AIIs� service capabilities and service advantages. However, the confidence interval of 2
standard errors around the correlation between these two constructs did not include 1.0.
Thus, discriminant validity among the constructs in the model was considered to be
142
supported. Table 5.10 displays the inter-factor correlation coefficients, standard errors,
and t-values, demonstrating discriminant validity of the study�s measurement model.
Consequently, based on model fit, reliability, and validity assessment, the study�s
measurement model was concluded to be sufficiently adequate to move on to the next
data analysis stage�structural model analysis.
Structural Model Analysis Results
Due to the exploratory nature of the study, the structural model was designed to
investigate the interrelationships of all possible paths between (a) the three factors of
competitive advantages and two factors of AIIs� performance and (b) the three factors of
AIIs� capabilities and three factors of competitive advantages, resulting in a total of 15
paths. Table 5.11 shows the results of the study�s structural model, including
standardized parameter estimates, t-values from unstandardized solutions, significance
levels for the structural paths, and overall goodness-of-fit indices. Figure 5.2 illustrates a
path diagram of the study�s structural model with standardized solutions.

143
Table 5.11.
Structural Model
Paths in the Structural Model
Standardized Parameter Estimates
t-Valuea
Probabilityb
≤ Market Interpretation Capabilities $ Cost
Advantages Market Interpretation Capabilities $ Product
Advantages Market Interpretation Capabilities $ Service
Advantages Sourcing Capabilities $ Cost Advantages Sourcing Capabilities $ Product Advantages Sourcing Capabilities $ Service Advantages Service Capabilities $ Cost Advantages Service Capabilities $ Product Advantages Service Capabilities $ Service Advantages Cost Advantages $ Relationship Performance
with Domestic Clients Cost Advantages $ Relationship Performance
with Foreign Suppliers Product Advantages $ Relationship Performance
with Domestic Clients Product Advantages $ Relationship Performance
with Foreign Suppliers Service Advantages $ Relationship Performance
with Domestic Clients Service Advantages $ Relationship Performance
with Foreign Suppliers
.11
.40
.51
.45
.09 -.24
.26 .45 .71
.19
.32
.30
.46
.34
-.17
1.41
4.95
6.73
5.47 1.21
-3.62
3.05 5.39 8.71
2.61
3.76
2.68
3.39
2.82
-1.19
.161
.000
.000
.000
.228
.000
.003
.000
.000
.010
.000
.008
.001
.005
.236
Goodness-of-Fit Indices χ2
(d.f.184; N=159) = 503.27, p < .000 CFI = .95 NNFI = .94 RMSEA = .105 GFI = .78
aValues are from unstandardized solutions. bp-Values from two-tail t-test.

144
Figu
re 5
.2.
Stru
ctur
al M
odel
with
Sta
ndar
dize
d So
lutio
ns
Not
e. *
Indi
cate
s par
amet
er e
stim
ate
is n
ot st
atis
tical
ly si
gnifi
cant
at p
< .0
5. N
=159
. A
ll ot
her i
ndic
ator
s are
stat
istic
ally
sign
ifica
nt a
t p <
.05.
N=1
59.
.51
Mar
ket
Inte
rpre
tatio
n C
apab
ilitie
s
Sour
cing
C
apab
ilitie
s
Serv
ice
Cap
abili
ties
Serv
ice
Adv
anta
ges
Prod
uct
Adv
anta
ges
Cos
t A
dvan
tage
s
Rela
tions
hip
Perf
orm
ance
with
Fo
reig
n Su
pplie
rs
Rela
tions
hip
Perf
orm
ance
with
D
omes
tic C
lient
s.4
4
1.00
1.00
1.00
.52
.70
.47
.28
.52 .10
.37
-.01*
.08
.06*
.11* .40
.51 .4
5 .09*
-.24
.26
.45
.71
.19
.32 .30
.46
.34
-.17*

145
Overall, various fit indices for the structural model suggested a marginally
acceptable fit to the data. Among the absolute fit indices, the chi-square statistic of
503.27 (d.f. 184, N=159, p-value < .000) suggested that there might be significant
differences, however, the RMSEA had a value of .105, just around the upper acceptable
threshold of .10, and the GFI value of .78 showed a marginally acceptable fit. Among the
incremental fit indices, the NNFI value was .94 and the CFI value was .95, indicating an
excellent fit of the overall structural model.
Except for three paths, all remaining paths proposed in the theoretical model were
statistically significant at p < .05. Three paths found not to be statistically significant
were paths connecting market interpretation capabilities to cost advantages, sourcing
capabilities to product advantages, and service advantages to relationship performance
with foreign suppliers. After reviewing the relationships of the pairs of these factors, their
non-significant results were not surprising. For example, AIIs� market interpretation
capabilities seemed to be mainly concerned with their domestic target consumers, and
thus, these capabilities would be least likely to affect their competitive advantages
originating from the cost of raw material, production cost per unit, and cost of goods sold.
Additionally, AIIs� capabilities to understand foreign suppliers� requirements and keep
close foreign supplier relationships might not be directly related with their competitive
advantages, coming from their design, styles, packaging, and even fashion-appealing
products. Similarly, AIIs� competitive advantages achieved from technical support or
after sales service for domestic clients might not be significantly associated with their
relationship performance with foreign suppliers.

146
Except for two paths, all remaining paths proposed in the theoretical model were
in the expected direction�positive. Two paths that demonstrated a negative direction
were paths connecting sourcing capabilities to service advantages and service advantages
to relationship performance with foreign suppliers. Although, the latter path was not
statistically significant, the findings on these two paths suggested interesting relationships
among AIIs� service capabilities, service advantages, and relationship performance with
foreign suppliers. That is, AIIs� capabilities to maintain good relationships with foreign
suppliers might negatively impact their positional advantages driven from their service
efforts for domestic clients. Similarly, AII�s better-than-competitors� service advantages
appeared to be negatively associated with their relationship performance with foreign
suppliers. Intuitively, a firm�s capabilities to keep a good relationship with domestic
clients seemed to counteract with its competitive advantages driven from their client
service, and its effort to serve domestic clients effectively, in turn, might frustrate its
effort to keep a healthy relationship with foreign suppliers.
In addition to direct relationships between explanatory variables (AIIs�
capabilities) to intermediary outcome variables (competitive advantages), and between
intermediary outcome variables and final outcome variables (AIIs� performance), Table
5.12 shows the standardized indirect effects of explanatory variables on the final
performance outcome variables. Indirect effects are caused by compounding paths.
Except the indirect effect of sourcing capabilities on relationship performance with
domestic clients, all other indirect effects were statistically significant at p < .05. Except
the indirect effect of service capabilities on relationship performance with foreign

147
suppliers, all other indirect effects were positive. These findings suggest that all of the
three AIIs� capabilities may have equally important indirect effects on relationship
performance with domestic clients, while they may affect relationship performance with
foreign suppliers differently. For example, AIIs� sourcing capabilities had the largest
indirect effect on relationship performance with foreign suppliers.
Table 5.12.
Standardized Indirect Effects of Explanatory Variables on Outcome Variables
Explanatory Construct Variables
Effects on Outcome Construct Variables
Market
Interpretation Capabilities
Sourcing Capabilities
Service Capabilities
Relationship Performance with
Domestic Clients Relationship Performance with
Foreign Suppliers
.32
.13
.30*
.46
.34
-.17
Note. * Indicates the effect was not statistically significant at p < .05. N=159.

148
Testing of Research Hypotheses
Based on the results of the structural model, most of the study�s research
hypotheses were supported. Figure 5.3 shows the study�s structural model with
unstandardized solutions and the research hypotheses. Each hypothesis is discussed in
detail.

149
Figu
re 5
.3.
Stru
ctur
al M
odel
with
Uns
tand
ardi
zed
Solu
tions
and
the
Res
earc
h H
ypot
hese
s
Not
e. *
Indi
cate
s par
amet
er e
stim
ate
is n
ot st
atis
tical
ly si
gnifi
cant
at p
< .0
5. N
=159
. A
ll ot
her p
aram
eter
s are
stat
istic
ally
sign
ifica
nt a
t p <
.05.
N=1
59
H1b
: +0.
38
Mar
ket
Inte
rpre
tatio
n C
apab
ilitie
s
Sour
cing
C
apab
ilitie
s
Serv
ice
Cap
abili
ties
H1b
: +0.
11*
H1b
: +0.
56
H2b
: +
0.08
*
Serv
ice
A
dvan
tage
s
Prod
uct
Adv
anta
ges
Cos
t A
dvan
tage
s
Rel
atio
nshi
p Pe
rform
ance
with
Fo
reig
n Su
pplie
rs
Rel
atio
nshi
p Pe
rform
ance
with
D
omes
tic C
lient
s
H1a
: +0.
18
H1a
: +0.
33
H2a
: +0.
30
H2a
: +0.
49
H3a
: +0.
29
H3a
: -0.
16*
H2b
: +0.
45
H2b
: -0.
26
H3b
: +0.
31
H3b
: +0.
51
H3b
: +0.
91

150
Hypotheses H1a and H1b
Hypothesis 1a (H1a), stating that AIIs� cost advantages positively impact their
performance, was well supported. The results of H1a are shown in the paths from cost
advantages to both relationship performance outcomes. The path to relationship
performance with domestic clients (path coefficient = 0.18, t-value = 2.61) and to
relationship performance with foreign suppliers (path coefficient = 0.33, t-value = 3.76)
were statistically significant at p < .05 and both positive. Additionally, as per the path
coefficients from the standardized solutions, cost advantages appeared to impact
relationship performance with foreign suppliers (standardized path coefficient = .32) to a
greater degree than domestic clients (standardized path coefficient = .19).
The positive relationships between AIIs� cost advantages and relationship
performance were well expected. The effect size of cost advantages on each relationship
performance construct, however, was somewhat surprising. One plausible explanation for
this result is that AIIs� low cost of material, production, and goods sold may be important
for domestic clients� satisfaction; however, AIIs� low cost also may represent efficient
operating costs and an attractive margin structure, thus it may positively impact the
relationship with foreign suppliers.
Hypothesis 1b, stating that AIIs� capabilities positively impact their cost
advantages, was partially supported. The results of H1b were illustrated in the paths from
the three AIIs� capabilities variables to the cost advantages outcome variable. The path
from market interpretation capabilities was positive, however, not statistically significant
at p < .05 (path coefficient = 0.11, t-value = 1.41). The paths from sourcing capabilities

151
(path coefficient = 0.45, t-value = 5.47) and from service capabilities (path coefficient =
0.31, t-value = 3.05) were statistically significant at p < .05 and both positive.
Additionally, as per the path coefficients from the standardized solutions, sourcing
capabilities were the most influential factor on AIIs� cost advantages (standardized path
coefficient = .45), followed by service capabilities (standardized path coefficient = .26)
and market interpretation capabilities (standardized path coefficient = .11).
This finding was intuitively plausible. If AIIs have good relationships with
foreign suppliers, they might tend to achieve more competitive positions among
competitors. AIIs� efforts to serve domestic clients might also affect AIIs� operating cost,
margin structure, and other related costs, resulting in more competitive cost advantages.
However, AIIs� market interpretation capabilities might not significantly impact their
cost advantages. Market interpretation capabilities tend to focus more on AIIs� market
information, trends, and characteristics of end-users, rather than AIIs� cost issues.
Hypotheses 2a and 2b
Hypothesis 2a (H2a), stating that AIIs� product advantages positively impact their
performance, was well supported. The results of H2a were found in the paths from
product advantages to both relationship performance outcomes. The paths to relationship
performance with domestic clients (path coefficient = 0.30, t-value = 2.68) and to
relationship performance with foreign suppliers (path coefficient = 0.49, t-value = 3.39)
were statistically significant at p < .05 and both positive. As per the path coefficients
from the standardized solutions, product advantages seemed to impact relationship

152
performance with foreign suppliers (standardized path coefficient = .46) to a greater
degree than domestic clients (standardized path coefficient = .30).
The positive relationships between AIIs� product advantages and relationship
performance were expected as AIIs� good designs, styles, and fashion-appealing products
would help both domestic clients and foreign suppliers� businesses. Domestic clients
would be able to achieve more sales from well-designed and stylish products, while
foreign suppliers may have access to advanced designs and more popular styles in the
United States. The effect size of these relationships, however, was surprising in that the
impact of product advantages was greater on relationship performance with foreign
suppliers than that with domestic clients. This might be partially explained by the fact
that domestic clients typically would have a wider range of other product suppliers,
giving them more options of product choices and less dependency on AIIs� product
offerings for their success. On the other hand, foreign suppliers might have relatively
limited access to the U.S. domestic buyers and markets, giving them fewer options of
product choices and more dependency on AIIs� product offerings for their success.
Hypothesis 2b, stating AIIs� capabilities positively impact their product
advantages, was partially supported. The results of H2b were illustrated in the paths from
the three AIIs� capabilities variables to the product advantages outcome variable. The
paths from market interpretation capabilities (path coefficient = 0.38, t-value = 4.95) and
from service capabilities (path coefficient = 0.51, t-value = 5.39) were statistically
significant at p < .05 and both positive. The path from sourcing capabilities was positive,
however, not statistically significant at p < .05 (path coefficient = 0.08, t-value = 1.21).

153
Additionally, as per the path coefficients from the standardized solutions, service and
market interpretation capabilities were the most influential factors for AIIs� product
advantages (standardized path coefficient = .45 and .40 respectively), while sourcing
capabilities had little impact on AIIs� product advantages (standardized path coefficient
= .09).
The findings were interesting in that AIIs� service capabilities represented by
technical support and after sales service were as important as their capabilities to interpret
market information to achieve better design, styles, and fashion appeal in their products.
In other words, part of AIIs� successful product development seems to be supported by
their unique ability both to interpret the trends for domestic clients and their experience
and feedback from domestic clients after sales. Domestic clients� feedback on AIIs� past
products, as well as current market trends, may be feeding into new product development
in the future season.
Hypotheses 3a and 3b
Hypothesis 3a (H3a), stating that AIIs� service advantages positively impact their
performance, was partially supported. The results of H2a were found in the paths from
service advantages to both relationship performance outcomes. The path to relationship
performance with domestic clients (path coefficient = 0.29, t-value = 2.82) was found
statistically significant and positive, however, the path to relationship performance with
foreign suppliers (path coefficient = -0.16, t-value = -1.19) was found to be negative and
not statistically significant at p < .05. Furthermore, based on the path coefficients from
the standardized solutions, service advantages appeared to have much larger impact on

154
relationship performance with domestic suppliers (standardized path coefficient = .34)
than they do on relationship performance with foreign suppliers (standardized path
coefficient = -.17).
The positive relationship between AIIs� service advantages and relationship
performance with domestic clients was obvious. However, interestingly, AIIs� desire and
efforts to serve domestic clients seemed to frustrate foreign suppliers� needs and business
operations, resulting in poor relationship performance with foreign suppliers. Although
the negative impact of AIIs� service capabilities on relationship performance with foreign
suppliers were not shown to be statistically significant, it provided empirical support for
AIIs� struggle between overwhelmingly powerful domestic clients and deadly
competitive foreign supplier markets�reflecting one of the findings from the first phase
qualitative interview studies.
Hypothesis 3b, stating that AIIs� capabilities positively impact their service
advantages, was also partially supported. The results of H3b were illustrated in the paths
from three AIIs� capabilities variables to the product advantages outcome variable. All of
the three paths from market interpretation capabilities (path coefficient = 0.56, t-value =
6.73), from sourcing capabilities (path coefficient = -0.26, t-value = -3.62), and from
service capabilities (path coefficient = 0.91, t-value = 8.71) were statistically significant
at p < .05. Interestingly, only market interpretation and service capabilities had a positive
affect on service advantages, and sourcing capabilities had a negative impact on service
advantages. This negative effect of sourcing capabilities on service advantages suggested
a similar interpretation of the relationship between service advantages and relationship

155
performance with foreign suppliers. In this study, AIIs� sourcing capabilities were
manifested by the abilities of maintaining good relationships with foreign suppliers and
accommodating their requirements. Thus, if an AII has a successful relationship with
foreign suppliers, it might hinder the firm from achieving and providing better technical
support or after sales service. That is because the AII firm might give too much time and
attention to meeting foreign suppliers� requests rather than domestic clients� after service
requests, such as faster delivery, higher quality, or even lower prices. Also, inherently,
some of these requests may be counterproductive for the opposite partner.
In terms of the size of effect, service capabilities were the most influential factors
for AIIs� service advantages (standardized path coefficient = .71) for obvious reasons.
Particularly, market interpretation capabilities (standardized path coefficient = .51) were
an important factor for AIIs� service advantages among competitors. That is partially
because one of the goals of AIIs� market interpretation might be to provide the best
market information to domestic clients, resulting in a superior degree of service
advantages in the market. AIIs sourcing capabilities (standardized path coefficient = -.24)
were the least critical successful service to domestic clients, but still important,
suggesting that AIIs� service to domestic clients might be substantially dependent upon
their foreign suppliers.
Summary of Hypotheses Tests
Table 5.13 shows the summary of the research hypotheses tests. Out of 15
possible paths, 11 paths were supported by the statistical analysis for both significance
and the direction of the relationship. One path was supported for its path significance;

156
however, the direction was negative. The remaining two paths were not statistically
supported for their significance.
Table 5.13.
Summary of Hypotheses Tests
Hypotheses
Results
H1a: Cost Advantages $ Relationship Performance with Domestic Clients Cost Advantages $ Relationship Performance with Foreign Suppliers H1b: Marketing Interpretation Capabilities $ Cost Advantages Marketing Interpretation Capabilities $ Product Advantages Marketing Interpretation Capabilities $ Service Advantages H2a: Product Advantages $ Relationship Performance with Domestic Clients Product Advantages $ Relationship Performance with Foreign Suppliers H2b: Sourcing Capabilities $ Cost Advantages Sourcing Capabilities $ Product Advantages Sourcing Capabilities $ Service Advantages H3a: Service Advantages $ Relationship Performance with Domestic Clients Service Advantages $ Relationship Performance with Foreign Suppliers H3b: Service Capabilities $ Cost Advantages Service Capabilities $ Product Advantages Service Capabilities $ Service Advantages
Supported Supported Not Supported Supported Supported Supported Supported Supported Not Supported Partially Supported Supported Not Supported Supported Supported Supported

157
Post Hoc Model Modifications
In order to explain potential misfit in the structural model, two alternative models
were examined based on the theory and the analysis results from the original research
model. For alternative model 1, paths from the three explanatory variables to the two
final performance outcome variables were added to explore the possibilities of any direct
effects of AIIs� capabilities on AIIs� relationship performance. For alternative model 2,
the three paths that were statistically non-significant from the original research model
were removed. Table 5.14 shows the results of the alternative structural model 1. Table
5.15 displays the results of the alternative structural model 2.

158
Table 5.14.
Alternative Structural Model 1 (Adding Direct Paths from the Three Capabilities
Variables to the Two Performance Outcomes Variables)
Paths in the Structural Model
Standardized Parameter Estimates
t-Valuea
Probabilityb
≤ Market Interpretation Capabilities $ Cost
Advantages Market Interpretation Capabilities $ Product
Advantages Market Interpretation Capabilities $ Service
Advantages Sourcing Capabilities $ Cost Advantages Sourcing Capabilities $ Product Advantages Sourcing Capabilities $ Service Advantages Service Capabilities $ Cost Advantages Service Capabilities $ Product Advantages Service Capabilities $ Service Advantages Cost Advantages $ Relationship Performance
with Domestic Clients Cost Advantages $ Relationship Performance
with Foreign Suppliers Product Advantages $ Relationship Performance
with Domestic Clients Product Advantages $ Relationship Performance
with Foreign Suppliers Service Advantages $ Relationship Performance
with Domestic Clients Service Advantages $ Relationship Performance
with Foreign Suppliers Market Interpretation Capabilities $ Relationship
Performance with Domestic Clients Market Interpretation Capabilities $ Relationship
Performance with foreign suppliers
.15
.41
.53
.39
.10 -.17
.29 .44 .62
.23
.00
.41
.15
.24
.64
-.31
-.43
1.86
5.10
6.90
4.85 1.38
-2.58
3.32 5.31 7.94
2.86
-0.03
3.68
1.16
0.87
1.81
-1.91
-2.15
.065
.000
.000
.000
.170
.011
.001
.000
.000
.005
.976
.000
.248
.386
.072
.058
.033
(table continues)

159
Table 5.14.(continued) Paths in the Structural Model
Standardized Parameter Estimates
t-Valuea
Probabilityb
≤ Sourcing Capabilities $ Relationship
Performance with Domestic Clients Sourcing Capabilities $ Relationship
Performance with foreign suppliers Service Capabilities $ Relationship Performance
with Domestic Clients Service Capabilities $ Relationship Performance
with foreign suppliers
-.14
.72
.34
-.32
-1.42
5.66
1.83
-1.40
.158
.000
.069
.163
Goodness-of-Fit Indices χ2
(d.f.178; n=159) = 448.00, p < .000 CFI = .96 NNFI = .95 RMSEA = .098 GFI = .80
aValues are from unstandardized solutions. bp-Values from two-tail t-test.

160
Table 5.15.
Alternative Structural Model 2 (Deleting the Three Statistically Non-significant Paths
from the Original Structural Model)
Paths in the Structural Model
Standardized Parameter Estimates
t-Valuea
Probabilityb
≤ Market Interpretation Capabilities $ Product
Advantages Market Interpretation Capabilities $ Service
Advantages Sourcing Capabilities $ Cost Advantages Sourcing Capabilities $ Service Advantages Service Capabilities $ Cost Advantages Service Capabilities $ Product Advantages Service Capabilities $ Service Advantages Cost Advantages $ Relationship Performance
with Domestic Clients Cost Advantages $ Relationship Performance
with Foreign Suppliers Product Advantages $ Relationship Performance
with Domestic Clients Product Advantages $ Relationship Performance
with Foreign Suppliers Service Advantages $ Relationship Performance
with Domestic Clients
.42
.50
.47 -.24
.31 .49 .71
.19
.30
.28
.33
.37
5.21
6.62
5.76 -3.80
3.88 6.08 8.76
2.67
3.71
2.63
4.01
3.45
.000
.000
.000
.000
.000
.000
.000
.008
.000
.009
.000
.001
Goodness-of-Fit Indices χ2
(d.f.187; n=159) = 501.97, p < .000 CFI = .95 NNFI = .94 RMSEA = .103 GFI = .78
aValues are from unstandardized solutions. bp-Values from two-tail t-test.

161
In alternative model 1, six additional paths from the three capability variables to
the two relationship performance variables were added. This model was to investigate
possible direct effects from AIIs� capabilities to relationship performance. An overall fit
of this model was slightly improved (χ2 = 448.00, d.f. 178, N=159, p-value < .000,
RMSEA = .098, GFI = .80, NNFI = .95, and CFI = .96), however, four path coefficients
were not statistically significant even at p < .10. Particularly, 3 out of 6 newly added
paths were not statistically significant at p < .05 and 2 out of 6 new paths were not
statistically significant even at p < .10. Furthermore, 4 out of 6 newly added paths were in
the negative direction. This result suggested that service capabilities, overall, had no
statistically significant direct effect on either of the relationship performance variables.
Although there appeared to be statistically significant effects between market
interpretation capabilities and both of the relationship performance variables, the
relationships were in the negative direction, conflicting with theoretical explanations.
However, there did seem to be a possible direct relationship between sourcing
capabilities and relationship performance with foreign suppliers, suggesting new future
research possibilities.
In alternative model 2, three paths that were statistically non-significant from the
original structural model were deleted. Although all the path coefficients were now
statistically significant, there were practically no changes made in an overall fit of the
alternative model from the original structural model (χ2 = 501.97, d.f. 187, N=159, p-
value < .000, RMSEA = .103, GFI =.78, NNFI = .94, and CFI = .95). No other
substantial changes were detected.

162
In sum, the results of post hoc modifications suggested that the original structural
model based on theory that emphasized the role of competitive advantages between
firms� resources and performance was more appropriate in explaining the study�s topic.
Particularly, this study was an exploratory attempt to gain an understanding of the
relationships among AIIs� capabilities, competitive advantages, and performance. Thus,
despite three statistically non-significant paths, the original model was deemed to
produce sufficient and meaningful knowledge of AIIs� capabilities, competitive
advantages, and performance.
-

163
CHAPTER VI
CONCLUSIONS
Chapter VI presents the following sections: (a) Summary of the Study, (b)
Research Contributions and Implications, (c) Study Limitations, and (d) Future Research.
Summary of the Study
Structural changes in the global apparel industry have led to a new market
environment in which a segment of the apparel channel members (specifically, apparel
import intermediaries or AIIs) have had to assume new responsibilities and to take
different approaches to their functional activities. The purpose of this study was to
investigate the basic nature of these firms� business operations, that is, the relationships
among firm capabilities, competitive advantages, and performance, in the hyper-dynamic
market environment of the apparel industry. In order to do so, this study (a) developed an
integrative model of AIIs� capabilities, competitive advantages, and performance; and (b)
conducted an empirical assessment of the model using survey methodology.
Overall, the study�s hypotheses were well supported. Reflecting general thought
in the management literature, the structural model suggested that competitive advantages
would be the direct antecedents of AIIs� performance, while AIIs� functional capabilities
would affect AII performance indirectly. As the direct antecedents of AIIs� performance,
5 out of 6 paths (from the three competitive advantages to the two performance measures)
were found to be statistically significant in the positive direction, as predicted. Service

164
advantages demonstrated the largest effect on relationship performance with domestic
clients, followed by product and cost advantages. Product advantages showed the largest
impact on relationship performance with foreign suppliers, followed by cost advantages.
Service advantages, however, did not have a statistically significant effect on relationship
performance with foreign suppliers.
As the indirect antecedents of AIIs� performance, 7 out of 9 paths (from AIIs�
three functional capabilities to their three competitive advantages) were also found to be
statistically significant. Sourcing capabilities exhibited the largest positive effect on cost
advantages, followed by market interpretation capabilities. Service capabilities had the
largest positive impact on both product and service advantages, followed by market
interpretation capabilities. Market interpretation capabilities and sourcing capabilities,
however, were not found to have statistically significant effects on cost advantages and
product advantages, respectively. Interestingly, all of these indirect antecedent paths were
positive as hypothesized, with the exception of the path from sourcing capabilities to
service advantages which was negative, suggesting conflicting requests from AIIs�
domestic and foreign business partners and a consequent struggle to manage these
conflicting requests.

165
Research Contributions and Implications
This study made several important contributions to the body of knowledge in firm
research and research on the apparel industry. This section discusses the study�s
contributions and implications from the perspectives of theory development, business
operations, industry issues, academic research, and education.
Theoretical Contributions and Implications
From a theoretical perspective, the study�s findings empirically supported the
resource-advantage theory of competition used to frame the study. As R-A theory
predicted, AIIs� competitive advantages were shown to be the direct antecedents of
performance, and AIIs� capabilities were found to be the indirect antecedents of AIIs�
performance. Most of the AIIs� competitive advantages appeared to have important
positive impact on their performance, and these advantages seemed to be achieved from
AIIs� critical resources. In addition, the study�s findings were consistent with the firm
capability literature as they showed that firms� capabilities were indeed important firm
resources, positively and significantly impacting firms� competitive advantages.
In addition to empirical support for extant theory, the study�s results of the
negative relationship between (a) AIIs� service efforts for domestic clients and their
relationship with foreign suppliers and (b) AIIs� sourcing capabilities and their service
efforts for domestic clients particularly suggested a need for a new or expanded theory
that can explain the process of competition for intermediary firms in a global economy.
Extant theories of firm competition, in general, have been based on a single business
relationship�typically between one seller and its buyers. However, when a firm deals

166
simultaneously with two equally important business partners�both buyers and
suppliers�the process of competition becomes more complicated. For example, specific
strategies that are effective for a firm�s buyers may not be simultaneously effective for its
suppliers and may even create significant power conflicts among the three business
partners. When a firm operates in the global market, building and maintaining its
business partnerships across borders presents more complex operation issues. In this
context, current theories of firm competition based on a single business partnership may
not be able to explain the whole process of intermediary firms� competition successfully.
By showing possible negative relationships among sourcing capabilities, service
advantages, and relationship performance with foreign suppliers, this study�s results
supported the inadequacy of extant theory in explaining the process of AIIs� competition
and suggested the need for a new or expanded theory.
Business Contributions and Implications
From the perspective of AIIs� business strategies, the study�s findings provided
important insights into AIIs� success factors which may assist AII firms with practical
business solutions. The study�s model confirmed that AIIs need to develop critical
capabilities that will lead to competitive advantages, which, in turn, lead to superior firm
performance. The study�s results showed that, in order to succeed, AIIs need the superior
capabilities of market interpretation, sourcing, and service. For example, market
interpretation capabilities, such as interpreting trends for the end user, monitoring import
market information, and interpreting market information based on �on-the-floor�
experience, help to achieve both better product and service advantages. Results indicated

167
that among these three market interpretation capabilities, AIIs may want to put particular
emphasis on monitoring import market information. Sourcing capabilities, such as
understanding foreign suppliers� requirements and establishing/maintaining close
relationships with foreign suppliers, helped to achieve superior cost advantages. Of these
two sourcing capabilities, understanding foreign suppliers� requirements appeared to have
a larger impact. Service capabilities, such as establishing/maintaining close relationships
with domestic clients, achieving/maintaining prompt response to domestic clients� orders,
and developing a long-term domestic client service relationship, helped to achieve all of
the three competitive advantages of cost, product, and service. Results indicated that all
three service capabilities were essentially equally important.
The study�s firm capabilities were important in that they impacted firm
competitive advantages directly. This suggested that once AIIs have attained the
capabilities of market interpretation, sourcing, and service, then they are in the process of
developing the competitive advantages of cost, product, and service, which have a direct
impact on firm performance. However, the results indicated that competitive advantages
may not impact performance in the same ways. Cost advantages, such as superior cost of
raw materials, production cost per unit, and cost of goods sold, helped to achieve better
relationship performance with both business partners. Results indicated that among these
three cost advantages, AIIs may want to put special focus on attaining competitive cost of
raw materials and production cost per unit. Product advantages, such as attractive
packaging, competitive design/styles, and strong fashion appeal, also helped to achieve
better relationship performance with both business partners. Results indicated that among

168
these three product advantages, strong fashion appeal showed the largest impact. Service
advantages, such as exceptional technical support and after sales service, helped to
achieve better relationship performance with domestic clients; however, service
advantages seemed to have little impact on relationship performance with foreign
suppliers. Results indicated that both technical support and after sales service had
virtually equal importance for AIIs� relationship performance with domestic clients.
In sum, the study findings suggested that AIIs� cost advantages achieved from
superior sourcing capabilities had a larger positive impact on relationship performance
with foreign suppliers than on relationship performance with domestic clients. AIIs�
product advantages achieved from superior service and market interpretation capabilities
had a larger positive impact on relationship performance with foreign suppliers than on
relationship performance with domestic clients. AIIs� service advantages achieved from
superior service capabilities had a larger positive impact on relationship performance
with domestic clients than on relationship performance with foreign suppliers. These
results have important strategic implications for AIIs� business operations as they may
help AII managers review their resource allocations and their competitive advantage mix
to determine the goals of performance and suggest an optimum strategy mix to achieve
those specific goals.
Industry Contributions and Implications
From the perspective of industry analysis and research, this study has drawn
needed attention to the AII business segment, including issues related to the definition of
AIIs, industry identity, and AIIs� business characteristics. First, the study offered an

169
accurate and clear description of AIIs that reflects the reality of today�s markets. Using
this description to define AIIs correctly is critical in a number of ways. Under the current
U.S. government business classification system, it is extremely difficult to isolate
business transactions made by AIIs, making accurate tracking of business transactions in
the U.S. apparel industry in recent decades very difficult. This inaccuracy could be
corrected. If more accurate data were available, it would be possible to identify this
important segment of apparel supply chain members, to track their business activities, to
calculate their economic impact, and to identify any shifts that occur in the global apparel
industry. Furthermore, a correct definition of AIIs may provide the basis for industry
cooperation among these firms, such as forming AII trade associations, as well as
illuminating employment possibilities that may currently be unrecognized by many
people in the workforce.
In addition to the correct definition of AIIs, the study provided empirical support
for the issue of an AII identity crisis that emerged from the first phase qualitative
interview studies. This nation-wide survey study showed that 49.1% of the survey
respondents considered themselves to be apparel manufacturers or other business types,
despite clearly fitting into the U.S. government�s business classification system
descriptions of wholesalers. This finding confirmed that there is an identity crisis among
the AII firms themselves. From a policy-makers� point of view, an AII identity crisis
means that there most likely is substantial misreporting of business census data. Given
that business census data are the basic measure for any type of industry analysis, the
study�s findings suggest that there is an urgent need for clarification and corrective

170
actions. From an apparel researchers� viewpoint, the AIIs� identity crisis issue points out
the importance of in-depth knowledge of both academic research and the current reality
of the marketplace. When research activities are limited and contained within an abstract
and theoretical realm, real-world phenomena may be overlooked or misrepresented,
causing a critical gap in our understanding of reality and limiting our ability to generate
relevant knowledge.
Supporting the importance of correctly defining AIIs, the study also offered a
descriptive profile of U.S. AIIs, including a variety of business characteristics. For
example, the study showed that most U.S. AIIs imported over 90% of their products
(84.9% of the survey respondents) and have been engaged in import operations for fewer
than 30 years (80.6% of the survey respondents), suggesting that many U.S. AIIs are
relatively young firms. In terms of AIIs business partners, three fourths of U.S. AIIs
imported from fewer than nine different foreign countries (74.2% of the survey
respondents) with fewer than four suppliers per country (76.7% of the survey
respondents) on average. On the domestic side, a little over two thirds of U.S. AIIs sold
products to at least 10 different domestic clients on average with some selling to over 25
(68.5% of the survey respondents). In terms of firm sizes, almost half of U.S. AIIs had
fewer than 50 employees (50.3% of the survey respondents) with some portion of
overseas staffing (52.2% of the survey respondents), and their annual sales figures were
less than 50 million U.S. dollars (50.9% of the survey respondents). Additionally, while
U.S. AIIs sold various types of products, the largest portion of them engaged in selling
women�s wear (40.9% of the survey respondents). This descriptive information on U.S.
171
AIIs is particularly important because there has been little information available in either
the business literature or the academic literature on their business characteristics prior to
this study.
By correctly defining AIIs, highlighting the issue of AIIs� identity, and providing
newly available information on AIIs� business characteristics, this study has helped to get
closer to the reality of industry phenomena as they occur within the U.S. apparel industry,
as well as to understand changes in the global apparel industry in a more realistic and
practical manner.
Academic Contributions and Implications
Academic Research
The first contribution of this study from an academic research perspective is that
the study confirmed the unique environment of the apparel industry, specifically the U.S.
apparel industry, and emphasized that great care should be taken in adapting extant scales
developed in other industries or even in other disciplines. In this study, the context and
business environment of the apparel industry differed so much that the simple term, �new
product� did not appear to share the same meaning with other industries. For example, for
the non-apparel industry research, new product could mean a brand new product that
never existed before, while for apparel industry research, new product generally means
new silhouettes, new textile patterns, or even new colors of an existing product. Because
of issues such as this, extant scales of product development in the export performance
literature did not successfully capture AIIs� product development or design capabilities.

172
Instead, some of the survey items that were added based on the first phase qualitative
interview studies emerged as more significant and meaningful in the AII context. Items
such as �our firm�s capabilities to interpret trends to satisfy end-user customers are�,�
�our firm�s capabilities to interpret market information through personal �on-the-floor�
experience are�,� or �our firm�s capabilities to develop a long-term domestic client
service relationship are�� were found to be statistically significant measurement items
for AIIs� capabilities. Moreover, the item, �our firm�s products, in terms of fashion
appeal, are�� was shown to be more reliable for the product advantages construct than
the item, �our firm�s product quality is...� It is possible that the respondents interpreted
the term, fashion appeal, as product quality. Consequently, because of the unique
environment of the apparel industry and the different contexts that apparel firms face, the
study suggested that new context-specific scale development should be explored in order
to understand AIIs� business operations correctly and help their businesses with
important and meaningful strategic recommendations.
The second contribution to academic research is that the study empirically
supported that firms� relationship performance measures can be successful indicators of
their economic and non-economic strategic performance in the AII setting. Despite the
fact that the business literature has strongly and consistently shown three unique
measures of firm performance�economic, non-economic strategic, and relationship
performance�the study model did not recognize economic and non-economic measures
as discrete measures. Instead, economic and non-economic strategic performance
measures merged into a single measure, the relationship performance with domestic

173
clients. This finding suggested that if a firm has a good relationship with domestic clients,
it tends to have both better economic and strategic performance. Firms� relationship
performance typically requires a longer time to achieve than short-term economic
performance and, thus, if the purpose of research is to measure the degree of firm success
in the long term and the major firm operations rely strongly on business partnerships,
researchers might want to consider relationship performance as a more effective outcome
measure than any other firm performance measure.
Education
From the perspective of teaching and higher education, the study offered explicit
information about AIIs� critical capabilities, competitive advantages, and performance for
apparel educators. For example, unlike a typical approach to firms� sourcing activities
that is centered on low cost, the study�s findings suggested that the apparel industry may
have a greater need for relationship building and management skills with foreign business
partners. Given that building and managing business relationships with firms from
different political, economic, and cultural backgrounds can be extremely challenging and
may take some time, it may be necessary for apparel academics to consider special
curriculum or course content to address this particular need of the apparel industry.
Additionally, as seen in the relationship between competitive advantages and
performance, service advantages played a dominant role in relationships with domestic
clients. Educators may want to emphasize service quality, after sales service, and long-
term service relationships in apparel marketing by adding a course on the service
environment and/or on service quality. The study also stressed that market interpretation

174
capabilities can be acquired through personal immersion in the industry or an intuitive
understanding of the market. Thus, more extensive field trips, internships, and other
forms of direct experiential learning might be helpful for students. Finally, apparel
educators may want to take different approaches to the success of firms� various activities.
In helping students to prepare for employment, it may be important to emphasize that the
goals of better margin and bigger sales are not always the most effective or only goals for
apparel firms, particularly AIIs. Keeping business partners impressed with the firm�s
service quality, building reputation in the market, and providing impressive products and
services could be equally important goals�given that economic and other strategic
rewards may follow the firm�s relationship rewards. All of these findings can be
important guidelines to accomplish the mission of higher education successfully �
preparing the future workforce for industry needs.
Study Limitations
As with all research, this study has limitations. First, despite personal visits and
follow-up phone calls and emails, the study�s sample size was a concern, particularly
when using the structural equation modeling technique. In general, SEM requires a large
sample size, and some fit indices are highly dependent on substantial sample size. Thus,
caution is indicated in interpreting the study results. Second, although the study achieved
an effective response rate of 21.6%, approximately the average business survey response
rate of 21% [in selected business journals published since 1990], non-response bias must
be considered (Paxson, 1992, as cited in Dillman, 2000). The study showed that there was
no statistically significant non-response bias; however, true non-response bias can never

175
be eliminated unless 100% participation is attained. Similarly, even though the statistical
analysis supported that there were no statistically significant measurement differences
from the different modes of survey follow up used in the study, true measurement
differences cannot be known in reality.
Third, location bias should be considered. The study found a geographic
concentration�89.7%�of AIIs in the states of New York, California, and New Jersey.
The initial sample frame generated from ReferenceUSA under NAICS codes 315, 42432,
and 42433 had the largest portion of firms�82.7%�from the state of New York. It may
be true that most AIIs are operating in New York, particularly New York City; however,
there may have been other factors impacting the geographic distribution of the study�s
sample. Fourth, the majority of the survey items was adapted from the export
performance literature due to a lack of extant scales in the intermediary, import, and even
apparel literature. Not surprisingly, many items did not perform well in the AII setting,
causing high cross-loadings, low loadings on the intended factors, or low reliabilities.
Although the study was able to provide a relatively good fit for the measurement and
structural models, the effect of dropped items during exploratory factor analysis and
reliability analysis must be considered.
Finally, as most research does, with the exception of some longitudinal studies,
the survey approach used in this research offers only time-, context-, and situation-
specific understanding of the relationship among AIIs� capabilities, competitive
advantages, and performance. Care should be taken when applying the study�s results to a
larger population for the long term.

176
Future Research
This study provides numerous future research possibilities. Most importantly, the
study emphasized a pressing need for development of appropriate measurement scales to
research AIIs� business operations. No usable measurement scales were found in the
literature for AIIs� design capabilities. Although the study�s scales for AIIs� capabilities,
competitive advantages, and performance were successfully adapted from the
management literature and offered some level of understanding about business operations,
these scales need to be refined and expanded to increase scale reliability and validity.
Furthermore, new scales could be developed that reflect the unique and dynamic apparel
market environment and would capture the common contexts of apparel firms� business
practices. Accurate, reliable, and meaningful measurement scales would allow research
on AII firm strategies to advance more successfully.
Second, while this study specifically employed functional capabilities as AIIs�
critical resources, there may be other resources that are vital for their performance. For
example, the role of different firm resources, such as financial resources, human
resources, or historical resources, on firm performance has not yet been discussed in the
AIIs� setting. This needs special attention. In addition to cost, product, and service
advantages, other sources of AIIs� competitive advantages should also be explored. The
different dimensions of AIIs� competitive advantages, such as relationship advantages,
brand-name advantages, or geographic/location advantages, might be important direct
antecedents of firm performance. Further investigation is necessary.

177
Third, once good measurement scales have been established and validated within
the U.S. AII setting, longitudinal and cross-cultural studies would be an appropriate next
step in developing research in this area. Just as the apparel market environment has
changed so much and so fast in recent decades, there is no doubt that it will make
tremendous and constant changes going forward. Longitudinal studies on AIIs would
help to keep abreast of the changes, monitor industry trends, and offer timely and
practical recommendations on AIIs� business practices. Just as AIIs exist in the U.S.
apparel industry, it is reasonable to assume that they have counterparts in other developed
countries. It is likely that cross-cultural studies on AIIs would be of great interest to firms
that deal with clients from other developed countries. The findings of both longitudinal
and cross-cultural studies would help to establish whether these scales were generalizable
for different times and cultural settings.
Finally, the results of a systematic range of studies on AIIs� capabilities,
competitive advantages, and performance, including scale development, longitudinal, and
cross-cultural research may, ultimately, guide the development of a new or expanded
theory of AII firm operations and competition, helping us to understand better how AIIs
compete and succeed. If this were accomplished, it would significantly advance the
knowledge base of both the firm and apparel research areas.
178
REFERENCES
Aaby, N.E., & Slater, S.F. (1988). Management influences on export performance: A review of the empirical literature 1978-88. International Marketing Review, 6(4), 7-26.
Aacker, D., Kumar, V., & Day, G. (1995). Chapter Ten: Attitude Measurement. In D.
Aacker, V. Kumar, and G. Day (Eds.), Marketing Research (5th ed., pp. 251-281). New York: John Wiley & Sons.
Ackoff, R.L. (1981). The art and science of mess management. Interfaces, 11, 20-26. Alchian, A.A., & Demsetz, H. (1972). Production, information costs, and economic
organization. American Economic Review, 62, 777-795. Alder, U. (2004). Structural change: The dominant feature in the economic development
of the German textile and clothing industries. Journal of Fashion Marketing and Management, 8, 300-319.
Alderson, W. (1957). Marketing behavior and executive action, Homewood, IL: Richard
D. Irwin. Aldrich, H.E. (1979). Organizations and environments. Englewood Cliffs, NJ: Prentice-
Hall. Ambler, T. and Kokkinaki, F. (1997). Measures of marketing success. Journal of
Marketing Management, 13, 665-678. Amine, L.S., & Cavusgil, S.T. (1986). Export marketing strategies in the British Clothing
Industry. European Journal of Marketing, 20(7), 21-33. Anderson, E.W., Fornell, C., & Lehman, D.R. (1994). Customer satisfaction, marketing
share, and profitability: Findings from Sweden. Journal of Marketing, 58(July), 53-66.
Appelbaum, R.P. & Christerson, B. (1997). Cheap labor strategies and export-oriented
industrialization: some lessons from the Los Angeles/East Asia apparel connection. International Journal of Urban & Regional Research, 21, 202-217.

179
Appelbaum, R.P., & Gereffi, G. (1994). Power and profits in the apparel commodity chain. In E. Bonacich, L. Cheng, N. Chinchilla, N. Hamilton, & P. Ong (Eds.), Global production: The apparel industry in the pacific rim, (pp. 42-62). Philadelphia, PA: Temple University Press.
Armstrong, J.S., & Overton, T.S. (1977). Estimating non-response bias in mail surveys.
Journal of Marketing Research, 14, 396-402. Armstrong, J.S., & Luske, E.J. (1987). Return postage in mail surveys: A meta-analysis.
Public Opinion Quarterly, 51, 233-248. Bagozzi, R.P., Yi, Y., & Phillips, L.W. (1991). Assessing construct validity in
organizational research. Administrative Science Quarterly, 36, 421-458. Balabanis, G. I. (2000). Factors affecting export intermediaries� service offerings: The
British example. Journal of International Business Studies, 31, 83-99. Balabanis, G. I. (2001). The relationship between diversification and performance in
export intermediary firms. British Journal of Management, 12, 37-84. Balabanis, G.I., Katsikeas, E.S. (2003). Being an entrepreneurial exporter: Does it pay?
International Business Review, 12, 233-252. Barney, J. (1991). Firm resources and sustained competitive advantage. Journal of
Management, 17, 99-120. Baughman, L. M. (2004, December 3). A current assessment of health of the U.S. textile
and apparel industries: On life support or a case of the sniffles? [Letter to the Chairman of Committee for the Implementation of Textile Agreements of US Department of Commerce]. National Retail Federation News Release. Retrieved December 13, 2004, from http://www.nrf.com/content/press/release2004/cita-cottontrousers.pdf
Bello, D.C., Chelariu, C., & Zhang, L. (2003). The antecedents and performance
consequences of Relationalism in export distribution channels. Journal of Business Research, 56, 1-16.
Berle, A.A., & Means, G. (1932). The modern corporation and private property. New
York: Commerce Clearing House. Bitpipe.com. (n.d.). Apparel Industry. Retrieved September 7, 2006, from
http://www.bitpipe.com/tlist/Apparel-Industry.html

180
Black, J.A., & Boal, K.B. (1994). Strategic resources: Traits, configurations, and paths to sustainable competitive advantage. Strategic Management Journal, 15, 131-148.
Bonacich, E., Cheng, L., Chinchilla, N., Hamilton, N., & Ong, P. (1994). The garment
industry in the restructuring global economy. In E. Bonacich, L., Checng, N. Chinchilla, N. Hamilton, and P.Ong (Eds.), Global production: The apparel industry in the pacific rim (pp. 3-18). Philadelphia: Temple University Press.
Calantone, R., Garcia, R., & Dröge, C. (2003). The effects of environmental turbulence
on new product development strategy planning. Journal of Product Innovation Management, 20, 90-103.
Carr, A.S., & Pearson, J.N. (2002). The impact of purchasing and supplier involvement
on strategic purchasing and its impact on firm�s performance. International Journal of Operation & Production Management, 22, 1032-1053.
Cavusgil, S. T., & Zou, S. (1994). Marketing strategy-performance relationship: An
investigation of the empirical link in export market ventures. Journal of Marketing, 58(1), 1-21.
Child, J. (1972). Organizational structure, environment, and performance: The role of
strategic choice. Sociology, 6, 1-22. Cline, W. R. (1990). The future of world trade in textiles and apparel (Rev. ed.).
Washington, DC: Institute for International Economics. Coase, R. (1937). The nature of the firm. Economica, 4, 386-405. Conner, K.R. (1991). A historical comparison of resource based theory and five schools
of thought within industrial organization economics: Do we have a new theory of the firm? Journal of Management, 17, 121-154.
Connolly, T., Conlon, E.J., & Deutsch, S.J. (1980). Organizational effectiveness: A
multiple-constituency approach. Academy of Management Review, 5, 211-217. Cyert, R.M., & March, J.G. (1963). A behavioral theory of the firm. Englewood Cliffs,
NJ: Prentice-Hall. Day, G.S. (1994). The capabilities of market-driven organizations. Journal of Marketing,
58(October), 37-51. De Noble, A.F., Castaldi, R.M., & Moliver, D.M. (1989). Export intermediaries: Small
business perceptions of service and performance. Journal of Small Business Management, 27, 33-41.
181
Deng, S., & Wortzel, L.H. (1995). Importer purchase behavior: Guidelines for Asian exporters. Journal of Business Research, 32, 41-47.
Dess,G.G., & Beard, D.W. (1984). Dimensions of organizational task environments.
Administrative Science Quarterly, 29, 52-73. Dess, G.G., & Robinson, Jr. R.B. (1984). Measuring organizational performance in the
absence of objective measures: The case of the privately-held firm and conglomerate business unit. Strategic Management Journal, 5, 265-273.
DeVellis, R.F. (1991). Scale development: Theory and applications. Newbury Park, CA:
Sage. Dicken, P. (2003). Global shift: Reshaping the global economic map in the 21st century
(4th ed.). New York: The Guilford press. Dickerson, K.G. (1999). Textiles and apparel in the global economy (3rd ed.). New York:
John Wiley & Sons. Dillman, D.A. (2000). Mail and internet surveys: The tailored design method (2nd ed.).
New York: John Wiley & Sons. Dillman, D.A., Clark, J.R., Sinclair, M.A. (1995). How prenotice letters, stamped return
envelopes, and reminder postcards affect mailback response rates for census questionnaires. Survey Methodology, 21, 1-7.
Downey, H. K., Hellriegel, D., & Slocum, J. (1975). Environmental uncertainty: The
construct and its application. Administrative Science Quarterly, 20, 613-629. Duncan, R. (1972). Characteristics of organizational environments and perceived
uncertainty. Administrative Science Quarterly, 17, 313-327. Dyer, B., & Ha-Brookshire, J.E. (in press). Apparel import intermediaries� secrets to
success: Redefining success in a hyper-dynamic environment. Journal of Fashion Marketing and Management.
Ellis, K. (2007, January 9). Importers concerned with port security plan. Women�s Wear
Daily, 193, 12-12. Encaoua, D., Geroski, P., & Jacquemin, A. (1986). Strategic competition and the
persistence of dominant firms: A survey. In Stiglitz, J.E. and Mathewson, F. (Eds.), New developments in the analysis of market structure. London: Macmillan.
Etzioni, A. (1964). Modern organizations. Englewood Cliffs, NJ: Prentice Hall.

182
Ford, J.D., & Schellenberg, D.A. (1982). Conceptual issues of linkage in the assessment of organizational performance. Academy of Management Review, 7, 49-58.
Fornell, C., & Larcker, D.F. (1981). Evaluating structural equation models with
unobservable variables and measurement error. Journal of Applied Psychology, 82, 578-589.
Fredrickson, J.W. (1984). The comprehensiveness of strategic decision process:
Extension, observations, and future directions. Academy of Management Journal, 27, 445-466.
Fredrickson, J.W., & Iaquinto, I.A. (1989). Inertia and creeping rationality in strategic
decision processes. Academy of Management Journal, 32, 543-576. Fredrickson, J.W., & Mitchell, T.R. (1984). Strategic decision processes:
Comprehensiveness and performance in an industry with a stable environment. Academy of Management Journal, 27, 399-423.
Geroski, P., Machin, S.J., & Walters, C.F. (1997). Corporate growth and profitability.
The Journal of Industrial Economics, 45, 171-189. Gioia, D.A., & Pitre, E. (1990). Multiparadigm perspectives on theory building. Academy
of Management Review, 15, 584-602. Glazer, R., & Weiss, A.M. (1993). Marketing in turbulent environments: Decision
processes and the time-sensitivity of information. Journal of Marketing Research, 30, 509-521.
Goll, I., & Rasheed, M.A. (1997). Rational decision-making and firm performance: The
moderating role of environment. Strategic Management Journal, 18, 583-591. Grant, R.M. (1996). Toward a knowledge-based theory of the firm. Strategic
Management Journal, 17, 109-122. Grimm, C.M. (2006). Strategic paradigms of competitive advantage. In C.M. Grimm, H.
Lee, & K.G. Smith (Eds.), Strategy as action: Competitive dynamics and competitive advantage (pp. 31-47). New York: Oxford University Press.
Grove, R.M., & Kahn, R.L. (1979). Surveys by telephone: A national comparison with
personal interviews. New York: Academic. Ha-Brookshire, J.E., & Dyer, B. (2006). Apparel import intermediaries: The impact of a
hyper-dynamic environment on U.S. apparel firms. Manuscript submitted for publication. University of North Carolina at Greensboro.

183
Hair, J.F. Jr., Anderson, R.E., Tatham, R.L., & Black, W.C. (1998). Multivariate data analysis (5th ed.). Upper Saddle River, NJ: Prentice Hall.
Hoyle, R.H. (1995). The structural equation modeling approach: Basic concepts and
fundamental issues. In R.H. Hoyle (Ed.), Structural equation modeling: Concepts, issues, and application (pp. 1-15). Thousand Oaks, CA: Sage.
Hoyle, R.H., & Panter, A.T. (1995). Writing about structural equation models. In R.H.
Hoyle (Ed.), Structural equation modeling: Concepts, issues, and application (pp. 158-176). Thousand Oaks, CA: Sage.
Hu, L.Y., & Bentler, P.M. (1995). Evaluating model fit. In R.H. Hoyle (Ed.), Structural
equation modeling: Concepts, issues, and application (pp. 158-176). Thousand Oaks, CA: Sage.
Hunt, S.D. (2000). A general theory of competition: Resources, competences,
productivity, economic growth. Thousand Oaks, CA: Sage. Hunt, S.D., & Arnett, D.B. (2003). Resource-advantage theory and embeddedness:
Explaining R-A theory�s explanatory success. Journal of Marketing Theory and Practice, 11, 1-17.
Hunt, S.D., & Morgan, R.M. (1995). The comparative advantage theory of competition.
Journal of Marketing, 59(April), 1-15. Hunt, S.D., & Morgan, R.M. (1997). Resource-advantage theory: A snake swallowing its
tail or a general theory of competition? Journal of Marketing, 61(October), 74-82. Jensen, M.C., & Meckling, W.H. (1976). Theory of the firm: Managerial behavior,
agency costs and ownership structure. Journal of Financial Economics, 3, 305-360.
Jones, R.M., & Hayes, S.G. (2004). The UK clothing industry: Extinction or evolution?
Journal of Fashion Marketing and Management, 8, 262-278. Kaplan, D. (2000). Structural equation modeling: Foundations and extensions. Thousand
Oaks, CA: Sage. Katsikeas, C.S., Leonidou, L.C., & Morgan, N.A. (2000). Firm-level export performance
assessment: Review, evaluation, and development. Journal of the Academy of Marketing Science, 28, 493-511.

184
Keiser, S., & Sproul, L. (1982). Managerial responses to changing environments: Perspectives on problem sensing from social cognition. Administrative Science Quarterly, 17, 548-570.
Kim, L., & Lim, Y. (1988). Environment, generic strategies, and performance in a rapidly
developing country: A taxonomic approach. Academy of Management Journal, 31, 802-827.
Kirpalani, V.H., & Balcome, D. (1987). International marketing success: On conducting
more relevant research. In P.J. Rosson & S.D. Reid (Eds.), Managing export entry and expansion: An international context. New York: Praeger.
Kotabe, M., & Helsen, K. (1998). Global marketing management. New York: John Wiley. Kotha, S. & Nair, A. (1995). Strategy and environment as determinants of performance:
Evidence from the Japanese machine tool industry. Strategic Management Journal, 16, 497-518.
Kuivalainen, O., Sundqvist, S., Puumalainen, K., & Cadogan, J.W. (2004). The effect of
environmental turbulence and leader characteristics on international performance: Are knowledge-based firms different? Canadian Journal of Administrative Sciences, 21, 35-50.
Kunz, G.I., & Garner, M.B. (2006). Going global: The textile and apparel industry. New
York: Fairchild. Lambert, D.M., & Harrington, T.C. (1990). Measuring nonresponse bias in customer
service mail surveys. Journal of Business Logistics, 11(2), 5-25. Lawrence, P.R., & Lorsch, J.W. (1967). Organization and environments. Cambridge,
MA: Harvard University Press. Lehman, J., & Phelps, S. (Eds.). (2005). Jobber. West's encyclopedia of American law
(2nd ed., Vol., 6). Detroit, MI: Gale. Lee, C.S., & Yoo, S.Y. (1990). Impact of export market expansion strategy on export
performance. International Marketing Review, 7(4), 41-51. Li, Z.G., & Dant, R.V. (1999). Effects of manufacturers� strategies on channel
relationships. Industrial Marketing Management, 28, 131-143. March, J.G., & Simon, H.A. (1958). Organizations. New York: McGraw-Hill.
185
Matthews, C.H., & Scott, S.G. (1995). Uncertainty and planning in small and entrepreneurial firms: An empirical assessment. Journal of Small Business Management, 33(4), 34-52.
McKean, E. (Ed.). (2005). Trader. The new Oxford American dictionary (2nd ed.). New
York: Oxford University Press. Mentzer, J.T., DeWitt, W., Keeler, J.S., Min, S., Nix, N.W., Smith, C.D., & Zacharia,
Z.G. (2001). Defining supply chain management. Journal of Business Logistics, 22(2), 1-25.
Michelle, P. (2004, September), �The impact of change on business: Belk�s side of the
story�, in G.F. Simmons (Moderator), The Impact of Change. Symposium conducted at the University of North Carolina at Greensboro, NC.
Miles, M.P., Covin, J.G., & Heeley, M.B. (2000). The relationship between
environmental dynamism and small firm structure, strategy, and performance. Journal of Marketing Theory and Practice, 8(2), 63-74.
Miller, D., & Friesen, P.H. (1982). Innovation and conservative and entrepreneurial
firms: Two models of strategic momentum. Strategic Management Journal, 3, 1-25.
Milliken, F. (1987). Three types of uncertainty about the environment: State, effect, and
response uncertainty. Academy of Management Review, 12, 133-143. Mintzberg, H. (1979). The structuring of organizations. Englewood Cliffs, NJ: Prentice-
Hall. Mooney,G., Giesbrecht, L., & Shettle, C. (1993). To pay or not to pay: That is the
question. Paper presented at the meeting of the American Association for Public Opinion Research, St. Charles, IL.
Morgan, N.A., Kaleka, A., & Katsikeas, C.S. (2004). Antecedents of export venture
performance: A theoretical model and empirical assessment. Journal of Marketing, 68(1), 90-108.
Morris, M.H., Schindehutte, M., & LaForge, R.W. (2002). Entrepreneurial marketing: A
construct for integrating emerging entrepreneurship and marketing perspectives. Journal of Marketing Theory and Practice, 10(4), 1-19.
Nelson, N.J., LaBat, K.L., & Williams, G.M. (2002). Contemporary Irish textile artists:
Exploring experiences of gender, culture, and artistic medium. Clothing and Textiles Research Journal, 20, 15-25.

186
Olsen, R.P. (1978). The textile industry: An industry analysis approach to operations management. Lexington, MA: Lexington Books.
Overby, J.W., & Servais, P. (2004). Small and medium-sized firms� import behavior: The
case of Danish industrial purchasers. Industrial Marketing Management, 34, 71-83.
Paxson, M.C., Dillman, D.A., & Tarnai, J. (1995). Improving response to business mail
surveys. In B.G. Cox, D.A. Binder, B.N. Chinnappa, A. Christianson, M.J. Colledge, & P.S. Kott (Eds.), Business survey methods (pp. 303-315). New York: Wiley.
Pelham, A.M. (1999). Influence of environment, strategy, and market orientation on
performance in small manufacturing firms. Journal of Business Research, 45, 33-46.
Peng, M.W., & Ilinitch, A.Y. (1998). Export intermediary firms: A note on export
development research. Journal of International Business Studies, 29, 609-620. Peng, M.W., & York, A.S. (2001). Behind intermediary performance in export trade:
Transactions, agents, and resources. Journal of International Business Studies, 32, 327-346.
Peng, M.W., Hill, C.W.L., & Wang, D.Y.L. (2000). Schumpeterian dynamics versus
Williamsonian considerations: A test of export intermediary performance. Journal of Management Studies, 37, 167-184.
Penrose, E. (1959). The theory of the growth of the firm. New York: Sharpe. Pfeffer, J. (1982). Organizations and organization theory. Boston: Pitman. Piercy, N.F., Kaleka, A., & Katsikeas, C.S. (1998). Sources of competitive advantage in
high performing exporting companies. Journal of World Business, 33, 378-393. Porter, M.E. (1980). Competitive strategy. New York: Free Press. Porter, M.E. (1985). Competitive advantage. New York: Free Press. Progressive Policy Institute. (2003, November 12). The import cost of baby clothes has
dropped 30 percent since 1997. Trade Fact of the Week. Retrieved September 6, 2006, from http://www.ppionline.org/ppi_ci.cfm?contentid=252182&knlgAreaID=108&subsecid=900003

187
Progressive Policy Institute. (2006, February 15). T-shirt prices are falling. Trade Fact of the Week. Retrieved September 6, 2006, from http://www.ppionline.org/ppi_ci.cfm?contentid=253748&knlgAreaID=108&subsecid=900003
Progressive Policy Institute. (2006, April 19). US imports have grown by 38 percent
since 2000. Trade Fact of the Week. Retrieved September 6, 2006, from http://www.ppionline.org/ppi_ci.cfm?knlgAreaID=108&subsecID=900003&contentID=253826
Raykov, T., & Marcoulides, G.A. (2000). A first course in structural equation modeling. Mahwah, NJ: Lawrence Erlbaum Associates.
ReferenceUSA (2006). Crawford Textiles Company Inc. Profile. Retrieved September 14, 2006, from ReferenceUSA.
Reichel, J. (2000). The internationalisation of importing companies. European Journal of Marketing, 22(10), 31-40.
Rencher, A.C. (2002). Methods of multivariate analysis (2nd ed.). Hoboken, NJ: John Wiley & Sons.
Richey, R.G., & Myers, M.B. (2001). An investigation of market information use in
export channel decisions: Antecedents and outcomes. International Journal of Physical Distribution & Logistics Management, 31, 334-353.
Scheffer, M., & Duineveld, M. (2004). Final demise or regeneration?: The Dutch case.
Journal of Fashion Marketing and Management, 8, 340-349. Seth, A., & Thomas, H. (1994). Theories of the firm: Implications for strategy research.
Journal of Management Studies, 31, 165-191. Sharfman, M.P., & Dean Jr., J.W. (1991). Conceptualizing and measuring the
organizational environment: A multidimensional approach. Journal of Management, 17, 681-700.
Simon, H.A. (1947). Administrative behaviour. New York: Free Press. Singer, A.E. (1997). Game theory and the evolution of strategic thinking. Human Systems
Management, 16, 63-75. Soanes, C., & Stevenson, A. (Eds.). (2004). Importer. The concise Oxford English
dictionary (11th ed.). New York: Oxford University Press.

188
Song, X.M., & Parry, M.E. (1997). A cross-national comparative study of new product development processes: Japan and the United States. Journal of Marketing, 61(April), 1-18.
Souchon, A.L., & Diamantopoulos, A. (1997). Use and non-use of export information:
Some preliminary insights into antecedents and impact on export performance. Journal of Marketing Management, 13, 165-151.
Steers, R. (1977). Organizational effectiveness: A behavioral view. Pacific Palisades, CA:
Goodyear. Tanaka, J.S. (1993). Multifaceted conceptions of fit in structural equation models. In
structural equation models with latent variables. Child Development, 58, 134-146. Taplin, I., & Winterton, J. (2004). The European clothing industry: Meeting the
competitive challenge, Journal of Fashion Marketing and Management, 8, 256-261.
Thompson, J.D. (1967). Organizations in action. New York: McGraw-Hill. Tirole, J. (1988). The theory of industrial organization. Cambridge, MA.: MIT Press. Tookey, D.A. (1964). Factors associated with success in exporting. Journal of
Management Studies, 1, 48-66. Tosi, H.L, Aldag, R., Storey, R. (1973). On the measurement of the environment: An
assessment of the Larwrence and Lorsch environmental subscale. Administrative Science Quarterly, 18, 27-36.
Tosi, H.L., & Slocum, J.W. (1984). Contingency theory: Some suggested directions.
Journal of Management, 10, 9-26. Tung, R.L. (1979). Dimensions of organizational environments: An exploratory study of
their impact on organization structure. Academy of Management Journal, 22, 672-693.
U.S. Census Bureau. (2005a). Business and professional classification report: Form SQ-
CLASS (00), (4-20-2005), Retrieved August 7, 2006, from http://www.census.gov/svsd/www/sqclass.pdf
U.S. Census Bureau. (2005b). Retail trade. 2002 Economic Census wholesale trade
subject series. Washington, DC: U.S. Department of Commerce. Retrieved December 29, 2005 from http://www.census.gov/prod/ec02/ec0242slls.pdf

189
U.S. Census Bureau. (2005c). Wholesale trade. 2002 Economic Census retail trade subject series. Washington, DC: U.S. Department of Commerce. Retrieved December 29, 2005 from http://www.census.gov/prod/ec02/ec0244slls.pdf
U.S. Census Bureau. (2006, February). Sector 31-33: Manufacturing. Economic Census
2002. Retrieved September 7, 2006 from http://www.census.gov/econ/census02/naics/sector31/31-33.htm
U.S. Census Bureau. (2006, February 15). Industry statistics sampler: NAICS 42
Wholesale trade. Retrieved September 25, 2006 from http://www.census.gov/econ/census02/data/industry/E42.HTM
U. S. International Trade Commission. (2006). USITC Interactive Tariff and Trade
DataWeb, Version 2.7.4 [Data file]. Available from USITC web site, http://dataweb.usitc.gov/scripts/user_set.asp
Vibert, C. (2004). Theories of macro-organizational behavior: A handbook of ideas and explanations. Armonk, NY: M.E. Sharpe. Vibert, C., & Hurst, D. (2004). Radical humanist and structuralist perspectives. In C.
Vibert (Ed.), Theories of macro-organizational behavior: A handbook of ideas and explanations. Armonk, NY: M.E. Sharpe.
Walters, P.G.P., & Samiee, S. (1990). A model for assessing performance in small U.S.
exporting firms. Entrepreneurship Theory and Practice, 15(2), 33-50. Ward, P.T., McCreery, J.K., Ritzman, L.P., & Sharma, D. (1998). Competitive priorities
in operations management. Decision Sciences, 29, 1035-1046. Weick, K. (1979). The social psychology of organizing, 2nd ed. Boston: Addison-Wesley. Williamson, O.E. (1976). Markets and hierarchies: Analysis and anti-trust implications.
New York: Free Press. Williamson, O.E. (1985). The economic institutions of capitalism. New York: Free Press. Williamson, O.E. (1988). Corporate finance and corporate governance. Journal of
Finance, 43, 567-591. World Trade Organization (2006). International trade statistics, 2006: Trade by sector,
chapter IV. Retrieved January 24, 2007, from http://www.wto.org/english/res_e/statis_e/its2006_e/its06_bysector_e.htm

190
Yuchtman, E., & Seashore, S.E. (1967). A system resource approach to organizational effectiveness. American Sociological Review, 32, 891-903.

191
APPENDIX A
QUALITATIVE INTERVIEW EXPERT INFORMANTS
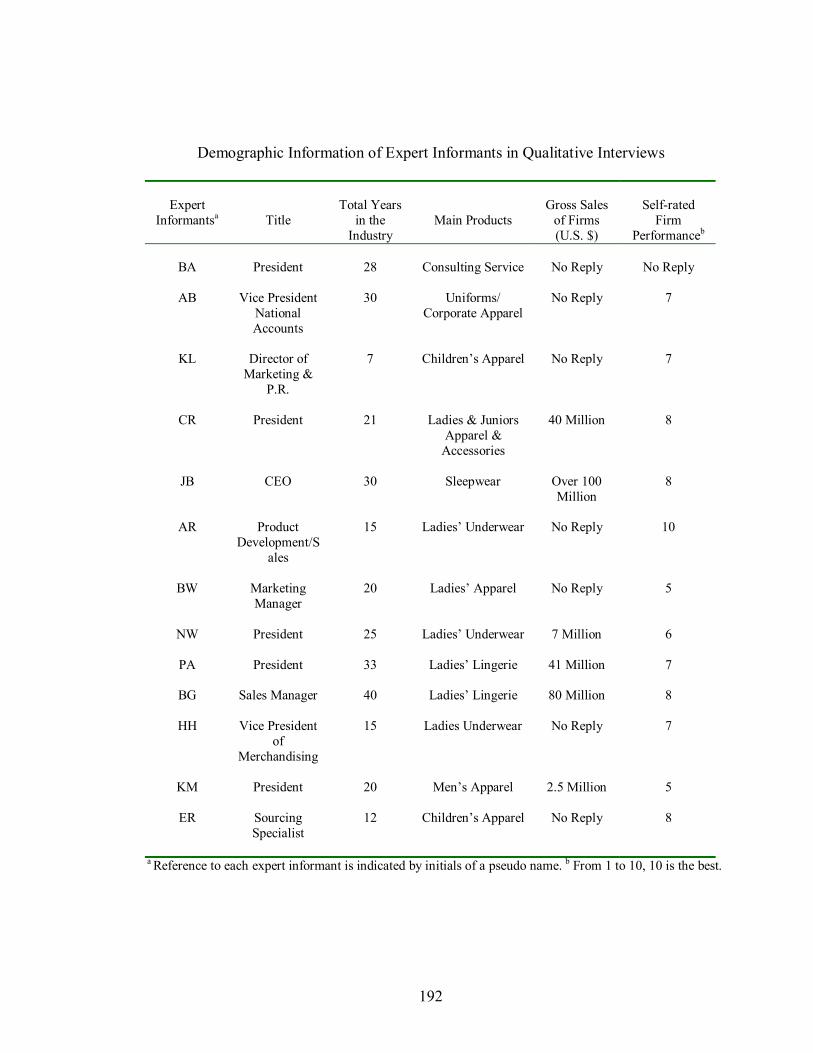
192
Demographic Information of Expert Informants in Qualitative Interviews
Expert
Informantsa
Title
Total Years
in the Industry
Main Products
Gross Sales
of Firms (U.S. $)
Self-rated
Firm Performanceb
BA President
28 Consulting Service No Reply No Reply
AB Vice President National Accounts
30 Uniforms/ Corporate Apparel
No Reply 7
KL Director of Marketing &
P.R.
7 Children�s Apparel No Reply 7
CR President 21 Ladies & Juniors Apparel &
Accessories
40 Million 8
JB CEO 30 Sleepwear Over 100 Million
8
AR Product Development/S
ales
15 Ladies� Underwear No Reply 10
BW Marketing Manager
20 Ladies� Apparel No Reply 5
NW President 25 Ladies� Underwear 7 Million
6
PA President 33 Ladies� Lingerie 41 Million
7
BG Sales Manager 40 Ladies� Lingerie 80 Million
8
HH Vice President of
Merchandising
15 Ladies Underwear No Reply 7
KM President 20 Men�s Apparel 2.5 Million
5
ER Sourcing Specialist
12 Children�s Apparel No Reply 8
a Reference to each expert informant is indicated by initials of a pseudo name. b From 1 to 10, 10 is the best.

193
APPENDIX B
QUALITATIVE INTERVIEW SCHEDULE

194
1. How long have you been with this company? % Please describe your current title and years in this position. % Please describe a position before the current title, if any.
2. Please give a brief history of your company.
% How and when was your company founded? % How would you describe the growth path that your company has followed
since its foundation?
3. What is your understanding of your company�s roles in today�s apparel industry? % Who, or what type of companies are your major clients? % What types of works or services does your company provide to your clients? % How does your company help your clients? % Is there anything else that your clients ask you to do other than what your
company is currently doing? How do you feel about those requests? % Who, or what type of companies are your major suppliers? % What types of works or services does your company receive from your
suppliers? % How do your suppliers help your companies? % What are the most challenging factors in selecting good suppliers? % Is there anything else that you would like your suppliers to do for your
company? Do you think they can satisfy your requests? % What types of works or services does your company provide to your
suppliers? % How does your company help your suppliers? % Is there anything else that your suppliers ask you to do other than what your
company is currently doing? How do you feel about those requests?
4. Are there any differences or changes in terms of your company�s functions since its birth?
5. How would you rate your company�s current performance relative to its
competitors?
6. Please name three or four strong points that your company has, relative to its major competitors. What are your company�s unique strengths that a competitor would find it hard to imitate? [Probe for details]
7. How was your company able to obtain or build those strengths?
8. Please name three areas which you would like to enhance within your company?
[Probe for details]

195
9. Why are those points important for your company?
10. If you can trade the best top 10 talents among your competitors to enhance three areas that you just mentioned before, would you do it? % Then, what would those be? % If not, why do you not want to trade them?
11. Some people say that the apparel industry in the US is declining. How do you
see the future of your company?
12. What are three things that will guarantee to succeed in the apparel import industry? [probe for details]
13. What are three things that will guarantee to fail in today�s apparel import
industry? [Probe for details]
14. What is your company�s goal or vision for the future?
15. If you have to pick the classification of your company between the apparel wholesale trade and the apparel manufacturing, what would you pick?
16. Are there any thoughts or opinions you would like to share?

196
APPENDIX C
DEMOGRAPHIC QUESTIONNAIRE FOR QUALITATIVE INTERVIEWS

197
Demographic Questionnaire for Interviews
Name: _____________________________Date: _______________________________
Title: __________________________________________________________________ Company Name: _________________________________________________________
Sole Proprietorship____ Partnership_______ Corporation________
Years with this Company: _________________________________________________
Gross Sales in last year: ________________________________________________________________________ (Optional)
Main Products that your company is providing: ________________________________________________________________________
Country of Origin of your company�s products:
Domestic________ Foreign____________ (if both, please indicate the estimated percentage of each.)
For foreign products, please name three countries of your biggest suppliers.
What are your company�s goals in next three years?
How would you rate the performance of your company in the last five years? Please circle the appropriate number on a scale of 1 to 10 with 1 being unsuccessful and 10 being successful.
Unsuccessful 1 2 3 4 5 6 7 8 9 10 Successful
Any other comments:

198
APPENDIX D
SURVEY QUESTIONNAIRE

199
A SURVEY OF U.S. APPAREL COMPANIES This survey is being conducted by Jung E. Ha-Brookshire, a Ph.D. candidate in the Department of Consumer, Apparel, and Retail studies at the University of North Carolina at Greensboro. Your response will be used to assess business operations of apparel (or other related goods) firms that are conducting design, marketing, sourcing, or importing their products to make sales to their domestic retailer or wholesaler clients. You have been selected to participate in this study as we believe that you can provide expert opinions and views of apparel firms� operations and performance over the past three to five years. If you are not sure of an answer to a question, please provide your best estimate.
Please respond to all questions, as incomplete questionnaires create serious problems in data analysis. Please return your completed questionnaire either in the enclosed self-addressed, post prepaid envelope or by e-mail at your earliest convenience. The researcher would be happy to share with you a detailed executive summary of the aggregate results of the study, including relevant and applicable information that may help you with practical business problems, at no cost. If you wish to receive a copy of the results of the study, please provide a copy of your business card a long with your completed questionnaire or provide detailed contact information at the end of the survey.
The quality of this research is highly dependent on your participation. I sincerely
appreciate your participation and time!
Jung E. Ha-Brookshire, Ph.D. Candidate ([email protected]) Department of Consumer, Apparel, and Retail Studies
School of Human Environmental Sciences University of North Carolina at Greensboro

200
While answering the following questionnaire, please keep in mind apparel firms/divisions that import their products to satisfy their domestic clients (such as retailers or other apparel firms) and foreign suppliers (such as factories or distributors). PART I. Firm Abilities 1. Please think about your main competitors and indicate how you rate your
firm�s/division�s abilities on a scale of 1 to 7, where 1 is much worse and 7 is much better. (Circle one number for each statement.)
Much worse
Much better
Our firm�s or division�s ability to� a)
develop new products for our domestic clients is................
1 2 3 4 5 6 7
b) build the product to designated or revised specifications is.
1 2 3 4 5 6 7
c) utilize new methods and ideas in the manufacturing process is�������������������..
1 2 3 4 5 6 7
d) interpret trends to satisfy our end-user customers is���
1 2 3 4 5 6 7
e) identify prospective domestic clients is�������...
1 2 3 4 5 6 7
f) capture important market information is�������..
1 2 3 4 5 6 7
g) acquire import market-related information is�����..
1 2 3 4 5 6 7
h) make contacts in the import market is��������..
1 2 3 4 5 6 7
i) monitor competitive products in the import market is��.
1 2 3 4 5 6 7
j) interpret market information through personal �on the floor� experience is���������������..
1 2 3 4 5 6 7
k) understand domestic clients� requirements is�����..
1 2 3 4 5 6 7
l) understand foreign suppliers� requirements is����.....
1 2 3 4 5 6 7
m) establish and maintain close foreign supplier relationships is....���������������������...
1 2 3 4 5 6 7
n) establish and maintain close domestic client relationships is��������...........................................................
1 2 3 4 5 6 7
o) achieve and maintain on-time product delivery is���... 1 2 3 4 5 6 7

201
Much worse
Much better
Our firm�s or division�s ability to�
p) achieve and maintain prompt response to domestic clients� orders is��������������������
1 2 3 4 5 6 7
q) offer extensive 24/7 domestic client service is ����...
1 2 3 4 5 6 7
r) develop a long-term domestic client service relationship is 1 2 3 4 5 6 7 PART II. Competitive Advantages 2. Please think about your main competitors and indicate what you feel to be your
firm�s/division�s competitive advantage in the following statements on a scale of 1 to 7, where 1 is much worse and 7 is much better. (Circle one number for each statement.)
Much worse
Much better
Our firm�s or division�s� a)
cost of raw materials is��������������
1 2 3 4 5 6 7
b) production cost per unit is�������������
1 2 3 4 5 6 7
c) cost of goods sold is���������������.
1 2 3 4 5 6 7
d) selling price to domestic clients is���������...
1 2 3 4 5 6 7
e) product quality is����������������.
1 2 3 4 5 6 7
f) packaging is��������.........................................
1 2 3 4 5 6 7
g) design and styles are���������������
1 2 3 4 5 6 7
h) products, in terms of fashion appeal, are.............................
1 2 3 4 5 6 7
i) established import connections to provide effective product accessibility is..������...............................
1 2 3 4 5 6 7
j) established import connections to provide a wide range of product accessibility are�������������...
1 2 3 4 5 6 7
k) technical support for domestic clients is�������..
1 2 3 4 5 6 7
l) after sales service for domestic clients is............................. 1 2 3 4 5 6 7

202
Much Worse
Much better
Our firm�s or division�s�
m) delivery speed is����������������...
1 2 3 4 5 6 7
n) delivery reliability is���������������
1 2 3 4 5 6 7
PART III. Firm Entrepreneurial Orientation 3. Please indicate the extent to which you agree or disagree with the following
statements regarding your firm�s/division�s entrepreneurial orientation on a scale of 1 to 7, where 1 is strongly disagree and 7 is strongly agree. (Circle one number for each statement.)
Strongly Disagree
Strongly
Agree In the past 5 years�
a) our firm or division has marketed many new lines of products or services���������������..
1 2 3 4 5 6 7
b) changes in our firm�s or division�s products or service lines have usually been quite dramatic����������.
1 2 3 4 5 6 7
In dealing with competitors, our firm or division�
c) typically initiates actions which competitors then respond to����������������������...
1 2 3 4 5 6 7
d) is very often the first business to introduce new products/services, administrative techniques, operating technologies, etc����������...........................
1 2 3 4 5 6 7
e) typically seeks to avoid competitive clashes, preferring a �live-and-let-live� posture�������������.
1 2 3 4 5 6 7
f) favor a strong emphasis on new products, technological leadership, and innovations����..................................
1 2 3 4 5 6 7

203
Strongly Disagree
Strongly Agree
In general, the top managers of our firm or division�
g) have a strong proclivity for high-risk projects (with chances of very high returns)���������...........
1 2 3 4 5 6 7
h) believe that owing to the nature of the environment, bold, wide-ranging acts are necessary to achieve the firm�s objectives��������������......................
1 2 3 4 5 6 7
When confronted with decision-making situations involving uncertainty�
i) our firm or division typically adopts a bold, aggressive posture in order to maximize the probability of exploiting potential opportunities��������������..
1 2 3 4 5 6 7
PART IV. Performance 4. Please indicate your perceptions of your firm�s/division�s financial performance on a
scale of 1 to 7, where 1 is much worse and 7 is much better. (Circle one number for each statement.)
Much Worse
Much better
Compared to main competitors over the past 12 months, our firm�s or division�s� a)
import sales volume was.����.....................................
1 2 3 4 5 6 7
b)
market share was.�������.....................................
1 2 3 4 5 6 7
c)
profitability was.�����...����������...
1 2 3 4 5 6 7

204
5. Please indicate your perceptions of your firm�s/division�s strategic performance on a scale of 1 to 7, where 1 is extremely poor and 7 is extremely successful. (Circle one number for each statement.)
Extremely poor
Extremely successful
Over the past 12 months, our firm�s or division�s� a)
creative contributions on the market were.������..
1 2 3 4 5 6 7
b)
recognition as an expert in the industry was.�����...
1 2 3 4 5 6 7
c) establishment of critical business relationships with suppliers, clients, etc. was..������������..
1 2 3 4 5 6 7
d) accomplishment of business strategic goals was����. 1 2 3 4 5 6 7
Over the past 3 years, our firm�s or division�s�
e)
long-term stability in the market was�...............................
1 2 3 4 5 6 7
6. Please think about your main competitors and indicate the extent to which you agree
or disagree with the following statements on a scale of 1 to 7, where 1 is strongly disagree and 7 is strongly agree. (Circle one number for each statement).
Strongly disagree
Strongly
agree
Over the past 12 months, our domestic clients are impressed with� a)
our firm�s or division�s service quality��������
1 2 3 4 5 6 7
b)
the quality of the relationship between our two firms��..
1 2 3 4 5 6 7
c)
our firm�s or division�s reputation.......................................
1 2 3 4 5 6 7
d)
our firm�s or division�s overall total product/service offering��������������������.
1 2 3 4 5 6 7
Over the past 12 months, our firm or division is impressed with� e)
our domestic clients� loyalty to our firm or division���
1 2 3 4 5 6 7
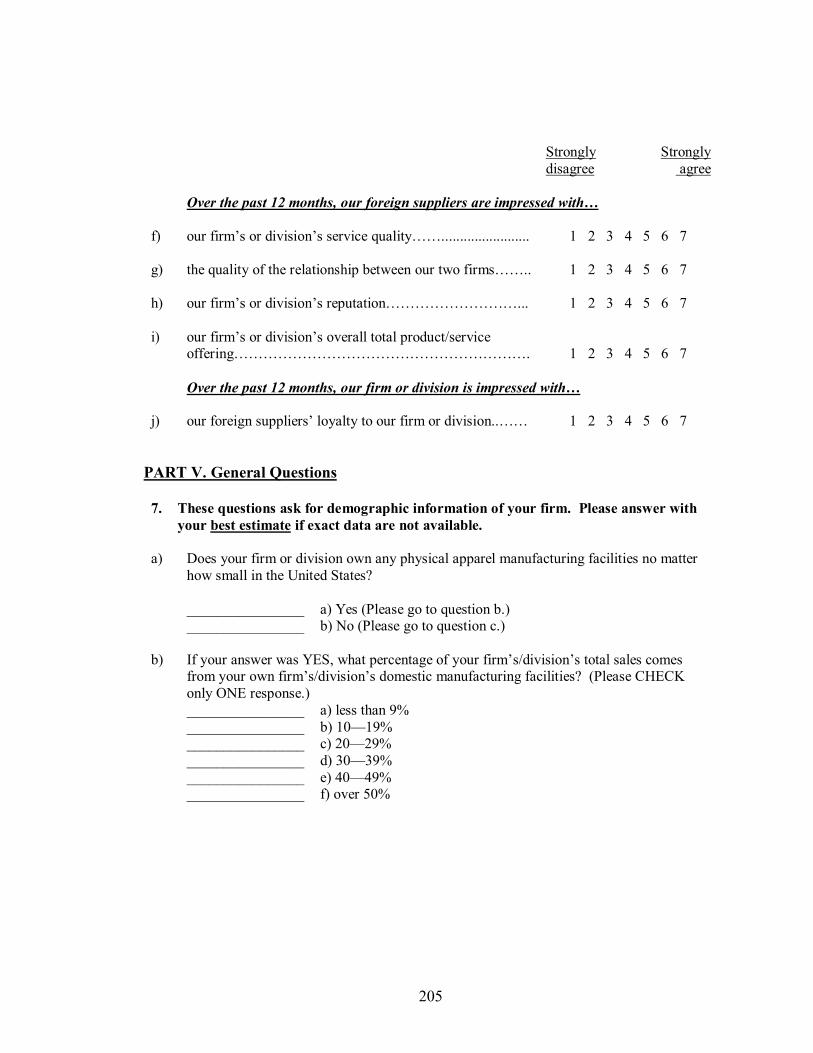
205
Strongly disagree
Strongly agree
Over the past 12 months, our foreign suppliers are impressed with� f)
our firm�s or division�s service quality��........................
1 2 3 4 5 6 7
g)
the quality of the relationship between our two firms��..
1 2 3 4 5 6 7
h)
our firm�s or division�s reputation���������...
1 2 3 4 5 6 7
i)
our firm�s or division�s overall total product/service offering��������������������.
1 2 3 4 5 6 7
Over the past 12 months, our firm or division is impressed with� j)
our foreign suppliers� loyalty to our firm or division..��
1 2 3 4 5 6 7
PART V. General Questions
7. These questions ask for demographic information of your firm. Please answer with your best estimate if exact data are not available.
a) Does your firm or division own any physical apparel manufacturing facilities no matter
how small in the United States?
________________________________
a) Yes (Please go to question b.) b) No (Please go to question c.)
b) If your answer was YES, what percentage of your firm�s/division�s total sales comes from your own firm�s/division�s domestic manufacturing facilities? (Please CHECK only ONE response.)
________________________________ ________________ ________________ ________________ ________________
a) less than 9% b) 10�19% c) 20�29% d) 30�39% e) 40�49% f) over 50%

206
c) If your answer was NO, what percentage of your firm�s/division�s total sales comes from your own firm�s/division�s import operations? (Please CHECK only ONE response.)
________________________________ ________________ ________________ ________________________________
a) less than 49% b) 50�59% c) 60�69% d) 70�79% e) 80�89% f) over 90%
d) Does your firm or division own any stores to make direct sales to end-user consumers?
________________________________
a) Yes (Please go to question e.) b) No (Please go to question f.)
e) If your answer was YES, what percentage of your firm�s/division�s total sales comes directly from your firm�s/division�s own retail stores? (Please CHECK only ONE response.)
________________________________ ________________ ________________ ________________ ________________
a) less than 9% b) 10�19% c) 20�29% d) 30�39% e) 40�49% f) over 50%
f) How many years has your firm/division been directly involved in any type of import operations? (Please CHECK only ONE response.)
________________________________ ________________ ________________ ________________________________
a) less than 9 years b) 10�19 years c) 20�29 years d) 30�39 years e) 40�49 years f) over 50 years
g) In the past 3 years, on average, from how many different countries did your firm or division import products? (Please CHECK only ONE response.)
________________________________ ________________ ________________ ________________________________
a) fewer than 4 b) 5�9 c) 10�14 d) 15�19 e) 20�24 f) over 25

207
h) In the past 3 years, across all countries from which you imported, what was the average number of suppliers per country? (Please CHECK only ONE response.)
________________________________ ________________ ________________________________________________
a) fewer than 4 b) 5�9 c) 10�14 d) 15�19 e) 20�24 f) over 25
i) In general, to how many different domestic clients did your firm or division supply products? (Please CHECK only ONE response.)
________________________________ ________________ ________________ ________________________________
a) fewer than 4 b) 5�9 c) 10�14 d) 15�19 e) 20�24 f) over 25
j) How many employees (including your overseas staff) would you estimate your firm or division has as of today? (Please CHECK only ONE response.)
________________________________ ________________________________________________ ________________
a) fewer than 49 b) 50�149 c) 150�299 d) 300�499 e) 500�749 f) over 750
k) If you have any overseas staff, what percentage of your firm�s or division�s employees are overseas employees? (Please CHECK only ONE response.)
________________________________ ________________ ________________ ________________ ________________
a) 0% b) 1�9% c) 10�19% d) 20�29% e) 30�39% f) over 40%
l) What business classification BEST describes your firm�s or division�s MAJOR business? (Please CHECK only ONE response.)
________________
________________ ________________ ________________
a) Manufacturer b) Wholesaler c) Retailer d) other (please specify) _____________

208
m) What product category BEST describes your firm�s or division�s MAJOR business? (Please CHECK only ONE response.)
________________
________________ ________________ ________________ ________________ ________________
a) Women�s b) Men�s c) Children�s and Infants� d) Sleepwear/underwear e) Fur/Leather f) other (please specify)______________
n) What is your firm�s or division�s annual gross sales figure in US$? (Please CHECK only ONE response.)
________________________________ ________________________________ ________________________________
a) less than 4.9 million b) 5�24.9 million c) 25�49.9 million d) 50�99.9 million e) 100�499 million f) over 500 million
o) What title best describes your position within your firm or division? (Please CHECK only ONE response.)
________________________________ ________________ ________________ ________________
a) CEO/President b) General Manager c) Vice President d) Division Manager e) Other (Please specify) _____________
OPTIONAL The researcher would be happy to share with you a detailed executive summary of the aggregate results of the study, including relevant and applicable information that may help you with practical business problems, at no cost. If you wish to receive a copy of the study results, please attach your business cards or provide your name and detailed address in the space below. Name: Title: Mailing Address: Phone: E-mail:
209
COMMENTS If there are any additional issues that are important to your firm but are not addressed by this survey or if you have general comments, please share them here.
Thank you so much for your cooperation!
CONTACT INFORMATION
Jung E. Ha-Brookshire Ph.D. Candidate
Department of Consumer, Apparel, and Retail Studies School of Human Environmental Sciences University of North Carolina at Greensboro
210 Stone Building PO Box 26170, Greensboro, NC 27402-6170
Phone: (336) 256-0268 Fax: (336) 334-5614
Email: [email protected]

210
APPENDIX E
MAIL SURVEY COVER LETTER

211
Date
Name, Title Company, Address Dear Mr./Ms. XXX, I, Jung E. Ha-Brookshire, a Ph.D. candidate in the Department of Consumer, Apparel, and Retail Studies at the University of North Carolina at Greensboro, am seeking your support for an important business study. At the same time, I am offering you an excellent opportunity to receive an exclusive, Advance Executive Summary of the study results that will include immediate, relevant, and practical knowledge about US apparel firms� strategies and performance, at no cost, simply by participating in this important research. The study is part of the researcher�s dissertation, investigating apparel firms� business practices. Specifically, you have been selected as the researcher believes that you can provide expert opinions and views of your firm�s operations and performance over the past three to five years. The enclosed survey can be completed in approximately 15 to 20 minutes. Your privacy and your company�s privacy will be completely safeguarded as the data will be analyzed as aggregate, not individual, responses. Furthermore, this study is for academic purposes, not for any commercial gain. Your written survey responses will be kept strictly confidential in the researcher�s locked office. Please take your time to answer all the questions as honestly as possible as there are no right or wrong answers. If you feel that you are not the most qualified individual at your company to fill out the survey, please forward this survey packet to that person and encourage that person to complete the survey. As indicated above, the researcher would be happy to share with you an Advance Executive Summary of the aggregate study results, including relevant and applicable information that may help with practical business problems, at no cost. If you wish to receive a copy of the summary, please enclose your business card with your completed questionnaire or provide your name and detailed contact information at the end of the survey. If you do not want the summary, complete the survey without providing your firm�s contact information. If you have any questions concerning your rights as a participant, you may contact Mr. Eric Allen, from the Office of Research Compliance at (336) 256-1482. If you have any questions regarding the research itself, you may contact the researcher at (336) 256-0268 or by e-mail at [email protected]. Your time is at a premium; however, the quality of this important research is completely dependent on your response. Please return the completed survey in the enclosed self-addressed pre-paid envelope at your earliest convenience or by December XX, 2006. Thank you in advance for your valuable time. Sincerely, Jung E. Ha-Brookshire, Ph.D. Candidate Department of Consumer, Apparel, and Retail Studies University of North Carolina at Greensboro Enclosures: Consent to act as a human participant, questionnaire, and self-addressed pre-paid return envelope

212
APPENDIX F
E-MAIL SURVEY COVER LETTER

213
Date: Dear Mr./ Mrs. XXX: It was a pleasure talking with you through the phone today. As we discussed, I am offering you an excellent opportunity to receive an exclusive, Advance Executive Summary of the study results that will include immediate, relevant, and practical knowledge about US apparel firms� strategies and performance, at no cost, simply by participating in this important research. The study is part of the researcher�s dissertation, investigating apparel firms� business practices. Specifically, you have been selected as the researcher believes that you can provide expert opinions and views of your firm�s operations and performance over the past three to five years. The enclosed survey can be completed in approximately 15 to 20 minutes. Your privacy and your company�s privacy will be completely safeguarded as the data will be analyzed as aggregate, not individual, responses. Furthermore, this study is for academic purposes, not for any commercial gain. Your written survey responses will be kept strictly confidential in the researcher�s locked office. Please take your time to answer all the questions as honestly as possible as there are no right or wrong answers. Once competed, please save the file, check if you marked all your answers, and then simply send me your complete response by e-mail. As indicated above, the researcher would be happy to share with you an Advance Executive Summary of the aggregate study results, including relevant and applicable information that may help with practical business problems, at no cost. If you wish to receive a copy of the summary, please indicate in your e-mail. If you have any questions concerning your rights as a participant, you may contact Mr. Eric Allen, from the Office of Research Compliance at (336) 256-1482. If you have any questions regarding the research itself, you may contact the researcher at (336) 256-0268 or by e-mail at [email protected]. Your time is at a premium; however, the quality of this important research is completely dependent on your response. Please return the completed at your earliest convenience or by December XX, 2006. Thank you in advance for your valuable time. Sincerely, Jung E. Ha-Brookshire, Ph.D. Candidate Dr. Barbara Dyer, Associate Professor Department of Consumer, Apparel, and Retail Studies University of North Carolina at Greensboro
Enclosures: Consent to act as a human participant and questionnaire

214
APPENDIX G
PHONE OR PERSONAL RECRUITMENT MATERIAL

215
Any participants who will be recruited via phone conversation or personal visits to apparel import firms will be informed the following information by the PI. My name is Jung E. Ha-Brookshire and I am a Ph.D. candidate at the Department of Consumer, Apparel, and Retail Studies, University of North Carolina at Greensboro. I am offering you an excellent opportunity to receive an exclusive, Advance Executive Summary of the study results that will include immediate, relevant, and practical knowledge about US apparel firms� strategies and performance, at no cost, simply by participating in this important research. The study is part of the researcher�s dissertation, investigating apparel firms� business practices. I am looking for opinions and views of apparel firms� executives and senior managers who would share important information regarding firm operations and performance over the past three to five years. With that information, I plan to make an in-depth investigation of apparel firms� business practices. Your assistance in filling out the attached questionnaire is extremely valuable to the quality of this study as your response would provide further insights into apparel firms� performance. Written surveys will take approximately 15 to 20 minutes. Your privacy and your company�s privacy will be completely safeguarded as the data will be analyzed as aggregate, not individual, responses. Furthermore, this study is for academic purposes, not for any commercial gain. Your written survey responses will be kept strictly confidential in the researcher�s locked office. Please take your time to answer all the questions as honestly as possible as there are no right or wrong answers. Once competed, please seal the envelope and return back to me. I would be happy to share with you an Advance Executive Summary of the aggregate study results, including relevant and applicable information that may help with practical business problems, at no cost. If you wish to receive a copy of the summary, please indicate at the end of the survey. If you have any questions concerning your rights as a participant, you may contact Mr. Eric Allen, from the Office of Research Compliance at (336) 256-1482. If you have any questions regarding the research itself, you may contact the researcher at (336) 256-0268 or by e-mail at [email protected]. Thank you in advance for your assistance and time.

216
APPENDIX H
APPROVAL OF INSTITUTIONAL REVIEW BOARD (IRB) FOR THE USE OF
HUMAN PARTICIPANTS IN RESEARCH:
QUALITATIVE INTERVIEWS

217

218
APPENDIX I
APPROVAL OF INSTITUTIONAL REVIEW BOARD (IRB) FOR THE USE OF
HUMAN PARTICIPANTS IN RESEARCH:
MAIL SURVEY

219

220
APPENDIX J
MEASUREMENT PURIFICATION:
EXPLORATORY FACTOR ANALYSIS AND RELIABILITY ANALYSIS

221
EFA 1: AIIs� Capabilities
Kaiser�s Measurement Sampling Adequacy: Overall MSA = 0.777
V4 V9 V10 V12 V13 V14 V16
V18
0.817 0.771 0.808 0.686 0.662 0.853
0.836 0.796
Note. All MSA indices are above 0.5, thus acceptable.
Eigenvalues of the Correlation Matrix: Total = 8 Average = 1
Eigenvalue Difference Proportion Cumulative
1 4.10733531 2.70275304 0.5134 0.5134 2 1.40458227 0.26239472 0.1756 0.6890 3 1.14218755 0.71700254 0.1428 0.8318 4 0.42518502 0.13839151 0.0531 0.8849 5 0.28679350 0.02616460 0.0358 0.9208 6 0.26062890 0.03978435 0.0326 0.9533 7 0.22084455 0.06840166 0.0276 0.9809 8 0.15244289 0.0191 1.0000
Rotated Factor Pattern (Standardized Regression Coefficients)
Factor1 Factor2 Factor3 V4 -0.00468 0.88605 -0.03662 V9 -0.09438 0.88528 0.21393 V10 0.13842 0.84253 -0.12129 V12 0.06855 0.05688 0.90275 V13 0.01810 -0.02531 0.95287 V14 0.86053 -0.01638 0.10161 V16 0.88316 0.00232 0.04512 V18 0.91854 0.03126 -0.07044
Final Communality Estimates After Rotation: Total = 6.654
V4 V9 V10 V12 V13 V14 V16 V18 0.764 0.860 0.772 0.905 0.908 0.807 0.815
0.822

222
EFA 2: Positional Advantages
Kaiser�s Measurement Sampling Adequacy: Overall MSA = 0.782
V19 V20 V21 V24 V25 V26 V29
V30
0.738 0.703 0.895 0.880 0.776 0.750 0.783
0.794
Note. All MSA indices are above 0.5, thus acceptable.
Eigenvalues of the Correlation Matrix: Total = 8 Average = 1
Eigenvalue Difference Proportion Cumulative
1 4.89289086 3.41927307 0.6116 0.6116 2 1.47361779 0.81682079 0.1842 0.7958 3 0.65679700 0.33963653 0.0821 0.8779 4 0.31716047 0.03770087 0.0396 0.9176 5 0.27945961 0.03643611 0.0349 0.9525 6 0.24302350 0.16000225 0.0304 0.9829 7 0.08302125 0.02899173 0.0104 0.9932 8 0.05402952 0.0068 1.0000
Rotated Factor Pattern (Standardized Regression Coefficients)
Factor1 Factor2 V19 0.03421571 0.9342115 V20 -0.0685747 1.00481736 V21 0.06788145 0.87113305 V24 0.87075732 -0.0859973 V25 0.92405964 -0.0069237 V26 0.93414052 -0.0283454 V29 0.78417239 0.09908809 V30 0.73427623 0.07969337
Final Communality Estimates After Rotation: Total = 6.367
V19 V20 V21 V24 V25 V26 V29 V30
0.906 0.944 0.824 0.689 0.847 0.847 0.704
0.605

223
EFA 3: AIIs� Performance
Kaiser�s Measurement Sampling Adequacy: Overall MSA = 0.757
V41 V43 V44 V46 V48
V49
0.786 0.738 0.761 0.862 0.681 0.739
Note. All MSA indices are above 0.5, thus acceptable.
Eigenvalues of the Correlation Matrix: Total = 8 Average = 1
Eigenvalue Difference Proportion Cumulative
1 4.42175823 3.41494905 0.7370 0.7370 2 1.00680918 0.78297835 0.1678 0.9048 3 0.22383083 0.01733033 0.0373 0.9421 4 0.20650051 0.11607232 0.0344 0.9765 5 0.09042819 0.03975512 0.0151 0.9916 6 0.05067307 0.0084 1.0000
Rotated Factor Pattern (Standardized Regression Coefficients)
Factor1 Factor2
RP1 -0.0672737 1.00014318 RP3 0.09747751 0.8800618 RP4 0.0083734 0.93518627 RP6 0.90156564 0.05380921 RP8 0.99737326 -0.0533762 RP9 0.94775035 0.02239286
Final Communality Estimates After Rotation: Total = 5.429
V41 V43 V44 V46 V48
V49
0.921 0.890 0.884 0.876 0.932 0.925

224
Reliability Analysis: Market Interpretation Capabilities
Simple Statistics
Variable N Mean Std Dev Sum Minimum Maximum
V4 159 5.62264 1.25627 894.00000 1.00000
7.00000 V9 159 5.61635 1.30626 893.00000 1.00000
7.00000 V10 159 5.61635 1.25687 893.00000 1.00000
7.00000
Cronbach Coefficient Alpha
Variables Alpha
Raw 0.858710 Standardized 0.858418
Cronbach Coefficient Alpha with Deleted Variable
Raw Variables Standardized Variables
Deleted Correlation Correlation Variable with Total Alpha with Total Alpha
V4 0.706895 0.825869 0.705867 0.826229 V9 0.785565 0.750921 0.785565 0.750921 V10 0.708458 0.824453 0.707395 0.824822
Pearson Correlation Coefficients, N = 159 Prob > |r| under H0: Rho=0
V4 V9 V10
V4 1.00000 0.70187 0.60118
<.0001 <.0001
V9 0.70187 1.00000 0.70391 <.0001 <.0001
V10 0.60118 0.70391 1.00000
<.0001 <.0001

225
Reliability Analysis: Sourcing Capabilities
Simple Statistics
Variable N Mean Std Dev Sum Minimum Maximum
V12 159 5.59119 1.04466 889.00000 2.00000
7.00000 V13 159 5.69811 1.17330 906.00000 1.00000
7.00000
Cronbach Coefficient Alpha Variables Alpha Raw 0.896444 Standardized 0.899773
Cronbach Coefficient Alpha with Deleted Variable Raw Variables Standardized Variables Deleted Correlation Correlation Variable with Total Alpha with Total Alpha V12 0.817807 . 0.817807 . V13 0.817807 . 0.817807 .
Pearson Correlation Coefficients, N = 159 Prob > |r| under H0: Rho=0 V12 V13 V12 1.00000 0.81781 <.0001 V13 0.81781 1.00000
<.0001

226
Reliability Analysis: Service Capabilities
Simple Statistics
Variable N Mean Std Dev Sum Minimum Maximum
V14 159 5.92453 0.96487 942.00000 1.00000
7.00000 V16 159 6.01258 0.90699 956.00000 2.00000
7.00000 V18 159 5.92453 1.04668 942.00000 1.00000
7.00000
Cronbach Coefficient Alpha
Variables Alpha
Raw 0.882184 Standardized 0.884094
Cronbach Coefficient Alpha with Deleted Variable
Raw Variables Standardized Variables
Deleted Correlation Correlation Variable with Total Alpha with Total Alpha
V14 0.771512 0.832938 0.771910 0.837912 V16 0.776486 0.832232 0.776506 0.833840 V18 0.774773 0.834304 0.774935 0.835234
Pearson Correlation Coefficients, N = 159 Prob > |r| under H0: Rho=0
V14 V16 V18
V14 1.00000 0.71708 0.71503
<.0001 <.0001
V16 0.71708 1.00000 0.72104 <.0001 <.0001
V18 0.71503 0.72104 1.00000
<.0001 <.0001

227
Reliability Analysis: Cost Advantages
Simple Statistics
Variable N Mean Std Dev Sum Minimum Maximum
V19 159 5.06289 1.03536 805.00000 1.00000
7.00000 V20 159 5.10692 1.07675 812.00000 1.00000
7.00000 V21 159 5.42767 1.09347 863.00000 1.00000
7.00000
Cronbach Coefficient Alpha
Variables Alpha
Raw 0.937622 Standardized 0.938240
Cronbach Coefficient Alpha with Deleted Variable
Raw Variables Standardized Variables
Deleted Correlation Correlation Variable with Total Alpha with Total Alpha
V19 0.890142 0.895122 0.890819 0.895181 V20 0.924980 0.865699 0.926776 0.866431 V21 0.801757 0.963711 0.801305 0.964094
Pearson Correlation Coefficients, N = 159 Prob > |r| under H0: Rho=0
V19 V20 V21
V19 1.00000 0.93068 0.76434
<.0001 <.0001
V20 0.93068 1.00000 0.81025 <.0001 <.0001
V21 0.76434 0.81025 1.00000
<.0001 <.0001

228
Reliability Analysis: Product Advantages
Simple Statistics
Variable N Mean Std Dev Sum Minimum Maximum
V24 159 5.38365 1.19492 856.00000 1.00000
7.00000 V25 159 5.97484 1.07297 950.00000 2.00000
7.00000 V26 159 5.88050 1.02107 935.00000 2.00000
7.00000
Cronbach Coefficient Alpha
Variables Alpha
Raw 0.912466 Standardized 0.917199
Cronbach Coefficient Alpha with Deleted Variable
Raw Variables Standardized Variables
Deleted Correlation Correlation Variable with Total Alpha with Total Alpha
V24 0.749827 0.945893 0.750413 0.946505 V25 0.849756 0.853506 0.858078 0.859534 V26 0.889307 0.826615 0.893737 0.829421
Pearson Correlation Coefficients, N = 159 Prob > |r| under H0: Rho=0
V24 V25 V26
V24 1.00000 0.70856 0.75367
<.0001 <.0001
V25 0.70856 1.00000 0.89844 <.0001 <.0001
V26 0.75367 0.89844 1.00000
<.0001 <.0001
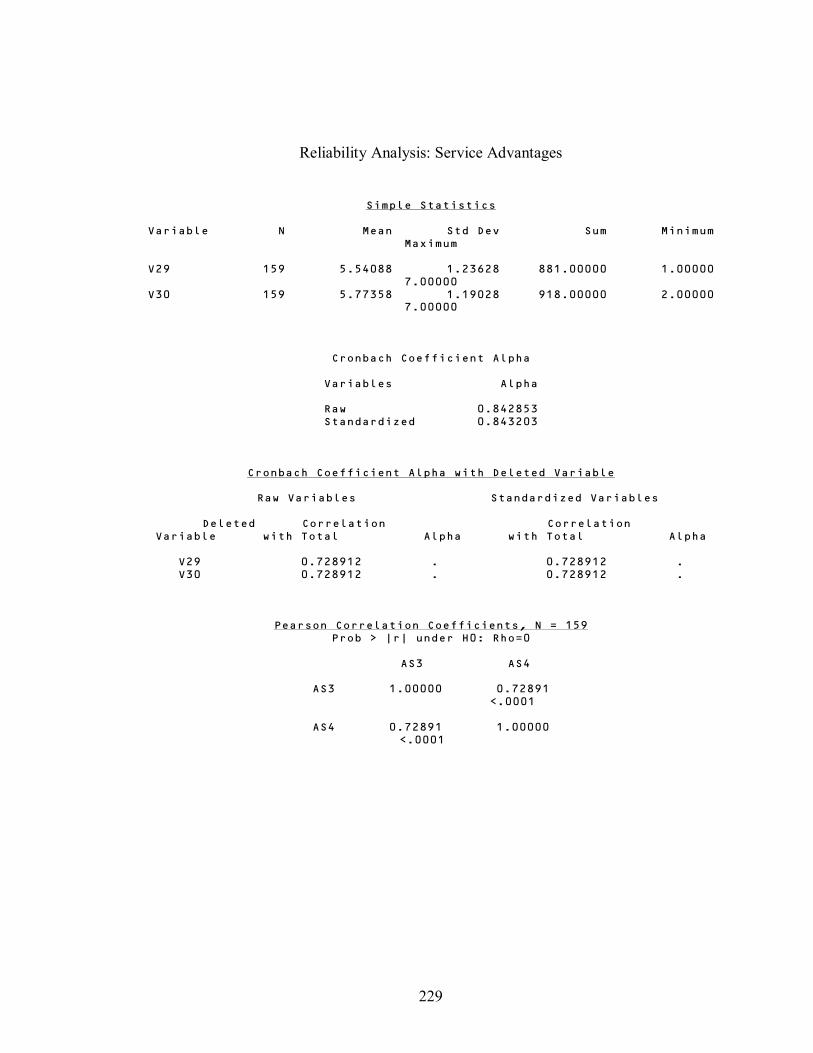
229
Reliability Analysis: Service Advantages
Simple Statistics
Variable N Mean Std Dev Sum Minimum Maximum
V29 159 5.54088 1.23628 881.00000 1.00000
7.00000 V30 159 5.77358 1.19028 918.00000 2.00000
7.00000
Cronbach Coefficient Alpha
Variables Alpha
Raw 0.842853 Standardized 0.843203
Cronbach Coefficient Alpha with Deleted Variable
Raw Variables Standardized Variables
Deleted Correlation Correlation Variable with Total Alpha with Total Alpha
V29 0.728912 . 0.728912 . V30 0.728912 . 0.728912 .
Pearson Correlation Coefficients, N = 159 Prob > |r| under H0: Rho=0
AS3 AS4
AS3 1.00000 0.72891
<.0001
AS4 0.72891 1.00000 <.0001

230
Reliability Analysis: Relationship Performance with Domestic Clients
Simple Statistics
Variable N Mean Std Dev Sum Minimum Maximum
V41 159 5.94969 0.98597 946.00000 2.00000
7.00000 V43 159 5.95597 1.01474 947.00000 2.00000
7.00000 V44 159 5.96226 0.99928 948.00000 2.00000
7.00000
Cronbach Coefficient Alpha
Variables Alpha
Raw 0.941940 Standardized 0.942058
Cronbach Coefficient Alpha with Deleted Variable
Raw Variables Standardized Variables
Deleted Correlation Correlation Variable with Total Alpha with Total Alpha
V41 0.896025 0.902398 0.895953 0.902456 V43 0.877662 0.916532 0.877811 0.916576 V44 0.863737 0.927078 0.863920 0.927284
Pearson Correlation Coefficients, N = 159 Prob > |r| under H0: Rho=0
V41 V43 V44
V41 1.00000 0.86443 0.84600
<.0001 <.0001
V43 0.86443 1.00000 0.82225 <.0001 <.0001
V44 0.84600 0.82225 1.00000
<.0001 <.0001

231
Reliability Analysis: Relationship Performance with Foreign Suppliers
Simple Statistics
Variable N Mean Std Dev Sum Minimum Maximum
V46 159 5.60377 1.10819 891.00000 1.00000
7.00000 V48 159 5.77987 1.07119 919.00000 1.00000
7.00000 V49 159 5.72327 1.05490 910.00000 1.00000
7.00000
Cronbach Coefficient Alpha
Variables Alpha
Raw 0.950010 Standardized 0.950453
Cronbach Coefficient Alpha with Deleted Variable
Raw Variables Standardized Variables
Deleted Correlation Correlation Variable with Total Alpha with Total Alpha
V46 0.866517 0.949260 0.866536 0.949318 V48 0.907813 0.916940 0.908610 0.917543 V49 0.911587 0.914590 0.912093 0.914876
Pearson Correlation Coefficients, N = 159 Prob > |r| under H0: Rho=0
V46 V48 V49
V46 1.00000 0.84311 0.84765
<.0001 <.0001
V48 0.84311 1.00000 0.90353 <.0001 <.0001
V49 0.84765 0.90353 1.00000
<.0001 <.0001

232
APPENDIX K
PERMISSION TO REPRINT

233