capcom co. ltd. buy - jefferies.com · capcom the gaming space is changing rapidly. the console...
TRANSCRIPT
JPY Prev. 2013A Prev. 2014E Prev. 2015E Prev. 2016E
Rev. (MM) -- 94,006.0 -- 89,000.0 -- 89,500.0 -- 92,000.0
EV/Rev 0.8x 0.9x 0.9x 0.8x
OperatingProfit
-- 10,151.0 -- 12,500.0 -- 13,800.0 -- 15,000.0
Net Profit -- 2,973.0 -- 7,700.0 -- 8,500.0 -- 9,300.0
ROE -- 5.9% -- 11.5% -- 11.4% -- 11.1%
BV/Share -- 1,091.00 -- 1,255.00 -- 1,406.00 -- 1,571.00
P/B 1.6x 1.4x 1.2x 1.1x
EPS
FY Mar -- 52.00 -- 137.00 -- 151.00 -- 165.00
FY P/E 33.6x 12.8x 11.6x 10.6x
Price Performance
JUN-13 JUL-13 AUG-13 SEP-13
1,800
1,700
1,600
1,500
1,400
COMPANY NOTE
Initiating Coverage
JPN | Technology | Software 10 September 2013
Capcom Co. Ltd. (9697 JP)Positioned Well for the Transition; Initiatingwith Buy
EQU
ITY R
ESEARC
H G
LOB
AL
BUYPrice target ¥2,050
Price ¥1,749Price target $10.50
Price $8.74
Bloomberg TSE: 9697 JPBloomberg OTC: CCOEY
Financial SummaryBook Value (MM): ¥70,528.0Book Value/Share: ¥1,255Net Debt (MM): (¥21.5)BNReturn on Avg. Equity: 11.5%Net Debt/Capital: (31.0)%Long-Term Debt (MM): ¥6,553.0LTD/Cap: 9.0%Dividend Yield: 2.4%Cash & ST Invest. (MM): ¥39,632.0
Market Data52 Week Range: ¥1,847 - ¥1,250Total Entprs. Value (MM): ¥76.8BNMarket Cap. (MM): ¥98.3BNInsider Ownership: 13.0%Institutional Ownership: 40.0%Shares Out. (MM): 56.2Float (MM): 41.8Avg. Daily Vol.: 435,500
Atul Goyal, CFA *Equity Analyst
+65 6551 3965 [email protected] Oda §
Equity Associate+813 5251 6138 [email protected]
* Jefferies Singapore LimitedMCI (P) 035/07/2013
§ Jefferies (Japan) Limited
Key Takeaway
The gaming space is changing rapidly. The console gaming market, in its 8thinnings, is shrinking and consolidating. Capcom transitioned well from Gen 6to Gen 7 and should do better than peers this cycle as well. Near-term, MonsterHunter 4's launch (14th Sep on 3DS platform) should help sentiment/earnings.In addition, a strong balance sheet allows Capcom to expand inorganically.Initiate with Buy and a price target of ¥2,050.
Industry at crossroads, Capcom positioned well. Technology has always been achange agent for this industry. Besides a new cycle (next-gen consoles), in the last few years,the industry has been revolutionized by the mobile-OS app-store business model. Despitechallenges, Capcom did very well in the previous console cycle and was also very early inidentifying and planning for mobile-gaming expansion.
Console in 8th innings…consolidating. The installed base of next-gen consoles is likelyto fall by 30-50%. As the tie ratio is declining, the total market is shrinking. The top end ofthe market will likely consolidate. Capcom will have help from 3 major franchises (ResidentEvil, Street Fighter, Monster Hunter). Capcom sold well in Gen 7 cycle (<10% decline fromGen 6, vs. Konami -70%; Square -35%). In this cycle, Capcom’s upside can come from itscloser alliance with Sony (we expect Sony’s PS4 to take a meaningful lead in the currentconsole cycle).
Capcom making a Beeline for mobile games. The mobile-OS games market has grownrapidly and is now bigger than handheld games (which is declining steadily). Within that,Japan appears by far the biggest. Here, small companies (Super-Cell, Gungho, etc.) arebetter positioned than console-era companies. Around 20-25% of Capcom's mobile-OSgame revenues are driven by its subsidiary Beeline. Its Smurfs village is a global hit. StrongB/S gives it flexibility to expand inorganically.
MH4 can surprise near-term. In the near-term, Capcom is set to launch MonsterHunter-4 on 3DS on 14 Sep. We believe MH4 could sell well (>3m), beating co guidance of2m. The previous version MH3 sold 2.4m (3DS installed base was 15m then; now c. 32m).
Valuation/Risks
Capcom is attractively valued (11x PER; 1.2x PBR) with healthy RoE of c.11-12%. Our pricetarget of ¥2,050 (for 9697 JP and $10.50 for CCOEY); and is based on 1.5x PBR. Besides themarket risk and the industry risk (the games industry by its very nature faces the biggest riskof hit-and-miss), a weak reception to MH4 (for 3DS) is the main near-term risk.
Jefferies does and seeks to do business with companies covered in its research reports. As a result, investors should be aware that Jefferies may have aconflict of interest that could affect the objectivity of this report. Investors should consider this report as only a single factor in making their investmentdecision. Please see analyst certifications, important disclosure information, and information regarding the status of non-US analysts on pages 18 to 21of this report.
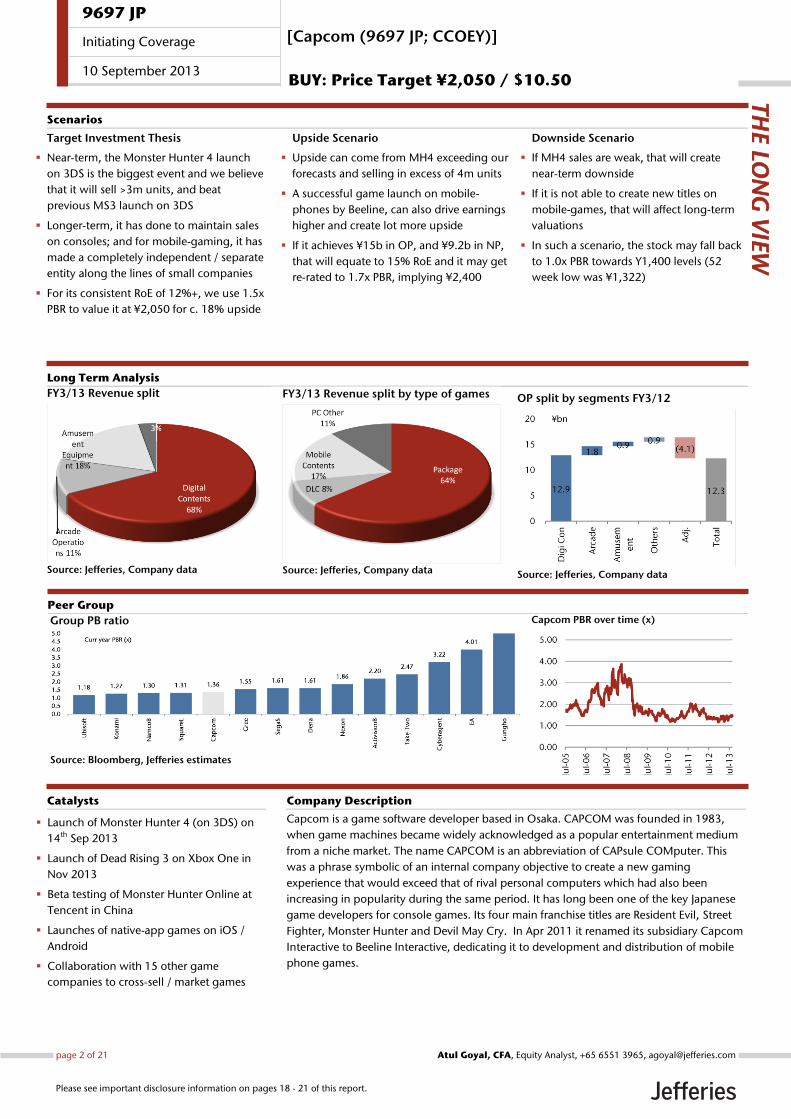
FY3/13 Revenue split
Source: Jefferies, Company data
Capcom is a game software developer based in Osaka. CAPCOM was founded in 1983,
when game machines became widely acknowledged as a popular entertainment medium
from a niche market. The name CAPCOM is an abbreviation of CAPsule COMputer. This
was a phrase symbolic of an internal company objective to create a new gaming
experience that would exceed that of rival personal computers which had also been
increasing in popularity during the same period. It has long been one of the key Japanese
game developers for console games. Its four main franchise titles are Resident Evil, Street
Fighter, Monster Hunter and Devil May Cry. In Apr 2011 it renamed its subsidiary Capcom
Interactive to Beeline Interactive, dedicating it to development and distribution of mobile
phone games.
Launch of Monster Hunter 4 (on 3DS) on
14th Sep 2013
Launch of Dead Rising 3 on Xbox One in
Nov 2013
Beta testing of Monster Hunter Online at
Tencent in China
Launches of native-app games on iOS /
Android
Collaboration with 15 other game
companies to cross-sell / market games
Catalysts
Target Investment Thesis
Near-term, the Monster Hunter 4 launch
on 3DS is the biggest event and we believe
that it will sell >3m units, and beat
previous MS3 launch on 3DS
Longer-term, it has done to maintain sales
on consoles; and for mobile-gaming, it has
made a completely independent / separate
entity along the lines of small companies
For its consistent RoE of 12%+, we use 1.5x
PBR to value it at ¥2,050 for c. 18% upside
Upside Scenario
Upside can come from MH4 exceeding our
forecasts and selling in excess of 4m units
A successful game launch on mobile-
phones by Beeline, can also drive earnings
higher and create lot more upside
If it achieves ¥15b in OP, and ¥9.2b in NP,
that will equate to 15% RoE and it may get
re-rated to 1.7x PBR, implying ¥2,400
Downside Scenario
If MH4 sales are weak, that will create
near-term downside
If it is not able to create new titles on
mobile-games, that will affect long-term
valuations
In such a scenario, the stock may fall back
to 1.0x PBR towards Y1,400 levels (52
week low was ¥1,322)
Long Term Analysis
Scenarios
Group PB ratio
Source: Bloomberg, Jefferies estimates
Capcom PBR over time (x)
Company Description
THE LO
NG
VIE
W
Peer Group
[Capcom (9697 JP; CCOEY)]
BUY: Price Target ¥2,050 / $10.50
OP split by segments FY3/12
Source: Jefferies, Company data
FY3/13 Revenue split by type of games
Source: Jefferies, Company data
9697 JP
Initiating Coverage
10 September 2013
page 2 of 21 , Equity Analyst, +65 6551 3965, [email protected] Goyal, CFA
Please see important disclosure information on pages 18 - 21 of this report.
Capcom The gaming space is changing rapidly. The Console gaming market, in its 8th
innings, is shrinking and consolidating. Capcom transitioned well from Gen 6
to Gen 7 and should do better than peers in this cycle as well. Near-term, the
Monster Hunter 4 launch (14th Sep on 3DS) should help sentiment/earnings
With 30% of market cap in cash, it is well positioned to acquire a mobile-
gaming company if it needs to. We initiate with a Buy and a price target of
¥2,050 (at 1.5x PBR for 12% RoE).
Industry at a crossroads, Capcom positioned well Technology has always been a change agent for this industry. Besides a new cycle (next-
gen consoles), in the last few years the industry has been revolutionized by the mobile-OS
app-store business model. That has led to (a) market expansion, (b) change in customer
needs, (c) resulting change in the business models. Game developers are repositioning
amidst these structural changes. Capcom did well in the previous cycle where its overall
sales for its 4 major franchises fell <10% (Konami’s fell by 70%). On the mobile-gaming
side, Capcom established a separate entity Beeline Interactive for smartphone games, in
Apr 2011. It was early to spot the changes and trends in both consoles and mobile-
gaming.
Console in 8th innings…consolidating The biggest challenge for game developers is that the installed base of next-gen consoles
(and handhelds) is set to be just about half of the previous one. As tie-ratio is falling, total
market size is shrinking. The top end of the market will consolidate like it did in previous
gen consoles as well. But with the help of 3 major franchises (Resident Evil, Street Fighter,
Monster Hunter), Capcom managed to sell nearly as many games as it sold in the
previous cycle (while Konami saw 70% decline, Square saw 35% decline). For this cycle
Capcom’s upside can come from its closer alliance with Sony (we expect Sony’s PS4 to
take a meaningful lead in the current console cycle).
Capcom is making a Beeline for Mobile games The Mobile Games market has experienced rapid growth. It is now bigger than the
handheld market (steady decline). Within that, Japan appears to be by far the biggest
market. Here, small cos (Super-Cell, Gungho etc.) are better positioned than the console-
era companies. Capcom has c20-25% of game-revenues from mobile-OS driven by its
100% subsidiary Beeline. Its Smurfs village has been a global hit. Capcom’s strong
balance-sheet gives it the flexibility it needs in world’s largest mobile-gaming market.
MH4 can surprise near-term In the near-term, Capcom is set to launch MH4 on 3DS on 14th Sep. Given the general
dearth of good games on 3DS, we believe MH4 could do exceptionally well in Japan and
it could sell well north of 3m units (co guiding 2m units for this year). MH3 sold 2.4m,
when the 3DS installed base was about 15m and now it is about 32m. While the company
is guiding for c.2m sales of MH4, analysis of previous hits suggests a surprise is in the
store.
Valuation and Risks Capcom trades at very attractive valuation (11x PER; 1.2x PBR). Given consistently healthy
RoE of c.12-15%, it would warrant a 2.0x PBR. However, last year’s RoE of <5% is a
dampener. We are using 1.5x PBR as target multiple with FY3/15 RoE estimate of 12%, for
a target price of ¥2,050.
Besides the market risk (Japan market risk) and the industry risk (game industry by its very
nature faces the biggest risk of hit-and-miss), a weak reception of MH4 (for 3DS) is the
main near-term risk.
Capcom was early to adopt multi-
plat for Gen 7 consoles; it was very
early to move into smartphone
games with Beeline (of Smurfs fame)
Console gaming market faces lower
installed base and lower tie-ratio,
while the competitors are allocating
large budgets for development /
marketing…
Mobile gaming has so far been
dominated by smaller players that
are far more nimble…but here the
Japan opportunity is huge
Longer-term Capcom still needs to
refine its strategy and we remain
cautious. However near-term, MH
offers positive surprise
At 11-12x it is one of the cheapest
game stocks…our target of Y2,050
implies 15% upside
9697 JP
Initiating Coverage
10 September 2013
page 3 of 21 , Equity Analyst, +65 6551 3965, [email protected] Goyal, CFA
Please see important disclosure information on pages 18 - 21 of this report.
Overall Business structure: Revenue and Profits
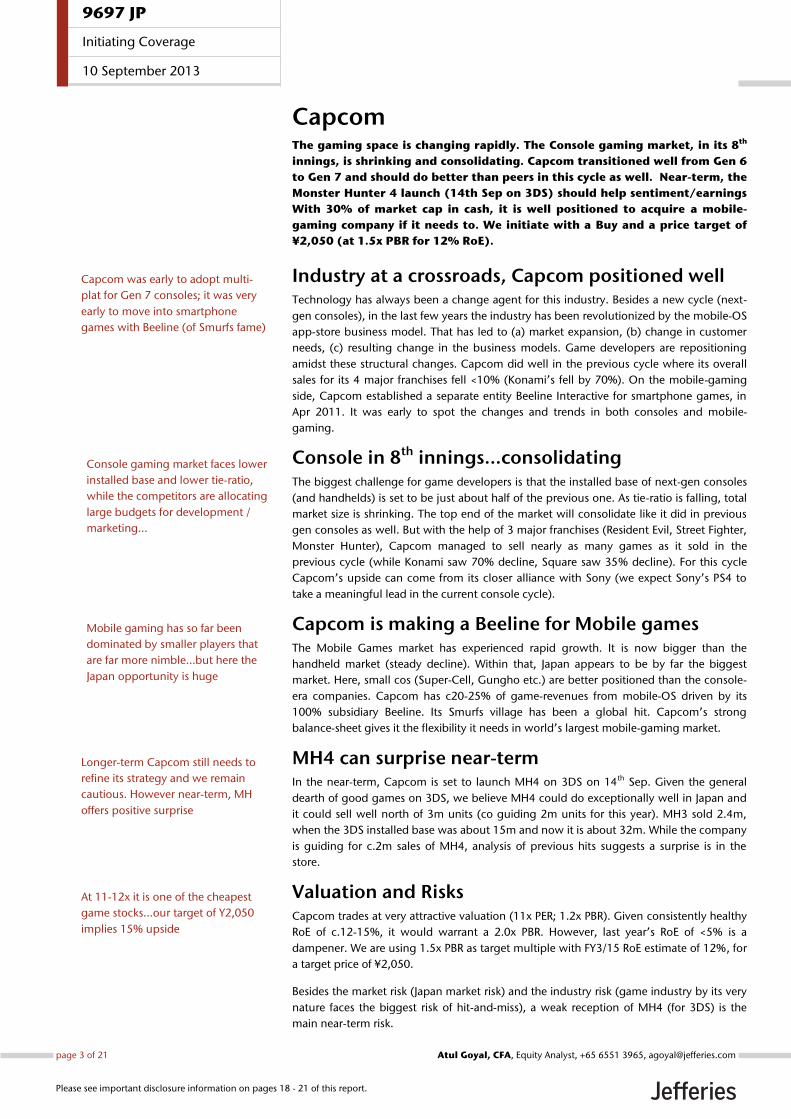
Exhibit 1: Revenue breakdown
Source: Jefferies, company data
.
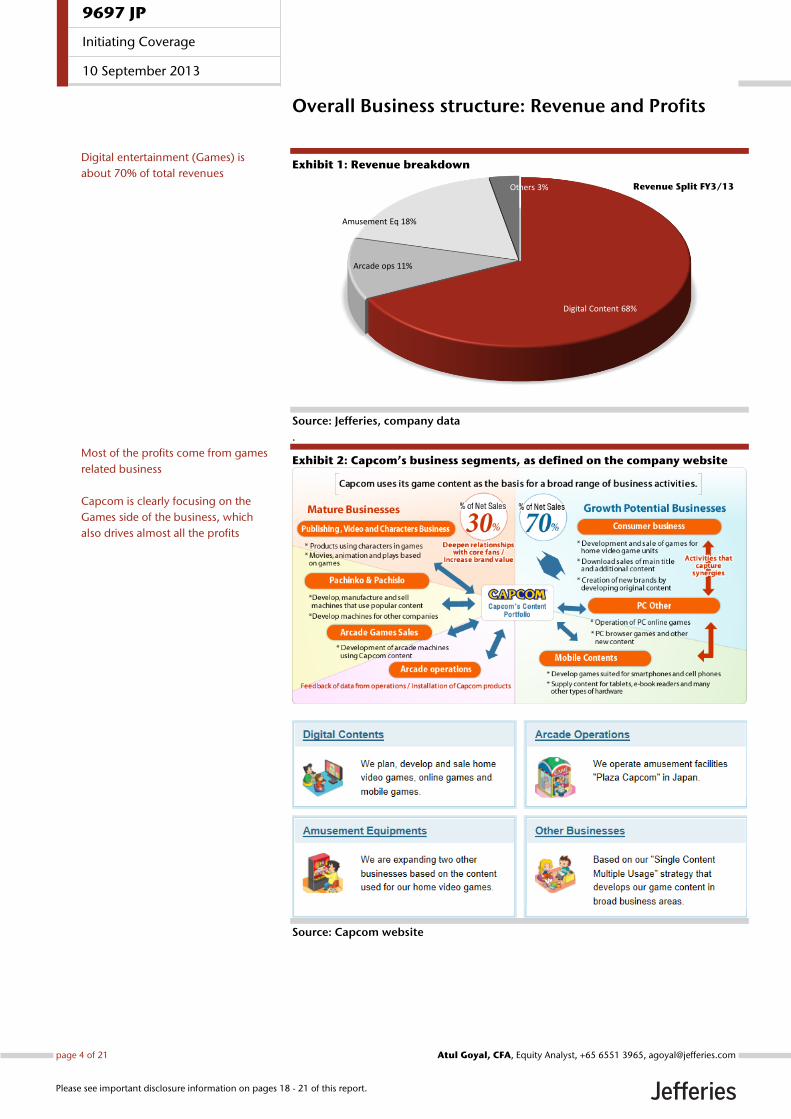
Exhibit 2: Capcom’s business segments, as defined on the company website
Source: Capcom website
Digital Content 68%
Arcade ops 11%
Amusement Eq 18%
Others 3% Revenue Split FY3/13
Digital entertainment (Games) is
about 70% of total revenues
Most of the profits come from games
related business
Capcom is clearly focusing on the
Games side of the business, which
also drives almost all the profits
9697 JP
Initiating Coverage
10 September 2013
page 4 of 21 , Equity Analyst, +65 6551 3965, [email protected] Goyal, CFA
Please see important disclosure information on pages 18 - 21 of this report.
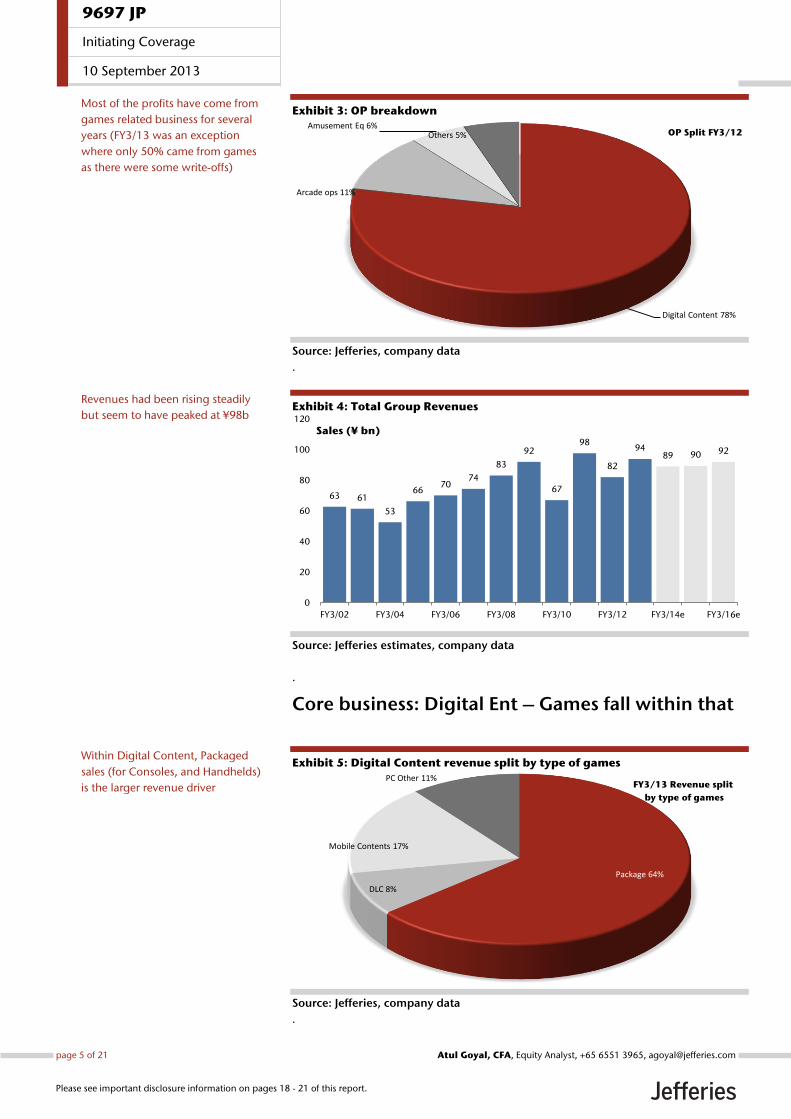
Exhibit 3: OP breakdown
Source: Jefferies, company data
.
Exhibit 4: Total Group Revenues
Source: Jefferies estimates, company data
.
Core business: Digital Ent – Games fall within that
Exhibit 5: Digital Content revenue split by type of games
Source: Jefferies, company data
.
Digital Content 78%
Arcade ops 11%
Amusement Eq 6%Others 5% OP Split FY3/12
63 61
53
6670
74
83
92
67
98
82
9489 90 92
0
20
40
60
80
100
120
FY3/02 FY3/04 FY3/06 FY3/08 FY3/10 FY3/12 FY3/14e FY3/16e
Sales (¥ bn)
Package 64%
DLC 8%
Mobile Contents 17%
PC Other 11%FY3/13 Revenue split
by type of games
Most of the profits have come from
games related business for several
years (FY3/13 was an exception
where only 50% came from games
as there were some write-offs)
Revenues had been rising steadily
but seem to have peaked at ¥98b
Within Digital Content, Packaged
sales (for Consoles, and Handhelds)
is the larger revenue driver
9697 JP
Initiating Coverage
10 September 2013
page 5 of 21 , Equity Analyst, +65 6551 3965, [email protected] Goyal, CFA
Please see important disclosure information on pages 18 - 21 of this report.
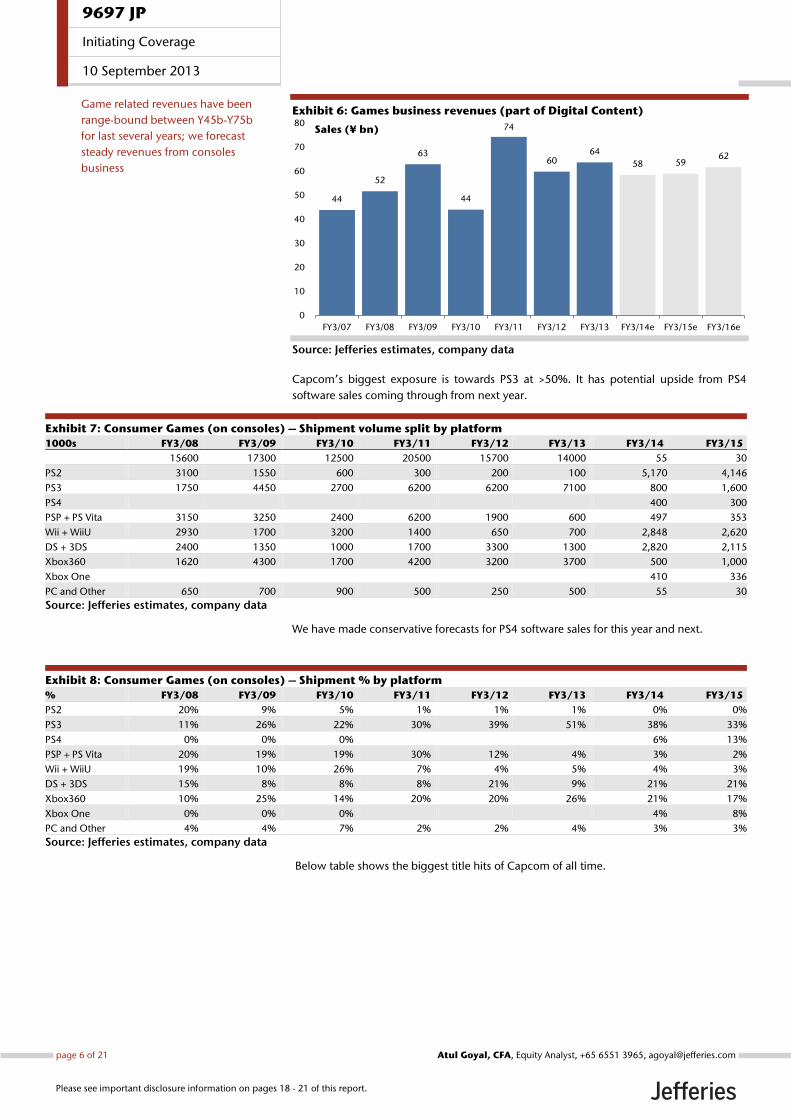
Exhibit 6: Games business revenues (part of Digital Content)
Source: Jefferies estimates, company data
Capcom’s biggest exposure is towards PS3 at >50%. It has potential upside from PS4
software sales coming through from next year.
Exhibit 7: Consumer Games (on consoles) – Shipment volume split by platform
1000s FY3/08 FY3/09 FY3/10 FY3/11 FY3/12 FY3/13 FY3/14 FY3/15
15600 17300 12500 20500 15700 14000 55 30
PS2 3100 1550 600 300 200 100 5,170 4,146
PS3 1750 4450 2700 6200 6200 7100 800 1,600
PS4 400 300
PSP + PS Vita 3150 3250 2400 6200 1900 600 497 353
Wii + WiiU 2930 1700 3200 1400 650 700 2,848 2,620
DS + 3DS 2400 1350 1000 1700 3300 1300 2,820 2,115
Xbox360 1620 4300 1700 4200 3200 3700 500 1,000
Xbox One 410 336
PC and Other 650 700 900 500 250 500 55 30
Source: Jefferies estimates, company data
We have made conservative forecasts for PS4 software sales for this year and next.
Exhibit 8: Consumer Games (on consoles) – Shipment % by platform
% FY3/08 FY3/09 FY3/10 FY3/11 FY3/12 FY3/13 FY3/14 FY3/15
PS2 20% 9% 5% 1% 1% 1% 0% 0%
PS3 11% 26% 22% 30% 39% 51% 38% 33%
PS4 0% 0% 0% 6% 13%
PSP + PS Vita 20% 19% 19% 30% 12% 4% 3% 2%
Wii + WiiU 19% 10% 26% 7% 4% 5% 4% 3%
DS + 3DS 15% 8% 8% 8% 21% 9% 21% 21%
Xbox360 10% 25% 14% 20% 20% 26% 21% 17%
Xbox One 0% 0% 0% 4% 8%
PC and Other 4% 4% 7% 2% 2% 4% 3% 3%
Source: Jefferies estimates, company data
Below table shows the biggest title hits of Capcom of all time.
44
52
63
44
74
6064
58 5962
0
10
20
30
40
50
60
70
80
FY3/07 FY3/08 FY3/09 FY3/10 FY3/11 FY3/12 FY3/13 FY3/14e FY3/15e FY3/16e
Sales (¥ bn)
Game related revenues have been
range-bound between Y45b-Y75b
for last several years; we forecast
steady revenues from consoles
business
9697 JP
Initiating Coverage
10 September 2013
page 6 of 21 , Equity Analyst, +65 6551 3965, [email protected] Goyal, CFA
Please see important disclosure information on pages 18 - 21 of this report.
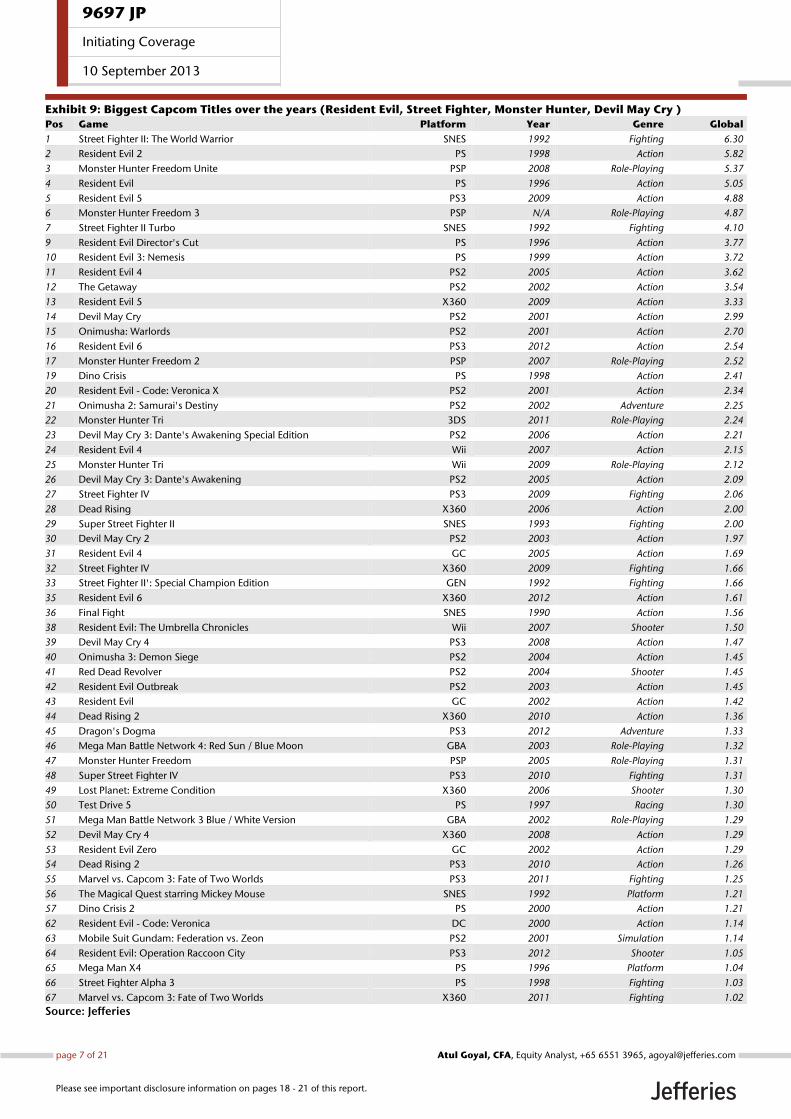
Exhibit 9: Biggest Capcom Titles over the years (Resident Evil, Street Fighter, Monster Hunter, Devil May Cry )
Pos Game Platform Year Genre Global
1 Street Fighter II: The World Warrior SNES 1992 Fighting 6.30
2 Resident Evil 2 PS 1998 Action 5.82
3 Monster Hunter Freedom Unite PSP 2008 Role-Playing 5.37
4 Resident Evil PS 1996 Action 5.05
5 Resident Evil 5 PS3 2009 Action 4.88
6 Monster Hunter Freedom 3 PSP N/A Role-Playing 4.87
7 Street Fighter II Turbo SNES 1992 Fighting 4.10
9 Resident Evil Director's Cut PS 1996 Action 3.77
10 Resident Evil 3: Nemesis PS 1999 Action 3.72
11 Resident Evil 4 PS2 2005 Action 3.62
12 The Getaway PS2 2002 Action 3.54
13 Resident Evil 5 X360 2009 Action 3.33
14 Devil May Cry PS2 2001 Action 2.99
15 Onimusha: Warlords PS2 2001 Action 2.70
16 Resident Evil 6 PS3 2012 Action 2.54
17 Monster Hunter Freedom 2 PSP 2007 Role-Playing 2.52
19 Dino Crisis PS 1998 Action 2.41
20 Resident Evil - Code: Veronica X PS2 2001 Action 2.34
21 Onimusha 2: Samurai's Destiny PS2 2002 Adventure 2.25
22 Monster Hunter Tri 3DS 2011 Role-Playing 2.24
23 Devil May Cry 3: Dante's Awakening Special Edition PS2 2006 Action 2.21
24 Resident Evil 4 Wii 2007 Action 2.15
25 Monster Hunter Tri Wii 2009 Role-Playing 2.12
26 Devil May Cry 3: Dante's Awakening PS2 2005 Action 2.09
27 Street Fighter IV PS3 2009 Fighting 2.06
28 Dead Rising X360 2006 Action 2.00
29 Super Street Fighter II SNES 1993 Fighting 2.00
30 Devil May Cry 2 PS2 2003 Action 1.97
31 Resident Evil 4 GC 2005 Action 1.69
32 Street Fighter IV X360 2009 Fighting 1.66
33 Street Fighter II': Special Champion Edition GEN 1992 Fighting 1.66
35 Resident Evil 6 X360 2012 Action 1.61
36 Final Fight SNES 1990 Action 1.56
38 Resident Evil: The Umbrella Chronicles Wii 2007 Shooter 1.50
39 Devil May Cry 4 PS3 2008 Action 1.47
40 Onimusha 3: Demon Siege PS2 2004 Action 1.45
41 Red Dead Revolver PS2 2004 Shooter 1.45
42 Resident Evil Outbreak PS2 2003 Action 1.45
43 Resident Evil GC 2002 Action 1.42
44 Dead Rising 2 X360 2010 Action 1.36
45 Dragon's Dogma PS3 2012 Adventure 1.33
46 Mega Man Battle Network 4: Red Sun / Blue Moon GBA 2003 Role-Playing 1.32
47 Monster Hunter Freedom PSP 2005 Role-Playing 1.31
48 Super Street Fighter IV PS3 2010 Fighting 1.31
49 Lost Planet: Extreme Condition X360 2006 Shooter 1.30
50 Test Drive 5 PS 1997 Racing 1.30
51 Mega Man Battle Network 3 Blue / White Version GBA 2002 Role-Playing 1.29
52 Devil May Cry 4 X360 2008 Action 1.29
53 Resident Evil Zero GC 2002 Action 1.29
54 Dead Rising 2 PS3 2010 Action 1.26
55 Marvel vs. Capcom 3: Fate of Two Worlds PS3 2011 Fighting 1.25
56 The Magical Quest starring Mickey Mouse SNES 1992 Platform 1.21
57 Dino Crisis 2 PS 2000 Action 1.21
62 Resident Evil - Code: Veronica DC 2000 Action 1.14
63 Mobile Suit Gundam: Federation vs. Zeon PS2 2001 Simulation 1.14
64 Resident Evil: Operation Raccoon City PS3 2012 Shooter 1.05
65 Mega Man X4 PS 1996 Platform 1.04
66 Street Fighter Alpha 3 PS 1998 Fighting 1.03
67 Marvel vs. Capcom 3: Fate of Two Worlds X360 2011 Fighting 1.02
Source: Jefferies
9697 JP
Initiating Coverage
10 September 2013
page 7 of 21 , Equity Analyst, +65 6551 3965, [email protected] Goyal, CFA
Please see important disclosure information on pages 18 - 21 of this report.
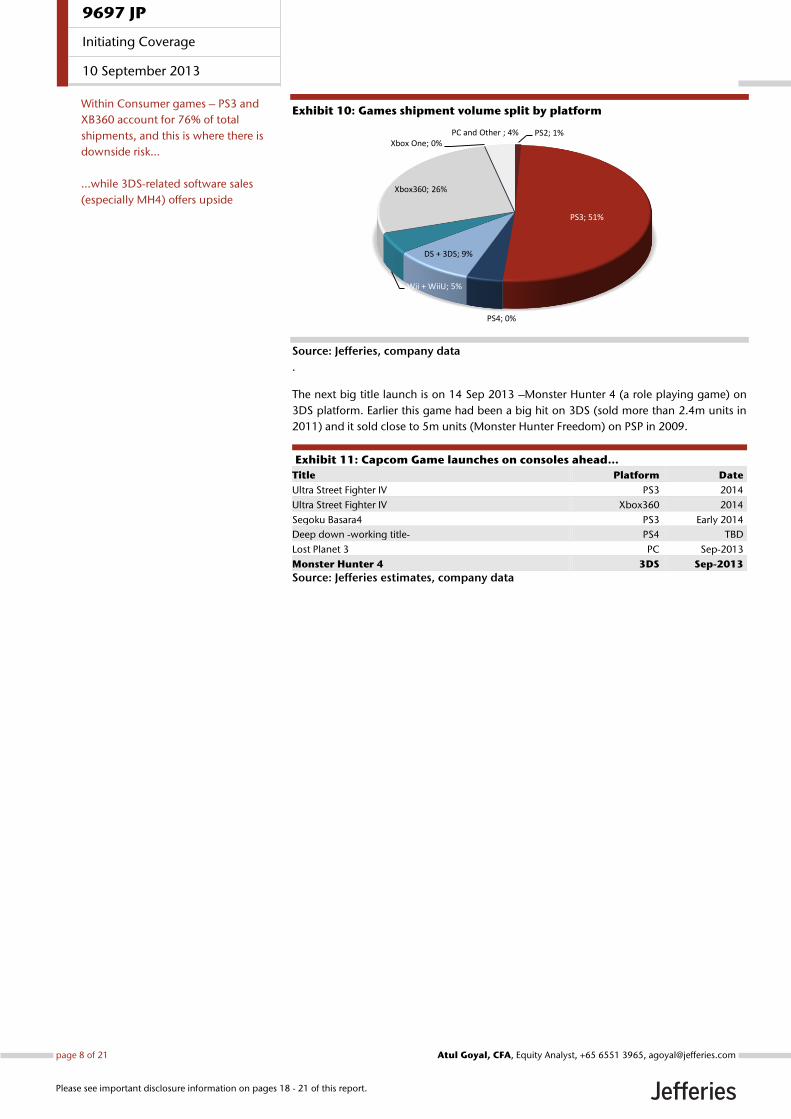
Exhibit 10: Games shipment volume split by platform
Source: Jefferies, company data
.
The next big title launch is on 14 Sep 2013 –Monster Hunter 4 (a role playing game) on
3DS platform. Earlier this game had been a big hit on 3DS (sold more than 2.4m units in
2011) and it sold close to 5m units (Monster Hunter Freedom) on PSP in 2009.
Exhibit 11: Capcom Game launches on consoles ahead…
Title Platform Date
Ultra Street Fighter IV PS3 2014
Ultra Street Fighter IV Xbox360 2014
Segoku Basara4 PS3 Early 2014
Deep down -working title- PS4 TBD
Lost Planet 3 PC Sep-2013
Monster Hunter 4 3DS Sep-2013
Source: Jefferies estimates, company data
PS2; 1%
PS3; 51%
PS4; 0%PSP + PS Vita; 4%
DS + 3DS; 9%
Wii + WiiU; 5%
Xbox360; 26%
Xbox One; 0%PC and Other ; 4%
Within Consumer games – PS3 and
XB360 account for 76% of total
shipments, and this is where there is
downside risk…
…while 3DS-related software sales
(especially MH4) offers upside
9697 JP
Initiating Coverage
10 September 2013
page 8 of 21 , Equity Analyst, +65 6551 3965, [email protected] Goyal, CFA
Please see important disclosure information on pages 18 - 21 of this report.
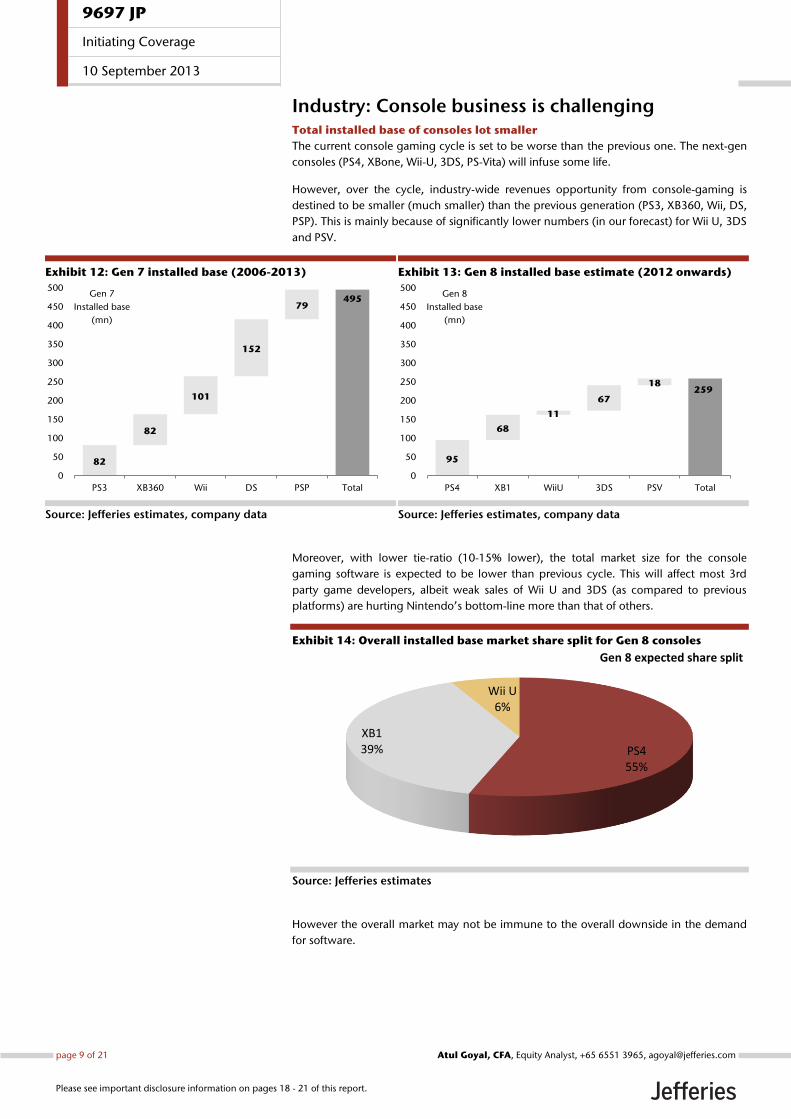
Industry: Console business is challenging Total installed base of consoles lot smaller
The current console gaming cycle is set to be worse than the previous one. The next-gen
consoles (PS4, XBone, Wii-U, 3DS, PS-Vita) will infuse some life.
However, over the cycle, industry-wide revenues opportunity from console-gaming is
destined to be smaller (much smaller) than the previous generation (PS3, XB360, Wii, DS,
PSP). This is mainly because of significantly lower numbers (in our forecast) for Wii U, 3DS
and PSV.
Exhibit 12: Gen 7 installed base (2006-2013)
Source: Jefferies estimates, company data
Exhibit 13: Gen 8 installed base estimate (2012 onwards)
Source: Jefferies estimates, company data
Moreover, with lower tie-ratio (10-15% lower), the total market size for the console
gaming software is expected to be lower than previous cycle. This will affect most 3rd
party game developers, albeit weak sales of Wii U and 3DS (as compared to previous
platforms) are hurting Nintendo’s bottom-line more than that of others.
Exhibit 14: Overall installed base market share split for Gen 8 consoles
Source: Jefferies estimates
However the overall market may not be immune to the overall downside in the demand
for software.
82
82
101
152
79495
0
50
100
150
200
250
300
350
400
450
500
PS3 XB360 Wii DS PSP Total
Gen 7
Installed base
(mn)
95
68
11
67
18259
0
50
100
150
200
250
300
350
400
450
500
PS4 XB1 WiiU 3DS PSV Total
Gen 8
Installed base
(mn)
PS455%
XB139%
Wii U6%
Gen 8 expected share split
9697 JP
Initiating Coverage
10 September 2013
page 9 of 21 , Equity Analyst, +65 6551 3965, [email protected] Goyal, CFA
Please see important disclosure information on pages 18 - 21 of this report.
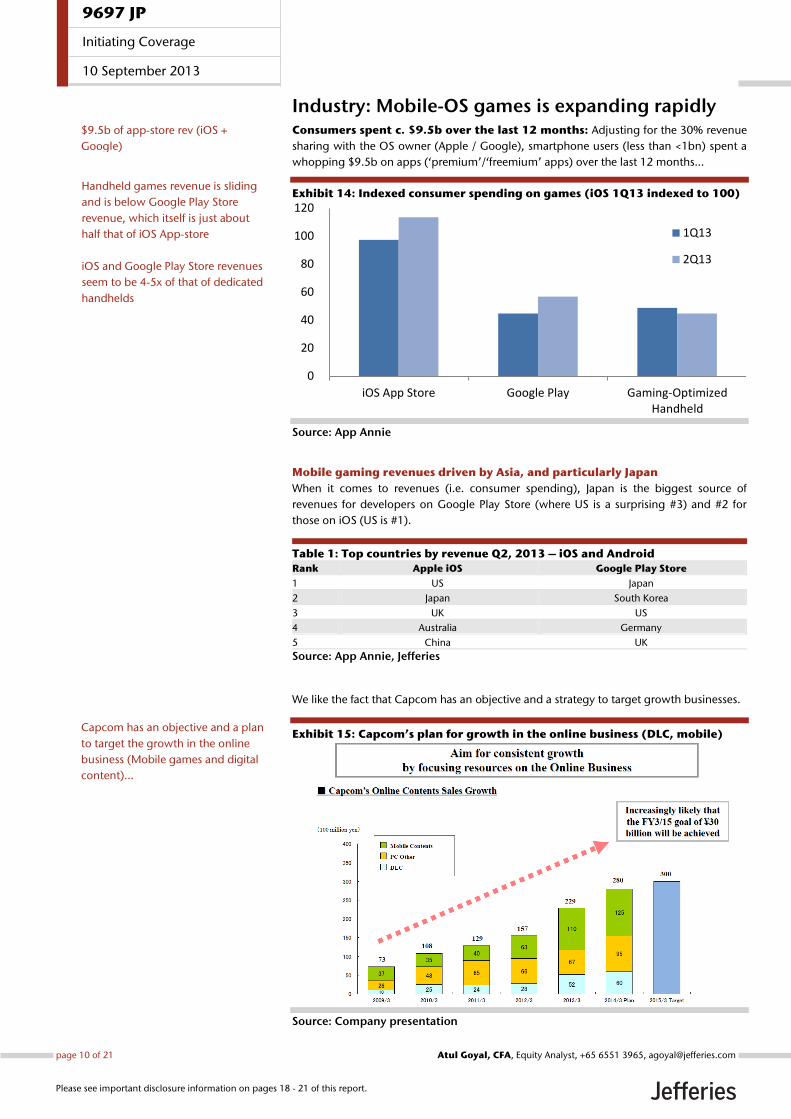
Industry: Mobile-OS games is expanding rapidly Consumers spent c. $9.5b over the last 12 months: Adjusting for the 30% revenue
sharing with the OS owner (Apple / Google), smartphone users (less than <1bn) spent a
whopping $9.5b on apps (‘premium’/‘freemium’ apps) over the last 12 months…
Exhibit 14: Indexed consumer spending on games (iOS 1Q13 indexed to 100)
Source: App Annie
Mobile gaming revenues driven by Asia, and particularly Japan
When it comes to revenues (i.e. consumer spending), Japan is the biggest source of
revenues for developers on Google Play Store (where US is a surprising #3) and #2 for
those on iOS (US is #1).
Table 1: Top countries by revenue Q2, 2013 – iOS and Android
Rank Apple iOS Google Play Store
1 US Japan
2 Japan South Korea
3 UK US
4 Australia Germany
5 China UK
Source: App Annie, Jefferies
We like the fact that Capcom has an objective and a strategy to target growth businesses.
Exhibit 15: Capcom’s plan for growth in the online business (DLC, mobile)
Source: Company presentation
0
20
40
60
80
100
120
iOS App Store Google Play Gaming-OptimizedHandheld
1Q13
2Q13
$9.5b of app-store rev (iOS +
Google)
Handheld games revenue is sliding
and is below Google Play Store
revenue, which itself is just about
half that of iOS App-store
iOS and Google Play Store revenues
seem to be 4-5x of that of dedicated
handhelds
Capcom has an objective and a plan
to target the growth in the online
business (Mobile games and digital
content)…
9697 JP
Initiating Coverage
10 September 2013
page 10 of 21 , Equity Analyst, +65 6551 3965, [email protected] Goyal, CFA
Please see important disclosure information on pages 18 - 21 of this report.
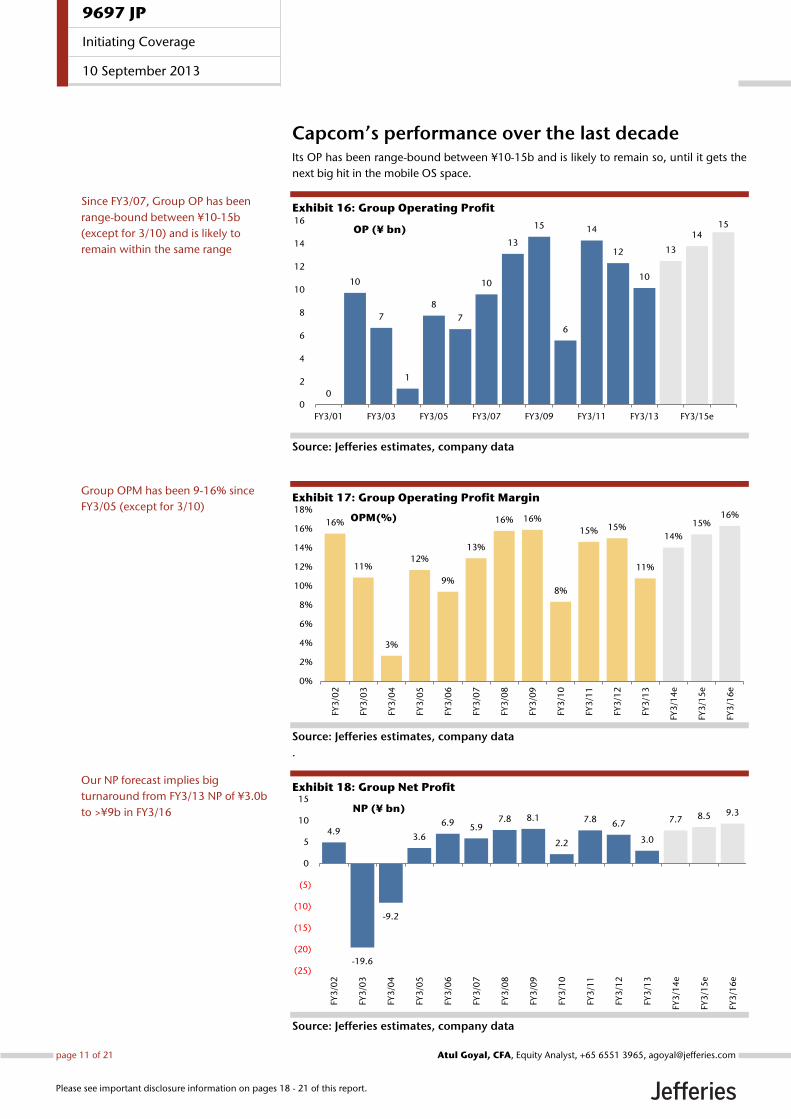
Capcom’s performance over the last decade Its OP has been range-bound between ¥10-15b and is likely to remain so, until it gets the
next big hit in the mobile OS space.
Exhibit 16: Group Operating Profit
Source: Jefferies estimates, company data
Exhibit 17: Group Operating Profit Margin
Source: Jefferies estimates, company data
.
Exhibit 18: Group Net Profit
Source: Jefferies estimates, company data
0
10
7
1
8
7
10
13
15
6
14
12
10
13
1415
0
2
4
6
8
10
12
14
16
FY3/01 FY3/03 FY3/05 FY3/07 FY3/09 FY3/11 FY3/13 FY3/15e
OP (¥ bn)
16%
11%
3%
12%
9%
13%
16% 16%
8%
15% 15%
11%
14%
15%16%
0%
2%
4%
6%
8%
10%
12%
14%
16%
18%
FY3
/02
FY3
/03
FY3
/04
FY3
/05
FY3
/06
FY3
/07
FY3
/08
FY3
/09
FY3
/10
FY3
/11
FY3
/12
FY3
/13
FY3
/14
e
FY3
/15
e
FY3
/16
e
OPM(%)
4.9
-19.6
-9.2
3.6
6.95.9
7.8 8.1
2.2
7.8 6.7
3.0
7.7 8.5 9.3
(25)
(20)
(15)
(10)
(5)
0
5
10
15
FY3
/02
FY3
/03
FY3
/04
FY3
/05
FY3
/06
FY3
/07
FY3
/08
FY3
/09
FY3
/10
FY3
/11
FY3
/12
FY3
/13
FY3
/14
e
FY3
/15
e
FY3
/16
e
NP (¥ bn)
Since FY3/07, Group OP has been
range-bound between ¥10-15b
(except for 3/10) and is likely to
remain within the same range
Group OPM has been 9-16% since
FY3/05 (except for 3/10)
Our NP forecast implies big
turnaround from FY3/13 NP of ¥3.0b
to >¥9b in FY3/16
9697 JP
Initiating Coverage
10 September 2013
page 11 of 21 , Equity Analyst, +65 6551 3965, [email protected] Goyal, CFA
Please see important disclosure information on pages 18 - 21 of this report.

.
Exhibit 19: Group Net Profit Margin
Source: Jefferies estimates, company data
.
Exhibit 20: Group RoE
Source: Jefferies estimates, company data
.
Exhibit 21: Group RoA
Source: Jefferies estimates, company data
.
7.8%
-31.9%
-17.4%
5.5%
9.9%7.9%
9.4% 8.8%
3.2%
7.9% 8.2%
3.2%
8.7% 9.5% 10.1%
-35%
-30%
-25%
-20%
-15%
-10%
-5%
0%
5%
10%
15%
FY3
/02
FY3
/03
FY3
/04
FY3
/05
FY3
/06
FY3
/07
FY3
/08
FY3
/09
FY3
/10
FY3
/11
FY3
/12
FY3
/13
FY3
/14
e
FY3
/15
e
FY3
/16
e
NPM(%)
14.4
-35.2
-24.5
11.3
19.3
13.815.8 14.3
3.8
13.811.5
4.9
11.5 11.4 11.1
(40)
(30)
(20)
(10)
0
10
20
30
FY3
/02
FY3
/03
FY3
/04
FY3
/05
FY3
/06
FY3
/07
FY3
/08
FY3
/09
FY3
/10
FY3
/11
FY3
/12
FY3
/13
FY3
/14
e
FY3
/15
e
FY3
/16
e
ROE %
5.7
-20.9
-9.9
3.9
7.56.3
8.5 8.8
2.3
8.57.3
3.2
8.3 9.1 10.0
(25)
(20)
(15)
(10)
(5)
0
5
10
15
FY3
/02
FY3
/03
FY3
/04
FY3
/05
FY3
/06
FY3
/07
FY3
/08
FY3
/09
FY3
/10
FY3
/11
FY3
/12
FY3
/13
FY3
/14
e
FY3
/15
e
FY3
/16
eROA %
RoE has stayed well above 10%
barring a few exceptional years and
is likely to remain so
9697 JP
Initiating Coverage
10 September 2013
page 12 of 21 , Equity Analyst, +65 6551 3965, [email protected] Goyal, CFA
Please see important disclosure information on pages 18 - 21 of this report.
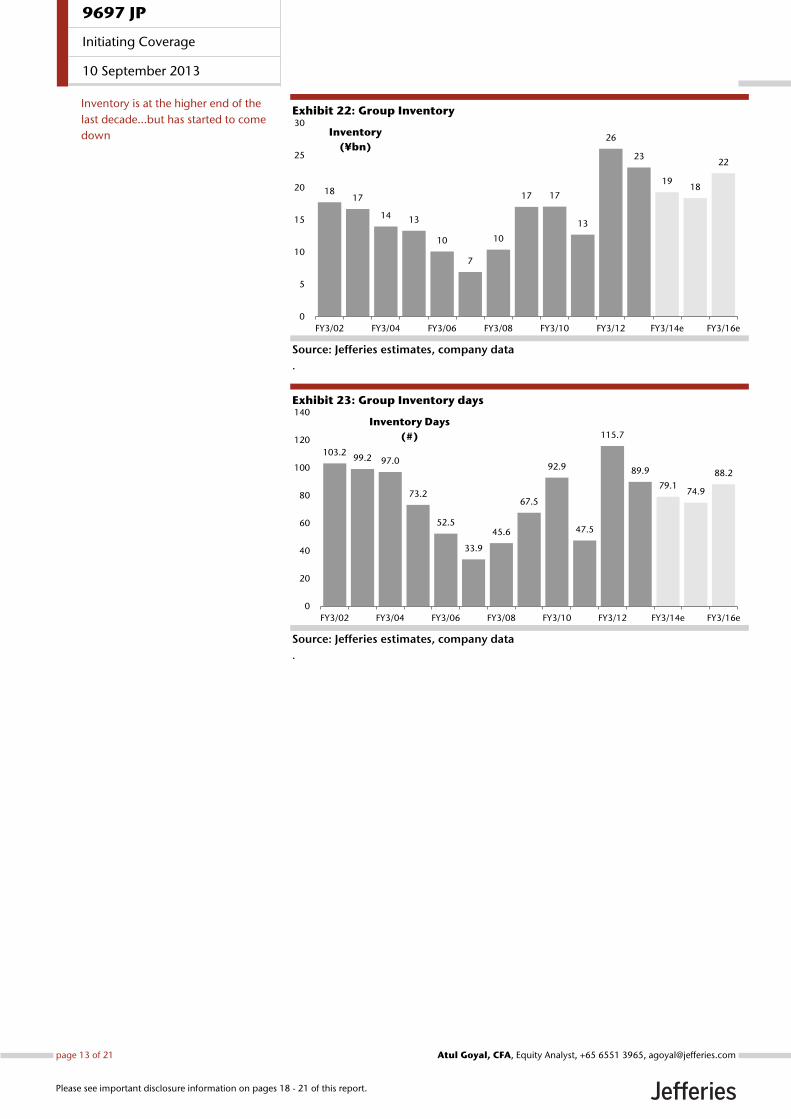
Exhibit 22: Group Inventory
Source: Jefferies estimates, company data
.
Exhibit 23: Group Inventory days
Source: Jefferies estimates, company data
.
18 17
14 13
10
7
10
17 17
13
26
23
19 18
22
0
5
10
15
20
25
30
FY3/02 FY3/04 FY3/06 FY3/08 FY3/10 FY3/12 FY3/14e FY3/16e
Inventory
(¥bn)
103.299.2 97.0
73.2
52.5
33.9
45.6
67.5
92.9
47.5
115.7
89.9
79.174.9
88.2
0
20
40
60
80
100
120
140
FY3/02 FY3/04 FY3/06 FY3/08 FY3/10 FY3/12 FY3/14e FY3/16e
Inventory Days
(#)
Inventory is at the higher end of the
last decade…but has started to come
down
9697 JP
Initiating Coverage
10 September 2013
page 13 of 21 , Equity Analyst, +65 6551 3965, [email protected] Goyal, CFA
Please see important disclosure information on pages 18 - 21 of this report.
Valuations: Look attractive
Exhibit 24: Consensus estimates
Actual Consensus Jefferies
FY3/13 FY3/14 FY3/15 FY3/14 FY3/15
Sales (¥ bn) 94,006 97,569 100,867 89,500 89,895
OP (¥ bn) 10,151 12,451 14,251 12,500 13,800
NP (¥ bn) 2,973 7,488 8,718 7,700 8,500
EPS (¥) 52 127 147 137 151
PER (x) 13 12 12.4 11.2
BVPS (¥) 1,084 1,175 1,287 1,255 1,406
ROE (%) 4 11.5 11.9 11.5 11.4
PBR (x) 1.44 1.32 1.36 1.21
Source: Jefferies estimates, company data, Bloomberg
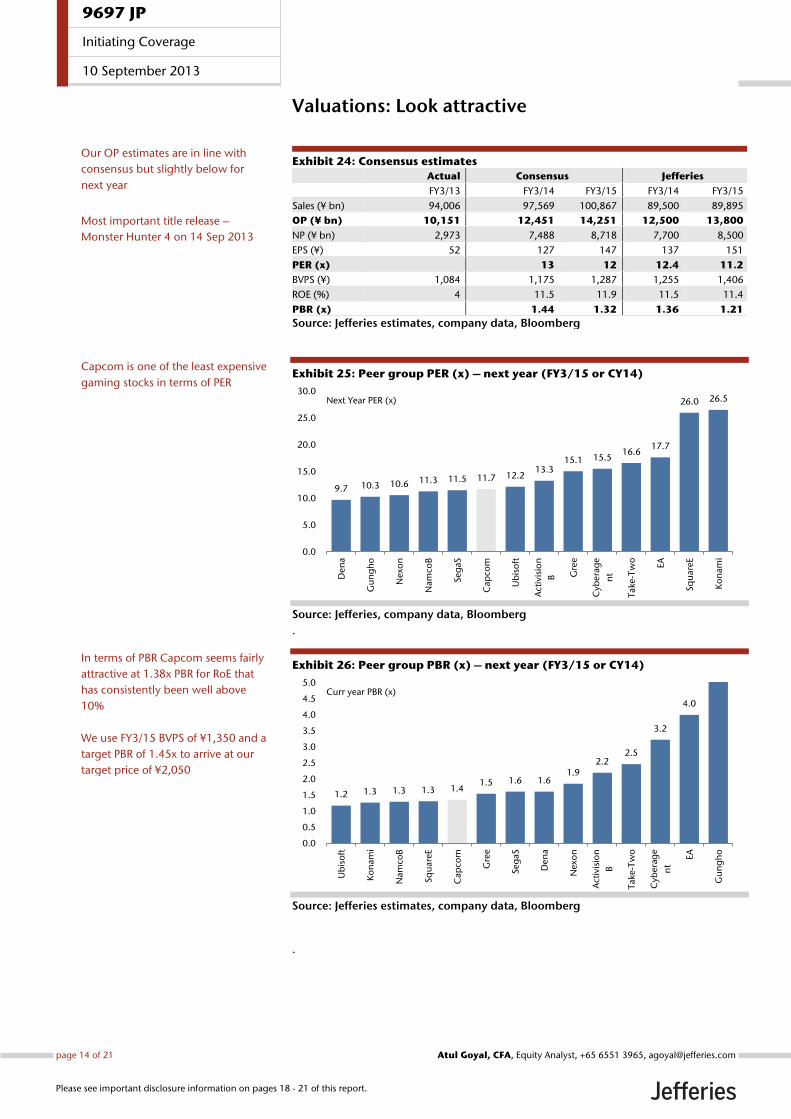
Exhibit 25: Peer group PER (x) – next year (FY3/15 or CY14)
Source: Jefferies, company data, Bloomberg
.
Exhibit 26: Peer group PBR (x) – next year (FY3/15 or CY14)
Source: Jefferies estimates, company data, Bloomberg
.
9.7 10.3 10.6 11.3 11.5 11.7 12.213.3
15.1 15.516.6
17.7
26.0 26.5
0.0
5.0
10.0
15.0
20.0
25.0
30.0
Den
a
Gu
ng
ho
Nex
on
Nam
coB
Seg
aS
Cap
com
Ub
iso
ft
Act
ivis
ion
B Gre
e
Cyb
era
ge
nt
Take
-Tw
o
EA
Sq
uare
E
Ko
nam
i
Next Year PER (x)
1.2 1.3 1.3 1.3 1.41.5 1.6 1.6
1.92.2
2.5
3.2
4.0
0.0
0.5
1.0
1.5
2.0
2.5
3.0
3.5
4.0
4.5
5.0
Ub
iso
ft
Ko
nam
i
Nam
coB
Sq
uare
E
Cap
com
Gre
e
Seg
aS
Den
a
Nex
on
Act
ivis
ion
B
Take
-Tw
o
Cyb
era
ge
nt
EA
Gu
ng
ho
Curr year PBR (x)
Capcom is one of the least expensive
gaming stocks in terms of PER
Our OP estimates are in line with
consensus but slightly below for
next year
Most important title release –
Monster Hunter 4 on 14 Sep 2013
In terms of PBR Capcom seems fairly
attractive at 1.38x PBR for RoE that
has consistently been well above
10%
We use FY3/15 BVPS of ¥1,350 and a
target PBR of 1.45x to arrive at our
target price of ¥2,050
9697 JP
Initiating Coverage
10 September 2013
page 14 of 21 , Equity Analyst, +65 6551 3965, [email protected] Goyal, CFA
Please see important disclosure information on pages 18 - 21 of this report.
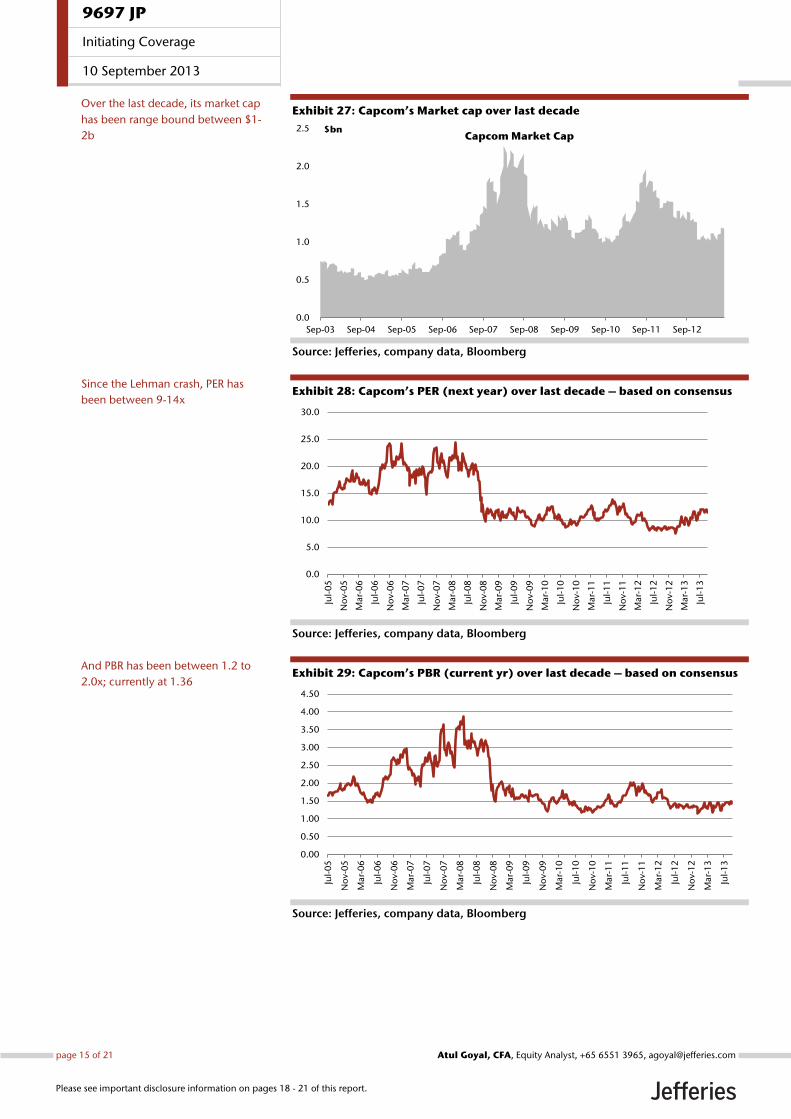
Exhibit 27: Capcom’s Market cap over last decade
Source: Jefferies, company data, Bloomberg
Exhibit 28: Capcom’s PER (next year) over last decade – based on consensus
Source: Jefferies, company data, Bloomberg
Exhibit 29: Capcom’s PBR (current yr) over last decade – based on consensus
Source: Jefferies, company data, Bloomberg
0.0
0.5
1.0
1.5
2.0
2.5
Sep-03 Sep-04 Sep-05 Sep-06 Sep-07 Sep-08 Sep-09 Sep-10 Sep-11 Sep-12
$bnCapcom Market Cap
0.0
5.0
10.0
15.0
20.0
25.0
30.0
Jul-
05
No
v-0
5
Mar-
06
Jul-
06
No
v-0
6
Mar-
07
Jul-
07
No
v-0
7
Mar-
08
Jul-
08
No
v-0
8
Mar-
09
Jul-
09
No
v-0
9
Mar-
10
Jul-
10
No
v-1
0
Mar-
11
Jul-
11
No
v-1
1
Mar-
12
Jul-
12
No
v-1
2
Mar-
13
Jul-
13
0.00
0.50
1.00
1.50
2.00
2.50
3.00
3.50
4.00
4.50
Jul-
05
No
v-0
5
Mar-
06
Jul-
06
No
v-0
6
Mar-
07
Jul-
07
No
v-0
7
Mar-
08
Jul-
08
No
v-0
8
Mar-
09
Jul-
09
No
v-0
9
Mar-
10
Jul-
10
No
v-1
0
Mar-
11
Jul-
11
No
v-1
1
Mar-
12
Jul-
12
No
v-1
2
Mar-
13
Jul-
13
Over the last decade, its market cap
has been range bound between $1-
2b
Since the Lehman crash, PER has
been between 9-14x
And PBR has been between 1.2 to
2.0x; currently at 1.36
9697 JP
Initiating Coverage
10 September 2013
page 15 of 21 , Equity Analyst, +65 6551 3965, [email protected] Goyal, CFA
Please see important disclosure information on pages 18 - 21 of this report.
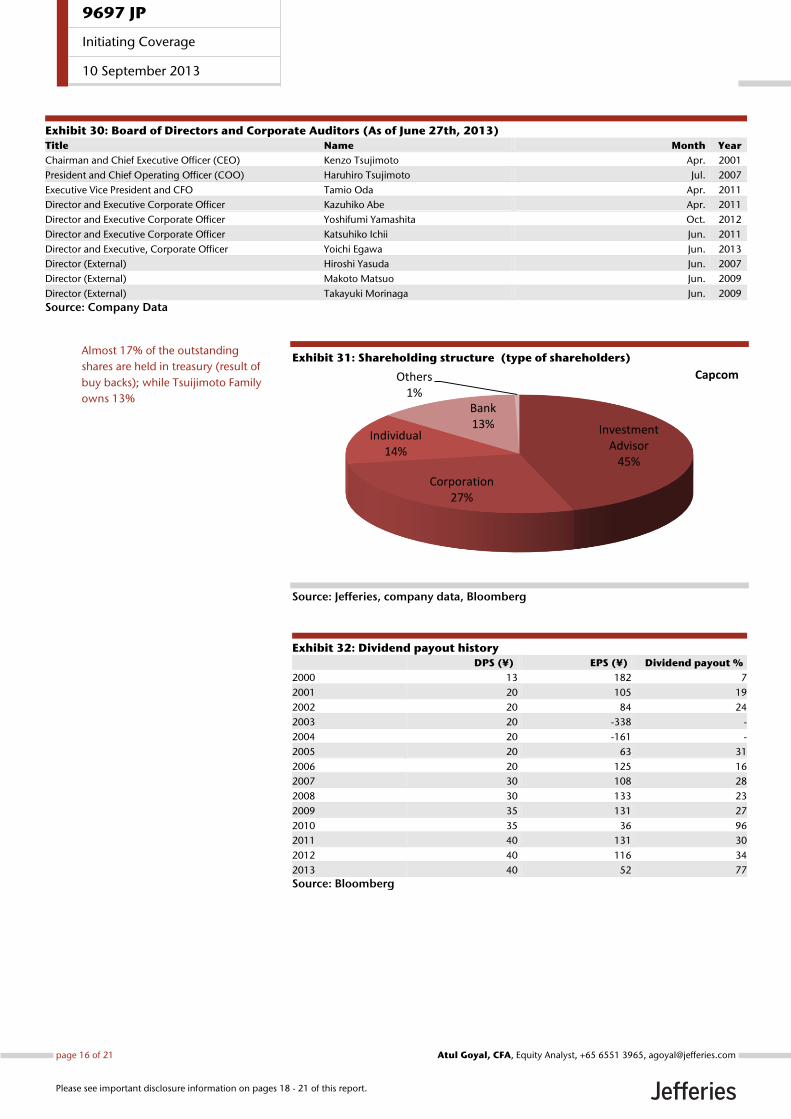
Exhibit 30: Board of Directors and Corporate Auditors (As of June 27th, 2013)
Title Name Month Year
Chairman and Chief Executive Officer (CEO) Kenzo Tsujimoto Apr. 2001
President and Chief Operating Officer (COO) Haruhiro Tsujimoto Jul. 2007
Executive Vice President and CFO Tamio Oda Apr. 2011
Director and Executive Corporate Officer Kazuhiko Abe Apr. 2011
Director and Executive Corporate Officer Yoshifumi Yamashita Oct. 2012
Director and Executive Corporate Officer Katsuhiko Ichii Jun. 2011
Director and Executive, Corporate Officer Yoichi Egawa Jun. 2013
Director (External) Hiroshi Yasuda Jun. 2007
Director (External) Makoto Matsuo Jun. 2009
Director (External) Takayuki Morinaga Jun. 2009
Source: Company Data
Exhibit 31: Shareholding structure (type of shareholders)
Source: Jefferies, company data, Bloomberg
Exhibit 32: Dividend payout history
DPS (¥) EPS (¥) Dividend payout %
2000 13 182 7
2001 20 105 19
2002 20 84 24
2003 20 -338 -
2004 20 -161 -
2005 20 63 31
2006 20 125 16
2007 30 108 28
2008 30 133 23
2009 35 131 27
2010 35 36 96
2011 40 131 30
2012 40 116 34
2013 40 52 77
Source: Bloomberg
Investment Advisor
45%
Corporation27%
Individual14%
Bank13%
Others1%
Capcom
Almost 17% of the outstanding
shares are held in treasury (result of
buy backs); while Tsuijimoto Family
owns 13%
9697 JP
Initiating Coverage
10 September 2013
page 16 of 21 , Equity Analyst, +65 6551 3965, [email protected] Goyal, CFA
Please see important disclosure information on pages 18 - 21 of this report.
Appendix: P&L and Balance Sheet statements
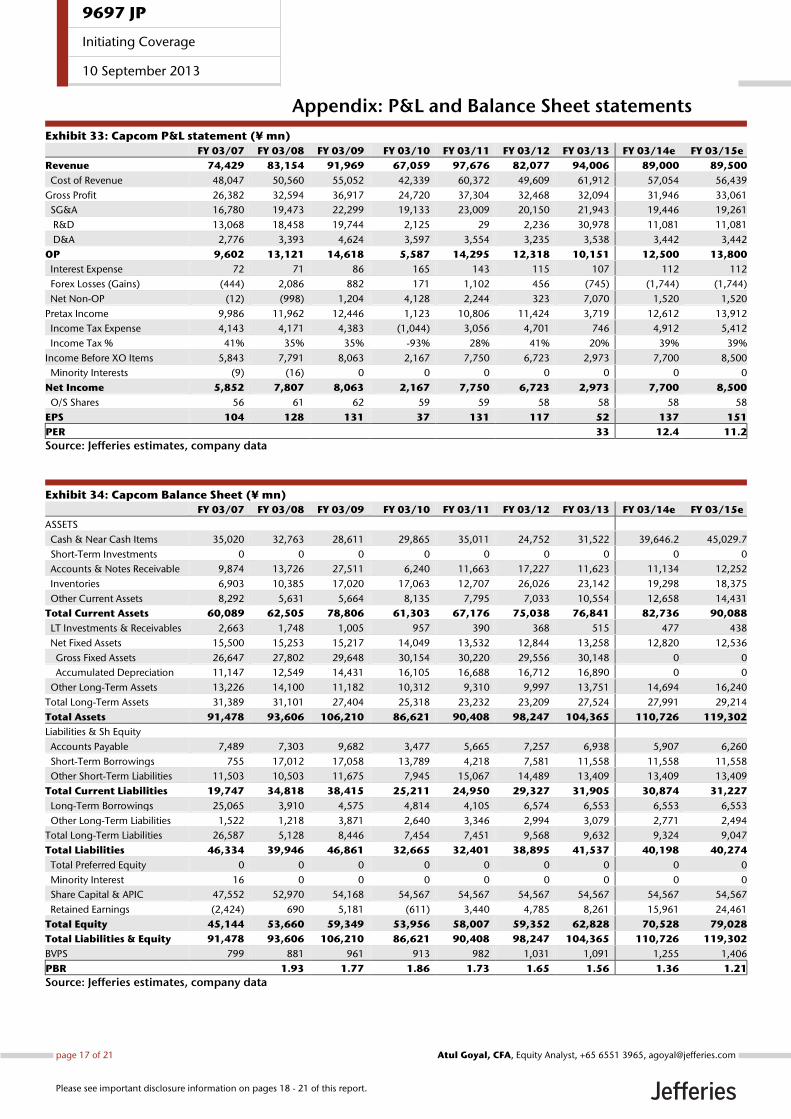
Exhibit 33: Capcom P&L statement (¥ mn)
FY 03/07 FY 03/08 FY 03/09 FY 03/10 FY 03/11 FY 03/12 FY 03/13 FY 03/14e FY 03/15e
Revenue 74,429 83,154 91,969 67,059 97,676 82,077 94,006 89,000 89,500
Cost of Revenue 48,047 50,560 55,052 42,339 60,372 49,609 61,912 57,054 56,439
Gross Profit 26,382 32,594 36,917 24,720 37,304 32,468 32,094 31,946 33,061
SG&A 16,780 19,473 22,299 19,133 23,009 20,150 21,943 19,446 19,261
R&D 13,068 18,458 19,744 2,125 29 2,236 30,978 11,081 11,081
D&A 2,776 3,393 4,624 3,597 3,554 3,235 3,538 3,442 3,442
OP 9,602 13,121 14,618 5,587 14,295 12,318 10,151 12,500 13,800
Interest Expense 72 71 86 165 143 115 107 112 112
Forex Losses (Gains) (444) 2,086 882 171 1,102 456 (745) (1,744) (1,744)
Net Non-OP (12) (998) 1,204 4,128 2,244 323 7,070 1,520 1,520
Pretax Income 9,986 11,962 12,446 1,123 10,806 11,424 3,719 12,612 13,912
Income Tax Expense 4,143 4,171 4,383 (1,044) 3,056 4,701 746 4,912 5,412
Income Tax % 41% 35% 35% -93% 28% 41% 20% 39% 39%
Income Before XO Items 5,843 7,791 8,063 2,167 7,750 6,723 2,973 7,700 8,500
Minority Interests (9) (16) 0 0 0 0 0 0 0
Net Income 5,852 7,807 8,063 2,167 7,750 6,723 2,973 7,700 8,500
O/S Shares 56 61 62 59 59 58 58 58 58
EPS 104 128 131 37 131 117 52 137 151
PER 33 12.4 11.2
Source: Jefferies estimates, company data
Exhibit 34: Capcom Balance Sheet (¥ mn)
FY 03/07 FY 03/08 FY 03/09 FY 03/10 FY 03/11 FY 03/12 FY 03/13 FY 03/14e FY 03/15e
ASSETS
Cash & Near Cash Items 35,020 32,763 28,611 29,865 35,011 24,752 31,522 39,646.2 45,029.7
Short-Term Investments 0 0 0 0 0 0 0 0 0
Accounts & Notes Receivable 9,874 13,726 27,511 6,240 11,663 17,227 11,623 11,134 12,252
Inventories 6,903 10,385 17,020 17,063 12,707 26,026 23,142 19,298 18,375
Other Current Assets 8,292 5,631 5,664 8,135 7,795 7,033 10,554 12,658 14,431
Total Current Assets 60,089 62,505 78,806 61,303 67,176 75,038 76,841 82,736 90,088
LT Investments & Receivables 2,663 1,748 1,005 957 390 368 515 477 438
Net Fixed Assets 15,500 15,253 15,217 14,049 13,532 12,844 13,258 12,820 12,536
Gross Fixed Assets 26,647 27,802 29,648 30,154 30,220 29,556 30,148 0 0
Accumulated Depreciation 11,147 12,549 14,431 16,105 16,688 16,712 16,890 0 0
Other Long-Term Assets 13,226 14,100 11,182 10,312 9,310 9,997 13,751 14,694 16,240
Total Long-Term Assets 31,389 31,101 27,404 25,318 23,232 23,209 27,524 27,991 29,214
Total Assets 91,478 93,606 106,210 86,621 90,408 98,247 104,365 110,726 119,302
Liabilities & Sh Equity
Accounts Payable 7,489 7,303 9,682 3,477 5,665 7,257 6,938 5,907 6,260
Short-Term Borrowings 755 17,012 17,058 13,789 4,218 7,581 11,558 11,558 11,558
Other Short-Term Liabilities 11,503 10,503 11,675 7,945 15,067 14,489 13,409 13,409 13,409
Total Current Liabilities 19,747 34,818 38,415 25,211 24,950 29,327 31,905 30,874 31,227
Long-Term Borrowings 25,065 3,910 4,575 4,814 4,105 6,574 6,553 6,553 6,553
Other Long-Term Liabilities 1,522 1,218 3,871 2,640 3,346 2,994 3,079 2,771 2,494
Total Long-Term Liabilities 26,587 5,128 8,446 7,454 7,451 9,568 9,632 9,324 9,047
Total Liabilities 46,334 39,946 46,861 32,665 32,401 38,895 41,537 40,198 40,274
Total Preferred Equity 0 0 0 0 0 0 0 0 0
Minority Interest 16 0 0 0 0 0 0 0 0
Share Capital & APIC 47,552 52,970 54,168 54,567 54,567 54,567 54,567 54,567 54,567
Retained Earnings (2,424) 690 5,181 (611) 3,440 4,785 8,261 15,961 24,461
Total Equity 45,144 53,660 59,349 53,956 58,007 59,352 62,828 70,528 79,028
Total Liabilities & Equity 91,478 93,606 106,210 86,621 90,408 98,247 104,365 110,726 119,302
BVPS 799 881 961 913 982 1,031 1,091 1,255 1,406
PBR 1.93 1.77 1.86 1.73 1.65 1.56 1.36 1.21
Source: Jefferies estimates, company data
9697 JP
Initiating Coverage
10 September 2013
page 17 of 21 , Equity Analyst, +65 6551 3965, [email protected] Goyal, CFA
Please see important disclosure information on pages 18 - 21 of this report.

Company DescriptionCAPCOM CO., LTD. develops consumer video game software. The Company also develops, manufactures, markets, and leases arcade gamemachines. Capcom also operates amusement facilities.
Analyst CertificationI, Atul Goyal, CFA, certify that all of the views expressed in this research report accurately reflect my personal views about the subject security(ies) andsubject company(ies). I also certify that no part of my compensation was, is, or will be, directly or indirectly, related to the specific recommendationsor views expressed in this research report.I, Ayano Oda, certify that all of the views expressed in this research report accurately reflect my personal views about the subject security(ies) andsubject company(ies). I also certify that no part of my compensation was, is, or will be, directly or indirectly, related to the specific recommendationsor views expressed in this research report.Registration of non-US analysts: Atul Goyal, CFA is employed by Jefferies Singapore Limited, a non-US affiliate of Jefferies LLC and is not registered/qualified as a research analyst with FINRA. This analyst(s) may not be an associated person of Jefferies LLC, a FINRA member firm, and therefore maynot be subject to the NASD Rule 2711 and Incorporated NYSE Rule 472 restrictions on communications with a subject company, public appearancesand trading securities held by a research analyst.
Registration of non-US analysts: Ayano Oda is employed by Jefferies (Japan) Limited, a non-US affiliate of Jefferies LLC and is not registered/qualified as a research analyst with FINRA. This analyst(s) may not be an associated person of Jefferies LLC, a FINRA member firm, and therefore maynot be subject to the NASD Rule 2711 and Incorporated NYSE Rule 472 restrictions on communications with a subject company, public appearancesand trading securities held by a research analyst.
As is the case with all Jefferies employees, the analyst(s) responsible for the coverage of the financial instruments discussed in this report receivescompensation based in part on the overall performance of the firm, including investment banking income. We seek to update our research asappropriate, but various regulations may prevent us from doing so. Aside from certain industry reports published on a periodic basis, the large majorityof reports are published at irregular intervals as appropriate in the analyst's judgement.
Meanings of Jefferies RatingsBuy - Describes stocks that we expect to provide a total return (price appreciation plus yield) of 15% or more within a 12-month period.Hold - Describes stocks that we expect to provide a total return (price appreciation plus yield) of plus 15% or minus 10% within a 12-month period.Underperform - Describes stocks that we expect to provide a total negative return (price appreciation plus yield) of 10% or more within a 12-monthperiod.The expected total return (price appreciation plus yield) for Buy rated stocks with an average stock price consistently below $10 is 20% or more withina 12-month period as these companies are typically more volatile than the overall stock market. For Hold rated stocks with an average stock priceconsistently below $10, the expected total return (price appreciation plus yield) is plus or minus 20% within a 12-month period. For Underperformrated stocks with an average stock price consistently below $10, the expected total return (price appreciation plus yield) is minus 20% within a 12-month period.NR - The investment rating and price target have been temporarily suspended. Such suspensions are in compliance with applicable regulations and/or Jefferies policies.CS - Coverage Suspended. Jefferies has suspended coverage of this company.NC - Not covered. Jefferies does not cover this company.Restricted - Describes issuers where, in conjunction with Jefferies engagement in certain transactions, company policy or applicable securitiesregulations prohibit certain types of communications, including investment recommendations.Monitor - Describes stocks whose company fundamentals and financials are being monitored, and for which no financial projections or opinions onthe investment merits of the company are provided.
Valuation MethodologyJefferies' methodology for assigning ratings may include the following: market capitalization, maturity, growth/value, volatility and expected totalreturn over the next 12 months. The price targets are based on several methodologies, which may include, but are not restricted to, analyses of marketrisk, growth rate, revenue stream, discounted cash flow (DCF), EBITDA, EPS, cash flow (CF), free cash flow (FCF), EV/EBITDA, P/E, PE/growth, P/CF,P/FCF, premium (discount)/average group EV/EBITDA, premium (discount)/average group P/E, sum of the parts, net asset value, dividend returns,and return on equity (ROE) over the next 12 months.
Conviction List Methodology
1. The aim of the conviction list is to publicise the best individual stock ideas from Jefferies Global Research2. Only stocks with a Buy or Underperform rating are allowed to be included in the recommended list.3. Stocks are screened for minimum market capitalisation and adequate daily turnover. Furthermore, a valuation, correlation and style screen
is used to ensure a well-diversified portfolio.4. Stocks are sorted to a maximum of 30 stocks with the maximum country exposure at around 50%. Limits are also imposed on a sector basis.5. Once a month, analysts are invited to recommend their best ideas. Analysts’ stock selection can be based on one or more of the following:
non-Consensus investment view, difference in earnings relative to Consensus, valuation methodology, target upside/downside % relativeto the current stock price. These are then assessed against existing holdings to ensure consistency. Stocks that have either reached theirtarget price, been downgraded over the course of the month or where a more suitable candidate has been found are removed.
6. All stocks are inserted at the last closing price and removed at the last closing price. There are no changes to the conviction list duringthe month.
9697 JP
Initiating Coverage
10 September 2013
page 18 of 21 , Equity Analyst, +65 6551 3965, [email protected] Goyal, CFA
Please see important disclosure information on pages 18 - 21 of this report.
7. Performance is calculated in US dollars on an equally weighted basis and is compared to MSCI World AC US$.8. The conviction list is published once a month whilst global equity markets are closed.9. Transaction fees are not included.
10. All corporate actions are taken into account.
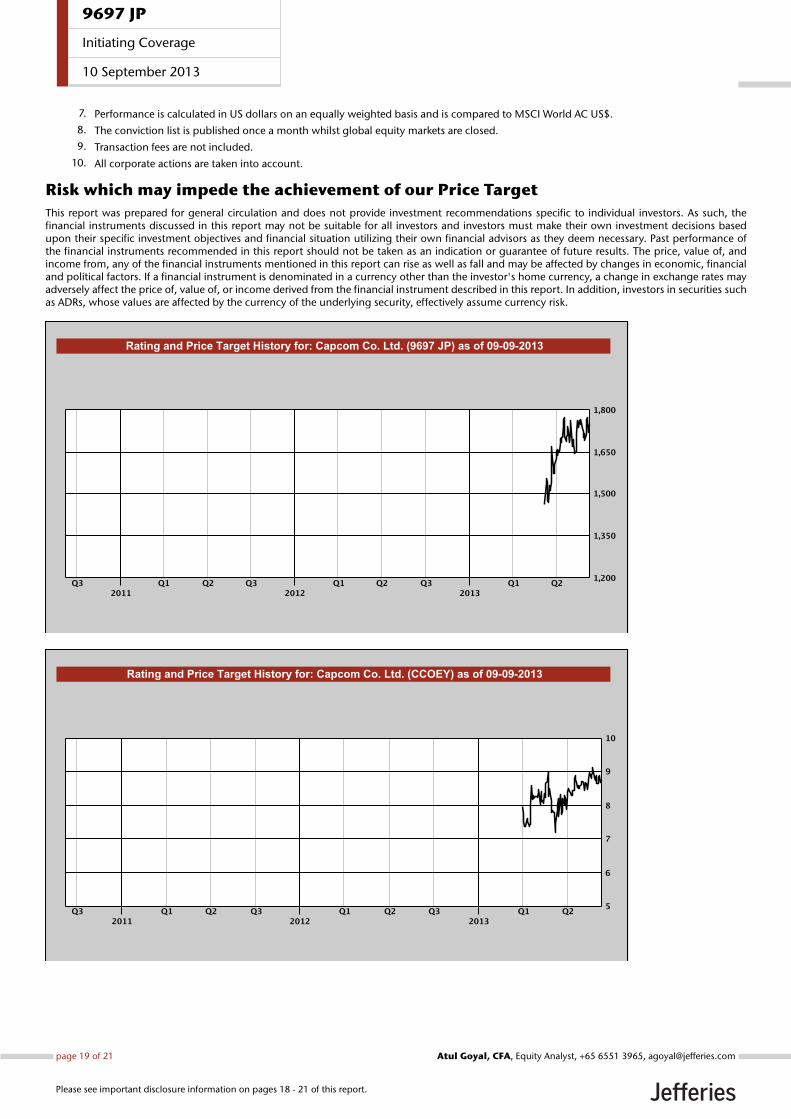
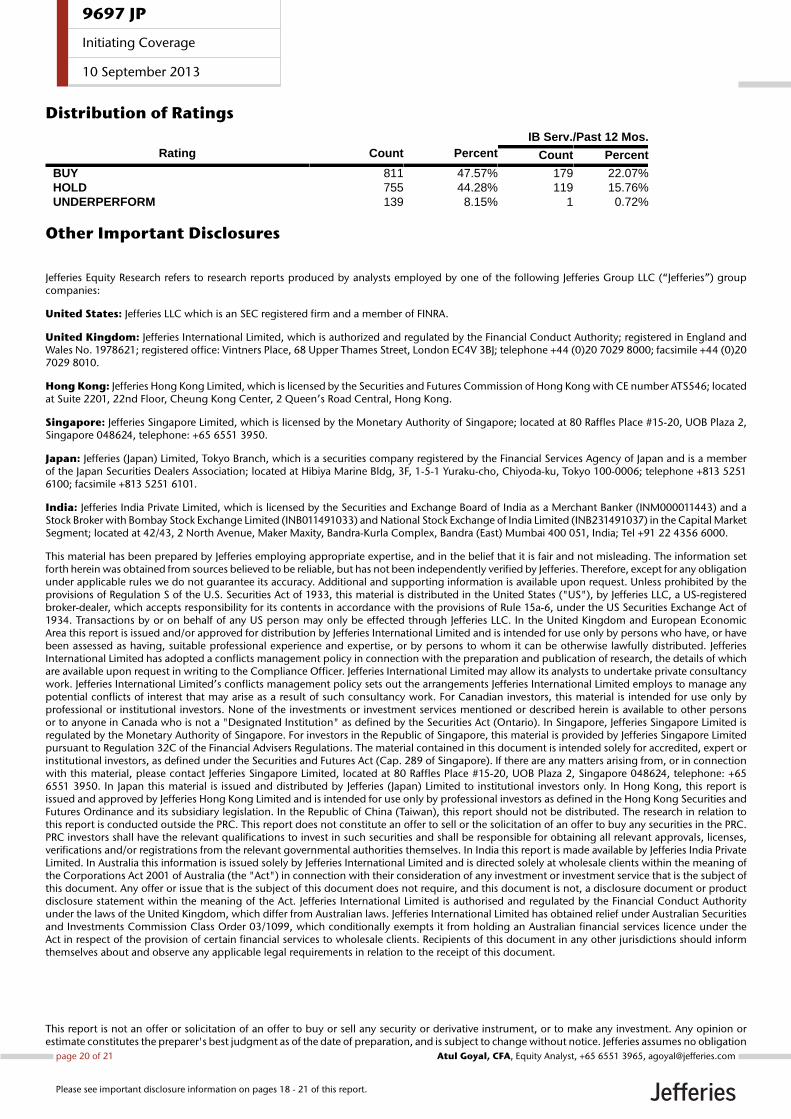
Risk which may impede the achievement of our Price TargetThis report was prepared for general circulation and does not provide investment recommendations specific to individual investors. As such, thefinancial instruments discussed in this report may not be suitable for all investors and investors must make their own investment decisions basedupon their specific investment objectives and financial situation utilizing their own financial advisors as they deem necessary. Past performance ofthe financial instruments recommended in this report should not be taken as an indication or guarantee of future results. The price, value of, andincome from, any of the financial instruments mentioned in this report can rise as well as fall and may be affected by changes in economic, financialand political factors. If a financial instrument is denominated in a currency other than the investor's home currency, a change in exchange rates mayadversely affect the price of, value of, or income derived from the financial instrument described in this report. In addition, investors in securities suchas ADRs, whose values are affected by the currency of the underlying security, effectively assume currency risk.
9697 JP
Initiating Coverage
10 September 2013
page 19 of 21 , Equity Analyst, +65 6551 3965, [email protected] Goyal, CFA
Please see important disclosure information on pages 18 - 21 of this report.
Distribution of RatingsIB Serv./Past 12 Mos.
Rating Count Percent Count Percent
BUY 811 47.57% 179 22.07%HOLD 755 44.28% 119 15.76%UNDERPERFORM 139 8.15% 1 0.72%
Other Important Disclosures
Jefferies Equity Research refers to research reports produced by analysts employed by one of the following Jefferies Group LLC (“Jefferies”) groupcompanies:
United States: Jefferies LLC which is an SEC registered firm and a member of FINRA.
United Kingdom: Jefferies International Limited, which is authorized and regulated by the Financial Conduct Authority; registered in England andWales No. 1978621; registered office: Vintners Place, 68 Upper Thames Street, London EC4V 3BJ; telephone +44 (0)20 7029 8000; facsimile +44 (0)207029 8010.
Hong Kong: Jefferies Hong Kong Limited, which is licensed by the Securities and Futures Commission of Hong Kong with CE number ATS546; locatedat Suite 2201, 22nd Floor, Cheung Kong Center, 2 Queen’s Road Central, Hong Kong.
Singapore: Jefferies Singapore Limited, which is licensed by the Monetary Authority of Singapore; located at 80 Raffles Place #15-20, UOB Plaza 2,Singapore 048624, telephone: +65 6551 3950.
Japan: Jefferies (Japan) Limited, Tokyo Branch, which is a securities company registered by the Financial Services Agency of Japan and is a memberof the Japan Securities Dealers Association; located at Hibiya Marine Bldg, 3F, 1-5-1 Yuraku-cho, Chiyoda-ku, Tokyo 100-0006; telephone +813 52516100; facsimile +813 5251 6101.
India: Jefferies India Private Limited, which is licensed by the Securities and Exchange Board of India as a Merchant Banker (INM000011443) and aStock Broker with Bombay Stock Exchange Limited (INB011491033) and National Stock Exchange of India Limited (INB231491037) in the Capital MarketSegment; located at 42/43, 2 North Avenue, Maker Maxity, Bandra-Kurla Complex, Bandra (East) Mumbai 400 051, India; Tel +91 22 4356 6000.
This material has been prepared by Jefferies employing appropriate expertise, and in the belief that it is fair and not misleading. The information setforth herein was obtained from sources believed to be reliable, but has not been independently verified by Jefferies. Therefore, except for any obligationunder applicable rules we do not guarantee its accuracy. Additional and supporting information is available upon request. Unless prohibited by theprovisions of Regulation S of the U.S. Securities Act of 1933, this material is distributed in the United States ("US"), by Jefferies LLC, a US-registeredbroker-dealer, which accepts responsibility for its contents in accordance with the provisions of Rule 15a-6, under the US Securities Exchange Act of1934. Transactions by or on behalf of any US person may only be effected through Jefferies LLC. In the United Kingdom and European EconomicArea this report is issued and/or approved for distribution by Jefferies International Limited and is intended for use only by persons who have, or havebeen assessed as having, suitable professional experience and expertise, or by persons to whom it can be otherwise lawfully distributed. JefferiesInternational Limited has adopted a conflicts management policy in connection with the preparation and publication of research, the details of whichare available upon request in writing to the Compliance Officer. Jefferies International Limited may allow its analysts to undertake private consultancywork. Jefferies International Limited’s conflicts management policy sets out the arrangements Jefferies International Limited employs to manage anypotential conflicts of interest that may arise as a result of such consultancy work. For Canadian investors, this material is intended for use only byprofessional or institutional investors. None of the investments or investment services mentioned or described herein is available to other personsor to anyone in Canada who is not a "Designated Institution" as defined by the Securities Act (Ontario). In Singapore, Jefferies Singapore Limited isregulated by the Monetary Authority of Singapore. For investors in the Republic of Singapore, this material is provided by Jefferies Singapore Limitedpursuant to Regulation 32C of the Financial Advisers Regulations. The material contained in this document is intended solely for accredited, expert orinstitutional investors, as defined under the Securities and Futures Act (Cap. 289 of Singapore). If there are any matters arising from, or in connectionwith this material, please contact Jefferies Singapore Limited, located at 80 Raffles Place #15-20, UOB Plaza 2, Singapore 048624, telephone: +656551 3950. In Japan this material is issued and distributed by Jefferies (Japan) Limited to institutional investors only. In Hong Kong, this report isissued and approved by Jefferies Hong Kong Limited and is intended for use only by professional investors as defined in the Hong Kong Securities andFutures Ordinance and its subsidiary legislation. In the Republic of China (Taiwan), this report should not be distributed. The research in relation tothis report is conducted outside the PRC. This report does not constitute an offer to sell or the solicitation of an offer to buy any securities in the PRC.PRC investors shall have the relevant qualifications to invest in such securities and shall be responsible for obtaining all relevant approvals, licenses,verifications and/or registrations from the relevant governmental authorities themselves. In India this report is made available by Jefferies India PrivateLimited. In Australia this information is issued solely by Jefferies International Limited and is directed solely at wholesale clients within the meaning ofthe Corporations Act 2001 of Australia (the "Act") in connection with their consideration of any investment or investment service that is the subject ofthis document. Any offer or issue that is the subject of this document does not require, and this document is not, a disclosure document or productdisclosure statement within the meaning of the Act. Jefferies International Limited is authorised and regulated by the Financial Conduct Authorityunder the laws of the United Kingdom, which differ from Australian laws. Jefferies International Limited has obtained relief under Australian Securitiesand Investments Commission Class Order 03/1099, which conditionally exempts it from holding an Australian financial services licence under theAct in respect of the provision of certain financial services to wholesale clients. Recipients of this document in any other jurisdictions should informthemselves about and observe any applicable legal requirements in relation to the receipt of this document.
This report is not an offer or solicitation of an offer to buy or sell any security or derivative instrument, or to make any investment. Any opinion orestimate constitutes the preparer's best judgment as of the date of preparation, and is subject to change without notice. Jefferies assumes no obligation
9697 JP
Initiating Coverage
10 September 2013
page 20 of 21 , Equity Analyst, +65 6551 3965, [email protected] Goyal, CFA
Please see important disclosure information on pages 18 - 21 of this report.
to maintain or update this report based on subsequent information and events. Jefferies, its associates or affiliates, and its respective officers, directors,and employees may have long or short positions in, or may buy or sell any of the securities, derivative instruments or other investments mentioned ordescribed herein, either as agent or as principal for their own account. Upon request Jefferies may provide specialized research products or servicesto certain customers focusing on the prospects for individual covered stocks as compared to other covered stocks over varying time horizons orunder differing market conditions. While the views expressed in these situations may not always be directionally consistent with the long-term viewsexpressed in the analyst's published research, the analyst has a reasonable basis and any inconsistencies can be reasonably explained. This materialdoes not constitute a personal recommendation or take into account the particular investment objectives, financial situations, or needs of individualclients. Clients should consider whether any advice or recommendation in this report is suitable for their particular circumstances and, if appropriate,seek professional advice, including tax advice. The price and value of the investments referred to herein and the income from them may fluctuate. Pastperformance is not a guide to future performance, future returns are not guaranteed, and a loss of original capital may occur. Fluctuations in exchangerates could have adverse effects on the value or price of, or income derived from, certain investments. This report has been prepared independently ofany issuer of securities mentioned herein and not in connection with any proposed offering of securities or as agent of any issuer of securities. Noneof Jefferies, any of its affiliates or its research analysts has any authority whatsoever to make any representations or warranty on behalf of the issuer(s).Jefferies policy prohibits research personnel from disclosing a recommendation, investment rating, or investment thesis for review by an issuer priorto the publication of a research report containing such rating, recommendation or investment thesis. Any comments or statements made herein arethose of the author(s) and may differ from the views of Jefferies.
This report may contain information obtained from third parties, including ratings from credit ratings agencies such as Standard & Poor’s. Reproductionand distribution of third party content in any form is prohibited except with the prior written permission of the related third party. Third party contentproviders do not guarantee the accuracy, completeness, timeliness or availability of any information, including ratings, and are not responsible forany errors or omissions (negligent or otherwise), regardless of the cause, or for the results obtained from the use of such content. Third party contentproviders give no express or implied warranties, including, but not limited to, any warranties of merchantability or fitness for a particular purpose oruse. Third party content providers shall not be liable for any direct, indirect, incidental, exemplary, compensatory, punitive, special or consequentialdamages, costs, expenses, legal fees, or losses (including lost income or profits and opportunity costs) in connection with any use of their content,including ratings. Credit ratings are statements of opinions and are not statements of fact or recommendations to purchase, hold or sell securities. Theydo not address the suitability of securities or the suitability of securities for investment purposes, and should not be relied on as investment advice.
Jefferies research reports are disseminated and available primarily electronically, and, in some cases, in printed form. Electronic research issimultaneously available to all clients. This report or any portion hereof may not be reprinted, sold or redistributed without the written consent ofJefferies. Neither Jefferies nor any officer nor employee of Jefferies accepts any liability whatsoever for any direct, indirect or consequential damagesor losses arising from any use of this report or its contents.
For Important Disclosure information, please visit our website at https://javatar.bluematrix.com/sellside/Disclosures.action or call 1.888.JEFFERIES
© 2013 Jefferies Group LLC
9697 JP
Initiating Coverage
10 September 2013
page 21 of 21 , Equity Analyst, +65 6551 3965, [email protected] Goyal, CFA
Please see important disclosure information on pages 18 - 21 of this report.