capital improvement board of managers - gfoa.netgfoa.net/cafr/coa2012/marioncountycapitol... ·...
TRANSCRIPT

Capital Improvement Board of Managers (of Marion County, Indiana)
(A Component Unit of the Consolidated City of Indianapolis - Marion County)
Comprehensive Annual Financial Report For the Fiscal Year Ended December 31, 2012

Comprehensive Annual Financial Report
Fiscal Year Ended December 31, 2012 Capital Improvement Board of Managers (of Marion County, Indiana) - a Component Unit of the Consolidated City of Indianapolis- Marion County Indianapolis, Indiana
Prepared by:
Finance Department Ann Lathrop, President

Capital Improvement Board of Managers (of Marion County, Indiana)
(A Component Unit of the Consolidated City of Indianapolis-Marion County)
December 31, 2012
Contents
Introductory Section (Unaudited) Letter of Transmittal .......................................................................................................................................... 2 Certificate of Achievement for Excellence in Financial Reporting .................................................................. 11 Organization Table ........................................................................................................................................... 12 Principal Officers and Management ................................................................................................................. 13
Financial Section Independent Auditor’s Report on Financial Statements ................................................................................... 15 Management’s Discussion and Analysis .......................................................................................................... 17 Financial Statements
Balance Sheets ............................................................................................................................................ 30 Statements of Revenues, Expenses and Changes in Net Position ............................................................... 32 Statements of Cash Flows .......................................................................................................................... 33 Notes to Financial Statements .................................................................................................................... 35
Other Supplementary Information Balance Sheet Information ......................................................................................................................... 65 Analysis of Revenues, Expenses and Changes in Net Position ................................................................. 66 Analysis of Certain Operating Expenses ................................................................................................... 67
Statistical Section (Unaudited)
Table I - Net Position by Component ............................................................................................................... 69 Table II - Changes in Net Position ................................................................................................................... 71 Table III - Event Statistics ................................................................................................................................ 73 Table IV - Largest Customers .......................................................................................................................... 75 Table V - Rate Schedule - Exhibits .................................................................................................................. 76 Table VI - Rate Schedule - Meetings ............................................................................................................... 77 Table VII - Rate Schedule - Hourly Labor Reimbursement Rates ................................................................... 78 Table VIII - Food Service and Concession Revenues ...................................................................................... 79 Table IX - Ratios of Outstanding Debt by Type .............................................................................................. 80 Table X - State and Local Taxes and Other Assistance ................................................................................... 81 Table XI - Pledged Revenue Coverage ............................................................................................................ 83 Table XII - Demographic and Economic Statistics .......................................................................................... 86 Table XIII - Principal Employers ..................................................................................................................... 87 Table XIV - Number of Employees (FTEs) by Identifiable Activity ............................................................... 88 Table XV - Occupancy Statistics ..................................................................................................................... 89
(THIS PAGE INTENTIONALLY LEFT BLANK)

Introductory
Section

2
May 31, 2013 Capital Improvement Board of Managers (of Marion County, Indiana) Indianapolis, Indiana We are pleased to present the Comprehensive Annual Financial Report of the Capital Improvement Board of Managers (of Marion County, Indiana) (“CIB”), for the fiscal year ended December 31, 2012.
The financial statements of the CIB are prepared in accordance with accounting principles generally accepted in the United States of America, and we believe they present the CIB's financial affairs in a manner designed to fairly set forth the financial position and results of operations of the CIB. We also believe that all disclosures necessary to enable the reader to gain an understanding of the CIB's financial affairs have been included. Responsibility for both the accuracy of the presented data and the completeness and fairness of the presentation, including all disclosures, rests with the CIB. The financial statements have been audited by the Indiana State Board of Accounts and the independent auditor’s report has been included in this report.
Management’s discussion and analysis (MD&A) immediately follows the independent auditor’s report and provides a narrative introduction, overview and analysis of the basic financial statements. The MD&A complements this letter of transmittal and should be read in conjunction with it.
Profile of the CIB
Structure and Reporting Entity: The CIB is a municipal body of Marion County created pursuant to the provisions of Indiana Code (IC) 36-10-9. The CIB has no stockholders or equity holders and all revenues and other receipts must be deposited and disbursed in accordance with provisions of such statute. The board is composed of nine members. Six of the nine board members are appointed by the Mayor of the City of Indianapolis, one is appointed by the Marion County Board of Commissioners, one is appointed by the City-County Council of the Consolidated City of Indianapolis-Marion County, a unified form of government commonly referred to as “Unigov” (“City-County Council”) and one is appointed jointly by majority vote of a body consisting of one member of the board of the county commissioners of each county in which a food and beverage tax is in effect under IC 6-9-35 on January 1 of the appointment. The board of county commissioners that has the greatest population of all counties in which a food and beverage tax is in effect under IC 6-9-35 on January 1 of the year of the appointment shall convene the meeting to make the joint appointment. Each county in which a food and beverage tax is in effect under IC 6-9-35 on January 1 of the year of the appointment is entitled to be represented at the meeting by one member of the county’s board of county commissioner, who shall be selected by that county’s board of county commissioners. One of the members appointed by the Mayor must be engaged in the hotel or motel business in the county. Not more than four of the members appointed by the Mayor may be affiliated with the same political party.
3
The CIB is authorized by the statute to finance, construct, equip, operate and maintain any capital facilities or improvements of general public benefit or welfare which would tend to promote convention, cultural, entertainment and recreational activities and thereby positively impact the wider public and civic well-being of the community. While the CIB receives certain excise tax revenue, the CIB has no taxing power. The exercise of any taxing power requires the action of the Indiana General Assembly and, in certain instances when so authorized by the Indiana General Assembly, the enactment by ordinance of the City-County Council. Additionally, certain of these taxes are statutorily restricted to limited purposes. The CIB operates facilities used in convention, cultural, entertainment and recreational activities in downtown Indianapolis. Such activities are maintained, for accounting and reporting purposes, in a single enterprise fund. Based upon the provisions of Governmental Accounting Standards Board Statement No. 14, The Financial Reporting Entity, the CIB has determined that it is a component unit of the Consolidated City of Indianapolis-Marion County as further explained in the notes to the financial statements.
CIB Operating Model: As an operating model, the CIB’s public purposes are achieved by operating capital facilities, which are an important driver to underlying the economic vitality of historically strong and growing convention, cultural, entertainment and recreational businesses (public and private) serving the public and civic interests and well-being of the State of Indiana and particularly the central Indiana region. The public and civic interests and well-being are directly and indirectly served by the investment and activity of the CIB and its growth fostering effect on the larger economy, including most directly the MSA Indianapolis public and private sector hospitality industry. Additionally, the broader private and public sector is benefited by leisure, amenity and employment opportunities. The hospitality industry is an important element and has played a central role in stabilizing the core of the City of Indianapolis, thereby generally transmitting a rippling benefit throughout the region and the State. This model, ever expanding since its inception in 1965, has become an important element to the success story that is the central Indiana region.
At the core of this operating model is an understanding that the CIB’s activities work in tandem with the private sector to foster diverse economic growth. The CIB’s assets, activities and ancillary amenities allow a larger private hospitality industry to operate. In turn, the hospitality industry mutually develops and services the region’s significant convention, cultural, entertainment and recreational activity and amenities. This understanding of the hospitality industry, as a significant driver allowing the region to enjoy amenities and activities beyond the means of the region to be supported by just its citizens, supports viewing it as an element that fosters non-hospitality economic growth and quality of life in the region. Viewed in this context, an operating model that permits the generation of non-operating revenue (from both the industry’s customers as well as regional users and beneficiaries of these activities and amenities) to support and subsidize the CIB’s capital and operating costs can be seen as thoughtful and balanced taxation policy. Tax policy impacting the CIB is managed by the Indiana General Assembly and the City-County Council. Working in harmony, this operating model has allowed the region to benefit from a thriving downtown Indianapolis and allows the State to enjoy the fruits of a growing tax base which extends past the borders of Indiana. Ultimately, the CIB operations serve to protect and support a region that has thrived and competes well in comparison to other similar cities in the nation.
Internal Control Structure: In developing and evaluating the CIB's accounting system, we have given consideration to the adequacy of the internal control structure, designing it to provide reasonable, but not absolute, assurance regarding: (1) the safeguarding of assets against loss from unauthorized use or disposition; and (2) the reliability of financial records for preparing financial statements and maintaining accountability for assets. The concept of reasonable assurance recognizes that: (1) the cost of a control should not exceed the benefits likely to be derived; and (2) the valuation of costs and benefits requires estimates and judgments by management.

4
All internal control evaluations occur within the above framework. We believe that the CIB's internal accounting controls adequately safeguard assets and provide reasonable assurance of proper recording of financial transactions.
Budget: The CIB maintains budgetary controls. The objective of these budgetary controls is to ensure compliance with legal provisions embodied in the annual approved budget. The Department Directors, in conjunction with the Administrative staff, develop budgets for the individual departments.
(1) Using these departmental budgets, the Chief Financial Officer prepares the budget for review and approval by the members of the governing board of the CIB.
(2) The budget is advertised in two local newspapers.
(3) The CIB’s board approves and submits the budget to the City-County Council for its review.
(4) The Municipal Corporations Committee of the Council holds public hearings on the budget of the CIB and forwards it for approval to the City-County Council.
(5) The budget of the CIB is reviewed and approved by the City-County Council.
(6) The overall adopted budget of the City (of which the CIB’s budget is a part) is reviewed by the County Tax Adjustment Board (“CTAB”) at a public meeting. The CTAB can reduce the City budget but not increase the operating expenses included in it and must complete its review by November 1.
(7) The Indiana Department of Local Government Finance (“DLGF”) makes the final review of the City’s budget. It can revise, reduce or restore, on appeal, funds and tax rates removed by the CTAB. It may not increase a budget above the level originally advertised. The DLGF certifies the City’s budget by February 15. The CIB’s budget is reviewed in the context of the larger City budget and, accordingly, the City’s budget review includes the review by the CTAB and DLGF. The CIB’s Act only requires review and approval by the City-County Council, not the review or approval of the CTAB and DLGF.
CIB Facilities: Among the facilities managed by the CIB are the multi-purpose Indiana Convention Center (“ICC”) and the state-of-the-art Lucas Oil Stadium (“LOS”). With the expansion of the Convention Center completed in January 2011, the expanded structure covers a 6 city block area in downtown Indianapolis. The LOS site covers a 6½ city block area just south of the expanded Convention Center and is connected by internal and covered structures, allowing combined use opportunities.
Since opening in 1972, the Indiana Convention Center has had four major expansions, with the fourth being completed in January 2011. With this latest expansion, the Indiana Convention Center now contains 566,300 square feet of clear span convention and exhibition space, 71 meeting rooms and three ballrooms. The 11 exhibit halls range in size from 36,300 square feet to 88,900 square feet. The Sagamore Ballroom, with 33,335 square feet, can be divided into seven different sections. The 500 Ballroom has 13,536 square feet and an adjoining reception room. The 10,202 square foot Wabash Ballroom features a 24’ ceiling and may be divided into three separate sections.

5
LOS features a retractable roof, offering spectacular views of the Indianapolis skyline. In addition, LOS has an infill playing surface, 7 locker rooms, exhibit space, meeting rooms, operable north window, dual two-level club lounges, 137 suites, retractable sideline seating, house reduction curtains, two large video boards, ribbon boards, spacious concourses, interior and exterior plaza space, 11 indoor docks and 2 vehicle ramps to the event level. In January 2011, LOS was connected to the expanded Convention Center and several hotels and entertainment options by a pedestrian connector. Tradeshows can take advantage of an indoor 30,000 square foot loading dock with 11 bays, retractable seating and operable walls to utilize up to 183,000 contiguous square feet of space. Football games can be played indoors or outdoors using the retractable roof and operable north window. The house reduction curtain system covers the entire Terrace Level seating, reducing capacity from 63,000 to approximately 41,000. Basketball and other mini-stadium events have the option of playing in the round for up to 71,000 fans or in a much smaller configuration with a house reduction curtain system. Concerts may be played indoors or outdoors in full stadium or reduced house configurations. Seating configurations range in size from 15,000 to 71,000.
In addition to managing the Indiana Convention Center & Lucas Oil Stadium, the CIB also maintains Victory Field and Bankers Life Fieldhouse.
Victory Field, home to the Indianapolis Indians AAA baseball team, has often been referred to as, “the most beautiful AAA ball park in the country,” by those who have enjoyed seeing a baseball game from this magnificent spot. It is constructed on a 13-acre site in White River State Park, which is subleased to, and operated by, the Indianapolis Indians franchise. Located on the southwest corner of West and Maryland streets, the ballpark is in close proximity to the Indiana Convention Center & Lucas Oil Stadium. Victory Field seats approximately 14,200 people, which includes an open-air stadium seating area and the very popular grassy berms in the outfield areas, which offer inviting, lawn seating. This grassy area, around the outfield wall, can accommodate up to 2,000 people. The park's main deck of seats wraps from behind home plate to the foul poles in left and right field. When fans enter the ballpark, they can walk down the steps to their seats in a lower seating bowl, or up to their seats in the upper bowl. There are 12,200 seats with back and arm rests. The ballpark also features many modern-day amenities, such as 29 luxury suites and cup holders at most seats.
Bankers Life Fieldhouse (formerly Conseco Fieldhouse), widely acknowledged as one of the finest sports and civic arenas in the country, is home to the National Basketball Association’s Indiana Pacers and the Women’s National Basketball Association’s Indiana Fever (2012 WNBA Champions). With a basketball-seating capacity of 18,165 that includes 71 suites and 2,667 club seats, Bankers Life Fieldhouse occupies approximately 750,000 square feet between Delaware and Pennsylvania Streets at Georgia Street in the warehouse district of downtown Indianapolis. The first retro-styled facility in the NBA, Bankers Life Fieldhouse has three seating levels: Lower Level, Krieg DeVault Club Level and Balcony Level; and the concourses on each level evoke memories of a traditional Indiana basketball Fieldhouse, complemented by state-of-the art amenities. Highlighting the inner bowl of the Fieldhouse are the windows that support the 14-story (140 foot), exposed steel roof. Throughout the day, and during select events, the curtains to these windows are lowered; giving fans not only a view to the outside, but a beautiful view of downtown Indianapolis. The window theme is continued on both the Pennsylvania and Delaware Street sides of the Indiana University Health Entry Pavilion, home to the 18 ticket windows and retro-styled ticker board announcing the upcoming events. A true tribute to the game of basketball in Indiana, the sightlines were designed for the best viewing of a basketball game; but also give patrons a great view for the many other events held at the Fieldhouse. From concerts, hockey, high school and college sports to the circus and even the World Swimming Championship, the Fieldhouse is also highly acclaimed for both the number and variety of non-basketball events it holds each year. Its many meeting rooms, restaurants and multi-use spaces also make the Fieldhouse ideal for the smaller corporate gatherings and ceremonies held daily. Located in the heart of downtown Indianapolis, the Fieldhouse is located within walking distance of Circle Centre Mall, the Indiana Convention Center, Lucas Oil Stadium, Victory Field, the State Capitol Building and the City-County Building.

6
Economic Condition
State and Local Economy: Intellectual capital, public support, academic partnerships, workforce excellence and business and industry collaborations are the driving force behind Indiana’s life sciences industry. For more than a century, Indiana has been a center of innovations in the life sciences, pharmaceutical and medical device industries. Indiana is home to more than 1,000 businesses in the medical device, pharmaceutical, drug development, diagnostic and agriculture-biotech sectors. The State has long been a world leader in life sciences and is home to such industry giants as Eli Lilly and Company, Biomet, Cook Group Inc., Roche Diagnostics and Zimmer. Indiana boasts the second-largest medical school in the United States, the Indiana University School of Medicine. Indiana is also home to the Indiana University Emerging Technologies Center, a highly successful business incubator which houses many biosciences companies. Indiana's life sciences industry succeeds through a collaboration of partnerships between industry, academia and government which creates new jobs and economic growth.
The production of motor vehicles, parts and transportation equipment is a cornerstone element of Indiana’s manufacturing culture. Indiana is home to major assembly plants for Toyota, Subaru, Honda and General Motors. The state is also home to hundreds of vehicle parts manufacturers, including Chrysler, Cummins, Delphi, Allison Transmission, ArvinMeritor, NTN, Mitsubishi, KYB, Keihin, Enkei, Toa, Tomasco USSteel, Tower Automotive, PPG and the North American headquarters of Aisin U.S.A. According to the US Bureau of Economic Analysis, Indiana’s motor vehicle industry is the 2nd largest in the United States. Indiana is home to more than 630 automotive companies producing more than 11% of all automobiles produced in the United States.
Indiana's advanced Logistics industry is a driving force in today's economy and offers a sustainable competitive advantage to manufacturers and distributors. The State is also home to information technology businesses, including Hurco Companies, Inc., search engine ChaCha, Sony Digital Audio, Hitachi, ExactTarget, and Interactive Intelligence, which maintain a clear focus on building a strong information technology workforce. Indiana’s academic and industrial partners have created an environment that encourages and sustains growth in the clean technology sector; Indiana’s clean energy jobs grew by nearly 18 percent between 1998 and 2007, ranking the state first in the industrial Midwest in overall job growth in the clean energy industry. Agriculture also plays a vital role in Indiana’s economy. With more than 15 million acres of farmland, Indiana is a leading producer of corn, soybeans, hogs, poultry, popcorn and tomato products.
Motorsports companies have also developed a clear industry cluster in the region. After all, no other place on the globe can boast the number and variety of major racing events that are held in Indianapolis and other parts of the state, annually. Commonly referred to as the “Racing Capital of the World”, Indianapolis is home to the Indianapolis Motor Speedway. In 2011, the Indianapolis Motor Speedway celebrated the 100th anniversary of the 500 mile race, which was first run in 1911 and which has been broadcast live on the radio, in its entirety, by the Indianapolis Motor Speedway Radio Network since 1953. Beginning in 2007, this wonderful event was first broadcast in HD. Indianapolis hosts two of the largest single-day sporting events in the world ~ the Indianapolis 500, often referred to as the “Greatest Spectacle in Racing,” which will be run on Sunday, May 26th, and the Brickyard 400, which will take place on Sunday, July 28th. And, on Sunday, August 18th, the IMS will host the Red Bull Indianapolis GP. The motorsports industry attracts a highly skilled and mobile workforce and, among other benefits, is an important asset in Indiana’s effort to retain and attract college graduates and other creative and skilled individuals.
There are a number of other notable players in the Indiana economy, among which is the Indianapolis Airport Authority. In 2012, the Indianapolis International Airport (IND) served 7.3 million domestic and international passengers. IND is the eighth largest cargo facility in the nation, and internationally it ranks 22nd largest in the world. In 2012, 1 million tons of cargo were transported from this facility. On average, there were 135 daily departures. In addition to 32 nonstop locations, there are 31 additional destinations from IND.
7
The passenger terminal is approximately 1.2 million square feet, with two concourses, each having 20 gates. Two gates are for international arrivals and lead to a dedicated federal inspection area and baggage claim. This beautiful state-of-the-art facility is an important contributor to central Indiana’s growing economy. As a part of the Airport’s economic impact, and based upon the most recent data available from the Aviation Association of Indiana, IND’s annual economic impact is $3.3 billion dollars. Key business partners include 9 commercial airlines, FAA, TSA, U.S. Customs & Border Patrol, 58 concessionaires (rental car, retail and other service providers), and tenants including FedEx Corporation, AAR, Express Scripts, Comlux, Hawker Beechcraft Services and Signature Flight Support. About 10,000 people work at the airport each day. No property taxes were or are used to operate and manage IND.
Indiana benefits from its proximity to major markets and population centers - both nationally and internationally. Through Indiana’s three ports, businesses can access markets and population centers in the north, through Lake Michigan and the Great Lakes - St. Lawrence Seaway; and to the south, through the Ohio and Mississippi rivers. Sometimes referred to as, “the Crossroads of America,” Indianapolis is at the center of America’s heartland, with more interstates converging in Indianapolis than in any other city in the United States. More than 50% of the population in the U.S. lives within a one day’s drive of Indianapolis.
Indianapolis is the nation’s 12th largest city. According to the U.S. Census Bureau’s Statistics for 2011, the estimated population of Marion County is 911,296 and 1,778,568 for the Indianapolis Metropolitan Area. Indianapolis is well known for the multitude of cultural, educational, sporting, shopping and dining opportunities offered to its residents and visitors. Indianapolis is the home of “Hoosier Hospitality” the perfect blend of Midwest, small town welcome and big city attractions and opportunities. Employers and employees discover that a dollar goes farther here. In other words, lower operating and living costs allow more to be done with less. Residents and business owners alike enjoy an extremely competitive cost of living, along with a high quality of life.
The hallmarks of the Indianapolis economy have long been its diversity and steady growth, which is part of the foundation of Indy’s strong performance during the past several years. Indianapolis can boast of diverse strengths in the manufacturing, distribution, retail and service sectors. Economic diversity keeps Indianapolis on a steady growth track. Additionally, Indiana’s real estate availability affords a wide selection of available land, existing office space and industrial parks. Finally, many of the city’s accomplishments, such as Victory Field, Bankers Life Fieldhouse, Circle Centre Mall, Lucas Oil Stadium, and the expanded Convention Center were all the result of successful partnerships between private and public sectors.
The stable economy and many attractions of Indianapolis, along with its central location within the nation, make it a prominent convention and tourist center. The Indianapolis 500 Mile Race, the Brickyard 400, the Red Bull Indianapolis GP, the NFL’s Indianapolis Colts, the NBA’s Indiana Pacers, the WNBA’s Indiana Fever and the AAA Indianapolis Indians baseball team are among the city’s prominent sporting attractions, not to mention countless amateur sporting events, including the Big Ten Championship Football Game, the NCAA® Men’s and Women’s Final Four Basketball Championship and the Men’s and Women’s Big Ten Basketball Tournaments. In February 2012, Indianapolis hosted the NFL Super Bowl®. Circle Centre Mall, White River State Park, the NCAA Headquarters and Hall of Champions, the Indianapolis Zoo, the Indianapolis Motor Speedway Museum, the Indiana State Museum, the Indianapolis Children’s Museum, the Indianapolis Museum of Art, the Eiteljorg Museum of American Indian and Western Art, the American Cabaret Theatre, the Indiana Repertory Theatre, the Indianapolis Symphony Orchestra and the White River State Park have also become popular attractions, along with many outstanding downtown restaurants and sports bars.

8
The current brand strategy of Visit Indy, Inc. (Visit Indy) is based on the competitive spirit found in the people of Indiana and offers a brand position that lives within the people of our great state. Around the world, Indianapolis’ name is synonymous with the very spirit of competition. With every structure we build, every event we stage, and every attraction we display, we set new national standards: always planning ahead for our next big opportunity - and consistently raising the game. In the development of this brand strategy, Visit Indy has been speaking in terms of certain primary factors which come into play. The first has to do with the restless dissatisfaction that describes the Hoosier spirit, one that never rests on its laurels and past successes. This is evident with the Col. H. Weir Cook Terminal at the Indianapolis International Airport, Lucas Oil Stadium, the expanded Indiana Convention Center and the recently completed JW Marriott. The JW Marriott Indianapolis is the city’s largest, full-service convention hotel with 104,000 square feet of meeting and event space and 1,005 guest rooms. With the addition of these new hotel rooms, the Indiana Convention Center now has over 4,700 rooms that are connected to the convention center. Indianapolis now has more rooms connected to its convention center than any other city in the country. The dynamic convention and meetings market and a vibrant tourism and hospitality industry are at the core of all of this exciting growth. Our industry is powered by over 70,000 dedicated service employees who help deliver an annual economic impact to Indianapolis MSA of approximately $3.5 billion. Significant growth will take place in the future for the convention and meetings market along with steady growth in leisure business to our city and region. In Visit Indy parlance, here’s to a bright future and additional guests visiting our great city in the years ahead.
Major Initiatives of the CIB: The Indiana Convention Center & Lucas Oil Stadium are excellent venues that have hosted very diverse groups - NCAA® Men’s and Women’s Final Four® Basketball Championships, North American Christian Annual Convention, Drum Corp International World Championship, Indiana Black Expo and VFW Annual National Convention. Groups leading the Top 20 Conventions, based on direct visitor spending for 2012, include Super Bowl XLVI® and NFL Experience, Fire Department Instructors Conference, Do It Best Corporation, National FFA Organization Convention, Gen Con LLC, Custom Electronic Design & Installation Association, Episcopal Church, The American Legion, Big Ten Football Championship and International Motorsports Industry Show.
The CIB’s primary objective, aside from the management and maintenance of its various facilities, is to build on the momentum of its convention and trade show business and continue to attract national and international sporting and other events to its facilities. A breakdown of current year events hosted and future events scheduled follows:
Current Year Events
JAMfest Super Nationals, Super Bowl XLVI®, NFL Experience, 2012, Dealernews International Powersports Dealer Expo, Pumper Cleaner Environmental Expo, Work Truck Show and NTEA Annual Convention, M-PACT 2012, International Sleep Products Assn. EXPO 2012, Nike MEQ Volleyball, National Science Teachers Association National Convention, Fire Department Instructors Conference, American Occupational Therapy Association Annual Meeting, American Coatings Shows & Conference-Biennial, 500 Festival Mini-Marathon Packet Pick-up and Expo, Indiana Conference of the United Methodist Church Annual Conference, IUPUI Commencement, Indiana Black Expo 2012 Summer Celebration, Gen Con "The Best Four Days in Gaming", Do it Best Corporation May and October Markets, National Forensic League National Tournament, American Legion National Convention, CEDIA Expo 2012, American Industrial Hygiene Association Annual Convention, 2012 WSF Cheer & Dance Nationals “Indy Showdown,” Young Champions Cheer Competition, NBM Shows, National Black MBA Association Annual Conference, Revive Our Hearts 2012 TRUE WOMAN Conference, Episcopal Church Triennial General Convention, 2012 Pokémon U.S. National Championships, American Association of Diabetes Educators Annual Meeting, Sports Inc. June Athletic Show, North American Die Casting Association CASTEXPO, National FFA Convention 2012, National Missionary Annual & Joint Youth Convention, Kenny Chesney Concert, DCI World Championships, Performance Racing Industry PRI Show, ISSMA State Marching Band Finals, Music For All Regional and Grand National Championships, Circle City Classic, Big Ten Football Championship Game, Big Ten Football Fanfest, and Indianapolis Colts Football.

9
Major Events Scheduled for 2013
National Precast Concrete Association, Circle of Stars Gymnastics Invitational, National Soccer Coaches Association Annual Convention, JAMfest Super Nationals, Capitol Sports Volleyball Central Zone Invitational, 2013 Monster Jam, 2013 Dealer Expo, National Football Scouting Combine, Pumper Cleaner Environmental Expo, Work Truck Show and NTEA Annual Convention, 2013 Supercross, Higher Education Users Group Alliance 2013, Nike Mideast Qualifier Volleyball, National Society of Black Engineers Annual National Convention, NCAA® Midwest Regional Basketball, WQA Aquatech USA, Just Give Me Jesus, National AfterSchool Association Annual Conference 2013, Association of College & Research Libraries Biennial, M-PACT 2013, Fire Department Instructors Conference, Do it Best Corporation May and October Markets, 2013 NCAA® Division I Men's Lacrosse Championship Quarterfinals, American College of Sports Medicine Annual Meeting, NBM Shows, Indiana Conference of the United Methodist Church Annual Conference, Church of the Nazarene General Assembly, lia sophia Annual Conference, Shriners of North America Imperial Council Session, 2013 Pokémon U.S. National Championships, Signature Equipo Vision LLC Summer Convention, ADSA-ASAS Joint Annual Meeting, Scentsy Annual Convention, Indiana Black Expo 2013 Summer Celebration, Pentecostal Assemblies of the World Annual Summer Assembly, DCI World Championships, Gen Con "The Best Four Days in Gaming", American Chemical Society National Meeting & Expo, Railway Interchange, Society of Hispanic Professional Engineers Annual, National Association for Gifted Children Annual Convention, Walk in the Word - Harvest Bible Chapel, Percussive Arts Society International Convention, Music For All Grand National Championship, National Federation for Catholic Youth Ministry Conference, Circle City Classic, Big Ten Football Championship Game, Big Ten Football Fanfest, SEMA/PRI Show, and Indianapolis Colts Football.
Major Events for 2014
American Football Coaches Association Annual Convention, 2014 Monster Jam, Circle of Stars Gymnastics Invitational, Pumper Cleaner Environmental Expo, 2014 Supercross, Work Truck Show and NTEA Annual Convention, Public Library Association National Convention, Property Loss Research Bureau Annual Claim Conference, Nike Mideast Qualifier Volleyball, American College Personnel Association Annual Convention, M-PACT 2014, Fire Department Instructors Conference, Nat'l. Rifle Assn. of America Annual Mtg./Exhibits, Do it Best Corporation May and October Markets, Business Professionals of America National Leadership Conference, National NeedleArts 2014 Summer Trade Show, Association for Iron & Steel Technology AISTECH 2014, BBI 2014 International Fuel Ethanol Workshop & Expo, NBM Shows, American Society for Engineering Educational Annual Conference & Exposition, lia sophia Annual Conference 2014, National Athletic Trainers' Association Annual Meeting, North American Christian Convention Annual Convention, Indiana Black Expo 2014 Summer Celebration, Gen Con "The Best Four Days in Gaming", National Association College Admission Counseling Annual Conference, Emergency Nurses Assn. Annual Scientific Conference, Music For All Grand National Championship, Percussive Arts Society International Convention, Circle City Classic, Big Ten Football Championship Game, Assemblies of the Lord Jesus Christ National Youth, Big Ten Football Fanfest, SEMA/PRI Show and Indianapolis Colts Football.

10
Awards and Acknowledgements
Independent Audit: The CIB has an annual audit of its financial statements performed by the Indiana State Board of Accounts. The independent auditor’s report on the CIB’s financial statements is included in the financial section of this report.
Awards: The Government Finance Officers Association of the United States and Canada (“GFOA”) awarded a Certificate of Achievement for Excellence in Financial Reporting to the CIB for its comprehensive annual financial report for the fiscal year ended December 31, 2011. This was the 27th consecutive year that the CIB has achieved this prestigious award. In order to be awarded a Certificate of Achievement, a government must publish an easily readable and efficiently organized comprehensive annual financial report. This report must satisfy both accounting principles generally accepted in the United States of America and applicable legal requirements. A Certificate of Achievement is valid for a period of one year only. We believe that our current comprehensive annual financial report continues to meet the Certificate of Achievement Program requirements and we are submitting it to the GFOA to determine its eligibility for another certificate.
Acknowledgements: This report could not have been prepared without the assistance of numerous staff members and the Indiana State Board of Accounts.
Sincerely,
Augustus B. Levengood, Executive Director Ann Lathrop, President

11

Capital Improvement Board of Managers of Marion County, Indiana
Organizational Table
12
13
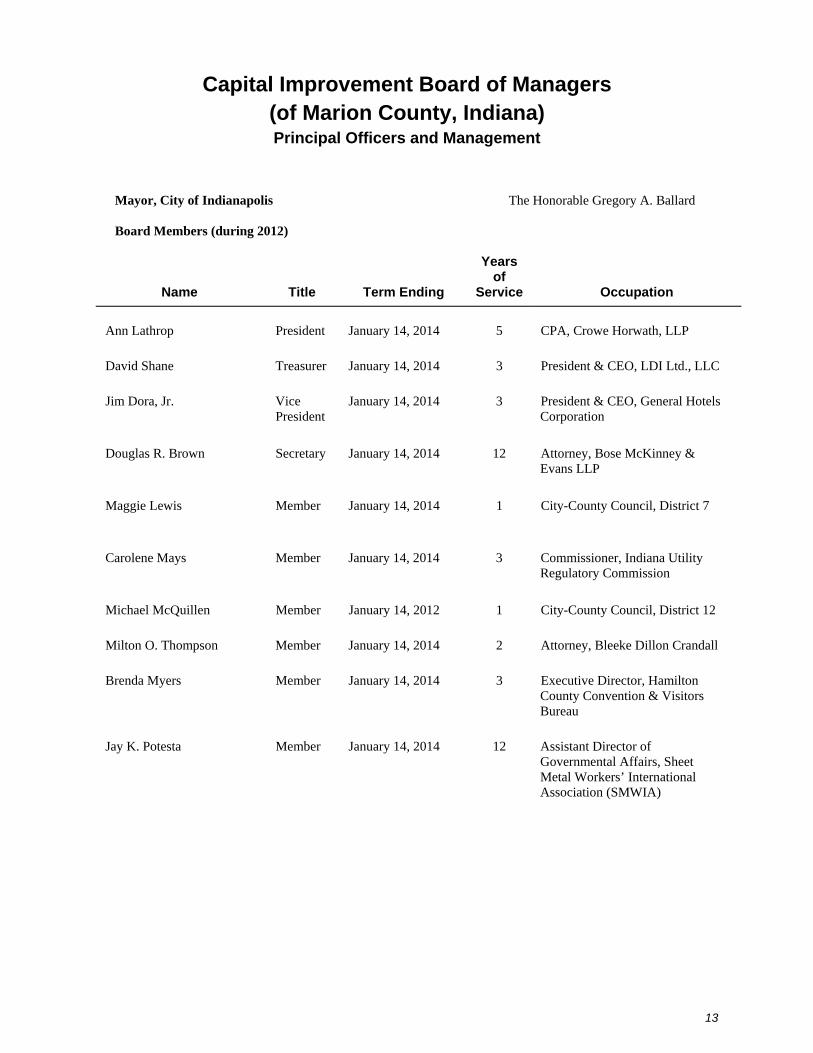
Capital Improvement Board of Managers (of Marion County, Indiana) Principal Officers and Management
Mayor, City of Indianapolis The Honorable Gregory A. Ballard Board Members (during 2012)
Name
Title
Term Ending
Years of
Service
Occupation
Ann Lathrop President January 14, 2014 5 CPA, Crowe Horwath, LLP
David Shane Treasurer January 14, 2014 3 President & CEO, LDI Ltd., LLC
Jim Dora, Jr. Vice President
January 14, 2014 3 President & CEO, General Hotels Corporation
Douglas R. Brown Secretary January 14, 2014 12 Attorney, Bose McKinney & Evans LLP
Maggie Lewis Member January 14, 2014 1 City-County Council, District 7
Carolene Mays Member January 14, 2014 3 Commissioner, Indiana Utility Regulatory Commission
Michael McQuillen Member January 14, 2012 1 City-County Council, District 12
Milton O. Thompson Member January 14, 2014 2 Attorney, Bleeke Dillon Crandall
Brenda Myers Member January 14, 2014 3 Executive Director, Hamilton County Convention & Visitors Bureau
Jay K. Potesta Member January 14, 2014 12 Assistant Director of Governmental Affairs, Sheet Metal Workers’ International Association (SMWIA)

14
Capital Improvement Board of Managers (of Marion County, Indiana)
Principal Officers and Management (Continued)
Administrative Personnel
Name
Position
Years of Service
Barney Levengood Executive Director 22
Linda G. Addaman Director of Marketing 17
Dan Huge, CPA Chief Financial Officer 3
Patti Dean Controller 3
Major E. Gardner Event Manager 32*
Michael A. Fox Stadium Director 28
Thomas L. Boyle Director of Operations 18 Counsel to the Board Bingham Greenebaum Doll, LLP Indianapolis, Indiana * Major E. Gardner employed January 1, 2012 - November 2, 2012

Financial Section
STATE OF INDIANA
AN EQUAL OPPORTUNITY EMPLOYER STATE BOARD OF ACCOUNTS 302 WEST WASHINGTON STREET ROOM E418 INDIANAPOLIS, INDIANA 46204-2765
Telephone: (317) 232-2513 Fax: (317) 232-4711 Web Site: www.in.gov/sboa
INDEPENDENT AUDITOR'S REPORT
TO: THE OFFICIALS OF THE CAPITAL IMPROVEMENT BOARD OF MANAGERS, MARION COUNTY, INDIANA Report on the Financial Statements We have audited the accompanying financial statements of Capital Improvement Board of Managers (Capital Improvement Board), as of and for the year ended December 31, 2012 and 2011, and the related notes to the financial statements, which collectively comprise the Capital Improvement Board’s basic financial statements as listed in the Table of Contents. Management’s Responsibility for the Financial Statements Management is responsible for the preparation and fair presentation of these financial statements in accordance with accounting principles generally accepted in the United States of America; this includes the design, implementation, and maintenance of internal control relevant to the preparation and fair presentation of financial statements that are free from material misstatement, whether due to fraud or error. Auditor's Responsibility Our responsibility is to express an opinion on these financial statements based on our audits. We conducted our audits in accordance with auditing standards generally accepted in the United States of America. Those standards require that we plan and perform the audit to obtain reasonable assurance about whether the financial statements are free of material misstatement. An audit involves performing procedures to obtain audit evidence about the amounts and disclosures in the financial statements. The procedures selected depend on the auditor’s judgment, including the assessment of the risks of material misstatement of the financial statements, whether due to fraud or error. In making those risk assessments, the auditor considers internal control relevant to the entity’s preparation and fair presentation of the financial statements in order to design audit procedures that are appropriate in the circumstances, but not for the purpose of expressing an opinion on the effectiveness of the Capital Improvement Board's internal control. Accordingly, we express no such opinion. An audit includes evaluating the appropriateness of accounting policies used and the reasonableness of significant accounting estimates made by management, as well as evaluating the overall presentation of the financial statements. We believe that the audit evidence we have obtained is sufficient and appropriate to provide a basis for our audit opinions. Opinion In our opinion, the financial statements referred to above present fairly, in all material respects, the respective financial position of the Capital Improvement Board as of December 31, 2012, and the respective changes in financial position and cash flows, where applicable, thereof and for the year then ended, in accordance with accounting principles generally accepted in the United States of America.

16
Other Matters Required Supplementary Information Accounting principles generally accepted in the United States of America require that the Management’s Discussion and Analysis as listed in the table of contents be presented to supplement the basic financial statements. Such information, although not a part of the basic financial statements, is required by the Governmental Accounting Standards Board who considers it to be an essential part of financial reporting for placing the basic financial statements in an appropriate operational, economic, or historical context. We have applied certain limited procedures to the required supplementary information in accordance with auditing standards generally accepted in the United States of America, which consisted of inquiries of management about the methods of preparing the information and comparing the information for consistency with management’s responses to our inquiries, the basic financial statements, and other knowledge we obtained during our audit of the basic financial statements. We do not express an opinion or provide any assurance on the information because the limited procedures do not provide us with sufficient evidence to express an opinion or provide any assurance. Other Information Our audit was conducted for the purpose of forming opinions on the financial statements that collectively comprise the Capital Improvement Board basic financial statements. The accompanying Balance Sheet Information (Combining Statements), Analysis of Revenues, Expenses and Changes in Net Position, and Analysis of Certain Operating Expenses are presented for purposes of additional analysis and are not a required part of the basic financial statements. The schedules listed above are the responsibility of management and were derived from and relate directly to the underlying accounting and other records used to prepare the basic financial statements. Such information has been subjected to the auditing procedures applied in the audit of the basic financial statements and certain additional procedures, including comparing and reconciling such information directly to the underlying accounting and other records used to prepare the basic financial statements or to the basic financial statements themselves, and other additional procedures in accordance with auditing standards generally accepted in the United States of America. In our opinion, the combining and analysis schedules listed above are fairly stated, in all material respects, in relation to the basic financial statements as a whole. The Introductory and Statistical Sections have not been subjected to the auditing procedures applied in the audit of the basic financial statements, and accordingly, we do not express an opinion or provide any assurance on these sections.
Bruce Hartman, CPA State Examiner May 23, 2013

17
MANAGEMENT’S DISCUSSION AND ANALYSIS
(Unaudited)
Introduction
The management of Capital Improvement Board of Managers of Marion County, Indiana (“CIB”), which is a component unit of the Consolidated City of Indianapolis-Marion County (“City”) and conducts its business in the City, offers readers of the CIB’s financial statements this narrative overview and analysis of the financial activities of the CIB for the fiscal year ended on December 31, 2012. This Management’s Discussion and Analysis is being presented to provide additional information regarding the activities of the CIB in connection with its financial statements and to meet the requirements of Governmental Accounting Standards Board (“GASB”) Statement No. 34, Basic Financial Statements - and Management’s Discussion and Analysis - for State and Local Governments.
The CIB is organized and operated to acquire, construct, finance, lease, operate, promote and publicize capital improvements and thereby serve the convention and visitor industry and the commercial, industrial and cultural interests of Indiana and its citizens. This presently occurs principally through its operation of the Indiana Convention Center & Lucas Oil Stadium, and its use arrangements related to Victory Field and Bankers Life Fieldhouse.
Financial Highlights
The following are some highlights from the CIB’s financial statements for the year ended December 31, 2012:
The CIB experienced an increase in Total assets of about $1.8 million, or .12% in 2012. Current assets - restricted increased by about $8.1 million primarily due to increases in the stadium and convention center sublease investment accounts. Current assets - unrestricted increased about $11.6 million due to an increase in cash reserves, which was largely the result of tax receipts designated for operating purposes in excess of the 2012 cash outlay. Capital assets decreased by about $34.4 million. This represents depreciation expense less additions in 2012. Other assets increased $16.5 million related to loans and advances,
Total liabilities decreased by about $14.9 million, or 1.2% in 2012. Current liabilities increased about $5.3 million in 2012 largely due to an increase in the current portion of long-term debt related to capital leases, while Noncurrent liabilities decreased about $20.2 million due to decreases in capital leases, and bonds and notes payable.
Net position increased by about $16.7 million, or 7.0% in 2012, primarily due to an increase in cash and investments, and note receivable, as well as a decrease in capital leases payable and a decrease in capital assets due to depreciation expense.
Operating revenues increased by about $1.7 million, or 6.4% in 2012, primarily due to labor reimbursements related to the Super Bowl.
Nonoperating revenues increased by about $10.1 million, or 7.8%. State and local taxes and other assistance increased by about $10.0 million due to fluctuations in the underlying activities from which such tax revenues are derived.
18
Operating expenses increased by about $11.0 million, or 14.6%, in large part due to additional labor and other expenses related to the Super Bowl, as well as, other new events. In addition, depreciation and amortization expense increased by $4.0 million.
Nonoperating expenses increased by about $1.0 million, or 1.5%. Interest expense increased by about $2.1 million and loss on sale/disposal of capital assets decreased by $1.0 million.
Overview of Financial Statements
This financial report of the CIB includes the following financial statements for the calendar years 2012 and 2011:
• Balance Sheets
• Statements of Revenues, Expenses and Changes in Net Position
• Statements of Cash Flows
Also included are notes to the financial statements that provide more detailed data. These financial statements are prepared in accordance with accounting principles generally accepted in the United States of America promulgated by GASB.
The net position of the CIB is composed of three categories:
Net investment in capital assets - this reflects the CIB’s investment in capital assets (e.g. land, buildings, machinery and equipment), less any related debt used to acquire those assets that is still outstanding. The CIB uses these capital assets to provide services to the public; consequently, these assets are not available for future spending. Although the CIB’s investment in its capital assets is reported net of related debt, it should be noted that the resources to repay this debt must be provided from other sources, since the capital assets themselves cannot be used to liquidate these liabilities.
Restricted - this represents resources that are subject to external restrictions (which principally relate to trust agreements under which capital lease obligations and bonded indebtedness were incurred) on how they may be used.
Unrestricted - this represents resources that may be used to meet the CIB’s ongoing obligations to the public and creditors.
The Balance Sheets reflect the assets and liabilities of the CIB using the accrual basis of accounting, which is similar to the accounting used by most private-sector companies. The CIB’s net position represents one way to measure the CIB’s financial health. In a general way, changes in net position that occur over time may also serve as an indicator of whether the financial position of the CIB is strengthening or softening. However, to assess the overall fiscal health of the CIB, readers of the CIB’s financial statements should consider additional nonfinancial factors such as the ability of the CIB to retain and attract conventions, trade shows, tourism, sporting and cultural events and other activities that utilize the capital assets of the CIB; the general economic health and outlook in Indianapolis-Marion County in the hotel and motel, retail food and beverage and rental car industries, which are subject to certain local taxes that are committed to and financially support the CIB; and the general economic health and outlook locally (that is, Indianapolis-Marion County and the surrounding region) as well as nationally with regard to consumer appetite for scheduling, attending and supporting the events and activities at the facilities of the CIB.
19
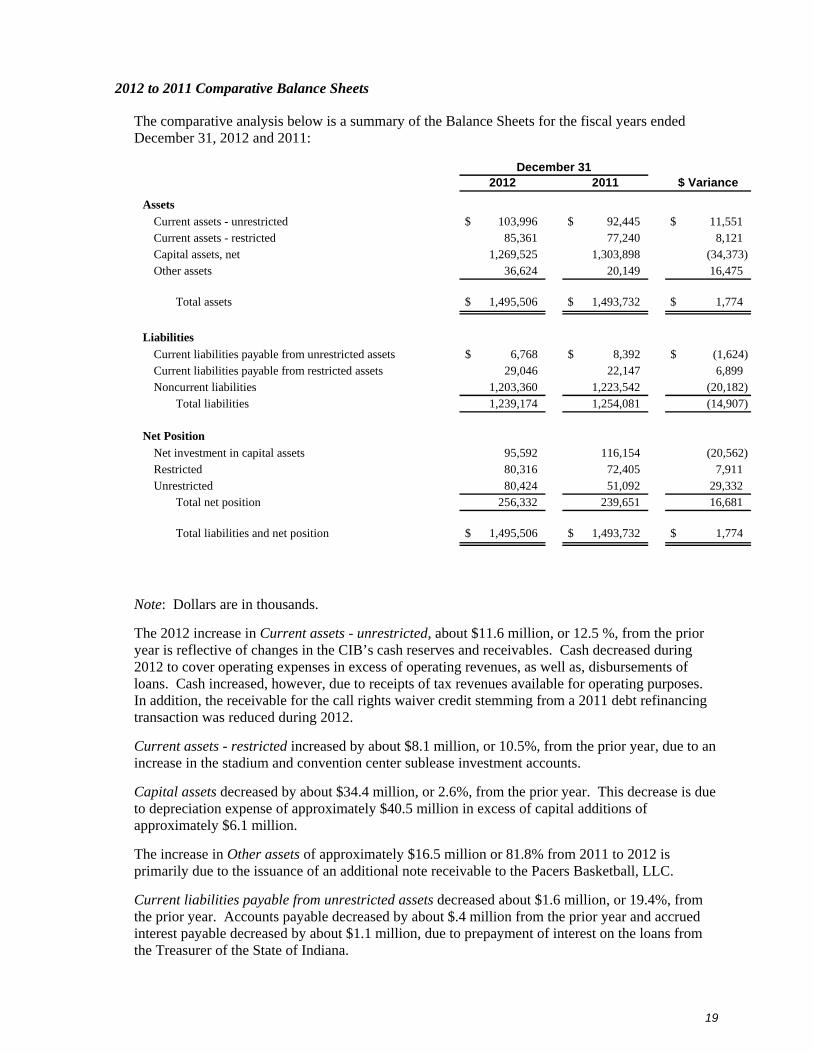
2012 to 2011 Comparative Balance Sheets
The comparative analysis below is a summary of the Balance Sheets for the fiscal years ended December 31, 2012 and 2011:
2012 2011 $ Variance
Assets
Current assets - unrestricted $ 103,996 $ 92,445 $ 11,551 Current assets - restricted 85,361 77,240 8,121 Capital assets, net 1,269,525 1,303,898 (34,373)Other assets 36,624 20,149 16,475
Total assets $ 1,495,506 $ 1,493,732 $ 1,774
Liabilities
Current liabilities payable from unrestricted assets $ 6,768 $ 8,392 $ (1,624)Current liabilities payable from restricted assets 29,046 22,147 6,899 Noncurrent liabilities 1,203,360 1,223,542 (20,182)
Total liabilities 1,239,174 1,254,081 (14,907)
Net Position
Net investment in capital assets 95,592 116,154 (20,562)Restricted 80,316 72,405 7,911 Unrestricted 80,424 51,092 29,332
Total net position 256,332 239,651 16,681
Total liabilities and net position $ 1,495,506 $ 1,493,732 $ 1,774
December 31
Note: Dollars are in thousands.
The 2012 increase in Current assets - unrestricted, about $11.6 million, or 12.5 %, from the prior year is reflective of changes in the CIB’s cash reserves and receivables. Cash decreased during 2012 to cover operating expenses in excess of operating revenues, as well as, disbursements of loans. Cash increased, however, due to receipts of tax revenues available for operating purposes. In addition, the receivable for the call rights waiver credit stemming from a 2011 debt refinancing transaction was reduced during 2012.
Current assets - restricted increased by about $8.1 million, or 10.5%, from the prior year, due to an increase in the stadium and convention center sublease investment accounts.
Capital assets decreased by about $34.4 million, or 2.6%, from the prior year. This decrease is due to depreciation expense of approximately $40.5 million in excess of capital additions of approximately $6.1 million.
The increase in Other assets of approximately $16.5 million or 81.8% from 2011 to 2012 is primarily due to the issuance of an additional note receivable to the Pacers Basketball, LLC.
Current liabilities payable from unrestricted assets decreased about $1.6 million, or 19.4%, from the prior year. Accounts payable decreased by about $.4 million from the prior year and accrued interest payable decreased by about $1.1 million, due to prepayment of interest on the loans from the Treasurer of the State of Indiana.

20
Current liabilities payable from restricted assets increased about $6.9 million, or 31.2%, from the prior year. Current portion of long-term debt and rental deposits increased by approximately $6.5 million and $.5 million, respectively.
Noncurrent liabilities decreased by about $20.2 million, or 1.6%, from the prior year. The net decrease in noncurrent liabilities in 2012 is due to reductions of the capital lease obligations and other debt in excess of new debt acquired during the year. With the completion of the ICC expansion project in 2011, the 2012 additions to debt were minimal compared to the scheduled payment reductions during the year.
Invested in Capital assets, net of related debt decreased about $20.6 million, or 17.7%, in 2012, as a result of reductions of debt and depreciation expense in excess of newly acquired capital assets. Restricted net position increased about $7.9 million, or 10.9%, in 2012, as a result of an increase in cash equivalents held with fiscal agent. This represents tax revenues received to be used to pay the capital lease obligations related to Lucas Oil Stadium and the ICC expansion. The approximate $29.3 million increase, or 57.4%, from the prior year in Unrestricted net position is primarily due to the continued increase of tax revenues available for operating purposes.
2011 to 2010 Comparative Balance Sheets
The comparative analysis below is a summary of the Balance Sheets for the fiscal years ended December 31, 2011 and 2010:
2011 2010 $ Variance
Assets
Current assets - unrestricted $ 92,445 $ 73,055 $ 19,390 Current assets - restricted 77,240 68,371 8,869 Capital assets, net 1,303,898 1,321,956 (18,058)Other assets 20,149 10,177 9,972
Total assets $ 1,493,732 $ 1,473,559 $ 20,173
Liabilities
Current liabilities payable from unrestricted assets $ 8,392 $ 5,436 $ 2,956 Current liabilities payable from restricted assets 22,147 40,195 (18,048)Noncurrent liabilities 1,223,542 1,218,572 4,970
Total liabilities 1,254,081 1,264,203 (10,122)
Net Position
Net investment in capital assets 116,154 118,659 (2,504)Restricted 72,405 66,209 6,196 Unrestricted 51,092 24,488 26,604
Total net position 239,651 209,356 30,295
Total liabilities and net position $ 1,493,732 $ 1,473,559 $ 20,173
December 31
Note: Dollars are in thousands.
21
The 2011 increase in Current assets - unrestricted, about $19.4 million, or 26.5 %, from the prior year is reflective of changes in the CIB’s cash reserves and an additional receivable for call rights waiver credits stemming from a 2011 debt refinancing transaction. Cash decreased during 2011 to cover operating expenses in excess of operating revenues, however, increased due to an $8 million receipt of funds from the interlocal agreement and other tax revenues designated for operating purposes.
Current assets - restricted increased by about $8.9 million, or 13.0%, from the prior year, due to an approximate increase of $2.8 million in the renewal and replacement reserve, $2.5 million in box office funds and $3.6 million in taxes receivable from the State of Indiana.
Capital assets decreased by about $18.0 million, or 1.4%, from the prior year. In 2011, this decrease is due to depreciation expense in excess of capital additions since the ICC expansion project was placed into service in 2011.
The increase in Other assets of approximately $10.0 million or 98.0% from 2010 to 2011 is due to the issuance of an additional note receivable to the Pacers Basketball, LLC.
Current liabilities payable from unrestricted assets increased about $3.0 million, or 54.4%, from the prior year. Accounts payable increased by about $2.3 million, or 57.2%, from the prior year due to various capital projects. Accrued interest payable increased by about $.67 million, due to interest on loans from the Treasurer of the State of Indiana.
Current liabilities payable from restricted assets decreased about $18.0 million, or 44.9%, from the prior year. Current unearned contribution revenue decreased by $12.5 million due to the recognition of such amounts as revenue in 2011. Current portion of long-term debt decreased by $5.9 million, the real estate rentals payable decreased $1.85 million, and funds held for others - box office increased $2.5 million.
Noncurrent liabilities increased about $5.0 million, or .4%, over the prior year. The amount due to the State of Indiana was reclassified as a capital lease payable since the ICC project was placed into service in 2011. The net increase in noncurrent liabilities in 2011 is due to additional expenditures on LOS and the ICC, net of scheduled reductions for the capital lease obligations.
Net investment in capital assets decreased about $2.5 million, or 2.1%, in 2011, as a result of capital asset and related debt activity in connection with the LOS and ICC projects. Restricted increased about $6.2 million, or 9.4%, in 2011, as a result of an increase in the renewal and replacement fund and box office funds, and an increase in the accrual of state and local tax assistance. The approximate $26.6 million increase, or 108.7%, from the prior year in Unrestricted is primarily due to the receipt of $8 million from the interlocal agreement and new tax revenues created in 2009 designated for operating expenses.

22
2012 to 2011 Comparative Statements of Revenues, Expenses and Changes in Net Position
The comparative analysis below is a summary of the Statements of Revenues, Expenses and Changes in Net Position for the fiscal years ended December 31, 2012 and 2011:
2012 2011 $ Variance % Variance
Operating Revenues
Rental income $ 8,550 $ 9,060 $ (510) (5.6) %Food service and concession commissions 3,971 4,752 (781) (16.4)
Parking lot income 1,430 1,009 421 41.7
Labor reimbursements 14,089 11,052 3,037 27.5
Other operating income 1,056 1,486 (430) (28.9)
Total operating revenues 29,096 27,359 1,737 6.4
Nonoperating Revenues
Investment income 337 240 97 40.2
State and local taxes and other assistance 138,777 128,797 9,980 7.7
Other 103 89 14 16.1
Total nonoperating revenues 139,217 129,126 10,091 7.8
Total revenues 168,313 156,485 11,828 7.6
Operating Expenses
Salaries and wages 15,458 12,810 2,648 20.7
Fringe benefits 3,564 3,187 377 11.8
Utilities 5,399 5,428 (29) (0.5)
Repairs and maintenance 4,364 2,582 1,782 69.0
Insurance 1,516 1,247 269 21.6
Security 2,629 2,800 (171) (6.1)
Nondepreciable equipment, parts and supplies 3,886 4,863 (977) (20.1)
Other 9,325 6,209 3,116 50.2
Depreciation and amortization 40,413 36,402 4,011 11.0
Total operating expenses 86,554 75,528 11,026 14.6
Nonoperating Expenses
Interest expense 51,008 48,879 2,129 4.4
Compensation to Visit Indy, Inc. 9,105 9,036 69 0.8
Colts inducements/Revenue Sharing and Day-of-Game expenses 5,200 5,260 (60) (1.1)
Other 577 1,765 (1,188) 100.0
Net nonoperating expenses 65,890 64,940 950 1.5
Total expenses 152,444 140,468 11,976 8.5
Income Before Capital Contributions 15,869 16,017 (148) (0.9)
Capital Contributions 812 14,278 (13,466) (94.3)
Increase in Net Position 16,681 30,295 (13,614) (44.9)
Net Position, Beginning of Year 239,651 209,356 30,295 14.5
Net Position, End of Year $ 256,332 $ 239,651 $ 16,681 7.0
December 31
Note: Dollars are in thousands.
Total operating revenues increased about $1.7 million, or 6.4%. Labor reimbursements increased about $3 million, or 27.5%, mainly related to the Super Bowl. All other operating revenues decreased a total of approximately $1.3 million, in part due to normal fluctuations in event activity and partially due to the lack of availability of space for other events during the Super Bowl time frame.

23
Total nonoperating revenues increased about $10.1 million, or 7.8%. State and local taxes and fees increased about $10.0 million, or 7.7%. The 2005 New Tax revenues increased about $4.9 million and all other Excise Tax revenues increased approximately $5.2 million in 2012.
Total operating expenses increased by $11.0 million, or 14.6%. Salaries and wages increased by about $2.6 million, or 20.7%, and fringe benefits increased about $.4 million, or 11.8%. Much of this increase was related to the Super Bowl. Repairs and maintenance costs increased about $1.8 million, or 69.0%, due to several large projects during 2012. Nondepreciable equipment, parts and supplies decreased about $1.0 million, or 20.1%, due to 2011 expenses relating to the ICC expansion. Other expenses increased by about $3.1 million, or 50.2%, due primarily to costs related to public safety for the Super Bowl. Depreciation and amortization increased about $4.0 million, or 11.0%, due to 2012 being the first full year for depreciation for the ICC expansion project which was placed into service in 2011.
Total nonoperating expenses increased about $1.0 million, or 1.5%. Interest expense increased approximately $2.1 million. This represents a combination of decreased interest expense in 2012 related to savings on certain debt refinancing transactions, as well as increased expense in 2012 on other debt issues due to debt refinancing savings recognized in 2011. In addition, the ICC expansion debt had a significant increase in interest expense in 2012. Other nonoperating expenses decreased about $1.2 million. This is the result of approximately $1.1 million of loss on sale/disposal of capital assets, primarily related to the replacement of carpet in the ICC included in 2011.
Capital contributions recognized of approximately $.8 million represent capital additions at Victory Field paid for by the Indianapolis Indians. The capital contributions of about $14.3 million in 2011 consist of contributions relating to the ICC expansion. The majority of this amount was classified as unearned contribution revenue in 2010 and recorded as a capital contribution in 2011 when the expansion was placed into service

24
2011 to 2010 Comparative Statements of Revenues, Expenses and Changes in Net Position
The comparative analysis below is a summary of the Statements of Revenues, Expenses and Changes in Net Position for the fiscal years ended December 31, 2011 and 2010:
2011 2010 $ Variance % Variance
Operating Revenues
Rental income $ 9,060 $ 6,313 $ 2,747 43.5%
Food service and concession commissions 4,752 3,071 1,681 54.7
Parking lot income 1,009 1,499 (490) (32.7)
Labor reimbursements 11,052 7,780 3,272 42.1
Other operating income 1,486 414 1,072 258.9
Total operating revenues 27,359 19,077 8,282 43.4
Nonoperating Revenues
Investment income 240 207 33 15.9
State and local taxes and other assistance 128,797 120,583 8,214 6.8
Other 89 92 (3) (3.3)
Total nonoperating revenues 129,126 120,882 8,244 6.8
Total revenues 156,485 139,959 16,526 11.8
Operating Expenses
Salaries and wages 12,810 10,376 2,434 23.5
Fringe benefits 3,187 2,848 339 11.9
Utilities 5,428 5,414 14 0.3
Repairs and maintenance 2,582 1,120 1,462 130.5
Insurance 1,247 1,117 130 11.6
Security 2,800 3,310 (510) (15.4)
Nondepreciable equipment, parts and supplies 4,863 4,124 739 17.9
Other 6,209 4,620 1,589 34.4
Depreciation and amortization 36,402 32,532 3,870 11.9
Total operating expenses 75,528 65,461 10,067 15.4
Nonoperating Expenses
Interest expense 48,879 48,650 229 0.5
Compensation to Visit Indy, Inc. 9,036 9,192 (156) (1.7)
Colts inducements/Revenue Sharing and Day-of-Game expenses 5,260 4,940 320 6.5
Other 1,765 - 1,765 100.0
Net nonoperating expenses 64,940 62,782 2,158 3.4
Total expenses 140,468 128,243 12,225 9.5
Income Before Capital Contributions 16,017 11,716 4,301 36.7
Capital Contributions 14,278 6,893 7,385 107.1
Increase in Net Position 30,295 18,609 11,686 62.8
Net Position, Beginning of Year 209,356 190,747 18,609 9.8
Net Position, End of Year $ 239,651 $ 209,356 $ 30,295 14.5
December 31
Note: Dollars are in thousands.

25
Total operating revenues increased about $8.3 million, or 43.4%. Rental income increased about $2.7 million, or 43.5%, food service and concession income increased about $1.7 million, or 54.7% and labor reimbursements increased about $3.3 million, or 42.1%. All of these increases were directly related to the increased size and capacity of the expanded ICC. The expansion allowed the ICC to hold larger conventions with greater headcount than in previous years. Other operating income increased about $1.1 million mainly due to reimbursements of previous utility costs related to the LOS construction and ICC expansion.
Total nonoperating revenues increased about $8.2 million, or 6.8%. State and local taxes and fees increased about $8.2 million, or 6.8%. This was the result of the 2009 Marion County Innkeeper’s Tax and the 2009 PSDA Revenue increasing about $2.7 million, as well as the Original Excise Tax revenues increasing approximately $4.9 million in 2011.
Total operating expenses increased by $10.1 million, or 15.4%. Salaries and wages increased by about $2.4 million, or 23.5%, and fringe benefits increased about $.3 million, or 11.9%, due to additional labor related to the increased operating income from new and larger events. Repairs and maintenance costs increased about $1.5 million, or 130.5%, largely due to work done to repair parking lots. Insurance costs increased about $.1 million, or 11.6%. Security costs decreased about $.5 million, or 15.4%, due to two additional Colts playoff games in January 2010 versus one in January 2011. Nondepreciable equipment, parts and supplies increased about $.7 million, or 18.0%, due to renovations at Bankers Life Fieldhouse. Other expenses increased by about $1.6 million, or 34.4%, due to an increase in advertising and promotion and labor set-up fees. Depreciation and amortization increased about $3.9 million, or 11.9%, due to the ICC expansion project being placed into service in 2011.
Total nonoperating expenses increased about $2.2 million, or 3.4%. Other nonoperating expenses increased about $1.8 million. This is a result of grants to other organizations of approximately $.7 million in 2011 which were not similarly made in 2010, as well as, approximately $1.1 million of loss on sale/disposal of capital assets, primarily related to the replacement of carpet in the ICC.
Capital contributions of about $14.3 million in 2011 consist of contributions relating to the ICC expansion. The majority of this amount was classified as unearned contribution revenue in 2010 and recorded as a capital contribution in 2011 when the expansion was placed into service. The capital contributions of about $6.9 million in 2010 were relating to the LOS construction.
26
Overall Financial Analysis
The CIB’s financial position continued to improve in 2012. As was the case in 2010 and 2011, the CIB ended 2012 with a positive net cash flow and an increase in operating cash balances. The CIB’s 2013 budget anticipates meeting 2013 expenditures with budgeted revenues and cash reserves.
Capital Asset and Debt Administration
Capital Assets
As discussed, the CIB is organized and operated to acquire, construct, lease, finance, operate, promote and publicize capital improvements and thereby serve the convention and visitor industry and the commercial, industrial and cultural interests of Indiana and its citizens. Because these assets are leased from the other governments and ownership of the assets ultimately reverts to the CIB upon expiration or termination of these leases, they are accounted for as property owned under capital leases and are depreciated along with other assets owned by the CIB. Readers are referred to footnotes 3 and 4 to the financial statements for more detailed information on capital asset activity. These capital improvements (capital assets) consist primarily of the following:
Indiana Convention Center & Lucas Oil Stadium
Among the facilities managed by the CIB is a multi-purpose sports and convention facility, the Indiana Convention Center & Lucas Oil Stadium. Over the years, the ICC has been expanded to meet the ever-growing demand for convention space in Indianapolis, the Capitol City of Indiana. As the lure of the City’s many tourist, cultural and sports attractions grows around the country, so grows the appeal of Indianapolis for convention and trade show organizers. The Indiana Convention Center & Lucas Oil Stadium hosts numerous state and national conventions, trade shows, cultural and sporting events each year, bringing millions of visitors to Indianapolis and central Indiana.
The Indiana Convention Center & Lucas Oil Stadium was constructed, expanded and improved using a mix of private and public funds, including the proceeds from a number of tax-exempt and taxable bond offerings by Marion County Convention and Recreational Facilities Authority (“MCCRFA”) and the Indiana Finance Authority (“IFA”). Lease agreements relating to these facilities secure the related bonds, along with certain state and local taxes which are used by the CIB to pay lease rentals. Such state and local taxes also secure certain bond and note indebtedness of the CIB and other lease obligations of the CIB related to other facilities.
In 2005, the CIB entered into a lease and other agreements with the Colts extending their relationship and commitment with the City of Indianapolis and setting forth the terms of their use of the CIB’s facilities. The Colts will play their home NFL games in Indianapolis through their 2034 season. The CIB is obligated to operate, maintain and insure the Indiana Convention Center & Lucas Oil Stadium at its expense.
The CIB has not adopted any planned actions that would significantly impact the planned use or life of the ICC or LOS.

27
Bankers Life Fieldhouse (formerly Conseco Fieldhouse)
Bankers Life Fieldhouse (including a connected parking facility) was completed in 1999 and is used for a variety of sporting events, concerts and other special events. The Pacers Basketball, LLC’s, a National Basketball Association franchise (the Pacers), is the exclusive operator of the facility, which operation and use occurs under its operating and financial agreements (as recently amended) with the CIB. Other frequent users include the Indiana Fever (a Women’s National Basketball Association basketball franchise).
Bankers Life Fieldhouse was built using a mix of private and public funds, including the proceeds from a 1997 tax-exempt and taxable bond offering of MCCRFA. A lease agreement (between MCCRFA, as lessor, and the CIB, as lessee) related to Bankers Life Fieldhouse secures the related bonds, along with certain state and local taxes which are committed by the CIB to pay lease rentals. The CIB is obligated to cause certain on-going capital maintenance and repair items to be undertaken, if necessary, to maintain the condition of Bankers Life Fieldhouse.
In 2010, the CIB entered into an Amendment to the Operating Agreement with the Pacers. In this amendment, the CIB agreed to provide $3.5 million dollars of capital improvements to Bankers Life Fieldhouse. The capital improvements were provided in full from 2010 through 2012.
The CIB has not adopted any planned actions that would significantly impact the planned use or life of Bankers Life Fieldhouse.
Victory Field
MCCRFA completed construction of Victory Field in 1995. Victory Field is home to the Indianapolis Indians (“Indians”), a AAA minor league baseball franchise affiliated with the Pittsburgh Pirates organization.
Victory Field was built using a mix of public and private funds, including the proceeds from a taxable bond offering of MCCRFA. A lease agreement (between MCCRFA, as lessor, and the CIB, as lessee) related to Victory Field also secures the related bonds, along with certain state and local taxes which are committed by the CIB to pay lease rentals. The CIB is obligated to cause Victory Field to be operated, maintained and insured; those obligations are undertaken by the Indians. The novelty/gift shop area at Victory Field was renovated in 2009. All renovation costs were paid for by the Indians. There are currently no commitments for additional significant construction.
The CIB has not adopted any planned actions that would significantly impact the planned use or life of Victory Field.
Long-Term Debt
The CIB’s long-term debt is comprised of capital lease obligations, bond indebtedness and note indebtedness.
The CIB has acquired certain of its existing capital assets (namely the previously existing ICC, Bankers Life Fieldhouse and Victory Field) through capital leasing arrangements involving MCCRFA and, in 2005, began acquiring other capital assets (namely LOS and an expansion of the ICC) through capital leasing arrangements involving the Indiana Office of Management and Budget (“IOMB”), the Indiana Stadium and Convention Building Authority (“ISCBA”), and the IFA (collectively and individually their interests being referred to in this discussion as “the State Leasing Entities”).

28
MCCRFA’s revenue bonds are payable solely from the respective trust estates under which they were issued and rely upon the receipt of debt service lease rentals to provide for their payment. The CIB’s lease payments to MCCRFA are funded and secured by a pledge of certain state and local tax revenues that varies depending on which debt is involved. More specific information concerning these financing and security arrangements related to CIB’s facilities can be found in footnotes 4, 5 and 7 to the financial statements.
The IFA’s revenue obligations are payable from and secured by ISCBA obligations that are supported by the ISCBA’s leases with IOMB, as lessee, who in turn receives rent under subleases with the CIB, as sublessee. The CIB’s lease payments to IOMB are funded and secured by a pledge of certain state and local tax revenues. More specific information concerning these financing and security arrangements related to CIB’s facilities can be found in footnotes 4 and 7 to the financial statements.
In addition to its lease obligations, the CIB has direct outstanding revenue bonds and note indebtedness of its own. Such borrowings were undertaken for a variety of purposes, including making certain capital improvements, meeting certain contractual commitments with recurring users of its facilities and providing working capital. Like its lease obligations, these indebtedness obligations are payable from, and secured by, certain state and local tax revenues, which pledges vary depending on which debt is involved. While the CIB has contractually agreed to certain debt-related limitations in connection with its capital lease obligations and bond indebtedness, certain provisions of Indiana law also limit the amount of bond and note indebtedness that it may incur.
Readers are referred to footnotes 6 and 7 to the financial statements for more detailed information on long-term debt activity.
Economic Factors and Other Matters
With Super Bowl XLVI®, and the ICC expansion as key drivers, Indianapolis tourism and convention business continued to grow in 2012. With the exception of the Super Bowl, 2013 tourism and convention projections are on par with 2012. As a convention and tourism business, the CIB is charged with the public purpose of promoting and publicizing Indianapolis and the central Indiana region. It continues to pursue this core purpose. The CIB’s focus for the business of the ICC & LOS in 2013 includes maximizing the use of the facilities by concentrating on hosting large trade show events, consideration of its available rentable space (and amenities) to meet demand (and effectively compete with other national offerings) and minimizing the wear and tear on facilities (by proactively and continuously undertaking maintenance and repairs).

29
There are no events scheduled for CIB facilities that have been cancelled for 2013 that would adversely affect operations. Regardless, the CIB will pursue continuing efforts involving the CIB’s marketing relationships with Visit Indy to attract new and recurring conventions, trade shows, sports, tourism, cultural events and other activities to its facilities and in the Central Indiana region.
Requests for Information
This financial report is designed to provide a general overview of the CIB’s finances and to demonstrate the CIB’s accountability for the public funds it receives. If you have any questions about this report or need additional financial information, your inquiries should be directed to:
Finance Department Capital Improvement Board of Managers
of Marion County, Indiana 100 South Capitol Avenue
Indianapolis, Indiana 46225-1071
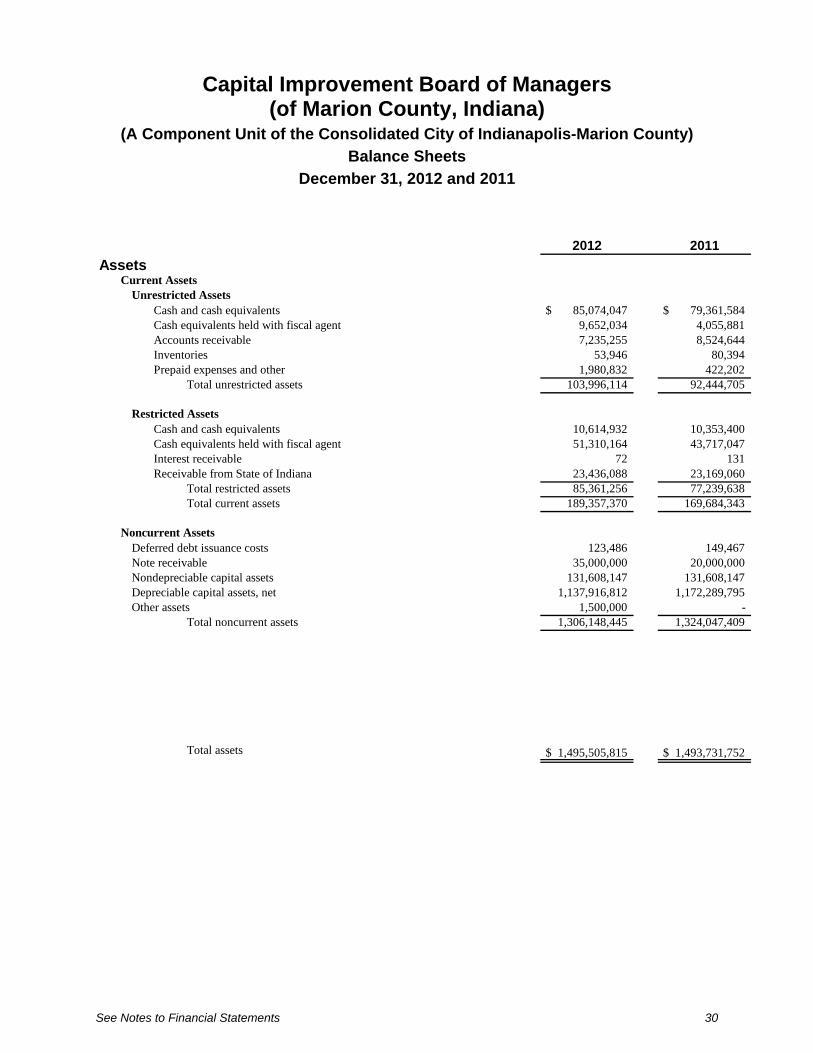
See Notes to Financial Statements 30
Capital Improvement Board of Managers (of Marion County, Indiana)
(A Component Unit of the Consolidated City of Indianapolis-Marion County)
Balance Sheets
December 31, 2012 and 2011
2012 2011
AssetsCurrent Assets
Unrestricted AssetsCash and cash equivalents $ 85,074,047 $ 79,361,584 Cash equivalents held with fiscal agent 9,652,034 4,055,881 Accounts receivable 7,235,255 8,524,644 Inventories 53,946 80,394 Prepaid expenses and other 1,980,832 422,202
Total unrestricted assets 103,996,114 92,444,705
Restricted AssetsCash and cash equivalents 10,614,932 10,353,400 Cash equivalents held with fiscal agent 51,310,164 43,717,047 Interest receivable 72 131 Receivable from State of Indiana 23,436,088 23,169,060
Total restricted assets 85,361,256 77,239,638 Total current assets 189,357,370 169,684,343
Noncurrent AssetsDeferred debt issuance costs 123,486 149,467 Note receivable 35,000,000 20,000,000 Nondepreciable capital assets 131,608,147 131,608,147 Depreciable capital assets, net 1,137,916,812 1,172,289,795 Other assets 1,500,000 -
Total noncurrent assets 1,306,148,445 1,324,047,409
Total assets $ 1,495,505,815 $ 1,493,731,752

31
2012 2011
Liabilities and Net PositionCurrent Liabilities
Payable From Unrestricted AssetsAccounts payable $ 5,777,043 $ 6,192,688 Unearned revenue 263,796 189,896 Accrued expenses and withholdings 671,513 827,690 Accrued interest payable 55,058 1,182,230
Total current liabilities payable from unrestricted assets 6,767,410 8,392,504
Payable From Restricted AssetsFunds held for others - box office 2,980,817 3,292,819 Rental deposits 2,064,464 1,541,394 Accrued interest payable 1,183,490 1,001,937 Current portion of long-term debt 22,817,171 16,310,389
Total current liabilities payable from restricted assets 29,045,942 22,146,539 Total current liabilities 35,813,352 30,539,043
Noncurrent LiabilitiesBonds and notes payable 68,700,076 70,341,694 Capital leases payable 1,134,174,469 1,152,851,099 Net pension obligation 485,829 348,984
Total noncurrent liabilities 1,203,360,374 1,223,541,777 Total liabilities 1,239,173,726 1,254,080,820
Net PositionNet investment in capital assets 95,592,243 116,153,760 Restricted
For debt service 72,439,410 63,216,672 For capital projects 5,531,060 5,480,596 For other 2,345,505 3,708,157
Unrestricted 80,423,871 51,091,747 Total net position 256,332,089 239,650,932
Total liabilities and net position $ 1,495,505,815 $ 1,493,731,752
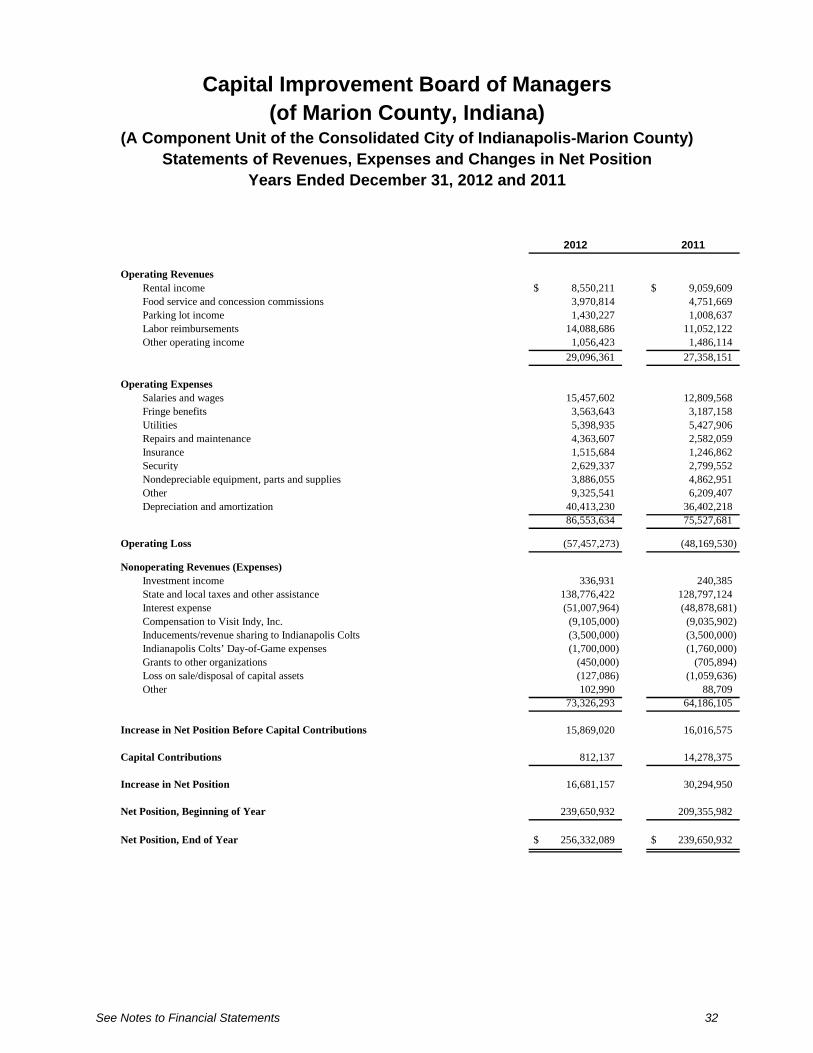
See Notes to Financial Statements 32
Capital Improvement Board of Managers (of Marion County, Indiana)
(A Component Unit of the Consolidated City of Indianapolis-Marion County) Statements of Revenues, Expenses and Changes in Net Position
Years Ended December 31, 2012 and 2011
2012 2011
Operating RevenuesRental income $ 8,550,211 $ 9,059,609 Food service and concession commissions 3,970,814 4,751,669 Parking lot income 1,430,227 1,008,637 Labor reimbursements 14,088,686 11,052,122 Other operating income 1,056,423 1,486,114
29,096,361 27,358,151
Operating ExpensesSalaries and wages 15,457,602 12,809,568 Fringe benefits 3,563,643 3,187,158 Utilities 5,398,935 5,427,906 Repairs and maintenance 4,363,607 2,582,059 Insurance 1,515,684 1,246,862 Security 2,629,337 2,799,552 Nondepreciable equipment, parts and supplies 3,886,055 4,862,951 Other 9,325,541 6,209,407 Depreciation and amortization 40,413,230 36,402,218
86,553,634 75,527,681
Operating Loss (57,457,273) (48,169,530)
Nonoperating Revenues (Expenses)Investment income 336,931 240,385 State and local taxes and other assistance 138,776,422 128,797,124 Interest expense (51,007,964) (48,878,681)Compensation to Visit Indy, Inc. (9,105,000) (9,035,902)Inducements/revenue sharing to Indianapolis Colts (3,500,000) (3,500,000)Indianapolis Colts’ Day-of-Game expenses (1,700,000) (1,760,000)Grants to other organizations (450,000) (705,894)Loss on sale/disposal of capital assets (127,086) (1,059,636)Other 102,990 88,709
73,326,293 64,186,105
Increase in Net Position Before Capital Contributions 15,869,020 16,016,575
Capital Contributions 812,137 14,278,375
Increase in Net Position 16,681,157 30,294,950
Net Position, Beginning of Year 239,650,932 209,355,982
Net Position, End of Year $ 256,332,089 $ 239,650,932

See Notes to Financial Statements 33
Capital Improvement Board of Managers (of Marion County, Indiana)
(A Component Unit of the Consolidated City of Indianapolis-Marion County)
Statements of Cash Flows
Years Ended December 31, 2012 and 2011
2012 2011
Cash Flows From Operating ActivitiesReceipts from customers and users $ 29,113,645 $ 28,122,867 Payments to suppliers and others (25,951,264) (20,182,177)Payments to employees (19,040,577) (15,742,282)
Net cash used in operating activities (15,878,196) (7,801,592)
Cash Flows From Noncapital Financing ActivitiesPayments to Visit Indy, Inc. (12,105,000) (9,035,902)State and local taxes and other assistance 55,835,886 39,035,846 Grants paid to other organizations (450,000) (705,894)Payments to Indianapolis Colts (5,200,000) (5,260,000)
Net cash provided by noncapital financing activities 38,080,886 24,034,050
Cash Flows From Capital and Related Financing ActivitiesPrincipal paid on long-term liabilities (15,155,676) (18,215,673)Interest paid on long-term liabilities (52,013,934) (49,661,564)Acquisition of capital assets (3,983,303) (3,694,941)State and local taxes and other assistance 82,673,508 86,196,338 Baseball Park Capital Improvement Fund rental payments received 102,990 88,711
Net cash provided by capital and related financing activities 11,623,585 14,712,871
Cash Flows From Investing ActivitiesProceeds from sales and maturities of investment securities - 34,050,889 Interest received on investment securities and cash equivalents 336,990 258,158 Disbursement of loan to Pacers Basketball, LLC (15,000,000) (10,000,000)
Net cash provided by (used in) investing activities (14,663,010) 24,309,047
Net Increase in Cash and Cash Equivalents 19,163,265 55,254,376
Cash and Cash Equivalents, Beginning of Year 137,487,912 82,233,536
Cash and Cash Equivalents, End of Year $ 156,651,177 $ 137,487,912

See Notes to Financial Statements 34
Capital Improvement Board of Managers (of Marion County, Indiana)
(A Component Unit of the Consolidated City of Indianapolis-Marion County)
Statements of Cash Flows (Continued)
Years Ended December 31, 2012 and 2011
2012 2011
Noncash Capital and Related Financing ActivitiesCapital assets acquisitions included in accounts payable $ 873,963 $ 2,356,579 Additions to capital assets due to Lucas Oil Stadium and
Indiana Convention Center Expansion projects 2,854,509 14,488,133 Capital contributions 812,137 14,278,375 Increase in capital lease obligation 2,987,347 282,115,007 Amortization of call rights waiver credit 1,556,806 366,037
Reconciliation of Operating Loss to Net Cash Used in Operating Activities
Operating loss $ (57,457,273) $ (48,169,530)Adjustment to reconcile operating loss to net cash used in
operating activitiesDepreciation and amortization 40,413,230 36,402,218 Nondepreciable equipment expense funded by capital lease
obligation 132,839 2,521,327 Change in assets and liabilities
Accounts receivable (267,417) (1,877,915)Inventories 26,448 (8,585)Prepaid expenses (58,630) (53,501)Accounts payable 1,066,971 484,437 Unearned revenue 73,900 (26,998)Accrued expenses and withholdings (19,332) 254,444 Funds held for others - box office (312,002) 2,464,933 Rental deposits 523,070 207,578
Net cash used in operating activities $ (15,878,196) $ (7,801,592)

35
Capital Improvement Board of Managers (of Marion County, Indiana)
(A Component Unit of the Consolidated City of Indianapolis-Marion County)
Notes to Financial Statements
December 31, 2012 and 2011
Note 1: Summary of Significant Accounting Policies
The Capital Improvement Board of Managers (of Marion County, Indiana) (“CIB”) is a municipal body created under Indiana Code (“IC”) 36-10-9 and is governed by a nine-member board. Six of the nine board members are appointed by the Mayor of the City of Indianapolis, one is appointed by the Marion County Board of Commissioners, one is appointed by the City-County Council of the Consolidated City of Indianapolis-Marion County, a unified form of government commonly referred to as “Unigov” (“City-County Council”) and one is appointed jointly by majority vote of a body consisting of one member of the board of the county commissioners of each county in which a food and beverage tax is in effect under IC 6-9-35 on January 1 of the appointment. The governments of the City of Indianapolis and Marion County, Indiana have been consolidated and operate under one elected City-County Council. The CIB has no stockholders or equity holders and all revenues and other receipts must be deposited and disbursed in accordance with provisions of this statute. The CIB is authorized to finance, construct, equip, operate and maintain any capital facilities or improvements of general public benefit or welfare which would tend to promote cultural, recreational, public or civic well-being of the community. Facilities used in sports, recreation and convention activities are leased and/or operated by the CIB in downtown Indianapolis.
Reporting Entity
The CIB is considered to be a component unit of the Consolidated City of Indianapolis-Marion County. The CIB has based this determination upon the fact that Unigov is financially accountable for the CIB and its operations. Financial accountability is evidenced by the following:
a. The Mayor of Indianapolis, acting in his capacity as the executive of both the City and the County, appoints a voting majority of the CIB's governing body;
b. Unigov, through its elected City-County Council, is able to impose its will upon the CIB since it approves the CIB's budget and may, at its discretion, choose to modify it;
c. The CIB is fiscally dependent upon Unigov in that it may not issue revenue bond or general obligation bond debt without approval by the Mayor of Indianapolis or the Marion County Board of Commissioners, respectively, and the City-County Council.
The CIB Building Facilities Corporation (“CIBBFC”) was created in 1999 to serve as the master tenant of property owned by the CIB. The CIBBFC is considered a component unit of the CIB. Due to its insignificance, the net activity of the CIBBFC is included as a receivable in the CIB’s financial statements, rather than as a blended component unit.
Subsequent to December 31, 2012, the property for which the CIBBFC acted as master tenant was sold for $3,100,000 and the lease between the CIB and the CIBBFC was terminated.

36
Capital Improvement Board of Managers (of Marion County, Indiana)
(A Component Unit of the Consolidated City of Indianapolis-Marion County)
Notes to Financial Statements
December 31, 2012 and 2011
Measurement Focus and Basis of Accounting and Financial Reporting
The CIB is a business-type activity that prepares its financial statements on the accrual basis and economic resources measurement focus in conformity with accounting principles generally accepted in the United States of America as applied to governmental units. Under the accrual basis of accounting, revenues are recorded when earned and expenses are recorded when a liability is incurred, regardless of the timing of the related cash flows.
During 2012, the CIB adopted Statement of Governmental Accounting Standards Board (“GASB”) No. 63, Financial Reporting of Deferred Outflows of Resources, Deferred Inflows of Resources, and Net Position. This Statement amends the net asset reporting requirements in Statement No. 34, Basic Financial Statements—and Management’s Discussion and Analysis—for State and Local Governments, and other pronouncements by incorporating deferred outflows of resources and deferred inflows of resources into the definitions of the required components of the residual measure and by renaming that measure as net position, rather than net assets. This Statement has been applied retrospectively and had no impact on the CIB’s net position, changes in net position or financial reporting disclosures. Upon adoption of GASB 63, the CIB currently has no deferred outflows of resources or deferred inflows of resources to report.
Use of Estimates
The preparation of financial statements in conformity with accounting principles generally accepted in the United States of America requires management to make estimates and assumptions that affect the reported amounts of assets and liabilities and disclosure of contingent assets and liabilities at the date of the financial statements and the reported amounts of revenues and expenses during the reporting period. Actual results could differ from those estimates.
Cash and Cash Equivalents
For purposes of the statements of cash flows, the CIB considers all highly liquid investments (including those that are held with fiscal agent and/or are restricted) with an original maturity of three months or less when purchased to be cash equivalents.
Inventories
Inventories consist of maintenance and operating supplies and are valued at the lower of cost or market. Cost is determined on the first-in, first-out (“FIFO”) method.

37
Capital Improvement Board of Managers (of Marion County, Indiana)
(A Component Unit of the Consolidated City of Indianapolis-Marion County)
Notes to Financial Statements
December 31, 2012 and 2011
Receivable From State of Indiana
The receivable from the State of Indiana represents certain derived tax revenues and fees accrued in accordance with GASB Statement No. 33, Accounting and Financial Reporting for Nonexchange Transactions. This balance is comprised of the following at December 31:
2012 2011
State and local taxes $ 23,078,968 $ 22,747,240 Specialty license plate fees 357,120 421,820
$ 23,436,088 $ 23,169,060
Capital Assets
Purchased capital assets are stated at cost. Donated capital assets are stated at estimated fair value at the date of donation. Depreciation is charged as an expense of operations using the straight-line method. The CIB uses a capitalization threshold of $20,000 for recording individual capital assets. The cost of minor repairs and replacements is expensed as incurred. Major repairs and replacements are capitalized. Estimated useful lives used to compute depreciation are as follows:
Years
Buildings and improvements 10-50Parking garage 30Equipment, furniture and fixtures and other 3-25
The CIB capitalized interest as a component of construction in progress, based on interest costs of borrowings specifically for the project. There was no interest capitalized during 2012. Total interest capitalized for 2011 was $311,000.
Deferred Debt Issuance Costs
Deferred debt issuance costs are being amortized over the life of the lease or debt using the bonds-outstanding method.
38
Capital Improvement Board of Managers (of Marion County, Indiana)
(A Component Unit of the Consolidated City of Indianapolis-Marion County)
Notes to Financial Statements
December 31, 2012 and 2011
Compensated Absences
Employees earn vacation time based on the calendar year. Certain employees are allowed to carry over from the previous year any accrued unused vacation days. No employee may have more than thirty unused vacation days on December 31 of any year. In compliance with GASB Statement No. 16, Accounting for Compensated Absences, the CIB has recorded a current liability of $365,994 and $316,524 for accrued vacation and related benefits at December 31, 2012 and 2011, respectively, as these benefits are expected to be used within one year. No accrual for employees' sick pay or personal time is recorded since employees are not paid for unused sick leave or personal time upon termination of employment.
Unearned Contribution Revenue
In accordance with GASB Statement No. 33, Accounting and Financial Reporting for Nonexchange Transactions, the CIB records capital contributions as unearned revenue until such time as the related assets are placed in service. Such amounts are then recorded as contribution revenue.
Original Issue Discounts and Premiums
Original issue discounts and premiums on bonds are amortized using the interest method over the life of the bonds to which they relate.
Revenue and Expense Recognition
Operating revenues and expenses of the CIB are derived primarily from convention, trade show, sporting and other special events held at the Indiana Convention Center & Lucas Oil Stadium. Operating revenues consist mainly of rental income, food service and concession commissions and labor reimbursements. All expenses that relate to operating the Indiana Convention Center & Lucas Oil Stadium facilities are considered to be operating expenses of the CIB. However, certain expenses incurred by the CIB on behalf of the Indianapolis Colts (“Colts”) are excluded from operations. All revenues and expenses not meeting this definition are reported as nonoperating revenues and expenses or capital contributions.
When both restricted and unrestricted resources are available for use, it is the CIB’s policy to use restricted resources first, then unrestricted resources as they are needed.
39
Capital Improvement Board of Managers (of Marion County, Indiana)
(A Component Unit of the Consolidated City of Indianapolis-Marion County)
Notes to Financial Statements
December 31, 2012 and 2011
Restricted Assets
Pursuant to Indiana statutes and the provisions of the CIB’s Amended and Restated Capital Improvement Bond Fund Revenue Deposit Agreement and Amended and Restated Stadium and Convention Special Fund Revenue Deposit Agreement, certain tax revenues (state and local) and fees are allocated to the CIB and are pledged to secure and pay installments of rent under certain lease and sublease agreements and other obligations of the CIB discussed later in the notes.
Annual Budget
The CIB makes operating and capital expenditures only as provided in its approved budget. The CIB is required by law to adopt an operating and capital budget, which in total cannot be increased by the CIB without the approval of the City-County Council. While the CIB also budgets for certain debt service costs, payment of these costs do not require City-County Council approval. The CIB prepares its annual budget on the modified accrual basis, while the accompanying financial statements are on the accrual basis.
Reclassifications
Certain reclassifications have been made to the 2011 financial statements to conform to the 2012 financial statement presentation. These reclassifications had no effect on the changes in net position.
Note 2: Cash, Cash Equivalents and Investments
Deposits
Custodial credit risk is the risk that in the event of a bank failure, the CIB’s deposits may not be returned to it. The CIB’s deposit policy for custodial credit risk requires compliance with the provisions of Indiana statutes.
The CIB’s cash deposits are insured up to $250,000 at financial institutions insured by the Federal Deposit Insurance Corporation’s (“FDIC”). Any cash deposits in excess of the $250,000 FDIC limits are partially or fully collateralized by the depository institution and insured by the Indiana Public Deposits Insurance Fund (“Fund”) via the pledged collateral from the institutions securing deposits of public funds. The Fund is a multiple financial institution collateral pool as provided under Indiana Code, Section 5-13-12-1.

40
Capital Improvement Board of Managers (of Marion County, Indiana)
(A Component Unit of the Consolidated City of Indianapolis-Marion County)
Notes to Financial Statements
December 31, 2012 and 2011
Investments
Indiana statutes generally authorize the CIB to invest in United States obligations and issues of federal agencies, secured repurchase agreements fully collateralized by U.S. Government or U.S. Government agency securities, Indiana municipal securities, certificates of deposit and open-end money market mutual funds.
At December 31, 2012 and 2011, the CIB had $60,962,198 and $47,772,928, respectively, invested in open-end money market mutual funds with maturities of less than one year. These amounts were held by a fiscal agent for the purpose of paying bond principal and interest.
Interest Rate Risk - As a means of limiting its exposure to fair value losses arising from rising interest rates, the CIB is limited to investing in municipal securities of Indiana issuers that have not defaulted during the previous 20 years and other securities with a stated maturity of not more than two years after the date of purchase or entry into a repurchase agreement, as defined by Indiana Code. The CIB’s investment policy for interest rate risk requires compliance with the provisions of Indiana statutes. The money market mutual funds are considered to have a maturity of less than one year because they are redeemable in full immediately.
Credit Risk - Credit risk is the risk that the issuer or other counterparty to an investment will not fulfill its obligations. The CIB’s investment policy for credit risk requires compliance with the provisions of Indiana statutes, which stipulate that the CIB only invest in securities that are rated AAA by Standard and Poor’s or Aaa by Moody’s Investor’s Service. At December 31, 2012 and 2011, the CIB’s investments in money market mutual funds were rated AAA by Standard & Poor’s.
Custodial Credit Risk - For an investment, custodial credit risk is the risk that, in the event of the failure of the counterparty, the CIB will not be able to recover the value of its investments or collateral securities that are in the possession of an outside party. The CIB’s investment in money market mutual funds was not subject to custodial credit risk at December 31, 2012 and 2011, as their existence is not evidenced by securities that exist in physical or book entry form. The CIB’s investment policy does not address how investment securities and securities underlying repurchase agreements are to be held.
Concentration of Credit Risk - The CIB places no limit on the amount that may be invested in any one issuer.

41
Capital Improvement Board of Managers (of Marion County, Indiana)
(A Component Unit of the Consolidated City of Indianapolis-Marion County)
Notes to Financial Statements
December 31, 2012 and 2011
Foreign Currency Risk - This risk relates to adverse effects on the fair value of an investment from changes in exchange rates. The CIB’s investment policy prohibits foreign investments.
Summary of Carrying Values
Deposits and investment securities included in the balance sheets are classified as follows:
2012 2011
Carrying valueDeposits $ 95,688,979 $ 89,714,984 Investments 60,962,198 47,772,928
$ 156,651,177 $ 137,487,912
Cash and cash equivalents and investment securitiesCurrent - unrestricted $ 94,726,081 $ 83,417,465 Current - restricted 61,925,096 54,070,447
$ 156,651,177 $ 137,487,912
Investment Income
Investment income for the years ended December 31, 2012 and 2011 consisted of:
2012 2011
Interest and dividend income $ 336,931 $ 240,385
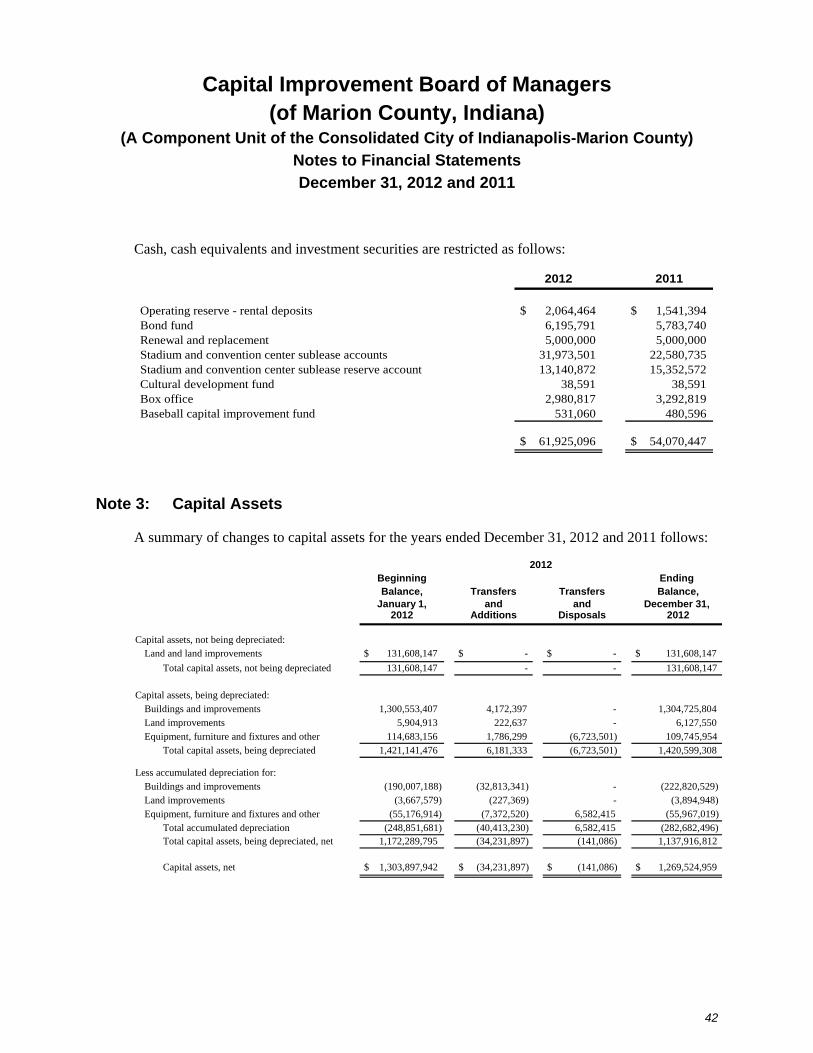
42
Capital Improvement Board of Managers (of Marion County, Indiana)
(A Component Unit of the Consolidated City of Indianapolis-Marion County)
Notes to Financial Statements
December 31, 2012 and 2011
Cash, cash equivalents and investment securities are restricted as follows:
2012 2011
Operating reserve - rental deposits $ 2,064,464 $ 1,541,394 Bond fund 6,195,791 5,783,740 Renewal and replacement 5,000,000 5,000,000 Stadium and convention center sublease accounts 31,973,501 22,580,735 Stadium and convention center sublease reserve account 13,140,872 15,352,572 Cultural development fund 38,591 38,591 Box office 2,980,817 3,292,819 Baseball capital improvement fund 531,060 480,596
$ 61,925,096 $ 54,070,447
Note 3: Capital Assets
A summary of changes to capital assets for the years ended December 31, 2012 and 2011 follows:
Beginning EndingBalance, Transfers Transfers Balance,
January 1, and and December 31,2012 Additions Disposals 2012
Capital assets, not being depreciated:Land and land improvements $ 131,608,147 $ - $ - $ 131,608,147
Total capital assets, not being depreciated 131,608,147 - - 131,608,147
Capital assets, being depreciated:Buildings and improvements 1,300,553,407 4,172,397 - 1,304,725,804 Land improvements 5,904,913 222,637 - 6,127,550 Equipment, furniture and fixtures and other 114,683,156 1,786,299 (6,723,501) 109,745,954
Total capital assets, being depreciated 1,421,141,476 6,181,333 (6,723,501) 1,420,599,308
Less accumulated depreciation for:Buildings and improvements (190,007,188) (32,813,341) - (222,820,529)Land improvements (3,667,579) (227,369) - (3,894,948)Equipment, furniture and fixtures and other (55,176,914) (7,372,520) 6,582,415 (55,967,019)
Total accumulated depreciation (248,851,681) (40,413,230) 6,582,415 (282,682,496)Total capital assets, being depreciated, net 1,172,289,795 (34,231,897) (141,086) 1,137,916,812
Capital assets, net $ 1,303,897,942 $ (34,231,897) $ (141,086) $ 1,269,524,959
2012

43
Capital Improvement Board of Managers (of Marion County, Indiana)
(A Component Unit of the Consolidated City of Indianapolis-Marion County) Notes to Financial Statements December 31, 2012 and 2011
Beginning EndingBalance, Transfers Transfers Balance,
January 1, and and December 31,2011 Additions Disposals 2011
Capital assets, not being depreciated:Land and land improvements $ 109,117,472 $ 22,490,675 $ - $ 131,608,147 Construction in progress 286,407,958 7,647,150 (294,055,108) -
Total capital assets, not being depreciated 395,525,430 30,137,825 (294,055,108) 131,608,147
Capital assets, being depreciated:Buildings and improvements 1,029,981,258 272,876,794 (2,304,645) 1,300,553,407 Land improvements 4,684,833 1,220,080 - 5,904,913 Equipment, furniture and fixtures and other 105,414,863 9,268,293 - 114,683,156
Total capital assets, being depreciated 1,140,080,954 283,365,167 (2,304,645) 1,421,141,476
Less accumulated depreciation for:Buildings and improvements (161,996,794) (29,210,894) 1,200,500 (190,007,188)Land improvements (3,471,924) (195,655) - (3,667,579)Equipment, furniture and fixtures and other (48,181,245) (6,995,669) - (55,176,914)
Total accumulated depreciation (213,649,963) (36,402,218) 1,200,500 (248,851,681)Total capital assets, being depreciated, net 926,430,991 246,962,949 (1,104,145) 1,172,289,795
Capital assets, net $ 1,321,956,421 $ 277,100,774 $ (295,159,253) $ 1,303,897,942
2011
Accumulated depreciation includes amortization of property and equipment acquired under capital lease obligations.
Note 4: Capital Leases Payable
Financing for a substantial portion of the CIB’s capital projects has been obtained from the Indiana Finance Authority (IFA) and the Marion County Convention and Recreational Facilities Authority (“MCCRFA”) as hereafter described in greater detail.
The IFA issued approximately $666,500,000 in Lease Appropriation Bonds (Series 2005A, 2007A and 2008A) for purposes of financing the costs of constructing Lucas Oil Stadium (“LOS”) and approximately $329,200,000 in Lease Appropriation Bonds (Series 2008A, 2009A and 2009B) in relation to expanding the Indiana Convention Center (the “ICC Expansion”). The IFA loaned the resulting bond proceeds to the Indiana Stadium and Convention Building Authority (“ISCBA”), which was created for the purposes of acquiring, constructing, equipping, owning, leasing and financing facilities for lease to, or for the benefit of, a capital improvement board.
44
Capital Improvement Board of Managers (of Marion County, Indiana)
(A Component Unit of the Consolidated City of Indianapolis-Marion County)
Notes to Financial Statements
December 31, 2012 and 2011
In connection with the above, legislation was passed in 2005 by the State of Indiana, which generally increased the percentages and, in some cases, expanded the areas of application for certain existing excise taxes (“2005 New Excise Tax Revenues”), increased the amount of revenues to be captured within the existing Professional Sports Development Area (“2005 PSDA Revenues”) and established certain new fees. This legislation is further explained later in these notes.
The ISCBA leases the LOS and ICC Expansion through December 31, 2040 under separate Lease Agreements (“Stadium Lease Agreement” and “Convention Center Lease Agreement”) to the Indiana Office of Management and Budget (“IOMB”). The IOMB, in turn, subleases LOS and the ICC Expansion under separate Sublease Agreements (“Stadium Sublease Agreement” and “Convention Center Sublease Agreement”) to the CIB.
Sublease rentals are payable solely from, and are secured exclusively by a pledge of, the 2005 New Excise Tax Revenues, the 2005 PSDA Revenues and certain fees as later described in these notes, and starting in 2028 (following retirement of the previously outstanding lease and bond obligations of the CIB), certain of the CIB’s existing state and local tax assistance revenues. Such amounts are pledged in accordance with an Amended and Restated Stadium and Convention Special Fund Revenue Deposit Agreement between the CIB, IOMB, the ISCBA, the IFA, the Indiana State Budget Director and the Deposit Trustee. Payment by the Deposit Trustee to the Stadium Bond or Convention Center Bond Trustee for the purpose of paying sublease rental payments under the Subleases constitutes lease rentals under the Leases and payment of amounts due under the respective loan agreements.
MCCRFA was created pursuant to IC 36-10-9.1 and is authorized thereunder to acquire one or more capital improvements from the CIB or other local governments, by purchase or lease and to fund or refund indebtedness incurred on account of such capital improvements to enable the respective government to make a savings on its debt service obligations.
Pursuant to its Master Lease Agreement with MCCRFA, the CIB is leasing a portion of the Indiana Convention Center and a baseball facility (“Victory Field”) located adjacent thereto. Under a separate Master Lease Agreement II, the CIB is leasing Bankers Life Fieldhouse (a multi-purpose arena) and an adjacent parking garage.
Under each of the Master Lease and Sublease Agreements, the CIB has the option to purchase the leased facilities at a price equal to the amount required to provide for payment or redemption of all related outstanding debt obligations. Also, the CIB is obligated to pay certain expenses and all costs to operate, insure and maintain the leased facilities. The CIB’s Master Lease and Sublease payment obligations are payable from and secured by a pledge of certain state and local taxes to be received by the CIB. Certain lease obligations have specific or senior liens on some of the state and local taxes.
45
Capital Improvement Board of Managers (of Marion County, Indiana)
(A Component Unit of the Consolidated City of Indianapolis-Marion County)
Notes to Financial Statements
December 31, 2012 and 2011
A number of MCCRFA bond refundings have resulted in the restructuring of the CIB’s Master Lease Agreements with MCCRFA. These transactions are described in the paragraphs that follow.
In May 2012, the CIB recorded a deferred accounting loss of $1,959,928 on the restructuring of its Master Lease Agreement with MCCRFA, which will be amortized over the period ending 2021. The restructuring was the result of the issuance of MCCRFA’s Excise Taxes Lease Rental Revenue Refunding Senior Bonds, Series 2012A (the “2012A Senior Bonds”). The 2012A Senior Bonds were issued to refund a portion of MCCRFA’s Excise Taxes Lease Rental Revenue Refunding Senior Bonds, Series 2003A. As a result of this refunding transaction, the CIB was able to restructure its lease obligation to MCCRFA and reduce its aggregate debt service payments by approximately $3,000,000 and obtain an economic gain (difference between the present values of the old and new debt service payments) of approximately $2,950,000.
In relation to MCCRFA’s 2003 refunding transaction, the CIB recorded a deferred accounting gain of $2,445,312 on the restructuring of its Master Lease Agreement with MCCRFA, which was being amortized into income over the period ending in 2021. Due to the aforementioned refunding, a portion of the unamortized balance of this deferred accounting gain was included in the determination of the deferred accounting loss on the restructuring of the Master Lease Agreement.
In November 2011, the CIB recorded a deferred accounting gain of $12,340,306 on the restructuring of its Master Lease Agreement II with MCCRFA, which will be amortized into income over the period ending 2026. The restructuring was the result of the issuance of MCCRFA’s Excise Taxes Lease Rental Revenue Refunding Subordinate Bonds, Series 2011A (the “2011A Subordinate Bonds”). The 2011A Subordinate Bonds were issued to refund MCCRFA’s Excise Taxes Lease Rental Revenue Refunding Subordinate Bonds, Series 1997A. As a result of this refunding transaction, the CIB was able to restructure its lease obligation to MCCRFA and reduce its aggregate debt service payments by approximately $11,640,000 and obtain an economic gain (difference between the present values of the old and new debt service payments) of approximately $11,320,000.
In June 2011, the CIB recorded a deferred accounting gain of $910,000 on the restructuring of its Master Lease Agreement with MCCRFA, which will be amortized into income over the period ending in 2026. The restructuring was the result of the issuance of MCCRFA’s Excise Taxes Lease Rental Revenue Refunding Senior Bonds, Series 2011B (“2011B Senior Bonds”). The 2011B Senior Bonds were issued to refund MCCRFA’s Excise Taxes Lease Rental Revenue Refunding Senior Bonds, Series 1997A. As a result of this refunding transaction, the CIB was able to restructure its lease obligation to MCCRFA and reduce its aggregate debt service payments by approximately $1,590,000 and obtain an economic gain (difference between the present values of the old and new debt service payments) of approximately $1,050,000.
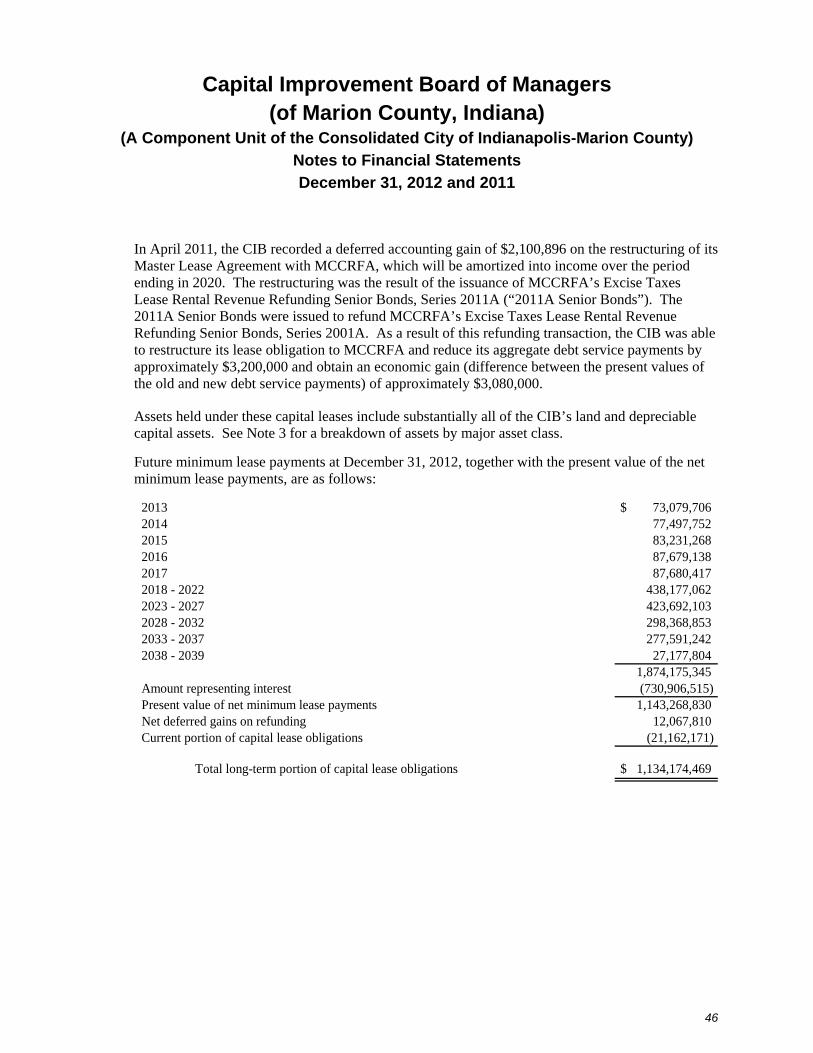
46
Capital Improvement Board of Managers (of Marion County, Indiana)
(A Component Unit of the Consolidated City of Indianapolis-Marion County)
Notes to Financial Statements
December 31, 2012 and 2011
In April 2011, the CIB recorded a deferred accounting gain of $2,100,896 on the restructuring of its Master Lease Agreement with MCCRFA, which will be amortized into income over the period ending in 2020. The restructuring was the result of the issuance of MCCRFA’s Excise Taxes Lease Rental Revenue Refunding Senior Bonds, Series 2011A (“2011A Senior Bonds”). The 2011A Senior Bonds were issued to refund MCCRFA’s Excise Taxes Lease Rental Revenue Refunding Senior Bonds, Series 2001A. As a result of this refunding transaction, the CIB was able to restructure its lease obligation to MCCRFA and reduce its aggregate debt service payments by approximately $3,200,000 and obtain an economic gain (difference between the present values of the old and new debt service payments) of approximately $3,080,000.
Assets held under these capital leases include substantially all of the CIB’s land and depreciable capital assets. See Note 3 for a breakdown of assets by major asset class.
Future minimum lease payments at December 31, 2012, together with the present value of the net minimum lease payments, are as follows:
2013 $ 73,079,706 2014 77,497,752 2015 83,231,268 2016 87,679,138 2017 87,680,417 2018 - 2022 438,177,062 2023 - 2027 423,692,103 2028 - 2032 298,368,853 2033 - 2037 277,591,242 2038 - 2039 27,177,804
1,874,175,345 Amount representing interest (730,906,515)Present value of net minimum lease payments 1,143,268,830 Net deferred gains on refunding 12,067,810 Current portion of capital lease obligations (21,162,171)
Total long-term portion of capital lease obligations $ 1,134,174,469

47
Capital Improvement Board of Managers (of Marion County, Indiana)
(A Component Unit of the Consolidated City of Indianapolis-Marion County)
Notes to Financial Statements
December 31, 2012 and 2011
Note 5: Long-Term Debt
Long-term debt of the CIB (excluding capital lease obligations) consists of the following:
Junior Subordinate Notes
Under a borrowing arrangement executed in 1998, certain civic-minded local businesses (“Junior Lenders”) began lending to the CIB pursuant to junior notes certain funds paid to them from Circle Center Limited Partnership (an activity and investment that had civic origins and was unrelated to the CIB) for the purpose of assisting with the financing of Bankers Life Fieldhouse and other CIB activities. The Junior Lenders lent certain income and other proceeds that they received from their respective interests in Circle Centre Partners Limited Partnership. These notes were issued as junior obligations with a payment right similar to MCCRFA’s bondholders except they are, in all respects, subordinate.
The notes mature on December 31, 2017, with interest at a per annum rate equal to a rolling monthly average of the yield on 13-week United States Treasury Bills. Interest is payable annually. The notes can be prepaid at the CIB’s option at any time without penalty.
During 2012 and 2011, no additional borrowing under such loans occurred. The aggregate balance of these loans at December 31, 2012 and 2011 is $33,759,000. Accrued and unpaid interest on these notes at December 31, 2012 and 2011 amounted to $31,058 and $24,306, respectively.
Series 1999A Bonds
During 1999, the CIB issued $25,805,000 of Excise Taxes Revenue Subordinate Bonds, Series 1999A (the “1999A Subordinate Bonds”), and $23,800,000 of Excise Taxes Revenue Subordinate Refunding Notes, Series 1999A (collectively, the “1999 Subordinate Bonds”). A portion of the proceeds from these debt issues was used to finance certain renovations and improvements to the Indiana Convention Center and the CIB’s former domed stadium facility, while the remaining proceeds were used to prepay a prior loan to the Colts. The Subordinate Refunding Notes were paid off in 2008.
In September 2011, the 1999A Subordinate Bonds were refunded at The Indianapolis Local Public Improvement Bond Bank (“Bond Bank”) level. Relative to this refunding, the Bond Bank provided the CIB with a Call Rights Waiver Credit in the amount of $1,934,175 for the purpose of reducing the succeeding ten semi-annual debt service payments. The credit is being reduced as the savings in debt service payments are realized. The balance of the Call Rights Waiver Credit receivable at December 31, 2012 and 2011 was $11,291 and $1,568,097, respectively, and is recorded in accounts receivable in the balance sheets.

48
Capital Improvement Board of Managers
(of Marion County, Indiana) (A Component Unit of the Consolidated City of Indianapolis-Marion County)
Notes to Financial Statements
December 31, 2012 and 2011
Information regarding the Series 1999 Subordinate Bonds at December 31, 2012 and 2011 follows:
2012 2011
Excise Taxes Revenue Subordinate Bonds, Series 1999ASerial bonds, maturing June 1, 2004 to December 1, 2013. Interest at
3.35% to 5.00%, due semiannually on June 1 and December 1 $ 1,655,000 $ 3,235,000 Term bonds, maturing June 1, 2015 to June 1, 2021. Interest at
5.00%, due semiannually on June 1 and December 1 17,000,000 17,000,000 18,655,000 20,235,000
Unamortized discount (58,924) (72,306)
Total Series 1999A $ 18,596,076 $ 20,162,694
Treasurer of State Junior Subordinate Notes
The CIB has entered into a Note Purchase Agreement with the Treasurer of the State of Indiana. On December 15, 2009, the CIB completed an initial State Treasurer Loan and issued a note (“2009 Note”) in the amount of $9,000,000, bearing interest at a per annum rate of 5.25% with a maturity date of December 15, 2019. The note was reissued in July 2010 with an interest rate of 4.25% and again in November 2011 with an interest rate of 3.00%. On December 15, 2010, the CIB completed a second State Treasurer Loan and issued a note (“2010 Note”) in the amount of $9,000,000, bearing interest at 3.46% with a maturity date of December 15, 2020. This note was reissued in November 2011 with an interest rate of 3.00%. Interest payments on both the 2009 and 2010 Notes were to commence June 1, 2013; however, interest was prepaid in the amount of $1,707,183 in December 2012. Interest payments are required to be made annually thereafter on each June 1. No loan was requested from the State Treasurer in 2011.
The debt service requirements to maturity for long-term debt of the CIB (excluding capital lease obligations) are as follows at December 31, 2012:
Principal Interest Total
2013 $ 1,655,000 $ 1,305,399 $ 2,960,399 2014 1,740,000 1,377,558 3,117,558 2015 1,825,000 1,288,433 3,113,433 2016 1,915,000 1,194,933 3,109,933 2017 35,769,000 1,127,866 36,896,866 2018 - 2021 27,510,000 2,514,500 30,024,500
$ 70,414,000 $ 8,808,689 $ 79,222,689

49
Capital Improvement Board of Managers (of Marion County, Indiana)
(A Component Unit of the Consolidated City of Indianapolis-Marion County)
Notes to Financial Statements
December 31, 2012 and 2011
Note 6: Changes in Long-Term Obligations
The following is a summary of long-term obligation transactions for the CIB for the years ended December 31, 2012 and 2011:
Balance BalanceJanuary 1, December 31, Current
2012 Additions Reductions 2012 Portion
Long-term obligationsJunior Subordinate Notes $ 33,759,000 $ - $ - $ 33,759,000 $ - Excise Taxes Revenue Subordinate Bonds,
Series 1999A 20,235,000 - (1,580,000) 18,655,000 1,655,000 Treasurer of State Junior
Subordinate Notes, Series 2009A 9,000,000 - - 9,000,000 - Treasurer of State Junior
Subordinate Notes, Series 2010A 9,000,000 - - 9,000,000 - Capital leases 1,152,047,761 2,987,348 (11,766,279) 1,143,268,830 21,162,171 (Discount)/premium (72,306) - 13,382 (58,924) - Net gain (loss) on refunding 15,533,727 (1,959,928) (1,505,989) 12,067,810 -
$ 1,239,503,182 $ 1,027,420 $ (14,838,886) $ 1,225,691,716 $ 22,817,171
Balance BalanceJanuary 1, December 31, Current
2011 Additions Reductions 2011 Portion
Long-term obligationsJunior Subordinate Notes $ 33,759,000 $ - $ - $ 33,759,000 $ - Excise Taxes Revenue Subordinate Bonds,
Series 1999A 21,745,000 - (1,510,000) 20,235,000 1,580,000 Treasurer of State Junior
Subordinate Notes, Series 2009A 9,000,000 - - 9,000,000 - Treasurer of State Junior
Subordinate Notes, Series 2010A 9,000,000 - - 9,000,000 - Due to State of Indiana 265,535,629 16,579,378 (282,115,007) - - Capital leases 900,730,275 282,115,007 (30,797,521) 1,152,047,761 14,730,389 (Discount)/premium (86,822) - 14,516 (72,306) - Net gain (loss) on refunding 974,569 15,351,201 (792,043) 15,533,727 -
$ 1,240,657,651 $ 314,045,586 $ (315,200,055) $ 1,239,503,182 $ 16,310,389

50
Capital Improvement Board of Managers (of Marion County, Indiana)
(A Component Unit of the Consolidated City of Indianapolis-Marion County)
Notes to Financial Statements
December 31, 2012 and 2011
Note 7: State and Local Taxes and Other Assistance
A summary of the various sources of state and local taxes and other assistance received by the CIB follows. These include certain Excise Taxes, PSDA Revenues, Ticket Fees and Specialty License Plate Fees.
Excise Taxes consist of the Marion County Innkeeper’s Tax, the Marion County Food and Beverage Tax, the Marion County Admissions Tax, the Marion County Supplemental Auto Rental Excise Tax, the Regional County Food and Beverage Tax and the Indiana Cigarette Tax, all of which are described in greater detail below.
Marion County Innkeeper’s Tax
Since 1997, a 6% Marion County Innkeeper’s Tax (the “Original Marion County Innkeeper’s Tax”) has been levied on every person engaged in the business of renting or furnishing, for periods of less than 30 days, any lodgings in any hotel, motel, inn, tourist camp, tourist cabin, or any other place in which lodgings are regularly furnished for a consideration. This tax is applied in addition to the Indiana Gross Retail and Use Taxes imposed under these circumstances. In accordance with IC 6-9-8 (as amended), one-sixth of the Innkeeper’s Tax of 6% is to be used solely to fund lease rental payments (Senior or Subordinate) or other obligations related to convention center expansion projects.
The Marion County Innkeeper’s Tax was increased in 2005 by an additional 3% (the “2005 Marion County Innkeeper’s Tax”) and again in 2009 (effective September 1, 2009) by an additional 1% (the “2009 Marion County Innkeeper’s Tax”).
Marion County Food and Beverage Tax
Since 1981, a 1% Marion County Food and Beverage Tax (the “Original Marion County Food and Beverage Tax”) has been imposed on the gross retail income received by a retail merchant from any transaction within Marion County in which food or beverage is furnished, prepared or served. However, it does not apply to transactions exempt from Indiana Gross Retail Tax, as defined under Indiana statutes.
The Marion County Food and Beverage Tax was increased in 2005 by an additional 1% (the “2005 Marion County Food and Beverage Tax”).

51
Capital Improvement Board of Managers (of Marion County, Indiana)
(A Component Unit of the Consolidated City of Indianapolis-Marion County)
Notes to Financial Statements
December 31, 2012 and 2011
Marion County Admissions Tax
Since 1997, a 5% Marion County Admissions Tax (the “Original Marion County Admissions Tax”) has been imposed on each person who pays a price of admission to certain events held in a facility financed in whole or in part by bonds or notes issued under IC 18-4-17 (before its repeal), IC 36-10-9 or IC 36-10-9.1. As stated in IC 6-9-13, the tax equals 5% of the price of admissions to such an event and is paid with the price of admission. Generally, events sponsored by educational, religious, political and charitable organizations are exempt.
The Marion County Admissions Tax was increased in 2005 by an additional 1% (the “2005 Marion County Admissions Tax”).
Marion County Supplemental Auto Rental Excise Tax
Since 1997, a 2% Marion County Supplemental Auto Rental Excise Tax (the “Original Marion County Supplemental Auto Rental Excise Tax”) has been imposed under IC 6-6-9.7 on the rental of certain passenger motor vehicles and trucks at a rate equal to 2% of the gross retail income received by a retail merchant for the rental. Certain exclusions apply.
The Marion County Supplemental Auto Rental Excise Tax was increased in 2005 by an additional 2% (the “2005 Marion County Supplemental Auto Rental Excise Tax”).
Regional County Food and Beverage Tax
In 2005, a 1% Regional County Food and Beverage Tax was established (the “2005 Regional County Food and Beverage Tax”) by six of the counties surrounding Marion County, those being Boone, Johnson, Hamilton, Hancock, Hendricks and Shelby. The food and beverage tax, equal to 1%, is imposed on the gross retail income resulting from any transaction in which food or beverage is furnished, prepared or served by a retail merchant for consideration and for consumption at a location, or on equipment, provided by the retail merchant, including transactions in which food or beverage is served by a retail merchant off its premises. This tax is in addition to the Indiana Gross Retail Tax.
As long as there are any obligations owed by the CIB to the ISCBA or any state agency under a lease or other agreement entered into between the CIB and the ISCBA or any state agency, the CIB receives one-half of the amounts received from the 1% Regional County Food and Beverage Tax up to annual maximum of $5 million.
52
Capital Improvement Board of Managers (of Marion County, Indiana)
(A Component Unit of the Consolidated City of Indianapolis-Marion County)
Notes to Financial Statements
December 31, 2012 and 2011
Indiana Cigarette Tax
IC 6-7 provides that the CIB shall receive $350,000 annually from receipts of the Indiana Cigarette Tax. This tax is levied on each person who first sells, uses, consumes, handles or distributes cigarettes. The rate of tax depends upon the weight of the cigarettes and also applies to all cigarette papers, wrappers or tubes made or prepared for the purpose of making cigarettes to be sold, exchanged, bartered, given away or otherwise disposed of within Indiana.
Original Excise Tax Revenues
The Original Marion County Innkeeper’s Tax, Original Marion County Food and Beverage Tax, Original Marion County Admissions Tax, Original Marion County Supplemental Auto Rental Excise Tax and the CIB’s Indiana Cigarette Tax receipts (collectively, the “Original Excise Tax Revenues”) are distributed to the CIB and are used to pay its outstanding obligations (other than those relating to LOS and the ICC Expansion) and otherwise further its operating purposes.
2005 New Tax Revenues
The 2005 Marion County Innkeeper’s Tax, 2005 Marion County Food and Beverage Tax, 2005 Marion County Admissions Tax, 2005 Marion County Supplemental Auto Rental Excise Tax and 2005 Regional County Food and Beverage Tax, and starting in 2028 following retirement of the previously outstanding lease and bond obligations of the CIB, certain of the CIB’s original state and local assistance tax revenues (collectively, the “2005 New Tax Revenues”), are to be distributed to the CIB and used to pay obligations relating to LOS and the ICC Expansion.
Professional Sports Development Area Revenues
Pursuant to IC 36-7-31, the Metropolitan Development Commission of the City of Indianapolis, Indiana, and of Marion County, Indiana (the “Commission”), may establish a professional sports development area which area may include any facility (a) used in the training of a team engaged in professional sports events, or (b) financed in whole or in part by notes or bonds issued by a political subdivision or issued under the CIB’s or the IFA’s enabling act and used to hold a professional sporting event. Certain state and local taxes generated in the area are allocated to a professional sports development area fund and can be used to finance the construction and equipping of a designated capital improvement used for a professional sporting event. The taxes which may be allocated to the PSDA Fund include the Indiana Gross Retail Tax, the Indiana Use Tax, the Indiana Adjusted Gross Income Tax imposed on an individual, the County Option Income Tax and the 2% Marion County Food and Beverage Tax as previously described (the “Covered Taxes”).
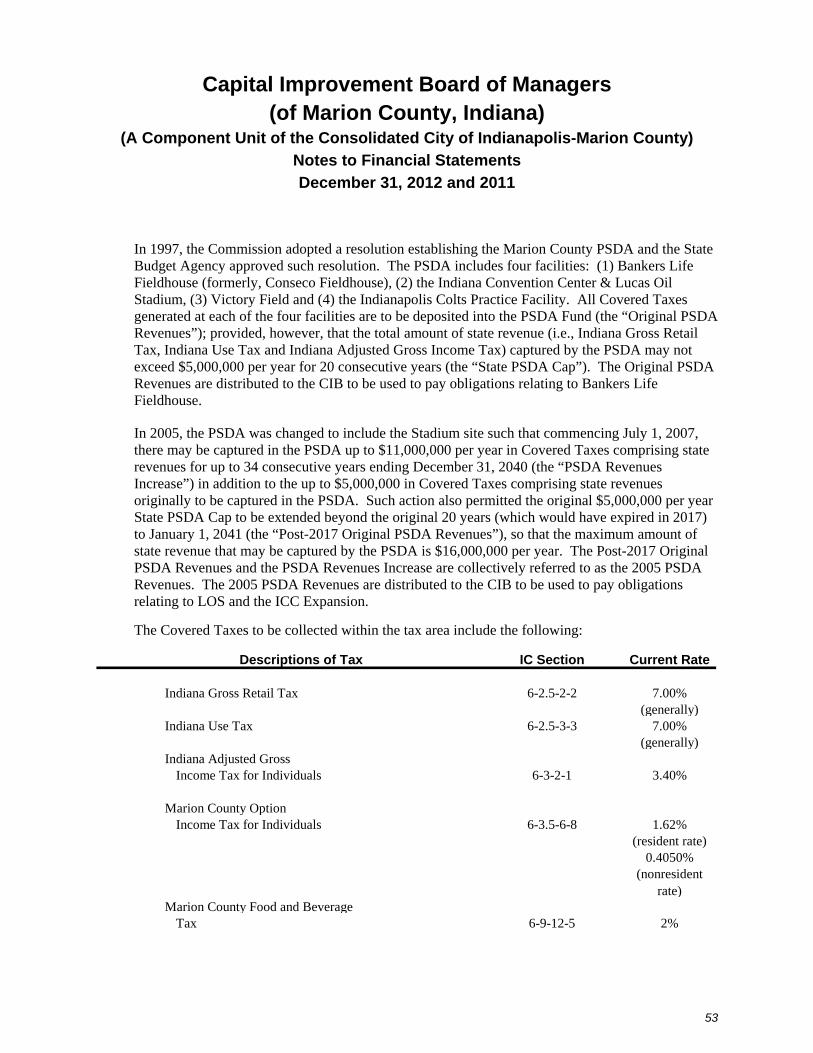
53
Capital Improvement Board of Managers (of Marion County, Indiana)
(A Component Unit of the Consolidated City of Indianapolis-Marion County)
Notes to Financial Statements
December 31, 2012 and 2011
In 1997, the Commission adopted a resolution establishing the Marion County PSDA and the State Budget Agency approved such resolution. The PSDA includes four facilities: (1) Bankers Life Fieldhouse (formerly, Conseco Fieldhouse), (2) the Indiana Convention Center & Lucas Oil Stadium, (3) Victory Field and (4) the Indianapolis Colts Practice Facility. All Covered Taxes generated at each of the four facilities are to be deposited into the PSDA Fund (the “Original PSDA Revenues”); provided, however, that the total amount of state revenue (i.e., Indiana Gross Retail Tax, Indiana Use Tax and Indiana Adjusted Gross Income Tax) captured by the PSDA may not exceed $5,000,000 per year for 20 consecutive years (the “State PSDA Cap”). The Original PSDA Revenues are distributed to the CIB to be used to pay obligations relating to Bankers Life Fieldhouse.
In 2005, the PSDA was changed to include the Stadium site such that commencing July 1, 2007, there may be captured in the PSDA up to $11,000,000 per year in Covered Taxes comprising state revenues for up to 34 consecutive years ending December 31, 2040 (the “PSDA Revenues Increase”) in addition to the up to $5,000,000 in Covered Taxes comprising state revenues originally to be captured in the PSDA. Such action also permitted the original $5,000,000 per year State PSDA Cap to be extended beyond the original 20 years (which would have expired in 2017) to January 1, 2041 (the “Post-2017 Original PSDA Revenues”), so that the maximum amount of state revenue that may be captured by the PSDA is $16,000,000 per year. The Post-2017 Original PSDA Revenues and the PSDA Revenues Increase are collectively referred to as the 2005 PSDA Revenues. The 2005 PSDA Revenues are distributed to the CIB to be used to pay obligations relating to LOS and the ICC Expansion.
The Covered Taxes to be collected within the tax area include the following:
Descriptions of Tax IC Section Current Rate
Indiana Gross Retail Tax 6-2.5-2-2 7.00%(generally)
Indiana Use Tax 6-2.5-3-3 7.00%(generally)
Indiana Adjusted GrossIncome Tax for Individuals 6-3-2-1 3.40%
Marion County Option Income Tax for Individuals 6-3.5-6-8 1.62%
(resident rate)0.4050%
(nonresident rate)
Marion County Food and BeverageTax 6-9-12-5 2%

54
Capital Improvement Board of Managers (of Marion County, Indiana)
(A Component Unit of the Consolidated City of Indianapolis-Marion County)
Notes to Financial Statements
December 31, 2012 and 2011
The Indiana Gross Retail Tax is imposed on all retail transactions made in Indiana. The person acquiring property in Indiana is liable for the tax, but retail merchants are responsible for collecting the tax. The Indiana Gross Retail Tax is imposed, at the time of sale, on the amount of gross retail income received by the retail merchant.
The Indiana Use Tax is imposed on the storage, use, or consumption of tangible personal property in Indiana. The Indiana Use Tax is similar to the Indiana Gross Retail Tax in that it is measured by the gross retail income received from a retail transaction and is computed using the same rates.
The Indiana Adjusted Gross Income Tax is imposed on both individuals (resident and nonresident) and corporations. The tax is applied to the adjusted gross income, as defined under Indiana statutes, of all resident individuals and to the part of the adjusted gross income derived from sources within Indiana of all nonresident individuals.
The Marion County Option Income Tax is imposed on the Indiana adjusted gross income of individual resident and nonresident county taxpayers of Marion County.
As noted previously, the Marion County Food and Beverage Tax is generally imposed on the gross retail income received by a retail merchant from any transaction within Marion County in which food or beverage is furnished, prepared or served.
The total amount of Indiana Gross Retail Tax, Indiana Use Tax and Indiana Adjusted Gross Income Tax for Individuals to be captured and deposited into the PSDA fund is limited. However, Marion County taxes are not limited.
In 2009, the Commission adopted a resolution expanding the Marion County PSDA and the State Budget Agency approved such resolution. The PSDA expansion related to the area in Indianapolis bounded on the east by Illinois Street, on the south by Maryland Street, and on the west and north by Washington Street, as those streets were located on June 1, 2009 (the “2009 Tax Area Addition”). The Commission resolution designates certain hotel, motel, or multi-brand complex of hotels and motels with significant meeting space that are located in the 2009 Tax Area Addition. By this designation and effective July 1, 2009, all Covered Taxes (except for Marion County Food and Beverage Taxes) generated from such hotel and motel facilities in the 2009 Tax Area Addition (the “2009 PSDA Revenues”) are captured and distributed to the CIB to be used to pay operating expenses of the CIB facilities; provided, however, that the total amount of state revenue (i.e., Indiana Gross Retail Tax, Indiana Use Tax and Indiana Adjusted Gross Income Tax) captured by the PSDA expansion may not exceed $8,000,000 per year. The 2009 Tax Area Addition designation expires December 31, 2040.

55
Capital Improvement Board of Managers (of Marion County, Indiana)
(A Component Unit of the Consolidated City of Indianapolis-Marion County)
Notes to Financial Statements
December 31, 2012 and 2011
2009 New Tax Revenues
The new 2009 Marion County Innkeeper’s Tax and 2009 PSDA Revenues (collectively, “the 2009 New Tax Revenues”), are to be distributed to the CIB and are restricted to paying operating expenses of the CIB facilities.
Specialty License Plate Fees
IC 9-18-49 permits the Indiana Bureau of Motor Vehicles to design and issue a National Football League franchised football team license plate as a specialty group recognition license plate (under IC 9-18-25), featuring the name and logo of the Indianapolis Colts. An annual fee of twenty dollars ($20) is charged for the license plate in addition to standard license plate fees and is collected by the Indiana Bureau of Motor Vehicles at the time the plate is sold.
Interlocal Agreement
In 2010, an Interlocal Cooperation Agreement was established pursuant to which the Metropolitan Development Commission of Marion County, Indiana, acting in its capacity as the Redevelopment Commission of the City of Indianapolis, Indiana (the “Redevelopment Commission”), provides $8,000,000 of funding annually to the CIB to further their mutual purposes, including to better assure the CIB’s funding sources for Visit Indy, Inc. Visit Indy, Inc. is an important body through which the convention and visitor industry and the commercial, industrial and cultural interests of Indianapolis and its citizens are promoted and publicized, including the CIB’s capital improvements. The CIB received $8,000,000 of funding in 2011 and 2012. The agreement renews annually and assumes the same terms and level of funding, subject to certain factors, including, the availability of funds, and unless either party gives a six-month termination notice prior to the end of the annual cycle.

56
Capital Improvement Board of Managers (of Marion County, Indiana)
(A Component Unit of the Consolidated City of Indianapolis-Marion County)
Notes to Financial Statements
December 31, 2012 and 2011
Summary of State and Local Taxes and Other Assistance
State and local taxes and other assistance received or accrued by the CIB in 2012 and 2011 include the following components:
2012 2011
Marion County food and beverage (1%) $ 21,363,190 $ 19,456,828 Innkeeper’s tax (5%) 22,594,512 20,058,708 Innkeeper’s tax (1%) 4,518,902 4,011,742 Auto rental excise tax (2%) 2,349,515 2,051,253 Admissions tax (5%) 6,537,019 4,944,580 Cigarette tax 350,000 350,000 PSDA tax allocation 7,212,774 7,691,826
Total Original Excise Taxes and Original PSDA Revenues 64,925,912 58,564,937
Marion County food and beverage (1%) 21,363,190 19,456,828 Regional food and beverage (.5%) 5,193,634 5,387,617 Innkeeper’s tax (3%) 13,556,707 12,035,225 Auto rental excise tax (2%) 2,349,515 2,051,253 Admissions tax (1%) 1,307,404 988,916 PSDA tax allocation 8,544,320 7,444,361
Total 2005 New Tax Revenues and 2005 PSDA Revenues 52,314,770 47,364,200
Innkeeper’s tax (1%) 4,518,902 4,011,742 PSDA tax allocation 8,270,978 9,959,285
Total 2009 New Tax Revenues and 2009 PSDA Revenues 12,789,880 13,971,027
Specialty License Plate Fees 745,860 896,960
Interlocal Agreement funding 8,000,000 8,000,000
Total state and local taxes and other assistance $ 138,776,422 $ 128,797,124
Total lease rental and other debt obligations paid with state and local taxes and fees for the years ended December 31, 2012 and 2011 amounted to $65,549,867 and $67,855,360, respectively.
Subsequent to year end, the Original Marion County Admissions Tax was increased by 4% and the Original Marion County Supplemental Auto Rental Excise Tax was increased by 2%. Both increases become effective on March 1, 2013. The CIB will pay to the Consolidated City of Indianapolis-Marion County, Office of Finance and Management (OFM), 100% of the revenue from these increases for the first twelve months the increases are in effect. After the initial twelve month period, the CIB will pay to the OFM 25% of the revenue from these increases, provided the total payments shall not exceed $3,000,000.

57
Capital Improvement Board of Managers (of Marion County, Indiana)
(A Component Unit of the Consolidated City of Indianapolis-Marion County)
Notes to Financial Statements
December 31, 2012 and 2011
Note 8: Agreements With the Pacers Basketball, LLC
During 1997, the CIB approved new Operating and Financial Agreements with Pacers Basketball, LLC (“Operator” or “Pacers”) that, among other things, govern the use of Bankers Life Fieldhouse. The agreements cover a twenty-year initial term, commencing in 1999, with ten five-year extension options. The Operator will receive revenues from Fieldhouse operations, naming rights, signage, advertising and broadcast revenues. The CIB is responsible for major repairs on the facility, while the Operator is responsible for making daily repairs to keep the facility operational. The sale of a controlling interest in the Indiana Pacers is subject to the CIB’s first right of refusal.
The Financial Agreement provides for targeted profitability for the Operator. If this target is not reached, the CIB will reimburse certain operating expenses. In addition, the Operator remains obligated, upon early termination of the Financial Agreement, to repay the CIB for advances made through 1999 for utility and maintenance costs of the CIB’s previous arena facility, Market Square Arena. At the conclusion of each NBA Season during the initial twenty-year term of the Financial Agreement, five percent of the cumulative advances are to be forgiven. At December 31, 2012, the outstanding balance of cumulative advances aggregates $10,646,400. The Financial Agreement may be terminated after ten years (but only if the CIB does not exercise its right of first refusal and if the Operator has experienced a defined level of losses), and the Operator must pay a mutually agreed-upon termination fee.
In 2012 and 2010, the CIB, MCCRFA and the Operator entered into amendments to the Operating Agreement which provided various amendatory and additional covenants, including that the Operator shall have no right to terminate the Operating Agreement prior to June 30, 2014. Under these amendments, the CIB agreed to provide three $10,000,000 noninterest-bearing operating loans to the Pacers on the following dates: July 16, 2010; January 15, 2011; and January 15, 2012; as well as two $5,000,000 noninterest-bearing loans on or before December 31, 2012 and April 30, 2013. The loans are subject to certain approval, repayment and forgiveness provisions. The CIB’s note receivable balance from the Pacers at December 31, 2012 and 2011 was $35,000,000 and $20,000,000, respectively. The amendments also provided that the CIB shall make capital improvements to Bankers Life Fieldhouse of an amount not to exceed $3,500,000. These improvements were all completed by December 31, 2012.
Note 9: Lease Agreement With the Indianapolis Colts
In 1984, the CIB entered into a long-term lease agreement with the Colts requiring its home NFL football games to be played in the CIB’s former domed stadium facility. The agreement was amended several times and subsequently terminated in 2005.

58
Capital Improvement Board of Managers (of Marion County, Indiana)
(A Component Unit of the Consolidated City of Indianapolis-Marion County)
Notes to Financial Statements
December 31, 2012 and 2011
Effective September 1, 2005, the CIB and the Colts entered into a new lease agreement (the “New Colts Agreement”). Under the New Colts Lease Agreement, the CIB is to receive $250,000 annually from the Colts during the term of the agreement, provided that the Colts play at least ten pre-season, regular season or post-season games in Lucas Oil Stadium. If the Colts do not play at least ten games in the Stadium in any given NFL season, the annual rent will be reduced by $25,000 for each game below the ten-game minimum that is not played in Lucas Oil Stadium. Also, the Colts agreed to reimburse the CIB for any Day-of-Game Personnel Expenses (as defined in the New Colts Lease Agreement). The CIB, in turn, agreed to reimburse the Colts for all ordinary and reasonable Day-of-Game Expenses (as defined in the New Colts Lease Agreement). The CIB also agreed to pay the Colts $3,500,000 of annual revenues from Non-Colts Events (as defined in the New Colts Lease Agreement) held at the Stadium. The New Colts Lease Agreement expires on August 31, 2038. However, in the event the Colts are not among the top five NFL teams in total gross operating revenues for the 2030 fiscal year, the Colts have the right to terminate the lease without cause at their sole discretion effective as of August 31, 2035.
Contractual Undertaking
During 2007, the Colts undertook a $34,000,000 loan through the NFL’s G-3 program and a $66,000,000 loan through a series of transactions involving fixed rate bonds issued by the City of Indianapolis (the “City’s Colts Loan”) and the Bond Bank to finance its commitment. To secure the Bond Bank’s bonds issued as part of the City’s Colts Loan, the CIB entered into a contractual undertaking, secured by a subordinate pledge on certain Original Excise Tax Revenues and the Indiana Cigarette Tax Revenues of the CIB, which would require payments to the Bond Bank by the CIB if the Colts fail to timely repay the City’s Colts Loan. The Colts are obligated to pay the City’s Colts Loan with interest such that no payments are anticipated on such contractual undertaking by the CIB.
Note 10: Baseball Facility
In 1994, the CIB entered into an agreement to lease (“Ground Lease”) certain real estate from the Indiana White River State Park Development Commission (“WRSP”), a State agency. The CIB constructed Victory Field, a professional baseball facility, on this land. The initial lease period of the Ground Lease commenced December 1, 1994, and expires March 31, 2016. The Ground Lease allows for lease extensions provided, among other conditions, such extensions, combined with the initial lease period, do not exceed 99 years. Upon expiration or termination of the Ground Lease, any facilities constructed on the land revert to WRSP.

59
Capital Improvement Board of Managers (of Marion County, Indiana)
(A Component Unit of the Consolidated City of Indianapolis-Marion County)
Notes to Financial Statements
December 31, 2012 and 2011
Under the Ground Lease and a related agreement, the CIB agreed to provide for the construction of the baseball facility and to sublease the facility to the Indianapolis Indians, Inc., a minor league baseball franchise. Victory Field was completed in 1996. To fund a portion of the cost of Victory Field, MCCRFA issued its Excise Taxes Lease Rental Revenue Bonds, Series 1995A. Such bonds are payable primarily from rental payments to be made by the CIB under a separate financing lease, dated June 1, 1995, referred to as the Second Amendment to Master Lease Agreement, between the CIB and MCCRFA. This lease is currently in effect and ends on the sooner of March 31, 2016 or the June 1 or December 1 next following payment of such bonds. Upon payment of the bonds, MCCRFA’s rights in Victory Field will be transferred to the CIB.
Future minimum sublease payments due from the Indians at December 31, 2012 are as follows:
Fixed AdditionalRentals Rentals Total
2013 $ 500,000 $ 50,000 $ 550,000 2014 500,000 50,000 550,000 2015 500,000 50,000 550,000
$ 1,500,000 $ 150,000 $ 1,650,000
Additional rentals represent amounts to be set aside in the Baseball Park Capital Improvement Fund for future maintenance of the facility.
Note 11: Hudnut Commons (formerly, Capitol Commons)
The CIB and the City entered into agreements with developers in 1986 to construct and operate the Hudnut Commons (an open, public landscaped area), a parking facility beneath the Hudnut Commons and a convention hotel. The construction of the Hudnut Commons was funded by $6,300,000 of private grants. The developers funded construction of the underground parking facility and the hotel. In 1988, the CIB obtained a leasehold interest in the garage and thereupon became the lessor in a long-term lease arrangement for the operation of the garage facility.

60
Capital Improvement Board of Managers (of Marion County, Indiana)
(A Component Unit of the Consolidated City of Indianapolis-Marion County)
Notes to Financial Statements
December 31, 2012 and 2011
During 2004, the CIB, in conjunction with the City, determined that it was in the best interests of the City and Marion County, to allow for the construction of a new, high-rise, corporate headquarters facility on a portion of the existing Hudnut Commons site. The CIB entered into a Joint Development Agreement with the Department of Metropolitan Development of the Consolidated City of Indianapolis-Marion County (“DMD”) and an internationally known retail mall developer that generally provides the framework for various ancillary agreements governing the ownership, use and operation of the Hudnut Commons site and its associated underground parking garage. In short, the various other agreements govern the transfer from the CIB to DMD of certain rights and interests related to the Hudnut Commons surface improvements and all air rights above the surface of such property, together with approximately one-half of the underground Hudnut Commons parking garage.
The CIB generally retains responsibility for one-third of all operating costs associated with the maintenance of the entire garage and for any necessary capital improvements to the Hudnut Commons site and one-half of the parking garage transferred to DMD. These responsibilities are more fully described in a separate Operating Agreement between the CIB and DMD and in the Second Amendment and Restatement of Lease between the CIB and the garage tenant and operator. Both of these agreements have a term of 99 years, ending in 2103. In return for accepting these responsibilities, the CIB continues to receive a portion of all rental payments and/or Monthly Parking Allowance Payments, as defined in the agreements.
Note 12: Risk Management
The CIB is exposed to various risks of loss related to theft of, damage to and destruction of assets, as well as torts and natural disasters. The CIB purchases commercial insurance policies for such risks of loss. Certain of these policies allow for deductibles, which range from $250 to $250,000 per occurrence. Settled claims have not exceeded this commercial coverage in any of the past three years.
61
Capital Improvement Board of Managers (of Marion County, Indiana)
(A Component Unit of the Consolidated City of Indianapolis-Marion County)
Notes to Financial Statements
December 31, 2012 and 2011
Note 13: Pension Plan
Plan Description
The CIB contributes to the Public Employees’ Retirement Fund of Indiana (“PERF”), established in accordance with Indiana statutes (I.C.5-10.3-2-1). PERF is an agent multiple-employer public employee retirement system that acts as a common investment and administrative agent for units of state and local government in Indiana. The authority to establish or amend benefit provisions of PERF rests with the Indiana General Assembly. However, obligations to contribute to the plan are determined by the board of PERF in accordance with actuarial methods. PERF issues a publicly available financial report that includes financial statements and required supplementary information for the plan. This report may be obtained by writing to: Indiana Public Retirement System, One North Capitol, Suite 001, Indianapolis, Indiana, 46204, or by calling 888-526-1687. Substantially all of the CIB’s full-time employees are covered by the plan. The following disclosures represent the most current and available information on the plan through the June 30, 2012 actuarial valuation.
Retirement benefits vest after 10 years of service. Normal retirement is defined as the earliest of: (1) age 65 with 10 years of vesting service; (2) age 60 with 15 years of vesting service; or (3) the sum of age and vesting service equal to 85, but not earlier than age 55. A reduced benefit will be received if an employee takes early retirement between ages 50 and 65 and has had 15 or more years of vesting service. Employees may either elect to receive a lump-sum distribution of their annuity savings account balance upon retirement or receive an annuity amount as a monthly supplement to the retirement benefits described above. PERF also provides death and disability benefits. These benefit provisions and all other requirements are established by state statute and county ordinance.
Funding Policy
The CIB contributes an actuarially determined percentage (8.25% for calendar year 2012) of employee payroll to the plan. Required contributions are communicated to the CIB annually by the PERF board and are effective January 1 of each year. This component represents the employer contribution required under the plan. Employees are required to contribute 3.00% of their annual salary to an annuity savings account, as prescribed by Indiana statutes. The CIB contributes the 3.00% for its participating salaried employees. Accumulated employee contributions and allocated interest income are maintained by PERF in a separate system-wide fund for all members. An employee who leaves employment before qualifying for benefits receives a refund of his or her savings account.

62
Capital Improvement Board of Managers (of Marion County, Indiana)
(A Component Unit of the Consolidated City of Indianapolis-Marion County)
Notes to Financial Statements
December 31, 2012 and 2011
Annual Pension Cost and Net Pension Obligation
For calendar year 2012, the CIB’s annual pension cost of $975,205 for the plan was equal to the CIB’s required and actual contributions. Required contributions are determined as part of annual June 30 actuarial valuations using the entry age normal actuarial cost method. The actuarial assumptions used for the June 30, 2012 actuarial valuation included: (a) 6.75% investment rate of return (net of administrative expenses), (b) 3.25%-4.5% projected salary increases, based upon PERF experience between 2005 and 2010, (c) 1.0% per year cost-of-living adjustments, and (d) 3.0% inflation rate per year. The actuarial value of the plan’s assets is determined using techniques that smooth the effects of short-term volatility in the market value of investments over a four-year period with a 20% corridor. Effective July 1, 1997, the plan’s unfunded actuarial accrued liability is being amortized as a level percentage of projected payroll on an open basis over 30 years.
The following is a schedule of the net pension obligation (“NPO”) for the CIB at December 31, 2012:
Net Pension Obligation (NPO)
Annual Required Contribution ("ARC") $ 776,223 Interest on NPO 24,429 Adjustment to the ARC (28,123)Annual Pension Cost 772,529 Contributions made 635,684 Increase in NPO 136,845 NPO, beginning of year 348,984
NPO, end of year $ 485,829
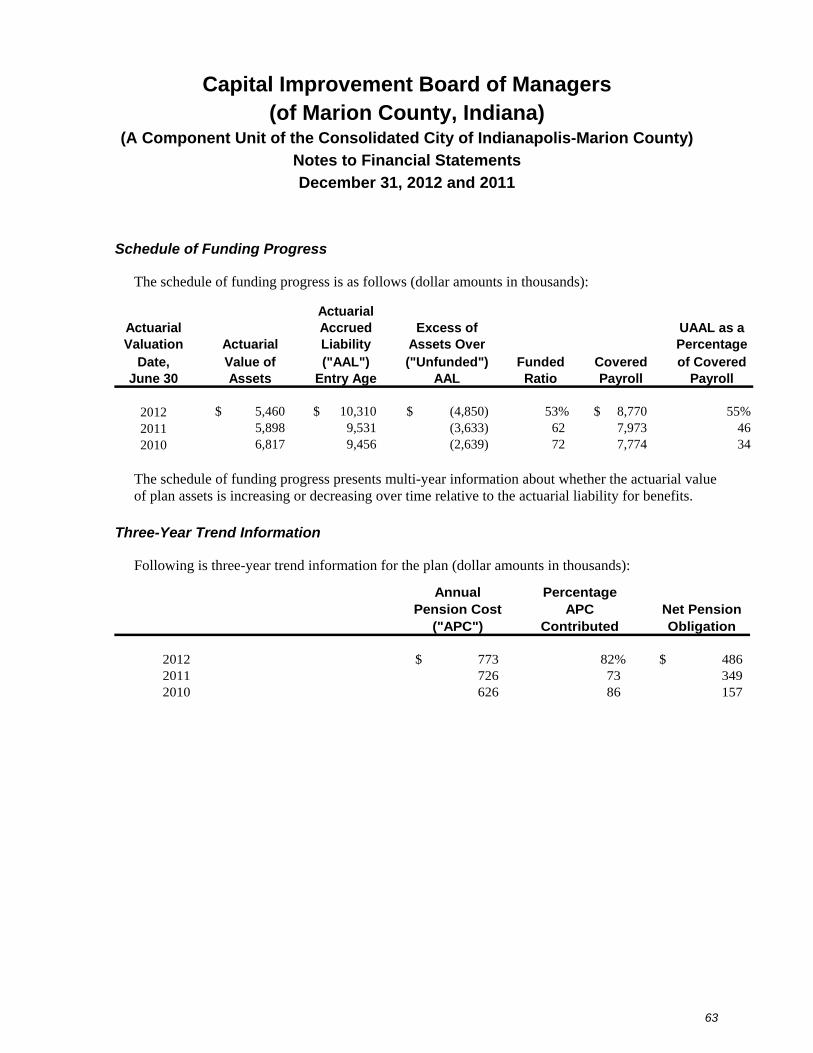
63
Capital Improvement Board of Managers (of Marion County, Indiana)
(A Component Unit of the Consolidated City of Indianapolis-Marion County)
Notes to Financial Statements
December 31, 2012 and 2011
Schedule of Funding Progress
The schedule of funding progress is as follows (dollar amounts in thousands):
ActuarialActuarial Accrued Excess of UAAL as aValuation Actuarial Liability Assets Over Percentage
Date, Value of ("AAL") ("Unfunded") Funded Covered of CoveredJune 30 Assets Entry Age AAL Ratio Payroll Payroll
2012 $ 5,460 $ 10,310 $ (4,850) 53% $ 8,770 55%2011 5,898 9,531 (3,633) 62 7,973 462010 6,817 9,456 (2,639) 72 7,774 34
The schedule of funding progress presents multi-year information about whether the actuarial value of plan assets is increasing or decreasing over time relative to the actuarial liability for benefits.
Three-Year Trend Information
Following is three-year trend information for the plan (dollar amounts in thousands):
2012 $ 773 82% $ 486 2011 726 73 349 2010 626 86 157
Annual Pension Cost
("APC")
Percentage APC
ContributedNet Pension Obligation

64
Capital Improvement Board of Managers (of Marion County, Indiana)
(A Component Unit of the Consolidated City of Indianapolis-Marion County)
Notes to Financial Statements
December 31, 2012 and 2011
Note 14: Commitments and Contingencies
Visit Indy, Inc. (formerly, Indianapolis Convention & Visitors Association)
In return for its assistance in attracting users to the Indiana Convention Center & Lucas Oil Stadium, the CIB has agreed to compensate Visit Indy, Inc. (“Visit Indy”) annually in the form of a base amount, plus a quarterly incentive fee. The total payments to be made to Visit Indy in any year cannot exceed 40% of the 5% Marion County Innkeeper’s Tax received by the CIB in the preceding tax year. For the year ended December 31, 2010, the City-Council approved an additional transfer from budgeted capital outlays of the CIB which provided for a total of $9,030,000 in funding for Visit Indy. The CIB agreed to continue to compensate Visit Indy at the $9,030,000 level for both 2011 and 2012; therefore, allowing for funding in excess of the not to exceed percentage referred to above.
The term of CIB’s agreement with Visit Indy was set to expire on December 31, 2012, unless further extended. In December 2012, the CIB and Visit Indy agreed to extend the term of the agreement until December 31, 2014 and thereby continue to provide base compensation in the amount of $9,030,000 in 2013 and 2014. In addition, the CIB contributed $3,000,000 to Visit Indy in December 2012, portions of which may be credited against the base compensation or refunded to the CIB in 2013 or 2014, respectively, if certain conditions are not met by Visit Indy. This contribution is recorded as an asset at December 31, 2012, and will be recorded as contribution expense as eligibility requirements are satisfied by Visit Indy.
As mentioned previously in these notes, the CIB has also entered into an Interlocal Agreement with the Department of Metropolitan Development of the City of Indianapolis and Marion County. This agreement provides $8,000,000 of annual assistance that will be used to fund the CIB’s payments to Visit Indy.
Litigation
The CIB is involved in certain litigation which is considered by management to be incidental to the conduct of CIB operations. In the opinion of management, the ultimate outcome of these matters, in the aggregate, is not currently expected to have a materially adverse effect upon the financial position, changes in financial position and cash flows of the CIB.

Other Supplementary Information

65
Capital Improvement Board of Managers (of Marion County, Indiana)
(A Component Unit of the Consolidated City of Indianapolis of Marion County) Balance Sheet Information
December 31, 2012
Capital Capital
Improvement ImprovementFund Bond Fund Total
AssetsCurrent Assets
UnrestrictedCash and cash equivalents $ 83,262,215 $ 1,811,832 $ 85,074,047 Cash equivalents held with fiscal agent - 9,652,034 9,652,034 Accounts receivable 7,223,964 11,291 7,235,255 Inventories 53,946 - 53,946 Prepaid expenses and other 1,980,832 - 1,980,832
Total unrestricted assets 92,520,957 11,475,157 103,996,114
Restricted AssetsCash and cash equivalents 10,614,932 - 10,614,932 Cash equivalents held with fiscal agent - 51,310,164 51,310,164 Interest receivable - 72 72 Receivable from State of Indiana 2,306,914 21,129,174 23,436,088
Total restricted assets 12,921,846 72,439,410 85,361,256 Total current assets 105,442,803 83,914,567 189,357,370
Noncurrent AssetsDeferred debt issuance costs - 123,486 123,486 Note receivable 35,000,000 - 35,000,000 Nondepreciable capital assets 131,608,147 - 131,608,147 Depreciable capital assets, net 1,137,916,812 - 1,137,916,812 Other assets 1,500,000 - 1,500,000
Total noncurrent assets 1,306,024,959 123,486 1,306,148,445
Total assets $ 1,411,467,762 $ 84,038,053 $ 1,495,505,815
Liabilities and Net PositionCurrent Liabilities
Payable From Unrestricted AssetsAccounts payable $ 5,777,043 $ - $ 5,777,043 Unearned revenue 263,796 - 263,796 Accrued expenses and withholdings 671,513 - 671,513 Accrued interest payable - 55,058 55,058
Total current liabilities payable from unrestricted assets 6,712,352 55,058 6,767,410
Payable From Restricted AssetsFunds held for others - box office 2,980,817 - 2,980,817 Rental deposits 2,064,464 - 2,064,464 Accrued interest payable - 1,183,490 1,183,490 Current portion of long-term debt - 22,817,171 22,817,171
Total current liabilities payable from restricted assets 5,045,281 24,000,661 29,045,942 Total current liabilities 11,757,633 24,055,719 35,813,352
Noncurrent LiabilitiesBonds and notes payable - 68,700,076 68,700,076 Capital lease payable - 1,134,174,469 1,134,174,469 Net pension obligation 485,829 - 485,829
Total noncurrent liabilities 485,829 1,202,874,545 1,203,360,374 Total liabilities 12,243,462 1,226,930,264 1,239,173,726
Net PositionNet investment in capital assets 1,269,524,959 (1,173,932,716) 95,592,243 Restricted 7,876,565 72,439,410 80,315,975 Unrestricted 121,822,776 (41,398,905) 80,423,871
Total net position 1,399,224,300 (1,142,892,211) 256,332,089
Total liabilities and net position $ 1,411,467,762 $ 84,038,053 $ 1,495,505,815

66
Capital Improvement Board of Managers (of Marion County, Indiana)
(A Component Unit of the Consolidated City of Indianapolis-Marion County)
Analysis of Revenues, Expenses and Changes in Net Position
Year Ended December 31, 2012
Capital Capital
Improvement ImprovementFund Bond Fund Total
Operating Revenues
Rental income $ 8,550,211 $ - $ 8,550,211
Food service and concession commissions 3,970,814 - 3,970,814
Parking lot income 1,430,227 - 1,430,227
Labor reimbursements 14,088,686 - 14,088,686
Other operating income 1,056,423 - 1,056,423
29,096,361 - 29,096,361
Operating Expenses
Salaries and wages 15,457,602 - 15,457,602
Fringe benefits 3,563,643 - 3,563,643
Utilities 5,398,935 - 5,398,935
Repairs and maintenance 4,363,607 - 4,363,607
Insurance 1,515,684 - 1,515,684
Security 2,629,337 - 2,629,337
Nondepreciable equipment, parts and supplies 3,886,055 - 3,886,055
Other 9,325,541 - 9,325,541
Depreciation and amortization 40,413,230 - 40,413,230
86,553,634 - 86,553,634
Operating Loss (57,457,273) - (57,457,273)
Nonoperating Revenues (Expenses)
Investment income 300,225 36,706 336,931
State and local taxes and other assistance 20,789,880 117,986,542 138,776,422
Interest expense - (51,007,964) (51,007,964)
Compensation to Visit Indy, Inc. (9,105,000) - (9,105,000)
Inducements/revenue sharing to Indianapolis Colts (3,500,000) - (3,500,000)
Indianapolis Colts’ Day-of-Game expenses (1,700,000) - (1,700,000)
Grants to other organizations (450,000) - (450,000)
Loss on sale/disposal of capital assets (127,086) - (127,086)
Other 102,990 - 102,990
6,311,009 67,015,284 73,326,293
Increase (Decrease) in Net Position Before Capital
Contributions (51,146,264) 67,015,284 15,869,020
Capital Contributions 812,137 - 812,137
Increase (Decrease) in Net Position (50,334,127) 67,015,284 16,681,157
Net Position, Beginning of Year 1,407,851,027 (1,168,200,095) 239,650,932
Transfers from bond fund 41,707,400 (41,707,400) -
Net Position, End of Year $ 1,399,224,300 $ (1,142,892,211) $ 256,332,089

67
Capital Improvement Board of Managers (of Marion County, Indiana)
(A Component Unit of the Consolidated City of Indianapolis-Marion County)
Analysis of Certain Operating Expenses
Years Ended December 31, 2012 and 2011
2012 2011
Salaries and WagesAdministration $ 942,088 $ 851,260 Office 1,855,990 1,716,600 Supervision 1,021,804 870,357 Mechanical 3,496,514 3,322,489 Service 1,600,630 1,532,597 Temporary 6,540,576 4,516,265
$ 15,457,602 $ 12,809,568
Fringe BenefitsSocial security taxes $ 959,604 $ 795,690 Public employees' retirement fund 975,205 869,802 Employees' insurance 1,019,669 1,163,790 State unemployment taxes 88,077 79,591 Workers' compensation 174,997 82,068 Other 346,091 196,217
$ 3,563,643 $ 3,187,158
UtilitiesElectricity $ 2,190,116 $ 2,167,817 Steam 906,693 932,985 Chilled water 1,962,257 1,830,865 Water and sewer 313,794 463,367 Gas 26,075 32,872
$ 5,398,935 $ 5,427,906
Repairs and MaintenanceControl systems maintenance contract $ 82,640 $ 104,738 Elevator and escalator maintenance contract 217,121 178,592 Computer maintenance contracts 146,883 165,273 Major repairs 3,199,700 1,598,269 Grounds maintenance 207,727 171,962 Fire extinguisher system 91,549 18,965 Sprinkler system 3,004 3,331 Trash removal 81,421 62,467 Communication repairs 130,142 54,584 LOS maintenance contracts 203,420 223,878
$ 4,363,607 $ 2,582,059

68
Capital Improvement Board of Managers (of Marion County, Indiana)
(A Component Unit of the Consolidated City of Indianapolis-Marion County)
Analysis of Certain Operating Expenses (Continued)
Years Ended December 31, 2012 and 2011
2012 2011
InsuranceFire and extended coverage $ 894,221 $ 821,071 Public liability 548,523 353,184 Fidelity bond 72,940 72,607
$ 1,515,684 $ 1,246,862
SecuritySecurity staff $ 2,629,337 $ 2,799,552
Nondepreciable Equipment, Parts and Supplies $ 3,886,055 $ 4,862,951
OtherAdvertising and promotion $ 325,271 $ 977,776 Telephone 79,848 115,449 Legal fees 940,552 1,198,183 Accounting and audit fees 83,352 91,842 Consulting fees 224,495 377,745 Architects and engineers 282,853 141,559 Equipment rental 476,725 437,485 Postage 9,236 10,631 Travel 17,951 21,812 Dues and subscriptions 6,130 5,455 Bad debts 267 2,880 Suite cable service 4,862 4,033 Medical services - Indianapolis Colts games 58,726 80,854 Parking 229,333 223,908 Set-up/installation and dismantling fees 2,777,679 2,354,361 Miscellaneous 3,808,261 165,434
$ 9,325,541 $ 6,209,407
Statistical Section (Unaudited)
This section of the CIB's comprehensive annual financial report presents detailed, contextual information and data to assist the reader in understanding what the information contained in the financial statements, note disclosures and supplementary information says about the CIB's overall financial health. Contents Pages
Financial Trends These schedules contain trend information to help the reader understand how the CIB's financial performance and well-being have changed over time. 69-74
Revenue Capacity These schedules contain information to help the reader assess the CIB's most significant own-source revenues. 75-79
Debt Capacity These schedules present information to help the reader assess the affordability of the CIB's current levels of outstanding debt and the CIB's ability to issue additional debt in the future. 80-85
Demographic and Economic Information These schedules offer demographic and economic indicators to help the reader understand the socioeconomic environment within which the CIB's financial activities take place and to facilitate comparisons of financial statement information over time and among governments. 86-87
Operating Information These schedules contain operational and infrastructure data to help the reader understand how the information in the CIB's financial report relates to the services the CIB provides and the activities it performs. 88-90
Sources: Unless otherwise noted, the information in these schedules is derived from the comprehensive annual financial reports for the relevant year.
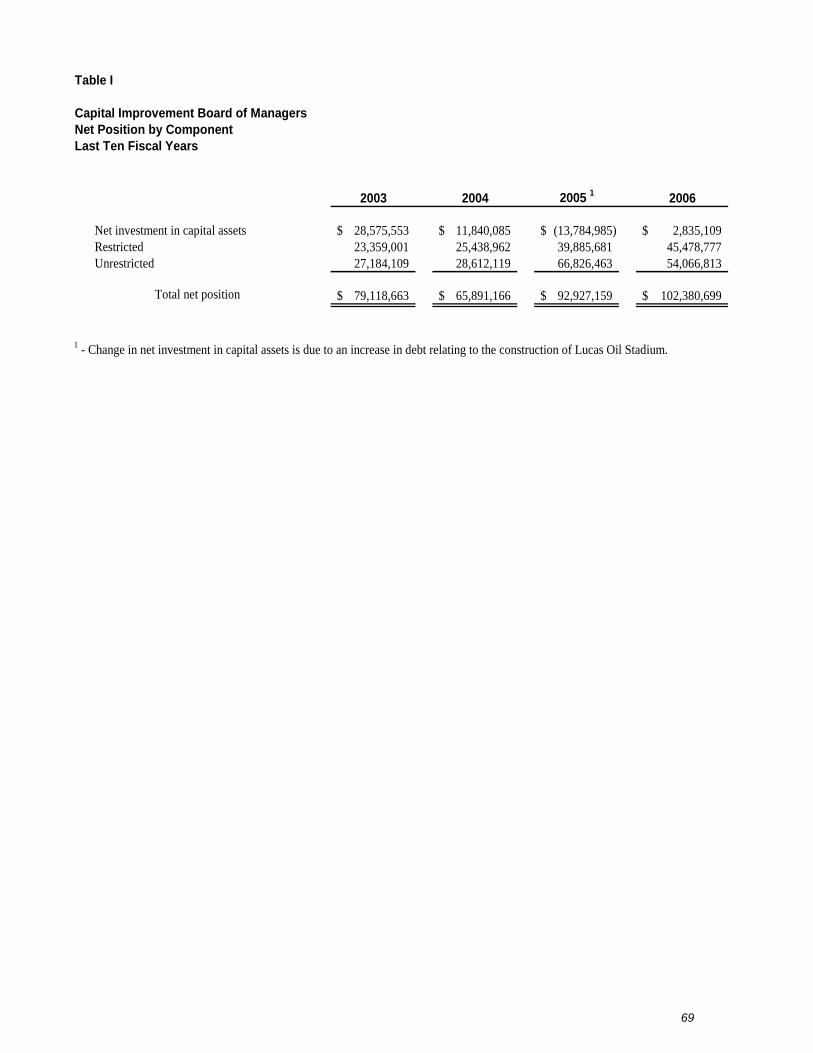
69
Table I
Capital Improvement Board of ManagersNet Position by ComponentLast Ten Fiscal Years
2003 2004 2005 1 2006
Net investment in capital assets 28,575,553$ 11,840,085$ (13,784,985)$ 2,835,109$ Restricted 23,359,001 25,438,962 39,885,681 45,478,777 Unrestricted 27,184,109 28,612,119 66,826,463 54,066,813
Total net position 79,118,663$ 65,891,166$ 92,927,159$ 102,380,699$
1 - Change in net investment in capital assets is due to an increase in debt relating to the construction of Lucas Oil Stadium.

70
2007 2008 2009 2010 2011 2012
23,170,426$ 147,019,581$ 134,281,780$ 118,659,477$ 116,153,760$ 95,592,243$ 52,270,165 56,831,449 69,703,922 66,208,915 77,675,379 80,315,975 35,442,304 (6,523,360) 3,985,965 24,487,590 45,821,793 80,423,871
110,882,895$ 197,327,670$ 207,971,667$ 209,355,982$ 239,650,932$ 256,332,089$

71
Table II
Capital Improvement Board of ManagersChanges in Net PositionLast Ten Fiscal Years
2003 2004 2005 2006
Operating revenues Rental income $ 6,259,493 $ 6,262,680 $ 5,839,044 $ 5,688,825
Food service and concession commissions 4,797,408 5,421,935 5,570,544 6,145,493 Parking lot income 805,680 750,267 359,422 417,013 Labor reimbursements 4,389,283 6,003,993 6,236,543 5,118,373 Advertising income 1,150,000 1,200,000 1,220,620 1,165,194 Other 861,817 867,313 1,653,322 982,432
Total operating revenues 18,263,681 20,506,188 20,879,495 19,517,330
Nonoperating revenues Investment income 643,808 852,243 1,982,455 3,747,243 State and local taxes and other assistance 48,074,416 51,301,827 65,295,285 93,512,062 Gain (loss) on sale/disposal of capital assets - - 40,419,560 15,318 Other 1,535,464 1,360,740 1,623,547 4,586,582
Total nonoperating revenues 50,253,688 53,514,810 109,320,847 101,861,205 Total Revenues 68,517,369 74,020,998 130,200,342 121,378,535
Operating expenses Salaries, wages and fringe benefits 12,520,287 13,880,615 14,696,686 13,563,112 Utilities 3,680,176 3,996,614 3,966,307 4,016,331 Repairs, maintenance, equipment, parts and supplies 2,077,979 4,554,102 2,448,289 2,115,986 Insurance 1,602,079 1,616,923 1,233,739 1,088,082 Security 1,027,228 1,017,292 1,099,567 1,372,344 Other 2,866,421 1,299,425 4,887,005 4,316,574 Depreciation and amortization 16,355,382 16,067,976 29,529,972 29,551,039
Total operating expenses 40,129,552 42,432,947 57,861,565 56,023,468
Nonoperating expenses Interest expense 20,368,132 21,344,759 21,137,501 20,711,441 Additional rental payment for swap termination - - - - Compensation to Visit Indy, Inc. 6,137,891 6,354,407 6,726,445 7,052,924 Payments to Indianapolis Colts 4,951,712 5,222,915 5,838,335 5,993,335 Grants to other organizations 3,143,197 3,284,584 5,882,975 3,601,582 Contribution of Hudnut Commons - 7,178,227 - - Other 1,443,715 1,442,623 5,717,528 18,542,245
Total nonoperating expenses 36,044,647 44,827,515 45,302,784 55,901,527 Total Expenses 76,174,199 87,260,462 103,164,349 111,924,995
Capital Contributions 10,452 11,967 - -
Increase (Decrease) in Net Position $ (7,646,378) $ (13,227,497) $ 27,035,993 $ 9,453,540

72
2007 2008 2009 2010 2011 2012
$ 6,354,696 $ 6,326,285 $ 6,791,593 $ 6,313,472 $ 9,059,609 $ 8,550,211 6,675,775 3,677,833 4,532,348 3,070,691 4,751,669 3,970,814 411,846 664,680 1,313,711 1,498,870 1,008,637 1,430,227 6,033,689 8,557,650 7,892,040 7,780,220 11,052,122 14,088,686 1,300,477 - - - - - 1,047,026 603,098 746,845 413,886 1,486,114 1,056,423 21,823,509 19,829,546 21,276,537 19,077,139 27,358,151 29,096,361
4,270,088 2,106,780 407,443 207,154 240,385 336,931 98,782,093 106,867,838 101,434,649 120,583,069 128,797,124 138,776,422 (28,588) 17,598 - 11,028 (1,059,636) (127,086) 1,206,312 319,170 72,774 80,746 88,709 102,990 104,229,905 109,311,386 101,914,866 120,881,997 128,066,582 139,089,257 126,053,414 129,140,932 123,191,403 139,959,136 155,424,733 168,185,618
13,849,005 16,544,495 14,530,703 13,224,267 15,996,726 19,021,245 4,259,820 5,278,056 5,441,608 5,414,506 5,427,906 5,398,935 1,918,641 1,948,935 1,357,256 5,244,483 7,445,010 8,249,662 1,107,108 1,281,698 1,255,953 1,116,622 1,246,862 1,515,684 1,173,598 3,216,882 2,784,096 3,310,355 2,799,552 2,629,337 5,394,458 6,202,122 4,253,411 4,619,506 6,209,407 9,325,541 29,844,812 38,023,853 35,795,575 32,531,535 36,402,218 40,413,230 57,547,442 72,496,041 65,418,602 65,461,274 75,527,681 86,553,634
20,197,976 19,353,144 34,129,715 48,649,587 48,878,681 51,007,964 - 16,371,000 - - - - 7,736,800 7,970,491 7,780,503 9,191,660 9,035,902 9,105,000 10,539,932 7,795,422 5,313,734 4,940,000 5,260,000 5,200,000 2,986,823 3,479,845 526,947 - 705,894 450,000 - - - - - - 18,542,245 18,542,245 - - - - 60,003,776 73,512,147 47,750,899 62,781,247 63,880,477 65,762,964 117,551,218 146,008,188 113,169,501 128,242,521 139,408,158 152,316,598
- 103,312,031 622,095 6,892,503 14,278,375 812,137
$ 8,502,196 $ 86,444,775 $ 10,643,997 $ 18,609,118 $ 30,294,950 $ 16,681,157

73
Table III
Capital Improvement Board of ManagersEvent StatisticsLast Ten Fiscal Years
2003 2004 2005 2006
Number of EventsEntertainment 11 13 9 10 Trade Shows 13 20 17 20 Local, Business and Social 209 213 179 185 State Convention Business 46 59 71 71 National Convention Business 33 37 28 38 Sporting Events 33 30 34 40
Total Number of Events 345 372 338 364
Event DaysEntertainment 11 13 9 12 Trade Shows 35 51 48 50 Local, Business and Social 306 290 251 237 State Convention Business 99 122 132 139 National Convention Business 131 131 95 131 Sporting Events 49 48 52 54
Total Event Days 631 655 587 623
AttendanceEntertainment 59,412 66,186 59,404 47,548 Trade Shows 119,187 121,170 110,343 141,118 Local, Business and Social 156,992 151,175 137,768 122,689 State Convention Business 54,972 87,932 83,912 87,482 National Convention Business 340,078 372,568 353,930 298,994 Sporting Events 820,026 792,442 918,434 905,908
Total Attendance 1,550,667 1,591,473 1,663,791 1,603,739
Source: Sales Office - Capital Improvement Board of Managers.
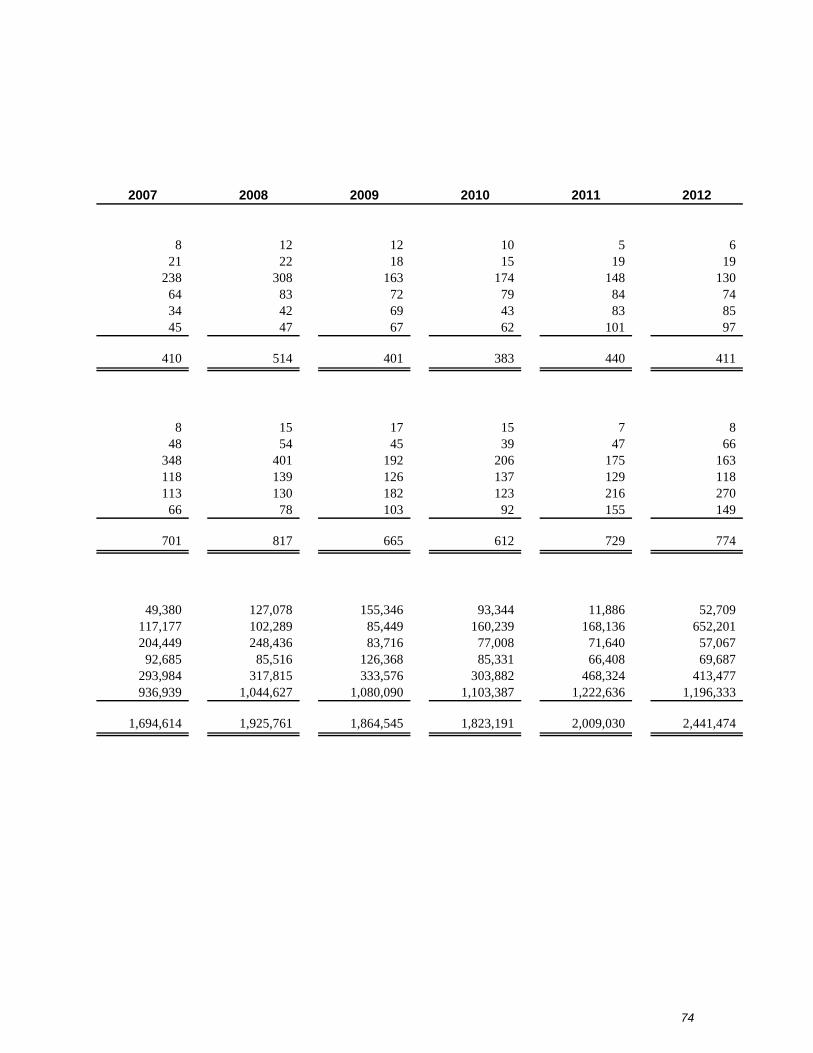
74
2007 2008 2009 2010 2011 2012
8 12 12 10 5 6 21 22 18 15 19 19 238 308 163 174 148 130 64 83 72 79 84 74 34 42 69 43 83 85 45 47 67 62 101 97
410 514 401 383 440 411
8 15 17 15 7 8 48 54 45 39 47 66 348 401 192 206 175 163 118 139 126 137 129 118 113 130 182 123 216 270 66 78 103 92 155 149
701 817 665 612 729 774
49,380 127,078 155,346 93,344 11,886 52,709 117,177 102,289 85,449 160,239 168,136 652,201 204,449 248,436 83,716 77,008 71,640 57,067 92,685 85,516 126,368 85,331 66,408 69,687 293,984 317,815 333,576 303,882 468,324 413,477 936,939 1,044,627 1,080,090 1,103,387 1,222,636 1,196,333
1,694,614 1,925,761 1,864,545 1,823,191 2,009,030 2,441,474

Table IV
Capital Improvement Board of ManagersLargest CustomersCurrent Year
$ Amount % of Total $ Amount % of Total $ Amount % of Total $ Amount % of Total
Customer 1 $ - 0.00% $ 2,472,405 17.55% $ - 0.00% $ 2,472,405 9.47%Customer 2 250,000 3.11% 922,715 6.55% - 0.00% 1,172,715 4.49%Customer 3 510,497 6.34% 531,344 3.77% 111,219 2.80% 1,153,060 4.42%Customer 4 467,408 5.81% 363,253 2.58% 80,760 2.04% 911,421 3.49%Customer 5 273,681 3.40% 378,362 2.68% 61,845 1.56% 713,888 2.73%Customer 6 13,281 0.16% 349,620 2.48% 239,606 6.04% 602,507 2.31%Customer 7 181,117 2.25% 303,340 2.15% 59,734 1.50% 544,191 2.09%Customer 8 228,071 2.83% 67,064 0.48% 167,256 4.21% 462,391 1.77%Customer 9 147,899 1.84% 190,099 1.35% 75,547 1.90% 413,545 1.58%Customer 10 127,207 1.58% 146,246 1.04% 137,578 3.46% 411,031 1.57%
Subtotal 2,199,161 27.32% 5,724,448 40.63% 933,545 23.51% 8,857,154 33.92%
Balance from other customers 5,851,050 72.68% 8,364,238 59.37% 3,037,269 76.49% 17,252,557 66.08%
$ 8,050,211 100.00% $ 14,088,686 100.00% $ 3,970,814 100.00% $ 26,109,711 100.00%
1 - Revenue amounts exclude "CIB Profit" as defined in the agreement between the CIB and Service America (d/b/a Centerplate).
Note: Information for 2003 is not readily available.
Sources: Rental income and labor reimbursement amounts obtained from the Sales Office - Capital Improvement Board of Managers.Food Service Commissions obtained from Service America.
TotalDecember 31, 2012
Food Service Commissions 1Labor ReimbursementsRental Income
75

Table V
Capital Improvement Board of ManagersRate Schedule - ExhibitsLast Ten Fiscal Years
Type of Rate 2003 2004 2005 2006 2007 2008 2009 2010 2011 2012
Base Rent (Per Net Square Foot 1):One to Four Open Days $ 0.75 $ 0.75 $ 0.75 $ 0.75 $ 0.75 $ 0.80 $ 0.85 $ 0.90 $ 0.95 $ 0.98 Five to Seven Open Days 0.80 0.80 0.80 0.80 0.80 0.85 0.90 0.95 1.00 1.03 After Seven Days - ICC 0.85 0.85 0.85 0.85 0.85 0.90 0.95 1.00 1.05 1.05 After Seven Days - LOS - - - - - 0.97 1.02 1.07 1.07 1.15
1 - Net square feet consists of actual display area used, less normal aisles and corridors.
Note: Customers are allowed up to three (3) move-in/out days at no charge; rates for additional days are based upon gross square footage of each venue.
Source: Sales Office - Capital Improvement Board of Managers.
76
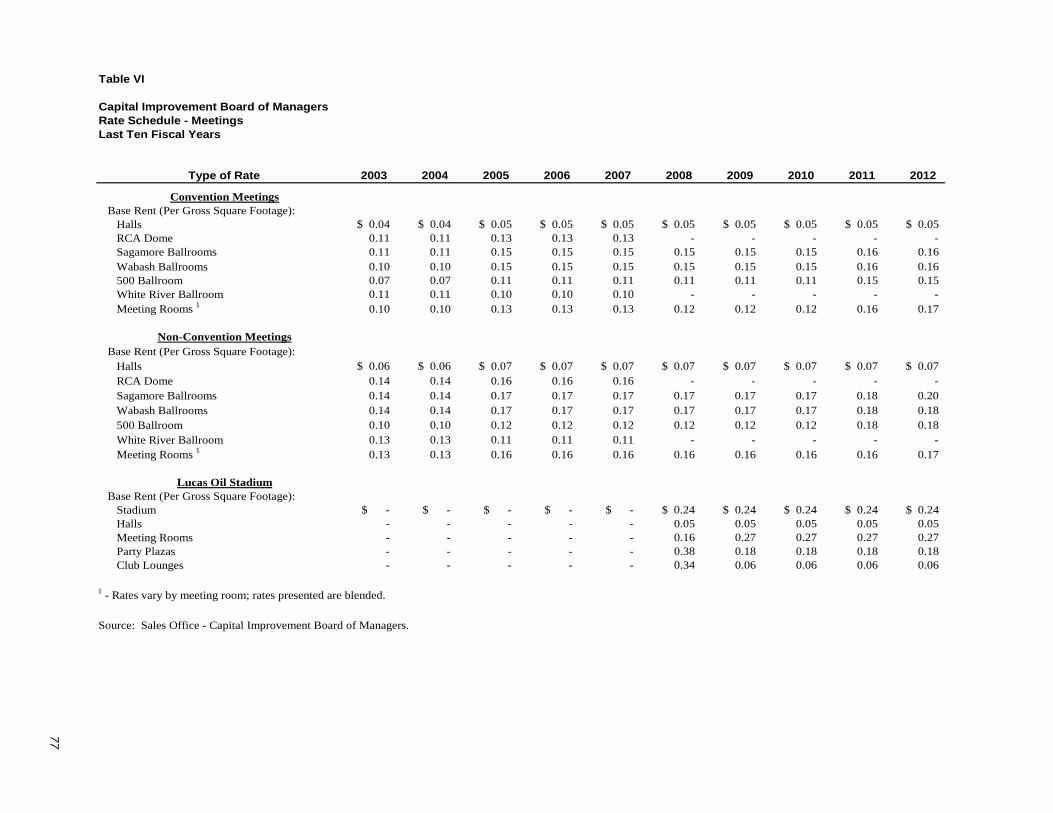
Table VI
Capital Improvement Board of ManagersRate Schedule - MeetingsLast Ten Fiscal Years
Type of Rate 2003 2004 2005 2006 2007 2008 2009 2010 2011 2012
Convention Meetings Base Rent (Per Gross Square Footage): Halls $ 0.04 $ 0.04 $ 0.05 $ 0.05 $ 0.05 $ 0.05 $ 0.05 $ 0.05 $ 0.05 $ 0.05 RCA Dome 0.11 0.11 0.13 0.13 0.13 - - - - - Sagamore Ballrooms 0.11 0.11 0.15 0.15 0.15 0.15 0.15 0.15 0.16 0.16 Wabash Ballrooms 0.10 0.10 0.15 0.15 0.15 0.15 0.15 0.15 0.16 0.16 500 Ballroom 0.07 0.07 0.11 0.11 0.11 0.11 0.11 0.11 0.15 0.15 White River Ballroom 0.11 0.11 0.10 0.10 0.10 - - - - - Meeting Rooms 1 0.10 0.10 0.13 0.13 0.13 0.12 0.12 0.12 0.16 0.17
Non-Convention Meetings Base Rent (Per Gross Square Footage): Halls $ 0.06 $ 0.06 $ 0.07 $ 0.07 $ 0.07 $ 0.07 $ 0.07 $ 0.07 $ 0.07 $ 0.07 RCA Dome 0.14 0.14 0.16 0.16 0.16 - - - - - Sagamore Ballrooms 0.14 0.14 0.17 0.17 0.17 0.17 0.17 0.17 0.18 0.20 Wabash Ballrooms 0.14 0.14 0.17 0.17 0.17 0.17 0.17 0.17 0.18 0.18 500 Ballroom 0.10 0.10 0.12 0.12 0.12 0.12 0.12 0.12 0.18 0.18 White River Ballroom 0.13 0.13 0.11 0.11 0.11 - - - - - Meeting Rooms 1 0.13 0.13 0.16 0.16 0.16 0.16 0.16 0.16 0.16 0.17
Lucas Oil Stadium Base Rent (Per Gross Square Footage): Stadium $ - $ - $ - $ - $ - $ 0.24 $ 0.24 $ 0.24 $ 0.24 $ 0.24 Halls - - - - - 0.05 0.05 0.05 0.05 0.05 Meeting Rooms - - - - - 0.16 0.27 0.27 0.27 0.27 Party Plazas - - - - - 0.38 0.18 0.18 0.18 0.18 Club Lounges - - - - - 0.34 0.06 0.06 0.06 0.06
Source: Sales Office - Capital Improvement Board of Managers.
1 - Rates vary by meeting room; rates presented are blended.
77
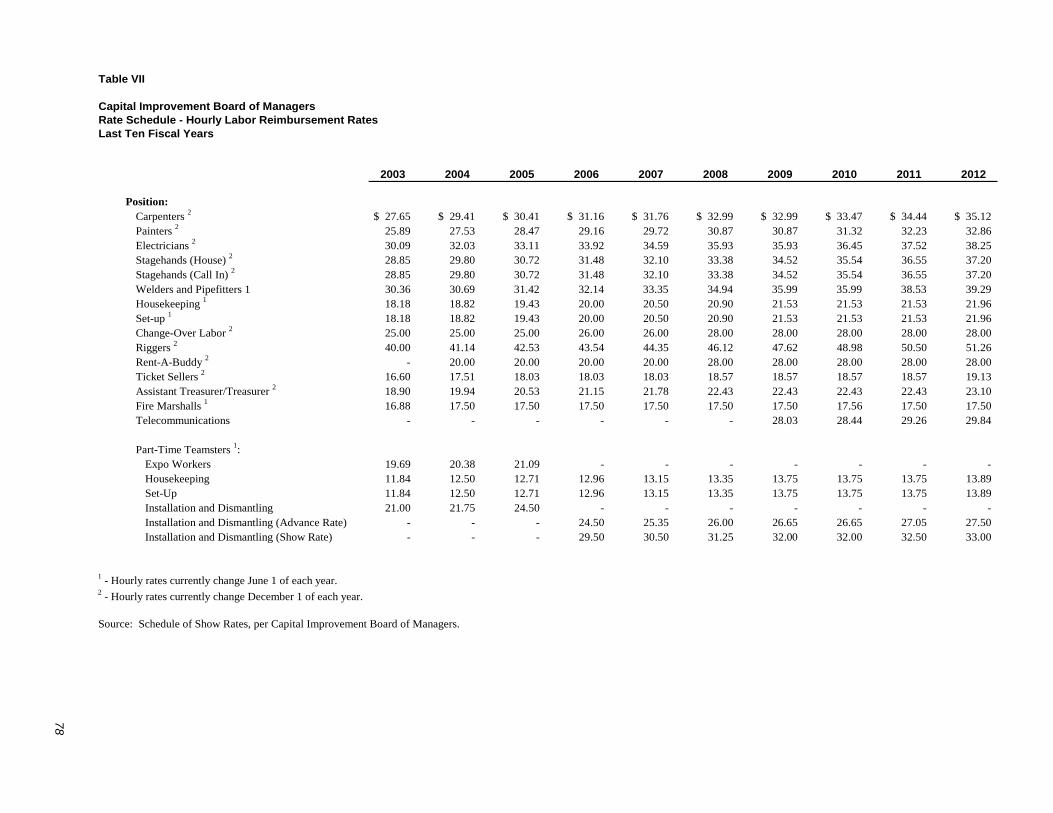
Table VII
2003 2004 2005 2006 2007 2008 2009 2010 2011 2012
Position:Carpenters 2 $ 27.65 $ 29.41 $ 30.41 $ 31.16 $ 31.76 $ 32.99 $ 32.99 $ 33.47 $ 34.44 $ 35.12 Painters 2 25.89 27.53 28.47 29.16 29.72 30.87 30.87 31.32 32.23 32.86 Electricians 2 30.09 32.03 33.11 33.92 34.59 35.93 35.93 36.45 37.52 38.25 Stagehands (House) 2 28.85 29.80 30.72 31.48 32.10 33.38 34.52 35.54 36.55 37.20 Stagehands (Call In) 2 28.85 29.80 30.72 31.48 32.10 33.38 34.52 35.54 36.55 37.20 Welders and Pipefitters 1 30.36 30.69 31.42 32.14 33.35 34.94 35.99 35.99 38.53 39.29 Housekeeping 1 18.18 18.82 19.43 20.00 20.50 20.90 21.53 21.53 21.53 21.96 Set-up 1 18.18 18.82 19.43 20.00 20.50 20.90 21.53 21.53 21.53 21.96 Change-Over Labor 2 25.00 25.00 25.00 26.00 26.00 28.00 28.00 28.00 28.00 28.00 Riggers 2 40.00 41.14 42.53 43.54 44.35 46.12 47.62 48.98 50.50 51.26 Rent-A-Buddy 2 - 20.00 20.00 20.00 20.00 28.00 28.00 28.00 28.00 28.00 Ticket Sellers 2 16.60 17.51 18.03 18.03 18.03 18.57 18.57 18.57 18.57 19.13 Assistant Treasurer/Treasurer 2 18.90 19.94 20.53 21.15 21.78 22.43 22.43 22.43 22.43 23.10 Fire Marshalls 1 16.88 17.50 17.50 17.50 17.50 17.50 17.50 17.56 17.50 17.50 Telecommunications - - - - - - 28.03 28.44 29.26 29.84
Part-Time Teamsters 1: Expo Workers 19.69 20.38 21.09 - - - - - - - Housekeeping 11.84 12.50 12.71 12.96 13.15 13.35 13.75 13.75 13.75 13.89 Set-Up 11.84 12.50 12.71 12.96 13.15 13.35 13.75 13.75 13.75 13.89 Installation and Dismantling 21.00 21.75 24.50 - - - - - - - Installation and Dismantling (Advance Rate) - - - 24.50 25.35 26.00 26.65 26.65 27.05 27.50 Installation and Dismantling (Show Rate) - - - 29.50 30.50 31.25 32.00 32.00 32.50 33.00
2 - Hourly rates currently change December 1 of each year.
Source: Schedule of Show Rates, per Capital Improvement Board of Managers.
Capital Improvement Board of ManagersRate Schedule - Hourly Labor Reimbursement RatesLast Ten Fiscal Years
1 - Hourly rates currently change June 1 of each year.
78

79
CIB CIB
Revenues Expenses Commission1 Profit 2 Total
2003 $ 13,425,511 $ 12,672,980 $ 4,027,653 $ 769,755 $ 4,797,408 2004 15,319,720 14,629,156 4,595,916 826,019 5,421,935 2005 16,140,782 15,545,727 4,842,235 728,309 5,570,544 2006 17,172,381 16,237,885 5,151,714 993,779 6,145,493 2007 18,672,495 17,729,488 5,601,749 1,074,026 6,675,775 2008 13,925,935 11,355,237 1,647,517 2,059,350 3,706,867 2009 13,060,511 8,605,225 - 4,532,348 4,532,348 2010 12,792,675 9,721,984 - 3,070,691 3,070,691 2011 15,122,275 10,370,606 - 4,751,669 4,751,669 2012 14,474,034 10,503,220 - 3,970,814 3,970,814
commissions on ICC revenues under its agreement.
Center events and Non-Colts events at Lucas Oil Stadium.
Table VIII
Capital Improvement Board of ManagersFood Service and Concession RevenuesLast Ten Fiscal Years
Source: Service America (d/b/a Centerplate) Monthly Commission Reports.
1 - Under its contract with Service America (d/b/a Centerplate) through June 1, 2008, the CIB received a 30% commission on ICC revenues as defined in the agreement. Effective June 2, 2008, the CIB no longer receives
2 - Revenues minus expenses, net of Service America's management fee and share of profits and exclusive of Colts' novelty sales through June 1, 2008. Effective June 2, 2008, the CIB retains net profits from Convention
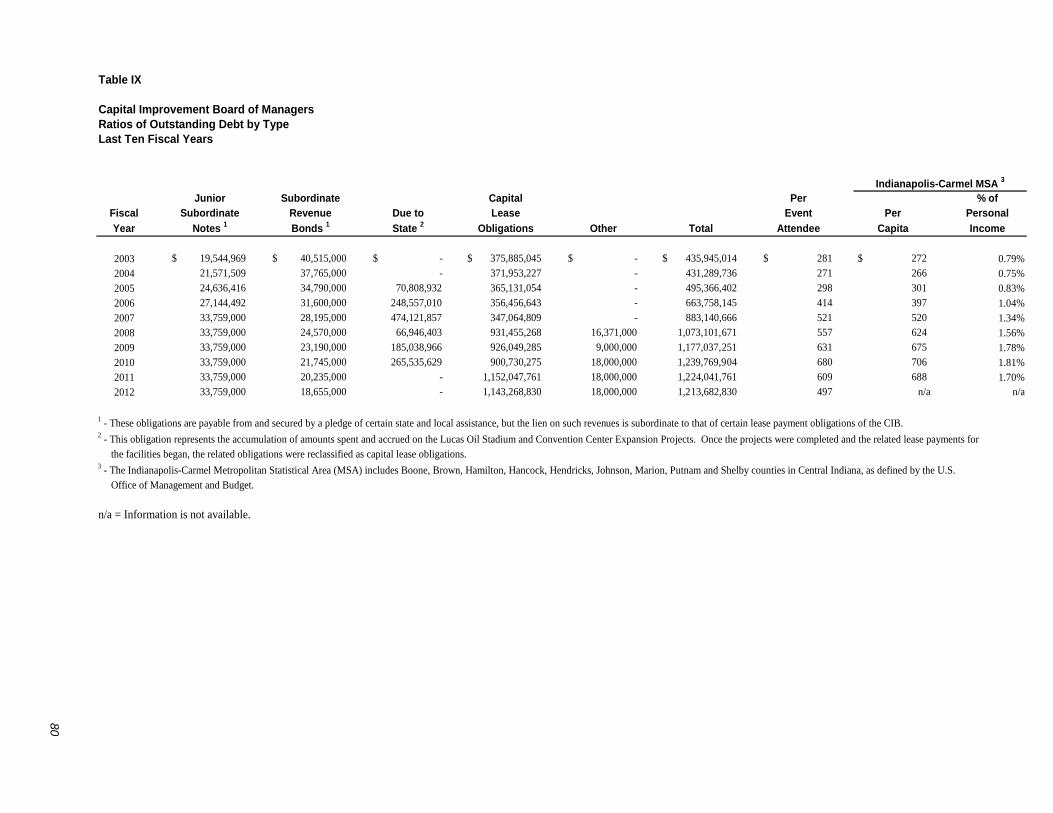
Table IX
Junior Subordinate Capital Per % ofFiscal Subordinate Revenue Due to Lease Event Per Personal
Year Notes 1 Bonds 1 State 2 Obligations Other Total Attendee Capita Income
2003 $ 19,544,969 $ 40,515,000 $ - $ 375,885,045 $ - $ 435,945,014 $ 281 $ 272 0.79%2004 21,571,509 37,765,000 - 371,953,227 - 431,289,736 271 266 0.75%2005 24,636,416 34,790,000 70,808,932 365,131,054 - 495,366,402 298 301 0.83%2006 27,144,492 31,600,000 248,557,010 356,456,643 - 663,758,145 414 397 1.04%2007 33,759,000 28,195,000 474,121,857 347,064,809 - 883,140,666 521 520 1.34%2008 33,759,000 24,570,000 66,946,403 931,455,268 16,371,000 1,073,101,671 557 624 1.56%2009 33,759,000 23,190,000 185,038,966 926,049,285 9,000,000 1,177,037,251 631 675 1.78%2010 33,759,000 21,745,000 265,535,629 900,730,275 18,000,000 1,239,769,904 680 706 1.81%2011 33,759,000 20,235,000 - 1,152,047,761 18,000,000 1,224,041,761 609 688 1.70%2012 33,759,000 18,655,000 - 1,143,268,830 18,000,000 1,213,682,830 497 n/a n/a
n/a = Information is not available.
Indianapolis-Carmel MSA 3
1 - These obligations are payable from and secured by a pledge of certain state and local assistance, but the lien on such revenues is subordinate to that of certain lease payment obligations of the CIB.2 - This obligation represents the accumulation of amounts spent and accrued on the Lucas Oil Stadium and Convention Center Expansion Projects. Once the projects were completed and the related lease payments for
Capital Improvement Board of ManagersRatios of Outstanding Debt by TypeLast Ten Fiscal Years
the facilities began, the related obligations were reclassified as capital lease obligations.3 - The Indianapolis-Carmel Metropolitan Statistical Area (MSA) includes Boone, Brown, Hamilton, Hancock, Hendricks, Johnson, Marion, Putnam and Shelby counties in Central Indiana, as defined by the U.S. Office of Management and Budget.
80
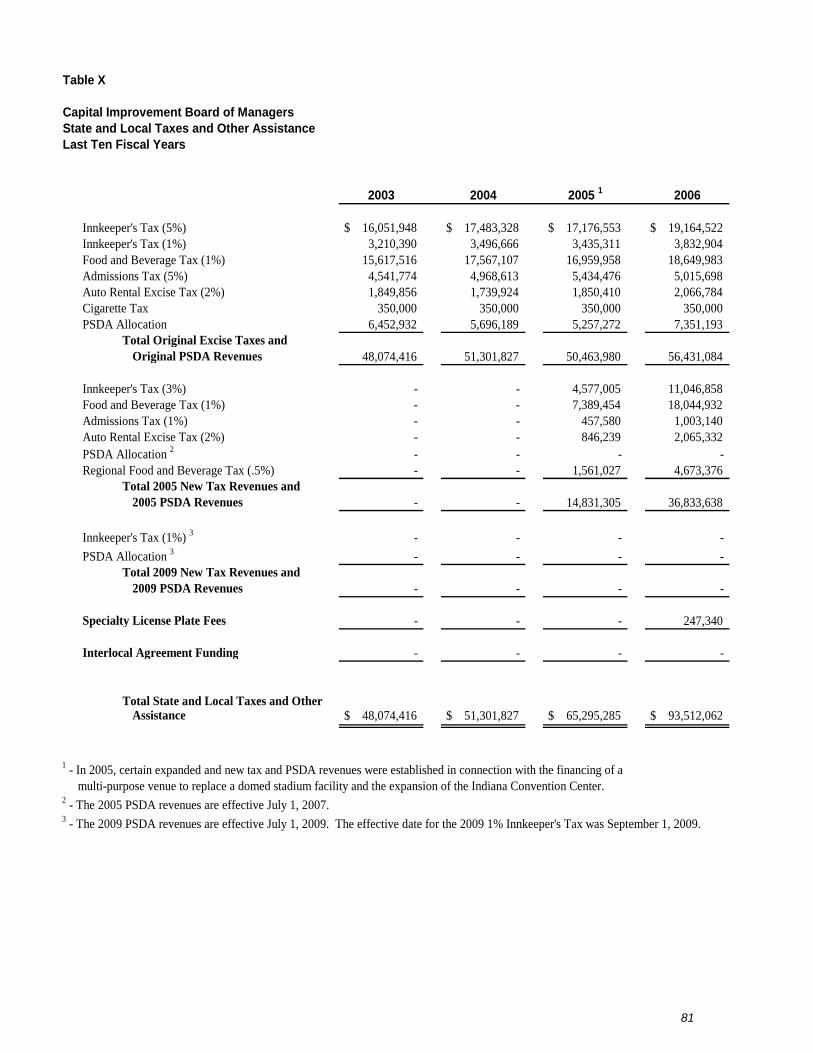
81
Table X
2003 2004 2005 1 2006
Innkeeper's Tax (5%) $ 16,051,948 $ 17,483,328 $ 17,176,553 $ 19,164,522 Innkeeper's Tax (1%) 3,210,390 3,496,666 3,435,311 3,832,904 Food and Beverage Tax (1%) 15,617,516 17,567,107 16,959,958 18,649,983 Admissions Tax (5%) 4,541,774 4,968,613 5,434,476 5,015,698 Auto Rental Excise Tax (2%) 1,849,856 1,739,924 1,850,410 2,066,784 Cigarette Tax 350,000 350,000 350,000 350,000 PSDA Allocation 6,452,932 5,696,189 5,257,272 7,351,193
Total Original Excise Taxes andOriginal PSDA Revenues 48,074,416 51,301,827 50,463,980 56,431,084
Innkeeper's Tax (3%) - - 4,577,005 11,046,858 Food and Beverage Tax (1%) - - 7,389,454 18,044,932 Admissions Tax (1%) - - 457,580 1,003,140 Auto Rental Excise Tax (2%) - - 846,239 2,065,332 PSDA Allocation 2 - - - - Regional Food and Beverage Tax (.5%) - - 1,561,027 4,673,376
Total 2005 New Tax Revenues and2005 PSDA Revenues - - 14,831,305 36,833,638
Innkeeper's Tax (1%) 3 - - - -
PSDA Allocation 3 - - - - Total 2009 New Tax Revenues and
2009 PSDA Revenues - - - -
Specialty License Plate Fees - - - 247,340
Interlocal Agreement Funding - - - -
Total State and Local Taxes and Other Assistance $ 48,074,416 $ 51,301,827 $ 65,295,285 $ 93,512,062
Capital Improvement Board of ManagersState and Local Taxes and Other AssistanceLast Ten Fiscal Years
2 - The 2005 PSDA revenues are effective July 1, 2007.3 - The 2009 PSDA revenues are effective July 1, 2009. The effective date for the 2009 1% Innkeeper's Tax was September 1, 2009.
1 - In 2005, certain expanded and new tax and PSDA revenues were established in connection with the financing of a multi-purpose venue to replace a domed stadium facility and the expansion of the Indiana Convention Center.

82
2007 2008 2009 2010 2011 2012
$ 19,716,399 $ 19,345,115 $ 16,586,647 $ 16,897,910 $ 20,058,708 $ 22,594,512 3,943,280 3,869,023 3,317,330 3,379,581 4,011,742 4,518,902 18,499,125 18,302,507 17,245,791 18,114,074 19,456,828 21,363,190 5,689,486 5,572,962 6,045,410 6,196,366 4,944,580 6,537,019 2,163,710 2,137,402 1,890,765 2,000,674 2,051,253 2,349,515 350,000 350,000 350,000 350,000 350,000 350,000 6,562,676 7,273,513 8,150,302 11,053,696 7,691,826 7,212,774
56,924,676 56,850,522 53,586,245 57,992,301 58,564,937 64,925,912
11,829,839 11,607,069 9,951,988 10,138,743 12,035,225 13,556,707 18,499,124 18,302,508 17,245,791 18,114,075 19,456,828 21,363,190 1,137,897 1,114,592 1,209,082 1,239,273 988,916 1,307,404 2,163,710 2,137,402 1,890,765 2,000,674 2,051,253 2,349,515 2,413,605 10,839,606 7,202,432 6,020,354 7,444,361 8,544,320 5,024,380 5,108,824 5,086,286 4,952,111 5,387,617 5,193,634
41,068,555 49,110,001 42,586,344 42,465,230 47,364,200 52,314,770
- - 843,325 3,379,581 4,011,742 4,518,902
- - 3,582,035 7,844,077 9,959,285 8,270,978
- - 4,425,360 11,223,658 13,971,027 12,789,880
788,862 907,315 836,700 901,880 896,960 745,860
- - - 8,000,000 8,000,000 8,000,000
$ 98,782,093 $ 106,867,838 $ 101,434,649 $ 120,583,069 $ 128,797,124 $ 138,776,422

83
Table XI
Capital Improvement Board of ManagersPledged Revenue CoverageLast Ten Fiscal Years
2003 2004 2005 2006
Original Excise Tax Revenues - Pledged on a Senior Basisto Secure Lease Rental Obligations
Innkeeper's Tax (5%) $ 16,051,948 $ 17,483,328 $ 17,176,553 $ 19,164,522 Innkeeper's Tax (1%) 3,210,390 3,496,666 3,435,311 3,832,904 Food and Beverage Tax (1%) 15,617,516 17,567,107 16,959,958 18,649,983 Admissions Tax (5%) 4,541,774 4,968,613 5,434,476 5,015,698 Auto Rental Excise Tax (2%) 1,849,856 1,739,924 1,850,410 2,066,784 Cigarette Tax 350,000 350,000 350,000 350,000
Total Tax Receipts 41,621,484 45,605,638 45,206,708 49,079,891
Disbursements - Senior Lease Rental Obligations 1
1991 and 1993 Leases (3,139,794) - - - 1995 Lease (1,006,000) (1,006,000) (1,006,000) (1,006,000) 1997 Lease (1,046,000) (1,046,000) (1,046,000) (1,046,000) 2001 Lease (2,723,470) (3,589,560) (4,624,000) (4,846,705) 2003 Lease (1,651,701) (3,794,113) (5,293,750) (6,271,000) 2011 Lease - - - - 2012 Lease - - - -
Total Disbursements - Senior Lease Rental Obligations (9,566,965) (9,435,673) (11,969,750) (13,169,705)
Original Excise Tax Revenues in Excess of Senior Lease Rental Obligations 32,054,519 36,169,965 33,236,958 35,910,186
Original Excise Tax Revenues - Pledged Only to Secure Subordinate Lease Rental Obligations and Other Debt
PSDA Allocation 6,452,932 5,696,189 5,257,272 7,351,193
Disbursements - Subordinate Lease Rental Obligations and Other Debt 1
1997 Lease (12,957,000) (13,176,000) (13,416,500) (13,675,000) 1999 Subordinate Bonds/Notes (4,604,638) (4,684,888) (4,766,763) (4,827,638) Junior Subordinate Notes and Lease Obligations (40,790) (58,352) (63,988) (72,881) 2011 Lease - - - -
Total Disbursements - Subordinate Lease Rental Obligations and Other Debt (17,602,428) (17,919,240) (18,247,251) (18,575,519)
Excess Available for CIB Operations $ 20,905,023 $ 23,946,914 $ 20,246,979 $ 24,685,860
Coverage Ratio - Senior Obligations 4.35 4.83 3.78 3.73
Coverage Ratios - Senior and Subordinate Obligations 2 1.77 1.88 1.67 1.78
2 - Excludes Junior Subordinate Notes and Lease Obligations.3 - Excludes additional rental payment in 2008 of $16,371,000 to fund a portion of a swap termination payment.
pledged to secure these Obligations.
1 - Senior Lease Rental and Subordinate Lease Rental Obligation payments are gross and do not take into account amounts paid from
Note: The 2005 New Tax Revenues, 2009 Innkeeper's Tax and 2009 PSDA Revenues are not included in this schedule since they are not
capitalized interest or any other sources.

84
2007 2008 2009 2010 2011 2012
$ 19,716,399 $ 19,345,115 $ 16,586,647 $ 16,897,910 $ 20,058,708 $ 22,594,512 3,943,280 3,869,023 3,317,330 3,379,581 4,011,742 4,518,902 18,499,125 18,302,507 17,245,791 18,114,074 19,456,828 21,363,190 5,689,486 5,572,962 6,045,410 6,196,366 4,944,580 6,537,019 2,163,710 2,137,402 1,890,765 2,000,674 2,051,253 2,349,515 350,000 350,000 350,000 350,000 350,000 350,000 50,362,000 49,577,009 45,435,943 46,938,605 50,873,111 57,713,138
- - - - - - (1,006,000) (1,006,000) (1,997,800) (1,006,000) (1,006,000) (1,006,000) (1,046,000) (1,046,000) (1,046,000) (1,046,000) (523,000) - (4,845,706) (4,844,281) (4,844,740) (4,846,490) (2,424,023) - (6,272,000) (6,273,250) (6,273,000) (6,271,250) (6,271,750) (4,281,805) - - - - (1,399,679) (4,225,282) - - - - - (500,219)
(13,169,706) (13,169,531) (14,161,540) (13,169,740) (11,624,452) (10,013,306)
37,192,294 36,407,478 31,274,403 33,768,865 39,248,659 47,699,832
6,562,676 7,273,513 8,150,302 11,053,696 7,691,826 7,212,774
(13,934,000) (14,213,000) (14,502,500) (14,775,500) (7,453,000) - (4,877,763) (4,922,013) (2,555,338) (2,555,872) (2,185,556) (991,400) (85,812) (562,425) 3 (50,301) (46,250) (24,306) (31,058) - - - - (2,989,100) (9,098,125)
(18,897,575) (19,697,438) (17,108,139) (17,377,622) (12,651,962) (10,120,583)
$ 24,857,395 $ 23,983,553 $ 22,316,566 $ 27,444,939 $ 34,288,523 $ 44,792,023
3.82 3.76 3.21 3.56 4.38 5.76
1.78 1.76 1.72 1.90 2.41 3.23

85
Table XI, continued
Capital Improvement Board of ManagersPledged Revenue Coverage - 2005 Sublease Rental ObligationsLast Ten Fiscal Years
2009 2010 2011 2012
2005 New Tax Revenues - Pledged to Secure the SubleaseRental Obligations
Innkeeper's Tax (3%) $ 9,951,988 $ 10,138,743 $ 12,035,225 $ 13,556,707 Marion County Food and Beverage Tax (1%) 17,245,791 18,114,075 19,456,828 21,363,190 Regional Food and Beverage Tax (.5%) 5,086,286 4,952,111 5,387,617 5,193,634 Admissions Tax (1%) 1,209,082 1,239,273 988,916 1,307,404 Auto Rental Excise Tax (2%) 1,890,765 2,000,674 2,051,253 2,349,515 PSDA Tax Allocation 7,202,432 6,020,354 7,444,361 8,544,320 Colts License Plate Fees 836,700 901,880 896,960 745,860
43,423,044 43,367,110 48,261,160 53,060,630
Disbursements - Sublease Rental Obligations 2
Stadium Sublease Agreement (20,000,000) (41,000,000) (39,077,337) (35,827,338) Convention Center Sublease Agreement - - (4,501,609) (9,588,640)
(20,000,000) (41,000,000) (43,578,946) (45,415,978)
2005 New Tax Revenues in Excess of Sublease Rental Obligations 1 $ 23,423,044 $ 2,367,110 $ 4,682,214 $ 7,644,652
Coverage Ratio - Sublease Rental Obligations 2.17 1.06 1.11 1.17
are not pledged to secure these Sublease Rental Obligations.
2 - Sublease Rental Obligation payments are gross and do not take into account amounts paid from capitalized interest or any other sources. These payments began in 2009, so there will be no prior years presented.
Note: The Original Excise Tax Revenues, 2009 Innkeeper's Tax and 2009 PSDA Revenues are not included in this schedule since they
1 - Excess 2005 New Tax Revenues are not available to the CIB for operations and may only be used at the direction of the Indiana Office of Management and Budget to: (1) pay obligations of the ISCBA arising out of the design, development and construction of the LOS or the Convention Center Expansion Project, (2) prepay the 2005 Sublease Rental Obligations,
Obligations relate. or (3) fund certain extraordinary improvements to LOS or the Convention Center Project to which the Sublease Rental
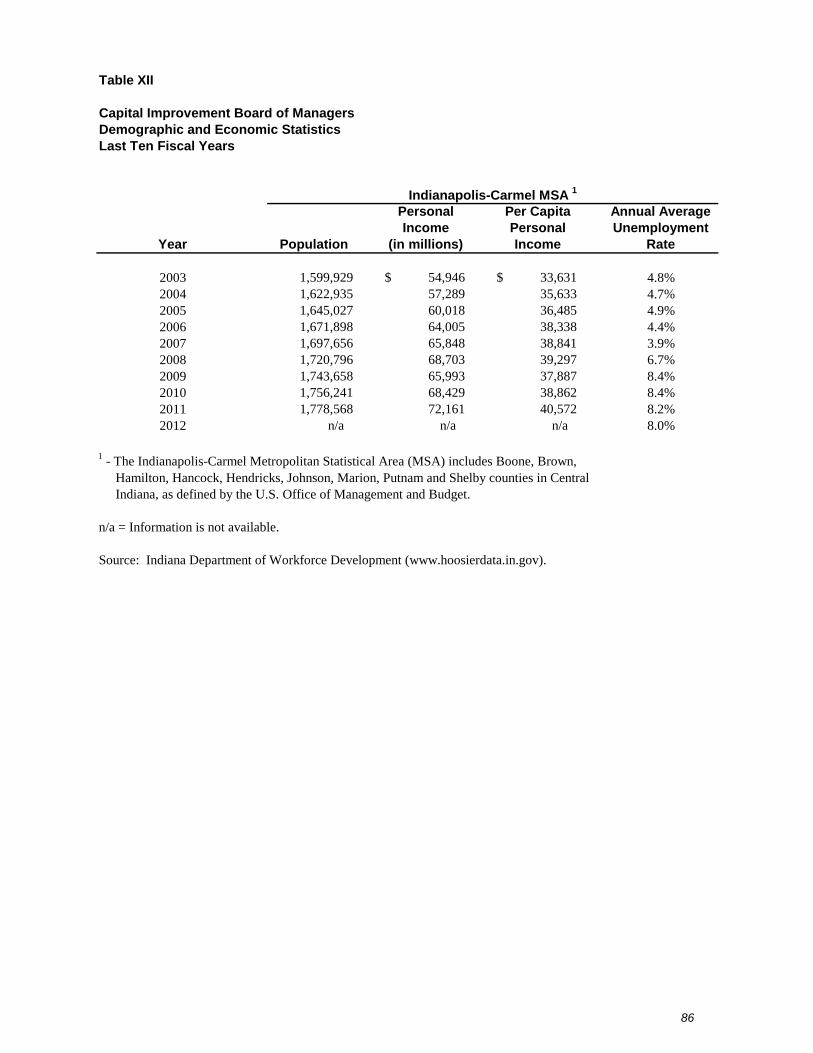
86
Table XII
Capital Improvement Board of ManagersDemographic and Economic Statistics Last Ten Fiscal Years
Personal Per Capita Annual AverageIncome Personal Unemployment
Year Population (in millions) Income Rate
2003 1,599,929 $ 54,946 $ 33,631 4.8%2004 1,622,935 57,289 35,633 4.7%2005 1,645,027 60,018 36,485 4.9%2006 1,671,898 64,005 38,338 4.4%2007 1,697,656 65,848 38,841 3.9%2008 1,720,796 68,703 39,297 6.7%2009 1,743,658 65,993 37,887 8.4%2010 1,756,241 68,429 38,862 8.4%2011 1,778,568 72,161 40,572 8.2%2012 n/a n/a n/a 8.0%
1 - The Indianapolis-Carmel Metropolitan Statistical Area (MSA) includes Boone, Brown, Hamilton, Hancock, Hendricks, Johnson, Marion, Putnam and Shelby counties in Central Indiana, as defined by the U.S. Office of Management and Budget.
n/a = Information is not available.
Source: Indiana Department of Workforce Development (www.hoosierdata.in.gov).
Indianapolis-Carmel MSA 1

87
Employer Name Employees % of Total
I.U. Health 20,292 2.25%St. Vincent Hospitals & Health Service 11,075 1.23%Eli Lilly and Company 10,500 1.16%Wal-Mart 9,000 1.00%Marsh Supermarkets 8,890 0.99%Community Health Network 8,100 0.90%FedEx Express 6,000 0.67%Franciscan St. Francis Health 5,576 0.62%WellPoint 4,500 0.50%Rolls-Royce 4,100 0.45%AT&T 4,000 0.44%Chase 3,810 0.42%Roche Diagnostics 3,000 0.33%
98,843 10.96%
1 - Principal employers for the Indianapolis MSA (Local, state and federal employers are excluded).
Note: Information for 2003 is not readily available.
Sources: The Indy Partnership (www.indypartnership.com).
2012
Table XIII
Capital Improvement Board of Managers
Principal Employers 1
Current Year
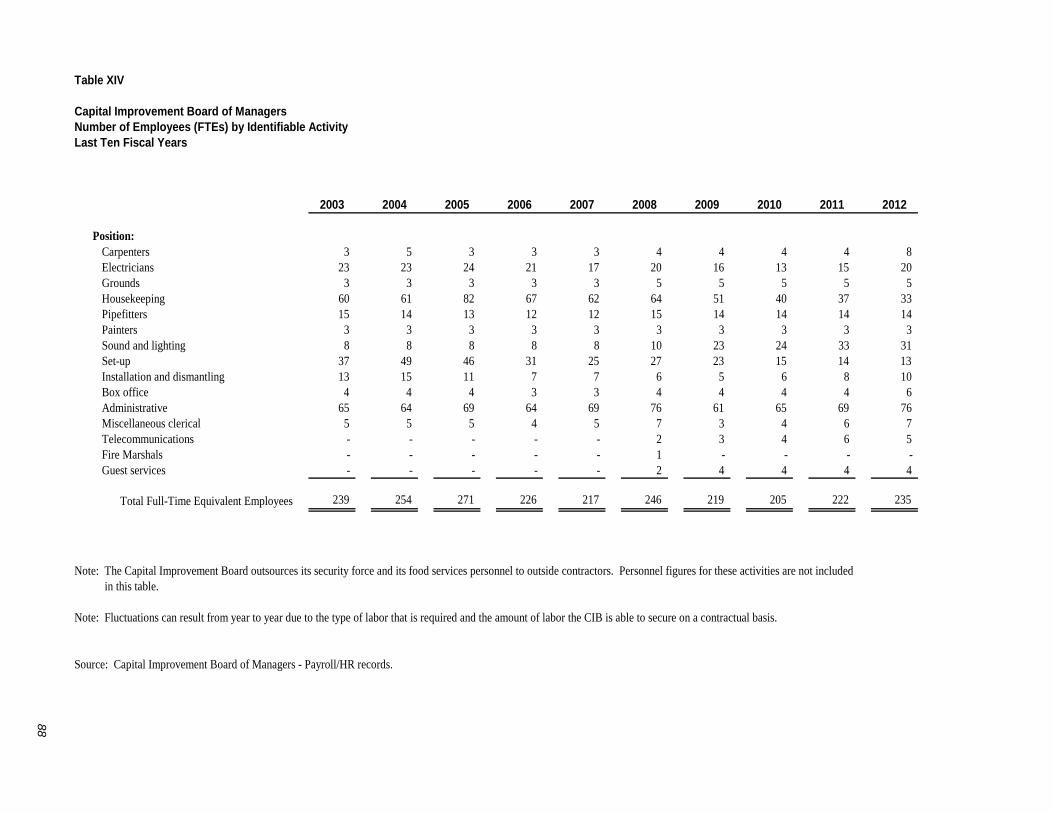
2003 2004 2005 2006 2007 2008 2009 2010 2011 2012
Position:Carpenters 3 5 3 3 3 4 4 4 4 8 Electricians 23 23 24 21 17 20 16 13 15 20 Grounds 3 3 3 3 3 5 5 5 5 5 Housekeeping 60 61 82 67 62 64 51 40 37 33 Pipefitters 15 14 13 12 12 15 14 14 14 14 Painters 3 3 3 3 3 3 3 3 3 3 Sound and lighting 8 8 8 8 8 10 23 24 33 31 Set-up 37 49 46 31 25 27 23 15 14 13 Installation and dismantling 13 15 11 7 7 6 5 6 8 10 Box office 4 4 4 3 3 4 4 4 4 6 Administrative 65 64 69 64 69 76 61 65 69 76 Miscellaneous clerical 5 5 5 4 5 7 3 4 6 7 Telecommunications - - - - - 2 3 4 6 5 Fire Marshals - - - - - 1 - - - - Guest services - - - - - 2 4 4 4 4
Total Full-Time Equivalent Employees 239 254 271 226 217 246 219 205 222 235
Note: The Capital Improvement Board outsources its security force and its food services personnel to outside contractors. Personnel figures for these activities are not included in this table.
Note: Fluctuations can result from year to year due to the type of labor that is required and the amount of labor the CIB is able to secure on a contractual basis.
Source: Capital Improvement Board of Managers - Payroll/HR records.
Table XIV
Capital Improvement Board of ManagersNumber of Employees (FTEs) by Identifiable ActivityLast Ten Fiscal Years
88
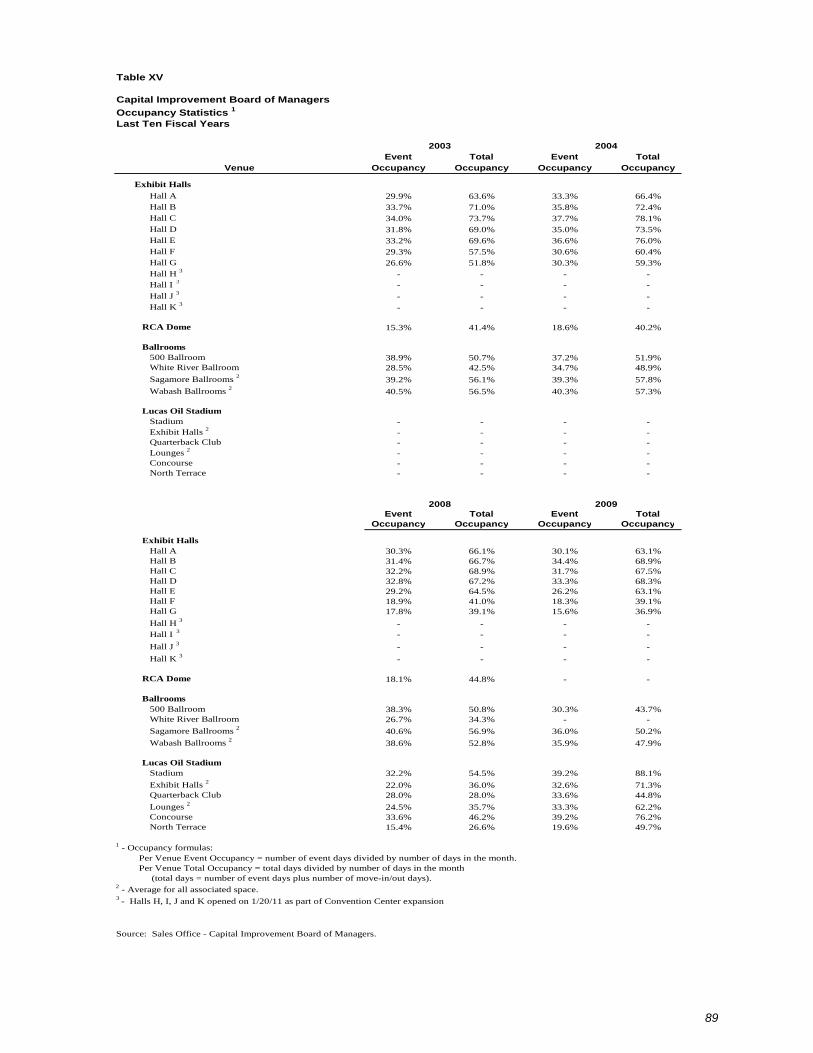
89
Event Total Event Total Venue Occupancy Occupancy Occupancy Occupancy
Exhibit Halls
Hall A 29.9% 63.6% 33.3% 66.4% Hall B 33.7% 71.0% 35.8% 72.4% Hall C 34.0% 73.7% 37.7% 78.1% Hall D 31.8% 69.0% 35.0% 73.5% Hall E 33.2% 69.6% 36.6% 76.0% Hall F 29.3% 57.5% 30.6% 60.4% Hall G 26.6% 51.8% 30.3% 59.3% Hall H 3 - - - - Hall I
3 - - - -
Hall J 3 - - - - Hall K 3 - - - -
RCA Dome 15.3% 41.4% 18.6% 40.2%
Ballrooms 500 Ballroom 38.9% 50.7% 37.2% 51.9% White River Ballroom 28.5% 42.5% 34.7% 48.9%
Sagamore Ballrooms 2 39.2% 56.1% 39.3% 57.8%
Wabash Ballrooms 2 40.5% 56.5% 40.3% 57.3%
Lucas Oil Stadium Stadium - - - - Exhibit Halls 2 - - - - Quarterback Club - - - - Lounges 2 - - - - Concourse - - - - North Terrace - - - -
Event Total Event Total Occupancy Occupancy Occupancy Occupancy
Exhibit Halls Hall A 30.3% 66.1% 30.1% 63.1% Hall B 31.4% 66.7% 34.4% 68.9% Hall C 32.2% 68.9% 31.7% 67.5% Hall D 32.8% 67.2% 33.3% 68.3% Hall E 29.2% 64.5% 26.2% 63.1% Hall F 18.9% 41.0% 18.3% 39.1% Hall G 17.8% 39.1% 15.6% 36.9%
Hall H 3 - - - - Hall I
3 - - - -
Hall J 3 - - - -
Hall K 3 - - - -
RCA Dome 18.1% 44.8% - -
Ballrooms 500 Ballroom 38.3% 50.8% 30.3% 43.7% White River Ballroom 26.7% 34.3% - -
Sagamore Ballrooms 2 40.6% 56.9% 36.0% 50.2%
Wabash Ballrooms 2 38.6% 52.8% 35.9% 47.9%
Lucas Oil Stadium Stadium 32.2% 54.5% 39.2% 88.1%
Exhibit Halls 2 22.0% 36.0% 32.6% 71.3% Quarterback Club 28.0% 28.0% 33.6% 44.8%
Lounges 2 24.5% 35.7% 33.3% 62.2% Concourse 33.6% 46.2% 39.2% 76.2% North Terrace 15.4% 26.6% 19.6% 49.7%
1 - Occupancy formulas: Per Venue Event Occupancy = number of event days divided by number of days in the month. Per Venue Total Occupancy = total days divided by number of days in the month (total days = number of event days plus number of move-in/out days).2 - Average for all associated space.3 - Halls H, I, J and K opened on 1/20/11 as part of Convention Center expansion
Source: Sales Office - Capital Improvement Board of Managers.
2008 2009
Last Ten Fiscal Years
Table XV
Capital Improvement Board of Managers
Occupancy Statistics 1
2003 2004

90
Event Total Event Total Event Total Occupancy Occupancy Occupancy Occupancy Occupancy Occupancy
33.4% 67.9% 33.4% 61.9% 30.1% 60.5%33.4% 69.3% 35.3% 65.5% 31.5% 63.8%35.6% 70.7% 30.7% 59.5% 31.8% 63.8%34.2% 70.4% 29.9% 58.4% 29.9% 61.4%32.9% 66.8% 28.5% 55.1% 29.9% 61.1%31.5% 64.9% 29.3% 54.8% 31.5% 58.1%31.8% 65.2% 27.9% 51.0% 25.5% 52.3%
- - - - - -- - - - - -
- - - - - -- - - - - -
18.4% 53.2% 18.9% 43.8% 20.5% 42.2%
35.9% 50.4% 34.2% 48.5% 36.4% 50.4%28.8% 43.6% 27.9% 41.6% 29.9% 41.1%
39.3% 60.0% 41.2% 56.6% 38.0% 55.3%
36.7% 56.3% 37.0% 51.6% 34.2% 49.7%
- - - - - -- - - - - -- - - - - -- - - - - -- - - - - -- - - - - -
Event Total Event Total Event Total Occupancy Occupancy Occupancy Occupancy Occupancy Occupancy
29.3% 58.1% 31.2% 65.8% 25.7% 57.7%29.0% 58.6% 28.8% 64.1% 29.5% 64.8%29.6% 62.2% 26.0% 62.2% 23.5% 59.6%31.5% 62.7% 30.7% 66.8% 27.3% 63.7%27.9% 60.8% 25.5% 61.4% 26.8% 61.2%20.0% 41.9% 23.0% 53.7% 28.4% 63.7%14.2% 32.9% 21.1% 51.5% 21.3% 54.4%
- - 18.5% 45.7% 23.5% 55.5%- - 19.7% 47.4% 25.7% 60.1%
- - 23.4% 52.0% 29.5% 63.4%
- - 19.9% 47.7% 23.2% 56.6%
- - - - - -
22.7% 42.5% 30.7% 39.7% 33.6% 49.7%- - - - - -
23.7% 45.9% 31.6% 45.2% 32.2% 51.0%
23.2% 39.6% 39.8% 48.2% 30.8% 44.6%
16.2% 36.2% 18.4% 31.8% 17.3% 40.3%
14.9% 28.1% 14.1% 26.8% 14.2% 35.7%18.9% 22.7% 12.1% 13.9% 14.6% 26.1%
14.7% 23.9% 13.4% 18.9% 14.4% 31.1%18.4% 31.0% 19.2% 28.8% 18.1% 39.5%
- - - - - -
20122011
2005 2006 2007
2010