capsid structure and its stability at the late stages of...
TRANSCRIPT
Supplementary materials:
Capsid structure and its Stability at the Late Stages of Bacteriophage SPP1 Assembly
Helen E. White, Michael B. Sherman, Sandrine Brasilès, Eric Jacquet, Philippa Seavers ,
Paulo Tavares, Elena V. Orlova
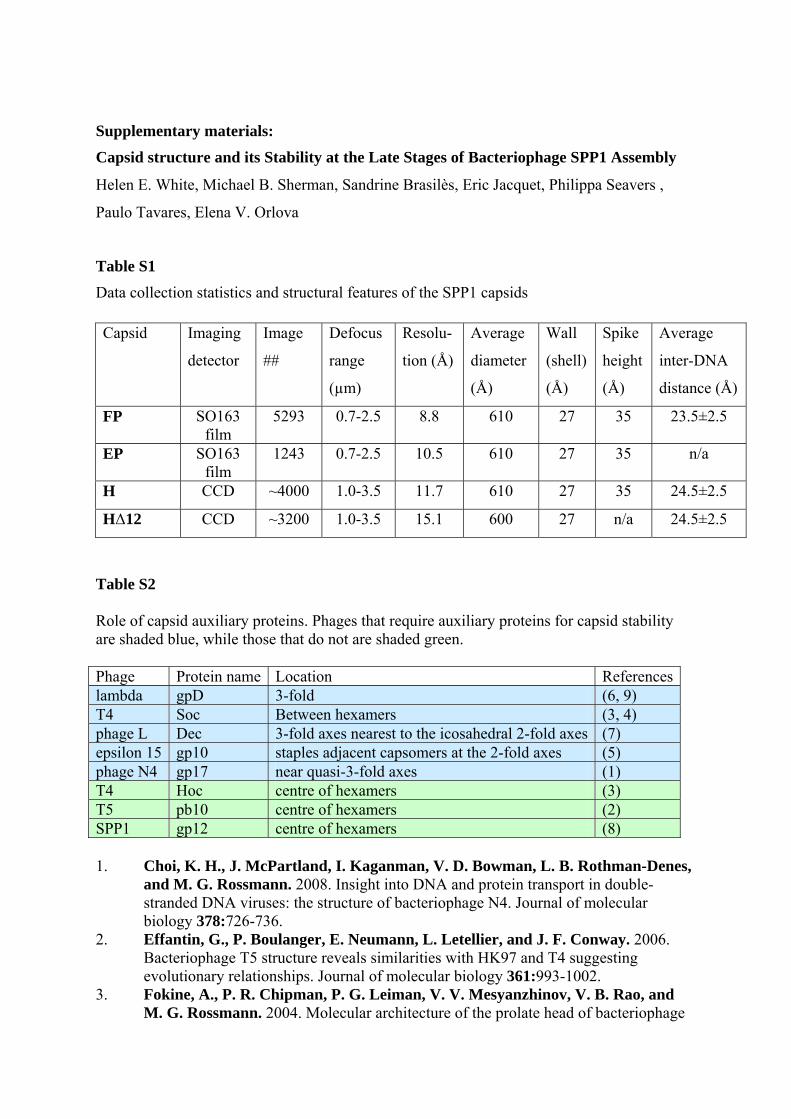
Table S1
Data collection statistics and structural features of the SPP1 capsids
Table S2 Role of capsid auxiliary proteins. Phages that require auxiliary proteins for capsid stability are shaded blue, while those that do not are shaded green. Phage Protein name Location Referenceslambda gpD 3-fold (6, 9) T4 Soc Between hexamers (3, 4) phage L Dec 3-fold axes nearest to the icosahedral 2-fold axes (7) epsilon 15 gp10 staples adjacent capsomers at the 2-fold axes (5) phage N4 gp17 near quasi-3-fold axes (1) T4 Hoc centre of hexamers (3) T5 pb10 centre of hexamers (2) SPP1 gp12 centre of hexamers (8) 1. Choi, K. H., J. McPartland, I. Kaganman, V. D. Bowman, L. B. Rothman-Denes,
and M. G. Rossmann. 2008. Insight into DNA and protein transport in double-stranded DNA viruses: the structure of bacteriophage N4. Journal of molecular biology 378:726-736.
2. Effantin, G., P. Boulanger, E. Neumann, L. Letellier, and J. F. Conway. 2006. Bacteriophage T5 structure reveals similarities with HK97 and T4 suggesting evolutionary relationships. Journal of molecular biology 361:993-1002.
3. Fokine, A., P. R. Chipman, P. G. Leiman, V. V. Mesyanzhinov, V. B. Rao, and M. G. Rossmann. 2004. Molecular architecture of the prolate head of bacteriophage
Capsid Imaging
detector
Image
##
Defocus
range
(µm)
Resolu-
tion (Å)
Average
diameter
(Å)
Wall
(shell)
(Å)
Spike
height
(Å)
Average
inter-DNA
distance (Å)
FP SO163 film
5293 0.7-2.5 8.8 610 27 35 23.5±2.5
EP SO163 film
1243 0.7-2.5 10.5 610 27 35 n/a
H CCD ~4000 1.0-3.5 11.7 610 27 35 24.5±2.5
HΔ12 CCD ~3200 1.0-3.5 15.1 600 27 n/a 24.5±2.5

T4. Proceedings of the National Academy of Sciences of the United States of America 101:6003-6008.
4. Ishii, T., and M. Yanagida. 1977. The two dispensable structural proteins (soc and hoc) of the T4 phage capsid; their purification and properties, isolation and characterization of the defective mutants, and their binding with the defective heads in vitro. Journal of molecular biology 109:487-514.
5. Jiang, W., M. L. Baker, J. Jakana, P. R. Weigele, J. King, and W. Chiu. 2008. Backbone structure of the infectious epsilon15 virus capsid revealed by electron cryomicroscopy. Nature 451:1130-1134.
6. Lander, G. C., A. Evilevitch, M. Jeembaeva, C. S. Potter, B. Carragher, and J. E. Johnson. 2008. Bacteriophage lambda stabilization by auxiliary protein gpD: timing, location, and mechanism of attachment determined by cryo-EM. Structure 16:1399-1406.
7. Tang, L., E. B. Gilcrease, S. R. Casjens, and J. E. Johnson. 2006. Highly discriminatory binding of capsid-cementing proteins in bacteriophage L. Structure 14:837-845.
8. White, H. E., M. B. Sherman, S. Brasilès, E. Jacquet, P. Seavers, P. Tavares, and E. V. Orlova. 2012. Capsid structure and its Stability at the Late Stages of Bacteriophage SPP1 Assembly. J. Virology submitted.
9. Yang, F., P. Forrer, Z. Dauter, J. F. Conway, N. Cheng, M. E. Cerritelli, A. C. Steven, A. Pluckthun, and A. Wlodawer. 2000. Novel fold and capsid-binding properties of the lambda-phage display platform protein gpD. Nature structural biology 7:230-237.
-0.2
0
0.2
0.4
0.6
0.8
1
0 0.1 0.2 0.3
Cro
ss-c
orre
latio
n
Frequency
Fourier Shell Correlations
0.5
H∆12
HEP
FP 8.8 Å
11.7 Å
15.1 Å
10.5 Å
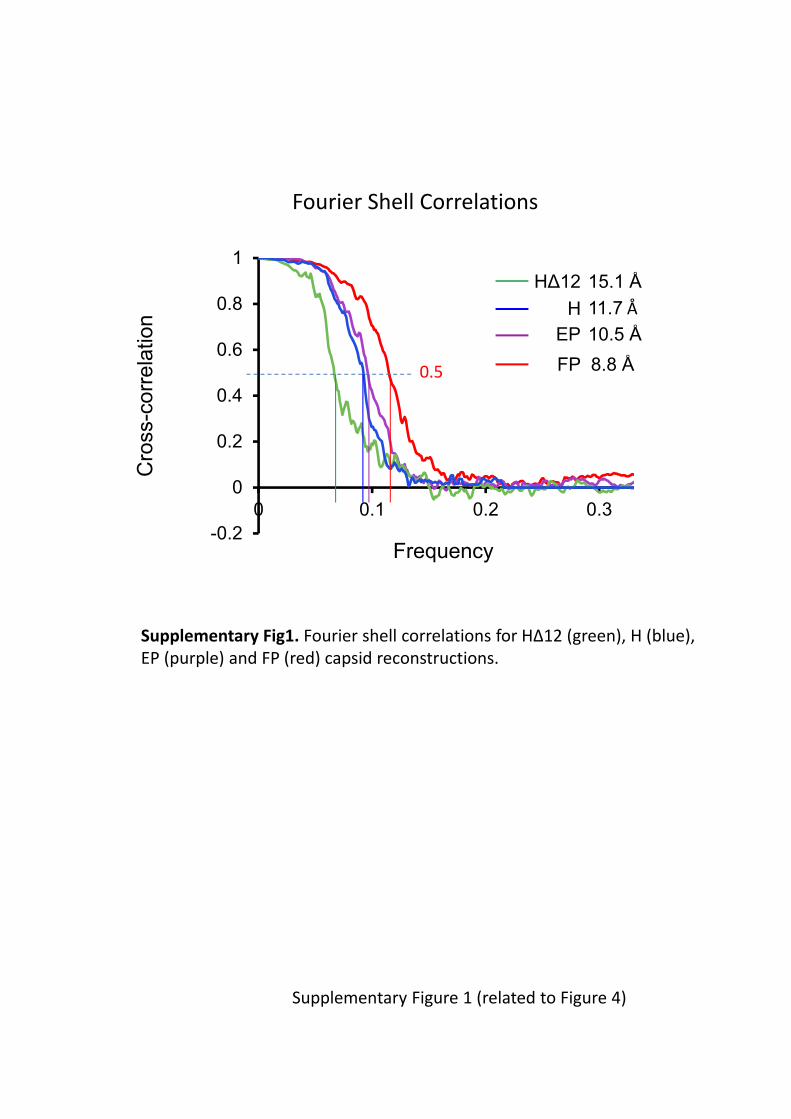
Supplementary Figure 1 (related to Figure 4)
Supplementary Fig1. Fourier shell correlations for HΔ12 (green), H (blue), EP (purple) and FP (red) capsid reconstructions.

Supplementary Figure 2 (related to Figure 2)
B FP
5f 3f general
A HΔ12
5f 3f general
1/(24Å)
1/(24Å)
Supplementary Fig 2. Class averages for the 5‐fold, 3‐fold and a generalview (top) of HΔ12 (A) and FP (B) capsids and their correspondingdiffraction patterns (bottom). All diffractions (Fourier transforms)demonstrate the same distances for DNA packing in decorated and non‐decorated capsids.
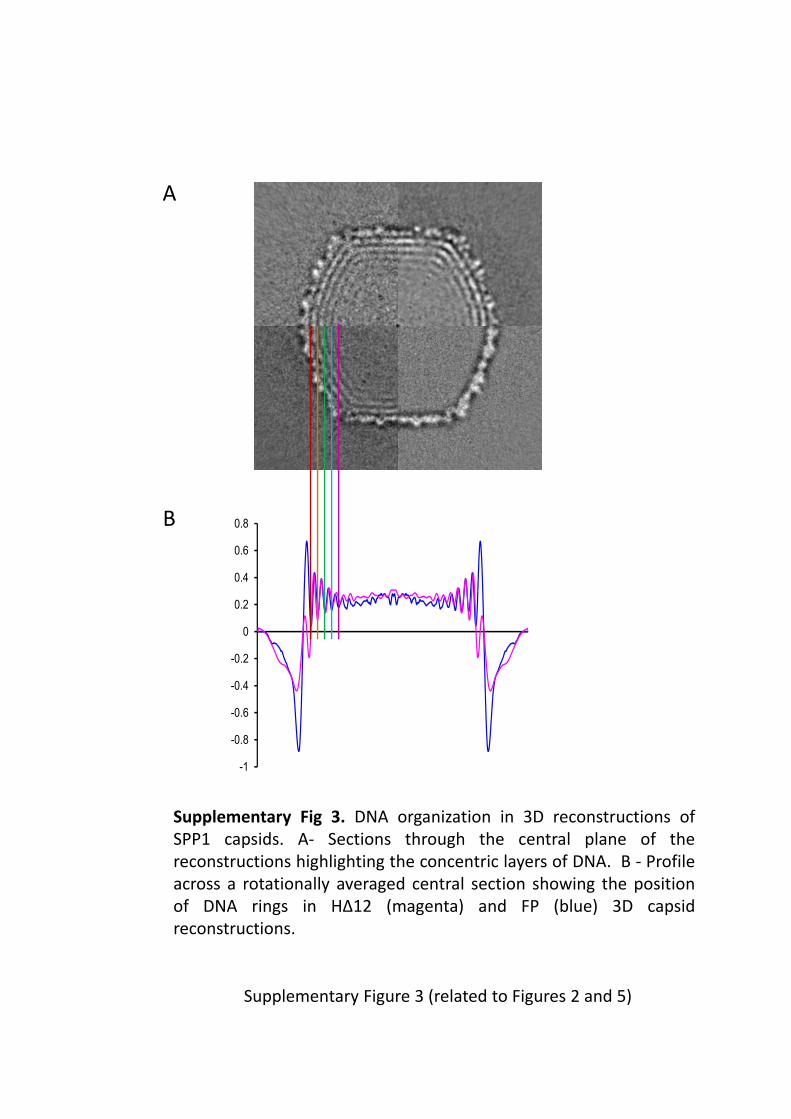
Supplementary Figure 3 (related to Figures 2 and 5)
HΔ12 H
FP EP
B
A
-1
-0.8
-0.6
-0.4
-0.2
0
0.2
0.4
0.6
0.8
Supplementary Fig 3. DNA organization in 3D reconstructions ofSPP1 capsids. A‐ Sections through the central plane of thereconstructions highlighting the concentric layers of DNA. B ‐ Profileacross a rotationally averaged central section showing the positionof DNA rings in HΔ12 (magenta) and FP (blue) 3D capsidreconstructions.
HK97 (1OHG)HK97 (predict)
Lambda (predict)T5 (predict)SPP1 (predict)
E‐LoopβB
MAYTKISDVIVPELFNPYVINTTTQLSAFFQSGIAATD--DELNALAKKAGGGSTLNMPYWNDLDGDSQVLNDTDDLVPQKINSPP1 sequence
HK97 (1OHG)HK97 (predict)
Lambda (predict)T5 (predict)SPP1 (predict)
α3
E‐Loop P‐domain
βC βD
AGQ-DKAVLILRGNAWSS---HDLAATLSGSDPMQAIGSRVAAYWAREMQKIVFAELAGVFSNDDMKDNK-----LDISG---SPP1 sequence
-------------TADGIYS-----------------AETFVDASYKLGDHESLLTAIGMHSATMASAVKQDLIEFVKDSQSG
HK97 (1OHG)HK97 (predict)
Lambda (predict)T5 (predict)SPP1 (predict)
α5 α6
A‐domain
SPP1 sequence
HK97 (1OHG)HK97 (predict)
Lambda (predict)T5 (predict)SPP1 (predict)
P‐domainA‐domainβHβG
IRFP-----TYMN-----------KRVIVDDSMPVETLEDGTK---VFTSYLFGAG----ALGYAEGQPEVPTETARNALGSQSPP1 sequence
HK97 (1OHG)HK97 (predict)
Lambda (predict)T5 (predict)SPP1 (predict) v
P‐domain A‐domain
βI βJ
DILINRKHFVLHPRGVKFTENAMAGTTPTDEELANGANWQ------RVYDPKKIRIVQFKHRLQA------------------SPP1 sequence
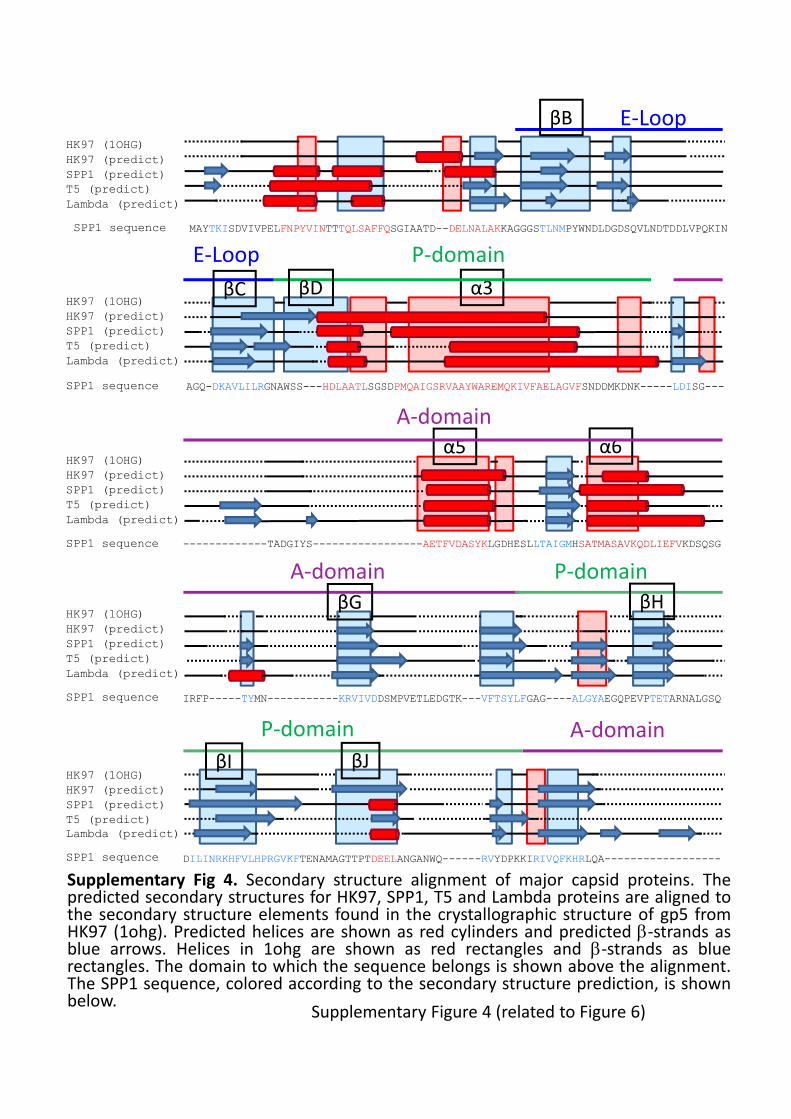
Supplementary Figure 4 (related to Figure 6)
Supplementary Fig 4. Secondary structure alignment of major capsid proteins. Thepredicted secondary structures for HK97, SPP1, T5 and Lambda proteins are aligned tothe secondary structure elements found in the crystallographic structure of gp5 fromHK97 (1ohg). Predicted helices are shown as red cylinders and predicted ‐strands asblue arrows. Helices in 1ohg are shown as red rectangles and ‐strands as bluerectangles. The domain to which the sequence belongs is shown above the alignment.The SPP1 sequence, colored according to the secondary structure prediction, is shownbelow.

A
B
Supplementary Figure 5. Different views of the refined fit of the gp13 model into the EM map.A) Stereo view of one subunit of FP with helices 3, 5, and 6 coloured red. B) Rotated by 90 around Z axis C) Rotated by 80 around X axis.
C
90°
90°
Z
X
Supplementary Figure 5 (related to Figure 6)
α3 α3
α5 α5α6 α6
α3 α3
α6 α6