carbon capture from integrated pulp and board mill€¦ · 2 capture from integrated pulp and board...
TRANSCRIPT
VTT TECHNICAL RESEARCH CENTRE OF FINLAND LTD
CO2 capture from integrated pulp and board millKangas P.1, Onarheim K.1, Hankalin V.2 and Santos S.31VTT Technical Research Centre of Finland2ÅF-Consult Ltd, Finland3IEAGHG, UK
19th Conference on Process Integration, Modelling, and Optimisation for Energy Savings & Emission ReductionPRES 2016, Prague, Czech Republic27-31 August 2016
2
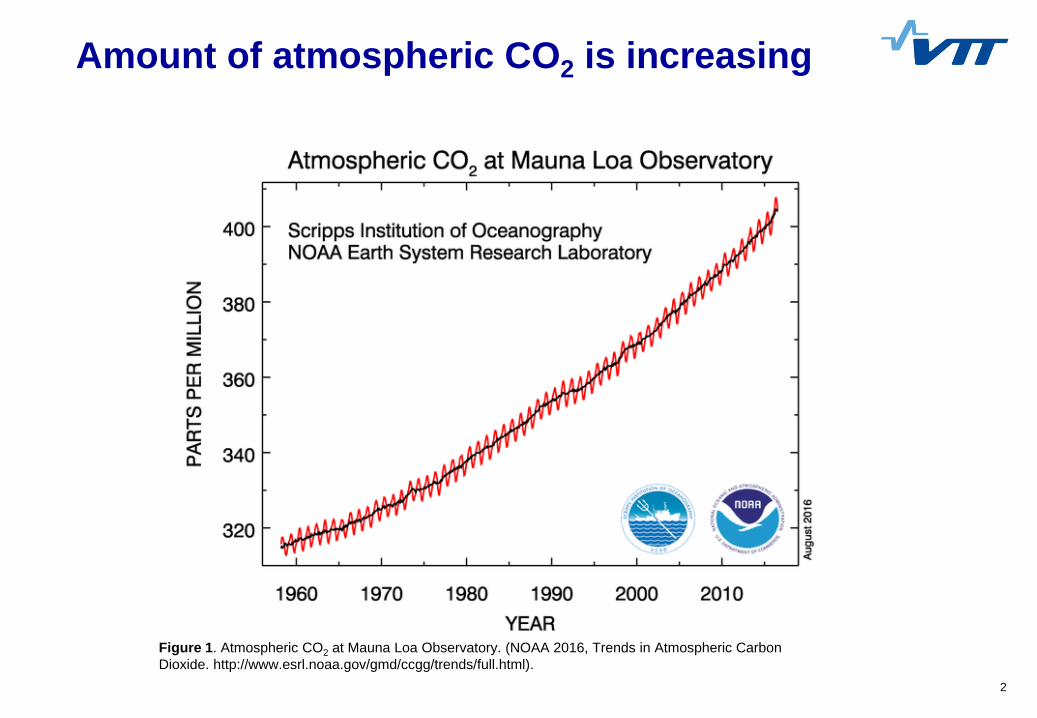
Amount of atmospheric CO2 is increasing
Figure 1. Atmospheric CO2 at Mauna Loa Observatory. (NOAA 2016, Trends in Atmospheric Carbon Dioxide. http://www.esrl.noaa.gov/gmd/ccgg/trends/full.html).
3
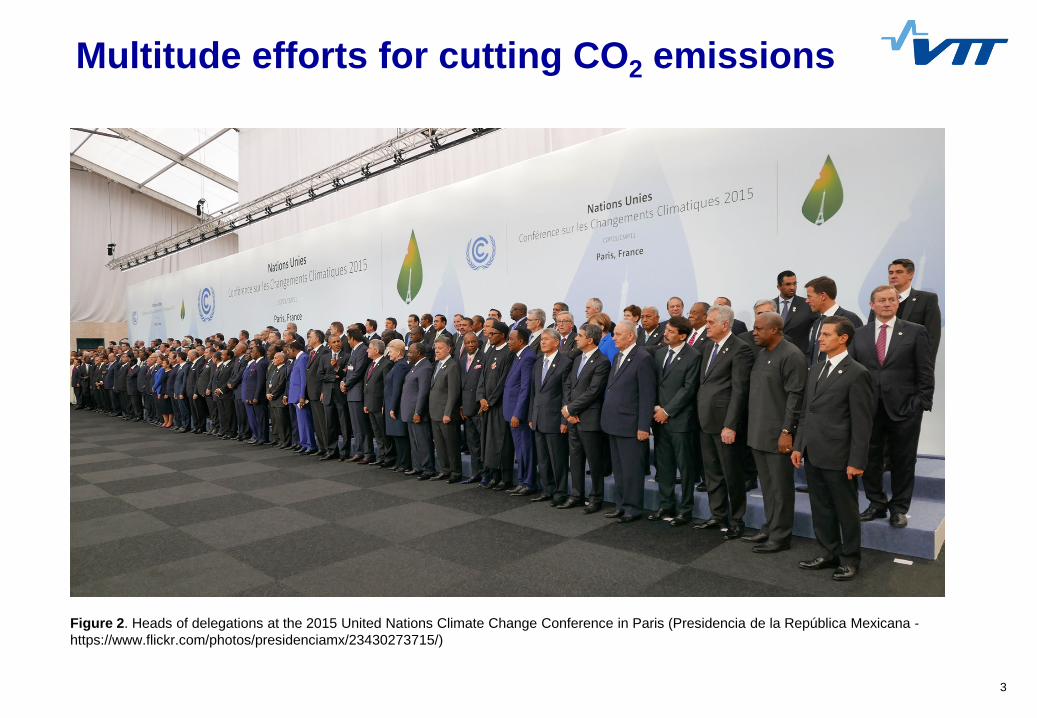
Multitude efforts for cutting CO2 emissions
Figure 2. Heads of delegations at the 2015 United Nations Climate Change Conference in Paris (Presidencia de la República Mexicana -https://www.flickr.com/photos/presidenciamx/23430273715/)
4
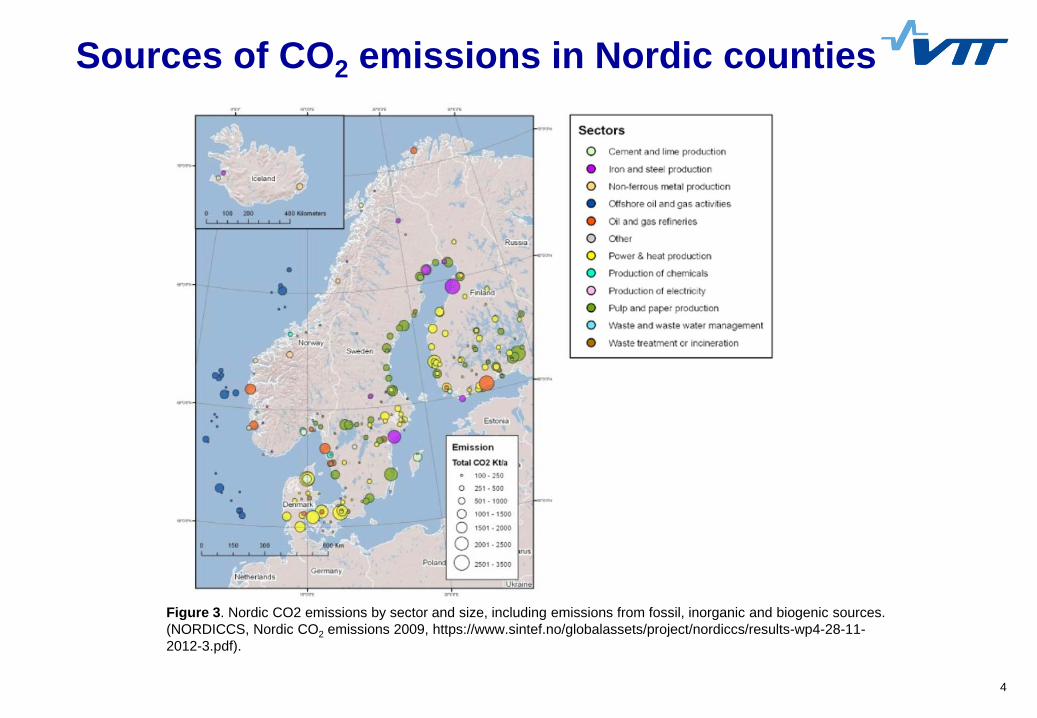
Sources of CO2 emissions in Nordic counties
Figure 3. Nordic CO2 emissions by sector and size, including emissions from fossil, inorganic and biogenic sources. (NORDICCS, Nordic CO2 emissions 2009, https://www.sintef.no/globalassets/project/nordiccs/results-wp4-28-11-2012-3.pdf).
5
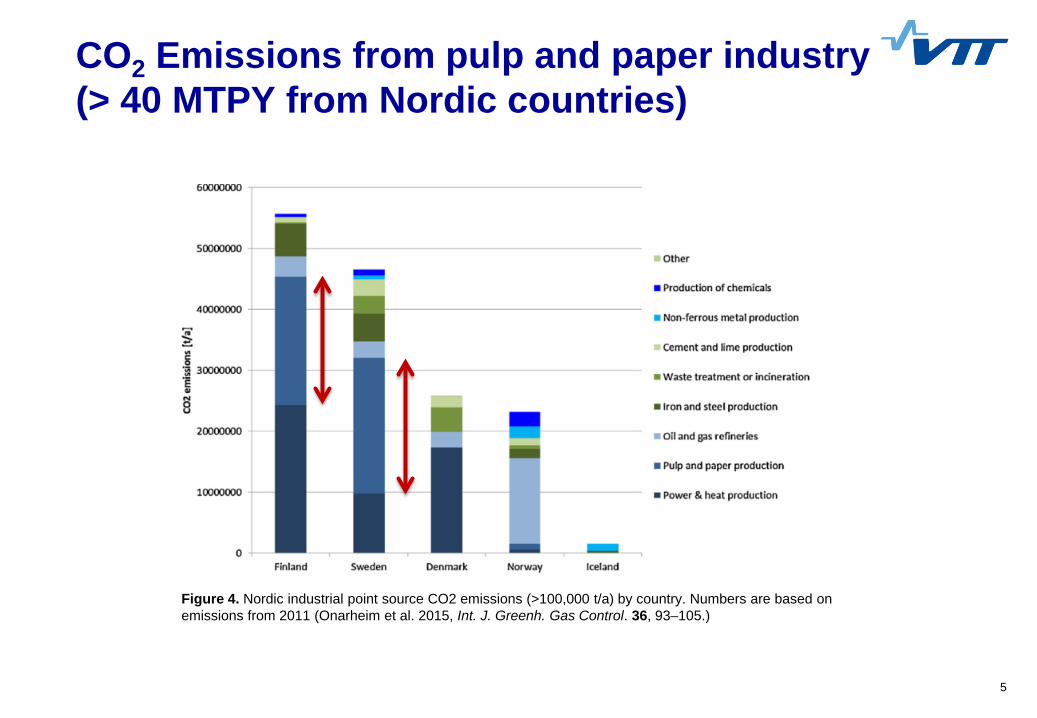
CO2 Emissions from pulp and paper industry(> 40 MTPY from Nordic countries)
Figure 4. Nordic industrial point source CO2 emissions (>100,000 t/a) by country. Numbers are based on emissions from 2011 (Onarheim et al. 2015, Int. J. Greenh. Gas Control. 36, 93–105.)
6
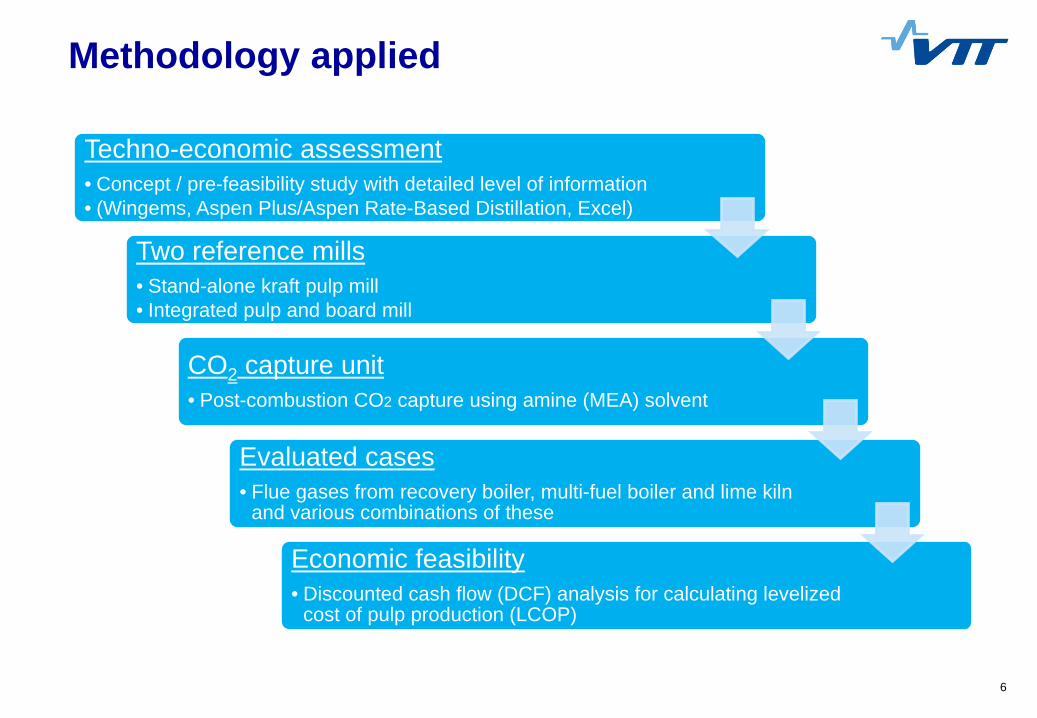
Methodology applied
Techno-economic assessment• Concept / pre-feasibility study with detailed level of information• (Wingems, Aspen Plus/Aspen Rate-Based Distillation, Excel)
Two reference mills• Stand-alone kraft pulp mill• Integrated pulp and board mill
CO2 capture unit• Post-combustion CO2 capture using amine (MEA) solvent
Evaluated cases• Flue gases from recovery boiler, multi-fuel boiler and lime kiln
and various combinations of these
Economic feasibility• Discounted cash flow (DCF) analysis for calculating levelized
cost of pulp production (LCOP)

Reference pulp and board mills
8
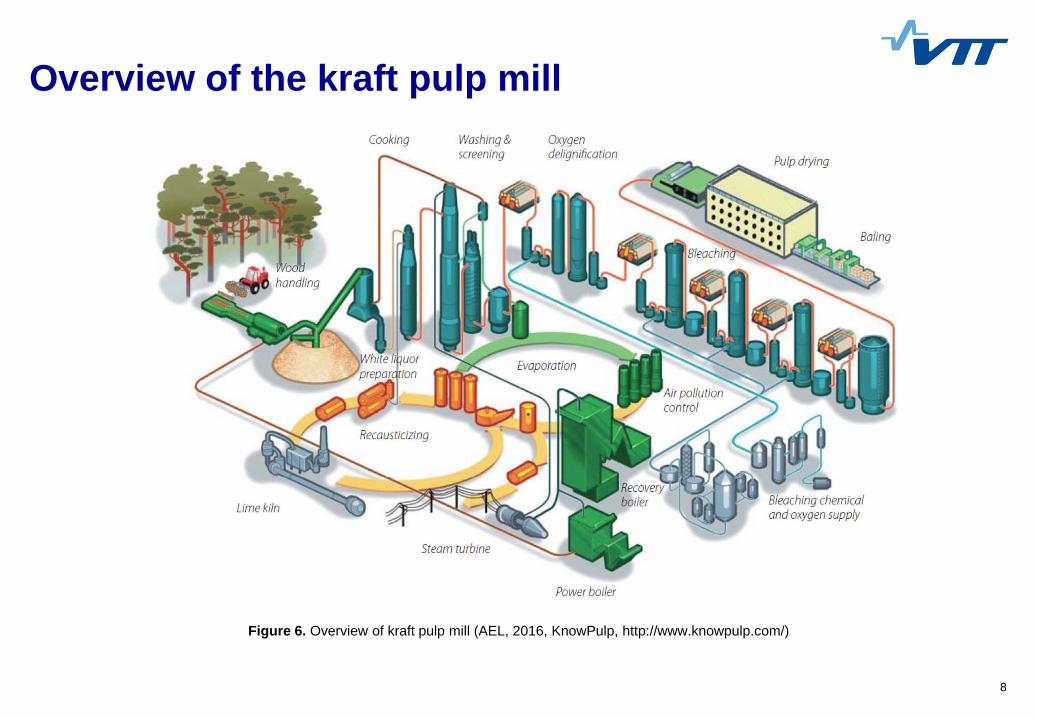
Overview of the kraft pulp mill
Figure 6. Overview of kraft pulp mill (AEL, 2016, KnowPulp, http://www.knowpulp.com/)

9
Carbon balance of a pulp mill
Figure 7. Carbon balance of a typical modern pulp mill. For example mill producing 800 000 adt of bleached softwood kraft pulp (BSKP)will generate approximately 2.1 million tonnes of CO2 annually.
10
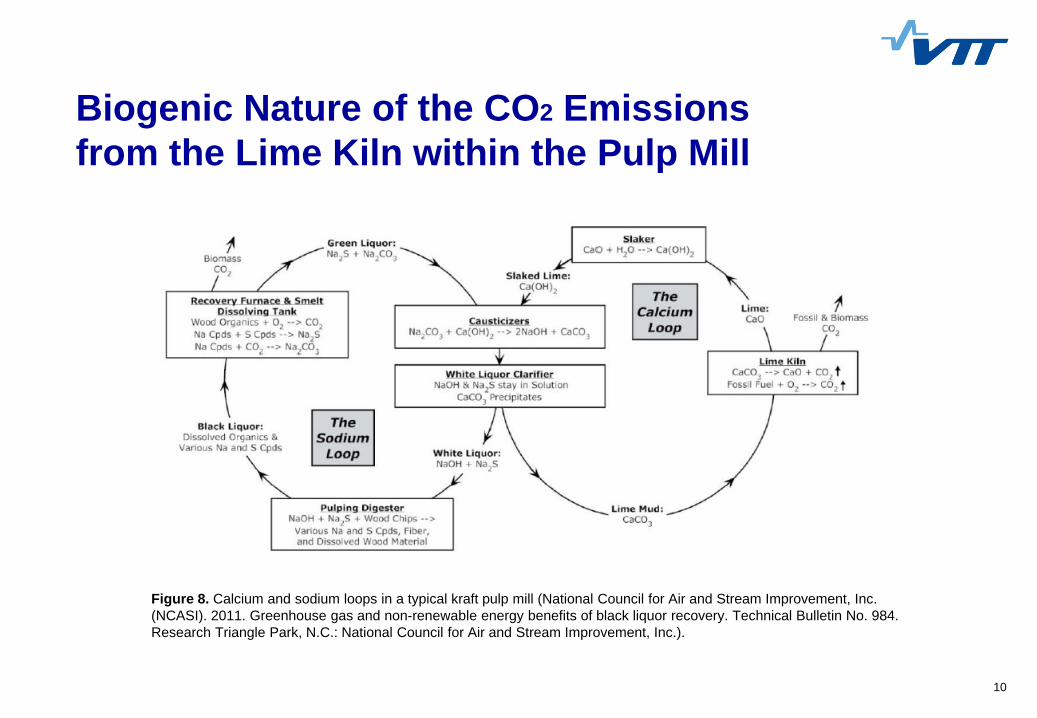
Biogenic Nature of the CO2 Emissionsfrom the Lime Kiln within the Pulp Mill
Figure 8. Calcium and sodium loops in a typical kraft pulp mill (National Council for Air and Stream Improvement, Inc.(NCASI). 2011. Greenhouse gas and non-renewable energy benefits of black liquor recovery. Technical Bulletin No. 984.Research Triangle Park, N.C.: National Council for Air and Stream Improvement, Inc.).
1101/09/2016
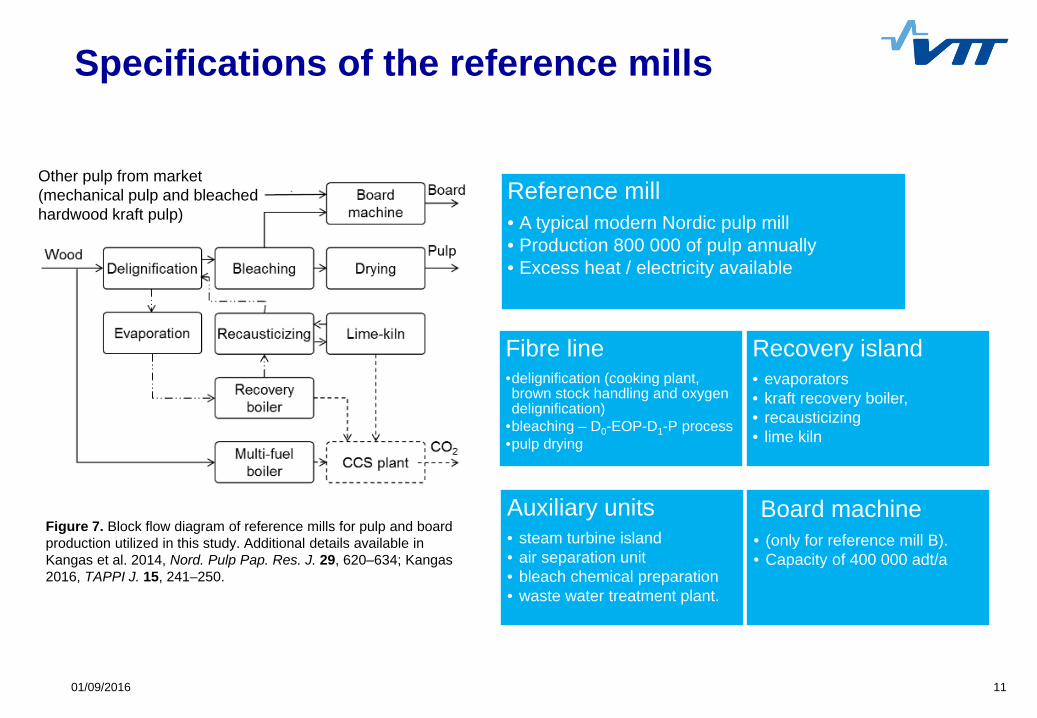
Other pulp from market (mechanical pulp and bleached hardwood kraft pulp)
Specifications of the reference mills
Figure 7. Block flow diagram of reference mills for pulp and board production utilized in this study. Additional details available in Kangas et al. 2014, Nord. Pulp Pap. Res. J. 29, 620–634; Kangas 2016, TAPPI J. 15, 241–250.
Reference mill• A typical modern Nordic pulp mill• Production 800 000 of pulp annually• Excess heat / electricity available
Fibre line•delignification (cooking plant, brown stock handling and oxygen delignification)
•bleaching – D0-EOP-D1-P process•pulp drying
Recovery island• evaporators• kraft recovery boiler,• recausticizing• lime kiln
Auxiliary units• steam turbine island• air separation unit• bleach chemical preparation• waste water treatment plant.
Board machine• (only for reference mill B).• Capacity of 400 000 adt/a

1201/09/2016
Products of the reference mills
A. Kraft pulp mill
• Pulp production 800 000 adt/a• Bleached Softwood Kraft Pulp
• Electricity: 902 GWh/a• Crude tall-oil: 31200 t/a• CO2 emissions:
• Recovery boiler: 1.6 Mt/a• Multi-fuel boiler: 0.3 Mt/a• Lime kiln: 0.2 Mt/a
B. Integrated pulp and board mill
• Pulp production 740 000 adt/a• Bleached Softwood Kraft Pulp
• Board production 400 000 adt/a• 3-ply folding box board
• Electricity: 533 GWh/a• Crude tall-oil: 31200 t/a• CO2 emissions:
• Recovery boiler: 1.6 Mt/a• Multi-fuel boiler: 0.3 Mt/a• Lime kiln: 0.2 Mt/a
1301/09/2016
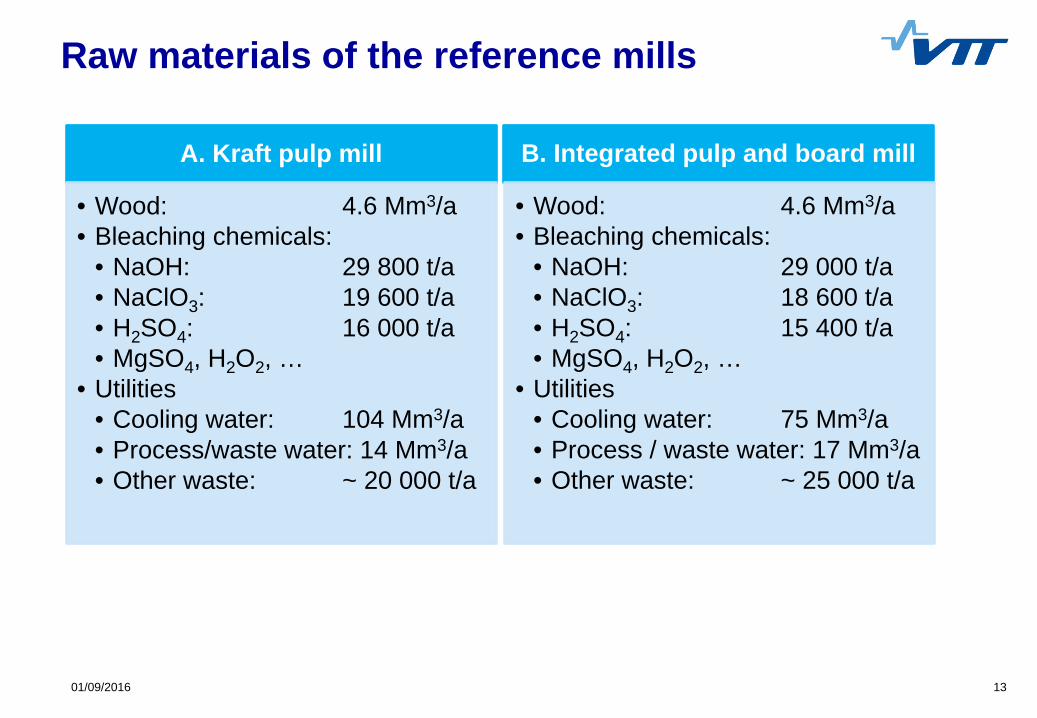
Raw materials of the reference mills
A. Kraft pulp mill
• Wood: 4.6 Mm3/a• Bleaching chemicals:
• NaOH: 29 800 t/a• NaClO3: 19 600 t/a• H2SO4: 16 000 t/a• MgSO4, H2O2, …
• Utilities• Cooling water: 104 Mm3/a• Process/waste water: 14 Mm3/a• Other waste: ~ 20 000 t/a
B. Integrated pulp and board mill
• Wood: 4.6 Mm3/a• Bleaching chemicals:
• NaOH: 29 000 t/a• NaClO3: 18 600 t/a• H2SO4: 15 400 t/a• MgSO4, H2O2, …
• Utilities• Cooling water: 75 Mm3/a• Process / waste water: 17 Mm3/a• Other waste: ~ 25 000 t/a
14
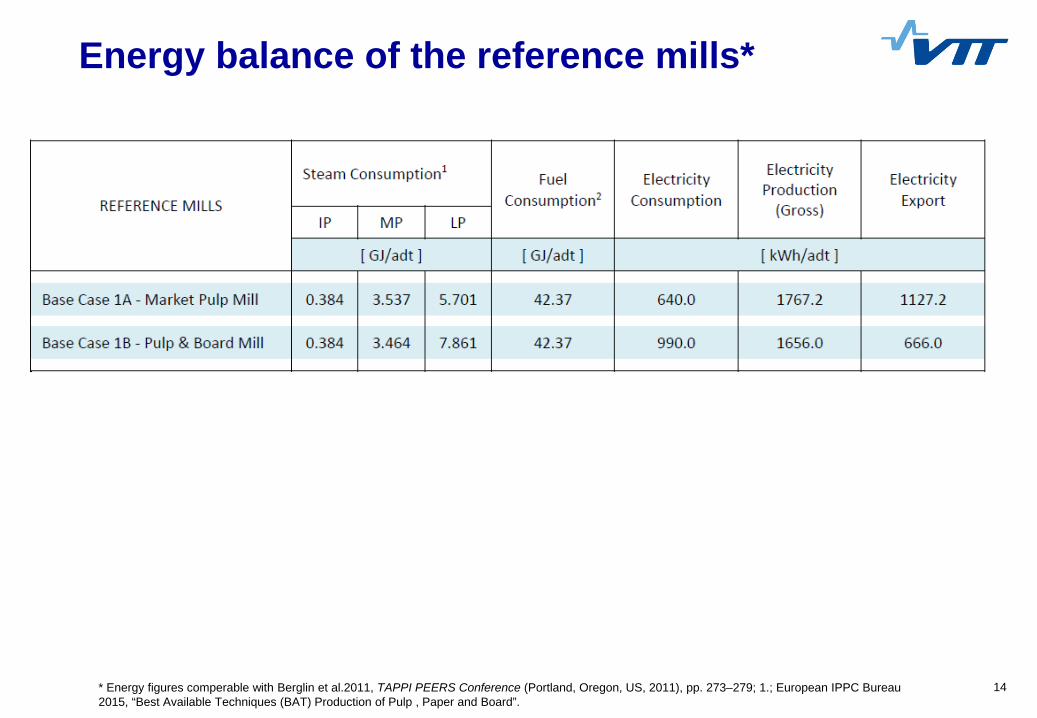
Energy balance of the reference mills*
* Energy figures comperable with Berglin et al.2011, TAPPI PEERS Conference (Portland, Oregon, US, 2011), pp. 273–279; 1.; European IPPC Bureau 2015, “Best Available Techniques (BAT) Production of Pulp , Paper and Board”.
1501/09/2016
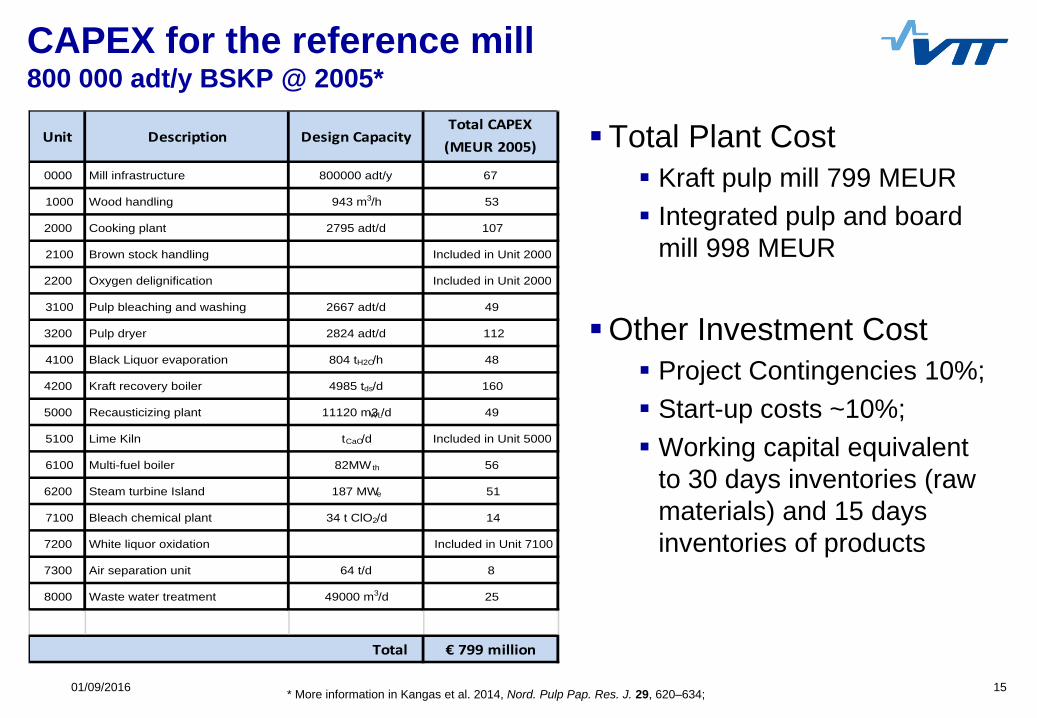
CAPEX for the reference mill 800 000 adt/y BSKP @ 2005*
* More information in Kangas et al. 2014, Nord. Pulp Pap. Res. J. 29, 620–634;
Total Plant Cost Kraft pulp mill 799 MEUR Integrated pulp and board
mill 998 MEUR
Other Investment Cost Project Contingencies 10%; Start-up costs ~10%; Working capital equivalent
to 30 days inventories (raw materials) and 15 days inventories of products
Total CAPEX(MEUR 2005)
0000 Mill infrastructure 800000 adt/y 67
1000 Wood handling 943 m3/h 53
2000 Cooking plant 2795 adt/d 107
2100 Brown stock handling Included in Unit 2000
2200 Oxygen delignification Included in Unit 2000
3100 Pulp bleaching and washing 2667 adt/d 49
3200 Pulp dryer 2824 adt/d 112
4100 Black Liquor evaporation 804 tH2O/h 48
4200 Kraft recovery boiler 4985 tds/d 160
5000 Recausticizing plant 11120 m3WL/d 49
5100 Lime Kiln tCaO/d Included in Unit 5000
6100 Multi-fuel boiler 82MWth 56
6200 Steam turbine Island 187 MWe 51
7100 Bleach chemical plant 34 t ClO2/d 14
7200 White liquor oxidation Included in Unit 7100
7300 Air separation unit 64 t/d 8
8000 Waste water treatment 49000 m3/d 25
€ 799 millionTotal
Unit Description Design Capacity
16
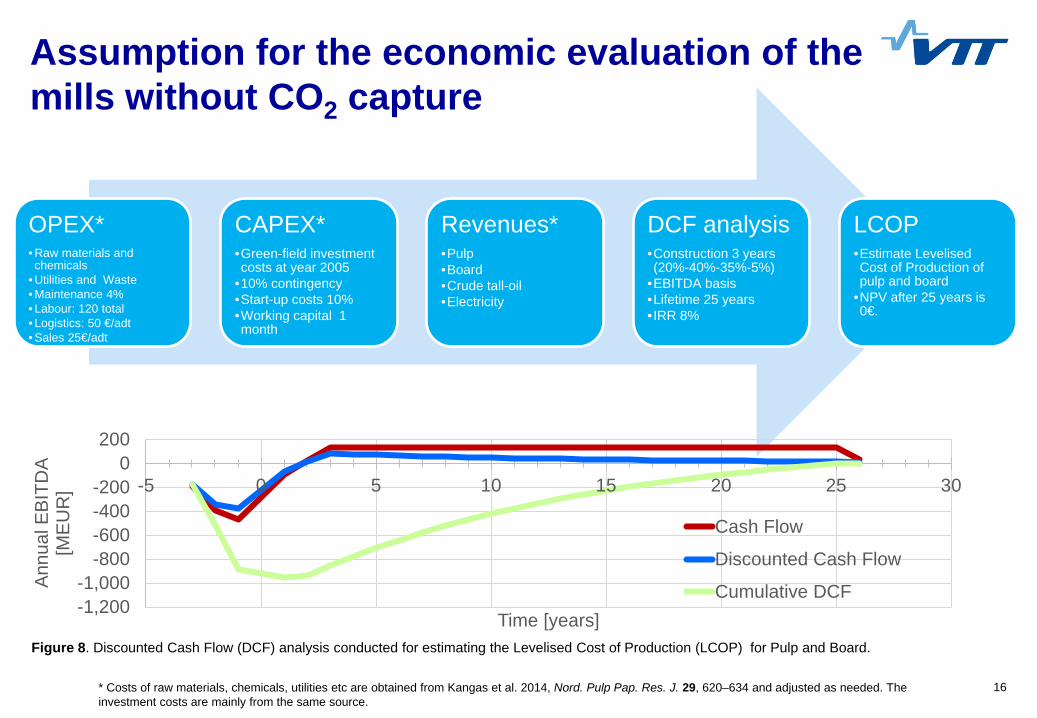
Assumption for the economic evaluation of the mills without CO2 capture
OPEX*• Raw materials and chemicals
• Utilities and Waste• Maintenance 4%• Labour: 120 total• Logistics: 50 €/adt• Sales 25€/adt
CAPEX*•Green-field investment costs at year 2005
•10% contingency•Start-up costs 10%•Working capital 1 month
Revenues*•Pulp•Board•Crude tall-oil•Electricity
DCF analysis•Construction 3 years (20%-40%-35%-5%)
•EBITDA basis•Lifetime 25 years•IRR 8%
LCOP•Estimate LevelisedCost of Production of pulp and board
•NPV after 25 years is 0€.
-1,200-1,000
-800-600-400-200
0200
-5 0 5 10 15 20 25 30
Annu
al E
BITD
A [M
EUR
]
Time [years]
Cash Flow
Discounted Cash Flow
Cumulative DCF
* Costs of raw materials, chemicals, utilities etc are obtained from Kangas et al. 2014, Nord. Pulp Pap. Res. J. 29, 620–634 and adjusted as needed. The investment costs are mainly from the same source.
Figure 8. Discounted Cash Flow (DCF) analysis conducted for estimating the Levelised Cost of Production (LCOP) for Pulp and Board.
17
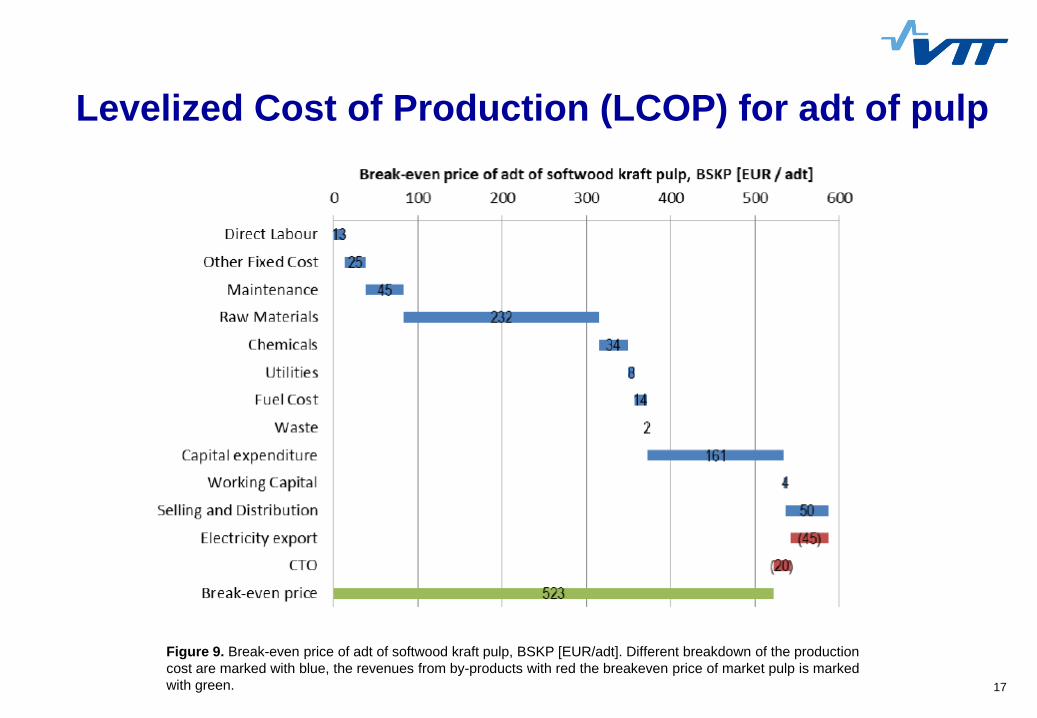
Levelized Cost of Production (LCOP) for adt of pulp
Figure 9. Break-even price of adt of softwood kraft pulp, BSKP [EUR/adt]. Different breakdown of the production cost are marked with blue, the revenues from by-products with red the breakeven price of market pulp is marked with green.
18
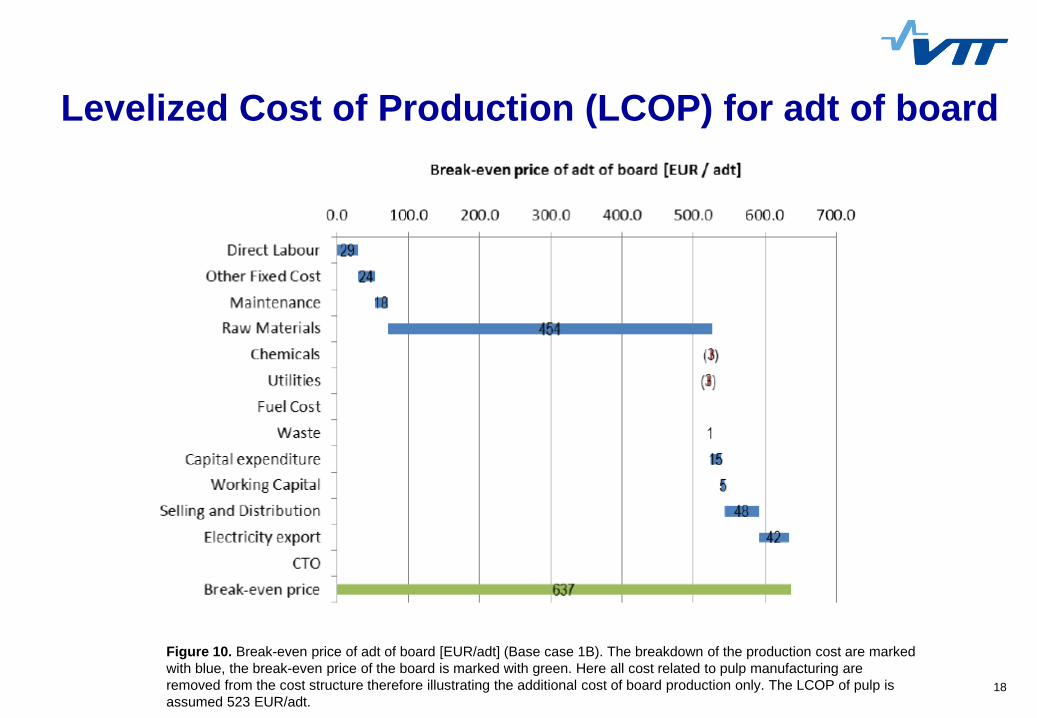
Levelized Cost of Production (LCOP) for adt of board
Figure 10. Break-even price of adt of board [EUR/adt] (Base case 1B). The breakdown of the production cost are marked with blue, the break-even price of the board is marked with green. Here all cost related to pulp manufacturing are removed from the cost structure therefore illustrating the additional cost of board production only. The LCOP of pulp is assumed 523 EUR/adt.
19
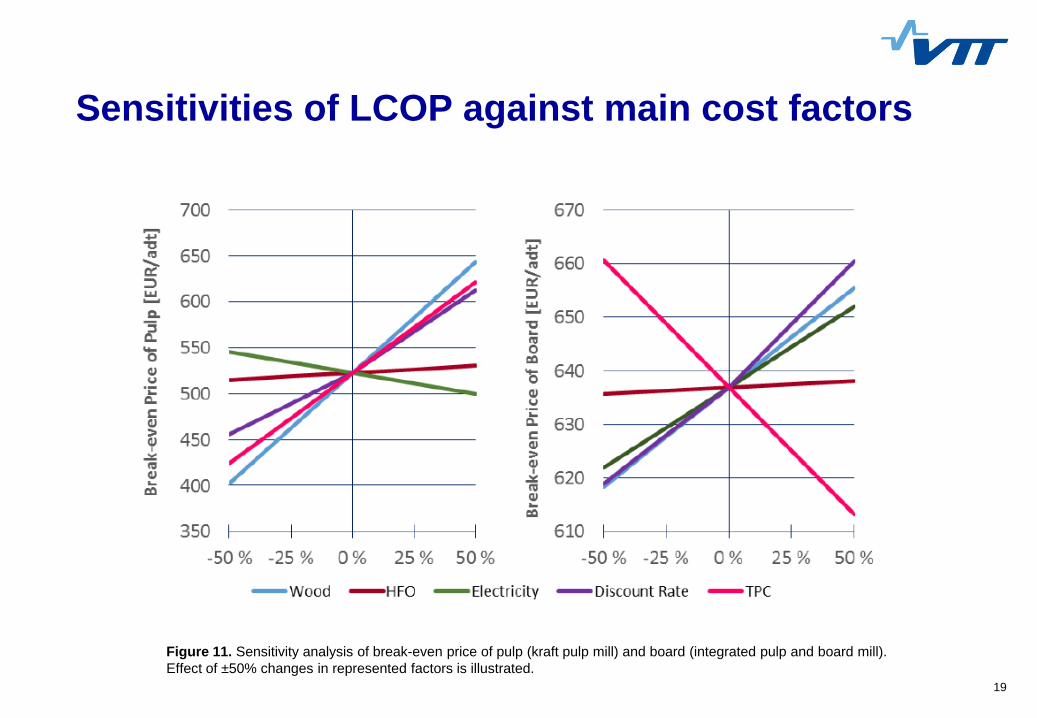
Sensitivities of LCOP against main cost factors
Figure 11. Sensitivity analysis of break-even price of pulp (kraft pulp mill) and board (integrated pulp and board mill). Effect of ±50% changes in represented factors is illustrated.
2001/09/2016
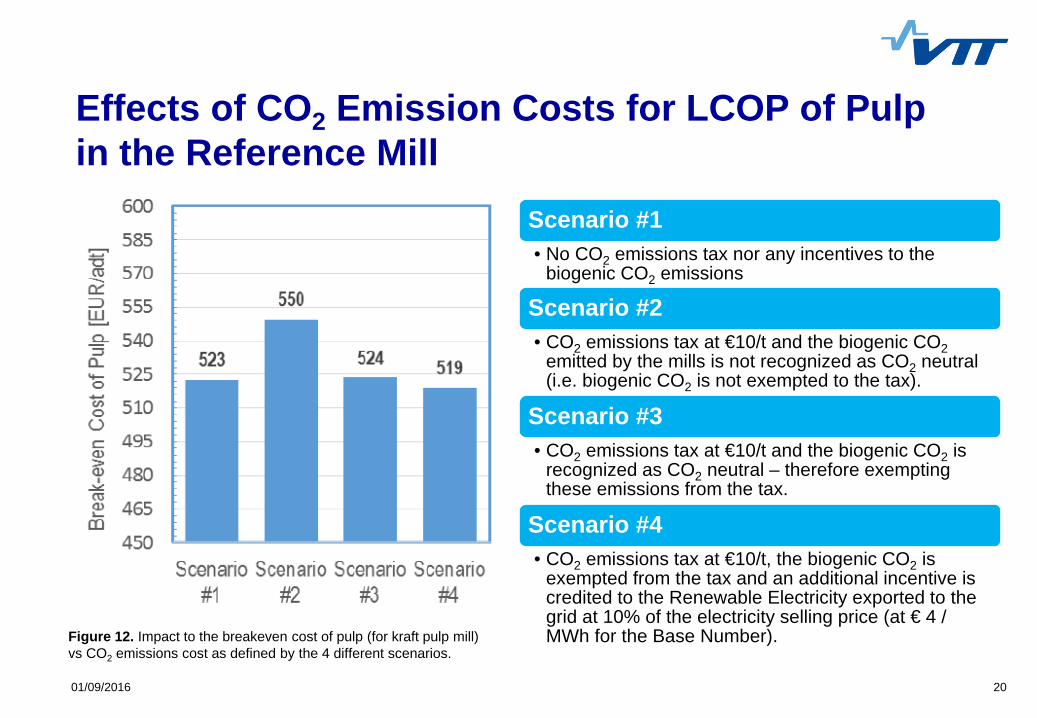
Effects of CO2 Emission Costs for LCOP of Pulp in the Reference Mill
Figure 12. Impact to the breakeven cost of pulp (for kraft pulp mill) vs CO2 emissions cost as defined by the 4 different scenarios.
Scenario #1• No CO2 emissions tax nor any incentives to the
biogenic CO2 emissions
Scenario #2• CO2 emissions tax at €10/t and the biogenic CO2
emitted by the mills is not recognized as CO2 neutral (i.e. biogenic CO2 is not exempted to the tax).
Scenario #3• CO2 emissions tax at €10/t and the biogenic CO2 is
recognized as CO2 neutral – therefore exempting these emissions from the tax.
Scenario #4• CO2 emissions tax at €10/t, the biogenic CO2 is
exempted from the tax and an additional incentive is credited to the Renewable Electricity exported to the grid at 10% of the electricity selling price (at € 4 / MWh for the Base Number).
21
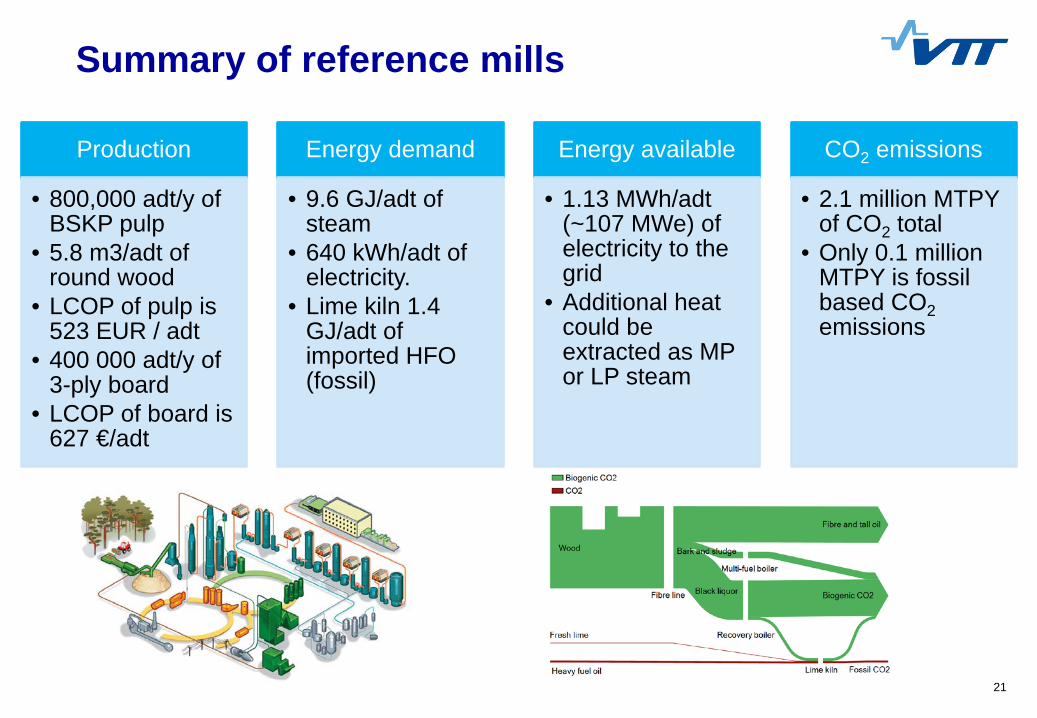
Summary of reference mills
Production
• 800,000 adt/y of BSKP pulp
• 5.8 m3/adt of round wood
• LCOP of pulp is 523 EUR / adt
• 400 000 adt/y of 3-ply board
• LCOP of board is 627 €/adt
Energy demand
• 9.6 GJ/adt of steam
• 640 kWh/adt of electricity.
• Lime kiln 1.4 GJ/adt of imported HFO (fossil)
Energy available
• 1.13 MWh/adt (~107 MWe) of electricity to the grid
• Additional heat could be extracted as MP or LP steam
CO2 emissions
• 2.1 million MTPY of CO2 total
• Only 0.1 million MTPY is fossil based CO2emissions
CO2 capture plant
23
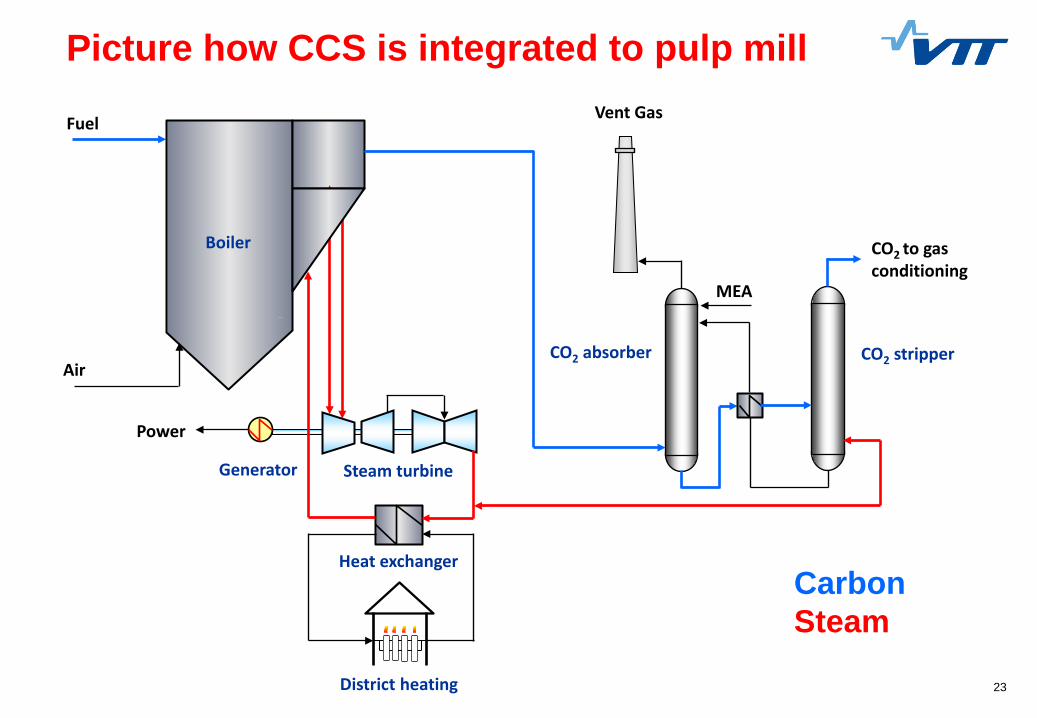
Picture how CCS is integrated to pulp millVent Gas
Boiler
Steam turbine
Power
Generator
Heat exchanger
District heating
CO2 to gasconditioning
Fuel
Air
CarbonSteam
CO2 absorber CO2 stripper
MEA
24
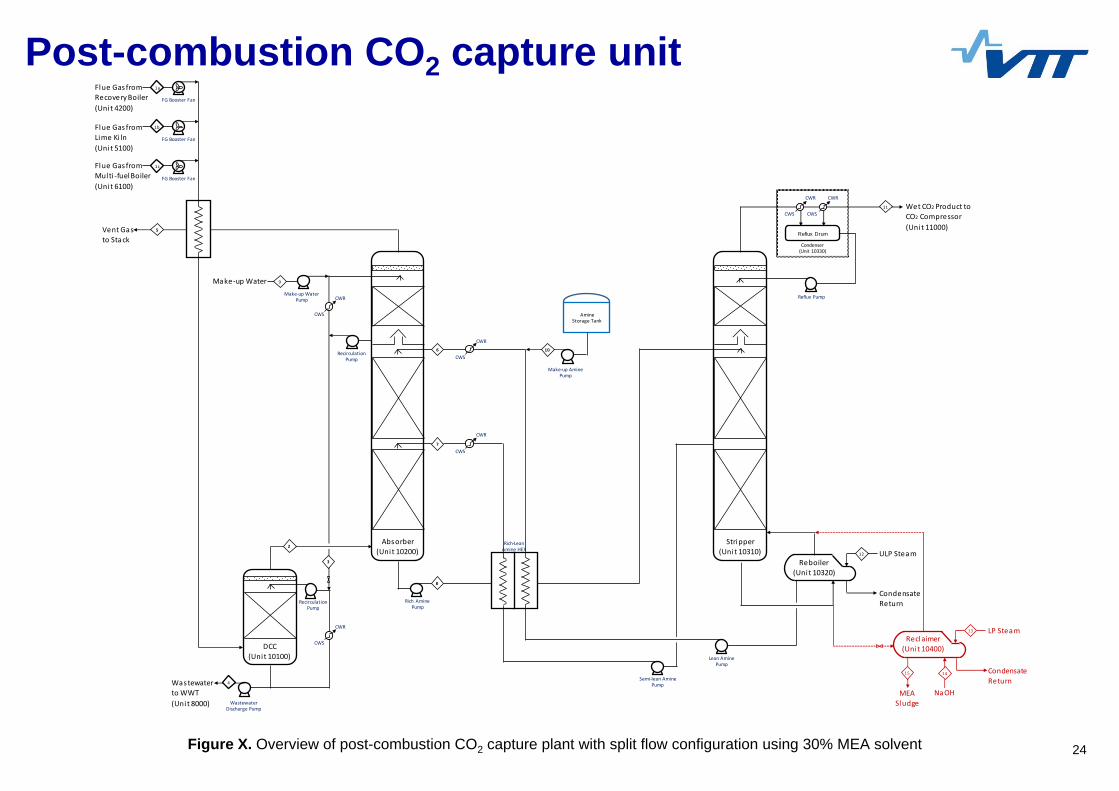
Post-combustion CO2 capture unit
Figure X. Overview of post-combustion CO2 capture plant with split flow configuration using 30% MEA solvent
Reflux Drum
CWS
CWR
CWS
CWR
CWS
CWR
CWS
CWR
CWS
CWR
Wet CO2 Product toCO2 Compressor (Uni t 11000)
Make‐up Amine Pump
Lean Amine Pump
Semi‐lean Amine Pump
Rich Amine Pump
Reboiler(Uni t 10320)
RecirculationPump
Make‐up Water Pump Reflux Pump
Condenser(Unit 10330)
Amine Storage Tank
Stripper(Uni t 10310)
Absorber(Uni t 10200)
MEA Sludge
Vent Gasto Stack
Make‐up Water
ULP Steam
Condensate Return
CWS
CWR
RecirculationPump
Wastewater Discharge Pump
Wastewaterto WWT (Uni t 8000)
DCC(Unit 10100)
4
LP Steam
NaOH
Rich‐Lean Amine HEX
Flue Gas from Recovery Boiler (Uni t 4200)
Flue Gas from Lime Ki ln(Uni t 5100)
Flue Gas from Multi ‐fuel Boiler(Uni t 6100)
1a
FG Booster Fan
FG Booster Fan
FG Booster Fan
1b
1c
Reclaimer(Unit 10400)
Condensate Return
5
9
12
11
15
13
2
8
3
6
7
10
14
25
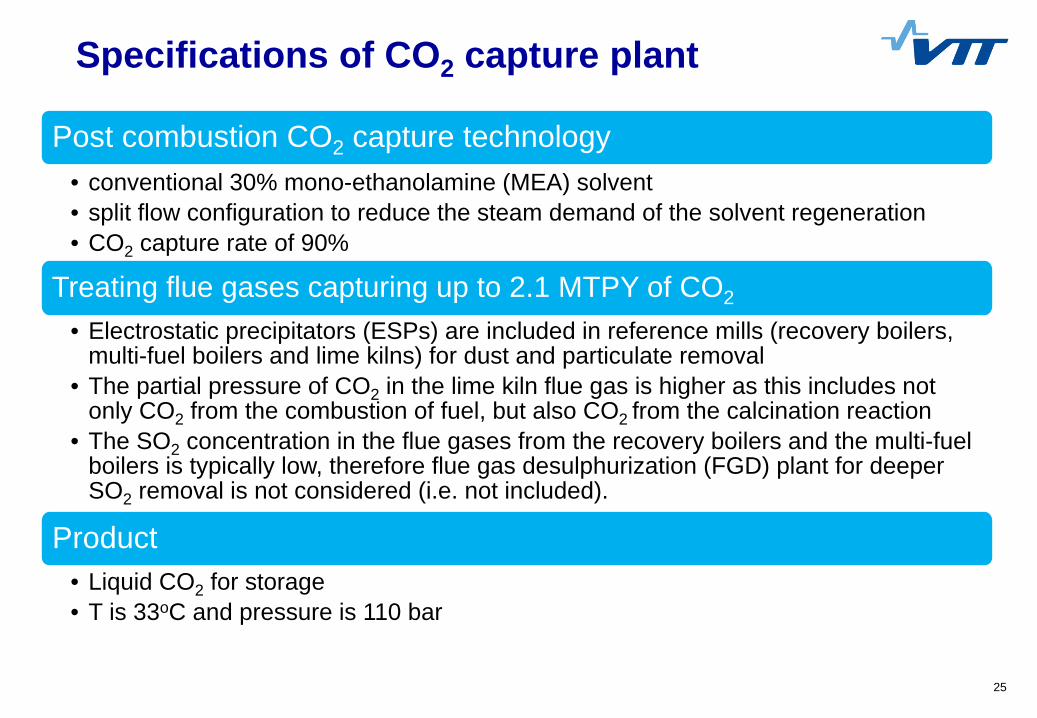
Specifications of CO2 capture plant
Post combustion CO2 capture technology• conventional 30% mono-ethanolamine (MEA) solvent• split flow configuration to reduce the steam demand of the solvent regeneration• CO2 capture rate of 90%
Treating flue gases capturing up to 2.1 MTPY of CO2
• Electrostatic precipitators (ESPs) are included in reference mills (recovery boilers, multi-fuel boilers and lime kilns) for dust and particulate removal
• The partial pressure of CO2 in the lime kiln flue gas is higher as this includes not only CO2 from the combustion of fuel, but also CO2 from the calcination reaction
• The SO2 concentration in the flue gases from the recovery boilers and the multi-fuel boilers is typically low, therefore flue gas desulphurization (FGD) plant for deeper SO2 removal is not considered (i.e. not included).
Product• Liquid CO2 for storage• T is 33oC and pressure is 110 bar
26
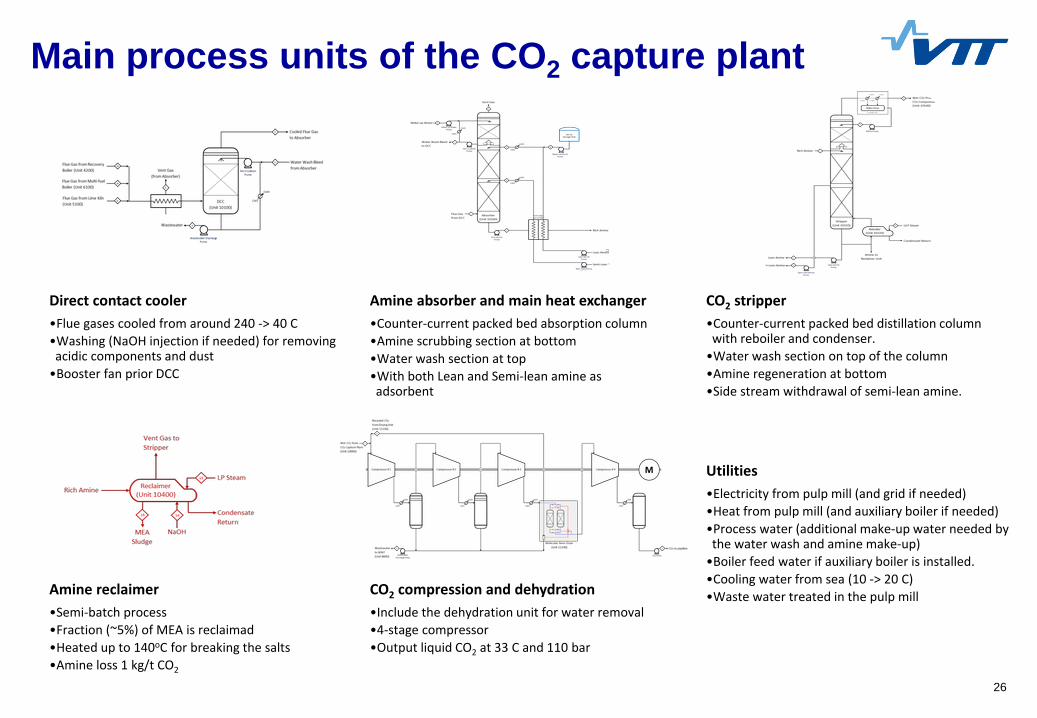
Main process units of the CO2 capture plant
Direct contact cooler•Flue gases cooled from around 240 -> 40 C•Washing (NaOH injection if needed) for removing acidic components and dust•Booster fan prior DCC
Amine absorber and main heat exchanger•Counter-current packed bed absorption column•Amine scrubbing section at bottom•Water wash section at top•With both Lean and Semi-lean amine as adsorbent
CO2 stripper•Counter-current packed bed distillation column with reboiler and condenser.•Water wash section on top of the column•Amine regeneration at bottom•Side stream withdrawal of semi-lean amine.
Amine reclaimer•Semi-batch process•Fraction (~5%) of MEA is reclaimad•Heated up to 140oC for breaking the salts•Amine loss 1 kg/t CO2
CO2 compression and dehydration•Include the dehydration unit for water removal•4-stage compressor•Output liquid CO2 at 33 C and 110 bar
Utilities•Electricity from pulp mill (and grid if needed)•Heat from pulp mill (and auxiliary boiler if needed)•Process water (additional make-up water needed by the water wash and amine make-up)•Boiler feed water if auxiliary boiler is installed.•Cooling water from sea (10 -> 20 C)•Waste water treated in the pulp mill

01/09/2016 27
Evaluated CO2 capture cases
A: Capture of CO2 in the Kraft Recovery Boiler (REC) only.• Total 1.5 MTPY CO2 captured; 68% of total emissions.
B: Capture of CO2 in the Multi-fuel Boiler (MFB) only.• Total 0.3 MTPY CO2 captured; 13% of total emissions.
C: Capture of CO2 in the Lime Kiln (LK) only• Total 0.2 MTPY CO2 captured; 9% of total emissions.
D: Capture of CO2 in both Kraft & Multi-boilers only.• Total 1.7 MTPY CO2 captured; 81% of total emissions.
E: Capture of CO2 in both Kraft Boiler & Lime Kiln only.• Total 1.7 MTPY CO2 captured; 77% of total emissions.
F: Capture of CO2 in Kraft, Multi-fuel Boilers & Lime Kiln• Total 1.9 MTPY CO2 captured; 90% of total emissions.
28
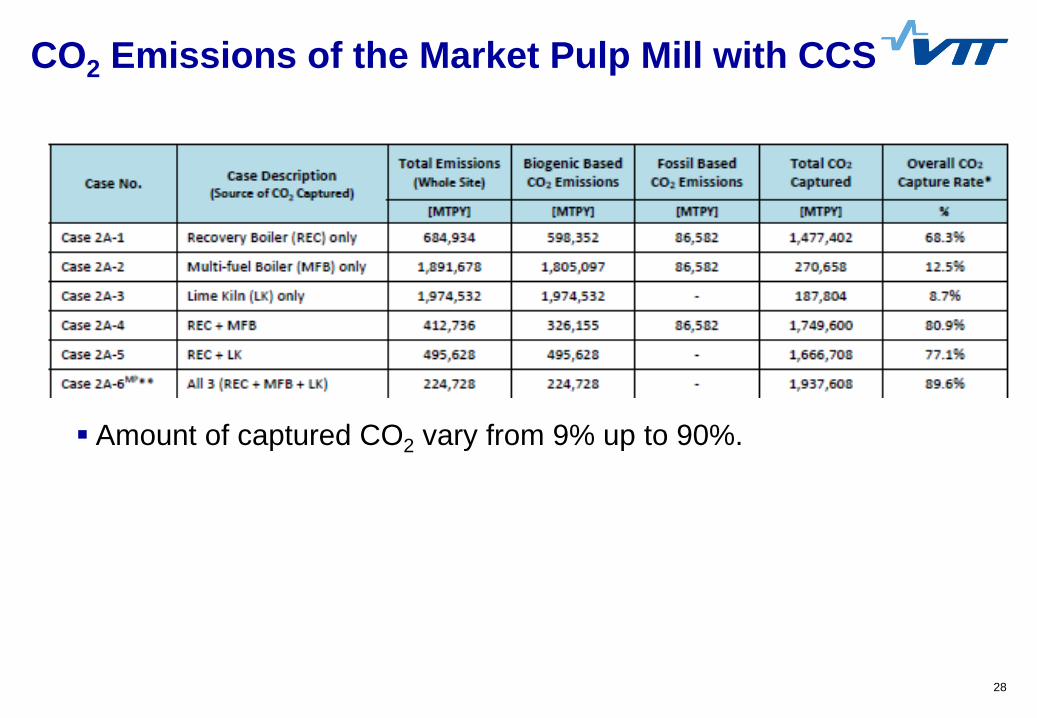
CO2 Emissions of the Market Pulp Mill with CCS
Amount of captured CO2 vary from 9% up to 90%.
01/09/2016 29
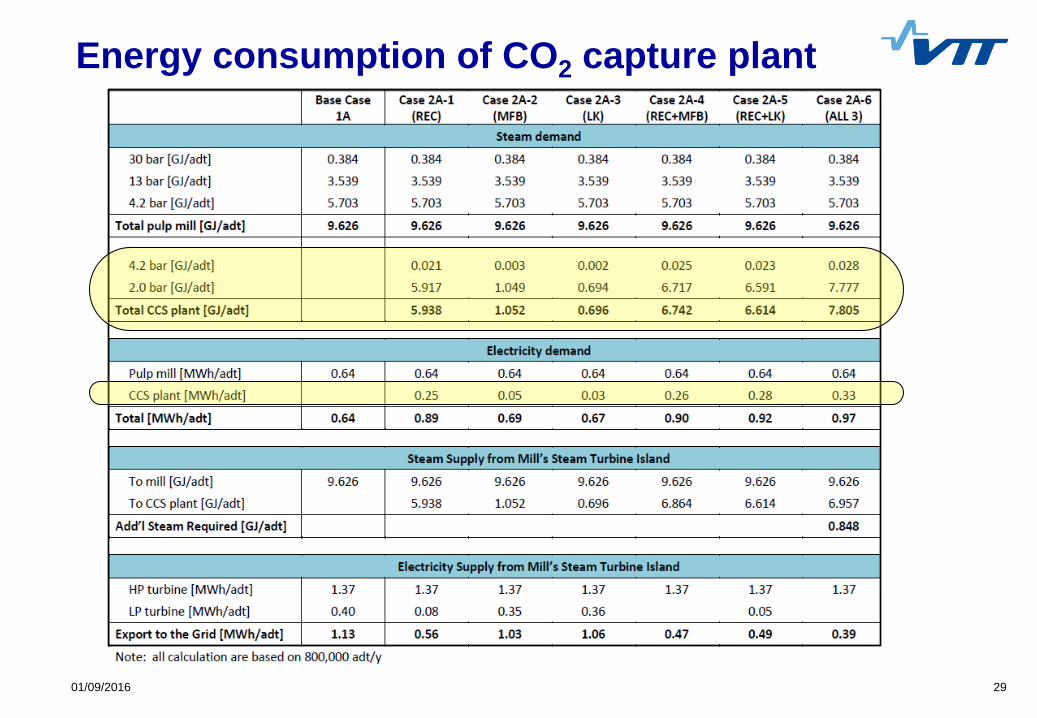
Energy consumption of CO2 capture plant
30
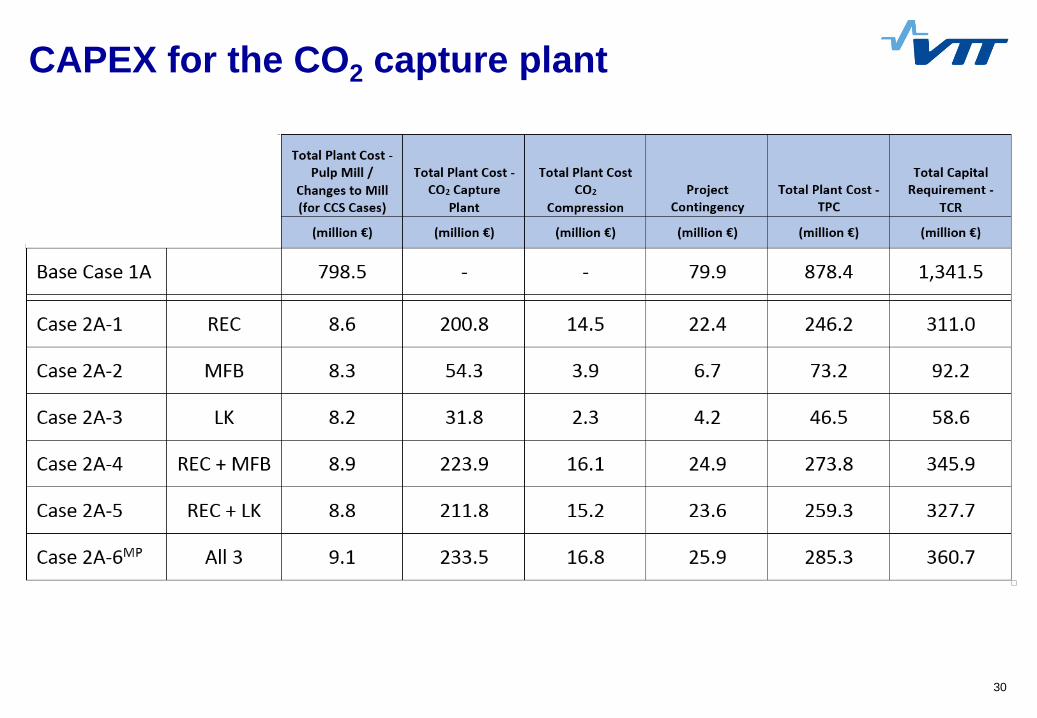
CAPEX for the CO2 capture plant
31
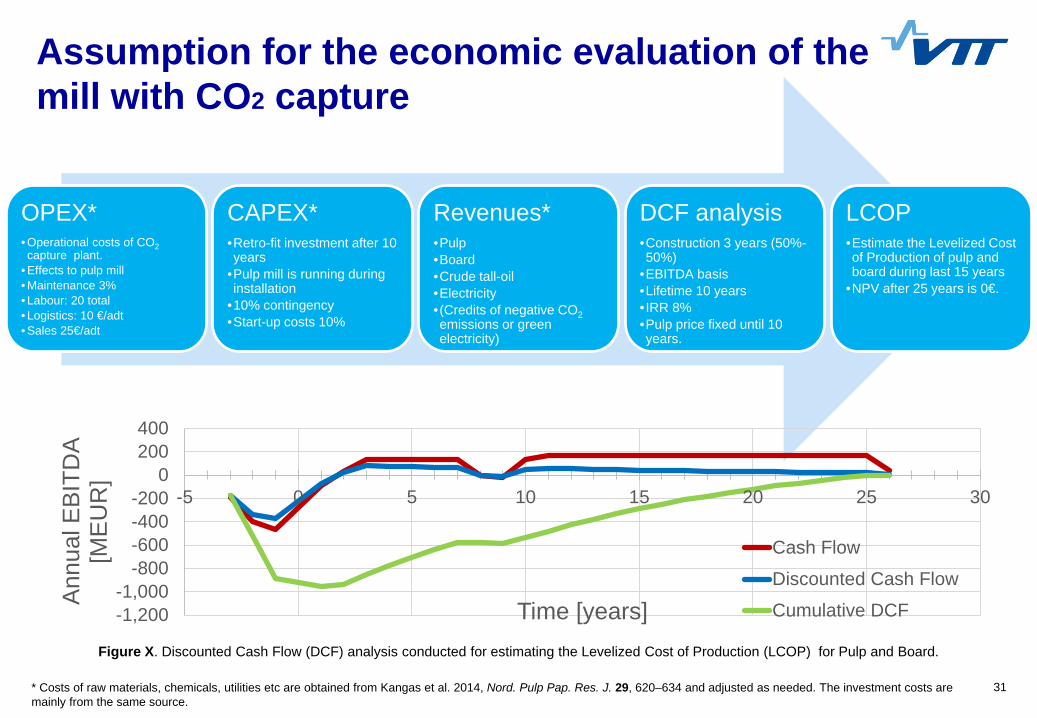
Assumption for the economic evaluation of the mill with CO2 capture
OPEX*• Operational costs of CO2capture plant.
• Effects to pulp mill• Maintenance 3%• Labour: 20 total• Logistics: 10 €/adt• Sales 25€/adt
CAPEX*•Retro-fit investment after 10 years
•Pulp mill is running during installation
•10% contingency•Start-up costs 10%
Revenues*•Pulp•Board•Crude tall-oil•Electricity•(Credits of negative CO2emissions or green electricity)
DCF analysis•Construction 3 years (50%-50%)
•EBITDA basis•Lifetime 10 years•IRR 8%•Pulp price fixed until 10 years.
LCOP•Estimate the Levelized Cost of Production of pulp and board during last 15 years
•NPV after 25 years is 0€.
* Costs of raw materials, chemicals, utilities etc are obtained from Kangas et al. 2014, Nord. Pulp Pap. Res. J. 29, 620–634 and adjusted as needed. The investment costs are mainly from the same source.
Figure X. Discounted Cash Flow (DCF) analysis conducted for estimating the Levelized Cost of Production (LCOP) for Pulp and Board.
-1,200-1,000
-800-600-400-200
0200400
-5 0 5 10 15 20 25 30
Ann
ual E
BIT
DA
[ME
UR
]
Time [years]
Cash Flow
Discounted Cash Flow
Cumulative DCF
32
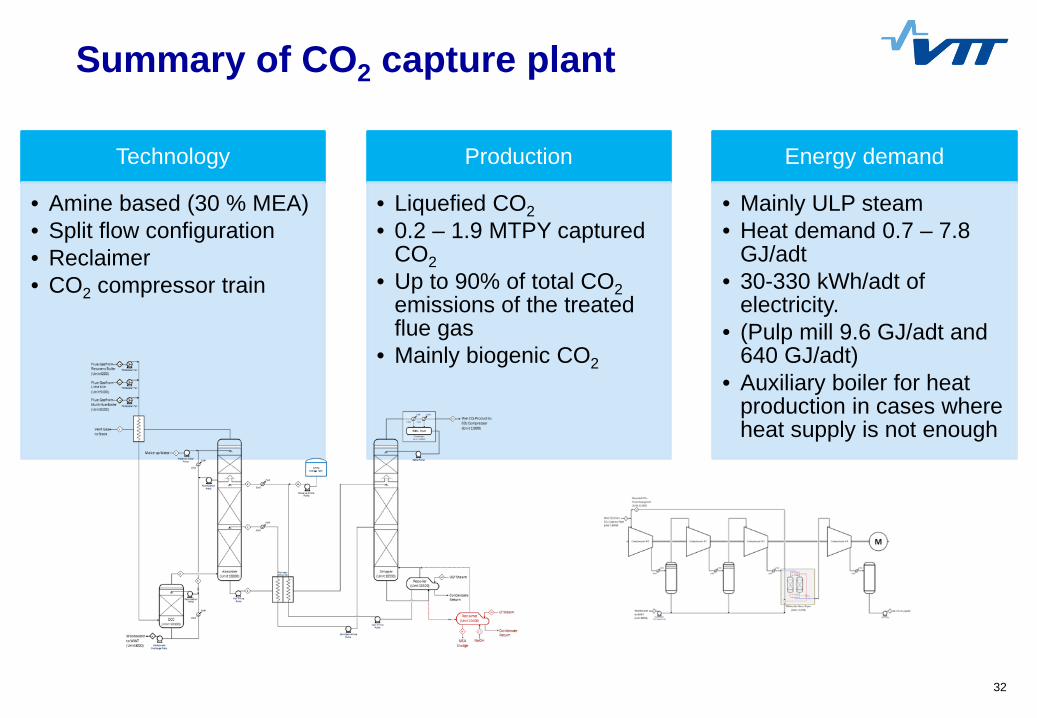
Summary of CO2 capture plant
Technology
• Amine based (30 % MEA)• Split flow configuration• Reclaimer• CO2 compressor train
Production
• Liquefied CO2• 0.2 – 1.9 MTPY captured
CO2• Up to 90% of total CO2
emissions of the treated flue gas
• Mainly biogenic CO2
Energy demand
• Mainly ULP steam• Heat demand 0.7 – 7.8
GJ/adt• 30-330 kWh/adt of
electricity. • (Pulp mill 9.6 GJ/adt and
640 GJ/adt)• Auxiliary boiler for heat
production in cases where heat supply is not enough

Process integration
34
Evaluated alternatives for heat integration
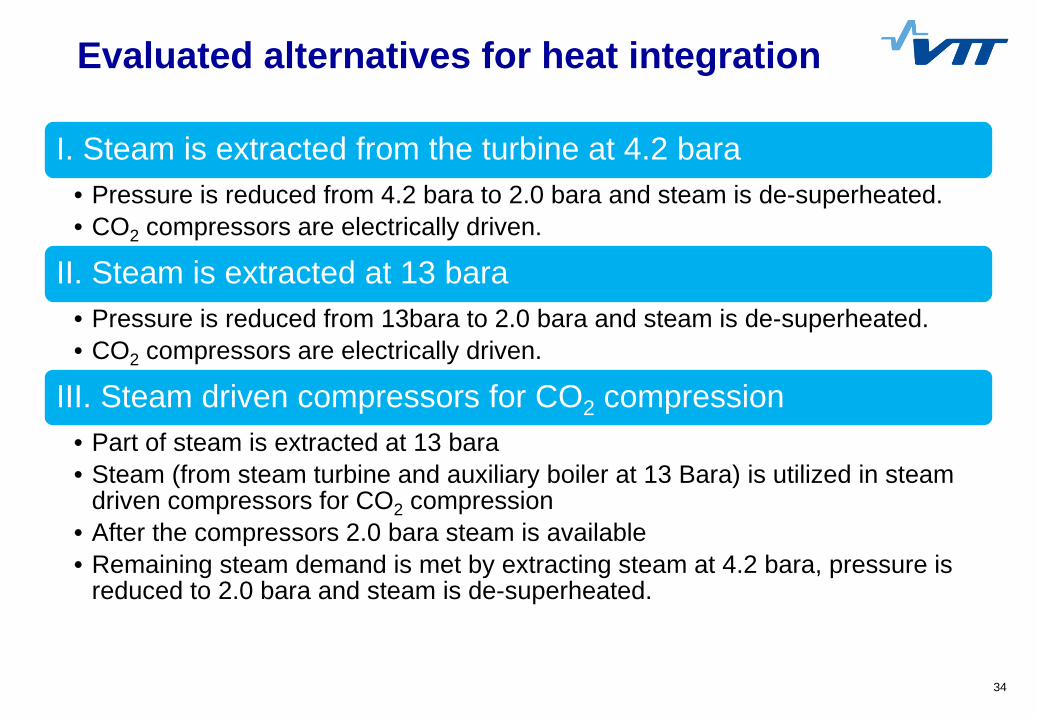
I. Steam is extracted from the turbine at 4.2 bara• Pressure is reduced from 4.2 bara to 2.0 bara and steam is de-superheated. • CO2 compressors are electrically driven.
II. Steam is extracted at 13 bara• Pressure is reduced from 13bara to 2.0 bara and steam is de-superheated. • CO2 compressors are electrically driven.
III. Steam driven compressors for CO2 compression • Part of steam is extracted at 13 bara• Steam (from steam turbine and auxiliary boiler at 13 Bara) is utilized in steam
driven compressors for CO2 compression• After the compressors 2.0 bara steam is available• Remaining steam demand is met by extracting steam at 4.2 bara, pressure is
reduced to 2.0 bara and steam is de-superheated.
35
Pulp mill steam turbine configuration I
HP1 LP1 LP2
Surface condenser
Cooling waterHP 103 bar
IP 30 bar
MP 13 bar
30 bar 13 bar 4.2 bar 0.8 bar 0.03 bar
LP 4.2 bar
1
2
3
4
8
7
5
ULP 2.0 bar
HP2 HP3
High pressure turbine Low pressure turbine
De-superheating
G
9
6
MP 13 bar
Recovery boilerMulti-fuel boiler
Auxiliary boiler
De-superheating
M CO2 COMP
10
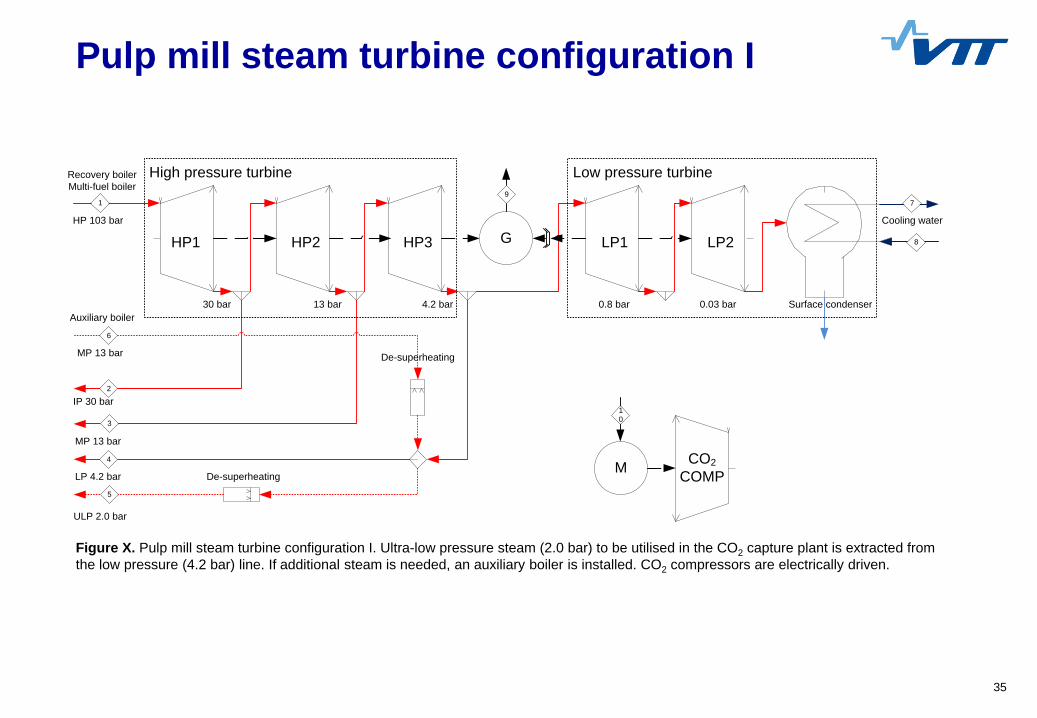
Figure X. Pulp mill steam turbine configuration I. Ultra-low pressure steam (2.0 bar) to be utilised in the CO2 capture plant is extracted fromthe low pressure (4.2 bar) line. If additional steam is needed, an auxiliary boiler is installed. CO2 compressors are electrically driven.
36
Pulp mill steam turbine configuration II
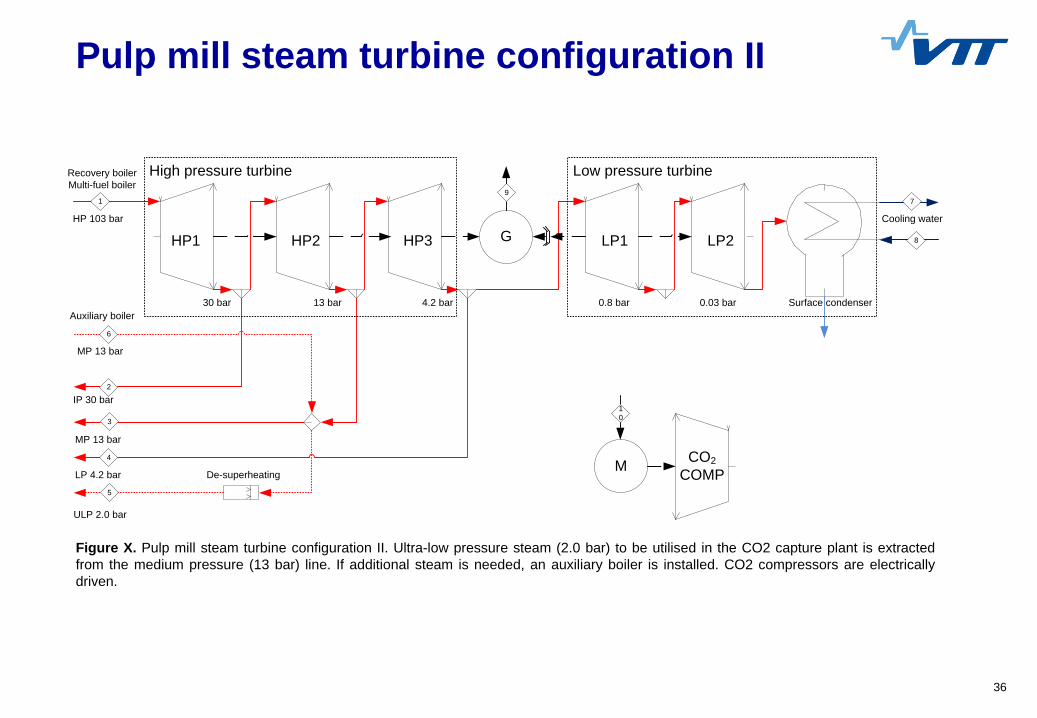
Figure X. Pulp mill steam turbine configuration II. Ultra-low pressure steam (2.0 bar) to be utilised in the CO2 capture plant is extractedfrom the medium pressure (13 bar) line. If additional steam is needed, an auxiliary boiler is installed. CO2 compressors are electricallydriven.
HP1 LP1 LP2
Surface condenser
Cooling waterHP 103 bar
IP 30 bar
MP 13 bar
30 bar 13 bar 4.2 bar 0.8 bar 0.03 bar
LP 4.2 bar
1
2
3
4
8
7
5
ULP 2.0 bar
HP2 HP3
High pressure turbine Low pressure turbine
De-superheating
G
9
6
MP 13 bar
Recovery boilerMulti-fuel boiler
Auxiliary boiler
M CO2 COMP
10
37
Pulp mill steam turbine configuration III
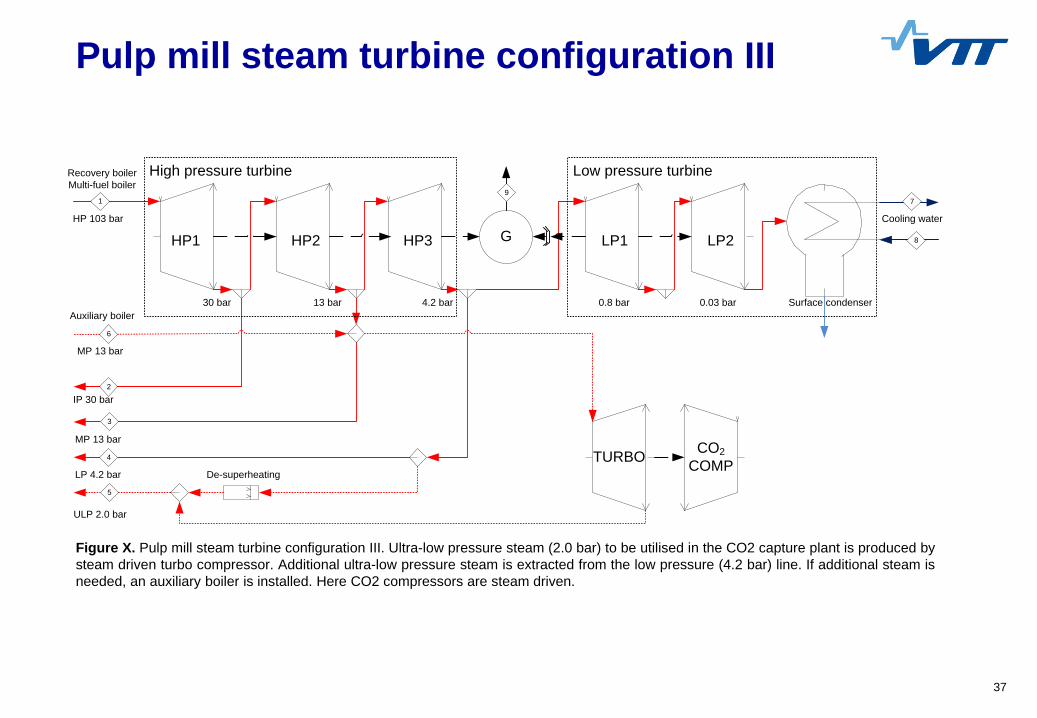
Figure X. Pulp mill steam turbine configuration III. Ultra-low pressure steam (2.0 bar) to be utilised in the CO2 capture plant is produced bysteam driven turbo compressor. Additional ultra-low pressure steam is extracted from the low pressure (4.2 bar) line. If additional steam isneeded, an auxiliary boiler is installed. Here CO2 compressors are steam driven.
HP1 LP1 LP2
Surface condenser
Cooling waterHP 103 bar
IP 30 bar
MP 13 bar
30 bar 13 bar 4.2 bar 0.8 bar 0.03 bar
LP 4.2 bar
1
2
3
4
8
7
5
ULP 2.0 bar
HP2 HP3
High pressure turbine Low pressure turbine
De-superheating
G
9
6
MP 13 bar
Recovery boilerMulti-fuel boiler
Auxiliary boiler
TURBO CO2 COMP

3801/09/2016
Water integration
Kraft pulp mill
Integratedpulp &
board millCooling water [m3/h] 12 330 8 999Process water [m3/h] 1 560 1 958BFW make up [m3/h] 100 95Waste water effluent [m3/h] 1 690 2 010Brine [t/h] 4.6 4.4
Unit 2A-1 2A-2 2A-3 2A-4 2A-5 2A-6MP
Cooling water [m3/h] 21478 4426 2689 23351 22114 27640
Waste water [m3/h] 155 45 17 196 171 216
Additional waste water from the CO2 capture plant is increased by upto15% of the original waste water treated in the pulp mill without CCS. Large amount of Na2SO4 purged from pulp mill for base casesMinimal upgrading waste water treatment plant is expected The amount of cooling water from CCS plant is large. New once
through seawater cooling system is installed. This is considered in the economic evaluation as an operating cost based on a fixed price for cooling water.

Results
40
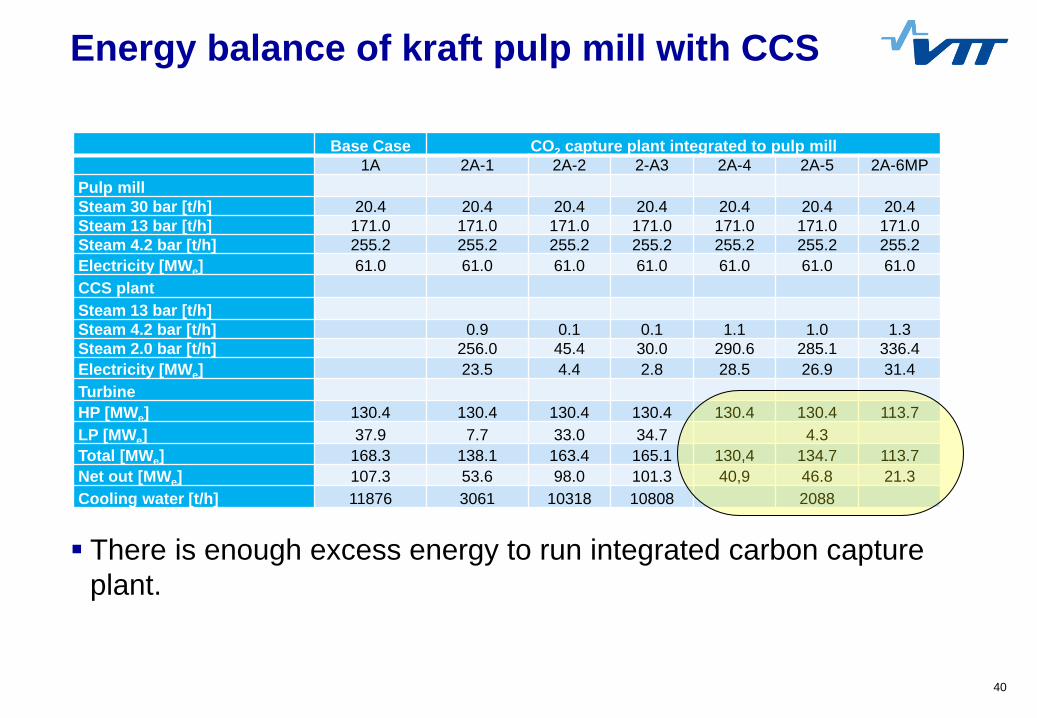
Energy balance of kraft pulp mill with CCS
Base Case CO2 capture plant integrated to pulp mill1A 2A-1 2A-2 2-A3 2A-4 2A-5 2A-6MP
Pulp millSteam 30 bar [t/h] 20.4 20.4 20.4 20.4 20.4 20.4 20.4Steam 13 bar [t/h] 171.0 171.0 171.0 171.0 171.0 171.0 171.0Steam 4.2 bar [t/h] 255.2 255.2 255.2 255.2 255.2 255.2 255.2Electricity [MWe] 61.0 61.0 61.0 61.0 61.0 61.0 61.0CCS plantSteam 13 bar [t/h]Steam 4.2 bar [t/h] 0.9 0.1 0.1 1.1 1.0 1.3Steam 2.0 bar [t/h] 256.0 45.4 30.0 290.6 285.1 336.4Electricity [MWe] 23.5 4.4 2.8 28.5 26.9 31.4TurbineHP [MWe] 130.4 130.4 130.4 130.4 130.4 130.4 113.7LP [MWe] 37.9 7.7 33.0 34.7 4.3Total [MWe] 168.3 138.1 163.4 165.1 130,4 134.7 113.7Net out [MWe] 107.3 53.6 98.0 101.3 40,9 46.8 21.3Cooling water [t/h] 11876 3061 10318 10808 2088
There is enough excess energy to run integrated carbon capture plant.
41
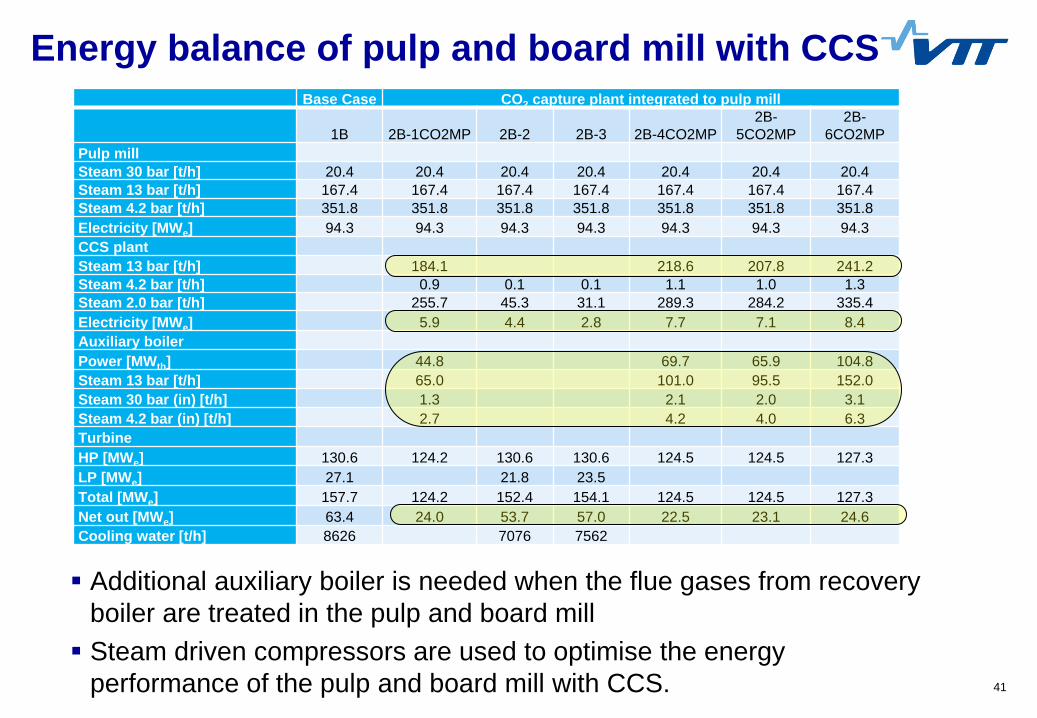
Energy balance of pulp and board mill with CCSBase Case CO2 capture plant integrated to pulp mill
1B 2B-1CO2MP 2B-2 2B-3 2B-4CO2MP2B-
5CO2MP2B-
6CO2MPPulp millSteam 30 bar [t/h] 20.4 20.4 20.4 20.4 20.4 20.4 20.4Steam 13 bar [t/h] 167.4 167.4 167.4 167.4 167.4 167.4 167.4Steam 4.2 bar [t/h] 351.8 351.8 351.8 351.8 351.8 351.8 351.8Electricity [MWe] 94.3 94.3 94.3 94.3 94.3 94.3 94.3CCS plantSteam 13 bar [t/h] 184.1 218.6 207.8 241.2Steam 4.2 bar [t/h] 0.9 0.1 0.1 1.1 1.0 1.3Steam 2.0 bar [t/h] 255.7 45.3 31.1 289.3 284.2 335.4Electricity [MWe] 5.9 4.4 2.8 7.7 7.1 8.4Auxiliary boilerPower [MWth] 44.8 69.7 65.9 104.8Steam 13 bar [t/h] 65.0 101.0 95.5 152.0Steam 30 bar (in) [t/h] 1.3 2.1 2.0 3.1Steam 4.2 bar (in) [t/h] 2.7 4.2 4.0 6.3TurbineHP [MWe] 130.6 124.2 130.6 130.6 124.5 124.5 127.3LP [MWe] 27.1 21.8 23.5Total [MWe] 157.7 124.2 152.4 154.1 124.5 124.5 127.3Net out [MWe] 63.4 24.0 53.7 57.0 22.5 23.1 24.6Cooling water [t/h] 8626 7076 7562
Additional auxiliary boiler is needed when the flue gases from recovery boiler are treated in the pulp and board mill Steam driven compressors are used to optimise the energy
performance of the pulp and board mill with CCS.
42
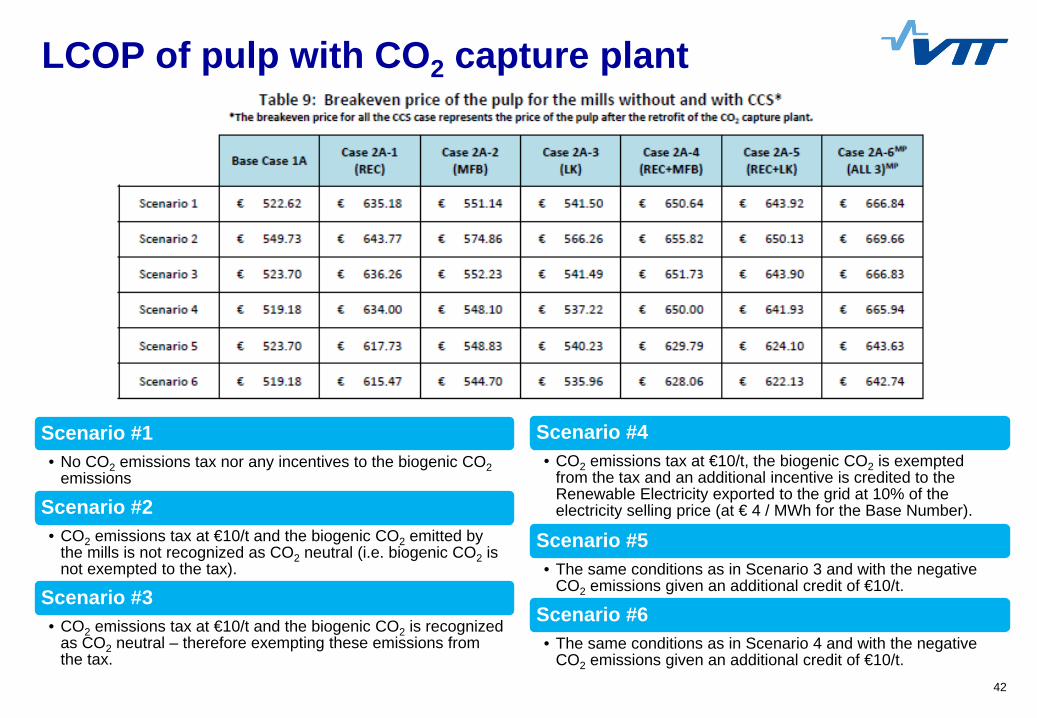
LCOP of pulp with CO2 capture plant
Scenario #1• No CO2 emissions tax nor any incentives to the biogenic CO2
emissions
Scenario #2• CO2 emissions tax at €10/t and the biogenic CO2 emitted by
the mills is not recognized as CO2 neutral (i.e. biogenic CO2 is not exempted to the tax).
Scenario #3• CO2 emissions tax at €10/t and the biogenic CO2 is recognized
as CO2 neutral – therefore exempting these emissions from the tax.
Scenario #4• CO2 emissions tax at €10/t, the biogenic CO2 is exempted
from the tax and an additional incentive is credited to the Renewable Electricity exported to the grid at 10% of the electricity selling price (at € 4 / MWh for the Base Number).
Scenario #5• The same conditions as in Scenario 3 and with the negative
CO2 emissions given an additional credit of €10/t.
Scenario #6• The same conditions as in Scenario 4 and with the negative
CO2 emissions given an additional credit of €10/t.
43
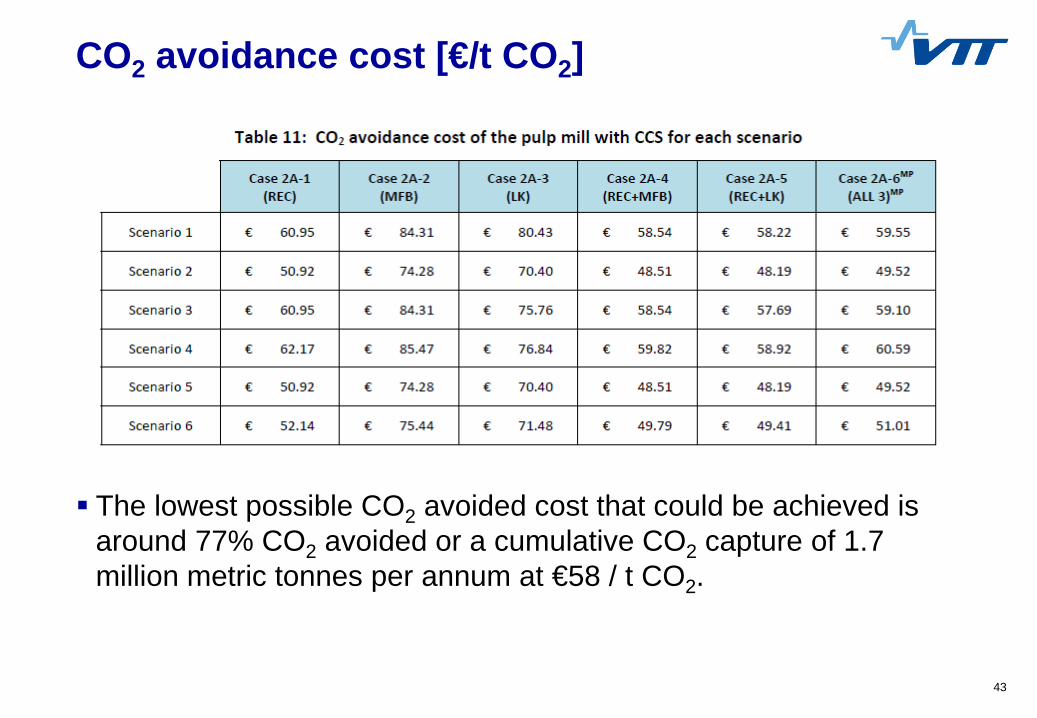
CO2 avoidance cost [€/t CO2]
The lowest possible CO2 avoided cost that could be achieved is around 77% CO2 avoided or a cumulative CO2 capture of 1.7 million metric tonnes per annum at €58 / t CO2.
44
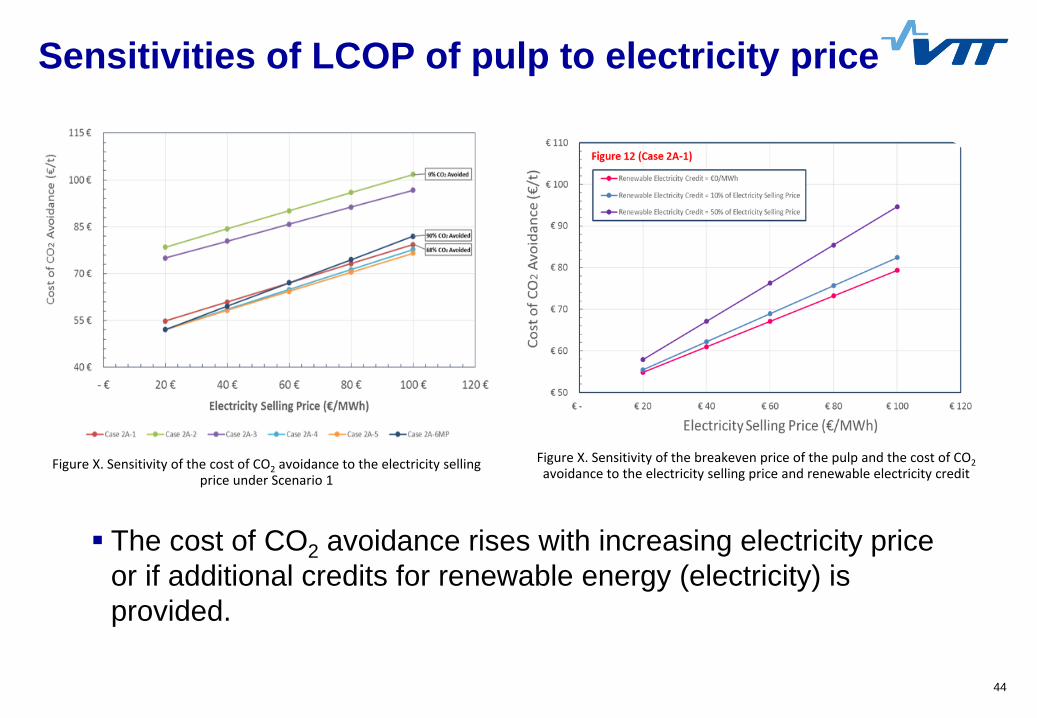
Sensitivities of LCOP of pulp to electricity price
Figure X. Sensitivity of the cost of CO2 avoidance to the electricity selling price under Scenario 1
Figure X. Sensitivity of the breakeven price of the pulp and the cost of CO2avoidance to the electricity selling price and renewable electricity credit
The cost of CO2 avoidance rises with increasing electricity price or if additional credits for renewable energy (electricity) is provided.
45
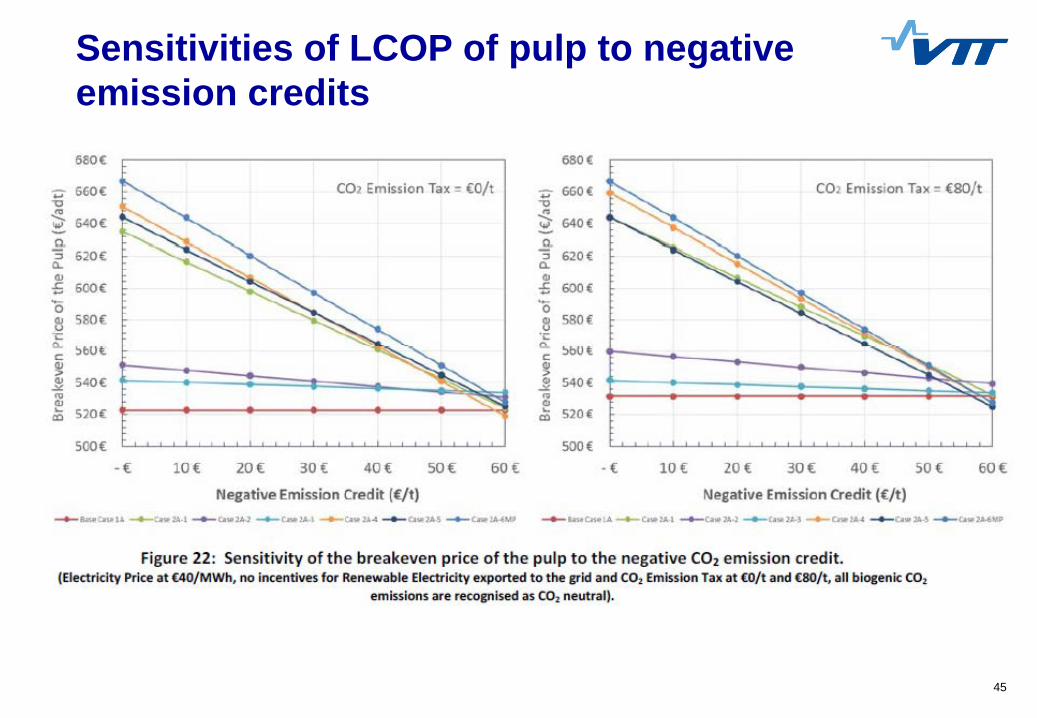
Sensitivities of LCOP of pulp to negativeemission credits

Discussion and Conclusions
47
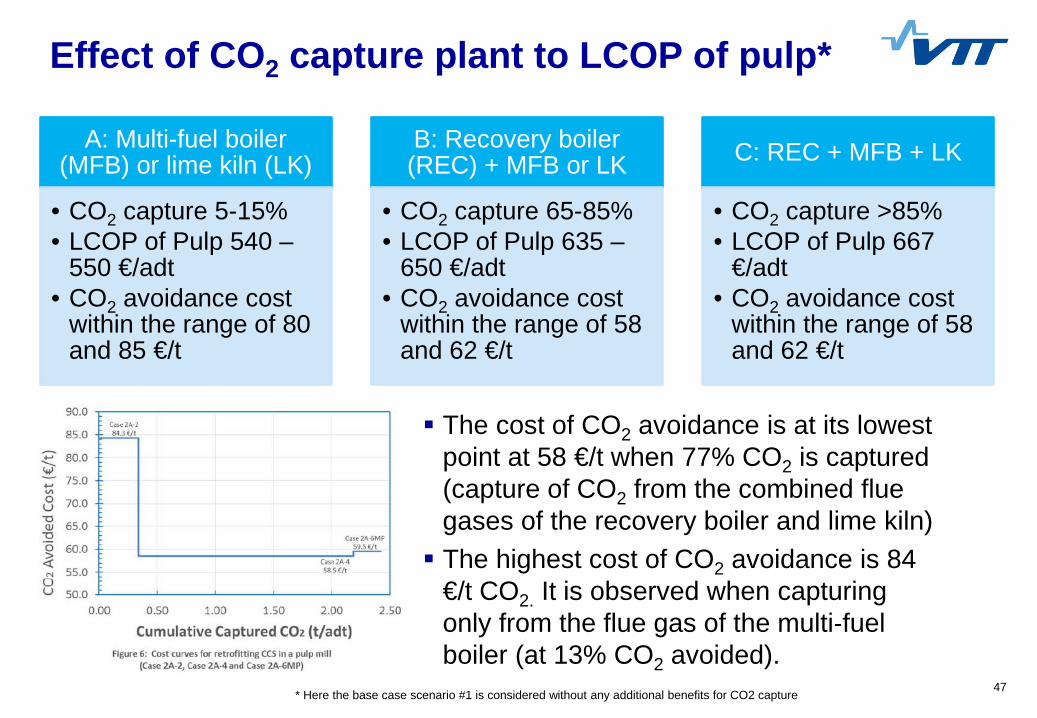
Effect of CO2 capture plant to LCOP of pulp*
* Here the base case scenario #1 is considered without any additional benefits for CO2 capture
A: Multi-fuel boiler (MFB) or lime kiln (LK)
• CO2 capture 5-15%• LCOP of Pulp 540 –
550 €/adt• CO2 avoidance cost
within the range of 80 and 85 €/t
B: Recovery boiler (REC) + MFB or LK
• CO2 capture 65-85%• LCOP of Pulp 635 –
650 €/adt• CO2 avoidance cost
within the range of 58 and 62 €/t
C: REC + MFB + LK
• CO2 capture >85%• LCOP of Pulp 667
€/adt• CO2 avoidance cost
within the range of 58 and 62 €/t
The cost of CO2 avoidance is at its lowest point at 58 €/t when 77% CO2 is captured (capture of CO2 from the combined flue gases of the recovery boiler and lime kiln) The highest cost of CO2 avoidance is 84
€/t CO2. It is observed when capturing only from the flue gas of the multi‐fuel boiler (at 13% CO2 avoided).
48
Future studiesDetailed description of CO2 capture from pulp and board mill
• Results of this study will be reported later this year.• CO2 capture could be more expensive as less electricity is available that could be exported to the
grid; and in some cases, additional auxiliary boiler will be needed.
Integration of warm water systems (Pulp mill, board mill, CCS)• Large amount of heat is generated in carbon capture plant (condensers and possibly in compressor) • How to effectively utilize large amount of low temperature heat?
Utilising excess heat in nearby industry or district heating• Paper and board mills? Chemical industry? District heating?• Seasonal variations?
Integration of CO2 capture plant and evaporation plant of pulp mill• Temperature levels at CO2 capture plant and evaporation plant are at same level• Could deeper process integration provide additional benefits for the energy performance?• Does it make the mill too sensitive for disturbances?
Utilisation of CO2 within mill• Not presented in this paper but worthwhile to consider that cases deploying lower capture rate could
be favourable for CCU projects rather than CCS projects• Lignin fractionation with CO2 at pulp mill or production of precipitated calcium carbonate (PCC) are
possible utilisation options.
49
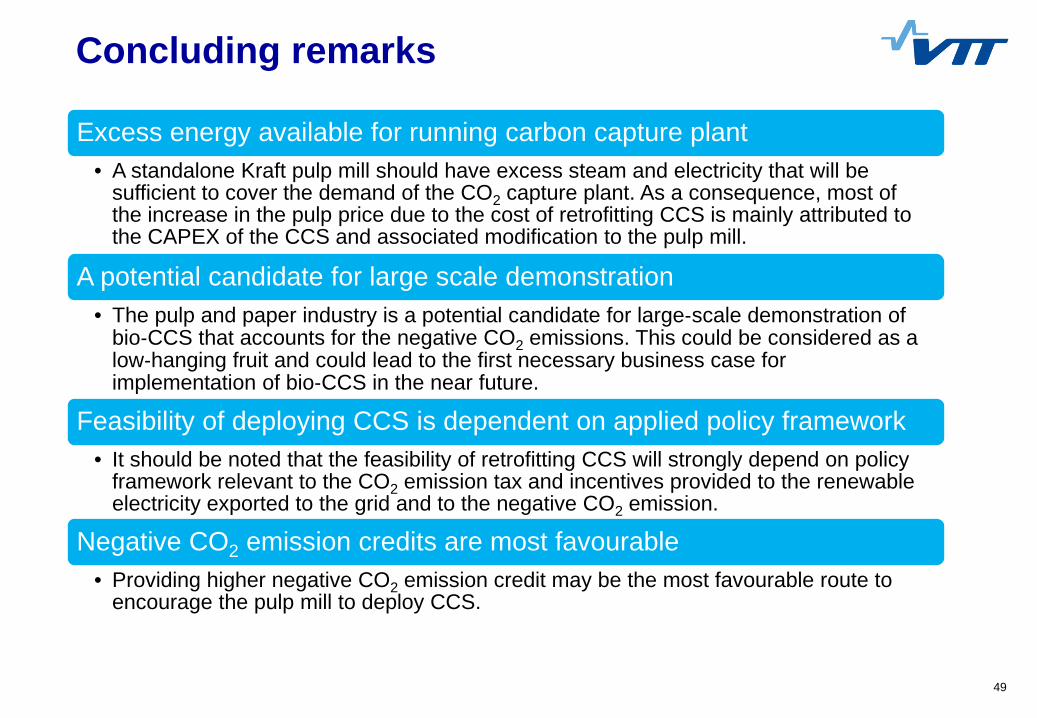
Concluding remarks
Excess energy available for running carbon capture plant• A standalone Kraft pulp mill should have excess steam and electricity that will be
sufficient to cover the demand of the CO2 capture plant. As a consequence, most of the increase in the pulp price due to the cost of retrofitting CCS is mainly attributed to the CAPEX of the CCS and associated modification to the pulp mill.
A potential candidate for large scale demonstration• The pulp and paper industry is a potential candidate for large‐scale demonstration of
bio‐CCS that accounts for the negative CO2 emissions. This could be considered as a low‐hanging fruit and could lead to the first necessary business case for implementation of bio‐CCS in the near future.
Feasibility of deploying CCS is dependent on applied policy framework• It should be noted that the feasibility of retrofitting CCS will strongly depend on policy
framework relevant to the CO2 emission tax and incentives provided to the renewable electricity exported to the grid and to the negative CO2 emission.
Negative CO2 emission credits are most favourable• Providing higher negative CO2 emission credit may be the most favourable route to
encourage the pulp mill to deploy CCS.
50
Kangas et al. 2014, Nord. Pulp Pap. Res. J. 29, 620–634
Kangas 2016, TAPPI J. 15, 241–250
Onarheim et al. 2015, 8th Trondheim Conference on CO2 Capture, Transport and Storage TCCS-8, Trondheim, Norway.
K. Onarheim et al. 2016, CO2 Summit II: Technologies and
Opportunities, Santa Ana Pueblo, New Mexico.
Onarheim et al. 2016, International Journal of
Greenhouse Gas Control (under preparation)
Kangas et al, Energy 2016 (under prepration) IEAGHG 2017, Performance and
Cost of Retrofitting CCS in Pulp and Paper industry (under
preparation)
Onarheim et al. 2017, Nordic Wood Biorefinery Conference,
Stockholm, Sweden (under preparation).
More details available

Thank you for your attention!