carbon dioxide in supermarket refrigeration13782/fulltext01.pdf · i abstract this thesis...
TRANSCRIPT
Carbon Dioxide in Super market Ref r igerat ion
Doctoral Thesis
By
Samer Sawalha
Division of Applied Thermodynamics and Refrigeration Department of Energy Technology
Royal Institute of Technology
Stockholm, Sweden 2008
Trita REFR Report No. 08/60 ISSN 1102-0245 ISRN KTH/REFR/08/60-SE ISBN 978-91-7178-965-5 © Samer Sawalha 2008


i
Abstract This thesis theoretically and experimentally investigates different aspects of the application of CO2 in supermarket refrigeration. Theoretical analy-sis has been performed using computer simulation models developed to simulate CO2 indirect, NH3/CO2 cascade, CO2 trans-critical and direct expansion (DX) R404A systems. The models supported the selection of the CO2 system solutions to be tested experimentally and facilitated the design of NH3/CO2 cascade and trans-critical systems test rigs. Perform-ance evaluation and systems’ optimizations have also been carried out.
In order to verify the findings of the theoretical analysis an experimental evaluation has been performed whereby a scaled-down medium size su-permarket has been built in a laboratory environment. NH3/CO2 cascade and trans-critical systems have been tested and compared to a conven-tional R404A system installed in the same laboratory environment. Ex-perimental findings have been compared to the computer simulation models.
In supermarket refrigeration applications, safety is a major concern be-cause of the large number of people that might be affected in the event of leakage. Therefore, a computer simulation model has been developed to perform calculations of the resulting concentration levels arising from different scenarios for leakage accidents in the supermarket. The model has been used to validate some of the risks associated with using CO2 in the application of supermarket refrigeration.
Results of the experiments and the computer simulation models showed good agreement and suggest that the NH3/CO2 cascade system is a more efficient solution than the analyzed conventional ones for supermarket refrigeration. On the other hand, CO2 trans-critical solutions have effi-ciencies comparable to the conventional systems analyzed, with potential for improvements in the trans-critical systems. From a safety point of view, the analysis of the calculations’ results clearly shows that using CO2 in supermarket refrigeration does not create exceptional health risks for customers and workers in the shopping area.
Studies conducted in this thesis prove that the CO2 systems investigated are efficient solutions for supermarket refrigeration.
Keywords: CO2, carbon dioxide, refrigeration system, supermarket, cas-cade, indirect, trans-critical, modelling, simulation, experiment, safety analysis, comparison.

ii

iii
Acknowledgements
No man is an island, entire of itself; every man is a piece of the continent, a part of the main.
John Donne quote (English poet 1572-1631)
Along the journey working on this thesis I find my self deeply grateful on the professional and personal levels to so many people.
First of all, I would like to thank my supervisor Professor Björn Palm for his support and guidance, I always appreciated your insightful additions to my work. Your approval helped a great deal in building confidence in my work. I admire your energy and commitment at work.
For the team work at IUC Sveriges Energi- & Kylcentrum AB at Katrineholm, I was very privileged to work with you. Special thanks to Jörgen Rogstam for the valuable discussions and generosity in sharing your experiences. Also thanks to Per-Olof Nilsson, the critical questions you raised helped a lot in improving the work. Göran Lundin, thank you for always making sure that I feel welcome, I do appreciate that a lot.
To Arash Soleimani Karimabad, Khuram Shahzad, Carlos Perales Cabre-jas, and Manustai Likitthammanit, it was great pleasure to work with you all, your additions to this thesis are clearly visible. You all had impressive devotion to work and commitment to results of high quality.
At KTH, thanks to Jaime Arias for the discussions, information concern-ing supermarket refrigeration, and the valuable comments and of course all that come with a nice smile. I was lucky to have a CO2-buddy at the department, Yang Chen, thank you for the discussions, support and en-couragements. To Professor Per Lundqvist, thank you for reading the thesis and raising many interesting points, not only related to the thesis but in general and about everything.
Many thanks to all staff members at the Division of Applied Thermody-namics and Refrigeration, everything about you made it a very pleasant environment to work in. Of course to all the stars of the “Energy” foot-ball team, thank you for the great games, we were the most confus-ing/confused team, won when we were supposed to loose and lost when we were supposed to win, but in all cases it was great fun. To Primal Fernando and Claudi Martín, wish you all the best in your careers, it has

iv
been great having you around in the department for the chat breaks with interesting topics, support at work and for the good laughs, thank you for being good friends. Best wishes also to Oxana Samoteeva, you have been a great support, thank you.
Special thanks to a special person, Nabil Kassem. I learned a lot from all the discussions, advices, and support that I received from you.
I am grateful to the Swedish Institute, and especially to Karin Diff, for the scholarship which helped me for the Master’s degree studies and for the first few months of the PhD work. Also many thanks to the financial support from The Swedish National Energy Agency and the companies participated in the project with IUC Sveriges Energi- & Kylcentrum AB.
To Ivo Martinac, I am very grateful for the help that I received from you during my early start at the Energy Technology Department. You have been exceptionally helpful.
In international cooperation projects I enjoyed working with Lennart Jo-hansson at KTH International who always showed support, understand-ing and concern, thank you Lennart.
On the personal level I would like to thank my friends Alaa, Feras, Malika, Nasrin, Rebhieh, Rehab, and Sara. To my friend/cousin Sadeq and his wife Ruba and their son, Adnan, you are a small family of mine in Sweden with such a big heart. To my all times friend Naser, true friendship lives for ever regardless of distance and time.
I am forever grateful to my parents, Noor-Addin and Fatema, who did their absolute best in taking care of our family, thank you for giving me the freedom to develop, I am lucky to be your son. To my brother Nidal, I always enjoyed your care and support and admired your kind heart. To my beloved sister Faten, thank you for all your love and support.
To my mother, who left this life a year a go. You will always live in my heart, with all the love. To you this thesis is dedicated.
Samer Sawalha
Stockholm, April 2008

v
Table of contents
1 Introduction .................................................................................. 1 1.1 Background............................................................................1 1.2 Aim of the study ...................................................................2 1.3 Methodology .........................................................................3 1.4 Publications ...........................................................................4
1.4.1 Conference papers.........................................................4 1.4.2 Journal papers..............................................................4 1.4.3 Other relevant publications ...........................................5
2 CO2 as a refrigerant.......................................................................7 2.1 Introduction ..........................................................................7 2.2 Discussion of the properties...............................................8 2.3 Comparison to other refrigerants ......................................9 2.4 Applications of CO2 in refrigeration systems ................17 2.5 Conclusions .........................................................................18
3 CO2 in supermarket refrigeration ...............................................20 3.1 Introduction ........................................................................20 3.2 System solutions .................................................................20
3.2.1 Indirect arrangements ................................................ 20 3.2.2 Cascade systems ........................................................ 22 3.2.3 Trans-critical systems (only CO2 systems) .................. 24
3.3 CO2 supermarket installations examples-The case of Sweden .................................................................................26
3.4 Comparative studies ...........................................................28 3.5 Conclusions .........................................................................30
4 Description of computer simulation models ..............................32 4.1 Indirect systems ..................................................................32
4.1.1 System description ..................................................... 33 4.1.2 Calculation model ..................................................... 34 4.1.3 System optimization.................................................. 35
4.2 Cascade system ...................................................................36 4.2.1 System description ..................................................... 38 4.2.2 Calculation model ..................................................... 38 4.2.3 System optimization.................................................. 43
4.3 Trans-critical CO2 system..................................................45 4.3.1 System description ..................................................... 46 4.3.2 Calculation model ..................................................... 47 4.3.3 System optimization.................................................. 48
4.4 DX R404A...........................................................................54 4.4.1 System description ..................................................... 54

vi
4.4.2 Calculations model .................................................... 54 4.5 Conclusions .........................................................................55
5 Simulation calculations and results ............................................56 5.1 Trans-critical CO2 system solutions ................................56
5.1.1 Parallel system .......................................................... 56 5.1.2 Centralized system .................................................... 58 5.1.3 Modified centralized system ....................................... 60
5.2 Comparisons .......................................................................70 5.2.1 Trans-critical, cascade, and DX R404A.................. 70 5.2.2 CO2 indirect and DX R404A ................................ 75
5.3 Discussions and conclusions ............................................79
6 Analysis of experimental results ................................................. 81 6.1 The case study.....................................................................81 6.2 Cascade system test rig ......................................................81
6.2.1 Experiments and results ........................................... 84 6.2.2 Optimization of the cascade system ............................ 95
6.3 Trans-critical system test rig .............................................95 6.3.1 System solution ......................................................... 95 6.3.2 Overall system analysis.............................................. 98 6.3.3 Comparison to cascade system.................................. 110
6.4 Comparison to R404A installation ............................... 111 6.4.1 R404A system description ...................................... 111 6.4.2 Running conditions and results ................................ 113
6.5 Experimental versus calculated results......................... 116 6.5.1 Indirect system ........................................................ 116 6.5.2 Cascade system........................................................ 119 6.5.3 Trans-critical system................................................ 122
6.6 Conclusions ...................................................................... 127
7 Safety aspects ............................................................................ 129 7.1 Introduction ..................................................................... 129 7.2 Safety characteristics of CO2 ......................................... 129 7.3 The case study.................................................................. 133 7.4 Risk analysis in the shopping area................................. 134 7.5 Risk analysis in the machine room................................ 136 7.6 Discussion of the assumptions and results ................. 139 7.7 Conclusions ...................................................................... 140
8 Conclusions and suggestions for future work ...........................141 8.1 Conclusions ...................................................................... 141
8.1.1 Theoretical analysis ................................................. 141 8.1.2 Experimental analysis ............................................ 141 8.1.3 General .................................................................. 142

vii
8.2 Suggestions for future work........................................... 142
9 Nomenclatures.......................................................................... 144
10 References................................................................................. 149

1
1 Introduction
1 . 1 B a c k g r o u n d The use of synthetic refrigerants dominated the refrigeration industry for decades due to their good performance and safety characteristics. Since they were found to be harmful to the environment, several regulations have been enforced on their usage. In Sweden, new installations with CFC refrigerants were banned from 1995 and from 2000 the use of these refrigerants was stopped. For HCFC refrigerants, new installations were banned from 1998 and refill was banned from 2002. The HCFC R22 and CFC R12 were the refrigerants which were used the most in commercial refrigeration.
The regulations on synthetic refrigerants have forced major changes in the refrigeration, air conditioning, and heat pump industries. Generally, the new situation required the old refrigerants to be replaced, systems to be tighter and new system solutions which require less refrigerant charge to be introduced. Nevertheless, the energy consumption of the systems should be kept as low as possible.
HFC refrigerants were expected to be an acceptable replacement for the phased out CFC and HCFCs but they turned out to be a temporary solu-tion due to their Global Warming Potential (GWP). In Sweden, R404A, which has GWP value of 3784, was intensively used in supermarket in-stallations as a replacement for the environmentally harmful refrigerants, mainly R22. In order to reduce the refrigerant charge, systems that use an indirect solution were applied. Systems’ tightness has been improved due to taxes enforced on leaking HFC refrigerants.
Finding alternative, environmentally friendly solutions for commercial refrigeration (for supermarkets, shops, large kitchens, etc.) and cold stor-age will lead to significant improvements in terms of protecting the envi-ronment. It accounts for about 28% (135576 tons/year) of the world-wide consumption of refrigerants which makes it the second largest con-suming application after mobile air conditioning, which accounts for 31% (Fischer et al., 1991).
The energy consumption of any alternative solutions should be kept as low as possible given that supermarkets are high energy consumers.

2
Electricity consumption in large supermarkets in the US and France is estimated to be 4% of national electricity use (Orphelin & Marchio, 1997). In Sweden, approximately 3% of the national electricity consumed is used in supermarkets (Sjöberg, 1997). A typical supermarket in Sweden uses between 35-50% of its total electricity consumption for refrigeration equipment (Lundqvist, 2000).
Natural refrigerants are seen as a potentially permanent solution where CO2 is the one that fits best in supermarket applications, mostly due to safety reasons, as it can be directly used in public areas. However, the application where the use of CO2 was first suggested after its revival and where most of the research work has been directed is in mobile air con-ditioning. On the other hand, hot water heat pumps were found to be a very interesting area of application and it has been widely applied on a commercial scale in Japan (Endoh et al., 2006).
In commercial refrigeration applications, CO2 was first used as a secon-dary working fluid in indirect system solutions. The knowledge and ex-perience gained from early research work on CO2 and the early installa-tions of CO2 in commercial applications promoted its wider application in supermarkets with different system solutions. Cascade systems with CO2 in the low stage and trans-critical solutions where CO2 is the only working fluid have been applied in recent years. Nowadays, in Sweden, there are more than 100 installations where CO2 is used in indirect sys-tems, a few cascade installations and at least 20 plants with trans-critical solutions.
Despite the high number of CO2 system installations in supermarkets, detailed analysis of their performance is needed where losses and poten-tial improvements in the system can be investigated. Most of the re-search work on CO2 supermarket solutions has been performed on real installations where system modifications are not possible, and further-more, comparisons with conventional or comparative solutions are diffi-cult due to the need for identical or comparable conditions.
1 . 2 A i m o f t h e s t u d y The purpose of this thesis is to investigate whether or not CO2 is a good alternative solution for supermarket refrigeration, to theoretically and experimentally evaluate its performance compared to a conven-tional/alternative system solution. By identifying the strength and weak-ness points in CO2 system solutions it is possible to apply and test modi-fications to optimise the system for its best possible performance.
3
By combining the experimental and theoretical findings it is possible to point out potential improvements in the experimental rigs, and thereaf-ter, conclude upon good CO2 system solution/s for supermarket refrig-eration.
It is also important to investigate safety issues when CO2 is applied in this application where a computer simulation model would give a good indication of the risks attached to using it.
A further step in this analysis of CO2 in supermarket refrigeration will be to recommend future research work.
1 . 3 M e t h o d o l o g y The work in this thesis started by surveying existing CO2 supermarket installations in Sweden. Installed and possible solutions where CO2 is used have been summarized as a basis for the theoretical and experimen-tal analysis.
In order to perform theoretical evaluations of the performance of differ-ent CO2 system solutions computer simulation models have been devel-oped. They simulate CO2 indirect, NH3/CO2 cascade, CO2 trans-critical and direct expansion (DX) R404A systems. The models supported the selection of the CO2 system solutions to be tested experimentally and fa-cilitated the design of the NH3/CO2 cascade and trans-critical system test rigs. Performance evaluation and systems’ optimizations have thus been achieved.
In order to verify the findings of the theoretical analysis an experimental evaluation has been performed whereby a scaled-down medium size CO2 supermarket has been built in a laboratory environment. NH3/CO2 cas-cade and trans-critical systems have been tested and compared to a con-ventional R404A system installed in the same laboratory environment. Experimental findings were compared to the computer simulation mod-els.
Based on the theoretical analysis of the results and the findings of the experimental tests it was possible to point out the advantages and limita-tions of using CO2 in supermarket refrigeration. Suggestions for im-provements and recommendations for future research topics have sub-sequently been drafted.
A computer simulation model has been developed to perform calcula-tions on the resulting concentration levels arising from different scenar-ios for leakage accidents in the supermarket. The model was used to as-

4
sess some of the risks attached to using CO2 in supermarket refrigeration applications.
1 . 4 P u b l i c a t i o n s The present thesis is based on several previously published articles and reports, as listed below.
1 . 4 . 1 C o n f e r e n c e p a p e r s 1. Sawalha, S., B. Palm, and L. Rolfsman. CO2 as Secondary Re-
frigerant in Sweden. IEA Annex 27 Workshop: Selected Issues on CO2 as Working Fluid in Compression Systems-IEA Heat Pump Centre. Trondheim, Norway, 2000.
2. Sawalha, S. and B. Palm. Safety Analysis of CO2 as a Refrigerant in Supermarket Refrigeration. 5th IIR Gustav Lorentzen Con-ference on Natural Working Fluids. Guangzhou, China, 2002. Also published in Revue Générale du Froid, April 2004, N° 1042, p. 39-43.
3. Sawalha, S. and B. Palm, Energy Consumption Evaluation of Indirect Systems with CO2 as Secondary Refrigerant in Super-market Refrigeration, 21st IIR International Congress of Refrig-eration. Washington, D.C., USA, 2003.
4. Sawalha, S., J. Rogstam, and P.-O. Nilsson. Laboratory Tests of NH3/CO2 Cascade System for Supermarket Refrigeration. IIR International Conference on Commercial Refrigeration. Vicenza, Italy, 2005.
5. Sawalha, S., K.A. Soleimani, and J. Rogstam, Experimental and Theoretical Evaluation of NH3/CO2 Cascade System for Su-permarket Refrigeration in Laboratory Environment. 7th IIR Gustav Lorentzen Conference on Natural Working Fluids. Trondheim, Norway, 2006.
6. Sawalha, S., C. Perales Cabrejas, M. Likitthammanit, J. Rogstam, P-O. Nilsson, Experimental Investigation of NH3/CO2 Cascade system and comparison to R404A system for supermarket re-frigeration. 22nd IIR International Congress of Refrigeration. Beijing, China, 2007.
1 . 4 . 2 J o u r n a l p a p e r s 1. Sawalha, S., Using CO2 in Supermarket Refrigeration. ASHRAE
Journal, 2005. 47(8): p. 26-30. 2. Sawalha, S., Theoretical Evaluation of Trans-critical CO2 Sys-
tems in Supermarket Refrigeration. Part I: Modelling, Simulation and Optimization of Two System Solutions. International Jour-

5
nal of Refrigeration, Volume 31, Issue 3, May 2008, Pages 516-524.
3. Sawalha, S., Theoretical Evaluation of Trans-critical CO2 Sys-tems in Supermarket Refrigeration. Part II: System Modifica-tions and Comparisons of Different Solutions International Journal of Refrigeration, Volume 31, Issue 3, May 2008, Pages 525-534.
1 . 4 . 3 O t h e r r e l e v a n t p u b l i c a t i o n s
1 . 4 . 3 . 1 C o n f e r e n c e
1. Rogstam, J., S. Sawalha, and P-O. Nilsson. Ice Rink Refrigera-tion System with CO2 as Secondary Fluid. in IIR International Conference on Thermophysical Properties and Transfer Proc-esses of Refrigerants. Vicenza, Italy, 2005.
2. Nilsson, P.O., J. Rogstam, S. Sawalha, and K. Shahzad, Ice Rink Refrigeration System with Carbon Dioxide as Secondary Fluid in Copper Tubes, in the 7th IIR Gustav Lorentzen Conference on Natural Working Fluids. Trondheim, Norway, 2006.
1 . 4 . 3 . 2 M a g a z i n e s
1. Rogstam, J., S. Sawalha, and P-O. Nilsson, Ice Rink Refrigera-tion System with CO2 as Secondary Fluid. ScanRef: Scandina-vian Refrigeration. 2005. 34(5): p. 36-41.
2. Nilsson, P-O., J. Rogstam, S. Sawalha and K. Shahzad, Ice Rink Refrigeration System with CO2 in Copper. ScanRef: Scandina-vian Refrigeration. 2006. 35(5): p. 32-35.
1 . 4 . 3 . 3 R e p o r t s
1. IEA Heat Pump Programme Report: Annex 27-Selected Issues on CO2 as a Working Fluid in Compression Systems (First au-thor of the Swedish contribution part), 2003. ISBN 91-85303-01-X, Report No. HPP-AN27-2 This report contains results from 12 different research projects and an extensive literature survey. Participating countries are Ja-pan, Norway, Sweden, Switzerland, and USA. The report is a useful information source for all those involved in CO2 technol-ogy for heating, cooling, refrigeration and air-conditioning.
2. Efficient Supermarket Refrigeration-Inventory report (Author of the CO2 part-English), 2006.
6
This report is a pre-study of three projects that deal with refrig-eration in supermarkets with focus on the case of Sweden. The CO2 part of the report is a result of an extensive literature survey and assembles information about the different CO2 system solu-tions including information about real installations. Advantages, challenges, and possibilities are discussed.
3. CO2 in Supermarket Refrigeration- Phase I report (First author), 2006. This report describes the investigated NH3/CO2 cascade system solution and presets some of the experimental results that have been obtained in the first phase of the project. Overall system validation and evaluations of the main components are also pre-sented.
1 . 4 . 3 . 4 M S c t h e s i s w o r k
The following projects were conducted in relation to the research work of this thesis and in cooperation with IUC Sveriges Energi- & Kylcentrum AB 1. Shahzad, K., An Ice Rink Refrigeration System Based on CO2 as
Secondary Fluid in Copper Tubes. Energy Technology Depart-ment, Royal Institute of Technology (KTH), Stockholm, Swe-den, 2006.
2. Soleimani, K. A., Experimental Investigations of NH3/CO2 Cascade Systems for Supermarket Refrigeration. Energy Tech-nology Department, Royal Institute of Technology (KTH), Stockholm, Sweden, 2006.
3. Perales Cabrejas, C., Parametric Evaluation of NH3/CO2 Cas-cade System for Supermarket Refrigeration in Laboratory Envi-ronment. Energy Technology Department, Royal Institute of Technology (KTH), Stockholm, Sweden, 2006.
4. Likitthammanit, M., Experimental Evaluation of CO2 Trans-critical System for Supermarket Refrigeration in a Laboratory Environment. Energy Technology Department, Royal Institute of Technology (KTH), Stockholm, Sweden, 2007.

7
2 CO2 as a refrigerant
2 . 1 I n t r o d u c t i o n CO2 is an old refrigerant that has been used since the early stages of the refrigeration industry in various applications, especially those which re-quired large amounts of refrigerant and strict safety considerations. This was the case until the 1930’s and 1940’s when synthetic refrigerants were introduced and then CO2 started to loose out faced with competition from the new refrigerants and was gradually replaced in all applications. The main reasons for the freewill phasing-out of CO2 are its high operat-ing pressure (about 64.2 bars at 25ºC) and its low critical temperature of 31ºC. This implied that CO2 systems had containment problems. Fur-thermore, when condensing close to and rejecting heat above the critical temperature the systems suffered loss in cooling capacity and efficiency. The technologies available at that time could not solve the problems at-tached to the use of CO2.
Synthetic refrigerants were considered as safe for many decades, but it proved otherwise for the environment. From this perspective, as a natu-ral substance, CO2 is an ideal choice; it is a by-product of the chemical industry and using it in refrigeration applications can be considered as an additional step before its inevitable release into the atmosphere. As a naturally existing substance in the atmosphere its long-term influence on the environment is very well investigated and we can assume that there are no unforeseen threats that CO2 poses for the environment. As a re-sult of its surplus in the atmosphere and the inescapably large scale of its current production CO2 is inexpensive and available.
Nowadays technologies can provide the tools to harness the high work-ing pressure of CO2, running and controlling the system in the super-critical region. In 1989, Professor Gustav Lorentzen suggested in a pat-ent application (Lorentzen, 1990) that CO2 could be used in a cycle that operates in the trans-critical region where the high pressure can be con-trolled by a throttling valve, which he proposed as a solution for mobile air conditioning application. This was a breakthrough that revived inter-est in CO2 as refrigerant and revealed new horizons to the refrigeration industry and the relevant research institutes.

8
Since the revival of CO2 as a refrigerant, a considerable amount of re-search work has been conducted to investigate the “new” refrigerant’s thermodynamic, thermal and transport properties and to try and explore new areas of application.
2 . 2 D i s c u s s i o n o f t h e p r o p e r t i e s The main characteristic that distinguishes CO2 from other refrigerants is its critical point. It has relatively low temperature of 31.06°C and high pressure of 73.8 bars. The triple point is at 5.2 bars and -56.6°C, which means that the operation in the refrigeration cycle will always be higher than the 5.2 bars limit, below which solid CO2 will be formed. This im-plies that a refrigeration cycle using CO2 will have a high operating pres-sure and for high heat sink temperatures heat rejection will take place in the super-critical region.
In the sub-critical region the pressure and temperature are coupled and this relationship is expressed in the saturation temperature pressure curve. Above the critical point this relationship does not apply, it be-comes arbitrary where the pressure and temperature can be regulated in-dependently. The fluid no longer exists in the two phase mode, there is no distinction between liquid and vapour and the fluid can neither be called liquid nor vapour/gas. This state is referred to as supercritical fluid.
Heat rejection in the super-critical region takes place at constant pressure and the temperature changes in a similar manner to the single phase. However, near the critical point the properties of the supercritical fluid change rapidly with temperature in isobaric processes and this should be taken into consideration when performing heat transfer calculations.
CO2 is unique among natural refrigerants in its good safety characteris-tics; it is non-flammable, non-explosive, and relatively non-toxic, which makes it an almost ideal fluid, especially for applications where relatively large quantities of refrigerant are needed. Moreover, it is inexpensive. In relation to the environment, as a natural substance CO2 has no Ozone Depletion Potential (ODP) and a GWP of 1.
Refrigerants properties in this thesis are obtained from the software En-gineering Equations Solver (EES), which uses an equation of state ap-proach rather than internal tabular data to calculate the properties of flu-ids. Details about the method of properties calculation in EES can be found in Klein (2006).

9
2 . 3 C o m p a r i s o n t o o t h e r r e f r i g e r a n t s Most of the properties that distinguish CO2 from other refrigerants are related to its high operating pressure, such that it has a much higher working pressure than other refrigerants. Figure 1 shows the saturation pressure for CO2 and some common refrigerants that have been, or are being used in supermarket refrigeration. At room temperature, 25ºC, CO2 has a saturation pressure of 64.2 bars, which is higher than the pres-sure that most of the conventional refrigeration components can stand; maximum operating pressure is usually 25 bars. At 0°C CO2 has a pres-sure which is about 6 and 7 times higher than that of R404A and NH3 respectively.
-40 -30 -20 -10 0 10 20 30 400
10
20
30
40
50
60
70
Tsat [°C]
Psa
t [ba
r] CO2
R134a
NH3R22Propane
R404A
Fi gu r e 1 : Sa t u r a t i on p r e s s u r e v e r s u s t empe ra t u r e f o r s e -l e c t e d r e f r i g e ran t s .
Two significant thermo-physical advantages for the refrigeration cycle result from the high working pressure. Firstly, the high working pressure results in high vapour density, shown in Figure 2. Consequently, for re-frigerants with similar values of latent heat of vaporiza-tion/condensation, the volumetric refrigerating effect will be higher. Figure 3 shows that CO2 has values for the latent heat of vaporization which are in the range of other common refrigerants, excluding NH3 which has exceptionally high values.

10
-40 -30 -20 -10 0 10 20 30 400
50
100
150
200
250
300
Tsat [°C]
Den
sity
sat;v
apou
r [kg
/m3 ]
CO2CO2
R134a
NH3
R22
Propane
R404A
Fi gu r e 2 : Sa t u ra t e d v ap ou r d e n s i t y f o r s e l e c t e d r e f r i g e r -an t s .
-40 -30 -20 -10 0 10 20 30 400
200
400
600
800
1000
1200
1400
Tsat [°C]
h fg
[kJ/
kg]
CO2R134a
NH3
R22
Propane
R404A
Fi gu r e 3 : La t en t h e a t o f v apo r i za t i o n/ c ond en sa t i o n f o r s e l e c t e d r e f r i g e ran t s .
Figure 4 shows the values for the volumetric refrigeration effect of the selected refrigerants. As can be seen in the plot CO2 has values which are

11
relatively much higher, at 0°C it is almost 5 times higher than for R-22 and NH3. The high value for the volumetric refrigerating effect means a smaller refrigerant vapour volume flow rate is needed for a given cooling capacity.
-30 -20 -10 0 10 20 30 400
5000
10000
15000
20000
25000
30000
Tsat [°C]
q v [k
J/m
3 ]
CO2
R134a
NH3R22Propane
R404A
Fi gu r e 4 : Vo lume t r i c r e f r i g e r a t i o n c apa c i t y ( c omp l e t e e v ap o ra t i on ) f o r s e l e c t e d r e f r i g e r an t s .
The second main advantage associated with the high working pressure is the low vapour pressure drop which means that smaller components and distribution lines can be used. The CO2 pressure drop can be related to other refrigerants by applying the properties presented above to the fol-lowing single phase flow pressure drop equation (Granryd et al., 2005):
dLwfP ⋅⋅⋅=
2
2ρΔ 2-1
Where PΔ is in Pascal,w is the fluid mean velocity (m/s), ρ is the den-sity (kg/m3), d and L are the pipe diameter and length (m) respectively, and f is the friction factor. Assuming that the refrigerant enters the evaporator as saturated liquid and evaporates completely the velocity can be expressed as
AhQ
Amw
fg ⋅⋅=
⋅=
ρρ
&& 2-2

12
Where m& is the fluid mass flow rate (kg/s), Q& is the cooling capacity (kW), fgh is the latent heat of vaporization (kJ/kg), A is pipe cross sec-tion area (m2). Substituting in the pressure drop equation the following expression is obtained:
dL
AhQfP
fg⋅⋅⎟
⎟⎠
⎞⎜⎜⎝
⎛
⋅⋅⋅⋅=
21
2
ρρΔ
& 2-3
For a wide range of Reynolds number, the friction factor for flow in smooth tubes will have an approximate value of between 0.0075 and 0.01. This is a rule of thumb that is suggested by Granryd et al. (2005). For the same capacity and pipe size, rearranging the above equation re-sults in an expression where the pressure drop is a function of the den-sity and the volumetric refrigerating effect ( vq ), as in the following equa-tion:
Yhq
Pfgv⋅
⋅=
1Δ 2-4
Y is constant (kW2/m4) which collects the fixed parameters related to the geometry and the operating conditions. From this expression the pressure drop of CO2 can be estimated and related to other refrigerants and the latent heat of vaporization/condensation of CO2 is of a compa-rable magnitude to the selected refrigerants, except NH3. The volumetric refrigerating effect is much higher for CO2 than the rest of the refriger-ants which indicates a much lower pressure drop for CO2. Using the above equation, the ratio between pressure drop values of the selected refrigerants and that of CO2 is plotted in Figure 5 where it can be seen that CO2 will have a much lower relative pressure drop.

13
-30 -20 -10 0 10 20 30 400
2
4
6
8
10
12
14
Tsat [°C]
ΔP
ratio
(Ref
/CO
2) [-
]
CO2
R134a
NH3
R22Propane
R404A
Fi gu r e 5 : Vapou r p r e s s u r e d r op r a t i o s f o r s e l e c t e d r e f r i g -e r an t s and CO 2 (Re f r i g e r na t/CO 2 ) a t d i f f e r e n t s a t u ra -t i o n t emp e ra tu r e s .
It is important that the saturation temperature drop that is attached to the pressure drop is low, so that it will be less detrimental to the coeffi-cient of performance (COP) of the system. The Clapeyron equation (Granryd et al., 2005), is used to convert the pressure drop to an equiva-lent change in saturation temperature
Ph
)vv(TT
fgabssat ΔΔ ⋅
−⋅= 12 2-5
absT is absolute temperature of the fluid (K), 2v is the specific volume for the saturated vapour (m3/kg) which is much larger than the specific vol-ume of the saturated liquid ( 1v ), so 1v can be ignored in equation 2-5. Consequently the above relationship can be expressed as follows
Pq
TTv
abssat ΔΔ ⋅⋅=1 2-6
For the same operating temperature, absT , CO2 will have a lower pres-sure drop, as discussed above, and the corresponding temperature drop will also be lower due to the high volumetric refrigerating effect of CO2. This can be seen in Figure 6 where the ratio of the saturation tempera-ture drop of the selected refrigerants to that of CO2 is plotted at differ-

14
ent saturation temperatures. Equation 2-6 is used to calculate the ratio in the following figure.
-30 -20 -10 0 10 20 30 400
5
10
15
20
25
30
35
40
45
50
Tsat [°C]
ΔT s
at,ra
tio (R
ef/C
O2)
[-]
CO2
R134a
NH3
R22
PropaneR404A
Fi gu r e 6 : Sa t u r a t i on t emp e ra tu r e d r o p r a t i o s f o r s e l e c t e d r e f r i g e r an t s and CO 2 (Re f r i g e r na t/CO 2 ) a t d i f f e r e n t s a t u ra t i o n t emp e r a t u r e s .
Due to the high volumetric refrigerating effect, low pressure and low temperature drops it is therefore possible to design smaller and more compact components with CO2. This is advantageous in applications where space-saving is required, such as in mobile air conditioning, and in applications where a large amount of material is used for distribution lines, such as in industrial and supermarket refrigeration.
In terms of thermal behaviour, several parameters suggest that CO2 will have good heat transfer properties compared to other refrigerants in the sub-critical region. It has a relatively high thermal conductivity for liquid and gas and a high specific heat. Close to the critical point the vapour density becomes close to that of liquid, which will have a strong influ-ence in determining the flow patterns and may result in a more homoge-nous flow in CO2 compared to other refrigerants. Figure 7 shows the liquid to vapour density ratio for CO2 and other selected refrigerants. It is clear from the figure that CO2 has much lower ratios over the selected temperature range than the other compared refrigerants.

15
-30 -20 -10 0 10 20 30 400
100
200
300
400
500
600
Tsat [°C]
Den
sity
ratio
(Liq
/Vap
) [-]
CO2
R134aNH3
R22PropaneR404A
Fi gu r e 7 : L iqu i d t o v apou r d en s i t y r a t i o s f o r s e l e c t e d r e -f r i g e r an t s a t d i f f e r e n t s a t u ra t i o n t emp e ra t u r e s .
Another important characteristic of heat transfer is surface tension. Low surface tension will make boiling of the refrigerant easier by requiring less superheat to initiate bubble formation. However, a negative effect may result from the low surface tension due to poor wetting of the rela-tively hot surface during boiling. CO2 has relatively low surface tension which is lower than R404A’s for most of the selected temperature range, which can be seen in the following figure.
-30 -20 -10 0 10 20 30 400
0,01
0,02
0,03
0,04
0,05
Tsat [°C]
Sur
face
tens
ion
[N/m
]
CO2
R134a
NH3
R22PropaneR404ALiq
Fi gu r e 8 : Su r f a c e t e n s i o n f o r s e l e c t e d r e f r i g e ran t s a t d i f -f e r e n t s a t u r a t i on t emp e ra tu r e s .

16
The flow in the trans-critical region is a single phase with high density, which is a positive factor when looking at the pressure drop and permits the use of small components. As a result of the comparable latent heat of vaporization, presented in Figure 3, the mass flow rates of the selected refrigerants will also be comparable for the same cooling capacity, except for NH3. Similar mass flow in small components will result in relatively higher mass flux for CO2 which indicates good single phase heat trans-fer.
Heat rejection in the trans-critical region is achieved at constant pressure where all properties change continuously with the temperature. For ex-ample; at 90 bars the density will change with temperature according to the plot in Figure 9. Plots of viscosity and conductivity look similar.
0 10 20 30 40 50 60 70 80 90 100 1100
2
4
6
8
10
12
14
0
200
400
600
800
1000
T [°C]
Cp
[kJ/
kg-K
], P
r Num
[-]
Cp
ρ [k
g/m
3 ]
Prρ
90 bars
Fi gu r e 9 : Den s i t y , s p e c i f i c h e a t and P rand t l numb e r f o r d i f f e r e n t t empe ra t u r e s a t 90 ba r s .
The specific heat, by definition, is infinite at the critical point and there is a maximum specific heat value for each isobaric pressure line in the trans-critical region, as can be seen in the figure above. This will have an influence on the Prandtl number which will also change along the iso-baric line with a maximum value at a certain temperature. This can also be seen in the figure above.
Changes in properties with temperature during the heat rejection process will result in considerable variations in the local values of pressure drop, temperature drop, and heat transfer coefficient.

17
2 . 4 A p p l i c a t i o n s o f C O 2 i n r e f r i g e r a t i o n s y s t e m s
After the revival of CO2 it has been investigated for use in almost all re-frigeration applications. The first application where the use of CO2 was suggested was in mobile air conditioning. This application is responsible for the highest consumption/release of refrigerants. R134a, which has a GWP value of 1300, is usually used in current systems. Therefore, the successful application of CO2 in mobile air conditioning will have signifi-cant environmental advantages.
In this application CO2 will have to operate in the trans-critical region which imposes challenges in designing high pressure components, keep-ing the system tight and controlling it properly. The European RACE project between 1994 and 1997 focused on experimentally investigating a CO2 mobile air conditioning system and comparing it to a R134a system (Gentner, 1998). Major car manufacturers participated in the project and the initial results laid the foundation for future work and demonstrated the potential for CO2 in this application. By improving the system’s components and level of control the CO2 technology was even able to compete with the improved R134a systems that were introduced in mid-1990s (Kim, Pettersen, & Bullard, 2004).
The extensive research and development carried out on CO2 systems re-sulted in a system which shows up to 40% improved COP over the base-line R134a for temperatures below 40°C, which are the temperatures at which mobile air conditioning systems operate most of the time. How-ever, the CO2 system had 10% lower COP at extreme temperatures, up to 54.4°C, while providing the same cooling capacity (Kim et al., 2004).
Modern car engines produce low amounts of waste heat which delays heating up the passenger compartment, thus resulting in long periods of discomfort and raising safety concerns (Kim et al., 2004). An important advantage that CO2 systems have over R134a is the possibility of operat-ing the system as a heat pump where heat is needed at start up. Kim et al. (2004) presented reasons why heat pumps are not currently employed in automobiles with R134a systems. These reasons included large compres-sor displacement and air in-leakage in compressor shaft seal at sub-atmospheric suction pressures.
The discovery of this potential for CO2 systems in this application and the regulations suggested for R134a systems strongly indicate that CO2 is currently the strongest candidate to replace R134a in mobile air condi-tioning.

18
The application where CO2 has been used commercially on the largest scale is in hot water heat pumps. When rejecting heat in the trans-critical region the temperature curve of CO2 matches the temperature of the heated medium, which reduces cycle losses and results in higher efficien-cies than for conventional refrigerants. In addition to the good adapta-tion of the heat rejection process to this application, the efficient com-pression and good heat transfer characteristics of CO2 contributes to improved process efficiency. The big advantage of this technology is the ability to supply water at a high temperature with good COP; in a study by Hwang and Radermacher (1998) a 10% improvement has been dem-onstrated over R22 systems.
Several Japanese manufacturers put CO2 heat pump water heaters for homes on the market in 2001/2002. In 2005, the Japanese government set a cumulative shipment target of 5.2 million units in 2010 to promote energy savings (Endoh et al., 2006). This is evidently the most successful application of CO2 in refrigeration systems from a commercial point of view.
Using CO2 in commercial and supermarket refrigeration systems has been implemented since the early stages of the revival of CO2 as a refrig-erant. It has been used in supermarket refrigeration systems as a secon-dary working fluid in indirect systems for freezing applications. Nowa-days, CO2 is also used in the low stage of cascade systems and as the only working fluid in trans-critical systems. Details of the different CO2 system solutions in supermarket refrigeration are presented in section 3.2.
The advances of CO2 in certain application areas encouraged research and investigation to go in new directions and test CO2 for different ap-plications. The development of new components, highlighting specific advantages of CO2 in certain applications, and gaining confidence in dealing with its systems provided a good background for new implemen-tations. Residential cooling and heating, transport refrigeration and hot air dryers are some of the application areas for which the applicability of CO2 systems has been investigated and may have potential as a replace-ment for synthetic refrigerants.
2 . 5 C o n c l u s i o n s CO2 has very interesting characteristics as a refrigerant. Being natural, it does not present unforeseen threats to the environment, it has no ODP and its GWP value is 1. It is cheap and has good safety characteristics which make it an almost ideal fluid for use in refrigerated spaces with relatively large quantities.

19
Properties of CO2 are significantly different from other conventional and natural refrigerants. It has low critical and high triple points with consid-erably higher operating pressures. The volumetric refrigerating effect is much higher, the pressure drop is much lower as well as the correspond-ing temperature drop, which permits the design of smaller components and more compact systems.
CO2 is being investigated and/or applied in different areas, such as; mo-bile air conditioning, hot water heat pumps, and commercial refrigera-tion. It demonstrates good competitiveness with conventional and alter-native technologies with the potential for implementation in other appli-cation areas as well.

20
3 CO2 in supermarket refrigeration
3 . 1 I n t r o d u c t i o n The early application of CO2 in supermarket refrigeration was as a sec-ondary working fluid in indirect systems. Some of the main reasons for using CO2 in indirect system arrangements are the simplicity of the sys-tem and the possibility of using components for other refrigerants to build its circuit.
Due to the widespread interest in CO2 as an alternative to synthetic re-frigerants in the two major refrigerant consuming applications, i.e. mo-bile air conditioning and commercial refrigeration, components which are specially designed to handle CO2 have become increasingly available and competitive in price. This has broadened the possibilities of using CO2 in arrangements other than indirect systems so that its favourable characteristics can be utilized effectively. About ten years after the first CO2 installation, other arrangements such as cascade and multistage sys-tems have also been applied commercially.
3 . 2 S y s t e m s o l u t i o n s In general, two temperature levels are required in supermarkets for chilled and frozen products. Product temperatures of around +3°C and –18°C are commonly maintained. In these applications, with a large dif-ference between evaporating and condensing temperatures, the cascade or other two-stage systems become favourable and are adaptable for the two-temperature level requirements of the supermarket. The following section describes CO2-based solutions that fulfil the refrigeration re-quirements of supermarkets.
3 . 2 . 1 I n d i r e c t a r r a n g e m e n t s CO2 as a secondary working fluid in indirect systems for freezing tem-perature applications was the first CO2 refrigeration system to be com-mercially applied. As discussed earlier, the two main reasons why CO2 was phased out were the high operating pressure and low critical tem-
21
perature. In the low temperature indirect concept, the operating condi-tions are far from the critical limits and the pressures are reasonable (11 bars at -37°C).
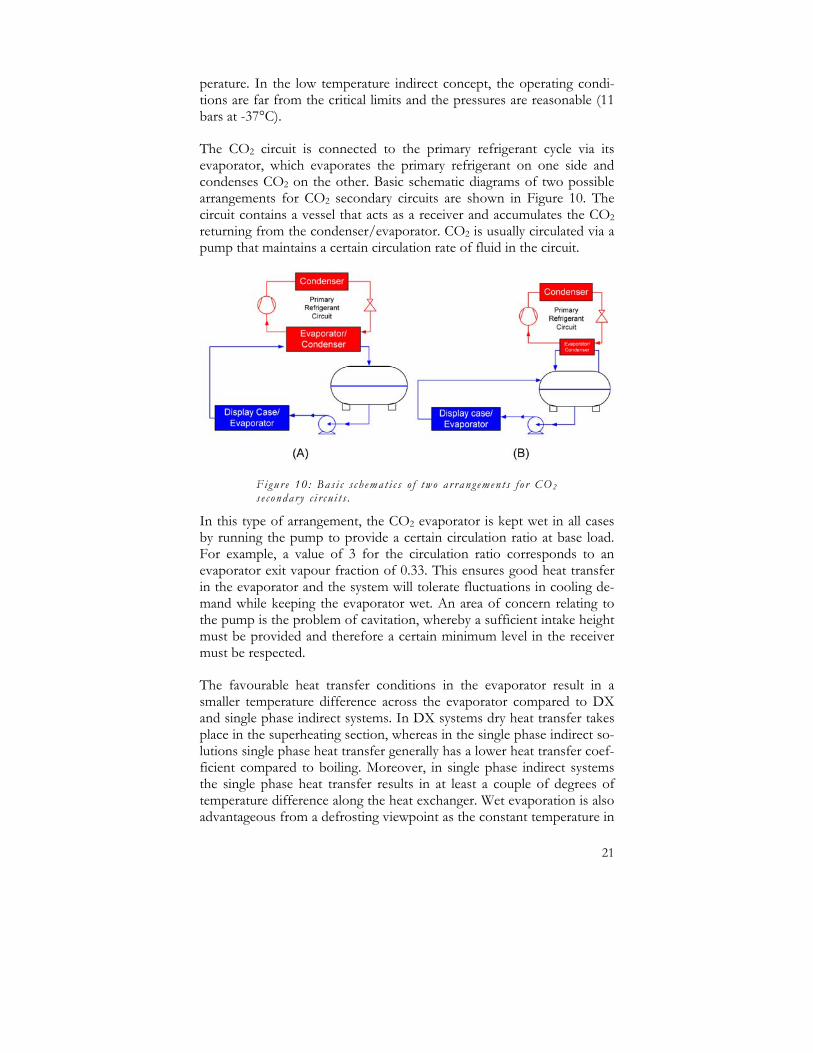
The CO2 circuit is connected to the primary refrigerant cycle via its evaporator, which evaporates the primary refrigerant on one side and condenses CO2 on the other. Basic schematic diagrams of two possible arrangements for CO2 secondary circuits are shown in Figure 10. The circuit contains a vessel that acts as a receiver and accumulates the CO2 returning from the condenser/evaporator. CO2 is usually circulated via a pump that maintains a certain circulation rate of fluid in the circuit.
Fi gu r e 10 : Ba s i c s c h ema t i c s o f tw o a r r an g emen t s f o r CO2 s e c o nda r y c i r c u i t s .
In this type of arrangement, the CO2 evaporator is kept wet in all cases by running the pump to provide a certain circulation ratio at base load. For example, a value of 3 for the circulation ratio corresponds to an evaporator exit vapour fraction of 0.33. This ensures good heat transfer in the evaporator and the system will tolerate fluctuations in cooling de-mand while keeping the evaporator wet. An area of concern relating to the pump is the problem of cavitation, whereby a sufficient intake height must be provided and therefore a certain minimum level in the receiver must be respected.
The favourable heat transfer conditions in the evaporator result in a smaller temperature difference across the evaporator compared to DX and single phase indirect systems. In DX systems dry heat transfer takes place in the superheating section, whereas in the single phase indirect so-lutions single phase heat transfer generally has a lower heat transfer coef-ficient compared to boiling. Moreover, in single phase indirect systems the single phase heat transfer results in at least a couple of degrees of temperature difference along the heat exchanger. Wet evaporation is also advantageous from a defrosting viewpoint as the constant temperature in

22
the evaporator on the refrigerant side results in more uniform frost for-mation and may therefore reduce the defrosting time. Additionally, the rate of frost formation may be lower due to the expected higher evapo-rating temperature of CO2 in the evaporator.
From gaining experience in operating CO2 at freezing temperature levels, the same concept has been applied to medium temperature levels, as re-ported by Madsen et al. (2003). The temperature required for chilled food is usually around +3°C and should not go higher than 7°C for long periods of time. Assuming 7K of temperature difference in the display cabinet results in CO2 operating at –4°C, which corresponds to around 31 bars. In this case, components that can withstand 40 bars (corre-sponding to saturation temperature of 6°C) can handle CO2 with accept-able safety margins.
3 . 2 . 2 C a s c a d e s y s t e m s Cascade systems with CO2 in the low-temperature stage have been ap-plied in several supermarket installations and are becoming a more and more competitive alternative. The refrigerant in the high-temperature stage is usually propane, NH3 or R404A. The medium temperature cir-cuit uses either CO2 as a secondary working fluid, in a similar indirect ar-rangement to the one discussed earlier, or conventional single phase sec-ondary working fluids. In this type of system, the additional heat ex-changer that is needed to couple the low temperature CO2 secondary cir-cuit to the primary refrigerant cycle does not exist and the effect of its temperature difference is eliminated.
By using CO2 as the working fluid in both the low- and medium-temperature stages, it will be possible to use only one heat exchanger to provide the required cooling for the medium and low temperature cir-cuits, as shown in Figure 11.

23
Fi gu r e 11 : CO 2 c a s c a d e s y s t em w i t h CO 2 a s t h e r e f r i g e r -an t f o r t h e med i um t emp e ra tu r e l e v e l . B and C a r e a l t e r -na t i v e a r ran g em en t s f o r t h e c a s c ad e j o i n t . D and E a r e a l t e rna t i v e s f o r t h e e v ap o ra t o r a r ran g emen t .
Different arrangements of the cascade condenser and evaporator are possible in the cascade system. The evaporator/condenser could be a plate, shell-and-plate- or shell-and-tube heat exchanger. When single phase secondary working fluid is used instead of CO2 for the medium temperature level, the primary refrigerant can be arranged to expand in two separate heat exchangers in order to provide the required cooling for the medium and low temperature circuits. Another solution is to have two separate circuits to provide the cooling at the medium and low tem-perature levels.
When CO2 is the refrigerant at the medium temperature level, a single vessel can act as the receiver to collect liquid for the medium and low stage circuits while condensation is taking place outside the vessel in the evaporator/condenser, labelled Cascade Joint I in Figure 11A. Figure 11B and Figure 11C are two possible options for the cascade joint. In the case of Cascade Joint I, the hot discharge gas from the low stage com-pressor passes directly through the cascade condenser after mixing with

24
the saturated vapour from the CO2 tank. When mixing the hot gas with the relatively cold saturated vapour, it will become de-superheated to a certain degree and then in the cascade condenser further de-superheating and condensation will take place. In this study such a solution is referred to as the hot gas de-superheating arrangement.
Alternatively, the hot gas could be passed through the colder liquid in the tank where it de-superheats close to saturation by boiling off some of the liquid. In this case only saturated vapour enters the cascade con-denser. This solution, Cascade Joint II, is shown in Figure 11B. As a third option, all heat exchange can be arranged to take place inside the vessel where the refrigerant in the high temperature stage is evaporating in the tubes, and CO2 condenses and accumulates in the vessel to pro-vide the two CO2 circuits with the required refrigerant, Cascade Joint III shown in Figure 11C.
For the low temperature evaporator a direct expansion of CO2 can be performed that will require a certain superheat at the evaporator outlet, Figure 11E, in which case a suction line internal heat exchanger (IHE) could be used to provide a few degrees of sub-cooling in order to avoid flashing gas in the liquid line. Or, alternatively, flooded evaporators can be used in a concept similar to that for the CO2 secondary circuit, Evaporator Arrangement I in Figure 11A. This will result in better heat transfer in the evaporator but will have slightly additional energy con-sumption by the circulation pump. One further arrangement for low-stage evaporation is shown in Figure 11D where the vessel is used to sub-cool the refrigerant before the expansion valve. This is achieved without superheating and the refrigerant entering the compressor is satu-rated vapour. Flooded evaporator arrangements are more likely to be ap-plied in large-scale installations and in industrial refrigeration applica-tions.
Assuming isentropic compression and 7K of superheat, the temperature of CO2 exiting the compressor under operating conditions of between –37°C and –4°C is about 38°C. Therefore, there is a possibility of re-moving some heat by means of colder heat sinks available in the vicinity of the plant (tap water, room or ambient air), which reduces some of the cooling capacity in the high stage cycle.
3 . 2 . 3 T r a n s - c r i t i c a l s y s t e m s ( o n l y C O 2 s y s t e m s ) The main advantage of a two-stage system with CO2 as the only working fluid in the plant, compared to the cascade concept, is the absence of the cascade condenser and its temperature difference. The drawback is that the condensing/heat rejection pressure of the high-stage cycle will be

25
much higher than if any other common refrigerant is used. When the ambient temperature is high, then CO2 will be operating over the critical point and trans-critical operation is enforced.
In general, higher condensing/cooling temperatures will result in a loss of COP. An operating parameter which is important to control in the trans-critical operation is the pressure in the gas cooler (condenser in the sub-critical operation), where an optimum value for the highest COP ex-ists for each ambient temperature.
This kind of system is most suitable for cold climates or where cold heat sinks are available. In this case, the operation of such plants will mostly be in the sub-critical region. If hot water production is needed, then it is possible to effectively use the trans-critical side of the cycle for hot water production, which will improve the cycle’s overall efficiency.
To reduce compression losses in the high stage CO2 cycle, two-stage compression with an intercooler could be used. Additional sub-cooling can be achieved via an IHE. Figure 12 shows a schematic diagram of a multistage CO2 system with an intercooler and IHE. As seen in Figure 12, in multistage systems without a cascade condenser, the three circuits (high, medium and low stage) can be connected by means of a vessel that is maintained at the intermediate pressure/temperature and acts as the cascade condenser. This system solution is referred to in this thesis as the “centralized”.
Fi gu r e 12 : S c h ema t i c o f CO 2 on l y c e n t r a l i z e d s y s t em s o -l u t i o n .

26
Another option for the cycle is to have separate, parallel CO2 circuits op-erating between the ambient temperature on the high side and the inter-mediate and freezing temperature levels on the other sides. In order to obtain reasonable efficiency, the CO2 circuit that operates between am-bient and freezing temperatures should have two-stage compression equipped with an intercooler and IHE. This solution is similar to con-ventional DX systems at both temperature levels. In this thesis, this type of system solution is referred to as the “parallel”.
The variations in the evaporator arrangements described in Figure 11 are also applicable alternatives in multistage systems.
3 . 3 C O 2 s u p e r m a r k e t i n s t a l l a t i o n s e x a m p l e s - T h e c a s e o f S w e d e n
R22 and R12 were the most commonly used refrigerants in commercial refrigeration in Sweden prior to the enforced phase-out of HCFCs and CFCs. The use of CFC refrigerants was stopped by the year 2000 and by 2002 the refill of HCFC refrigerants was banned. Thereafter, the number of plants running with R22 and R12 decreased dramatically. The HFC refrigerants R134a and R404A have been used as replacements for R12 and R22. R134a has some drawbacks, such as a relatively low vapour density, so the compressor displacement required for a certain refrigera-tion capacity is high, necessitating a larger and more expensive compres-sor (Stoecker, 1998). R134a compressors have to run at relatively high pressure ratios, which may compromise compressor reliability and result in low volumetric efficiency. Moreover, for evaporating temperatures lower than -26°C, the saturation pressure of R134a will be sub-atmospheric, resulting in reliability concerns with regard to air leaking into to the system. Such drawbacks do not exist in R404A, so by 2005, according to Arias (2005), it became the dominant refrigerant in super-markets comprising up to 70% of refrigerants used in 371 stores.
The first CO2 indirect system plant was implemented in Sweden in 1995 with financial support from the government through the Swedish State Department of Environment Protection; it was useful in testing the technology since no consumer would risk the investment. The successful operation of the first plant encouraged the owners to adopt the new technology, which was relatively harmless in environmental terms. By the year 2007, more than 100 plants were running with capacities ranging from 10 to 280 kW.
In early installations of CO2 indirect, the refrigerants most commonly used in the machine room are NH3, R404A, and Care50 (a mixture of ethane and propane). Some of the plants were converted from old sys-

27
tems running with artificial refrigerants. The machine room was com-pletely altered due to the change of the working fluid. Owing to the sim-plicity of the installed systems, there was no problem in finding refrigera-tion technicians and engineers to run the systems and carry out mainte-nance in a proper and safe manner.
In cases where NH3 was used as the refrigerant in the machine room, the installation was more expensive when compared with other systems us-ing relatively safe refrigerants (Rolfsman, 1996); this is due to the safety devices required for NH3 usage. The special safety equipment required varies from one case to another, depending on the place where the plant is installed and its surroundings.
A Swedish example of a CO2 indirect system installation is the City Gross shop in Rosengård, Malmö. The area of the supermarket is 14000 m2 and the CO2 charge is about 450 kg. The primary refrigerant is R404A with a cooling capacity of 3x55 kW on the freezer’s side (Nihlen, 2004).
The last few years have witnessed the start of the application of CO2 cas-cade systems in Sweden. This step has followed the implementation of this technology in countries like Denmark and Luxembourg (Heinbokel, 2001). The use of single phase secondary working fluid instead of CO2 at the medium temperature level has generally been preferred due to the relatively high working pressure of CO2 in the secondary circuit. As is usually the case in medium size supermarkets, at the low temperature levels direct expansion evaporators are used. Flooded evaporators im-prove the heat transfer coefficient and have better cooling performance from a temperature point of view but the high installation cost limits their usage.
The first cascade system installed in Sweden was in the town of Kristi-nehamn. NH3 is the primary refrigerant and freezing cabinets are spe-cially designed for CO2 with thicker pipes and electronic expansion valves that are also used as magnetic valves during defrosting, which is performed three times a day. The system is reported to be more expen-sive than a traditional one but savings in running costs are expected to reduce the total cost. The freezing capacity is 50 kW and the pressure on the high side of the CO2 cascade system is 30-34 bars (-5-0°C), and at the low temperature side the pressure is 11 bars (-37°C) (StayCool, 2002).
Another example of an installation is in Linköping, where the system has a cooling capacity of 130 kW at the medium temperature level and a freezing capacity of 20 kW. NH3 is used in the high stage with 38% pro-

28
pylene glycol as secondary working fluid at the medium temperature level. The CO2 and NH3 compressors used are from Bitzer and the charge of CO2 is 50 kg, whereas that of NH3 is 30 kg. A small cooling unit is used to cool the system and reduce its pressure in the event of downtime (Dahlberg, 2003).
Systems that solely use CO2 as the working fluid are suggested by Gi-rotto (2004) to be a competitive solution in cold climates, for instance under the weather conditions of Stockholm. Such systems may be effi-cient when working in sub-critical conditions, at ambient temperatures below about 20ºC, and in that way it will be competitive with conven-tional systems such as DX R404A (Girotto, 2004). Average ambient temperatures in the majority of Sweden suggest that the boundaries of the system will allow it to operate in sub-critical conditions for long peri-ods of the year during both the cold winter and the temperate summer.
The first trans-critical installation in Scandinavia was installed in Odense/Denmark in 2003 (Rehnby, 2004). Nowadays, there are at least 20 trans-critical installations in Sweden. ICA Kvantum in the town of Varberg is the first installation of its kind in Sweden, with capacities of 2x25 kW on the freezer side and 2x55 kW on the medium temperature side (Tesab, 2004). This installation is an application of the system pre-sented by Girotto et al. (2003) where two parallel DX circuits are used to provide the cooling capacities at the low and medium temperature levels. The CO2 charge of this plant is around 50 kg which is lower than the amount an CO2 indirect system would absorb (Ekenberg, 2004). This can be attributed to the absence of an accumulation tank in the DX sys-tem, whereas it must be installed in CO2 indirect systems. Another sys-tem in Luleå has been in operation since September 2004, the capacity of which is 50 kW on the freezer side and 150 kW at the medium tempera-ture level which serves the units display cases in a 3000 m2 shop (StayCool, 2004).
3 . 4 C o m p a r a t i v e s t u d i e s In some of the comparisons performance cannot be evaluated fairly due to different system requirements, sizes and boundaries. This is especially true when attempting to compare actual installations, which are rarely exact. Theoretical analysis should give a better indication of the perform-ance of different systems because many of the parameters that cannot be controlled in practice, due to commercial, practical and market restric-tions, can be handled by the simulation.
The following comparisons, selected from the available literature, are for different operating conditions and system requirements and the aim is to

29
give a general indication of the performance of different CO2 systems compared to conventional and alternative technologies.
Theoretical analysis of the R134a/CO2 cascade system, shown in Figure 13, resulted in a 16% reduction in energy consumption compared to a traditional DX R404A system. The R404A/brine indirect system con-sumed 41% more energy than the cascade system, mostly due to the brine pump. The capital cost of the R134a/CO2 cascade system is lower than the indirect option and slightly more expensive than the conven-tional DX system (Elefsen & Micheme, 2003).
F i gu r e 13 : R134a/CO 2 c a s c ad e s y s t em (El e f s e n & Mi ch eme , 2003) .
In a field study, Heinbokel (2001) reported that the CO2 indirect system has a 6% higher energy consumption than a conventional system, de-fined as the DX R404A single stage, while a brine system had a 20% higher consumption. The cascade system only had a 2% higher energy consumption and also has the additional advantage of a low CO2 charge. In both cases, the CO2 systems in this study used brine at the medium temperature level, whereas using CO2 for that level would improve the COP.
Multi-stage systems must be used with NH3 due to the high discharge temperature, which is 150°C for isentropic compression between -35 and 30°C. In case of propane, single stage compression can be used due to the steep slope of the constant entropy lines, which results in a low dis-charge temperature; 40°C for isentropic compression between -35 and 30°C. Haaf and Heinbokel (2002) compared three system solutions; the first is a two-stage NH3 indirect system with brine at the medium and low temperature levels. The second is a single-stage propane indirect sys-

30
tem with brine at the medium and low temperature levels. The third is a CO2 cascade system with NH3 or R404A in the high stage. The field study comparisons are made with a conventional DX R404A system. NH3 was 20-30% more expensive in terms of investment costs and had a 10-20% higher energy consumption, while the propane system had 15-25% higher investment costs and a 5-20% higher energy consumption. For the cascade system the investment costs and energy consumption were almost the same as DX R404A.
According to Girotto et al. (2003), the installation of the trans-critical CO2 system, as per the schematic diagram shown in Figure 14, is more expensive than the R404A system by at least 10%. The annual energy consumption of CO2 was 8% higher. The COP of the plant proved to be better than a comparable R404A system for the periods of the year when ambient temperatures were low. In this comparison the CO2 high side pressure was floating while R404A was condensing at a constant pres-sure/temperature.
Fi gu r e 14 : S c h ema t i c o f t r an s - c r i t i c a l CO 2 pa r a l l e l s y s -t em (Gi r o t t o e t a l . , 2003 ) .
3 . 5 C o n c l u s i o n s The three main categories of system solution where CO2 can be applied in supermarket refrigeration are the indirect, cascade and trans-critical systems. The indirect system solution was the first to be applied due to the low pressure levels at freezing temperatures and the simplicity of the system as well as the possibility of converting old systems to CO2 indi-rect while using most of the old circuit’s components.
In the cascade system solution the operation will be sub-critical where pressure levels are low so conventional components can be used. The

31
circulation pump and the additional temperature difference that exists in the secondary working fluid loop condenser in the indirect system solu-tion do not exist in the cascade system; thus, energy consumption is ex-pected to be lower.
The trans-critical system could be an interesting solution when hot water heating is needed, especially where good heat rejection characteristics can be employed. Otherwise, floating condensing must be applied so that the system operates sub-critically when the ambient temperature is low, thus achieving competitive COPs. Several arrangements can be found for the cascade and trans-critical system solutions.
The three main system solutions have all been installed in practice. In Sweden, for example, there are currently more than 100 supermarkets with indirect system solution. In the last few years several cascade and trans-critical systems have also been installed.
Some studies from the literature compared certain CO2 system solutions to conventional installations, which was mostly the DX R404A. In gen-eral, the indirect system had a slightly higher energy consumption than the conventional system but this was lower than the single phase indi-rect. The cascade system had comparable energy consumption figures to the DX R404A. In the case of the trans-critical system, energy consump-tion was slightly higher compared to the DX R404A system. The installa-tion cost was usually higher for CO2 system solutions.
Comparisons carried out in the literature are usually between systems in real-life installations. It is hard to draw conclusions based on measure-ments from real field installations since operating parameters, system re-quirements and ambient conditions are not usually identical. Therefore, a computer simulation model seems to be a convenient tool as a first step towards the evaluation of different solutions.

32
4 Description of computer simulation models
The application of new system solutions must be verified against existing technologies where theoretical analysis is an essential step in defining po-tential advantages, disadvantages and limitations in each solution. CO2 system solutions for supermarkets are mainly compared with DX R404A systems, which represent a “good” conventional system solution.
Models are written using EES software. Its basic function is to provide the numerical solution to a set of algebraic equations. It has many built-in mathematical and thermo-physical property functions for refrigerants (Klein, 2006).
4 . 1 I n d i r e c t s y s t e m s When comparing the energy consumption of an indirect system with that of a DX system, the indirect system is generally expected to have higher energy consumption due to the temperature difference that exists in the additional heat exchanger. This is denoted as evaporator/condenser in Figure 10, which couples the primary and secondary loops. This necessi-tates that the compressor operates at a lower evaporating temperature and therefore consumes more energy for the same refrigeration capacity. Moreover, the power needed to run the secondary working fluid circula-tion pump will add to the running costs of the indirect system.
In the specific application of supermarkets, the distribution lines are long which means that in the DX refrigeration system there will be a further increase in the temperature lift across the compressor due to the tem-perature drop in the suction line. This temperature drop may be 0.5-2ºC at -30ºC evaporating temperature (Stoecker, 1998). The low pressure drop, and the corresponding temperature drop, for CO2 suggests that the temperature drop in the return line (suction line in the case of DX) will be small and this may compensate for some of the temperature differ-ence in the additional heat exchanger.
The low pressure drop for CO2 and the low volume flow rate, due to the high vapour density of CO2, will contribute towards minimizing the en-

33
ergy consumption of the pump in the secondary circuit, which will give CO2 a major advantage compared to single phase indirect systems but it may result in higher energy consumption compared to DX systems.
In order to properly compare the CO2 indirect system with a DX system, the influence of pressure and corresponding temperature drops in the long suction line must be considered when making energy consumption calculations. The power consumption of the CO2 pump must also be calculated and related to compressor power. The following sections pre-sent a theoretical analysis of the energy consumption of a CO2 indirect system and a conventional DX system.
4 . 1 . 1 S y s t e m d e s c r i p t i o n The selected case is a plant with 50 kW of freezing capacity and a length of suction line which is 60 m. These features are estimated to be typical of a medium size supermarket, using CO2, in Sweden. As is the case with many installations in Sweden, plants have been converted to an indirect system with CO2 as the secondary working fluid then the pipes and freezing cabinets could be kept from the old plant and used to build the secondary loop. The DX and indirect refrigeration systems are shown in Figure 15 and Figure 16 respectively. The dashed lines represent the suc-tion and return lines and the components connected to them.
Heat rejection or heatrecovery system
ConventionalDX-system
Air
cool
er
Machine room
FreezingCabinet
Suction line
Fi gu r e 15 : S c h ema t i c o f a DX s y s t em .

34
Heat rejection or heatrecovery system
Primaryrefrigerant cycle
Air
cool
er
CO2secondary
loop
Machine room
FreezingCabinetReturn line
Fi gu r e 16 : S c h ema t i c o f a s i n g l e - s t a g e CO 2 i nd i r e c t s y s -t em .
4 . 1 . 2 C a l c u l a t i o n m o d e l The CO2 pressure drop and corresponding saturation temperature drop in the secondary circuit are calculated and compared to that of R404A. These drops will result in reduced pressure and temperature at the inlet of the compressor and will increase energy consumption. The energy consumption of CO2 indirect systems with R404A, NH3 or propane as the primary refrigerant is calculated and compared to conventional DX system using R404A.
The suction line flow in the DX system is in a single phase while it is a two-phase flow in the return line of the indirect system. Improper sizing of the suction/return line might result in large diameter pipes; conse-quently, installation costs will be high and in the case of the DX system oil return will be a problem. Small diameter pipes will result in high pres-sure and saturation temperature drops; hence, more compressor power will be required to operate the system.
To calculate the single phase flow pressure drop, equation 2-1 is used, where the friction factor ( f ) is calculated using the Gnielinski correla-tion presented in the following equation (Granryd et al., 2005).

35
2641790
1
).ln(Re).(f
−×= 4-1
Where Re is the Reynolds number.
The Friedel correlation of two-phase multiplier (Hewitt, 1998) is used to calculate the two-phase flow pressure drop in the CO2 return line. Rie-berer (1998) compared a few correlations and concluded that the Friedel correlation gives the best approximation for the CO2 two-phase flow pressure drop. The Friedel correlation defines the “frictional multiplier” that relates the two-phase flow frictional pressure gradient and the pres-sure gradient with the same total mass flux having the properties of a liquid.
The temperature of the air inlet to the freezing cabinet is assumed to be –30ºC, while the condensing temperature is 35ºC, and 5K is assumed for superheating and sub-cooling. CO2 leaves the flooded evaporator with a vapour content of 0.33, based on an assumed circulation ratio of 3. For the evaporator inlet, R404A enters with a vapour content of 0.45, while CO2 enters in the saturated liquid phase. The isentropic efficiency of the compressor is assumed to be 80%.
4 . 1 . 3 S y s t e m o p t i m i z a t i o n Values for the saturation temperature drop in the suction/return line for different pipe diameters are plotted in Figure 17. It is clear from this fig-ure that the saturation temperature drop of CO2 is much less than that of R404A for the same pipe diameters. This indicates that for the same permissible temperature drop in the suction line, CO2 will require a much smaller size than for R404A. Thus smaller pipes and more com-pact heat exchangers can be used with CO2.

36
20 30 40 50 60 70 800
0,5
1
1,5
2
2,5
3
3,5
4
d [mm]
dTin
,60m
,pip
e [°
C]
R404A
CO2
Fi gu r e 17 : T empe r a t u r e d r op i n t h e s u c t i o n/ r e t u r n l i n e f o r R404A and CO 2 (CR=3) f o r d i f f e r e n t p i p e d i ame -t e r s .
The size of the R404A suction line is selected based on an allowable temperature drop of 0.5-2ºC. According to Figure 17, a 2 5/8” (62 mm of internal diameter) suction line is used, which results in a 1.9ºC tem-perature drop in the 60-meter-long pipe. For the same pipe size, the temperature drop in the CO2 return line is 0.07ºC (about 27 times less). These calculations give an indication of the real situation when the plant is converted to CO2, having originally operated using R404A. In this case the pipes from the original plant are used to build the CO2 secondary loop. If the system had originally been designed to operate using CO2, then, according to the results in Figure 17, a size of 1 5/8” (38 mm in-ternal diameter) could have been selected which would result in a tem-perature drop of 0.65°C.
Detailed results from running the model and comparisons with DX R404A are presented in section 5.2.2.
4 . 2 C a s c a d e s y s t e m In the cascade system each refrigerant operates within the system’s boundaries where it can provide good COP with reasonable pressure levels and favourable operating conditions. The low critical point for CO2 implies that the COP will be relatively low, which can clearly be seen in Figure 18. It will, however, operate with a higher theoretical COP between low temperature ranges further below the critical point. The dif-ferences in COP in sub-critical operation between CO2 and the com-pared refrigerants are smaller than in the high stage operation. This can

37
be observed when comparing the COP curves in Figure 18 and Figure 19. In the figures, the COP is calculated under the assumption of an ideal compressor, with no superheating or sub-cooling. In Figure 18, COP values above the critical point are obtained at optimum pressure on the high pressure side.
15 20 25 30 35 40 451
2
3
4
5
6
7
8
9
10
Tcond / Tgc,exit [°C]
CO
P [-
]
CO2R404AR134aAmmonia
Tevap=-10°C
Fi gu r e 18 : COP o f CO 2 c ompa r e d t o o t h e r ma in r e f r i g -e r an t s i n h i g h s t a g e op e ra t i o n .
-15 -10 -5 0 5 10 153
4
5
6
7
8
9
10
11
12
CO
P [-]
CO2R404A
R134aAmmonia
Tevap=-35°C
Tcond [°C]
Fi gu r e 19 : COP o f CO 2 c ompa r e d t o o t h e r ma in r e f r i g -e r an t s i n l ow s t a g e o p e r a t i on .

38
The favourable thermo-physical properties of CO2 result in low pressure and temperature drops in the system’s components, which, in addition to good heat transfer characteristics, will contribute to an improvement in the COP values of CO2 in Figure 19.
4 . 2 . 1 S y s t e m d e s c r i p t i o n A solution which is based on natural refrigerants and an alternative can-didate to conventional systems is the NH3/CO2 cascade concept. Figure 20 is a schematic diagram of such a system solution which has been built and tested in a laboratory environment and will be described in detail in section 6.2. In this system concept CO2 pressure levels are acceptable; when condensing at -3°C pressure is about 32 bars. At this temperature level, as can be seen in Figure 20, the cooling load in the medium tem-perature level is provided by circulating CO2 which accumulates in the tank.
Fi gu r e 20 : NH 3 /CO 2 c a s c ad e s y s t em .
4 . 2 . 2 C a l c u l a t i o n m o d e l The model uses the required product temperatures and the ambient con-ditions as the boundaries of the system. At the medium temperature level the cooling capacity is 150 kW, with 50 kW for the freezing load; these capacities are typical for a medium size supermarket in Sweden which

39
was defined based on a survey carried out among several major compa-nies in the field. Load ratio is defined as the relation between cooling ca-pacities at the medium temperature level to those at the low temperature level; thus, the capacities selected result in load ratio of 3.
Product temperature at the medium level is +3ºC and -18ºC for frozen food. The designed condensing temperature is 30ºC. Some of the pa-rameters inserted in the model have been selected from experimental work on an NH3/CO2 cascade system, which is detailed in section 6.2. For instance, evaporating temperature that results in the required prod-uct temperature is calculated using experimental values for approach temperature differences and the temperature change of air across the cabinets’ heat exchangers.
In order to calculate performance, losses and capacities within the sys-tem, the main system components are modelled as follows.
4 . 2 . 2 . 1 D i s p l a y c a b i n e t s
Approach temperature differences and the temperature change of air across the heat exchangers were used to calculate the evaporation tem-perature of CO2.
Heat transfer between the refrigerant side and the air was not modelled. Instead, approach temperature differences and air temperature differ-ences were obtained from experimental data for the medium tempera-ture and freezing cabinets in the experimental rig. Details of these tests are presented in Perales Cabrejas (2006). The temperature profiles in the medium temperature cabinet and DX freezer are shown in Figure 21 and Figure 22 respectively.
L (m)
Tproduct
(a)
ΔTair
ΔTapp
Fi gu r e 21 : T empe r a t u r e p r o f i l e i n t h e med ium t emp e ra -t u r e c a b i n e t .

40
Tproduct
L (m)
T (ºC)
(b)
Fi gu r e 22 : T empe r a t u r e p r o f i l e i n t h e DX f r e e z e r .
Medium temperature cabinets
The temperatures of products at different positions in the cabinets have been measured in order to locate the position of the highest product temperature. The cabinets each have a cooling capacity of 5 kW with two parallel circuits 72 m in length and 5/8” (15.9 mm) in diameter.
Product-Air temperature difference (ΔTproduct,air) is the difference be-tween the warmest product temperature and the temperature of the air inlet into the display cabinet’s heat exchanger. Experiments showed that the product temperature value falls between the air inlet and outlet tem-peratures of the display cabinet’s heat exchanger; it is about 3K lower than the air inlet temperature. This is due to the fact that, in the vertical display cabinets used in the experimental rig, an air curtain was imple-mented which limits the infiltration of warm air from the surroundings into the cabinet’s cold envelope. The air entering the evaporator is a mix-ture of cold air from the product envelope and warm air from the cur-tain. Moreover, cold air leaving the cabinet’s evaporator is partly supplied though the rear vertical surface of the cabinet, through small holes which allow the products to be closer to the cold air supply. The air tempera-ture change (ΔTair) is 7K and the temperature difference between the air and the refrigerant (ΔTapp) is 2K.
DX freezing cabinet
The freezing load is divided between 2.5 kW cabinets which have a single coil of 72 m in length, with a diameter of 1/2” (12.7 mm).

41
Experiments showed that the warmest product temperature is 2.5K higher than the air inlet temperature to the freezer’s evaporator. A possi-ble reason for the product temperature being higher than the air inlet temperature could be that the freezers were exposed to a large radiation surface and ceiling lightning. Air temperature change across the heat ex-changer is 7.5K.
The lowest approach temperature difference between the air and the re-frigerant is about 5K; in the simulation model this could happen at either the air inlet or air outlet ends of the heat exchanger and depends on the superheat value. Looking at the temperature profile in Figure 22 it can be observed that with high superheat, the approach will be at the air inlet side while for low superheat value this will take place at the air outlet end; similar to the case of flooded medium temperature cabinets. The lowest superheat value that could be reached in the cascade experiment (Sawalha, Soleimani K., & Rogstam, 2006), with stable operation of the freezers, is 9K; this value has been used as an input into the simulation model.
The required product temperatures were used as input values for the model. Temperature profiles presented in Figure 21 and Figure 22 are then constructed using the experimental values outlined above to obtain the evaporation temperature. Pressure and temperature drops on the re-frigerant side are also included in the calculations of the evaporation temperature.
4 . 2 . 2 . 2 O t h e r h e a t e x c h a n g e r s
The condenser is simulated by assuming a 5K approach temperature dif-ference at the inlet of the heat sink side with no sub-cooling.
The temperature difference between CO2 and NH3 across the cascade condenser is 2.5K. This is based on the experimental results presented by Perales Cabrejas (2006).
4 . 2 . 2 . 3 C o m p r e s s o r s
Isentropic efficiency values of compressors were obtained from the following equation which is a curve fit by Brown et al. (2002) for a CO2 compressor in a mobile air conditioning system. This correlation has been compared to two other compressor curve fits by Chen and Gu (2005), Robinson and Groll (1998) and Liao’s et al. (2000), and was adapted as a good approximation of the real performance of an open-type CO2 compressor.
42
⎟⎟⎠
⎞⎜⎜⎝
⎛×−=
2
12 04478093430
PP..CO,isη 4-2
1P and 2P are the discharge and suction pressures.
It must be pointed out that Brown et al. (2002) suggested this formula for pressure ratios higher than 2. However, applying this correlation to lower pressure ratio values gives results which are close to the ones gen-erated by Robinson and Groll (1998) and Liao et al. (2000).
The correlation presented by Liao et al. (2000) is a curve fit of experi-mental data from a CO2 compressor and has been used in calculations for pressure ratios close to 1.5. Other examples of tested compressors which show good isentropic efficiency at pressure ratios lower than 2 can be found in Cutler et al. (2000) and Giannavola et al. (2000).
For the NH3 compressor the two correlations shown below, by Pierre (Granryd et al., 2005), were used to predict the volumetric and isentropic efficiencies of a “good” NH3 reciprocating compressor.
⎟⎟⎠
⎞⎜⎜⎝
⎛⋅−⋅=
2
13 0630021
PP.exp.NH,vη 4-3
Where 2
1
PP
is the pressure ratio.
⎟⎟⎠
⎞⎜⎜⎝
⎛+⋅−= 971691
2
1
3
3 .TT
.exp,abs
,abs
NH,is
NH,v
ηη
4-4
Where 2
1
,abs
,abs
TT
is the ratio of the absolute temperatures in (K)
4 . 2 . 2 . 4 P r e s s u r e a n d t e m p e r a t u r e d r o p c a l c u l a t i o n s
The calculations are made following the method presented in section 4.1.2. The pressure drop in fittings is not included in the calculations. Pipe length could be increased by 50% to account for the pressure drop in fittings, as suggested by Dossat (1991). However, this was not applied to the calculations because the model used to calculate the two-phase pressure drop overestimates the actual pressure drop by about 50% on average, as presented in section 6.5.1.

43
The flow in the medium temperature display cabinet starts as single phase flow, evaporates along the heat exchanger pipe and exits with a certain quality that is the inverse value of the circulation ratio ( CR/x 1= ). The pressure drop calculations were made using a simpli-fied algorithm which was shown to give results close to those of Friedel’s correlation presented in Hewitt (1998).
The same method is used for calculating the pressure drop in the DX freezers with two phase flow conditions at the inlet and single phase flow conditions at the exit. A simplified assumption is used due to the ex-pected small pressure and temperature drops in the display cabinets, of less than 0.5°C, which will have an insignificant influence on the system’s COP.
Pressure drop is neglected in the remaining heat exchangers in the sys-tem and in the high stage circuit pipes. The efficiency of the pump is as-sumed to be 50% with 400W of heat losses.
4 . 2 . 3 S y s t e m o p t i m i z a t i o n
4 . 2 . 3 . 1 P i p e s i z i n g
The length of pipe between the machine room and the display cabinets is assumed to be 60m, which is an estimate for an average size supermar-ket. The same guidelines for the sizing of suction and return lines, as used in the indirect system model, section 4.1.3, were followed in the siz-ing of the CO2 system. The size of the liquid supply line was chosen in order to ensure a reasonable pressure drop, which Dossat (1991) rec-ommended to be about 70 kPa in direct expansion systems.
Tube size selection took into consideration the possibility of running the system within a reasonable margin of load fluctuations and boundary changes. Some parameters, e.g. circulation ratio, can be changed while still allowing the system to give reasonable pressure drops at the selected sizes.
Figure 23 shows the temperature and pressure drops in the supply and return lines for the medium temperature circuit. The calculations are made for different tube diameters and circulation ratios of 2 and 3 at a saturation temperature of -8°C. A value of 2 is used as the design circula-tion ratio at the rated capacity.

44
20 25 30 35 40 45 500
0,5
1
1,5
2
2,5
3
0
50
100
150
200
250
300
350
Diameter [millimeter]
dT [
°C]
dT, Supply, CR=2
dT, Supply, CR=3
dT, Return, CR=3
dT, Return, CR=2
dP [
kPa]
dP, Return, CR=2
dP, Supply, CR=2
Supply
ReturnReturn
Supply1 5/8"
1 3/8"
Fi gu r e 23 : T empe r a t u r e and p r e s s u r e d r o p s i n t h e me -d i um t empe r a tu r e d i s t r i bu t i o n l i n e s .
As can be seen in the figure above, a 1 3/8” (34.9mm) length of supply line will result in temperature and pressure drops of about 0.35°C and 30kPa respectively. On the return line, the temperature drop for 1 5/8” (41.3mm) is 0.9°C which corresponds to a pressure drop of about 75kPa. In the same figure another plot is made where the circulation rate is in-creased to have a circulation ratio of 3 and the results on the temperature drop side show that the values are still within an acceptable range.
On the low temperature side, the plot in Figure 24 shows the calculation for two solutions where direct expansion or flooded evaporators can be applied. As can be seen in the figure, for a DX solution or flooded evaporator with circulation ratios of 2 and 3, the temperature and pres-sure drops are within the acceptable level for 7/8” (22.2mm) of liquid line and 1 3/8” (34.9mm) of return line.

45
15 20 25 30 350
0,5
1
1,5
2
2,5
0
25
50
75
100
125
Diameter [millimeter]
dT [°
C]
dT, Return, DXdT, Return, CR=2dT, Return, CR=2
dT, Return, CR=3dT, Return, CR=3
dP [k
Pa]
dP, Supply, DXdP, Supply, DX
dP, Supply, CR=3dP, Supply, CR=3dP, Supply, CR=2dP, Supply, CR=2
1 3/8"7/8"
Supply
Fi gu r e 24 : T empe r a t u r e and p r e s s u r e d r o p s i n t h e l ow t empe ra tu r e d i s t r i b u t i o n l i n e .
4 . 2 . 3 . 2 C i r c u l a t i o n r a t i o
According to the experimental study of the optimum circulation ratio for CO2 in a flooded evaporator (see section 6.2.1.2), increasing the circula-tion ratio did not result in any measurable improvement in heat transfer. This indicates that the selected circulation ratio should be as low as pos-sible to ensure complete evaporation at the highest expected load. There-fore, a circulation ratio value of 2 at base load was chosen which should ensure that during load fluctuations and at start up dry evaporation will not occur. However, higher value may be chosen in order to avoid dry-out which may occur with CO2 at relatively low vapour fractions.
4 . 3 T r a n s - c r i t i c a l C O 2 s y s t e m Trans-critical CO2 systems will bypass the need for a cascade condenser which may improve the COP. In order to evaluate the CO2 trans-critical system solution against other alternatives an efficient CO2 system should first be defined.
Calculations have been performed in order to design different CO2 trans-critical system solutions. The systems’ performance has been op-timized and the basic layout of each solution has been defined.

46
4 . 3 . 1 S y s t e m d e s c r i p t i o n The two main possibilities for system solutions where CO2 can be used in supermarket applications as the only refrigerant are the parallel and centralized arrangements. As can be seen in Figure 25, the parallel solu-tion consists of two separate circuits; one serves the medium tempera-ture level cabinets and the other serves the freezers. DX is applied at both temperature levels and two-stage compression is used for the low temperature circuit. This will decrease the discharge temperature, mini-mize losses in compression, and reduce the enthalpy difference across the compressors. Since the temperature lift is presumed to be small in the medium temperature circuit then single stage compression is used. System with similar solution have been presented by Girotto et al. (2003).
Fi gu r e 25 : A pa ra l l e l s y s t em s o l u t i on w i t h s i n g l e s t a g e c omp r e s s i o n on t h e med i um t emp e ra tu r e l e v e l w i t h IHE on b o t h c i r c u i t s . S im i l a r s o l u t i o n c an b e f o und i n G i r o t t o e t a l . (G i r o t t o e t a l . , 2003 ) .
In the centralized system solution1, Figure 26, the three circuits in the system merge in the accumulator/tank. Thereby, in this solution the evaporators for the medium temperature cabinets are flooded with CO2,
1 Usually what is referred to as a centralized system is a system with the central refrig-eration unit located in a machine room. In this study it refers to systems with a layout similar to that shown in the schematic diagram in Figure 26.

47
which is circulated by a pump, while DX is used in the freezers. Com-pression at the high stage is done in a single phase. Similar systems have been discussed and investigated by Schiesaro and Kruse (2002).
Gas Cooler/Condenser
Pump
Internal Heat Exchanger
Fi gu r e 26 : A c e n t r a l i z e d s y s t em s o l u t i on w i t h s i n g l e s t a g e c omp r e s s i o n a t t h e h i g h s t a g e . S im i l a r s o l u t i o n c an b e f o und in S c h i e s a r o and Kru s e ( 2002) .
The parallel system seems to be more applicable mainly due to its simi-larity to conventional DX systems. The fact that there are two separate circuits makes it more convenient to shut down one circuit if failure oc-curs, while keeping the other circuit unaffected. An important practical difference between the two systems is the oil return mechanism; in the parallel system appropriate sizing of suction lines and evaporator pipes, in addition to an efficient oil separator, should secure a sufficient return of oil to the compressors. In the centralized system solution oil escaping from the oil separator will “dissolve” in the tank liquid or float on the surface, or partly dissolve and float, depending on the oil type and its miscibility characteristics in CO2. Therefore, an additional oil separation loop should be added to the system to remove oil from the tank and re-turn it to the high stage compressors, described in section 6.3.1.
4 . 3 . 2 C a l c u l a t i o n m o d e l The same models used for the components of the cascade system, dis-cussed in section 4.2.2, are applied to the trans-critical solution. Addi-tional components used in the trans-critical system are modelled as fol-lows:

48
4 . 3 . 2 . 1 I n t e r n a l h e a t e x c h a n g e r ( I H E )
The IHE is modelled using the effectiveness as the input variable, which is calculated as:
)TT()cm()TT()cm(
i,ci,hminp
i,co,ccp
−×⋅
−×⋅=
&
&ε 4-5
Where in this case minpcp )cm()cm( ⋅=⋅ && . The inlet conditions of the heat exchanger are used as the input parameters where the exit tempera-ture from the cold side is calculated. Using temperatures and pressures from the exit of the cold side of the IHE, the enthalpy is calculated and the enthalpy difference at the cold side is assumed to be the same as at the hot side; enthalpy and pressure are then used to calculate the tem-perature at the exit on the hot side. The assumed effectiveness value of the IHE used in the models is 50%
4 . 3 . 2 . 2 H e a t e x c h a n g e r s
The condenser/gas cooler and intercooler are simulated by assuming a 5K approach temperature difference at the inlet of the heat sink side. No sub-cooling is assumed in the condensers.
Change in air temperature in the condenser/gas cooler is small, around 5K, and the influence of the internal pinch point is not expected to be as strong as in the cases of hot water heat pump applications. Additionally, this assumption is applied to all the refrigerants used in this study so it should have little influence on the comparison results.
4 . 3 . 3 S y s t e m o p t i m i z a t i o n Pipe sizes in the low and medium temperature levels and the pump cir-culation ratio are the same as for the cascade system, following the selec-tion criteria outlined in section 4.2.3.
At high ambient temperatures and when the exit temperature of CO2 in the gas cooler gets higher than the critical temperature of CO2, then the operating pressure becomes independent of the gas cooler exit tempera-ture. As can be seen in Figure 27, different pressures can be selected for a gas cooler exit temperature of 40°C and it is clear from the plot that there is an optimum pressure needed to achieve the highest COP.

49
-400 -300 -200 -100 0101
102
3x10²
h [kJ/kg]P
[bar
]
40°C
0°C
CarbonDioxide
Fi gu r e 27 : CO 2 t r an s - c r i t i c a l c y c l e w i t h g a s c o o l e r ex i t t empe r a tu r e o f 40 ºC and d i f f e r e n t d i s c h a r g e p r e s s u r e s .
For different temperatures, the shape of the isotherm will change and this suggests that the optimum operating pressure will depend on the ambient temperature. Therefore, it is essential to find a correlation be-tween ambient temperature and discharge pressure in order to run the system under optimum conditions and obtain the highest COP.
4 . 3 . 3 . 1 O p t i m u m h i g h p r e s s u r e f o r t r a n s - c r i t i c a l m o d e
In order to obtain the optimum discharge pressure for each ambient temperature the plot in Figure 28 is generated whereby the discharge pressure is varied and the COP is plotted against the pressure at gas cooler exit temperature (related to ambient temperatures with a 5K ap-proach temperature difference). Isentropic efficiency of the compressor is calculated using Brown’s correlation (Brown et al., 2002) presented in equation 4-2. The optimum values for the high pressure were curve fit-ted as a function of the ambient temperature.

50
75 90 105 120 1350
0,5
1
1,5
2
2,5
T1=47,5 [°C]
T1=42,5 [°C]T1=42,5 [°C]T1=45 [°C]
T1=40 [°C]T1=40 [°C]T1=37,5 [°C]T1=37,5 [°C]
T1=32,5 [°C]T1=32,5 [°C]T1=35 [°C]T1=35 [°C]
T1=47,5 [°C]
T1=42,5 [°C]T1=42,5 [°C]T1=45 [°C]T1=45 [°C]
T1=47,5 [°C]
T1=42,5 [°C]T1=42,5 [°C]T1=45 [°C]T1=45 [°C]
Discharge pressure [bar]C
OP
[-]
T1=47,5 [°C]
T1=42,5 [°C]T1=42,5 [°C]T1=45 [°C]T1=45 [°C]
Optimum pressure formulaOptimum pressure formula
Fi gu r e 28 : COP o f CO 2 t ran s - c r i t i c a l c y c l e v s . d i s c ha r g e p r e s s u r e a t d i f f e r e n t ga s c o o l e r ex i t t emp e ra tu r e s ( d e no t e d T1) .
The approach temperature difference in the gas cooler was assumed to be a constant 5K for the whole range of ambient conditions in sub- and trans-critical operations. The approach was assumed to take place at the air inlet side. Chen and Gu (2005) used Brown’s et al. (2002) curve fit of the gas cooler exit temperature for different ambient conditions; as can be seen in the plot in Figure 29 the value of the approach temperature difference is around 5K which means that it is a reasonable approxima-tion. Kauf (1998) used a fixed value of 2.9K while Liao et al. (2000) used the gas cooler exit temperature, instead of the ambient temperature, as the input value for the optimum discharge pressure correlation.
28 30 32 34 36 38 4060
70
80
90
100
110
120
130
140
0
1
2
3
4
5
6
Tamb [°C]
Pop
t [ba
r]
Popt Ying
Popt KaufPopt Kauf
ΔT G
c,ap
p [K
]
ΔTgc;app BrownΔTgc;app Brown
Popt Curve fit, ΔTgc,app FormulaPopt Curve fit, ΔTgc,app FormulaPopt Curve fit, ΔTgc,app=5KPopt Curve fit, ΔTgc,app=5K
Popt LiaoPopt Liao
Fi gu r e 29 : Op t imum d i s c h a r g e p r e s s u r e and g a s c o o l e r a pp r oa c h t empe r a t u r e d i f f e r e n c e f o r a CO 2 t ran s - c r i t i c a l c y c l e a t d i f f e r e n t amb i e n t t empe r a t u r e s .
51
The evaporating temperature used in the calculations was -8ºC; accord-ing to Kauf (1998) and Chen and Gu (2005) the evaporating temperature has no significant influence on the optimum discharge pressure. How-ever, Liao et al. (2000) included the influence of evaporating temperature in the optimum discharge pressure correlation.
An important parameter which influences the optimum discharge pres-sure is the isentropic efficiency of the compressor. Chen and Gu (2005) used Brown’s et al. correlation (Brown et al., 2002) while Kauf (1998) and Liao et al. (2000) used their own curve fit of real compressors.
Curve fitting the optimum pressure values (in bars), developed in Figure 28 in relation to the ambient temperature, yields the following correla-tion, which has been used in the simulation model:
( ) 1672 .TT.P app,gcambopt −+×= Δ 4-6
Figure 29 is a comparison between different correlations, used to calcu-late the optimum discharge pressure. The line labelled “PoptCurve fit, ΔTgc,app Formula” is the curve fit developed from a similar plot in Figure 28 but using Brown’s et al. correlation (Brown et al., 2002) for the ap-proach temperature difference estimate instead of the constant 5K. In order to be able to compare Liao’s et al. correlation (Liao et al., 2000) to the other correlations, the gas cooler exit temperature was related to the ambient temperature by using a fixed 5K approach temperature differ-ence. As can be seen in the plot, except for Kauf’s (Kauf, 1998) which uses a lower approach temperature difference, the optimum pressure correlations are in good agreement and the lines only diverge slightly at high ambient temperatures, i.e. higher than 36ºC.
It is worth noting that most of the studies concerning optimum CO2 dis-charge pressure are performed in mobile air conditioning and heat pump applications. This implies that capacities and component sizes, for which the correlations have been generated, are much smaller than those for commercial applications. Nevertheless, the assumptions used to develop the correlation in equation 4-6 are relevant for supermarket applications and the compressor efficiencies do not seem unrealistic; they tend to be around 80% within the operation range.
4 . 3 . 3 . 2 O p t i m u m i n t e r m e d i a t e p r e s s u r e
When CO2 operates in the trans-critical region it loses COP compared to other refrigerants at the same temperature levels. A way to improve the COP, especially when high temperature lift is needed, is to introduce two-stage compression using an intercooler. In general, the optimum in-

52
termediate pressure depends on the shape of the isotherm at which the heat is rejected, the slope of the isentropic compression lines and the de-pendence of the isentropic efficiency on the pressure ratio. In the case of CO2, the high operating pressure results in relatively low pressure ratios, hence, the variations in the isentropic efficiency are small. Using Brown’s et al. correlation (Brown et al., 2002) the isentropic efficiency is 84% at a pressure ratio of 2 and 76% at a pressure ratio of 4.
Medium temperature level
For an evaporating temperature of -8ºC and different ambient tempera-tures, the COP is calculated at different intermediate pressures (pressures in between the two compressor stages) and plotted in Figure 30. The intercooler is assumed to reject heat directly to the ambient air with 5K of approach temperature difference at all ambient temperature levels. An IHE, which provides further cooling after the gas cooler/condenser and superheating after the evaporator, is used and its effectiveness is as-sumed to be 50%.
40 50 60 70 80 90 100 110 1201,5
2,5
3,5
4,5
5,5
6,5
7,5
Intermediate Pressure [bar]
Hig
h S
tage
CO
P [-
]
Tamb=10 [°C]Tamb=15 [°C]
Tamb=20 [°C]
Tamb=25 [°C]
Tamb=30 [°C]Tamb=35 [°C]Tamb=40 [°C]
Popt Curve FitPopt Square Root Formula
Fi gu r e 30 : COP o f h i g h s t a g e v s . i n t e rm ed ia t e p r e s s u r e ( p r e s s u r e b e tw e e n h i gh s t a g e c omp r e s s o r s t a g e s ) a t d i f f e r -e n t amb i e n t t empe r a t u r e s . IHE e f f e c t i v e n e s s i s 50% and e vap o ra t i n g t emp e r a t u r e i s - 8 ºC
The values of the optimum intermediate pressure for different ambient temperatures were curve fitted and the following correlation was ob-tained:
( ) ( ) 5335230010 2 .TT.TT.P app,erintambapp,erintambopt,erint ++×++×=
4-7

53
This equation is plotted in Figure 30 and labelled “Popt, Curve Fit” where it can be seen to pass very close to the optimum pressure at the selected ambient temperatures. The plot “Popt, Square Root Formula” uses the following expression to determine the intermediate pressure.
( ) 5012
.EqualPR PPP ×= 4-8
This formula results in equal pressure ratios in both compressors and is suggested as a good approximation of the optimum intermediate pres-sure (Granryd et al., 2005). As can be seen in Figure 30; the plot of equa-tion 4-8 falls below the optimum pressure.
Low temperature level
The same method has been used to obtain a correlation for the optimum intermediate pressure for an evaporating temperature of -37ºC; this ap-plies to the low temperature circuit in Figure 25. Figure 31 is a plot of the COP for different ambient temperatures and intermediate pressure values.
20 30 40 50 60 70 80 90 100 1100,5
1
1,5
2
2,5
Intermediate Pressure [bar]
CO
P [-
]
Tamb=10 [°C]Tamb=15 [°C]Tamb=15 [°C]Tamb=20 [°C]Tamb=20 [°C]
Tamb=25 [°C]Tamb=25 [°C]Tamb=30 [°C]Tamb=30 [°C]
Tamb=35 [°C]Tamb=35 [°C]Tamb=40 [°C]Tamb=40 [°C]
Popt, Curve FitPopt, Curve FitPopt, Med Temp Curve FitPopt, Med Temp Curve Fit
Fi gu r e 31 : COP v s . i n t e rmed i a t e p r e s s u r e ( p r e s s u r e b e -tw e e n c omp r e s s o r s t a g e s ) a t d i f f e r e n t amb i en t t empe r a -t u r e s . IHE e f f e c t i v e n e s s i s 50% and e v apo r a t i n g t em -p e r a t u r e i s - 37 ºC .
The line denoted “Popt, MedTempCurveFit” is the plot using the correla-tion in equation 4-7. As can be seen in the plot the correlation is not valid for freezing temperatures and a new correlation should therefore be used. The correlation in equation 4-9 is used and plotted in Figure 31,

54
labelled as “PoptCurve Fit”. The plot clearly shows that “PoptCurve Fit” curve fits with the optimum pressure values.
( ) ( ) 12146000080 2 .TT.TT.P app,erintambapp,erintambL,opt,erint ++×++×=
4-9
4 . 4 D X R 4 0 4 A
4 . 4 . 1 S y s t e m d e s c r i p t i o n Systems using R404A are referred to as conventional technologies where it is used as replacement for harmful synthetic refrigerants. The R404A system consists of two separate DX circuits; one is a single-stage circuit for the medium temperature level and the other is a two-stage compres-sion circuit, similar to that shown in the schematic diagram in Figure 25 except for the high pressure regulating valve used with CO2. Due to the steepness of the isentropic compression lines for R404A two-stage com-pression with inter-cooling has very little influence on improving the COP of the medium temperature level. Two-stage compression at the low temperature level may not be a conventional solution with R404A; however, it has been used in calculations to see what COP a good R404A system can produce.
4 . 4 . 2 C a l c u l a t i o n s m o d e l The temperature drop in the cabinets and distribution lines are taken to be equal to the values used in sizing the CO2 system. In practice this will require larger components when using R404A or higher tempera-ture/pressure drops for components of the same size. An equal tempera-ture drop is assumed and used as a reasonable approximation so that de-tailed sizing and calculation of the pressure and temperature drops for the R404A system will not be needed in the model.
The isentropic efficiency of the R404A compressors in the model was assumed to be 80% and an IHE with 50% effectiveness is used in both low and medium temperature level circuits.
For the display cabinets the same models and temperature assumptions were used, as in the case of CO2, except for the superheat value which was chosen to be 7 instead of the 9K used for the CO2 cabinets. In order to achieve temperature drops comparable to the values obtained for the CO2 cabinets, the cooling capacity of the single cabinet was reduced and the size of the pipe in the cabinet’s coil was increased. This will result in a higher number of cabinets in the system.

55
4 . 5 C o n c l u s i o n s Detailed computer models have been developed to simulate the per-formance of supermarket refrigeration systems which use R404A, NH3 or propane/CO2 indirect, NH3/CO2 cascade, trans-critical, and DX R404A. Two possible solutions for the trans-critical system, parallel and centralized, have been defined. All systems were designed for capacities and operating temperatures which fulfil the requirements of a medium size supermarket in Sweden.
For the case of CO2 systems, distribution lines have been sized in order to fit the capacities so that the influence of pressure and temperature drops will be properly evaluated. The calculated pressure and tempera-ture drops for CO2 are much lower than for R404A; thus, CO2 systems require much smaller distribution lines. Systems’ components have been modelled based on correlations and figures from the literature as well as experimental data. In the trans-critical system, formulas to calculate the optimum discharge and intermediate pressures were developed.
Two-stage compression at the low temperature level was assumed for the R404A system, which is not a conventional solution. The pressure drop in distribution lines and the approach temperature differences in condensers were assumed to be similar to those of CO2 systems, more-over the superheat value in the DX evaporators was 2K lower. All of these assumptions are in favour of the R404A system and will result in a high calculated COP.

56
5 Simulation calculations and results
Running the simulation models of the systems presented in the previous chapter, provides information about their efficiency and energy con-sumption. A detailed analysis of the different systems is presented in the following sections.
5 . 1 T r a n s - c r i t i c a l C O 2 s y s t e m s o l u t i o n s In a CO2 only system, a high heat rejection temperature means that it will operate in the trans-critical region with a relatively low COP. Key operat-ing parameter for a CO2 trans-critical system is to allow the head pres-sure to float, matching changes in ambient temperature. As a result, the COP for the CO2 system will improve and may become higher than conventional systems, even if they would operate with a floating head. Therefore, the COP calculations for each system are made for different ambient conditions.
5 . 1 . 1 P a r a l l e l s y s t e m The performance of the parallel system is evaluated by calculating the COP of the low and medium temperature circuits. The reference case, denoted as “Ref” in the plot, is defined as having two-stage compression at the low temperature level and single stage compression for the me-dium temperature circuit, as shown in the system in Figure 25. The COP is calculated for different ambient conditions and plotted in Figure 32.

57
10 15 20 25 30 35 400
1
2
3
4
5
6
7
8
Ambient temperature [°C]
CO
P [-
]
Single-Stage LowTwo-Stage Low (Ref)
Single-Stage Med (Ref)Two-Stage Med
Fi gu r e 32 : COPs o f tw o - and s i n g l e - s t a g e c omp r e s s i o n a r r an g emen t s f o r med i um and l ow t emp e ra tu r e c i r c u i t s i n t h e p a ra l l e l CO 2 s y s t em .
The improvement of COP when two-stage compression is used in both stages compared to single stage compression can be seen in the plot; along the calculated temperature range the improvement of the medium stage COP varies between 9-27%. The improvement in this stage of the circuit is important since the load is usually higher at the medium tem-perature level; therefore, energy consumption savings will be more prominent.
Two-stage compression at the low temperature level will result in signifi-cant improvements in the COP. COP values are calculated to be 22-72% higher over the selected ambient temperature range than for single stage compression. In both medium and low temperature cases the COP im-provement is greater given high ambient conditions.
The total COP of the system is the ratio between total cooling capacity and total energy consumption. Total COP values are plotted in Figure 33 for different solutions in the parallel system arrangement.

58
10 15 20 25 30 35 400
1
2
3
4
5
Ambient temperature [°C]
CO
P [-
]
Two-Low, Single-Med (Ref)Two-Low, Two-Med
Single-Low, Single-MedSingle-Low, Two-Med
Fi gu r e 33 : To t a l COPs f o r t h e d i f f e r e n t pa r a l l e l CO 2 s y s t em va r i a t i on s .
When two-stage compression is used in both circuits the total COP be-comes 4-16% higher than the reference case and 15-45% higher than in the case of single stage compression in both circuits.
5 . 1 . 2 C e n t r a l i z e d s y s t e m The calculation of COP for the centralized system solution is carried out in the same way as for the parallel arrangement. The pump power used by the medium temperature circuit is included in the system’s energy consumption, which is usually very small compared to the total energy consumption; in this case 740W was calculated as the energy required to run the pump at a circulation ratio of 2.
The reference centralized system, denoted by “Ref” in the following plot, is defined as having single-stage compression in the high stage, as per the system in Figure 26.
In Figure 34, the total COP is plotted for the reference centralized sys-tem solution, which reveals a 4-21% higher COP compared to the refer-ence parallel system. The improved parallel system solution with two-stage compression in both circuits gets close to the reference centralized system solution and at ambient temperatures higher than 30ºC it gives up to a 6% higher COP.
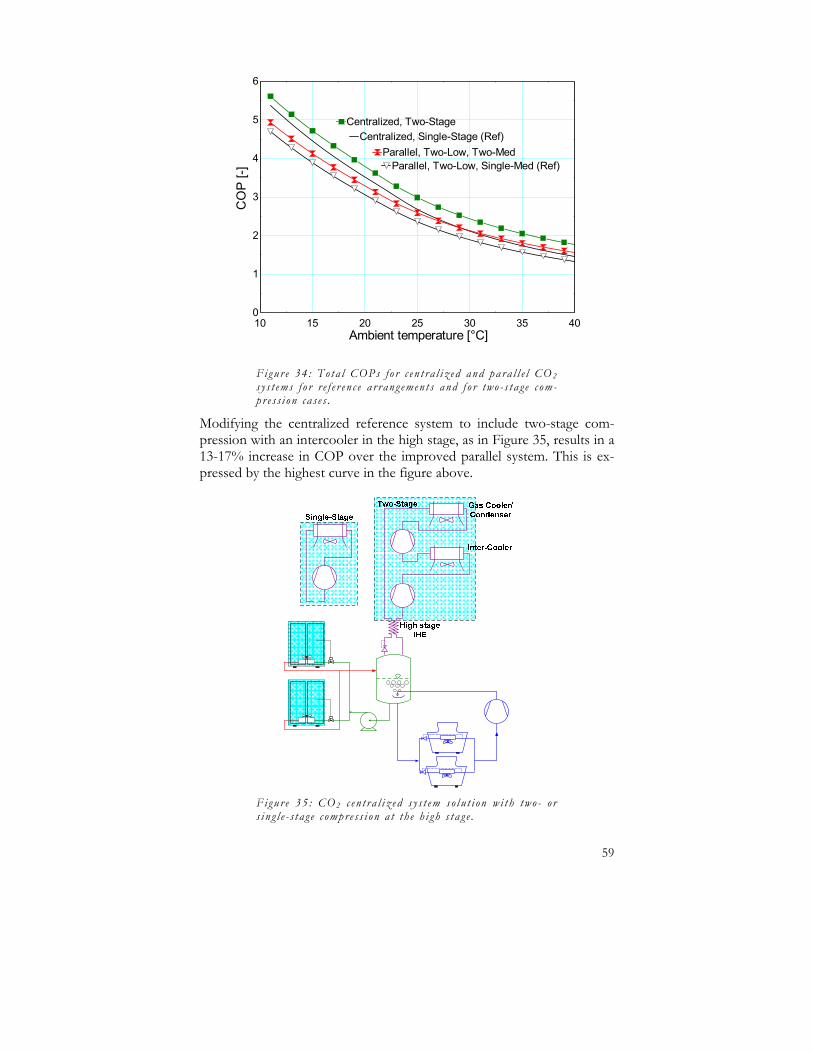
59
10 15 20 25 30 35 400
1
2
3
4
5
6
Ambient temperature [°C]
CO
P [-
]
Centralized, Single-Stage (Ref)Centralized, Two-Stage
Parallel, Two-Low, Single-Med (Ref)Parallel, Two-Low, Two-Med
Fi gu r e 34 : To t a l COPs f o r c e n t r a l i z ed and pa r a l l e l CO 2 s y s t em s f o r r e f e r e n c e a r r an g emen t s and f o r two - s t a g e c om -p r e s s i on c a s e s .
Modifying the centralized reference system to include two-stage com-pression with an intercooler in the high stage, as in Figure 35, results in a 13-17% increase in COP over the improved parallel system. This is ex-pressed by the highest curve in the figure above.
F i g u r e 35 : CO 2 c en t r a l i z e d s y s t em s o l u t i on w i t h two - o r s i n g l e - s t a g e c omp r e s s i o n a t t h e h i g h s t a g e .

60
The COP values generated at low ambient temperatures in floating con-densing and for the two stage compression cases are based on the as-sumption that the compressor operates with isentropic efficiency accord-ing to Brown’s et al. correlation (Brown et al., 2002) for pressure ratios down to 1.2. The pressure ratio in the simulations ranged from 1.7 to 3.7 in the case of single-stage centralized systems and from 1.2 to 2.2 in the case of two-stage centralized systems.
5 . 1 . 3 M o d i f i e d c e n t r a l i z e d s y s t e m According to the analysis of the models presented in the preceding sec-tion, the centralized system concept is a better solution than the parallel one, whereas the two-stage centralized system produces the highest COP of all. In order to obtain the best performance from the two-stage cen-tralized system, a proper evaluation of the influence of some of the components on its performance should be carried out, thus enabling op-timization of the system. The components and parameters investigated are:
5 . 1 . 3 . 1 H i g h s t a g e I H E
The high stage IHE can be seen in Figure 35. The value for IHE effec-tiveness used in the reference system is 50%, at which value the opti-mum intermediate pressure correlation was generated. As can be seen in the following figure, the influence of IHE effectiveness on the optimum discharge pressure is small; at an ambient temperature of 30°C with 100% effectiveness the value for the optimum pressure is just 2% less than with 10% IHE effectiveness and the high stage COP is only about 3% higher. What is referred to as the high stage COP here is the ratio between the cooling capacity provided by the high stage compressor in the reference system and its power consumption. The improvement is greater at high ambient temperatures; this can be seen in the figure where at an ambient temperature of 40°C a 5% reduction in the optimum pres-sure value is observed and this will result in a 9% increase in high stage COP. One more advantage that can be observed in the plot is that the optimum COP dome becomes flatter with an IHE, and this will make the system’s performance less sensitive to the control of the optimum discharge pressure, especially at high ambient temperatures.

61
75 80 85 90 95 100 105 110 115 1200,75
1,15
1,55
1,95
2,35
2,75
Discharge Pressure [bar]
Hig
h st
age
CO
P [-
]
Tamb=30°C, ε=10%Tamb=30°C, ε=50%Tamb=30°C, ε=100%
Tamb=40°C, ε=100%Tamb=40°C, ε=50%Tamb=40°C, ε=10%
Tamb=35°C, ε=100%Tamb=35°C, ε=10%
Fi gu r e 36 : H igh s t a g e COP a t d i f f e r e n t d i s c h a r g e p r e s -s u r e s and amb i e n t t emp e ra t u r e s f o r a CO 2 t r an s - c r i t i c a l c y c l e w i t h d i f f e r e n t IHE e f f e c t i v e n e s s v a l u e s .
IHE effectiveness will also affect the optimum intermediate pressure (the pressure between high stage compressor stages) and the resulting COP. With an efficient IHE the volumetric refrigerating cooling effect will increase and the start of the compression process will move to the area of greater superheat where the isentropic compression lines become flatter. Thus, not only the volumetric refrigerating effect but also the re-sulting enthalpy difference across the compressor will be higher for the same pressure ratio. As can be seen in Figure 37, with higher superheat, i.e. higher IHE efficiency, the optimum intermediate pressure value will be reduced. This is due to the fact that the isentropic compression lines are steeper at lower superheat values which means that it will be more ef-ficient to reject the heat at lower intermediate pressure. In this case with higher IHE efficiency, higher pressure ratio compression will take place in the second stage of the compressor, thereby moving a larger part of the compression to the left in the P-h diagram where the isentropic compression lines are steeper.

62
35 40 45 50 55 60 65 70 75 80 85 90
2
2,5
3
3,5
4
4,5
Intermediate Pressure [bar]
Hig
h S
tage
CO
P [-
] Tamb=20 [°C], ε=50%
Tamb=30 [°C], ε=50% Tamb=30 [°C], ε=10%
Tamb=30 [°C], ε=100%
Tamb=20 [°C], ε=10%
Tamb=20 [°C], ε=100%
Fi gu r e 37 : Hi gh s t a g e COP a t d i f f e r e n t i n t e rmed ia t e p r e s s u r e s ( p r e s su r e b e tw e e n h i gh s t a g e c omp r e s s o r s t a g e s ) , IHE e f f e c t i v e n e s s v a l u e s , a nd amb i e n t t empe r a tu r e s . Evapo ra t i n g t empe r a t u r e i s - 9 ºC .
With the intercooler exit temperature assumed to be constant, then the inlet temperature of the intercooler at the intermediate pressure level will be higher given a highly efficient IHE; this will result in more heat being rejected at the intermediate pressure level which in turn reduces the power demand on the high stage compressor. As a result of the reduced compressor work needed with high IHE effectiveness the COP of the system will be improved and this is what can be observed in the figure above. At an ambient temperature of 20ºC an IHE which is 100% effi-cient will improve the COP of the high stage by about 4% compared to the 50% IHE. At 30°C ambient the improvement will be about 6%.
5 . 1 . 3 . 2 L o w s t a g e I H E
A centralized system solution with a low stage IHE is shown in Figure 38. Using the IHE at the low stage with 100% effectiveness and a low stage compressor with isentropic efficiency of about 80% will result in discharge gas temperature of about 75°C, which is acceptable for good lubricant performance. The rate of increase in low stage compressor power due to the flattening isentropic compression lines with greater su-perheat values will be slightly higher than the increase in the cooling ca-pacity of freezing cabinets; this will result in a lowering of the COP of the low stage. Using an IHE with 100% effectiveness will degrade the low stage COP by 3% compared to a system without an IHE.

63
Fi gu r e 38 : CO 2 c e n t r a l i z e d s y s t em s o l u t i on w i t h a l ow s t a g e IHE.
As a result of an assumed load ratio of 3, the low stage IHE will have a very small influence, of about 0.5%, on the total COP of the two-stage centralized system at an ambient temperature of 30°C. This can be seen in the “No De-superheat” line in Figure 40.
The use of IHEs in supermarket applications is usually preferred, provid-ing sub-cooling in the liquid supply line to the cabinets in order to pre-vent evaporation of the refrigerant as a result of the pressure drop. For CO2 the pressure drop is much smaller than for other refrigerants, using the same tube diameter, which indicates that only a small IHE would be needed to provide a few degrees of sub-cooling.
5 . 1 . 3 . 3 L o w s t a g e d e - s u p e r h e a t b y a m b i e n t
In order to reach a product temperature of +3°C at the medium tem-perature level the evaporation temperature should be about -3°C. For a frozen product temperature of -18°C an evaporation temperature of about -34°C must be maintained. When the low stage compressor oper-ates between -34 and -3°C, the discharge temperature will be about 50°C when a low stage IHE is not used and the superheat in the evaporator is 9K. If the effectiveness of the IHE is 50%, then the discharge tempera-ture is about 60°C. As ambient temperatures are normally much lower there is the potential for removing heat from the low stage directly to the environment, so the cooling capacity on the high stage will be reduced and consequently the compressor power will be lowered. This heat re-moval to the environment at the medium pressure level is referred to in

64
this study as free de-superheating and the heat exchanger is denoted a de-superheater. A centralized system with a de-superheater is shown in the following figure.
Fi gu r e 39 : CO 2 c e n t r a l i z e d s y s t em s o l u t i o n w i t h l ow s t a g e IHE and d e - s up e r h ea t e r .
Figure 40 is a plot of the influence of the effectiveness of the IHE on the total COP of the two-stage centralized system both with and without a de-superheater. The improved COP with higher IHE effectiveness is due to the fact that the low stage discharge temperature gets higher and more heat can be removed from the hot gas.
0,1 0,2 0,3 0,4 0,5 0,6 0,7 0,8 0,9 12,42
2,43
2,44
2,45
2,46
2,47
2,48
2,49
2,5
IHE Effectiveness [-]
CO
Pto
t [-]
De-Superheating
No De-Superheating
Fi gu r e 40 : I n f l u e n c e o f t h e IHE and t h e f r e e d e -s u p e r h ea t o n t h e t o t a l COP. Amb i e n t t emp e r a t u r e i s 30 ºC .

65
For a low stage IHE with 50% effectiveness and de-superheating, a 2% improvement on the total COP can be achieved; this can be seen in the following figure which represents the percentage improvements in total COP with de-superheater for different IHE effectiveness at different ambient temperatures.
0,1 0,2 0,3 0,4 0,5 0,6 0,7 0,8 0,9 10
0,5
1
1,5
2
2,5
3
3,5
4
IHE Effectiveness [-]
Impr
ovem
ent o
n C
OP
tot [
%]
Tamb=30°CTamb=20°CTamb=10°C
Tamb=40°C
Tamb=30°C, LR=2
Fi gu r e 41 : I n f l u e n c e o f f r e e d e - s up e r h e a t i n g on imp r o v i n g t h e t o t a l COP f o r d i f f e r e n t v a l u e s o f e f f e c t i v e n e s s f o r t h e l ow s t a g e IHE a t d i f f e r e n t amb i e n t t empe r a t u r e s .
It is obvious that the amount of heat that can be rejected from the de-superheater is dependent on the heat sink temperature; at low ambient temperatures more heat can be removed to the environment due to a lower de-superheater exit temperature. As can be seen in the figure, the improvement in total COP at an ambient temperature of 10°C will be about 2.7% compared to 2% at 30°C.
For cases with load ratios lower than 3, which are used in the reference and the two-stage centralized systems, the influence on the total COP will be greater. This is due to the higher heat load that can be rejected to the environment at the medium pressure level; the plot in the figure above clearly indicates the improvement due to de-superheating for one case with a load ratio of 2 at an ambient temperature of 30°C, where the total load is kept the same.
5 . 1 . 3 . 4 D X e v a p o r a t o r s u p e r h e a t
The superheat value used in the reference and two-stage centralized sys-tems was 9K which is based on experimental data for NH3/CO2 cascade

66
systems (Sawalha et al., 2006). The freezers that are used in the experi-mental cascade system are not specially optimized for CO2; they have a long single coil with a large diameter. This has been chosen in the ex-perimental rig in order to evaluate the performance of CO2 in conven-tional display cabinets. If the cabinet were to be specially designed for CO2 it would be with smaller and shorter pipes, which would mean that it will be possible to operate the system with a lower superheat value with good stability. The low pressure drop of CO2 would permit the use of smaller pipes in the heat exchanger compared to cabinets for other re-frigerants. If the superheat value is reduced to 7K then the low stage COP will increase by 8% which accounts for about a 1.3% improvement in the total COP. The main reason for this improvement in the COP is the increase in the evaporating temperature due to shifting the minimum approach temperature difference to the air exit side of the evaporator.
As can be seen in Figure 42, the influence of the superheat value will be higher at lower ambient temperatures; this is due to the fact that the work of the low stage compressor at low ambient temperatures will ac-count for a larger share of the total power consumption.
10 15 20 25 30 35 401,5
2
2,5
3
3,5
4
4,5
5
5,5
6
Ambient temperature [°C]
CO
Pto
t [-]
DX,SH=7°CDX,SH=9°C
Flooded Evap
Fi gu r e 42 : To t a l COP a t d i f f e r e n t amb i e n t t empe r a tu r e w i t h 7 and 9K DX f r e e z e r s up e r h ea t and f l o o d ed e v ap o -r a t o r .
5 . 1 . 3 . 5 F l o o d e d f r e e z i n g c a b i n e t s
A solution that may improve the COP of the system is to use a low pres-sure receiver and pump the refrigerant into the freezers in the same way

67
as is used in the medium temperature cabinets. In the case of the flooded evaporator freezing cabinet, the superheat value is zero and the approach temperature difference is assumed to be similar to that of medium tem-perature cabinets and equals 2K; this assumption is due to the improved heat transfer conditions on the refrigerant side. The lowest temperature approach will be on the air exit side of the heat exchanger; therefore, the temperature profile in the heat exchanger can be presented by the sketch in the following figure. The warmest product temperature is 2.5K higher than the air inlet temperature and the air temperature difference across the heat exchanger is 7.5K; these assumptions are similar to the values used for the DX freezer calculations.
ΔTair
ΔTapp
L (m)
Tproduct
Fi gu r e 43 : T empe r a t u r e p r o f i l e i n t h e f r e e z e r ’ s f l o od ed e v ap o ra t o r .
In this case, with no superheat in the evaporator and a smaller approach temperature difference, it is clear, by looking at the temperature profile in the figure, that the evaporating temperature needed to provide the re-quired product temperature will be higher than in the case of DX . The evaporating temperature increase due to pump pressure is also taken into account in calculating the product and evaporating temperatures. The pump power needed for a circulation ratio of 2 is included in the total power consumption calculations. Using flooded freezers improved the total system COP, especially at low ambient temperatures, as can be seen in Figure 42. .
5 . 1 . 3 . 6 M o d i f i c a t i o n s s u m m a r y
Based on the results of the parametric analysis presented in the preced-ing sections, it will be possible to evaluate the performance with different system variations; thus the combination of variations which will give the best centralized system performance can be concluded. The COP is compared to that of the two-stage centralized system solution, discussed
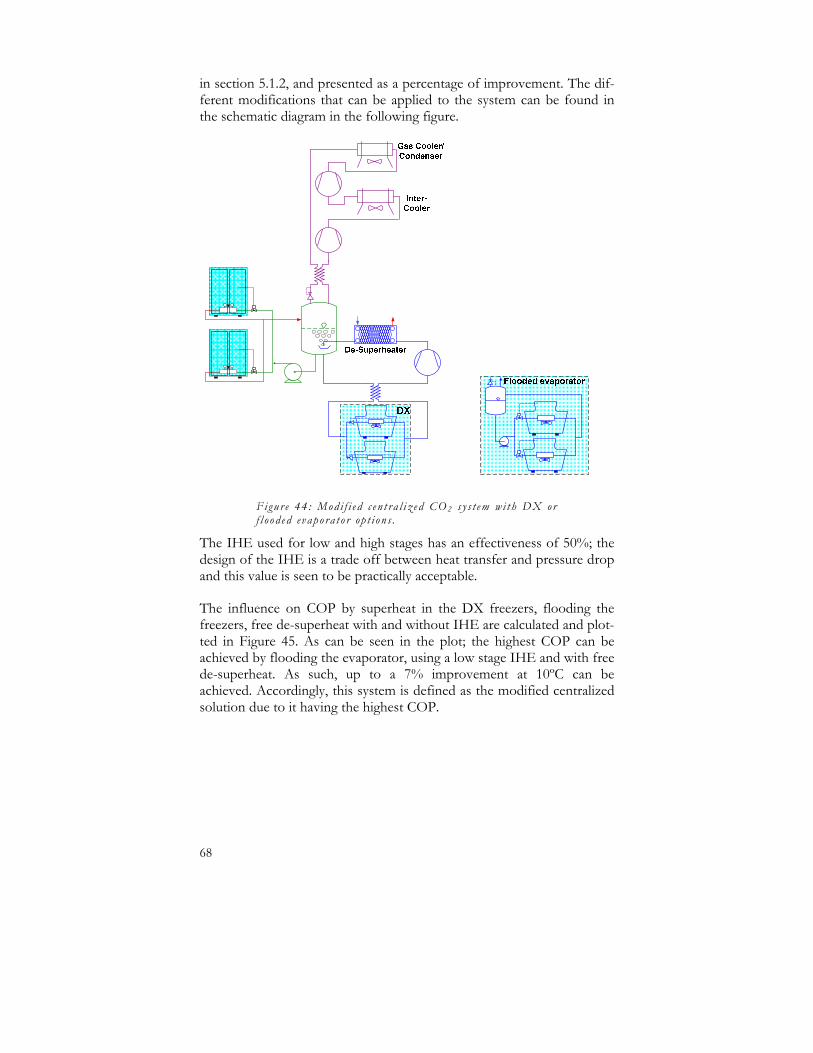
68
in section 5.1.2, and presented as a percentage of improvement. The dif-ferent modifications that can be applied to the system can be found in the schematic diagram in the following figure.
Fi gu r e 44 : Mod i f i e d c e n t r a l i z e d CO 2 s y s t em w i t h DX o r f l o o d e d e v ap o ra t o r op t i o n s .
The IHE used for low and high stages has an effectiveness of 50%; the design of the IHE is a trade off between heat transfer and pressure drop and this value is seen to be practically acceptable.
The influence on COP by superheat in the DX freezers, flooding the freezers, free de-superheat with and without IHE are calculated and plot-ted in Figure 45. As can be seen in the plot; the highest COP can be achieved by flooding the evaporator, using a low stage IHE and with free de-superheat. As such, up to a 7% improvement at 10ºC can be achieved. Accordingly, this system is defined as the modified centralized solution due to it having the highest COP.

69
0
1
2
3
4
5
6
7
8
11 12 13 14 15 16 17 18 19 20 21 22 23 24 25 26 27 28 29 30 31 32 33 34 35 36 37 38 39 40
Ambient temperature [ºC]
CO
P Im
prov
emen
t [%
]
Flooded,De-Superheat,IHE (Modified)
Flooded,De-Superheat
DX, SH=7ºC, De-Superheat, IHE
Flooded
DX, SH=7ºC, IHE
Fi gu r e 45 : To t a l r e l a t i v e COP imp r ov emen t f o r d i f f e r e n t c e n t r a l i z e d s y s t em va r i a t i on s c ompa r e d t o t h e tw o - s t a g e c e n t ra l i z e d s y s t em s o l u t i on a t d i f f e r e n t amb i en t t empe r a -t u r e s .
The flooded evaporator solution implies that a low pressure receiver and pump should be used, which will add to the installation cost compared to the DX solution. In this case the pump will provide head before the distribution lines which should be sufficient to avoid flashing gas in the liquid line, and since solenoid valves will be used to control the flow in the evaporators, instead of an expansion valve, then it will be of little importance to strive to avoid flashing gas in the liquid line. Conse-quently, the sole reason for using the IHE will be to create a higher compressor discharge temperature so that more heat can be rejected out into the environment. A flooded system with de-superheater and without IHE will produce an improvement in COP compared to a flooded evaporator without de-superheating and IHE at ambient temperatures below 25ºC. Above this value the ambient temperature will be very close to or higher than the compressor discharge temperature and therefore no heat will be removed.
A DX system with an IHE and free de-superheating results in a higher COP than the flooded evaporator without de-superheating; this can be observed for ambient temperatures lower than 37°C. The improvements range from between 2 to about 6% over the whole series of tempera-tures, compared to the two-stage centralized system. The presence of the IHE is essential with relatively long distribution lines and DX freezers; therefore, the additional component in this solution is the de-superheater

70
which will make this concept more favourable from a installation point of view.
5 . 2 C o m p a r i s o n s
5 . 2 . 1 T r a n s - c r i t i c a l , c a s c a d e , a n d D X R 4 0 4 A Using the models described in chapter 4 and based on the input values and calculations presented in the early sections of this chapter, the COPs of the different trans-critical, cascade and DX R404A systems are calcu-lated. Thereafter, the annual energy consumption of selected systems is calculated for three different climates; moderate European, hot and cold.
5 . 2 . 1 . 1 T o t a l C O P c a l c u l a t i o n s
COPs have been calculated for the two-stage centralized system solution (section 5.1.2), modified centralized (section 5.1.3.6), and the three alter-native system solutions (NH3/CO2 cascade, DX 404A, and two-stage CO2 parallel). A superheat value of 7K was assumed for all DX cases. Figure 46 is a plot of the total COP of each system at different ambient temperatures. As can be seen in the plot, different systems are better at different temperature ranges; except for the parallel system solution which has the lowest COP at all calculated temperatures.
Fi gu r e 46 : To t a l COP o f d i f f e r e n t s y s t em s o l u t i o n s f o r amb i e n t t empe ra t u r e s b e tw e en 10 and 40°C.

71
All of the simulated trans-critical CO2 systems show lower COPs than the other compared systems when the ambient temperature forces the operation into the trans-critical region or close to the critical tempera-ture. This can be seen in the figure above for ambient temperatures higher than 23°C. The cascade system shows a higher COP than the R404A system for the calculated range of ambient temperatures. For ambient temperatures lower than 23°C the centralized system solutions reveal higher COPs than the R404A and for temperatures lower than 16°C the modified centralized solution shows the highest COP among all of the systems analyzed.
It must be pointed out that the modifications which were applied to the centralized system can also be implemented on the cascade system whereby its COP could be further improved.
In conventional refrigeration systems the condensing temperature can usually be estimated to be constant, at about 40°C all year round, an as-sumption which is supported by data in Arias (2005). If the R404A sys-tem could be kept in this condition then all the solutions with floating condensing would produce higher COPs at ambient temperatures lower than 27°C. With a fixed head pressure the cascade system is the only one that has a higher COP than the R404A system.
5 . 2 . 1 . 2 A n n u a l e n e r g y c o n s u m p t i o n
Since performance differences between the systems under investigation vary over the ambient temperature range, then differences in annual en-ergy consumption will depend on the climate in which the system will operate.
Three different climatic examples were selected. The first is a typical European climate represented by the climate of Frankfurt/Germany. This city was also selected by Wertenbach and Caeser (1998) for their analysis of mobile air conditioning applications. A hot climate in the USA is represented by Phoenix-Arizona/USA. Stockholm/Sweden is the third example, selected as being representative of a cold climate.
Ambient temperatures and their variation over the year were generated using Meteonorm (Remund, Lang, & Kunz, 2001) for every hour of the year. As can be seen in Figure 47 the temperature in Stockholm and Frankfurt under 10°C for more than 50% of the time. In Phoenix the temperature levels tend to be higher; the temperature is above 30°C for the greatest number of hours compared to the other temperature ranges.

72
5478
1532
1227
483
41 0
4571
1794
1438
773
1787
883
1375 1400 1399 1370
2334
0
1000
2000
3000
4000
5000
6000
<10 10-15 15-20 20-25 25-30 >30
Tamb [°C]
Num
ber o
f Hou
rs [-
]
StockholmFrankfurtPhoenix
Fi gu r e 47 : Numbe r o f h ou r s p e r y e a r f o r d i f f e r e n t amb i -e n t t empe r a t u r e l e v e l s i n S t o ckho lm/Swed en , F rank -f u r t/Ge rmany , and Pho en ix -Ar i z ona/USA.
A CO2 trans-critical system in Stockholm or Frankfurt will operate sub-critically for most of the time while in Phoenix the system will operate in the trans-critical region for about 40% of the time.
Using ambient temperatures from Meteonorm for the selected cities as input variables in the simulation model the annual energy consumption for each system in Figure 46 is calculated. An additional system is added to the comparison, which is a single-stage centralized system solution. It is added to the group of systems analyzed because in practical terms it may be more applicable than the two-stage centralized system solutions.
When the ambient temperature is lower than 10°C then the model uses 10°C (15°C condensing/gas cooler exit temperature) as the input vari-able, which is chosen as a limit for floating condensation. It is important to note that the heat sink temperature supplied to the condenser/gas cooler and the intercooler should be the same, otherwise, if the inter-cooler had a lower heat sink temperature, the refrigerant may condense at the inlet of the high stage compressor. When controlling the heat sink temperature is necessary it will be difficult to achieve this with an air cooler; therefore, a water/brine loop may be needed to reject the heat. This will make the temperature difference between the refrigerant and ambient temperature higher than the assumed 5K.

73
Figure 48 represents annual energy consumption for the different sys-tems under investigation for the three selected cities. As can be seen in the figure, the two-stage parallel system solution has the highest energy consumption among the examined solutions in all three selected cli-mates, and the increase over the other systems’ energy consumption rises in hotter climates.
369399
335362
341 329356
380
326343
324 313
538
646
441
617583
542
0
100
200
300
400
500
600
700
R404A Float 2-St. Prallel NH3/CO2Cascade
1-St. DX-Centralized
2-St. DX-Centralized
ModifiedCentralized
Ann
ual E
nerg
y C
onsu
mpt
ion
[MW
h]FrankfurtStockholmPhoenix
Fi gu r e 48 : Annua l e n e r g y c on sump t i o n f o r d i f f e r e n t s u -p e rma rke t s y s t em s i n S t o ckho lm/Swed en , F rank -f u r t/Ge rmany , and Pho en ix -Ar i z ona/USA.
The values presented in Figure 48 can be related to each other in per-centages. This is detailed in Table 1 where the systems in rows are related to the ones in columns as a percentage. In the table, the values for the hottest and coldest examples are chosen for the comparison. In the case of Swedish/Stockholm weather conditions the modified centralized sys-tem solution has the lowest energy consumption over the year, 12% less than R404A and 4% less than NH3/CO2 cascade, followed by the refer-ence centralized system solution and NH3/CO2 cascade. All of the CO2 systems investigated, except the parallel solution, consume less energy over the year compared to R404A. This is also the result in the case of Frankfurt, which can be observed in Figure 48. The modified centralized system also has the lowest energy consumption and consumes 2% less energy compared to the NH3/CO2 cascade.

74
Tab l e 1 : P e r c e n t a g e d i f f e r e n c e i n annua l e n e r g y c o n s ump -t i o n d i f f e r e n c e s b e tw e e n t h e d i f f e r e n t s o l u t i o n s . A 5K t empe r a tu r e d i f f e r e n c e i s a s s umed b e tw e en t h e c o n -d e n s e r/ ga s c o o l e r ex i t and t h e h e a t s i nk . S y s t ems i n r ow s a r e r e l a t e d t o t h e on e s i n c o l umn s .
In the case of a hot climate, the NH3/CO2 cascade system has the lowest annual energy consumption; 18% lower than for the R404A. The modi-fied centralized system has an energy consumption which is almost the same as that of the R404A. Looking at the three centralized system solu-tions, it is clear that the modifications to the system are more important at high ambient temperatures where the percentage improvement is higher and the reduction in annual energy consumption is also high.
As can be seen in Figure 46, it is clear that differences in energetic per-formance, COP, between the systems depend on the ambi-ent/condensing (or gas cooler exit) temperature. In the calculations above, the difference between the condensing/gas cooler exit tempera-ture and the heat sink, air in this case, is assumed to be 5K. If a brine/water loop is used to transfer heat from the condenser/gas cooler to the environment then an additional temperature difference will exist and this will affect the annual energy consumption figures presented above.
With all the systems having a water/brine loop on the condenser/gas cooler side an additional 5K temperature difference is assumed between the heat transfer fluid and the ambient. Accordingly, the temperature dif-ference between the condenser/gas cooler exit and the ambient becomes 10°C. The temperature limit for floating condensing is kept the same as in the calculations above; 15°C of condensing or at the gas cooler exit.
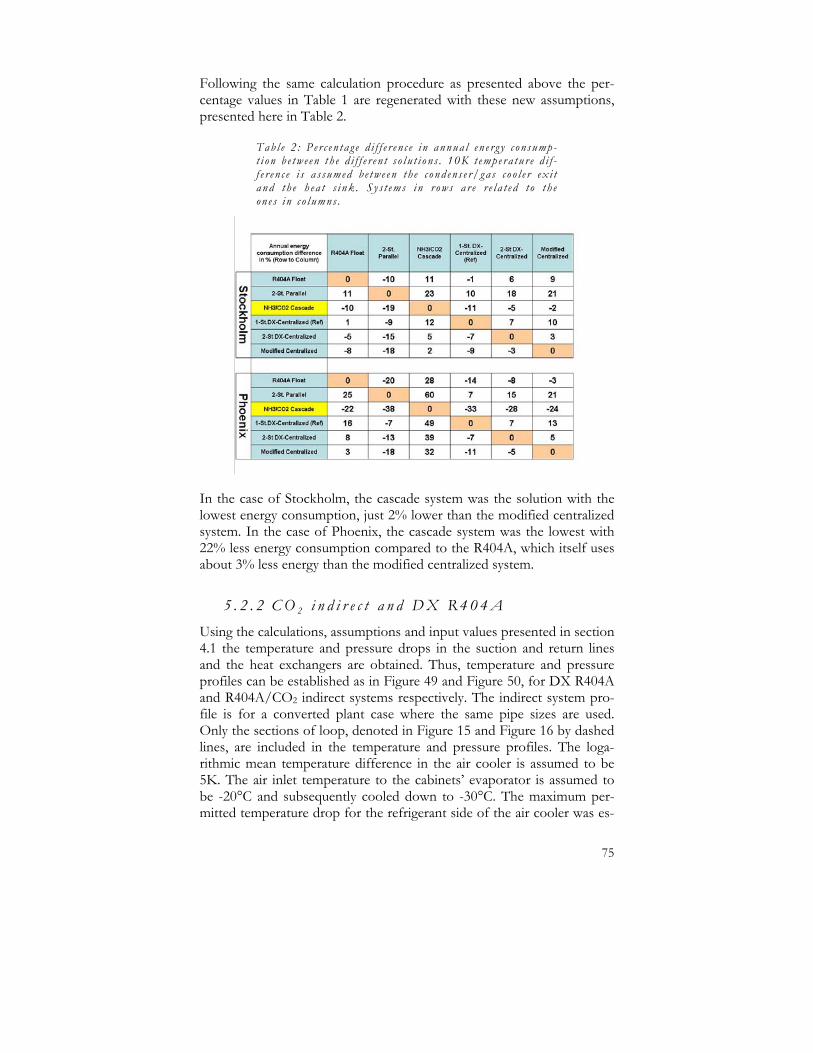
75
Following the same calculation procedure as presented above the per-centage values in Table 1 are regenerated with these new assumptions, presented here in Table 2.
Tab l e 2 : P e r c e n t a g e d i f f e r e n c e i n annua l e n e r g y c o n s ump -t i o n b e tw e e n t h e d i f f e r e n t s o l u t i o n s . 10K t emp e r a t u r e d i f -f e r e n c e i s a s s umed b e tw e e n t h e c o nd en s e r/ ga s c o o l e r ex i t and t h e h ea t s i nk . Sy s t ems in r ow s a r e r e l a t e d t o t h e on e s i n c o l umns .
In the case of Stockholm, the cascade system was the solution with the lowest energy consumption, just 2% lower than the modified centralized system. In the case of Phoenix, the cascade system was the lowest with 22% less energy consumption compared to the R404A, which itself uses about 3% less energy than the modified centralized system.
5 . 2 . 2 C O 2 i n d i r e c t a n d D X R 4 0 4 A Using the calculations, assumptions and input values presented in section 4.1 the temperature and pressure drops in the suction and return lines and the heat exchangers are obtained. Thus, temperature and pressure profiles can be established as in Figure 49 and Figure 50, for DX R404A and R404A/CO2 indirect systems respectively. The indirect system pro-file is for a converted plant case where the same pipe sizes are used. Only the sections of loop, denoted in Figure 15 and Figure 16 by dashed lines, are included in the temperature and pressure profiles. The loga-rithmic mean temperature difference in the air cooler is assumed to be 5K. The air inlet temperature to the cabinets’ evaporator is assumed to be -20°C and subsequently cooled down to -30°C. The maximum per-mitted temperature drop for the refrigerant side of the air cooler was es-

76
timated to be 1°C (Downing, 1988). In order to ensure the proper su-perheat of the primary refrigerant, the minimum approach temperature difference in the CO2 condenser (R404A evaporator) was estimated to be 2K. For simplicity, the temperature and pressure drops for the CO2 condenser were assumed to be identical to the values in the CO2 evapo-rator.
Fi gu r e 49 : Tempe ra t u r e and p r e s s u r e p r o f i l e s f o r DX R404A s y s t em (2 5/8” su c t i on l i n e ) .
Fi gu r e 50 : T empe r a tu r e and p r e s s u r e p r o f i l e s f o r R404A/CO 2 Ind i r e c t s y s t em (2 5/8” r e t u rn l i n e ) 2
2 R404A flow direction in the CO2 condenser/R404A evaporator is reversed in the fig-ure for explanatory reasons, but the calculations are based on counter-flow conditions.

77
As shown in the temperature profile, the compressor inlet temperatures for the DX and indirect systems are -29.4°C and -33.6°C respectively. The corresponding inlet pressures are 169 and 140 kPa. The logarithmic mean temperature difference in the CO2 condenser equals 6K and the total CO2 temperature drop (air cooler + return line + CO2 condenser) is less than 0.1°C. This is very low compared to the temperature drop in the R404A suction line which is about 1.9°C.
For the 50 kW freezing capacity, the compressor power required to pro-vide the temperature lift needed to operate the system is 27.8 kW for the DX R404A system while the R404A/CO2 indirect system requires 30.9 kW (11% higher).
As discussed in section 4.1.3, should the system have originally been de-signed to operate with CO2 then smaller pipes could be used for the CO2 loop. Accordingly, a return pipe size of 1 5/8” (38 mm internal diame-ter) was selected which results in energy consumption 13% higher for the R404A/CO2 indirect system compared with the DX R404A.
In the same way, the power consumption for the indirect system using NH3 or propane as the primary refrigerant is calculated. Table 3 summa-rizes the results of the power consumption calculations for different re-frigerants in the two systems.
Tab l e 3 : Ca l c u l a t e d p owe r c o n s ump t i o n f o r d i f f e r e n t p r i -ma r y r e f r i g e ran t s i n c o nv e n t i ona l DX and CO 2 i nd i r e c t s y s t em s w i t h two d i f f e r e n t r e t u r n l i n e s i z e s .
CO2 indirect system
Primary Ref.
R404A NH3 Propane
DX R404A system
2 5/8” (Converted)
30.9 27 27.5
1 5/8” 31.4 27.4 27.8 27.8
In an indirect system, the charge of the primary refrigerant becomes rela-tively small, and the limited volume of the machine room makes it easy to handle the primary refrigerant. Therefore, NH3 or propane can be used as primary refrigerants given proper safety precautions; this is the case in some supermarket installations in Sweden. As shown in Table 3, when NH3 or propane is used instead of R404A in the indirect system, the energy consumption becomes less than or equal to that of the DX R404A system. According to the calculations NH3 has the lowest energy consumption among the indirect systems investigated, having approxi-mately 3% lower energy consumption than the DX R404A system when large return line pipes are used, and 1.5% lower when smaller pipes are

78
used. However, temperature lift in this application is high and the dis-charge gas from the NH3 compressor will be very hot. It is also possible that the evaporation pressure of the NH3 could become lower than at-mospheric pressure which may cause leakage into the system. These problems may be solved by carefully designing a tight system at the low stage with two-stage compression and an intercooler; the latter will also reduce the compressor’s power consumption. Propane/CO2 indirect has similar energy consumption to the DX R404A system.
If the plant was originally constructed with an NH3/CO2 indirect system then it would be possible to have smaller distribution lines, which would financially compensate for some of the additional equipment needed for the secondary loop and the safety devices needed because of the use of NH3.
The calculations for the pumping power were based on the assumption that the plant was originally operated with R404A in a DX system and then changed to a CO2 indirect system. The same liquid lines were used for the liquid CO2 in the secondary loop.
The sizing of the R404A liquid pipe in the DX system is based on the re-sults presented in Figure 51, where the permitted velocity must be in the range of 1-2.5 m/s (Stoecker, 1998), which gives a pressure drop of around 100 kPa. This value is also acceptable according to Dossat (1991) where approximately 70 kPa is recommended and can be exceeded with adequate sub-cooling.
10 20 30 40 500
0,5
1
1,5
2
2,5
3
0
50
100
150
200
250
300
d [mm]
wliq
[m
/s]
dP [k
Pa]wliq
dP
Fi gu r e 51 : Ve l o c i t y and p r e s s u r e d r op i n t h e l i qu i d l i n e f o r R404A in d i f f e r e n t p i p e d im en s i on s .

79
The power required for the CO2 pump is calculated based on the as-sumption that the flow in 50% of the CO2 loop is in the liquid phase and in the other 50% is a two-phase flow with a quality of 0.33 (circulation ratio= 3). Pump efficiency is assumed to be 50%. The results show that the required pumping power is about 115 and 140W for the 2 5/8” and 1 5/8” return lines respectively. This is very small compared to the com-pressor’s power and accounts for less than 1% in this case. The pumping power for CO2 will be higher in practice than for the calculated values presented above; several reasons contributing towards this are discussed in 6.5.1.
5 . 3 D i s c u s s i o n s a n d c o n c l u s i o n s Calculations for the indirect system solution show that CO2 has a sub-stantially lower pressure drop than R404A, as well as a corresponding drop in saturation temperature. This brings the inlet conditions of the compressor in the indirect system close to the conditions of a DX sys-tem with R404A. Hence the power consumption of the indirect system is not much higher than that of the DX system with the same refrigerant in the primary loop. For the calculated example this is up to 13% higher.
The indirect system solution allows the use of refrigerants which cannot be used in a DX solution. NH3 and propane cannot be used in DX sys-tems for safety reasons, but can be used in indirect solutions, and the calculations show that the power consumption of such systems is less than or equal to that of the DX R404A system.
For trans-critical system solutions, in the ambient temperature range of 10-40°C, the single-stage centralized system solution demonstrates a 4-21% higher COP than the parallel system with single-stage compression at the medium temperature level. Using two-stage compression at the high stage of the centralized system solution will further improve its COP by about 5-22%. It is essential for the application of this solution with floating condensing to have a compressor with good isentropic effi-ciencies at the low pressure ratios required in this case.
Several options for improvements have been examined for the two-stage centralized system; such as, high and low stage IHEs, free de-superheating at the medium temperature level, a lower superheat tem-perature in the DX evaporators, and flooded evaporators. COP im-provements of up to 7% at an ambient temperature of 10ºC were achieved by flooding the evaporator, with low stage IHE and free de-superheat. This system is referred to as the modified centralized solution.

80
COPs for selected trans-critical, NH3/CO2 cascade, and DX R404A sys-tems have been generated for different ambient temperatures. The dif-ferences between the COPs of the analyzed systems vary depending on the ambient temperature. The modified centralized system solution shows the highest COP among the systems for ambient temperatures lower than 16ºC, above which the NH3/CO2 cascade system has the highest COP. However, modifications that were applied to the central-ized system can also be implemented on the cascade system whereby the COP can be further improved. The parallel CO2 system solution shows the lowest COP within the selected temperature range.
Since performance differences between the systems under investigation vary over the ambient temperature range, the differences in annual en-ergy consumption will depend on the climate in which the system will operate. Examining the systems in three different climate conditions; cold/Stockholm, moderate/Frankfurt, and hot/Phoenix-Arizona, showed that CO2 systems, with the exception of the parallel system, are better for cold climates, such as in the case of Stockholm. However, the NH3/CO2 cascade system is better for hot climates, such as in the case of Phoenix-USA; in this climate the CO2 modified centralized system has just a 1% higher annual energy consumption than the conventional R404A. This analysis shows that from an energy consumption point of view the CO2 centralized and NH3/CO2 cascade solutions are good for low ambient temperatures whereas the NH3/CO2 cascade solution is good for high ambient temperatures. Both system solutions proved to be good alternatives to the DX R404A system for supermarket refrigera-tion.

81
6 Analysis of experimental results
Based on the theoretical analysis of the different CO2 systems it was concluded that the NH3/CO2 cascade system produces the highest COPs at high ambient temperatures, with the CO2 two-stage centralized system solution giving higher COPs at low ambient temperatures. Therefore, from the theoretical analysis of the systems’ energy consump-tion, both solutions proved to be good alternatives to the DX R404A system for supermarkets. In order to verify the results of the computer simulation models and evaluate the NH3/CO2 cascade and CO2 central-ized systems experimentally, two corresponding test rigs were built in a controlled laboratory environment. The test rigs were installed at the IUC Sveriges Energi- & Kylcentrum AB laboratories where all the test-ing took place.
6 . 1 T h e c a s e s t u d y The investigated system solutions were chosen to be applicable to a me-dium size supermarket installation in Sweden. In such a supermarket, as explained earlier, cooling capacities are typically 150 kW for a product temperature of +3ºC and 50 kW for frozen products at -18ºC. The con-densing temperature is kept constant, at up to 40ºC. Accordingly, the systems have been designed to operate between these temperature boundaries and to provide a cooling capacity which is scaled down while trying to keep a load ratio close to 3.
6 . 2 C a s c a d e s y s t e m t e s t r i g Most of the investigations carried out for CO2 solutions in commercial refrigeration are based on actual installations, which makes it hard to per-form parametric analysis, modify or optimise the system. It is also hard to draw conclusions on its performance in relation to other systems due to the fact that comparisons are usually made between non-identical sys-tems with different boundaries and operating conditions. Therefore, there is a real need for comprehensive laboratory testing of CO2 in this application where it is possible to control its boundaries and operating conditions, and modify its design.

82
The laboratory cascade installation uses NH3 at the high stage and CO2 at the low stage, and at the medium temperature level CO2 is pumped to provide the required cooling load. Figure 52 is a schematic diagram of the test rig system.
Fi gu r e 52 : S c h ema t i c d i a g r am o f NH 3 /CO 2 c a s c a d e s y s -t em w i t h CO 2 a t t h e med i um t emp e ra t u r e l e v e l i n s t a l l e d i n t h e l ab o r a t o r y .
Temperature levels of -8 and -37ºC were chosen to provide the required product temperatures of around +3ºC and -18ºC, with a designed con-densing temperature of 35ºC. The system has a rated cooling capacity of about 16.6 kW for the medium temperature level and about 7.4 kW of freezing capacity at the rated speed of the CO2 compressor.
The 16.6 kW cooling capacity at the medium temperature level is divided between two display cabinets, with 5 kW each, with the other 6.6 kW supplied by an electric heater. The electric heater, referred to as a load simulator, provides heat to a secondary loop which is then exchanged with the refrigerant in a plate heat exchanger, as can be seen in the schematic diagram above. The electric heater at the medium temperature level was selected to provide 9 kW in three steps of 3 kW each, but when installed the electric power consumption was measured and it provided only 2.2 kW in each step. On the low temperature side, the load is di-vided between two freezers with 2.5 kW each and the electric heater,

83
which can provide a load of up to 3 kW in three 1 kW steps, although it was initially selected to provide 2 kW in each step. The freezers are equipped with electronic expansion valves.
As mentioned earlier, the system was designed to have a load ratio of 3 at the rated capacities. However, due to a shortage in capacity of the load simulators the resulting load ratio is about 2.2.
The CO2 compressor is a Copeland scroll type with operating tempera-tures between -37ºC and -8ºC and a displacement of 4.1 m3/h. The CO2 pump is hermitic with a capacity much higher than the highest circula-tion rate desired; therefore a bypass to the accumulation tank is used to reduce the flow rate pumped into the medium temperature circuit. In any case, with hermitic pumps a bypass line must be used in order to en-sure sufficient cooling of the pump in case all the valves in the down-stream lines are closed. The system is designed with a head of about 1.5 m over the pump to prevent cavitation.
The accumulation tank has the capacity to contain 180 L of CO2 and is equipped with an electronic level indicator. It can stand a pressure of up to 40 bars which corresponds to an operating temperature of about 6ºC. At standstill conditions the CO2 in the tank is cooled down using a cold brine circuit available in the laboratory. Heat exchange occurs via a small heat exchanger which acts as the cascade condenser in this case. More-over, the system is equipped with a safety release valve that is triggered when the pressure in the system exceeds 38 bars. To avoid the release valve opening and the subsequent loss of a significant charge from the system, a bleed valve is installed which opens for a periodical release of CO2 at a lower pressure than the value set for the release valve, 35 bars, so that the pressure in the system will be reduced. If the pressure in-crease in the system is higher than the rate that the bleed valve can han-dle, then the release valve will open and the system’s charge will be re-leased.
The NH3 unit uses a Bock reciprocating compressor with a displacement of 40.5 m3/h and the ability to run at 50% reduced capacity by unloading half of its cylinders. In addition to the unloading of the cylinders, the ca-pacity is controlled by a frequency converter. A frequency converter is also used with the CO2 compressor. NH3 is circulated in the evaporator via a thermosyphon loop.
The cascade condenser is a plate type heat exchanger that is specially se-lected to handle the pressure difference that will exist between CO2 and NH3. Under the design conditions, when CO2 condenses at -8°C the

84
pressure is 28 bars while NH3 will have a pressure of about 2.7 bars at 12°C.
Freezers and medium temperature display cabinets can be defrosted us-ing the conventional electric defrost method. Alternatively, freezers can be defrosted using some of the compressors’ discharge gas. Since the condensing temperature of the CO2 at the compressor discharge pres-sure will be below zero, the heating of the evaporators will be achieved via the sensible heat of the hot gas.
There are many possible variations within CO2 cascade systems, which should be investigated in order to modify the system’s design, optimize its cost and improve its performance. This test rig has facilitated many variations in the system and the design took into consideration the need to modify and adjust some of the operating parameters.
Pressures and temperatures were measured before and after each com-ponent in the test rig.
6 . 2 . 1 E x p e r i m e n t s a n d r e s u l t s
6 . 2 . 1 . 1 O v e r a l l s y s t e m a n a l y s i s
In order to provide answers regarding the system solution under investi-gation, it is important to perform an overall analysis of the system whereby its capacities are properly measured, the energy balance is veri-fied, and the efficiencies/COPs of the system are calculated.
Load Measurements
The two compressors were used to estimate the mass flow rate of the re-frigerant, which was then used to calculate the cooling capacities in the corresponding circuits. For the NH3 compressor, data was not available for its volumetric efficiency; therefore equation 4-3 was used to provide an estimate. The volumetric efficiency is then used in the following equa-tion to estimate the mass flow rate in the NH3 compressor:
isNH,vNH Vm ρη ⋅⋅= && 33 6-1
Where iρ is the vapour density at the compressor inlet which was de-termined by measuring the pressure and temperature. By measuring the rotational speed ( n ) in rpm the swept volume sV& in m3/s is obtained us-ing the following relationship:

85
36001
⋅⋅=r
dsips nnVV && 6-2
Where the compressor has a volume displacement rate ( dispV& ) of 40.5
m3/h at a rated rotational speed ( rn ) of 1450 rpm.
In order to verify this method of calculating the refrigerant mass flow rate, the energy balance around the condenser was performed and the re-sults were very close. Energy balance results produced approximately 7% higher values of volumetric efficiency than in Pierre’s correlation (Granryd et al., 2005). Therefore, the factor of 1.02 in equation 4-3 was corrected slightly to 1.094 (Perales Cabrejas, 2006).
For the CO2 compressor, inlet and discharge pressures and temperatures and its electrical power consumption were measured which gave enough information to estimate the mass flow rate. Heat losses of 7% were as-sumed for both compressors. CO2 mass flow rate in the low stage and the enthalpy difference across the cabinets at the low temperature level were used to calculate the corresponding cooling capacity.
The simulators at the medium and low temperature levels provide a known fixed cooling capacity via the electric heaters which can be used to verify the method of calculating the cooling capacity at the medium and low temperature levels. The medium temperature simulator provides a maximum power of 6.6 kW, while the low temperature simulator pro-vides a maximum of 3 kW. Each simulator can be switched to 1/3, 2/3 or 3/3 of its capacity. The load of the simulators is not enough to run the system at the lowest possible speed, therefore it can only verify that the measuring method accounts adequately for the known load changes from the simulators.
In the return line at the medium temperature level the flow is a two phase one, therefore it is not possible to obtain the load at this tempera-ture level by measuring the refrigerant mass flow rate. By measuring the cooling capacities of the cascade condenser and the freezing cabinets it was possible to estimate the total load at the medium temperature level. The electric power consumption of the CO2 pump was measured and this varied around an average value of 0.85 kW.
System COPs
Condensing and evaporating temperatures were kept almost constant during the test; for the NH3 unit these values were 33ºC and -11ºC re-spectively. On the CO2 freezer side the evaporating temperature was -34ºC and the tank temperature was about -8ºC, which resulted in prod-
86
uct temperatures of about -18 and +3°C in the freezers and medium temperature cabinets respectively. Cooling capacities at medium and low temperature levels are 11.7 and 5.4 kW respectively.
The COP of the NH3 unit is the ratio of the cooling load of the cascade condenser to the electric power consumption of the NH3 compressor. Experimental values showed that the COP of the NH3 unit was around 3.3 while for the low stage CO2 unit it was around 4.5, and the total COP was about 2.2.
The mass flow rate of NH3 in the system and the enthalpy difference across the compressor were used to calculate the shaft power. The COP of the NH3 unit on the refrigerant side (shaft power) was about 4.3 and the corresponding total COP was around 2.5. Relating shaft power to electrical power consumption, the electric motor efficiency was found to be around 80%. As stated earlier, a 7% heat loss was assumed.
6 . 2 . 1 . 2 P u m p c i r c u l a t i o n r a t i o
For non-phase changing secondary fluids there exists an optimum value for the flow rate where the maximum COP can be achieved. At flow rates lower than the optimum value heat transfer will be reduced and at rates higher than this value the pump power will be high (Horton & Groll, 2001).
In the case of CO2 such an optimum may not exist or it may not be as prominent as is the case with non-phase changing secondary working fluids. This is because of the low pumping power needed for CO2. In-creasing the pumping rate will not lower the COP as much as would be the case with other single phase secondary working fluids. Moreover, heat transfer is in the boiling mode for CO2 and the influence with changing the mass flow rate will only show an effect on heat transfer if the boiling regime is changed. Several studies of CO2 evaporation, e.g. Hihara (2000) and Zhao et al. (2000), showed that mass flux has an al-most negligible effect on the heat transfer coefficient, which was ex-plained by the dominance of nucleate boiling mechanisms.
On the medium temperature side the circulation ratio of the refrigerant was varied so that heat transfer in the display cabinets could be investi-gated. The load simulator was used to test for different circulation rates; Figure 53 is a schematic diagram of the test circuit. The fixed load pro-vided by the simulator makes it possible to test a wide range of circula-tion ratios and it will be easier to evaluate heat transfer by measuring the temperature difference between the secondary working fluid and the re-frigerant. A Coriolis mass flow meter is used to measure the mass flow

87
of the refrigerant. A valve located before the medium temperature simu-lator was used to control the mass flow rate.
Ttank=-8ºC6,6 kW el
NH3 Unit
Medium temperature circuit
5 KW
5 KWLow stage circuitMass flow
meter
Sight glass
P
PTT
T
Fi gu r e 53 : S c h ema t i c d i a g r am o f t h e CO2 c i r c u l a t i o n r a t e t e s t c i r c u i t .
The circulation ratio has been changed from between 1 up to and slightly over 12. The reason that this high value was reached was that the valve was opened gradually to identify at which point the heat transfer starts to change, with the valve fully open at the maximum circulation rate tested. Running at a high circulation rate with a high pressure drop could be jus-tified if the heat transfer in the evaporator were to be improved. By measuring the secondary working fluid temperatures around the simula-tor it was possible to evaluate the influence of the circulation rate on the heat transfer in the heat exchanger.
A plot of the average Logarithmic Mean Temperature Difference (LMTD) against the circulation ratio is presented in Figure 54. The aver-age LMTD was taken for a running time of 20 minutes with data col-lected every 10 seconds. Longer running periods, of at least one hour, were applied to a few points along the range and the average was the same as for the 20 minute running time. The influence of the circulation

88
ratio on improving heat transfer can be seen to be insignificant; the in-fluence is very small whereby the average LMTD varies within a range of 0.2K.
0
0,5
1
1,5
2
2,5
3
3,5
4
0 1 2 3 4 5 6 7 8 9 10 11 12 13CR [-]
LMTD
[K]
Fi gu r e 54 : S imu l a t o r ’ s a v e r a g e LMTD a t d i f f e r e n t c i r c u -l a t i o n r a t i o s CR .
Increasing the circulation ratio resulted in an increase in the pressure drop across the heat exchanger with a negligible improvement in heat transfer; this indicates that the circulation ratio should be chosen to be as low as possible to ensure wet evaporation at the highest expected load. Due to the low surface tension of CO2 it tends to have dryout in the evaporator at a relatively low vapour quality. The quality at which dryout occurs is dependent on the refrigerant mass flux. During the course of the experiments dryout was not observed, thus either it did not occur, because the mass flux did not reach the onset value, or it did occur but had insignificant influence on performance.
6 . 2 . 1 . 3 Fr e e z i n g c a b i n e t c o n t r o l
The two freezers in the system are identical and not specially optimized to handle CO2. They were delivered with an expansion valve control sys-tem that determines the evaporation temperature by measuring the sur-face temperature of the evaporator tube. In this case the temperature sensor is placed on the first bend after the expansion valve. Figure 55 is a schematic diagram of the freezer evaporator where the positions of the measuring points are indicated.

89
Tevap
TSH
Fi gu r e 55 : Ba s i c s c h ema t i c d i a g r am o f t h e f r e e z e r ’ s e v ap o ra t o r w i t h t h e mea su r in g p o i n t s i nd i c a t e d f o r t h e t empe r a tu r e - b a s e d c on t r o l l e r .
The freezers with this controller occasionally showed unstable behav-iour, especially at start up and low superheat set values. The air tempera-ture in the freezers started to increase up to 0ºC with a loss in cooling capacity then decrease again, with the behaviour repeated in a cyclic manner. The controller on one of the freezers was changed so that the evaporation temperature could be obtained by measuring the pressure in the evaporator, shown in Figure 56. The two identical freezers were run under the same conditions with the same settings for the controller and the behaviours were observed. When the system starts up the controller will gradually regulate the mass flow of refrigerant in order to reach the minimum superheat value. Both controllers were set to run with mini-mum superheat of 5K.
Fi gu r e 56 : Ba s i c s c h ema t i c d i a g r am o f t h e f r e e z e r ’ s e v ap o ra t o r w i t h t h e mea su r in g p o i n t s i nd i c a t e d f o r t h e p r e s s u r e ba s e d c o n t r o l l e r .
As can be seen in the following two plots, the air temperature in the case of the temperature based controller increased, with a loss in cooling ca-pacity. From the superheat values it can be seen that the controller failed to keep the superheat close to the set value. Whilst in the second case the

90
superheat was controlled more effectively and the temperature increased, with a much lower loss of cooling capacity. It should be noted that the superheat value was set at such a low value in order to trigger this behav-iour in both cabinets. However, this oscillatory behaviour was also ob-served with the temperature based controller at high superheat values, but it was more pronounced at low values.
-30,00
-25,00
-20,00
-15,00
-10,00
-5,00
0,00
5,00
10,00
15,00
20,00
11:45:36 12:14:24 12:43:12 13:12:00 13:40:48 14:09:36 14:38:24 15:07:12Time [h:min:s]
T [ºC
]
SuperheatAir inAir out
Fi gu r e 57 : A i r t empe r a t u r e s and s up e r h ea t i n t h e f r e e z -e r s w i t h m in imum sup e r h e a t v a l u e s e t a t 5K i n t h e t em -p e ra t u r e ba s e d c o n t r o l l e r .
-30,00
-25,00
-20,00
-15,00
-10,00
-5,00
0,00
5,00
10,00
15,00
20,00
11:45:36 12:14:24 12:43:12 13:12:00 13:40:48 14:09:36 14:38:24 15:07:12Time [h:min:s]
T [ºC
]
SuperheatAir inAir out
Fi gu r e 58 : A i r t empe r a t u r e s and s up e r h ea t i n t h e f r e e z -e r s w i t h m in imum sup e r h e a t v a l u e s e t a t 5K i n t h e p r e s -s u r e b a s e d c on t r o l l e r .
In order to understand the behaviour of the controller, the input pa-rameters for each controller, indicated in Figure 55 and Figure 56, are

91
plotted in the following two figures. The measured superheat value is also plotted as an indication of the stability of the operation.
-30,00
-25,00
-20,00
-15,00
-10,00
-5,00
0,00
5,00
10,00
15,00
20,00
11:38:24 12:07:12 12:36:00 13:04:48 13:33:36 14:02:24 14:31:12 15:00:00Time [h:min:s]
T [ºC
]
SuperheatEvap ExitEvap (From measured T)Evap (Sat. from measured P)
Fi gu r e 59 : T empe r a t u r e v a l u e s i npu t i n t o t h e t emp e ra -t u r e b a s e d c o n t r o l l e r . Min imum sup e r h e a t v a l u e i s s e t a t 5K .
-30,00
-25,00
-20,00
-15,00
-10,00
-5,00
0,00
5,00
10,00
15,00
20,00
11:38:24 12:07:12 12:36:00 13:04:48 13:33:36 14:02:24 14:31:12 15:00:00Time [h:min:s]
T [ºC
] SuperheatEvap ExitEvap (Sat. from measured P)
Fi gu r e 60 : T empe r a t u r e v a lu e s i npu t i n t o t h e p r e s su r e b a s e d c o n t r o l l e r . Min imum sup e r h e a t v a l u e i s s e t a t 5K .
Looking at the input parameters of the controllers in the figures above it can be observed that in the temperature based controller, Figure 59, the point where the evaporating temperature is measured gets superheated and the controller reads a higher temperature than the saturation tem-perature at the measured pressure. This can be seen as the trigger of the unstable behaviour. In Figure 59 the actual evaporating temperature is obtained by measuring the pressure and plotted to compare the control-ler input to the actual value. The freezer’s evaporator is not specially de-

92
signed for CO2 and therefore its pipes are larger than necessary; this may have resulted in the CO2 evaporating completely and becoming super-heated in the early section of the evaporator. Moreover, the heat ex-changer’s coil consists of one single long CO2 pipe which may have re-sulted in a delay in sensing the changes due to the expansion valves ad-justments.
In the other case, the controller reads the correct evaporating tempera-ture and therefore a more accurate superheat value, so the controller manages to adjust the superheat and maintain the capacity more effec-tively.
The measurements and experiences in running the display cabinets with the two controllers indicate more favourable conditions in the case of the pressure-based one. The controller successfully kept the superheat value within the set range, it had lower stability at low set superheat val-ues, lower than 8K, but was still not as unstable as the temperature-based controller.
6 . 2 . 1 . 4 C a s c a d e c o n d e n s e r a r r a n g e m e n t s
With regard to the cascade condenser there are three main arrangements that can be tested in the experimental rig concerning the way CO2 con-denses. The first arrangement is presented in Figure 11A and labelled as Cascade Joint I.
The second arrangement is where CO2 condenses in a thermosyphon loop, or Cascade Joint II, shown in Figure 11B. In this case CO2 will en-ter the cascade condenser as saturated vapour.
A third arrangement that can be applied in the test rig, Figure 61, is where the return line from the medium temperature level passes directly through the cascade condenser after mixing with the hot discharge from the low stage. In this study this arrangement is denoted as “forced con-densation”. Normally the medium temperature level has a higher load than the low temperature level, approximately three times on average, and the return line will have CO2 with a liquid fraction depending on the circulation ratio. The hot gas from the low stage will boil off some of the CO2 coming from the medium stage and the flow into the cascade con-denser will be with a certain liquid fraction. In order to test for different flow qualities a simpler arrangement was chosen, which is one of the CO2 indirect system solutions as shown in Figure 10A.

93
Fi gu r e 61 : Fo r c e d c o nd en s a t i on c a s c ad e c ond en s e r a r -r an g em en t .
The thermosyphon arrangement was mostly used in running the system; therefore, it can be defined as the base arrangement to which the other two will be compared. The tests have been run in such a way that the cooling load on the freezer side was fixed so that the CO2 compressor will be running continuously. Load changes have been achieved mainly by changing the load in the simulators at the medium temperature level. The inlet temperature of the cascade condenser in the hot gas de-superheating arrangement varied between 17 and 30°C depending on the load ratios. A frequency converter controlled the speed of the NH3 compressor in order to maintain a pressure of 28 bars in the CO2 tank, which corresponds to a condensation temperature of -8°C.
Figure 62 illustrates the temperature difference across the cascade con-denser for different cooling capacities. The points in the plot were taken using the average, taken during stable periods.
0
0,25
0,5
0,75
1
1,25
1,5
1,75
2
2,25
2,5
2,75
3
3,25
14 14,5 15 15,5 16 16,5 17 17,5 18 18,5 19 19,5 20 20,5 21 21,5 22 22,5 23Cooling Capacity [kW]
ΔT
[K]
Thermosyphon
Hot gas de-superheating
Fi gu r e 62 : Sa t u ra t i o n t empe r a t u r e d i f f e r e n c e a c r o s s t h e c a s c a d e c o nd en s e r i n t h e t h e rmo s yph on (F i gu r e 11B) and h o t g a s d e - s up e rh e a t i n g a r r an g emen t s (F i gu r e 11A) .

94
As can be seen in the figure, there is a temperature difference between the two arrangements of 0.2K along the test range. This temperature dif-ference is not considered to be significant and is negligible in terms of the overall system perspective. Moreover, it has been noticed that both arrangements presented good stability within the whole study range.
The forced arrangement, third, was tested for different loads with two different circulation ratios that result in vapour qualities of about 0.5 (CR=2) and 0.23 (CR=4.4) at the inlet of the cascade condenser. For better control over the inlet conditions of the cascade condenser the ar-rangement in Figure 10A was used for the test. The temperature differ-ences across the heat exchanger for two different forced condensation qualities and for the thermosyphon are plotted in the following figure.
0
0,5
1
1,5
2
2,5
3
3,5
4
4,5
5
14 14,5 15 15,5 16 16,5 17 17,5 18 18,5 19 19,5 20 20,5 21 21,5 22 22,5Cooling Capacity [kW]
ΔT
[K]
Forced Condensation: High x
Thermosyphon
Forced Condensation: Low x
CR=1.8X=0.56
CR=1.9X=0.53 CR=2.1
X=0.48
CR=4.4X=0.23CR=4.4
X=0.23CR=4X=0.25
CR=1 X=1
Fi gu r e 63 : Sa t u ra t i o n t empe r a t u r e d i f f e r e n c e a c r o s s t h e c a s c a d e c o nd en s e r i n t h e t h e rmo s yph on and f o r c e d c o nd en -s a t i o n a r ran g em en t s w i t h d i f f e r e n t s e t s o f v ap ou r qua l i t y v a l u e s .
As can be seen in the figure, in the case of low inlet quality with high mass flow and circulation ratio, the temperature difference is very close to the case of the thermosyphon. In the case of higher inlet quality, it can be seen that the temperature difference is high with a low mass flow rate and that heat transfer improves with an increase in mass flow rate. In practice, the different trends shown in the above figure suggest that a system with this arrangement may operate with some instability when load variations change the inlet vapour quality, heat and mass fluxes.
Both thermosyphon and hot gas de-superheating arrangements had good and comparable heat transfer in the cascade condenser, see Figure 61, and there was not a noticeable difference in system stability between the

95
two cases. However, in the hot gas de-superheating case, the load ratio, compressor discharge temperature, On-Off compressor operation, cool-ing load control, and load variations in both temperature levels are fac-tors that will strongly influence the CO2 conditions at the inlet of the cascade condenser and may result in different performances than those measured in the laboratory tests. Consequently, the experimental results of the thermosyphon solution are better able to be generalized to other installations.
6 . 2 . 2 O p t i m i z a t i o n o f t h e c a s c a d e s y s t e m Based on the parametric analysis conducted on the cascade system it was run with a thermosyphon arrangement and pressure based control in the freezers with superheat value set at 9K. The superheat value may be re-duced if the coil is divided into two shorter parallel loops instead of one single long loop.
Since the pump was much larger than necessary and the circulation rate had negligible influence on heat transfer, the circulation ratio was not kept at a certain low value. Instead, the system was run so that the circu-lation ratio did not fall below 3 at the maximum load. However, running a larger system with a pump size that reasonably matches the required cooling capacity the circulation ratio should be kept as low as possible.
6 . 3 T r a n s - c r i t i c a l s y s t e m t e s t r i g
6 . 3 . 1 S y s t e m s o l u t i o n The system works with CO2 as the only working fluid. The NH3 unit in the cascade system, shown in Figure 52, is replaced with a CO2 unit which works with a two-stage compressor and intercooler. After testing with the two-stage compressor it has been modified to work as single-stage system and further tests have been performed. A schematic dia-gram of the system with two-stage compression is shown in the follow-ing figure.

96
Trans-critical circuit
Inter-cooler
Gas cooler/Condenser
IHE
Fi gu r e 64 : S ch ema t i c d i a g r am o f t h e two - s t a g e t r an s -c r i t i c a l CO 2 s y s t em i n s t a l l e d i n t h e l ab o ra t o r y .
This system solution is similar to what is referred to as “centralized” in section 4.3. It can be observed from the diagram that a cascade con-denser is used which separates the system into two circuits. The main reason for using the cascade condenser was to separate the high stage compressors from the accumulation tank where oil will eventually collect and a special mechanism will be needed to return it to the high stage compressors. The oil used is of the POE type which is soluble in CO2 and can be separated by evaporating off the liquid CO2.
A schematic drawing of a system for oil separation is presented in Figure 65 whereby liquid CO2 from the tank is heated up until it evaporates and the oil is thus separated. Oil is collected in a small vessel and returned to the high stage via a pump that is triggered when a certain oil level is reached. Such a system is presented by Stoecker (1998).

97
Fi gu r e 65 : O i l r e t u rn s y s t em (S t o e ck e r , 1998 ) .
Using the cascade condenser solution will allow for system testing while bypassing potential oil return problems. After the system has been evalu-ated, the cascade condenser can be bypassed as indicated by the dashed lines around the cascade condenser in Figure 64. The high stage CO2 sys-tem is built as a separate unit first and then connected to the laboratory’s heat supply and sink systems in order to have better control over the sys-tem for preliminary evaluation. Figure 66 is a schematic diagram of the two-stage CO2 trans-critical unit which shows the loop that connects its evaporator to the laboratory’s heat supply system.
Fi gu r e 66 : S c h ema t i c d i a g r am o f t h e h i g h s t a g e t r an s -c r i t i c a l CO 2 un i t .

98
The two-stage compressor is a Dorin semi-hermetic unit with a rated speed of 2900 rpm and swept volume of 10.3 m3/h. The compressor can stand 100 and 163 bars of pressure in the suction and discharge lines re-spectively. The schematic diagram in Figure 66, for the sake of simplicity, shows two separate single stage compressors; however, the installed compressor is a single unit with two-stage compression.
A requirement for the compressor’s oil cooling procedure is that the temperature of the oil should not exceed 65˚C. It is carefully pointed out by the manufacturer that the oil cooler capacity can withdraw about 20% of the electric motor power consumption (Dorin, 2007). A SWEP plate heat exchanger with a cooling capacity of 3 kW at a temperature differ-ence of about 6°C on the water side and the capability to stand a pres-sure up to 100 bars is installed as the oil cooler.
The gas cooler, the cascade condenser, and the intercooler are Super-MaxTM plate heat exchangers from TRANTER. The gas cooler has a design pressure of 100 bars and a maximum design temperature of 100˚C. The cascade condenser and intercooler can stand up to 91 bars. The expansion/regulation valve is a Danfoss electronic with maximum working pressure of 140 bars.
The accumulator, oil separator, and coaxial IHE were designed and built in IUC Sveriges Energi- & Kylcentrum AB laboratories and can stand pressures of up to 200 bars.
Pressures and temperatures were measured before and after each com-ponent in the test rig.
6 . 3 . 2 O v e r a l l s y s t e m a n a l y s i s The CO2 trans-critical unit will be compared to the performance of the NH3 unit in the cascade system in Figure 52, and the operating condi-tions will be kept comparable. The heat sink temperature is controlled in a similar way to the NH3 system. The supply water temperature was var-ied between 15, 20, 25 and 30°C. The evaporating temperature was kept at around -12.5°C by controlling the mixing valve in the brine loop, shown in Figure 66.
Temperature and pressure measuring points are placed before and after each component in the system. A mass flow meter is installed at the brine side of the evaporator where the cooling capacity is calculated. An energy balance is performed around the evaporator to obtain the CO2 mass flow rate, and thereafter, capacities of the gas cooler and inter-cooler are calculated from the refrigerant side. The oil cooler capacity is

99
calculated by measuring the mass flow rate and the temperature differ-ences on the water side. During all tests the oil cooler capacity was found to be around 1 kW. The electric power consumption of the CO2 com-pressor is measured by an electric meter and is used for calculating the COP.
For the case of a supply water temperature of 30°C, the system was tested for several different discharge pressures in the trans-critical opera-tion. The limit for the highest discharge pressure that can be reached is 92 bars, which is the limit for the piping system. The resulting COP and cooling capacities of the system are presented in Figure 67.
0,0
0,2
0,4
0,6
0,8
1,0
1,2
1,4
1,6
1,8
2,0
70 75 80 85 90 95Discharge Pressure [bar]
CO
P[-]
0
5
10
15
20
25
30
35
Q [k
W]COP
Q
Fi gu r e 67 : COPs and c o o l i n g c a pa c i t i e s o f CO 2 t ran s -c r i t i c a l un i t a t d i f f e r e n t d i s c ha r g e p r e s s u r e s f o r a s upp l y wa t e r t emp e ra tu r e o f 30°C .
Measurements showed that there is a pressure drop of about 1.5 bars be-tween the compressor discharge and the gas cooler inlet, across the oil separator shown in Figure 66. The high pressure drop might be due to the flattening of the inlet point of the refrigerant to the oil separator which has been done in order to improve the distribution of the fluid in the separator’s cylinder. Therefore, what is referred to as the compres-sor’s discharge pressure in the following discussion is the pressure meas-ured at the exit of the gas cooler.
As can be seen in Figure 67, both COP and cooling capacity increase with greater gas cooler pressure and the operation seems to approach the optimum discharge pressure. Plotting the cycle of each discharge pres-sure on the P-h diagram, Figure 68, shows that with pressures higher

100
than the highest tested value, 89.5 bars, the cooling capacity will show only a small increase compared to the tested range. This is due to the sharp incline in the isotherm of the gas cooler exit temperature with in-creasing discharge pressure.
-200 -100 020
100110
h [kJ/kg]
P [b
ar]
35°C 30°C
-11°C
20°C
89.5 bars89.5 bars83,5 bars83,5 bars79,4 bars
55 bar
74,2 bars
Fi gu r e 68 : CO 2 P -h d i a g ram w i t h c y c l e p l o t s o f t h e 30°C supp l y wa t e r t empe r a t u r e t e s t s .
The installed compressor is recommended to be used with evaporating temperatures of between -50 and -20°C, whereas the evaporating tem-perature in the experiment is -12.5°C. It can be observed in the above figure that, except for a discharge pressure 83.5 bars, the isentropic effi-ciency of the second stage compression tends to increase with higher discharge pressures. This indicates that the operating pressure ratio of second stage compression, between 1.4 and 1.7, is lower than the opti-mum. Experimental values of isentropic efficiency for second stage compression at different pressure ratios are plotted in Figure 69.

101
0
10
20
30
40
50
60
70
80
90
100
1 1,1 1,2 1,3 1,4 1,5 1,6 1,7 1,8 1,9
Pressure ratio [-]
Isen
tropi
c E
ffici
ency
[%]
ExperimentalPoly. (4th order)Poly. (3ed order)Poly. (2nd order)
Fi gu r e 69 : Exp e r imen t a l v a l u e s and ex t rap o l a t i o n s o f t h e i s e n t r o p i c e f f i c i e n c y f o r s e c o nd s t a g e c omp r e s s i o n a t d i f f e r e n t p r e s s u r e ra t i o s .
Second, third and fourth order polynomial curve fittings are applied and used to extrapolate for pressure ratios up to 1.85. The shape of the fourth order extrapolation does not seem to be realistic, while the second and third order extrapolations give values similar to those of the highest reached with the highest pressure ratio tested; about 85% efficiency at a pressure ratio of 1.7. Therefore, an isentropic efficiency value of 85% was used in extrapolating the system’s COP for pressure ratios between 1.7 and 1.8. The extrapolated COPs are presented in the following figure.
0,0
0,2
0,4
0,6
0,8
1,0
1,2
1,4
1,6
1,8
2,0
70 75 80 85 90 95 100 105Discharge Pressure [bar]
CO
P[-]
0
5
10
15
20
25
30
35
Q [k
W]
COP measurmentsCOP ExtrapolationQ MeasurmentsQ Extrapolation
Fi gu r e 70 : CO 2 t r an s - c r i t i c a l un i t COPs and c o o l i n g c a -pa c i t i e s a t d i f f e r e n t d i s c h a r g e p r e s s u r e s f o r a s upp l y wa -t e r t emp e ra t u r e o f 30°C : exp e r im en t a l v a l u e s and ex -t r ap o l a t i o n s .

102
As can be seen in the figure, the optimum discharge pressure is around 90 bars whereas the COP starts to drop for higher values. This is due to the small increase in cooling capacity compared to compressor power. This can be observed in the cycles with dashed lines in Figure 71, the continuous line is for the highest pressure tested.
-200 -100 020
100110
h [kJ/kg]
P [b
ar]
35°C 30°C
-11°C
20°C55 bar
92 bars95 bars100 bars
89,5 bars (Exp)
Fi gu r e 71 : CO 2 P -h d i a g r am w i t h c y c l e p l o t s o f t h e ex -t r ap o l a t i o n s f o r h i g h d i s c ha r g e p r e s s u r e p o i n t s . Supp l y wa t e r t emp e ra tu r e i s 30°C. Th e c y c l e w i t h c o n t i nu ou s l i n e s i s f o r t h e h i g h e s t p r e s s u r e t e s t e d .
For a water supply temperature of 25°C and an approach temperature difference lower than 6K the operation will be sub-critical. Tests started with high pressure where the operation is trans-critical and then the regulation /expansion valve, shown in Figure 66, is opened to reduce the gas cooler pressure. The different pressures tested and the resulting COPs are presented in the following figure.

103
0,0
0,5
1,0
1,5
2,0
2,5
65 70 75 80 85 90 95Discharge Pressure [bar]
CO
P[-]
0
5
10
15
20
25
30
35
40
Q [k
W]
COP measurmentsCOP ExtrapolationQ MeasurmentsQ Extrapolation
Fi gu r e 72 : CO 2 t r an s - c r i t i c a l un i t COPs and c o o l i n g c a -pa c i t i e s a t d i f f e r e n t d i s c h a r g e p r e s s u r e s f o r a s upp l y wa -t e r t emp e ra t u r e o f 25°C : exp e r im en t a l v a l u e s and ex -t r ap o l a t i o n s .
The accumulator installed in the system turned out to be smaller than re-quired; therefore, the system was charged with a certain amount of re-frigerant and run starting at the highest discharge pressure in the test and the charge is then regulated in order to achieve good system stability. When the discharge pressure is reduced by opening the regulation valve the system charge is released so liquid CO2 will not fill the accumulator. This process is repeated with every reduction in discharge pressure.
As can be seen in the plot in Figure 72, cooling capacity and COP drop sharply when the operation is in the sub-critical region. This might be due to the excessive release of the system’s charge which causes a loss in cooling capacity and COP. The cycles at different pressures are plotted on the P-h diagram in Figure 73. As can be seen in the plot, the cycle with a gas cooler exit pressure of 68 bars has a low cooling capacity and incomplete condensation. The process shown with the dashed line repre-sents an assumed operation where the system goes through complete condensation and additional sub-cooling in the IHE so the cooling ca-pacity is high. This gives an indication of the highest COP that can be obtained from the system when it is properly charged. The cooling ca-pacity and COP that result from the operation shown by the dashed line process in the following figure are presented using separate points in Figure 72.

104
-200 -100 020
100110
h [kJ/kg]
P [b
ar]
35°C 30°C
-11°C
20°C
88.5 bars88.5 bars83,5 bars83,5 bars78,5 bars
55 bar68 bars (Extrap.)
74 bars68 bars
Fi gu r e 73 : CO 2 P -h d i a g ram w i t h c y c l e p l o t s o f t h e 25°C supp l y wa t e r t emp e ra tu r e t e s t s . Da sh e d l i n e i s f o r t h e ex t r ap o l a t e d c a s e .
According to the measurements and extrapolation presented in Figure 72, the highest COP that can be obtained from the installed system at 25°C is about 2. The main reasons for having a high COP when the sys-tem is operated trans-critically are the increases in cooling capacity and isentropic efficiency of the second stage compression; this can be ob-served in Figure 73.
Similar tests and analysis procedures have been carried out for the cases of supply water temperatures of 20 and 15°C. The following figure is a plot of the cooling capacities and COPs of the 20°C case, the two sepa-rate points being extrapolations of the sub-critical points.

105
0,0
0,5
1,0
1,5
2,0
2,5
60 62 64 66 68 70 72 74 76 78Discharge Pressure [bar]
CO
P[-]
0
5
10
15
20
25
30
35
40
Q [k
W]
COP measurmentsCOP ExtrapolationQ MeasurmentsQ Extrapolation
Fi gu r e 74 : CO 2 t r an s - c r i t i c a l un i t COPs and c o o l i n g c a -pa c i t i e s a t d i f f e r e n t d i s c h a r g e p r e s s u r e s f o r a s upp l y wa -t e r t emp e ra t u r e o f 20°C : exp e r im en t a l v a l u e s and ex -t r ap o l a t i o n s .
The following figure is a process plot of the test points, extrapolations shown with dashed lines. It is clear from the figure that cooling capacity increases and the performance of the second stage compression im-proves with the higher discharge pressures (pressure ratios) tested.
-200 -100 020
100
h [kJ/kg]
P [b
ar]
35°C 30°C
-11°C
20°C
77 bars74 bars
68 bars (Extrap.) 54 bar64 bars (Extrap.)
64 bars68 bars
Fi gu r e 75 : CO 2 P -h d i a g ram w i t h c y c l e p l o t s o f t h e 20°C supp l y wa t e r t empe r a tu r e t e s t s . Dash e d l i n e s a r e f o r t h e ex t r apo l a t e d c a s e s .

106
The highest tested COP that can be obtained at a supply water tempera-ture of 20°C is about 2.1. The extrapolation of the lowest gas cooler pressure yields a slightly higher COP, of about 2.3.
The cooling capacities and COPs obtained for the 15°C water supply temperature tests are presented in the following figure.
0,0
0,5
1,0
1,5
2,0
2,5
3,0
60 61 62 63 64 65 66 67 68Discharge Pressure [bar]
CO
P[-]
0
5
10
15
20
25
30
35
40
45
Q [k
W]COP
Q
Fi gu r e 76 : CO 2 t ran s - c r i t i c a l un i t exp e r im en t a l COPs and c o o l i n g c a pa c i t i e s a t d i f f e r e n t d i s c h a r g e p r e s s u r e s f o r a s upp l y wa t e r t empe r a tu r e o f 15°C .
The process plot for each test point is presented in the following figure.
-200 -100 020
50
100
h [kJ/kg]
P [b
ar]
35°C 30°C
-11°C
20°C
67 bars64 bars
50 bar61 bars
Fi gu r e 77 : CO 2 P -h d i a g ram w i t h c y c l e p l o t s o f t h e 15°C supp l y wa t e r t empe r a t u r e t e s t s .

107
The highest COP obtained is approximately 2.7 at 67 bars of gas cooler exit pressure. The highest experimental COP for each water supply tem-perature tested is plotted in the following figure.
0,0
0,5
1,0
1,5
2,0
2,5
3,0
14 15 16 17 18 19 20 21 22 23 24 25 26 27 28 29 30 31Supply Water Temperature [°C]
CO
P[-]
Fi gu r e 78 : Exp e r im en t a l COPs o f t h e CO2 t r an s - c r i t i c a l un i t f o r d i f f e r e n t s upp l y wa t e r t empe r a t u r e s . Evapo ra t i n g t empe r a tu r e i s a b ou t - 12 .5°C.
The COP at 20°C seems to be slightly lower than that which would fit in a trend line. This is due to the approach temperature difference in the intercooler being higher than in the rest of the tests, about 20 compared to 9°C. The valve on the water supply to the intercooler may have been partly closed during the test, whereas it should be fully open. An addi-tional test has been run with the supply water temperature valve fully opened. The approach temperature difference in the intercooler was about 9°C, the system COP was 2.2 at a discharge pressure of 69 bars. In this case, more heat will be rejected in the intercooler, which can be seen in the process plot of the test points presented in Figure 79.

108
-200 -100 020
100
h [kJ/kg]
P [b
ar]
35°C 30°C
-11°C
20°C
77 bars74 bars
54 bar64 bars68 bars
69 bars (9°C intercooler appr.)
Fi gu r e 79 : CO 2 P -h d i a g ram w i t h c y c l e p l o t s o f t h e 20°C supp l y wa t e r t empe r a tu r e t e s t s . Th e c y c l e w i t h a da s h e d l i n e i s f o r t h e f u l l y o p en ed supp l y wa t e r v a l v e t e s t .
It can be observed in the P-h diagrams that approach temperature differ-ences between the gas cooler/condenser exit and the supply water tem-perature tend to increase at lower pressures. This occurs when the heat rejection operation gets closer to the critical point or lower, where on the T-s diagram the isobars start to become flatter and the shape becomes less favourable for heat transfer. Consequently, the pinch point may oc-cur inside the heat exchanger instead of at the exit and the approach temperature difference at the exit of the gas cooler/condenser tends to increase.
As mentioned earlier, the installed compressor is designed to operate at higher pressure ratios than those applied in the tests. Therefore, it has been modified in order to operate with a partial cooling capacity as a sin-gle stage compressor. This will allow the compressor to operate at higher pressure ratios, which may result in better performance. The resulting system is similar to that which is referred to in section 4.3 as a “single-stage centralized" solution.
In the modified compressor, the high stage of the compressor is used for compression and the low stage is a “shortcut”. A concern regarding this new compressor arrangement was that the electric motor had high ca-pacity and needed to be cooled down by the refrigerant which may have significantly deteriorated the performance of the compressor.

109
The system has been tested for two different supply water temperatures to the condenser/gas cooler, these being 15 and 25°C. The cooling ca-pacity achieved by the system was about 10 kW. The resulting COPs are presented in the following figure along with the values for the two-stage compressor previously analyzed.
0,0
0,5
1,0
1,5
2,0
2,5
3,0
14 15 16 17 18 19 20 21 22 23 24 25 26 27 28 29 30 31Supply Water Temperature [°C]
CO
P[-]
2-St. Exp.Single St. Exp.
Fi gu r e 80 : Exp e r imen t a l COPs o f t h e s i n g l e - and tw o -s t a g e t r an s - c r i t i c a l un i t f o r d i f f e r e n t s upp l y wa t e r t em -p e ra t u r e s . Evapo ra t i n g t emp e ra t u r e i s ab ou t - 12 .5°C f o r two - s t a g e t e s t s and ab ou t -10°C f o r s i n g l e - s t a g e .
The resulting cycle plots are presented in the following figure.
-200 -100 020
100
h [kJ/kg]
P [b
ar]
35°C 30°C
-11°C
20°C
55 bars (COP=1.7)
75 bars (COP=1.4)
Fi gu r e 81 : CO 2 P -h d i a g r am w i t h c y c l e p l o t s o f t h e 15 and 25°C supp l y wa t e r t empe r a t u r e t e s t s f o r t h e s i n g l e -s t a g e c omp r e s s o r .

110
It can be observed in Figure 81 that the isentropic efficiency is higher at the higher pressure ratio. Several discharge pressure values have been tested and the resulting overall compressor efficiencies at different pres-sure ratios are plotted in the following figure.
0
10
20
30
40
50
60
70
80
90
100
1 1,4 1,8 2,2 2,6 3 3,4Pressure Ratio [-]
Isen
tropi
c E
ffici
ency
[%]
Fi gu r e 82 : Exp e r im en ta l v a l u e s o f t h e o v e ra l l e f f i c i e n c y o f t h e s i n g l e - s t a g e c omp r e s s o r a t d i f f e r e n t p r e s s u r e r a t i o s
Looking at the overall efficiency values in the above figure it must be taken into account that there are some parameters that reduced com-pressor efficiency due to the transformation from two- to single-stage. For instance, the heat that has to be removed from the compressor in order to cool down the relatively large electric motor. Furthermore, the low stage shortcut section will result in additional loss due to friction in the compressor and the electric power consumption will be higher due to the moving pistons.
As can be observed in Figure 80, the COP of the two-stage compressor is about 50% higher than the single-stage compressor that was tested. It was observed during the tests of the single-stage compressor that the heat removed from the compressor oil is about 1.4 kW, compared to 1 kW on average in the case of the two-stage compressor. This may be re-lated to the higher discharge temperature in the single stage compressor.
6 . 3 . 3 C o m p a r i s o n t o c a s c a d e s y s t e m As can be observed in Figure 52 and Figure 64, the cascade and trans-critical systems are identical except for the NH3 and CO2 trans-critical units connected to the cascade condenser. Comparing the performance of both units will give an indication of which system, cascade or trans-

111
critical, is more energy efficient. Figure 83 is a plot of the experimental COPs for the NH3 and CO2 two-stage trans-critical units.
0,0
0,5
1,0
1,5
2,0
2,5
3,0
3,5
4,0
4,5
10 15 20 25 30 35Supply Water Temperature [°C]
CO
P[-]
NH3 unitCO2 trans-crit. unit
Fi gu r e 83 : Exp e r imen t a l COPs o f t h e NH 3 and CO 2 two - s t a g e t r an s - c r i t i c a l un i t s f o r d i f f e r e n t s upp l y wa t e r t empe r a tu r e s . Evapo ra t i n g t empe r a t u r e i s ab ou t - 12 .5°C f o r t h e CO 2 t e s t s and -11°C f o r NH 3 .
The COP of the NH3 unit is up to 100% higher than that of CO2. In-creasing the evaporation temperature for the CO2 unit to equal the NH3’s will have negligible influence in reducing this difference.
6 . 4 C o m p a r i s o n t o R 4 0 4 A i n s t a l l a t i o n
6 . 4 . 1 R 4 0 4 A s y s t e m d e s c r i p t i o n In the laboratory of IUC Sveriges Energi- & Kylcentrum AB, where the NH3/CO2 system was installed, an R404A system was built. The R404A system has been installed as part of a separate project with the objectives to investigate control strategies, floating condensing, and heat recovery (Claesson, 2006). The system has been defined as that which would be most likely to be installed in a Swedish supermarket today. This was ac-cording to contact with companies involved in the project and a survey of some of the main supermarket chains. Figure 84 is a schematic dia-gram of the R404A installation.

112
Medium Temperature Circuit
9 kW el
5 kW
5 kW
Subcooler Subcooler
Brine Loop
Low Temperature Circuit
9 kW el
2.5 kW
2.5 kW
Subcooler
Fi gu r e 84 : S c h ema t i c d i a g r am o f t h e R404A s y s t em i n -s t a l l a t i on in t h e l ab o r a t o r y .
As can be seen in the figure, the system consists of two separate circuits for the low and medium temperature levels. At the medium temperature level two compressors, in two separate primary circuits, provide the re-quired cooling to a 40% solution of propylene glycol in an indirect sys-tem arrangement. As can be noticed in the secondary working fluid loop, an electric heater can provide a load of 3, 6 or 9 kW directly into the loop. The medium temperature compressors are of the scroll type from Copeland with a 20.9 m3/h volume flow rate, and a maximum pressure of 32 bars.
In the low temperature loop, a DX circuit is used with a Bizter compres-sor which has a flow rate volume of 63.5 m3/h and a maximum high pressure of 28 bar. A load simulator that provides 1.5, 3, 4.5 and 6.5 kW is used. Cabinets at the medium and low temperature levels are of similar capacities to those in the NH3/CO2 cascade system.
The system can provide a cooling capacity of 22 kW at the medium tem-perature level and 10 kW for the freezers. It is designed to operate within the same boundary conditions as for the NH3/CO2 cascade system.
This system differs from the one introduced in the theoretical analysis in section 4.4 by having the single phase secondary working fluid loop at the medium temperature level. The reason for this is to reduce the re-frigerant charge in the system due to the regulations enforced regarding the use of HFCs. Using the indirect system implies that the primary re-

113
frigerant will have to operate at a lower evaporation temperature due to the additional heat exchanger which couples the primary and secondary loops. Moreover, the indirect system has a secondary working fluid pump which adds to the system’s power consumption. Therefore, the R404A/single phase indirect system will have a lower COP than the DX R404A.
6 . 4 . 2 R u n n i n g c o n d i t i o n s a n d r e s u l t s The two systems run in the same laboratory environment where the boundary conditions are kept as identical as possible. Room temperature and relative humidity were around 20°C and 30% respectively. The two systems have been regulated in order to obtain evaporation temperatures that produce similar product temperatures in the systems’ cabinets. The temperature of water inlet to the condensers was controlled in order to simulate floating condensing conditions. Similar defrost methods and procedures were applied. Temperatures at the boundaries of the systems are listed in the following table.
Tab l e 4 : Ope ra t i n g t emp e ra tu r e s ( i n °C) f o r t h e c a s c a d e and R404A s y s t em s
Medium Freezers Product Evaporation Product Evaporation
Condenser Cond. Inlet
Water Cas. 404 Cas. 404 Cas. 404 Cas. 404 Cas. 404
20 2.7 4.5 -7.9 -12.4 -17.6 -14.0 -34.4 -36.9 23.2 27.9
25 2.6 4.3 -7.6 -12.9 -17.5 -15.5 -34.5 -36.3 28.1 33.7
30 2.5 4.3 -7.2 -13.7 -17.5 -14.5 -34.3 -34.9 33.0 40.7
As can be observed in the table, product temperatures in the cascade sys-tem cabinets are lower than in the R404A’s. Evaporation temperature at the medium temperature level for the R404A system is lower by about 5K and the condensing temperature is higher than that in the cascade system. The measured cooling capacities, load ratios and COPs of the different systems are presented in the following table.
Tab l e 5 : Coo l i n g c apa c i t i e s (kW) and r e su l t i n g COPs f o r t h e c a s c a d e and R404A s y s t em s
Cooling capacity
Medium Low Load ratio
R404A COP
Cas. COP Total COP
Cond. Inlet
Water Cas. 404 Cas. 404 Cas. 404. Med Low Med Low Cas. 404
20 13.1 13.6 5.4 10.5 2.4 1.3 1.8 1.6 3.1 1.9 2.6 1.7
25 13.0 13.4 5.3 10.0 2.5 1.3 1.6 1.5 2.7 1.7 2.4 1.5
30 13.4 14.8 5.3 9.8 2.5 1.5 1.4 1.4 2.5 1.6 2.2 1.4

114
Cooling capacities in the R404A system are calculated by measuring the energy consumption of the compressor and using the enthalpy difference around it to calculate the refrigerant mass flow rate. This is then used to calculate the cooling capacity in the DX evaporators.
As can be seen in Table 5, the cascade system has a higher COP than the R404A. It has a 50 to 60% higher COP at the tested temperature range. The load ratio for the R404A system in the tests is lower than that for the cascade which may suggest that the total COP of the R404A system would have been higher if the load ratio was the same; on the other hand, COP values for the R404A medium and low temperature circuits are very similar owing to the use of an indirect system at the medium temperature level, which can be noted in Table 5. Therefore, the total COP of the R404A system does not significantly improve with higher load ratio.
The electric power consumption of the secondary working fluid pump in the R404A system varied around an average value of 2 kW. While, as mentioned earlier, the CO2 pump in the cascade system had electric power consumption of 0.85 kW. Since, the experimental test rigs have been scaled down to fit in the laboratory conditions then there is a risk that the pumps are oversized. Therefore, in order to eliminate the pump size factor the total COPs of the cascade and R404A systems are com-pared in Figure 85 excluding the pumping power. The total COPs of the R404A system excluding the pumping power and assuming the same load ratios as for the cascade system have also been plotted.
0,0
0,3
0,5
0,8
1,0
1,3
1,5
1,8
2,0
2,3
2,5
2,8
3,0
18 20 22 24 26 28 30T [°C]
CO
Pto
t [-]
Cas. Exp. No pump
Cas. Exp
R404A Exp. No pump, Cas. Systemload ratioR404A Exp. No pump
R404A Exp
F i gu r e 85 : To t a l exp e r imen t a l COPs f o r NH 3 /CO 2 c a s -c a d e and R404A s y s t em s a t d i f f e r e n t s upp l y wa t e r t em -p e ra t u r e v a l u e s w i t h and w i t hou t pump in g p ow e r and a t t h e s ame l o ad ra t i o s .

115
It is clear from the figure that for the same load ratio and excluding the pumping power consumption the cascade system still has higher COP than the R404A, about 40-50% higher.
As can be observed in Table 4, the condensing temperature of NH3 in the cascade system is 5-8K lower than in the R404A system. The supply water temperature was kept the same for both systems and the differ-ences between the two cases could be related to the size of heat ex-changer selected. Nevertheless, if both systems are compared for the same condensing temperature then the cascade system will still produce a much higher total COP than the R404A, as can be seen in Table 5 and in Figure 85.
If the CO2 trans-critical unit, presented in Figure 66, replaces the NH3 unit in Figure 52, then the experimental COP values of the CO2 trans-critical unit, presented in Figure 83, can be used to estimate the total COPs of the CO2 trans-critical system in Figure 64. Total COPs of the CO2 trans-critical, cascade and R404A systems (including pumping power consumption) are presented in Figure 86.
0,0
0,3
0,5
0,8
1,0
1,3
1,5
1,8
2,0
2,3
2,5
2,8
3,0
18 20 22 24 26 28 30Supply Water Temperature [°C]
CO
Pto
t [-]
Cascade
R404A
CO2 trans-crit.
Fi gu r e 86 : To t a l exp e r im en t a l COPs f o r NH3 /CO 2 c a s -c a d e , CO 2 t r an s - c r i t i c a l and R404A s y s t ems a t d i f f e r e n t s u pp l y wa t e r t empe r a t u r e v a l u e s .
As can be seen in the figure above, the total COP of the CO2 trans-critical system is very close to that of the R404A system. The total COP of the CO2 system is based on an arrangement which uses a CO2/CO2 cascade condenser in order to avoid potential oil return problems. If the cascade condenser is bypassed then the evaporation temperature of the high stage CO2 unit will be higher than -12.5°C, which has been used during testing of the trans-critical unit. An evaporation temperature of

116
-8°C is expected instead, which is the tank temperature in the NH3/CO2 cascade system experiments. This will improve the system’s COP. How-ever, when the CO2/CO2 cascade condenser is bypassed then an oil re-turn system must be implemented, as per the system suggested in Figure 65, which will consume some energy and therefore influence the sys-tem’s COP.
6 . 5 E x p e r i m e n t a l v e r s u s c a l c u l a t e d r e s u l t s In the following sections of this chapter calculations from the computer simulation models for the indirect, cascade and trans-critical systems are compared to the experimental results so the computer models are vali-dated and the deviation from the experimental values are discussed.
6 . 5 . 1 I n d i r e c t s y s t e m Calculations of the CO2 two-phase pressure drop use the Friedel model (Hewitt, 1998). The results produced by the model have been compared to experimental results from a test rig that examines the use of CO2 in a miniature ice rink application. The system in question is a CO2 indirect solution where CO2 is pumped in long pipes embedded in the rink’s concrete bed, as shown in the schematic diagram of the system in Figure 87. CO2 enters the pipes in a single phase and evaporates along the pipes’ length at a temperature of about -10°C. The circulation ratio has been changed and the pressure drop along the pipes has been measured. Three different pipes of ½” diameter (12.7 mm) and 60 m length, ½” di-ameter (12.7 mm) and 120 m length, and 3/8” diameter (9.5 mm) and 60 m length have been tested. The dimensions of the miniature ice rink are 5.5x10 m and the pipes are arranged in circuits as shown in Figure 87. The 60 m long pipe circuit has 5 U bends and the 120 m circuit has 11 U bends.
Fi gu r e 87 : S ch ema t i c d i a g ram o f t h e CO2 i c e r i nk i n -s t a l l a t i on

117
For the pressure drop calculations it is assumed that in half of the pipe the flow is single phase with inlet conditions and in the other half it is a two phase flow with the conditions of the exit flow. The total pressure drop is the sum of the two values. This assumption is justified by the ap-proximately linear relationship between the quality and the two phase pressure drop, which can be observed in the two following plots. As an example, for the case of a 14 mm diameter pipe, 1 m in length, with mass fluxes of 100, 500 and 1000 kg/m2-s at a temperature of -10°C, the pres-sure drop at different qualities is plotted in Figure 88 for Friedel’s two phase multiplier model.
0 0,2 0,4 0,6 0,80
1
2
3
4
5
6
7
8
9
0
0,02
0,04
0,06
0,08
0,1
0,12
0,14
0,16
x [-]
dP [k
Pa]
G=500 [kg/m2-s] (Left axes)
G=100 [kg/m2-s] (Right axes)
G=1000 [kg/m2-s] (Left axes) dP [k
Pa]
T=-10 [°C], d=14 mm
Fi gu r e 88 : Two pha s e p r e s s u r e d r op a t d i f f e r e n t qua l i t i e s u s i n g F r i e d e l ’ s tw o pha s e mu l t i p l i e r ( d=14 mm, L=1 m , T= -10°C , G=100 , 500 and 1000 kg/m2 - s ) .
As an example of the low temperature conditions the same plot is made in Figure 89 for a temperature of -30°C.
0 0,2 0,4 0,6 0,80
2
4
6
8
10
12
14
16
0
0,05
0,1
0,15
0,2
0,25
0,3
0,35
x [-]
dP [k
Pa]
G=500 [kg/m2-s] (Left axes)
G=100 [kg/m2-s] (Right axes)
G=1000 [kg/m2-s] (Left axes) dP [k
Pa]
T=-30 [°C], d=14 mm
Fi gu r e 89 : Two pha s e p r e s s u r e d r op a t d i f f e r e n t qua l i t i e s u s i n g F r i e d e l ’ s tw o pha s e mu l t i p l i e r ( d=14 mm, L=1 m , T= -30°C , G=100 , 500 and 1000 kg/m2 - s ) .

118
The above plots cover part of the range of conditions used in the theo-retical and experimental analysis performed in this thesis. In the minia-ture ice rink the heat flux tends to be rather constant along the pipes, so the vapour fraction increases linearly along the length as the thermal re-sistance at the inside of the tube is not dominating.
For circulation ratios between 1.1 and 2.6, the Friedel model produced values which are up to 100% higher than the measured pressure drop, al-though bends were not taken into account in the calculation model. Over-prediction increased with increasing circulation ratios over the in-vestigated range. This can be observed in Figure 90 which shows calcu-lated and measured pressure drop values for different tube sizes.
0
10
20
30
40
50
60
70
80
90
1 1,2 1,4 1,6 1,8 2 2,2 2,4 2,6 2,8 3
CR [-]
dP [k
Pa]
Calculated L=60m, d=9.5mm
Measured L=60m, d=9.5mm
Calculated L=120m, d=12.7mm
Measured L=120m, d=12.7mm
Calculated L=60m, d=12.7mm
Measured L=60m, d=12.7mm
Fi gu r e 90 : Ca l c u l a t e d ( u s i n g F r i e d e l mod e l ) and m ea s -u r e d p r e s su r e d r o p f o r d i f f e r e n t t u b e s i z e s .
A detailed description of the ice rink installation, along with tests and re-sults can be found in Shahzad (2006) which was also summarized in Nilsson et al. (2006).
The result suggests that the calculated pressure drop and pumping power will be higher than the actual values; on the other hand, there are some parameters which are not accounted for in the calculation model and contribute to increasing the actual pumping power.
For instance; specific requirements of the pump must be considered in the analysis in order to properly evaluate its power consumption. In or-der to avoid cavitation, the Net Positive Suction Head (NPSH) should be respected. NPSH does not have a unique value since the factors that are used to calculate it are dependent on the mass flow rate. If the flow rate increases, as is the case where all the valves are open, then the pres-

119
sure drop between the tank and the pump will increase and a higher NPSH will be required. The presence of the filter before the pump makes this factor even more critical. Therefore, a maximum flow orifice is usually installed in the pump in order to prevent the mass flow rate from reaching values where the NPSH exceeds the liquid head over the pump and causes cavitation (Stoecker, 1998). This resistance adds to the pressure drop of the system and is not accounted for in the calculations of the pressure drop in pipes.
In order to cool the pump down there must be a bypass line between the pump and the accumulation tank to ensure that a specified flow rate will pass through the pump, in case all the valves in the discharge pipe net-work are closed. The bypassed flow rate in the cascade system installa-tion is high, due to the fact that the pump is large for the application and a smaller pump was not available. This results in a high volume flow rate passing through the pump and the bypass line. Pump power has been measured during several tests and the electricity consumption was about 850 W, which accounts for 10-15% of the total electric power consump-tion of the compressors.
Considering these practical limitations, it is difficult to compare the measured power consumption with the calculations, although the meas-urements and observations from the system indicate that the pressure drop is very small in the distribution line and components.
6 . 5 . 2 C a s c a d e s y s t e m The computer simulation model presented in section 4.2.2 is used to simulate the performance of the system with some modifications to match the case of the laboratory installation. The system’s pressure boundaries, compressor speeds, and the set point for superheat in the freezers are input variables into the model, which are then inserted into the performance equations and efficiency curves to calculate energy con-sumption, cooling capacities, and the efficiencies of different compo-nents and the system as a whole. The model was used in calculations for the design and sizing of components, and while running the system the model is used to evaluate how much the real system’s COP deviates from the calculated/expected COP.
The CO2 compressor is a hermetic scroll with a volumetric efficiency of 90% which is assumed to be constant. The isentropic efficiency is corre-lated using an estimate from a similar compressor from the same manu-facturer; the highest isentropic efficiency for the compressor is 64% at a pressure ratio of 2.5. The volumetric and isentropic efficiencies of the

120
NH3 compressor are calculated using Pierre’s correlations (Granryd et al., 2005) equations 4-3 and 4-4.
Using the computer simulation model to calculate the COP for the con-ditions presented in Table 4 and Table 5 results in the higher values, plotted in Figure 91.
0,0
0,3
0,5
0,8
1,0
1,3
1,5
1,8
2,0
2,3
2,5
2,8
3,0
18 20 22 24 26 28 30Supply Water Temperature [°C]
CO
Ptot
[-]
Calculations
Experimental
Fi gu r e 91 : Ca l c u l a t e d and exp e r im en ta l COPs o f t h e NH 3 /CO 2 c a s c a d e a t d i f f e r e n t s upp l y wa t e r t empe r a -t u r e s .
As can be seen in the figure, the model slightly overestimates the ex-perimental COPs, by values of between 2 and 6%. This is more notice-able at low heat sink temperature where the actual performance of the NH3 compressor may not have been properly predicted by the correla-tions used.
The calculated COP values for the cascade system presented in section 5.2.1.1 are higher than the ones presented in the discussion above. The same model has been used for all calculations; however, when the model is run to be compared with the experimental results, the CO2 compressor curve fit from the manufacturer’s data is used instead of Brown’s correla-tion (Brown et al., 2002). Brown’s correlation results in a high isentropic efficiency, about 80%. Deviations between different runs of the com-puter simulation model are also related to the temperature boundaries of the system, especially at the medium temperature level, and the load ra-tios.
The point of the theoretical and experimental comparison is to verify the computer simulation model in order to be able to modify parameters and see their influence on the system’s COP. The closeness of the calculated

121
results to the experimental ones verifies the correctness and accuracy of the computer simulation model and confirms the values related to the cascade system presented in the theoretical analysis, in chapter 5.
With the CO2 temperature in the medium temperature cabinets around -8°C, the solenoid valve will be closed for rather long periods of time in order not to freeze the products in the cabinet. If the system is operated at a higher medium temperature then this will result in a higher evaporat-ing temperature for the NH3 compressor which will improve the sys-tem’s efficiency. According to the temperature profile of the medium temperature cabinet in Figure 21, in order to achieve a product tempera-ture of about +3°C the evaporation temperature of the refrigerant should not be higher than -3°C. With this as a new input into the com-puter simulation model the resulting total COPs are about 2% higher compared to the calculated COP (reference case) presented in Figure 91. If the low stage compressor had a higher isentropic efficiency, corre-sponding to Brown’s et al. correlation (Brown et al., 2002), then the total COP would be about 3% higher. When the total COP is calculated for a system that operates with a medium temperature of-3°C and higher isen-tropic efficiency for the low stage compressor, using Brown’s et al corre-lation (Brown et al., 2002), then at least a 5% improvement in total COP is expected in comparison to the reference case. Plots of the COPs for the modifications and the reference case can be observed in Figure 92.
0
0,25
0,5
0,75
1
1,25
1,5
1,75
2
2,25
2,5
2,75
3
18 20 22 24 26 28 30Supply Water Temperature [°C]
CO
Pto
t [-]
Brown+High med. temp.
Brown
High med. temp
Reference case
Fi gu r e 92 : NH 3 /CO 2 c a s c ad e t e s t COPs a t d i f f e r e n t s upp l y wa t e r t emp e ra tu r e s and t h e c a l c u l a t e d COPs f o r p o t e n t i a l s y s t em imp ro v em en t s .

122
6 . 5 . 3 T r a n s - c r i t i c a l s y s t e m The simulation model introduced in section 4.3.1 is used to generate the calculated COP of the CO2 trans-critical high stage unit. The calculations are made with no superheat, ignoring the pressure drop in the system’s components. Assumptions for the approach temperature difference, IHE effectiveness, optimum discharge pressure, intermediate pressure correlation, and compressor isentropic efficiency curve fit that are used for the medium temperature circuit calculations in the parallel system so-lution, shown in the schematic diagram in Figure 25, are also used for the COP calculations of the CO2 trans-critical unit. Input values for the calculation model are the CO2 evaporation temperature and the water supply temperature into the gas cooler. It has been assumed in the com-puter simulation model that 1 kW is lost as heat to the oil, which is taken from the experimental data. The resulting COPs are presented in the fol-lowing figure.
0,0
0,5
1,0
1,5
2,0
2,5
3,0
3,5
4,0
14 15 16 17 18 19 20 21 22 23 24 25 26 27 28 29 30 31
Supply Water Temperature [°C]
CO
P[-]
2-St. Simulation-Brown2-St. Exp.
Fi gu r e 93 : Ca l c u l a t e d and exp e r im en ta l COPs o f t h e CO 2 t r an s - c r i t i c a l un i t a t d i f f e r e n t s upp l y wa t e r t em -p e r a t u r e s .
The values presented in the figure shows that the calculated COP is 20-50% higher than the experimental. One of the main reasons for the de-viation is the high efficiency of the compressor in the computer simula-tion model. The correlation of Brown’s et al. (Brown et al., 2002) gives a value of around 85% for the calculated pressure ratios, while the installed compressor has a value of about 56% at the low stage compression and the high stage isentropic efficiency varies between 40-80% depending on the pressure ratio, see Figure 69.

123
Another reason for the deviation is the approach temperature difference in the intercooler, which is assumed to be 5K in the computer simulation model while at least 9K was measured in the experiments. The lower ap-proach temperature difference in the intercooler means that more heat is removed at the intermediate stage which implies that the capacity at the second stage compressor is lower. At the gas cooler exit, the experimen-tal approach temperature difference varied from one test to another, for instance; at a water supply temperature of 30°C the approach tempera-ture difference was as low as 1.5°C whereas in the 15°C case 8°C was measured. This may be due to the shape of the isobar where the heat re-jection takes place; it is more favourable for heat transfer in the case of 30°C.
Deviations between the measurements and calculations can also be at-tributed to the fact that the optimum discharge pressure correlation used in the model is developed based on the performance of a compressor which has an isentropic efficiency that follows Brown’s et al. correlation (Brown et al., 2002) and a fixed approach temperature difference of 5K. The optimum intermediate pressure is also based on the performance of a similar compressor, with an IHE that has 50% effectiveness and an approach temperature difference of 5K at the intercooler exit. The evaporation temperature used for the development of the intermediate optimum pressure correlation is -8°C, which is higher than the -12.5°C used in these calculations. Details of the development of the optimum discharge and intermediate pressure correlations used in the computer simulation model can be found in sections 4.3.3.1 and 4.3.3.2 respec-tively.
In order to verify the validity of the simulation model and compare it to the experimental data, the simulation model is modified using a curve fit of the isentropic efficiency of the second stage compression as a func-tion of the pressure ratio, the data for which is shown in Figure 69. The first stage compression had an isentropic efficiency value of about 55% at a pressure ratio of approximately 2.2, which was almost constant dur-ing all tests. The effectiveness of the installed IHE is found to be about 20%. For an evaporation temperature of -12.5°C, using the approach temperature differences from the experimental data for each supply wa-ter temperature case the “theoretical” optimum intermediate pressure for the installed system is calculated using the same approach as described in section 4.3.3.2. It should be pointed out that the isentropic efficiency of the first stage compression is kept constant in the simulation in the pres-sure ratio range of 1.3 to 2.2. Since the second stage compression effi-ciency increases with increasing the pressure ratio, in the tested operating range, then, by having a lower pressure ratio in the first stage, the com-pressor power consumption will be reduced.

124
Using the experimental data as an input into the modified computer simulation model results in COP values which equal the experimental re-sults at a water supply temperature of 30°C, whereas it over-predicts the COP by 15% at a value of 15°C. This can be observed in the following figure.
0,0
0,5
1,0
1,5
2,0
2,5
3,0
3,5
4,0
14 16 18 20 22 24 26 28 30Supply Water Temperature [°C]
CO
P[-]
2-St. Simulation-Exp. Input2-St. Exp.
Fi gu r e 94 : Ca l c u l a t e d COPs o f t h e mod i f i e d c ompu t e r s imu l a t i on mod e l and exp e r im en t a l COP va l u e s o f t h e CO 2 t r an s - c r i t i c a l un i t a t d i f f e r e n t s upp l y wa t e r t em -p e r a t u r e s .
As mentioned earlier, the installed compressor is designed to operate at a highest evaporation temperature of -20°C. Therefore, the compressor may perform better at higher pressure ratios than those tested. A single-stage compressor with high isentropic efficiency may result in a higher system COP than when using low efficiency two-stage compression with heat rejection at the intermediate pressure.
The same manufacturer of the installed two-stage compressor, Dorin, supplies single-stage compressors for sub- and trans-critical operations. The compressors that are designed to operate sub-critically are able to operate in the trans-critical region but in a lower range than the ones that are designed to operate trans-critically. Two compressors which are able to cover the required cooling capacity range are selected; the trans-critical TCS373-D and the sub-critical SCS362 (Dorin, 2007).
From the compressor manufacturer’s data (Dorin, 2007), the overall effi-ciencies for both compressors are calculated and plotted in the following figure.

125
ηtcs=-4,3•PR2+29,2•PR+17,3
ηscs=-6,3•PR2+39,2•PR+1,3
0
10
20
30
40
50
60
70
80
90
100
0 0,5 1 1,5 2 2,5 3 3,5 4 4,5 5 5,5Pressure ratio [-]
Ove
rall
Effi
cien
cy [%
]
SCS 362 Sub-crit.TCS373-D Trans-crit.Poly. (TCS373-D Trans-crit.)Poly. (SCS 362 Sub-crit.)
Fi gu r e 95 : Ov e ra l l e f f i c i e n c i e s a t d i f f e r e n t p r e s s u r e r a t i o s f o r t h e s i n g l e - s t a g e c omp r e s s o r SCS362 and TCS373 -D f r om Dor in (Do r i n , 2007) .
The overall efficiency is calculated using the compressor’s input power compared to isentropic compression. This takes into account all losses in the compression process. With single stage compression the lowest pres-sure ratio at 15°C is 2.3, therefore, as can be seen in the above figure, both compressors can be used for the required operation range, which is marked by the ellipse in the above figure.
The calculation model in section 4.3.1 is used to calculate the perform-ance of the single-stage compressor. Assumptions regarding difference in approach temperature, IHE effectiveness, and optimum discharge pres-sure, which are used to calculate the COP of the medium temperature circuit in the parallel system solution, as shown in the schematic diagram in Figure 25, are also used for these calculations. The performance of the compressor is simulated in three different ways; using Brown’s et al. cor-relation (Brown et al., 2002) and using the curve fit of the two single-stage Dorin compressors selected, presented in the figure above. The re-sulting COPs are presented in the following figure, with the single- and two-stage experimental COPs and the calculated two-stage COP also presented in the figure for comparison purposes.
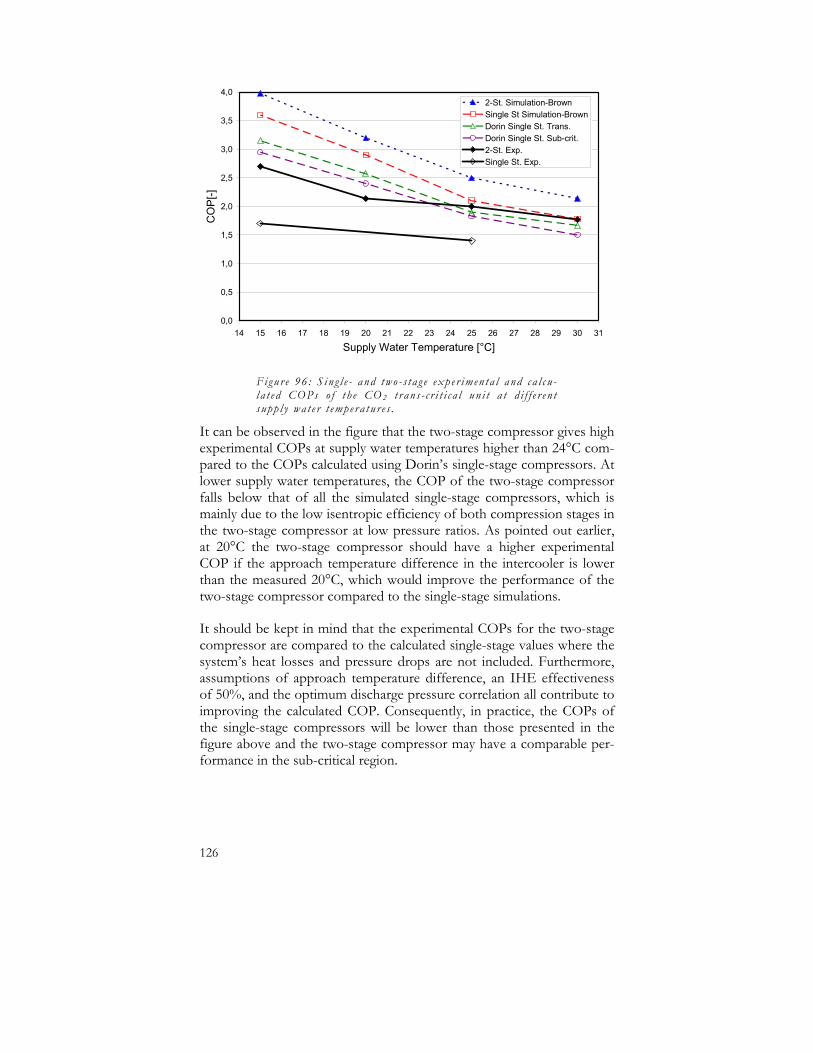
126
0,0
0,5
1,0
1,5
2,0
2,5
3,0
3,5
4,0
14 15 16 17 18 19 20 21 22 23 24 25 26 27 28 29 30 31
Supply Water Temperature [°C]
CO
P[-]
2-St. Simulation-BrownSingle St Simulation-BrownDorin Single St. Trans.Dorin Single St. Sub-crit.2-St. Exp.Single St. Exp.
Fi gu r e 96 : S i n g l e - and two - s t a g e exp e r imen t a l and c a l c u -l a t e d COPs o f t h e CO 2 t r an s - c r i t i c a l un i t a t d i f f e r e n t s u pp l y wa t e r t empe r a t u r e s .
It can be observed in the figure that the two-stage compressor gives high experimental COPs at supply water temperatures higher than 24°C com-pared to the COPs calculated using Dorin’s single-stage compressors. At lower supply water temperatures, the COP of the two-stage compressor falls below that of all the simulated single-stage compressors, which is mainly due to the low isentropic efficiency of both compression stages in the two-stage compressor at low pressure ratios. As pointed out earlier, at 20°C the two-stage compressor should have a higher experimental COP if the approach temperature difference in the intercooler is lower than the measured 20°C, which would improve the performance of the two-stage compressor compared to the single-stage simulations.
It should be kept in mind that the experimental COPs for the two-stage compressor are compared to the calculated single-stage values where the system’s heat losses and pressure drops are not included. Furthermore, assumptions of approach temperature difference, an IHE effectiveness of 50%, and the optimum discharge pressure correlation all contribute to improving the calculated COP. Consequently, in practice, the COPs of the single-stage compressors will be lower than those presented in the figure above and the two-stage compressor may have a comparable per-formance in the sub-critical region.

127
6 . 6 C o n c l u s i o n s An NH3/CO2 cascade system for supermarket refrigeration has been built in a laboratory environment. It replicates a medium size supermar-ket in Sweden with similar temperature boundaries but lower cooling ca-pacities, while keeping load ratios comparable. The experimental test rig allows several variations in the system whereby different system layouts and parameters can be tested in order to find an optimum system design.
The circulation ratio in the simulator has been changed and its influence on heat transfer has been evaluated. Increasing the mass flow of refriger-ant to have circulation ratios higher than one did not have a significant improvement on heat transfer. Since no optimum circulation ratio was found then it is recommended to keep this as low as possible in order to ensure complete evaporation at the highest expected load.
Three cascade condenser arrangements were tested; thermosyhon, hot gas de-superheating, and forced condensation. Both thermosyphon and hot gas de-superheating arrangements had good and comparable heat transfer in the cascade condenser and there was not a noticeable differ-ence in system stability between the two cases. However, in the case of hot gas de-superheating, the load ratio, compressor discharge tempera-ture, On-Off compressor operation, cooling load control, and load varia-tions at both temperature levels are factors that will strongly influence the CO2 conditions at the inlet of the cascade condenser and may result in a different performance than that which was produced by the labora-tory tests. However, the thermosyphon solution is less sensitive to the above factors. Thus, the experimental results of this solution can gener-ally be considered more applicable to other installations.
The measurements and experiences in running the display cabinets with the temperature and pressure based expansion valve controllers indicated a more stable operation in case of the pressure based controller. The controller successfully kept the superheat value within the set range, and while it demonstrated lower stability at low superheat set values it was still not as unstable as in the case of the temperature based controller.
The cascade system produced relatively good COP values. Compared to the R404A system installed in the same laboratory environment, total COPs were 50 to 60% higher for the cascade system.
The computer simulation model of the cascade system slightly over pre-dicts the experimental total COP by values of between 2 and 6%. Using the computer simulation model to test the influence of system modifica-tions/enhancements on the total COP showed that at least 5% im-provements on the calculated COP can be achieved.

128
From a technical point of view, the CO2 part of the cascade system proved easy to handle and no problems have been faced in finding suit-able components.
A two-stage CO2 trans-critical unit for supermarket refrigeration has been built. This unit can replace the NH3 unit in the cascade system so that the system operates using only CO2 as the working fluid. The meas-ured COPs for the CO2 trans-critical unit were much lower than those for the NH3 unit. However, when compared to the installed R404A in-stalled system the COPs were comparable over the tested supply water temperature range of 20-30°C.
The computer simulation model used for calculating the COP of the trans-critical system has been verified against the experimental results and a reasonable degree of agreement was achieved, with an observed over prediction of up to 15%.
In order to investigate the performance of a single-stage CO2 compres-sor the installed two-stage compressor has been modified for single stage use and subsequently tested. The results showed that the two-stage com-pressor resulted in an experimental COP about 50% higher. These large differences in COP can be related to the fact that the compressor is not specially designed to run as a single-stage unit.
Comparing the experimental results of the two-stage CO2 compressor with simulations of the single-stage compressor reveals higher COPs for the two-stage system for supply water temperatures higher than 24°C. The analysis of the results suggests that in practice the two-stage com-pressor will offer better performance than the single-stage solution in sub-critical conditions as well as in the trans-critical region.
Several modifications can be applied to the CO2 trans-critical unit which was tested. For instance, a compressor which is specially designed for the tested operating range should have a higher efficiency. Moreover, be-cause the intercooler had high approach temperature difference this sug-gests that it was undersized. If the trans-critical unit would be fixed on top of the tank, without the CO2/CO2 cascade condenser, then the evaporation temperature of the high stage unit will be higher than that tested, which will improve the system’s COP. On the other hand, an oil return system, which will consume some energy, must be considered.
Among the systems tested, the NH3/CO2 cascade solution produced the highest COPs. The CO2 trans-critical and R404A indirect systems pro-duced comparable COP values. Several modifications and improvements can be applied to the trans-critical system for which COP values higher than the R404A indirect system can be expected.

129
7 Safety aspects
7 . 1 I n t r o d u c t i o n Safety is a major concern in any refrigeration application and it is the main reason why synthetic refrigerants dominated the refrigeration in-dustry for several decades. In the specific application of supermarket re-frigeration, safety is more carefully considered because of the large num-ber of people that might be affected in the case of leakage.
Although considerable research has been devoted to development and performance analysis of CO2 refrigeration systems in commercial appli-cations, rather less attention has been paid to the detailed analysis of the safety aspects in this context. Some research work has been carried out through the RACE project for mobile air conditioning applications (Amin, Dienhart, & Wertenbach, 1999). These investigations focused on concentration levels in the passengers’ compartment in the case of leak-age and on the level of explosive energy in the case of component fail-ure.
7 . 2 S a f e t y c h a r a c t e r i s t i c s o f C O 2 A common issue for CO2 systems in supermarkets is the high level of pressure at standstill. Should the plant be stopped for maintenance, component failure, a power cut or any other reason, then the refrigerant inside the plant will start to gain heat from the environment and conse-quently the pressure inside the plant will increase. Components in the in-direct system and the low temperature level of the cascade and trans-critical systems will not stand high pressure as they are usually designed for a maximum pressure of 40 bars.
The most common and easiest protective technique is to release some of the CO2 charge from the plant when the pressure reaches a certain preset value. Consequently, the pressure and temperature of the CO2 in the plant will be reduced. If the plant remains at standstill, then the process will be repeated and subsequently the plant must be charged again to compensate for the lost CO2 charge. The fact that CO2 is inexpensive favours this solution over other more expensive ones such as an auxiliary cooling unit or a thermal storage vessel. The position of the relief valve

130
must be carefully selected so that liquid CO2 can not pass through it, otherwise solid CO2 (dry ice) will be formed which might block the valve. Dry ice will be formed when the pressure is reduced below the tri-ple point pressure, 5.2 bars, as clarified in Figure 97.
On the other hand, the formation of dry ice can be considered advanta-geous when leakage occurs in other parts of the system, with the excep-tion of the relief valves. The increase in concentration rate in the space of the leak will be lower than in the case of a vapour leak owing to the fact that the dry ice formed will delay the mixing of CO2 and air by the time that it takes the dry ice to sublime. Moreover, the formation of dry ice at the leakage point might block or limit the flow.
Fi gu r e 97 : CO 2 Lo g P -h d ia g r am
Supermarket refrigeration is a relatively large-scale application that re-quires long distribution lines and an accumulation tank for solutions where a pump is used. This results in a large system volume and conse-quently a considerable refrigerant charge. In the case of sudden leakage, the concentration levels of the refrigerant might be high and the number of people in the shopping area exposed to it could be large. Therefore, concern over safety is a major factor in the choice of the type of system and refrigerant to be used.
CO2 is a relatively safe refrigerant compared to natural and artificial working fluids. It is classified in group A1, according to ASHRAE Handbook-Fundamentals (ASHRAE, 2005). This is the group that con-tains the refrigerants that are least hazardous and without an identified toxicity at concentrations below 400 PPM. Naturally, CO2 exists in the atmosphere at concentrations around 350 PPM and for concentrations between 300 and 600 PPM people do not usually notice the difference.

131
According to ASHRAE (ASHRAE, 1989), a CO2 concentration of 1000 PPM is the recommended limit to ensure the comfort for the occupants, whereby in a CO2 controlled ventilation system fresh air should be sup-plied so that the CO2 concentration level will not exceed this value. This is the case in an application where a small CO2 generation rate is ex-pected due to different human activities. However, in the case of the high leakage rate that might occur in supermarket spaces or in the ma-chine room, the consequences of serious health hazards, such as suffoca-tion, must be taken into account.
The following table is a list of selected concentration levels of CO2 and the expected effects on human health.
Tab l e 6 : Di f f e r e n t Con c en t ra t i o n s o f CO 2 and t h e ex -p e c t e d h e a t h c on s equ en c e s
PPM Effects on health Reference
350 Normal value in the atmosphere (Bearg, 1993)
1,000 Recommended not to be exceeded for human com-fort
(ASHRAE, 1989)
5,000(1) TLV-TWA(2) (Rieberer, 1998)
20,000 Can affect the respiration function and cause excita-tion followed by depression of the central nervous
system. 50% increase in breathing rate
(Berghmans & Duprez, 1999)
30,000(3) 100% increase in breathing rate after short time ex-posure
(Amin et al., 1999)
50,000 (40,000)(4) IDLH(5) value (Rieberer, 1998)
Lowest lethal concentration (Berghmans & Duprez, 1999) 100,000
Few minutes of exposure produces unconsciousness (Hunter, 1975)
200,000 Death accidents have been reported (Berghmans & Duprez, 1999)
300,000 Quickly results in an unconsciousness and convul-sions
(Berghmans & Duprez, 1999)
(1) The Occupational Safety and Health Administration (OSHA) revised Permissible Expo-sure Limit (PEL): Time-Weighted Average (TWA) concentration that must not be ex-ceeded during any 8 hour per day 40 hour per week
(2) Threshold Limit Value (TLV): TWA concentration to which one may be repeatedly ex-posed for 8 hours per day 40 hours per week without adverse effect.
(3) Short Term Exposure Limit (STEL): a 15-minute TWA exposure that should not be ex-ceeded at any time during a workday
(4) National Institute for Occupational Safety and Health (NIOSH) revised Immediately Dangerous to Life or Health (IDLH) value
(5) IDLH: maximum level for which one could escape within 30 minutes without any es-cape-impairing symptoms or any irreversible health effects.

132
CO2 has one main drawback in not being self-alarming by lacking a dis-tinctive odour or colour. This implies that facilities where CO2 may leak must be equipped with sensors that trigger an alarm when the concentra-tion level exceeds 5000 PPM, above which CO2 concentration may have an adverse effect on health. CO2 is heavier than air and therefore will collect close to the floor when it leaks; thus, the sensors and ventilators in the space where CO2 might leak should be located close to the floor.
Being inexpensive and relatively safe allows the use of large charges of refrigerant and provides flexibility in the design of the system. Hence, flooded evaporators which require large refrigerant charges can be used at the intermediate and low temperature levels. Nevertheless, the CO2 charge is not expected to be very high compared to other refrigerants due to the fact that the compact size of the CO2 components and deliv-ery lines will help to minimise the charge. Based on experiences from several installations, an estimate of how much CO2 charge will be needed in a supermarket application can be found in Heinbokel (2001); about 5.25 and 1.7 kg/kW for secondary and cascade systems respectively. Of course this should be considered a rough estimate because it will be dif-ferent from one system solution and installation to another.
In case of component rupture, the fact that CO2 has relatively high oper-ating pressure compared to other refrigerants raises questions concerning the hazards of blast effects, shocks and flying fragments. As described and studied by Pettersen et al. (2004), the extent of potential damage can firstly be characterized by the explosive energy, which can be estimated as the energy released by the expansion of the refrigerant contained in a component or system. Secondly, is the possible occurrence of a Boiling Liquid Expanding Vapour Explosion (BLEVE) which may create a more severe blast effect than by ordinary refrigerant expansion. BLEVE may occur when a vessel containing a pressurised saturated liquid is rapidly depressurised, e.g. due to a crack or initial rupture. The sudden depres-surisation leads to explosive vaporisation and a transient overpressure peak that may burst the vessel.
As Pettersen et al. (2004) reported, the explosive energy per kg for CO2 is high compared to R22. However, when the comparison is made for a ductless residential air conditioning system with equal cooling or heating capacities and similar efficiencies then owing to the smaller volume and refrigerant charge of the CO2 system the actual explosive energies are in the same range.
In the supermarket system the expected explosive energy may be higher than in cases with conventional systems. This is due to the presence of an accumulation tank in most CO2 system solutions which increases the
133
system’s charge and volume. However, explosive energy is more of a concern with systems where the occupants are close to the system’s components; such as mobile air conditioning and residential air condi-tioning. In supermarket systems the high pressure components are in the machine room and the distribution lines are usually kept at a distance from the consumers.
Regarding the possible occurrence of BLEVE in CO2 vessels, Pettersen (2004) reports that the maximum observed pressure spikes in the tests were only a few bars above the initial pressure. Therefore, it was con-cluded that there was no reason to expect BLEVE in CO2 system accu-mulators or receivers.
In order to evaluate the risks attached to a leakage accident in a super-market the possible concentration levels in the supermarket’s shopping area and machine room that result from different accident scenarios have been calculated for a selected real-life example. The theoretical analysis will show the limits for the highest concentration levels that could be reached in the supermarket.
7 . 3 T h e c a s e s t u d y The example of a supermarket in the small to medium size category (relative to the CO2 installations in Sweden) was selected as the basis for the calculations. The dimensions of the shopping area are around 40x30x5 m and the machine room’s dimensions are 10x10x3 m. The ca-pacity of the plant is around 30 kW at the low temperature level and 75 kW at the medium temperature level. CO2 is used as a secondary work-ing fluid at the low temperature level in an indirect system, and the CO2 charge in this installation is assumed to be 100 kg. These parameters are similar to a supermarket in the Hedemora area, about 200 km North West of Stockholm.
The concentration of CO2 is calculated in different accident scenarios, which differ depending on two main parameters: the position of the leak and the flow rate of the leaking CO2.
The two main places in the supermarket where leakage could occur are the machine room and the shopping area. A risk analysis is performed for these two areas. It is assumed that the refrigerant leaks at different flow rates, which starts with the hypothetical case of the refrigerant es-caping instantaneously and totally from the plant, resulting in the highest concentration possible. The lowest flow rate used in the calculations was based on a leakage time of two hours.

134
It is assumed in the calculations that good mixing occurs and that the re-frigerant leaks with a constant flow rate until all the charge has escaped from the plant. A value of 365 PPM was used for the CO2 concentration in the fresh air supply and as the initial value in the room.
7 . 4 R i s k a n a l y s i s i n t h e s h o p p i n g a r e a Based on the dimensions of the selected supermarket, if the CO2 is as-sumed to escape completely within the shopping area in a very short time, then the maximum concentration of CO2 will be around 9,270 PPM. This concentration level far exceeds the accepted levels for the oc-cupants of non-industrial facilities, which has a limit of 1000 PPM, as shown in Table 6. Until 1989 the Occupational Safety and Health Ad-ministration (OSHA) set a concentration value of 10,000 PPM as the Permissible Exposure Limit (PEL). Most of the agencies, including the National Institute for Occupational Safety and Health (NIOSH), The American Conference of Governmental Industrial Hygienists (ACGIH), and The MAK-commission in Germany, that set the occupational safety standards used the TLV-TWA level of 5000 PPM. The TLV-TWA value is usually combined with the Short Term Exposure Limit (STEL) value of 30,000 PPM, which is much higher than the highest possible concen-tration in the shopping area (9,270 PPM). Accordingly, a leakage accident within the shopping area is not expected to result in any health hazard to the occupants.
When the fresh air supply is taken into account, the CO2 concentration in the space will drop after one hour of ventilation according to equation 7-1 (Peterson, 1986), which is represented by the curve in Figure 98. hC1 is the concentration after one hour (PPM), maxC is the maximum initial concentration (PPM) and N is the rate of air change (1/h).
)N(
max
h expCC −=1 7-1

135
0 0,5 1 1,5 2 2,5 3 3,5 4 4,5 50
0,2
0,4
0,6
0,8
1
N [1/h]
C1h
/Cm
ax [-
]
F i g u r e 98 : The i n f l u e n c e o f t h e v e n t i l a t i o n r a t e o n c o n -c e n t r a t i on l e v e l s
For the shopping area, ASHRAE Standard 62 (1989) recommends about 0.5 air changes per hour (ACH), which results in a reduction of ap-proximately 40% in the initial CO2 concentration after one hour of venti-lation, which can be seen in the figure above.
If the CO2 charge is assumed to escape with a constant flow rate then the concentration, in kg/m3, is calculated as a function of time according to equation 7-2 (Peterson, 1986) and the results, in PPM, are plotted in Figure 99 for the shopping area. It was assumed that the CO2 charge es-capes with a constant flow rate for different durations; 15 minutes, 30 minutes, 1 hour, and 2 hours. CO2 produced by the occupants was ig-nored in the calculations.
)t.N(air
COair
CO)m/kg( exp.CC
VNmC
VNmC −
⎭⎬⎫
⎩⎨⎧ −+
×−+
×= 0
223
&& 7-2
Where 2COm& is the CO2 mass flow rate (kg/h), V is the volume of the space (m3), airC is the CO2 concentration in fresh air (kg/m3), 0C is the initial concentration (kg/m3) and t is the time in hours.
In ventilation which controls CO2, the ventilation rate in the shopping area must be increased when the concentration reaches a value close to 1000 PPM, in order to bring the CO2 concentration down to a normal level. In these calculations the ventilation system was assumed to have constant value of 0.5 ACH regardless of the CO2 concentration level.

136
Fi gu r e 99 : CO 2 c on c e n t ra t i o n a ga i n s t t ime in t h e s h op -p i n g a r e a f o r l e aka g e du ra t i on s o f 15 m inu t e s , 30 m in -u t e s , 1 h ou r , and 2 h ou r s .
The results in Figure 99 show that the CO2 concentration increases sharply during the assumed leakage times. This is due to the fact that the CO2 leakage rate is much higher than the rate at which CO2 contami-nated air is replaced by fresh air supplied through ventilation. At the end of the leakage period (after 15, 30, 60, and 120 minutes) the CO2 concen-tration reaches a peak because at this point the CO2 charge has escaped completely from the plant into the shopping area. Afterward, the CO2 concentration decreases in an exponential manner due to the effect of ventilation which replaces the CO2 contaminated air with fresh air.
Looking at the accident scenario with the highest peak concentration, almost 9000 PPM for a leakage duration of 15 minutes, it is evident that the CO2 concentration level in the shopping area does not engender health risks to the customers and the workers in the supermarket. How-ever, an alarm is necessary to warn of a leakage problem so that proper procedures can be followed for occupants’ safety and proper mainte-nance can be performed.
7 . 5 R i s k a n a l y s i s i n t h e m a c h i n e r o o m If the same scenario, i.e. the charge escapes completely and instantane-ously, is applied to the machine room then the concentration will be around 185,300 PPM. It is very high if compared to the value of 200,000 PPM, listed in Table 6 at which death accidents have been reported.
137
Therefore, protective measures such as a proper alarm system based on CO2 detectors and an efficient CO2-controlled ventilation system must be implemented.
According to Swedish design codes (SvenskKylnorm, 2000), a minimum ventilation rate of 2 ACH is recommended in the machine room. This value results in an 86% drop in the initial CO2 concentration after one hour of fresh air supply, clarified in Figure 98.
The ventilation system in the machine room must be a CO2 controlled one; and, according to Swedish safety codes, when the concentration level in the machine room reaches the TLV, or 5000 PPM, the fresh air supply flow rate (m3/h) must be increased according to the following formula:
3 250 MV =& 7-3
Where M is the refrigerant charge (kg). The increase in the rate of venti-lation is accompanied by a low-alert alarm system, both visual and acous-tic, in the machine room and also in a place visible from outside the room. When the concentration level reaches 50,000 PPM (the IDLH value) a high-alert alarm system is triggered and the workers must leave the machine room immediately (SvenskKylnorm, 2000).
Figure 100 indicates that for a leakage duration of 2 hours there are no health consequences for the workers, since the IDLH value is not reached (the maximum value is approximately 26,150 PPM). The con-centration curve levels off close to the value of 25,000 PPM due to the fact that the extraction rate of CO2 is almost equal to the leakage rate. In the case of a leakage time of 1 hour, the highest value reached is ap-proximately 50,500 PPM and the high-alert alarm will be triggered for only 4 minutes, when the IDLH value is exceeded.

138
0 0,5 1 1,5 2 2,5 30
20000
40000
60000
80000
100000
120000
140000
Time [h]
C [P
PM
]
30 minutes1 hour
15 minutes
2 hours
Fi gu r e 100 : CO 2 c o n c en t ra t i o n a ga i n s t t ime i n t h e ma -c h i n e r o om f o r l e aka g e du ra t i on s o f 15 m inu t e s , 30 m in -u t e s , 1 h ou r , and 2 h ou r s .
Concern is high in the case of the whole CO2 charge leaking over a short time period, as for a leakage time of 30 minutes a value of 86,000 PPM is reached. According to the settings of the alarm system installed in the machine room, the low-alert alarm will be triggered less than one minute after leak starts, and will last for almost 12 minutes until the high-alert alarm is triggered. This means that the workers have at least 12 minutes to leave the room before critical CO2 concentration levels are reached.
In case of a leakage time of 15 minutes, the low-alert alarm will be acti-vated for at least 5 minutes before the high-alert alarm will start. This shortens the length of time available to escape from the machine room, but it should be also noted that the period when the IDLH value is ex-ceeded is 25 minutes, which means that the exposure time for the high concentration levels of CO2 is also short.
The high concentration levels reached in the machine room imply that specific safety procedures must be implemented. The fact that CO2 is a colourless, odourless gas means that a proper detection system must be placed to determine the increase in gas concentration. Figure 101 clarifies the safety equipment that should be in place in the machine room, and as is also shown in the figure, acoustic and flashing light alarm devices must be provided in a place which is visible from both inside and outside the room. The figure also shows that both the detectors and exhaust fan are placed at a low level, close to the floor.

139
Fi gu r e 101 : S imp l i f i e d d raw in g o f t h e ma ch in e r o om and t h e r e qu i r e d s a f e t y e qu ipmen t/d e v i c e s
7 . 6 D i s c u s s i o n o f t h e a s s u m p t i o n s a n d r e s u l t s
The results presented in this chapter are based on simplified assumptions and aimed to give an indication of the situation in practice. It was as-sumed that the refrigerant leaks with a constant flow rate, which is not the case in practice, where the flow rate is expected to be higher in the first stages of the leak and subsequently decay due to the reduction of pressure in the system.
The refrigerant was assumed to escape completely from the system, but it should be taken into account that when the pressure in the system drops to 5.2 bars then dry ice will form inside the system and will slowly sublimate. The same will occur to liquid CO2 leaking from the system into the surroundings. Furthermore, the formation of dry ice at the point of leakage may reduce the leakage flow rate and could block the leakage point. When the pressure inside the system drops to ambient pressure, part of the refrigerant will be left inside the system’s components and distribution lines.
The longest leakage time of two hours, used in the calculations, is con-sidered to be very short. In practice complete leakage rarely occurs and if it does happen then it would take place over several hours. Therefore, this will contribute to a slower increase in concentration levels.
Due to the fact that CO2 is 1.5 times heavier than air means that it will tend to pool; thus, the distribution of CO2 concentration in air will not
Acoustic alarm
Flashing light
Exhaust fan CO2 detector
Refrigeration unit

140
be homogenous as is assumed in these calculations. The concentration values presented in this study do not necessarily present what a human would be subject to because the concentration at an average human height might be higher or lower than the value calculated using an as-sumption of good mixing. The fact that the sensor must be installed at a level close to the floor means that it will measure higher concentrations than at an average human height. This will give an earlier warning and longer escape time than the values resulting from the homogenous con-centration assumption.
Based on the above discussion, it can be concluded that this model over-predicts the average CO2 concentration in the machine room and the shopping area. It also over-predicts the rate of concentration increase and therefore the escape time would be much longer than that used in the calculations.
Moreover, the analysis in this chapter does not take into account specific cases of direct and close contact with a leaking CO2 stream which could happen for technicians in the machine room. This means that the person will be exposed to a very high concentration for very short time which may result in a loss of consciousness. Skin burns will probably not occur due to the fact that CO2 does not evaporate at atmospheric pressure (Pettersen et al., 2004).
7 . 7 C o n c l u s i o n s From the analysis of the results of the calculations, it is clear that using CO2 in supermarkets refrigeration does not engender exceptional health risks for the customers and the workers in the shopping area. Neverthe-less, it is recommended that CO2 detectors are installed in the shopping area, especially in places where leakages are possible and high local con-centrations are expected in the case of a leak. It must be pointed out that even if the CO2 charge and the size of the supermarket’s shopping area and machine room are identical to the modelled example, the case of every supermarket must be considered individually, taking into consid-eration geometrical variations and the location of the distribution lines.
Evidently, safety requirements such as proper ventilation and an alarm system are essential in the machine room.

141
8 Conclusions and suggestions for future work
8 . 1 C o n c l u s i o n s The application of CO2 in supermarkets refrigeration has been investi-gated. The following conclusions can be drawn with relevance to the theoretical analysis, experimental work and general remarks on the whole study.
8 . 1 . 1 T h e o r e t i c a l a n a l y s i s Detailed computer models have been developed to simulate the per-formance of supermarket refrigeration systems using CO2 indirect, NH3/CO2 cascade, trans-critical, and DX R404A solutions. The cascade and trans-critical models have been compared to experimental results and these showed reasonable agreement.
A CO2 indirect system using NH3 or propane as the primary refrigerant has energy consumption comparable to that of DX R404A, while in an indirect R404A/CO2 system the energy consumption will be slightly higher.
The results from the computer simulations show that, from an energy consumption point of view, the trans-critical centralized and NH3/CO2 cascade system solutions that were studied are good for low ambient temperatures, whereas the cascade system demonstrates the highest COPs for high ambient temperatures. Therefore, both systems proved to be efficient alternatives to the DX R404A system for supermarket refrig-eration.
8 . 1 . 2 E x p e r i m e n t a l a n a l y s i s An NH3/CO2 cascade refrigeration system replicating that of a medium size supermarket in Sweden has been built in a laboratory environment. Different system variations have been tested and the performance of dif-

142
ferent components has been evaluated, thereby the system has been op-timized for its best possible performance.
In the same laboratory environment, comparing the cascade system to an R404A one with a secondary loop at the medium temperature level, the total COP was up to 60% higher for the cascade solution. The computer simulation model of the cascade system predicts the total COP reasona-bly well.
Finally, a two-stage CO2 trans-critical unit for supermarket refrigeration has been built. The unit can replace the NH3 unit in the cascade system so the system will operate using CO2 as the sole working fluid. The measured COPs of the CO2 trans-critical unit were much lower than those of the NH3. However, when compared to the R404A system the COPs were comparable over the tested supply water temperature range of the condenser, which was between 20-30°C. The computer simulation model of the trans-critical system predicts the experimental COPs rea-sonably well.
The results of the experimental and computer simulation models show that the NH3/CO2 cascade system is a more efficient solution for su-permarket refrigeration than the conventional ones analyzed. On the other hand, the CO2 trans-critical solutions have efficiencies which are comparable to the conventional systems analyzed, with the potential for improvements in the trans-critical systems.
8 . 1 . 3 G e n e r a l The studies reported in this thesis prove that CO2 systems investigated are efficient solutions for supermarket refrigeration. Being natural, CO2 does not present unforeseen threats to the environment and it is rela-tively safe. From a technical point of view, the CO2 systems tested proved to be easy to handle and no problems were faced in finding suit-able components for the cascade system. However, cheaper components with a wider operating range are needed for the trans-critical system.
8 . 2 S u g g e s t i o n s f o r f u t u r e w o r k The computer simulation models used to evaluate the performance of CO2 systems can be refined by including detailed modelling of heat ex-changers, especially the gas cooler/condenser. CO2 usually has a lower approach temperature difference in the gas cooler which may improve the system’s COP compared to other systems.
143
It is important to investigate different solutions with heat recovery sys-tems. CO2 Trans-critical systems have favourable heat rejection charac-teristics and can be used efficiently when hot water heating is required. It is also important to examine different trans-critical arrangements which incorporate solutions for oil return. When available, data for the two-stage trans-critical CO2 compressor, which covers the required operating range for supermarket applications should be added to the model.
Modifications to the centralized trans-critical system that were theoreti-cally evaluated can be applied to the NH3/CO2 cascade system. Results for this should be calculated theoretically and verified experimentally.
The centralized trans-critical solution should be evaluated experimentally in a similar way to that in which the cascade system has been tested. The performance of components and the control of the system should be in-vestigated as well as the overall system performance, which should be compared to the calculations from the computer simulation models.
Oil return to the high stage compressor in the centralized system seems to be a major concern in the application of this system solution. A satis-factory solution of this problem would make it possible to use a low pressure receiver and pump circulation at the low temperature level.
Generally, small CO2 pumps are not available which either does not permit the use of a pumped CO2 solution in small capacity applications or it results in a higher pumping power consumption than necessary. Moreover, a two-stage CO2 compressor which is specially designed to operate in the range of the centralized system solution is needed.
The cost of different CO2 systems found in the literature varies consid-erably. A comparative cost analysis of the CO2 systems needs to be con-ducted where the main additional expected costs can be highlighted. With the exception of the accumulation tank there are no technical rea-sons why CO2 components should be much more expensive than for other refrigerants. A proper cost analysis will help to introduce CO2 sys-tems into the market as inexpensive and efficient solutions.

144
9 Nomenclatures
Roman
A Pipe cross section area (m2)
ACH Air changes per hour (1/hour)
BLEVE Boiling Liquid Expanding Vapour Explosions
C Concentration (PPM)
0C Initial concentration (PPM)
hC1 Concentration after 1 hour (PPM)
airC Concentration in fresh air (PPM)
)/( 3mkgC Concentration (kg/m3)
maxC Maximum (initial) concentration (PPM)
Cond Condenser
COP Coefficient of performance
Cp Specific heat (kJ/kg-K)
CR Circulation ratio (-)
d Pipe diameter (m)
fgh Latent heat of vaporization (kJ/kg)
dP Pressure drop (kPa)
dT Temperature drop (°C)

145
DX Direct expansion
EES Engineering Equations Solver
f Friction factor (-)
G Mass flux (kg/m2-s)
GWP Global Warming Potential
IDLH Immediately Dangerous to Life or Heath
IHE Internal heat exchanger
L Pipe length (m)
Liq Liquid
LMTD Logarithmic Mean Temperature Difference (K)
M Refrigerant charge (kg)
m& Fluid mass flow rate (kg/s)
2COm& CO2 mass flow rate (kg/h)
3NHm& NH3 mass flow rate (kg/s)
Med Medium
N Air change per hour (1/h)
n Rotational speed (rpm)
rn Rated rotational speed (rpm)
NIOSH National Institute for Occupational Safety and Health
NPSH Net Positive Suction Head
Num Number
ODP Ozone Depletion Potential
OSHA Occupational Safety and Health Administration

146
P Pressure (bar)
P1 Condensing pressure (bar)
P2 Evaporating pressure (bar)
PEL Permissible Exposure Limit
POE Polyol Ester
PPM Parts per Million
Pr Prandtl Number (-)
Q& Cooling capacity (kW)
vq Volumetric refrigeration effect (kJ/m3)
Re Reynolds number (-)
Ref Reference case or Refrigerant
SH Superheat
St Stage
STEL Short Term Exposure Limit
T Temperature (°C)
t Time (hour)
absT Absolute temperature (K)
T1 Condensing/gas cooler exit temperature (°C)
T2 Evaporating temperature (°C)
TLV Threshold Limit Value
TWA Time-Weighted Average
V Space volume (m3)
V& Fresh air volumetric flow rate (m3/h)

147
dispV& Compressor volume displacement rate (m3/h)
1v Specific volume for saturated liquid (m3/kg)
2v Specific volume for saturated vapour (m3/kg)
Vap Vapour
w Velocity (m/s)
x Vapour quality (-)
Y Constant (kW2/m4)
Greek
α Heat transfer coefficient (W/m2-C)
Δ Difference (-)
ρ Density (kg/m3)
η Efficiency (-)
ε Heat exchanger effectiveness (-)
μ Mean viscosity (kg/m-s)
Subscript
abs Absolute
air For air
amb Ambient
app Approach temperature difference
c Cold fluid

148
Cas Cascade
el Electric
Equal,PR Equal pressure ratios
evap evaporation
exp Experimental
gc Gas cooler
h Hot fluid
i In
inter Intercooler or Intermediate
is Isentropic
L Low temperature/freezer
liq Liquid
max Maximum
min Minimum
o Out
opt Optimum
product For product
product,air Temperature difference between product and air
Sat Saturation
St Stage
tot Total
v volumetric
vap Vapour

149
10 References
Amin, J., Dienhart, B., & Wertenbach, J. (1999). Safety Aspects of an A/C System with Carbon Dioxide as Refrigerant. Paper pre-sented at the SAE Automotive Alternate Refrigerant Systems Symposium, Scottsdale, Arizona, USA.
Arias, J. (2005). Energy Usage in Supermarkets Modelling and Field Measurements. Doctoral thesis, Royal Institute of Technology, Stockholm.
ASHRAE. (1989). ASHRAE Standard 62, Ventilation for Acceptable Indoor Quality. Atlanta, USA: American Society of Heating, Re-frigeration, and Air-Conditioning Engineering, Inc.
ASHRAE. (2005). ASHRAE Handbook, Fundamentals. Atlanta, USA: American Society of Heating, Refrigeration, and Air-Conditioning Engineering, Inc.
Bearg, D. W. (1993). Indoor Air Quality and HVAC Systems: Lewis Publisher.
Berghmans, J., & Duprez, H. (1999). Safety Aspects of CO2 Heat Pumps. Paper presented at the 6th IEA International Energy Agency Heat Pump Conference, Berlin, Germany.
Brown, J. S., Yana-Motta, S. F., & Domanski, P. A. (2002). Comparative Analysis of an Automotive Air Conditioning Systems Operating With CO2 and R134a. International Journal of Refrigeration, 25(1), 19-32.
Chen, Y., & Gu, J. (2005). The Optimum High Pressure for CO2 Tran-scritical Refrigeration Systems with Internal Heat Exchangers. International Journal of Refrigeration, 28(8), 1238-1249.
Claesson, J. (2006). Efficient Supermarket Refrigeration – Project 1: Ef-ficient Control, Supervision, and System Solutions (In Swedish), Final report. Katrineholm, Sweden: IUC, Sveriges Energi- & Kylcentrum AB.
Cutler, B., Hwang, Y., Bogdanic, L., & Radermacher, R. (2000). Devel-opment of a Trans-critical Carbon Dioxide Environmental Con-trol Unit. Paper presented at the 4th IIR Gustav Lorentzen Conference on Natural Working Fluids, Indiana, USA.
Dahlberg, O. (2003). Ökat Användning av Ammoniak och Koldioxid. ScanRef, 32(September), 28.
Dorin. (2007). CO2 Transcritical Compressors. Available: http://www.dorin.com/ [2007, June 20].
150
Dossat, R. J. (1991). Principles of Refrigeration (3ed.). Englewood Cliffs, N.J.: Prentice Hall, cop.
Downing, R. C. (1988). Fluorocarbon Refrigeration Handbook. NJ, USA: Prentice Hall.
Ekenberg, T. (2004). Genombrott för Koldioxid till Butikskyla. ScanRef, 33(February), 18.
Elefsen, F., & Micheme, S., White. (2003, August 2003). CO2 Effective Comparison of Supermarket Refrigeration Systems. Paper pre-sented at the 21st IIR International Congress of Refrigeration, Washington, D.C., USA.
Endoh, K., Kouno, T., Gommori, M., Tanaami, T., Mizutani, K., & Miyata, M. (2006). Instant Hot Water Supply Heat Pump Water Heater Using CO2 Refrigerant for Home Use. Paper presented at the 7th IIR Gustav Lorentzen Conference on Natural Work-ing Fluids, Trondheim, Norway.
Fischer, S. K., Hughes, P. J., Fairchild, P. D., Kusik, C. L., Dieckmann, J. T., McMahon, E. M., & Hobday, N. (Eds.). (1991). Energy and Global Warming of CFC Alternative Technologies. Washington, D.C: Oak Ridge National Laboratory, Arthur D. Little, Inc., Al-ternative Fluorocarbons Environmental Acceptability Study (AFEAS), and U.S. Department of Energy (DOE).
Gentner, H. (1998, June 1998). Passenger Car Air Conditioning Using Carbon Dioxide as Refrigerant. Paper presented at the IIR-Gustav Lorentzen Conference on Natural Working Fluids, Oslo, Norway.
Giannavola, M. S., Murphy, R., Yin, J. M., Kim, M.-H., Bullard, C. W., & Hrnjak, P. (2000). Experimental Investigations of an Automo-tive Heat Pump Prototype for Military, SUV and Compact Cars. Paper presented at the 4th IIR Gustav Lorentzen Conference on Natural Working Fluids, Indiana, USA.
Girotto, S. (2004, November 27). Commercial and Industrial Refrigera-tion. Paper presented at the European Seminar: Carbon Dioxide as a Refrigerant Theoretical and Design Aspects, University of Padova, Milan, Italy.
Girotto, S., Minetto, S., & Nåksa, P. (2003, August 2003). Commercial Refrigeration System with CO2 as Refrigerant Experimental Re-sults. Paper presented at the 21st IIR International Congress of Refrigeration, Washington, D.C., USA.
Granryd, E., Ekroth, I., Lundqvist, P., Melinder, Å., Palm, B., & Rohlin, P. (2005). Refrigerating Engineering. Stockholm, Sweden: De-partment of energy engineering, Division of applied thermody-namics and refrigeration, Royal Institute of Technology (KTH).
Haaf, S., & Heinbokel, B. (2002). Alternative Refrigerant for Supermar-ket Refrigeration Installations. DKV-Tagungsbericht (Proceed-ings), 2(2), 29-42.

151
Heinbokel, B. (2001). CO2 Used as Secondary and Primary Refrigerant in Supermarket LT Refrigeration. Kl Luft-und Kältetechnik (Ventilation and refrigeration)(10).
Hewitt, G. F. (1998). Heat Exchanger Design Handbook (Vol. 2). NY, USA: Begell House, Inc.
Hihara, E. (2000, September 2000). Heat Transfer Characteristics of CO2. Paper presented at the Selected Issues on CO2 as Working Fluid in Compression Systems, Annex 27 workshop, Trond-heim, Norway.
Horton, W. T., & Groll, E. A. (2001). Analysis of Medium-Temperature Secondary Loop Refrigerating System. ASHRAE Transactions, 107(2), 459-465.
Hunter, D. (1975). The Diseases of Occupants (5 ed.). London, England: Hodder and Stoughton.
Hwang, Y., & Radermacher, R. (1998). Experimental Evaluation of CO2 Water Heater. Paper presented at the Third IIR-Gustav Lor-entzen Conference on Natural Working Fluids, Oslo, Norway.
Kauf, F. (1998). Determination of the Optimum High Pressure for Tran-scritical CO2-Refrigeration Cycles. International Journal of Thermal Science, 38(4), 325-330.
Kim, M.-H., Pettersen, J., & Bullard, C. W. (2004). Fundamental Process and System Design Issues in CO2 Vapour Compression Sys-tems. Progress in Energy and Combustion Science, 30(2), 119-174.
Klein, S. A. (2006). Engineering Equations Solver (EES). Madison, USA: F-Chart Software.
Liao, S. M., Zhao, T. S., & Jakobsen, A. (2000). A correlation of optimal heat rejection pressures in transcritical carbon dioxide cycles. Applied Thermal Engineering, 20(9), 831-841.
Lorentzen, G. (1990). Trans-critical Vapour Compression Cycle Device. In I. P. Publication (Ed.): WO 90/07683.
Lundqvist, P. (2000). Recent Refrigeration Equipment Trends in Super-markets: Energy Efficiency as Leading Edge. Bulletin of the In-ternational Institute of Refrigeration(5).
Madsen, K. B., Villumsen, J., & Nielsen, J. (2003, August 2003). Imple-mentation of CO2/Propane Walk-In Storage Rooms in a McDonald's Restaurant. Paper presented at the 21st IIR Interna-tional Congress of Refrigeration, Washington, D.C., USA.
Nihlen, M. (2004). En Jätte Slog Upp Portarna. Kyla(2), 7-12. Nilsson, P. O., Rogstam, J., Sawalha, S., & Shahzad, K. (2006). Ice Rink
Refrigeration System with Carbon Dioxide as Secondary Fluid in Copper Tubes, 7th IIR Gustav Lorentzen Conference on Natu-ral Working Fluids. Trondheim, Norway.

152
Orphelin, M., & Marchio, D. (1997). Computer-Aided Energy Use Esti-mation in Supermarkets, Building Simulation Conference. Pra-gue, Czech Republic.
Perales Cabrejas, C. (2006). Parametric Evaluation of NH3/CO2 Cascade System for Supermarket Refrigeration in Laboratory Environ-ment. MSc degree thesis, The Royal Institute of Technology (KTH), Stockholm.
Peterson, F. (1986). Ventilation Requirements (Vol. Compendium II:1 ). Stockholm: Department of Heating and Ventilation, Royal Insti-tute of Technology.
Pettersen, J. (2004). Experimental Study on Boiling Liquid Expansion in a CO2 Vessel. Paper presented at the Annex 27 workshop: Se-lected Issues on CO2 in Compression Systems, Final Report.
Pettersen, J., Hafner, A., & Brånås, M. (2004). Some Safety Aspects of CO2 Vapour Compression Systems. Paper presented at the An-nex 27 workshop: Selected Issues on CO2 in Compression Sys-tems, Final Report.
Rehnby, M. (2004). Koldioxid i Butikskylsystem. ScanRef, 33(4), 32-33. Remund, J., Lang, R., & Kunz, S. (2001). Meteonorm (Version 4.10).
Bern: Meteotest. Rieberer, R. (1998). CO2 as Working Fluid for Heat Pumps. Doctoral
thesis, Graz University of Technology, Graz, Austria. Robinson, D. M., & Groll, E. A. (1998). Efficiencies of Transcritical CO2
Cycle with and Without an Expansion Turbine. International Journal of Refrigeration, 21(7), 577-589.
Rolfsman, L. (1996). CO2 and NH3 in Supermarket ICA-FOCUS. Paper presented at the IIR International Conference of Applications for Natural Refrigerants, Aarhus, Denmark.
Sawalha, S., Soleimani K., A., & Rogstam, J. (2006, May). Experimental and Theoretical Evaluation of NH3/CO2 Cascade System for Supermarket Refrigeration in a Laboratory Environment. Paper presented at the 7th IIR Gustav Lorentzen Conference on Natural Working Fluids, Trondheim, Norway.
Schiesaro, P., & Kruse, H. (2002, July 2002). Development of a Two Stage CO2 Supermarket System. Paper presented at the IIF-IIR, New Technologies in Commercial Refrigeration, Urbana, Illi-nois, USA.
Shahzad, K. (2006). An Ice Rink Refrigeration System Based on CO2 as Secondary Fluid in Copper Tubes. MSc degree thesis, Royal In-stitute of Technology (KTH), Stockholm.
Sjöberg, A. (1997). Covering of a Cabinet in Supermarkets. MSc degree thesis, Royal Institute of Technology, Stockholm, Sweden.
StayCool. (2002, 2002). Ny Konsum-butik med Bara Naturliga Köldme-dier. StayCool Newsletter, 3.
StayCool. (2004, 2004). Världens Största i Luleå. StayCool Newsletter, 7.

153
Stoecker, W. F. (1998). Industrial Refrigeration Handbook: McGraw-Hill.
SvenskKylnorm. (2000). Kylbranschens Samarbetsstiftelse, Svensk Kyl-norm. Stockholm, Sweden.
Tesab. (2004). Genombrott för Koldioxidteknik till Butikskyla. Available: http://www.tesab.se/nyheterhtm/Nyheter1.htm#butikskyla [2004, December 13].
Wertenbach, J., & Caeser, R. (1998, June 1998). An Environmental Evaluation of an Automobile Air Conditioning System with CO2 versus HFC-134a as Refrigerant. Paper presented at the IIR-Gustav Lorentzen Conference on Natural Working Fluids, Oslo, Norway.
Zhao, Y., Molki, M., Ohadi, M., M., & Dessiatoun, S. V. (2000). Flow Boiling Of CO2 In Microchannels. ASHRAE Transactions, 106(1), 437-445.