carbon market forum carbon leakage options paper ceps – carbon market forum meeting, rome, 18 june...
TRANSCRIPT
Carbon Market Forum Carbon Leakage Options Paper CEPS – Carbon Market Forum meeting, Rome, 18 June 2014Eni Congress Center - Piazzale Mattei, 1
Vianney SchynsAdvisor Climate and Energy PoliciesUtility Support Group, utility provider for esp. chemicals’ site Chemelot(a.o. SABIC, OCI Nitrogen, DSM, Lanxess, INEOS, Borealis)
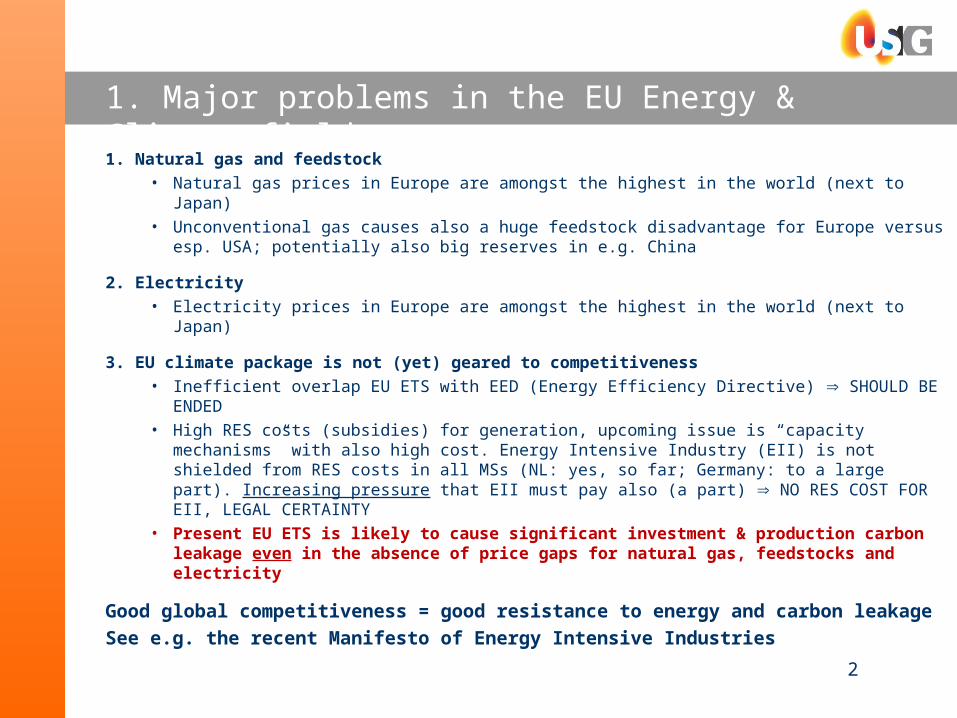
1. Major problems in the EU Energy & Climate field
1. Natural gas and feedstock• Natural gas prices in Europe are amongst the highest in the world (next to Japan)• Unconventional gas causes also a huge feedstock disadvantage for Europe versus esp.
USA; potentially also big reserves in e.g. China
2. Electricity• Electricity prices in Europe are amongst the highest in the world (next to Japan)
3. EU climate package is not (yet) geared to competitiveness• Inefficient overlap EU ETS with EED (Energy Efficiency Directive) SHOULD BE ENDED• High RES costs (subsidies) for generation, upcoming issue is “capacity mechanisms”
with also high cost. Energy Intensive Industry (EII) is not shielded from RES costs in all MSs (NL: yes, so far; Germany: to a large part). Increasing pressure that EII must pay also (a part) NO RES COST FOR EII, LEGAL CERTAINTY
• Present EU ETS is likely to cause significant investment & production carbon leakage even in the absence of price gaps for natural gas, feedstocks and electricity
Good global competitiveness = good resistance to energy and carbon leakageSee e.g. the recent Manifesto of Energy Intensive Industries
2
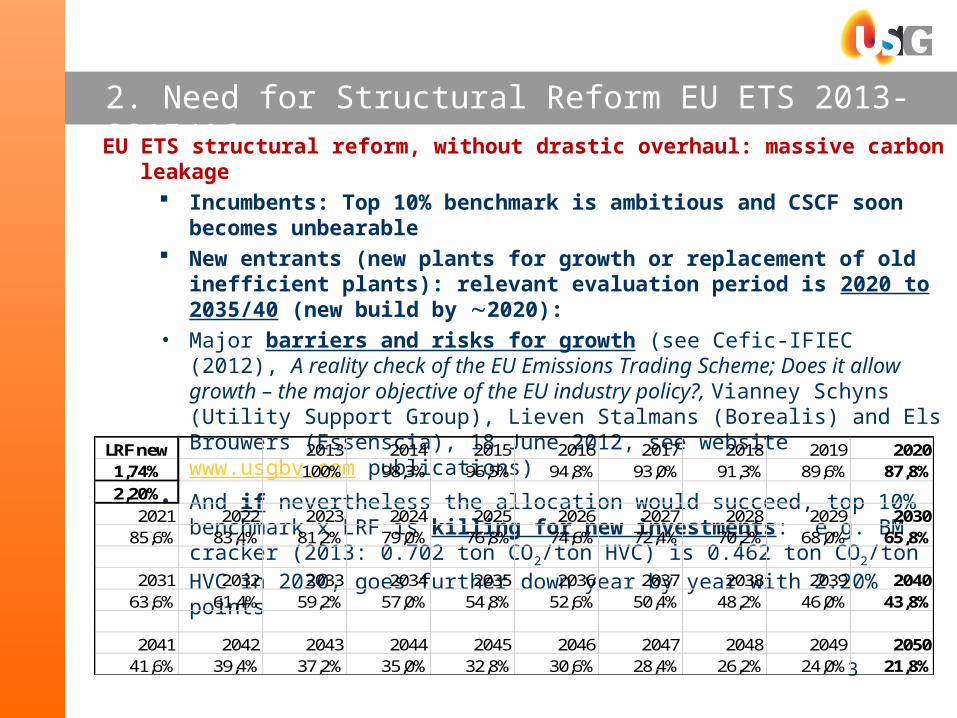
2. Need for Structural Reform EU ETS 2013-2015/16EU ETS structural reform, without drastic overhaul: massive carbon leakage
Incumbents: Top 10% benchmark is ambitious and CSCF soon becomes unbearable New entrants (new plants for growth or replacement of old inefficient plants):
relevant evaluation period is 2020 to 2035/40 (new build by 2020): • Major barriers and risks for growth (see Cefic-IFIEC (2012), A reality check of the EU
Emissions Trading Scheme; Does it allow growth – the major objective of the EU industry policy?, Vianney Schyns (Utility Support Group), Lieven Stalmans (Borealis) and Els Brouwers (Essenscia), 18 June 2012, see website www.usgbv.com publications)
• And if nevertheless the allocation would succeed, top 10% benchmark x LRF is killing for new investments: e.g. BM cracker (2013: 0.702 ton CO2/ton HVC) is 0.462 ton CO2/ton HVC in 2030, goes further down year by year with 2.20% points
3
LRF new 2013 2014 2015 2016 2017 2018 2019 20201,74% 100% 98,3% 96,5% 94,8% 93,0% 91,3% 89,6% 87,8%2,20%
2021 2022 2023 2024 2025 2026 2027 2028 2029 203085,6% 83,4% 81,2% 79,0% 76,8% 74,6% 72,4% 70,2% 68,0% 65,8%
2031 2032 2033 2034 2035 2036 2037 2038 2039 204063,6% 61,4% 59,2% 57,0% 54,8% 52,6% 50,4% 48,2% 46,0% 43,8%
2041 2042 2043 2044 2045 2046 2047 2048 2049 205041,6% 39,4% 37,2% 35,0% 32,8% 30,6% 28,4% 26,2% 24,0% 21,8%
3. Qualification leakage & two mains options in CMF Options PaperQualification carbon leakage risk: less enthusiastic about “gliding scale”
• In practical terms, the EU ETS contains the most carbon intensive sectors.– Who should we leave out? This would have limited volume impact.
• In most sectors the markets are continuously further globalising– Next to steel, chemicals, fibres, etc. also e.g. natural floor stones, ceramics– Transport costs over the globe are relatively cheap
• Carbon price level is important policy decision: up to which carbon price shall the system work well – like € 75 or 100/ton – must be forward looking! Getting off and on the CLL makes no sense, this only creates investment uncertainty
The CMF Options Paper comes to two basic options to avoid carbon leakage1. Border Adjustments, or2. Dynamic free allocation, based on realistic benchmarks and actual production
4
3. Option Border Measures in CMF Options PaperWTO issues – import obligations – border adjustment measures
• With fixed import obligation for allowances (like sometimes suggested on BAT level)– Undue advantage for importers with higher CO2 intensity (can be big difference)– Obligation probably required that importers can demonstrate that they have lower
emissions than a fixed ex-ante BAT level– Import to e.g. EU can become opposite of a “pollution heaven”, a “green haven”,
which may be low volumes globally but high volumes on the EU market• What about export from EU?
– Full exemption creates emissions outside the EU ETS? Or need for special reserve?– A benchmark-based free allocation for exports (which then must be based on
provisional export ex-post adjusted to actual export)• Border adjustment measures remain very cumbersome, would create huge administrative
efforts and costs and would certain be politically sensitive for countervailing measures– There is little appetite for border adjustment measures
• Anyway: – Border adjustment measures can never be based on historical frozen activity levels
5
3. Option free allocation in CMF Options PaperFree allocation as solution to avoid carbon leakage – three basic parameters well covered
1. Method of allocation: ex-ante frozen or dynamic? – Ex-ante frozen is inbuilt incentive for leakage– Production leakage in EU ETS: incentivised until 51% of historical production– Barriers and risks for growth leads to investment carbon leakage, growth disabler– Frozen allocations enhance frozen market shares (distortions winning/losing market
share)– Dynamic allocation solves these problems
2. Level of the benchmarks: geared to avoid leakage or too strict?– Benchmark level of zero = full auctioning; benchmarks must be realistic
3. The carbon price: until which level is carbon leakage avoided (policy decision needed).
Dynamic allocation remarks:• Present system of partially ceased operations is a partial ex-post already, change to full
ex-post is therefore really easy• Not any ETS copied a historical frozen allocation like EU ETS. Next to the ETS of New
Zealand also the ones of California and Australia are in some way “ex-post” (“true-up”)• Total EU cap can become too stringent, in case of continued absence of a global ETS
6
4. Objectives Reform and key points in present debate (1) Sound objectives for the new free allocation 2021-2030, the method of allocation should be
1. Simpler 2. Predictable for companies3. Effective (clear incentive to reduce emissions and effective against carbon leakage)
The search for solutions must be facts-based (very good). Key discussion points:• Ex-post actual production allocation is acknowledged as being in debate, but about
simplicity …– Partially ceased production rules (50%, 75%, etc.) are perceived by the Commission
as simple while total ex-post recalculation is perceived as complicated– But perverse incentive to keep plants at least at 51% production level, as also
mentioned by CAN Europe, is so far ignored– It remains totally unclear why ex-post calculation to actual production is perceived
as complicated (while this is in the ETSs elsewhere)– “20% capacity increase/reduction = 20% higher/lower allocation” sounds like simple,
in reality the outcome is a gamble, can be anything different– Our judgment: Ex-post would be a huge simplification, a needed one!
7
4. Key points in the present debate (2) • Ex-post actual production allocation suffers from a lower (product) carbon price signal, to
get the opportunity costs in product prices the allocation should remain ex-ante– Agreement: With a global auctioning system, the full carbon costs (direct & indirect
emissions) become reflected in product prices, thus enhancing lower demand by price elasticity of demand and enhancing inter-product competition
– However: The ex-ante allocation objective of the product carbon price signal cannot be combined with the objective to avoid carbon leakage, both are mutually exclusive
• However also:– First: Also the Commission acknowledges that sub-sectors at risk for carbon leakage
cannot pass on the full carbon costs in product prices» So what about enhancing lower demand by price elasticity of demand and
enhancing inter-product competition?– Second: Price elasticity of demand is exaggerated, example:
» Cement 0.5 means 5% lower demand at 10% price increase; thus 50% lower demand at 100% price increase. This is not credible (whole theories are build on the price elasticity of demand and inter-product competition).
– Third: Fact is that the CO2 break-even prices for carbon leakage are quite low for ex-ante and quite high for ex-post allocation – a world of difference
8
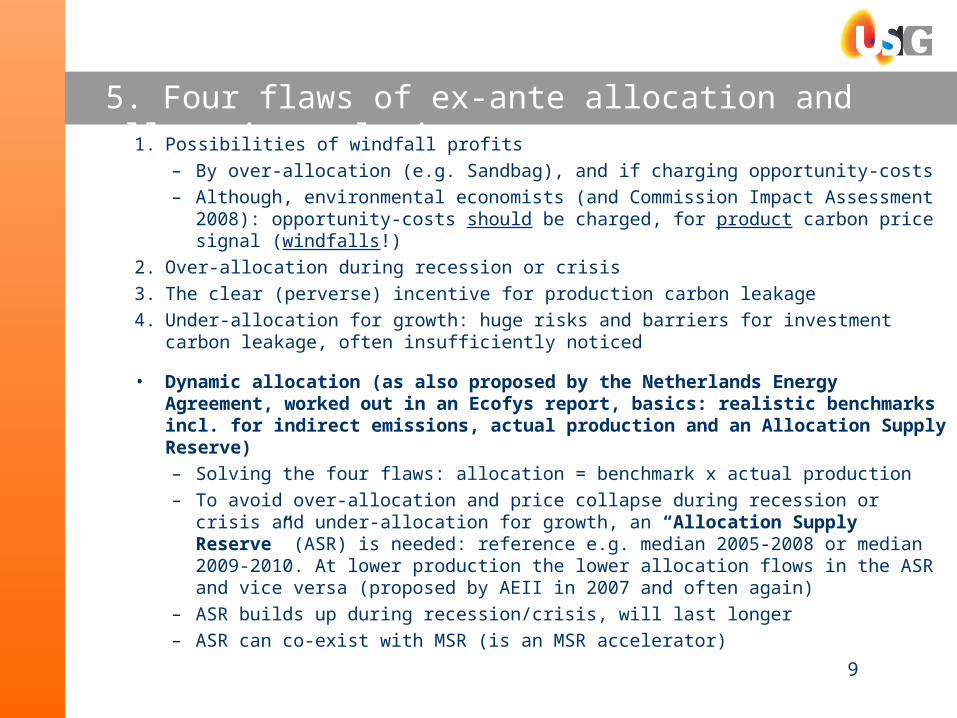
5. Four flaws of ex-ante allocation and allocation solution1. Possibilities of windfall profits
– By over-allocation (e.g. Sandbag), and if charging opportunity-costs– Although, environmental economists (and Commission Impact Assessment 2008):
opportunity-costs should be charged, for product carbon price signal (windfalls!)2. Over-allocation during recession or crisis3. The clear (perverse) incentive for production carbon leakage4. Under-allocation for growth: huge risks and barriers for investment carbon leakage, often
insufficiently noticed
• Dynamic allocation (as also proposed by the Netherlands Energy Agreement, worked out in an Ecofys report, basics: realistic benchmarks incl. for indirect emissions, actual production and an Allocation Supply Reserve)– Solving the four flaws: allocation = benchmark x actual production– To avoid over-allocation and price collapse during recession or crisis and under-
allocation for growth, an “Allocation Supply Reserve” (ASR) is needed: reference e.g. median 2005-2008 or median 2009-2010. At lower production the lower allocation flows in the ASR and vice versa (proposed by AEII in 2007 and often again)
– ASR builds up during recession/crisis, will last longer– ASR can co-exist with MSR (is an MSR accelerator)
9
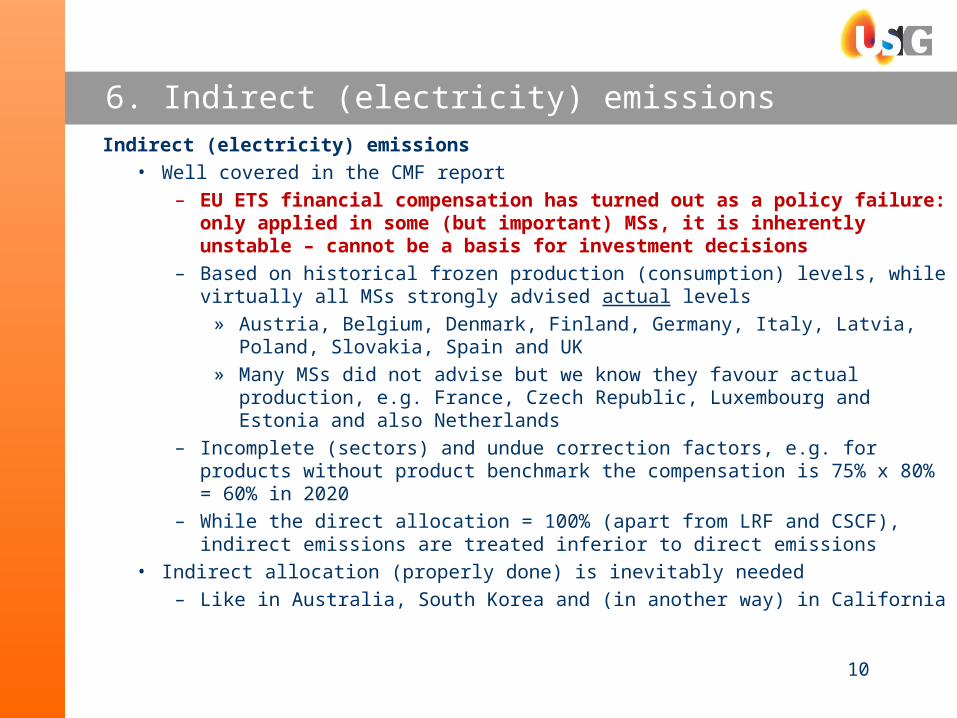
6. Indirect (electricity) emissionsIndirect (electricity) emissions
• Well covered in the CMF report– EU ETS financial compensation has turned out as a policy failure: only applied in
some (but important) MSs, it is inherently unstable – cannot be a basis for investment decisions
– Based on historical frozen production (consumption) levels, while virtually all MSs strongly advised actual levels
» Austria, Belgium, Denmark, Finland, Germany, Italy, Latvia, Poland, Slovakia, Spain and UK
» Many MSs did not advise but we know they favour actual production, e.g. France, Czech Republic, Luxembourg and Estonia and also Netherlands
– Incomplete (sectors) and undue correction factors, e.g. for products without product benchmark the compensation is 75% x 80% = 60% in 2020
– While the direct allocation = 100% (apart from LRF and CSCF), indirect emissions are treated inferior to direct emissions
• Indirect allocation (properly done) is inevitably needed– Like in Australia, South Korea and (in another way) in California
10
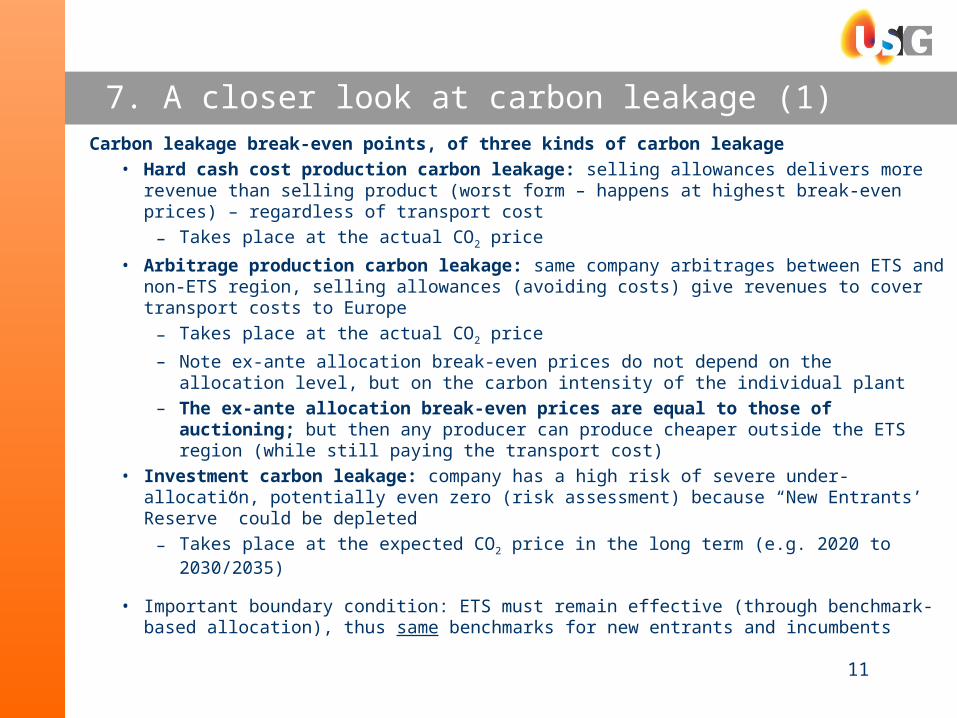
7. A closer look at carbon leakage (1)Carbon leakage break-even points, of three kinds of carbon leakage
• Hard cash cost production carbon leakage: selling allowances delivers more revenue than selling product (worst form – happens at highest break-even prices) – regardless of transport cost
– Takes place at the actual CO2 price• Arbitrage production carbon leakage: same company arbitrages between ETS and non-ETS
region, selling allowances (avoiding costs) give revenues to cover transport costs to Europe– Takes place at the actual CO2 price– Note ex-ante allocation break-even prices do not depend on the allocation level, but
on the carbon intensity of the individual plant– The ex-ante allocation break-even prices are equal to those of auctioning; but then
any producer can produce cheaper outside the ETS region (while still paying the transport cost)
• Investment carbon leakage: company has a high risk of severe under-allocation, potentially even zero (risk assessment) because “New Entrants’ Reserve” could be depleted
– Takes place at the expected CO2 price in the long term (e.g. 2020 to 2030/2035)
• Important boundary condition: ETS must remain effective (through benchmark-based allocation), thus same benchmarks for new entrants and incumbents
11
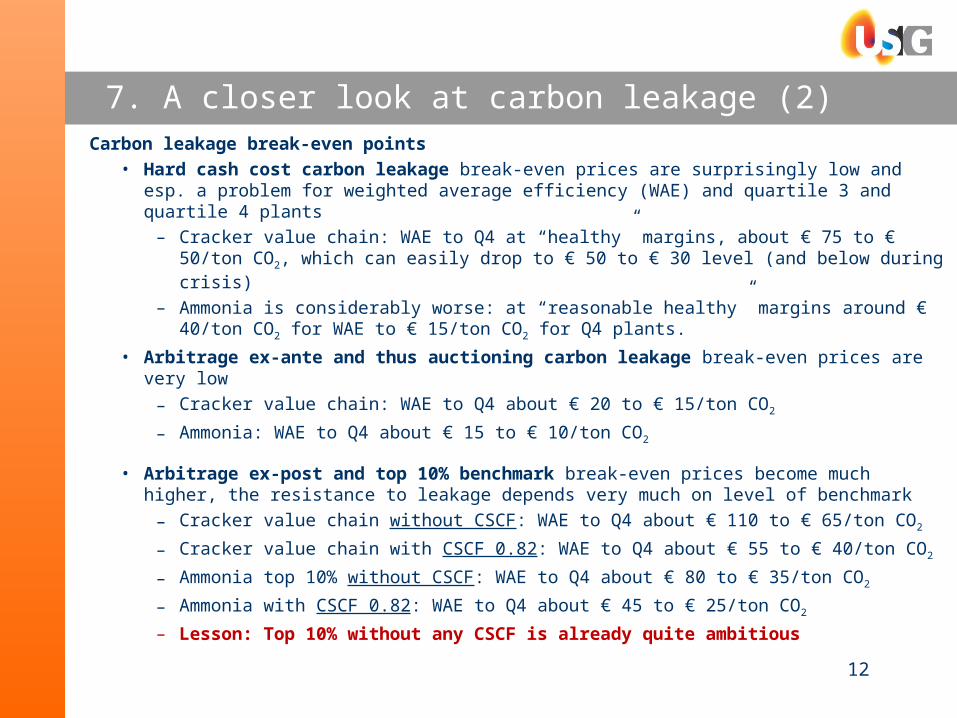
7. A closer look at carbon leakage (2)Carbon leakage break-even points
• Hard cash cost carbon leakage break-even prices are surprisingly low and esp. a problem for weighted average efficiency (WAE) and quartile 3 and quartile 4 plants
– Cracker value chain: WAE to Q4 at “healthy” margins, about € 75 to € 50/ton CO2, which can easily drop to € 50 to € 30 level (and below during crisis)
– Ammonia is considerably worse: at “reasonable healthy” margins around € 40/ton CO2 for WAE to € 15/ton CO2 for Q4 plants.
• Arbitrage ex-ante and thus auctioning carbon leakage break-even prices are very low– Cracker value chain: WAE to Q4 about € 20 to € 15/ton CO2
– Ammonia: WAE to Q4 about € 15 to € 10/ton CO2
• Arbitrage ex-post and top 10% benchmark break-even prices become much higher, the resistance to leakage depends very much on level of benchmark
– Cracker value chain without CSCF: WAE to Q4 about € 110 to € 65/ton CO2
– Cracker value chain with CSCF 0.82: WAE to Q4 about € 55 to € 40/ton CO2
– Ammonia top 10% without CSCF: WAE to Q4 about € 80 to € 35/ton CO2
– Ammonia with CSCF 0.82: WAE to Q4 about € 45 to € 25/ton CO2
– Lesson: Top 10% without any CSCF is already quite ambitious12
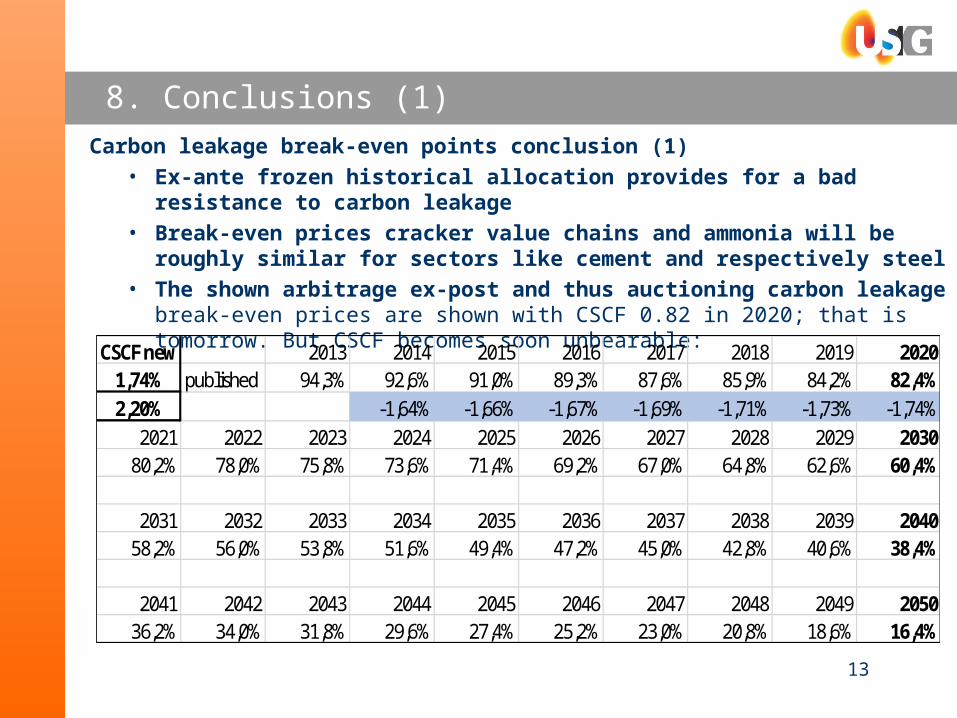
8. Conclusions (1)Carbon leakage break-even points conclusion (1)
• Ex-ante frozen historical allocation provides for a bad resistance to carbon leakage• Break-even prices cracker value chains and ammonia will be roughly similar for sectors
like cement and respectively steel• The shown arbitrage ex-post and thus auctioning carbon leakage break-even prices are
shown with CSCF 0.82 in 2020; that is tomorrow. But CSCF becomes soon unbearable:
13
CSCF new 2013 2014 2015 2016 2017 2018 2019 20201,74% published 94,3% 92,6% 91,0% 89,3% 87,6% 85,9% 84,2% 82,4%2,20% -1,64% -1,66% -1,67% -1,69% -1,71% -1,73% -1,74%
2021 2022 2023 2024 2025 2026 2027 2028 2029 203080,2% 78,0% 75,8% 73,6% 71,4% 69,2% 67,0% 64,8% 62,6% 60,4%
2031 2032 2033 2034 2035 2036 2037 2038 2039 204058,2% 56,0% 53,8% 51,6% 49,4% 47,2% 45,0% 42,8% 40,6% 38,4%
2041 2042 2043 2044 2045 2046 2047 2048 2049 205036,2% 34,0% 31,8% 29,6% 27,4% 25,2% 23,0% 20,8% 18,6% 16,4%
8. Conclusions (2)Carbon leakage break-even points conclusion (2)
• Sector roadmaps like from Cefic, Eurofer suggest an already accelerated abatement speed of roughly 0.8% per year (accelerated because of higher oil price and higher carbon prices)
• Commission Energy Roadmap diversified supply scenario € 52/ton in 2030, € 95/ton in 2040 and € 265/ton in 2050 – remember 2020 to 2035/40 and beyond is evaluation horizon for new plants after the crisis
• For CCS, this cannot be applied yet in the foreseeable future (high costs, public acceptance), an emerging global carbon market seems a prerequisite
• Therefore a balance is needed between e.g.:– Weighted Average Efficiency (WAE) benchmarks with Industry Linear Reduction factor
(ILRF) related to realistic abatement speed, e.g. 0.8% per year– Ultimate stringency would be top 10% without any ILRF (until global approach with
equal burdens globally)» Provided that there is reasonable certainty that the carbon price is “controlled”
to levels like € 50-60/ton until 2030» Provided that there are special solutions with a higher allocation for products like
ammonia and probably also steel
14
9. Appendix: Structural Reform EU ETS 2013-2015/16 (1)EU ETS structural reform:
Objective: good global competitiveness = good resistance to carbon leakageComprehensive solution package:
• (1) Revisit the total cap and industry allocation in function of more or less global participation by e.g. 2020 and beyond
• (2) Actual production allocation (“ex-post”) instead of “ex-ante” allocation, this avoids not only over-allocation during recession and crisis but avoids also under-allocation for growth by removing the present barriers and risks for growth and it mitigates the incentive for carbon leakage (to zero for an efficient plant)
• (3) Complete unrestricted indirect (electricity use) allocation, to replace the restricted and uncertain financial compensation (restricted: correction factors + for certain selected sectors only)
• (4) The too stringent “top 10%” benchmark not for now but replaced by a Weighted Average Efficiency Benchmark (WAE BM)
• (5) Abandon CSF (cross-sectoral correction factor) for incumbents and LRF for new entrants, replace both by a more realistic “ILRF” (Industry LRF) of e.g. 0.8%/year
Allocation is then: WAE BM x ILRF x actual production
15
4. Appendix: Structural Reform EU ETS 2013-2015/16 (2)EU ETS structural reform:
• (6) A “Allocation Supply Reserve” (ASR) is used to balance the market: lower production x BM than historical (median 2005-2008 or 2009-2010) to ASR, higher production x BM than historical taken from the ASR.
– Guarantee to refill ASR from auction volume, if depleted– No auctioning of left-overs end of trading period
• (7) Certainty about carbon leakage status, e.g. by including electricity and gas prices (ref. shale gas) and more robust criteria such as carbon cost (real and shadow) outside Europe into the Carbon Leakage List assessment
2013-2014 will be preparation years, Council decision on headlines in October 2014 and detailed legislative proposal by Commission possibly in in 2016 (earliest 2015) should not only focus on the macro adjustment (MSR), but should contain a robust comprehensive anti-leakage package
MSR fundamental flaw: it reacts to abatement (unlike ASR)
–Australian ETS is a leading example: Benchmark based on Weighted Average Efficiency, indirect allocation of 1.0 ton CO2/MWh (!) to “exposed” sectors, ex-post allocation (“true-up” to actual production)
16