carbon-neutral road transport 2050 perspective a technical
TRANSCRIPT

1
Carbon-neutral Road Transport 2050Carbon-neutral Road Transport 2050a technical study from a well-to-wheels a technical study from a well-to-wheels perspectiveperspective
OnlineApril 2021
DISCLAIMER➜The ERTRAC Carbon neutrality Study 2050 (WTW)
analyses different “extreme” scenarios and compares effects. It does not aim at giving a projection or at describing the way to achieve a carbon neutral road transport.
➜The study only reflects the views of the contributing authors and is not an official European Commission position.
➜Results:• This study explored different corner scenarios based on a static fuel
and fleet modelling exercise. • The analysis does not include dynamic modelling or prediction; the
results of the analysis should be considered as estimates for comparative purposes.
• The analysis does not draw conclusions on fuel and electricity availability, competition with other sectors demand, economics, societal acceptance ...
2
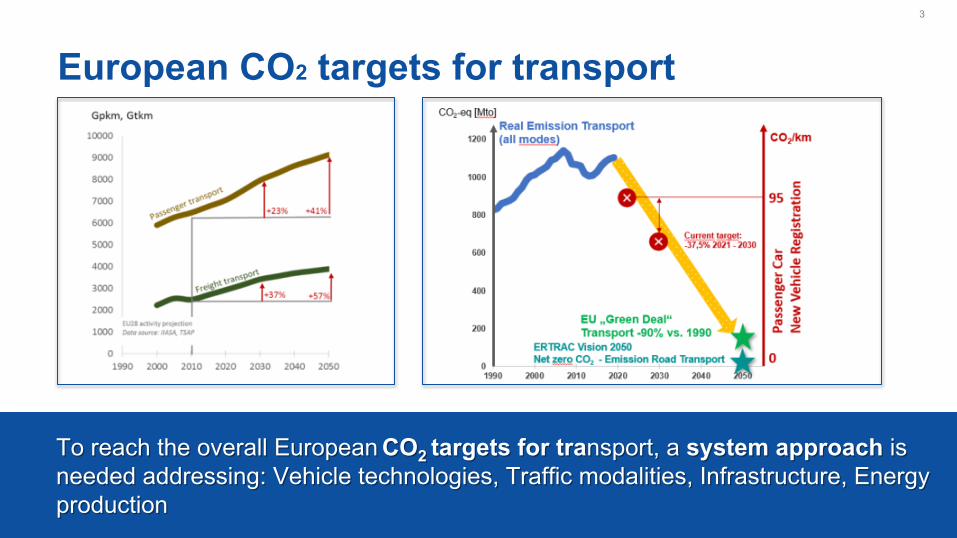
European CO2 targets for transport3
To reach the overall European To reach the overall European COCO2 2 targets for tratargets for transport, a nsport, a system approach system approach is is needed addressing: Vehicle technologies, Traffic modalities, Infrastructure, Energy needed addressing: Vehicle technologies, Traffic modalities, Infrastructure, Energy productionproduction
4
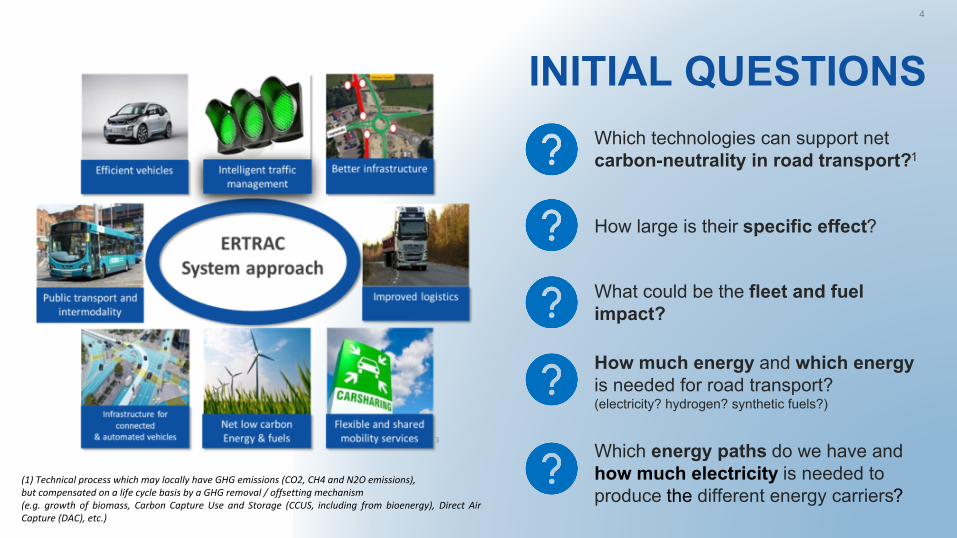
INITIAL QUESTIONSWhich technologies can support net carbon-neutrality in road transport?1
How large is their specific effect?
What could be the fleet and fuel impact?
How much energy and which energy is needed for road transport?(electricity? hydrogen? synthetic fuels?)
Which energy paths do we have and how much electricity is needed to produce the different energy carriers?
(1) Technical process which may locally have GHG emissions (CO2, CH4 and N2O emissions), but compensated on a life cycle basis by a GHG removal / offsetting mechanism (e.g. growth of biomass, Carbon Capture Use and Storage (CCUS, including from bioenergy), Direct Air Capture (DAC), etc.)
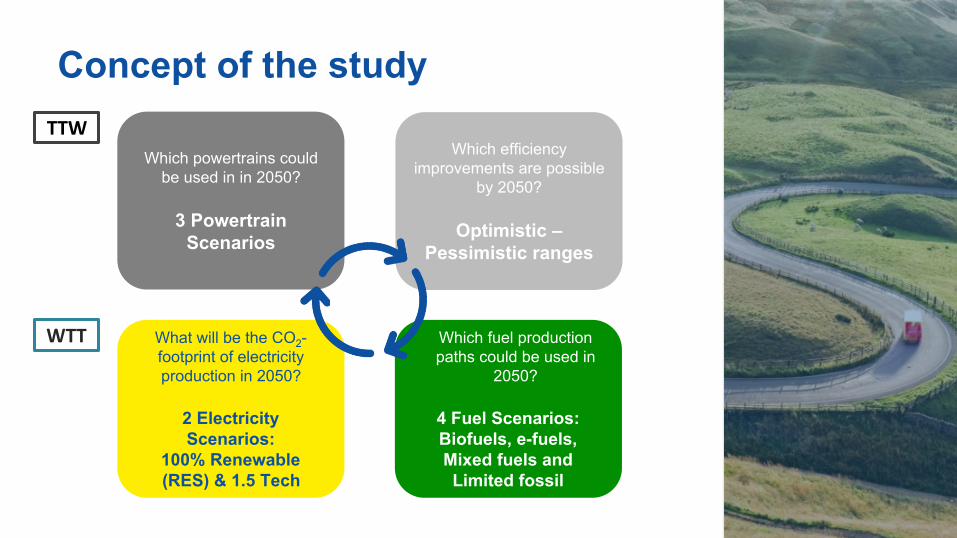
Concept of the study5
Which powertrains could be used in in 2050?
3 Powertrain Scenarios
Which efficiency improvements are possible
by 2050?
Optimistic – Pessimistic ranges
What will be the CO2-footprint of electricity production in 2050?
2 Electricity Scenarios:
100% Renewable (RES) & 1.5 Tech
Which fuel production paths could be used in
2050?
4 Fuel Scenarios: Biofuels, e-fuels, Mixed fuels and Limited fossil
WTT
TTW
6
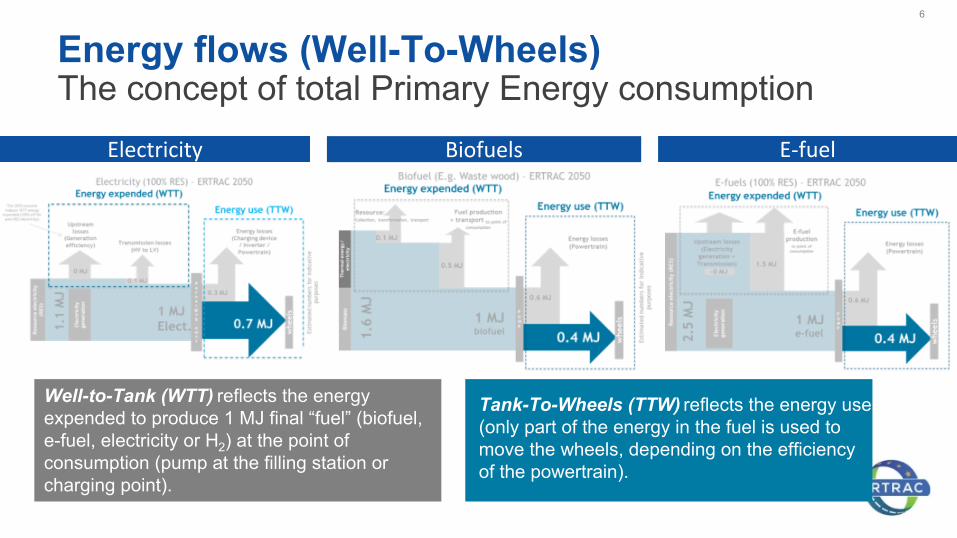
Energy flows (Well-To-Wheels)The concept of total Primary Energy consumption
BiofuelsElectricity E-fuel
Tank-To-Wheels (TTW) reflects the energy use (only part of the energy in the fuel is used to move the wheels, depending on the efficiency of the powertrain).
Well-to-Tank (WTT) reflects the energy expended to produce 1 MJ final “fuel” (biofuel, e-fuel, electricity or H2) at the point of consumption (pump at the filling station or charging point).
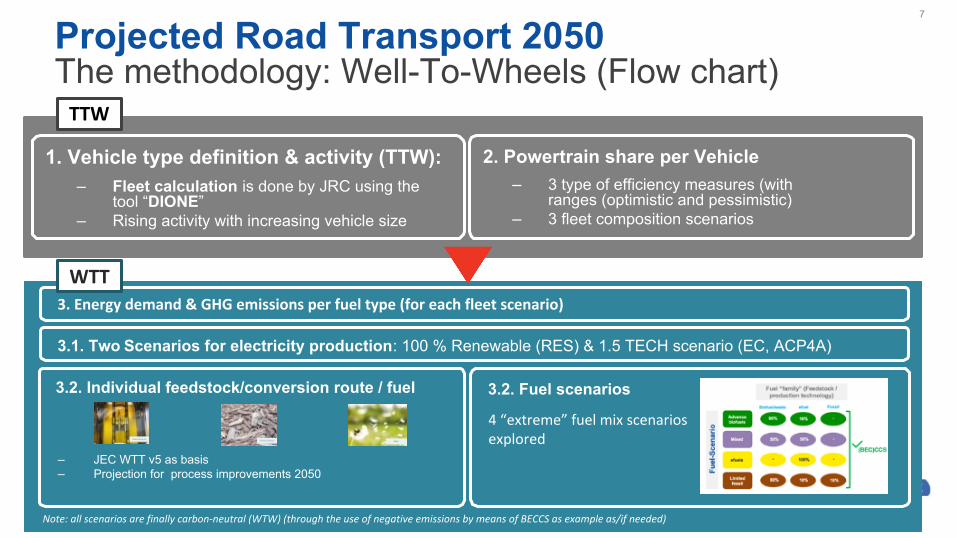
1. Vehicle type definition & activity (TTW):– Fleet calculation is done by JRC using the
tool “DIONE”– Rising activity with increasing vehicle size
7
Projected Road Transport 2050The methodology: Well-To-Wheels (Flow chart)
TTW
2. Powertrain share per Vehicle– 3 type of efficiency measures (with
ranges (optimistic and pessimistic)– 3 fleet composition scenarios
3. Energy demand & GHG emissions per fuel type (for each fleet scenario)
WTT
3.2. Individual feedstock/conversion route / fuel 3.2. Fuel scenarios
4 “extreme” fuel mix scenarios explored
– JEC WTT v5 as basis– Projection for process improvements 2050
Note: all scenarios are finally carbon-neutral (WTW) (through the use of negative emissions by means of BECCS as example as/if needed)
3.1. Two Scenarios for electricity production: 100 % Renewable (RES) & 1.5 TECH scenario (EC, ACP4A)

Reminder of the previous study
8
9
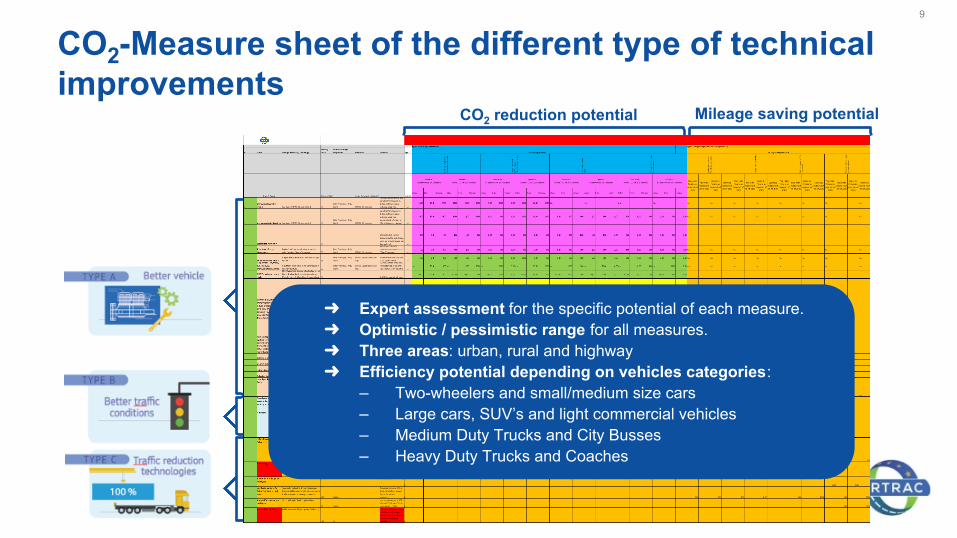
CO2 reduction potential Mileage saving potential
➜ Expert assessment for the specific potential of each measure.➜ Optimistic / pessimistic range for all measures.➜ Three areas: urban, rural and highway➜ Efficiency potential depending on vehicles categories:
– Two-wheelers and small/medium size cars– Large cars, SUV’s and light commercial vehicles– Medium Duty Trucks and City Busses– Heavy Duty Trucks and Coaches
CO2-Measure sheet of the different type of technical improvements

10
CO2 reduction potential Mileage saving potential
➜ Expert assessment for the specific potential of each measure.➜ Optimistic / pessimistic range for all measures.➜ Three areas: urban, rural and highway➜ Efficiency potential depending on vehicles categories:
– Two-wheelers and small/medium size cars– Large cars, SUV’s and light commercial vehicles– Medium Duty Trucks and City Busses– Heavy Duty Trucks and Coaches
CO2-Measure sheet of the different type of technical improvements
?
11
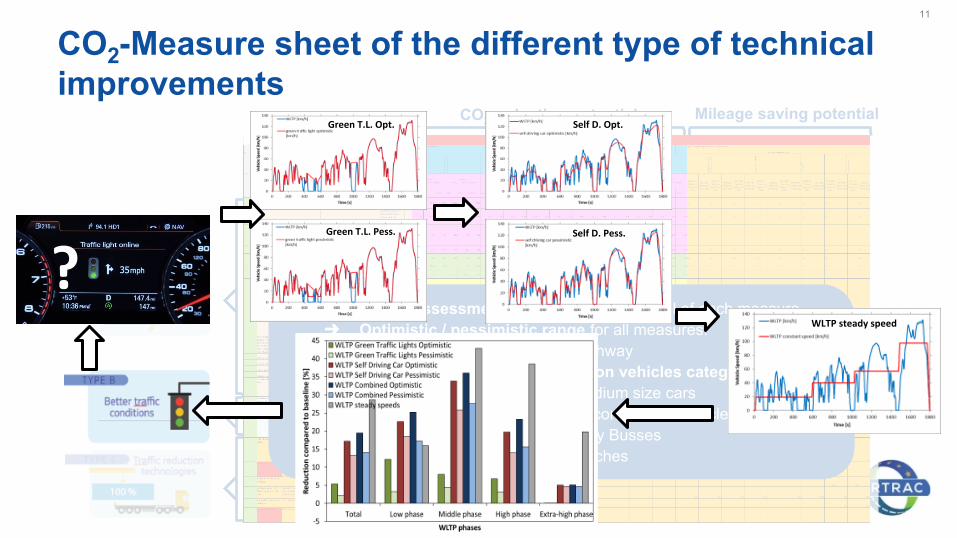
CO2-Measure sheet of the different type of technical improvements
CO2 reduction potential Mileage saving potential
➜ Expert assessment for the specific potential of each measure.➜ Optimistic / pessimistic range for all measures.➜ Three areas: urban, rural and highway➜ Efficiency potential depending on vehicles categories:
– Two-wheelers and small/medium size cars– Large cars, SUV’s and light commercial vehicles– Medium Duty Trucks and City Busses– Heavy Duty Trucks and Coaches
?
Green T.L. Opt.
Green T.L. Pess.
Self D. Opt.
Self D. Pess.
WLTP steady speed

3 Powertrain Scenarios 205012
3 different powertrain scenarios analysed (corner-points):
• Highly Electrified incl. Electrified Road Systems (HE-ERS)• Highly Electrified incl. Hydrogen (HE-H)• Hybrids Scenario (Hyb)
In this scenario the long distance electric vehicles operate with
Hydrogen energy
For Heavy duty trucks and Bus coaches: Electric energy by:
Electric Road System or Battery on-board
Scenarios assumptions as input for the study:
Hybrid Scenario, Why?
Maybe the infrastructure will not develop fully for
Electric and Hydrogen
PHEV = ability to run a significant distance
pure electric
13
Details Powertrain Scenarios 2050
Small/Med. PC 2. wheeler
Large PC/Large SUV
LCV/Delivery Van
City Bus Medium Duty Truck
Heavy Duty Truck Coach
37.5%20% 20%
50%
15%
60%
25% 60% 60% 70%
20%
37.5%20% 20%
50%
15% 20%
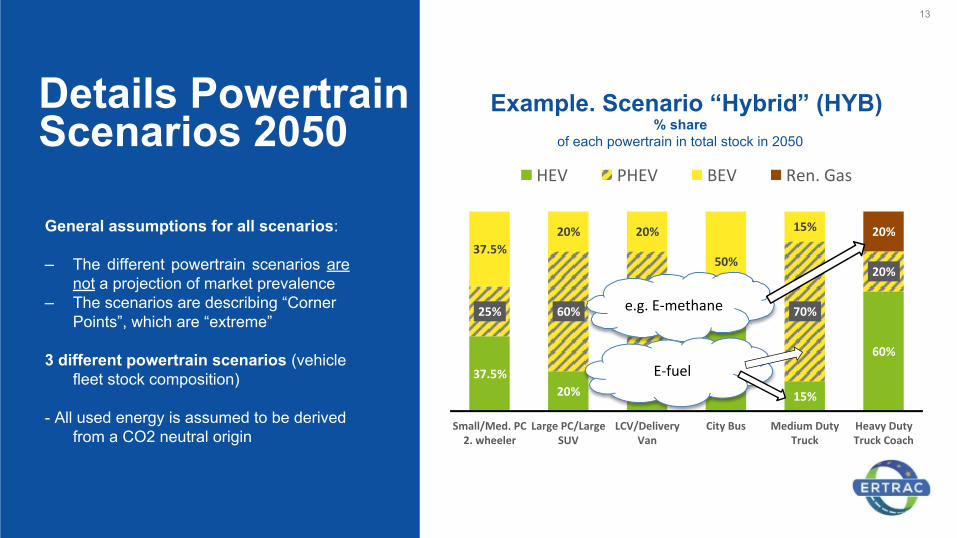
Example. Scenario “Hybrid” (HYB)
HEV PHEV BEV Ren. Gas
% share of each powertrain in total stock in 2050
General assumptions for all scenarios:
– The different powertrain scenarios are not a projection of market prevalence
– The scenarios are describing “Corner Points”, which are “extreme”
3 different powertrain scenarios (vehicle fleet stock composition)
- All used energy is assumed to be derived from a CO2 neutral origin
e.g. E-methane
E-fuel

www.ertrac.org
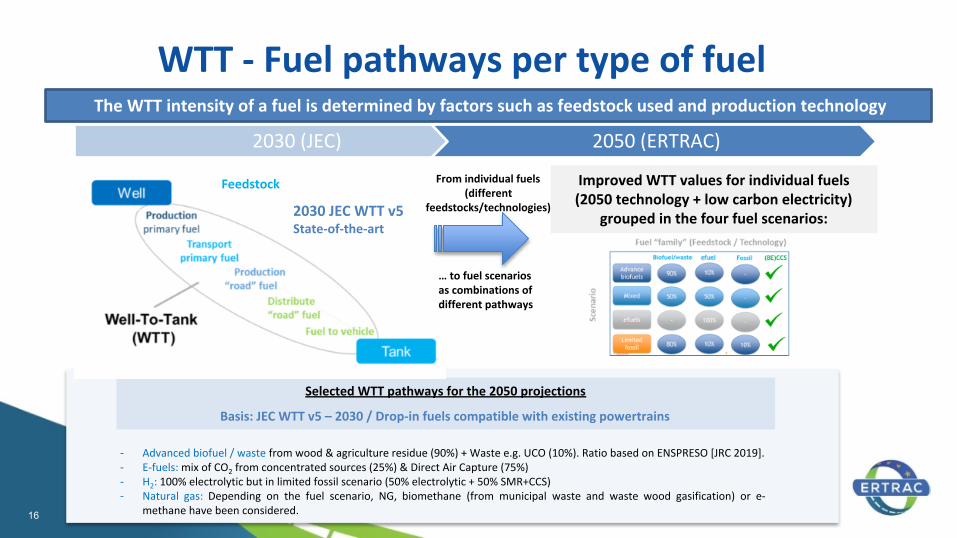
WTT - Fuel pathways per type of fuelThe WTT intensity of a fuel is determined by factors such as feedstock used and production
technology Many fuel routes (WTT) can be considered towards 2050
E.g. Advanced biofuel pathwaysMultiple routes
E.g. e-fuels
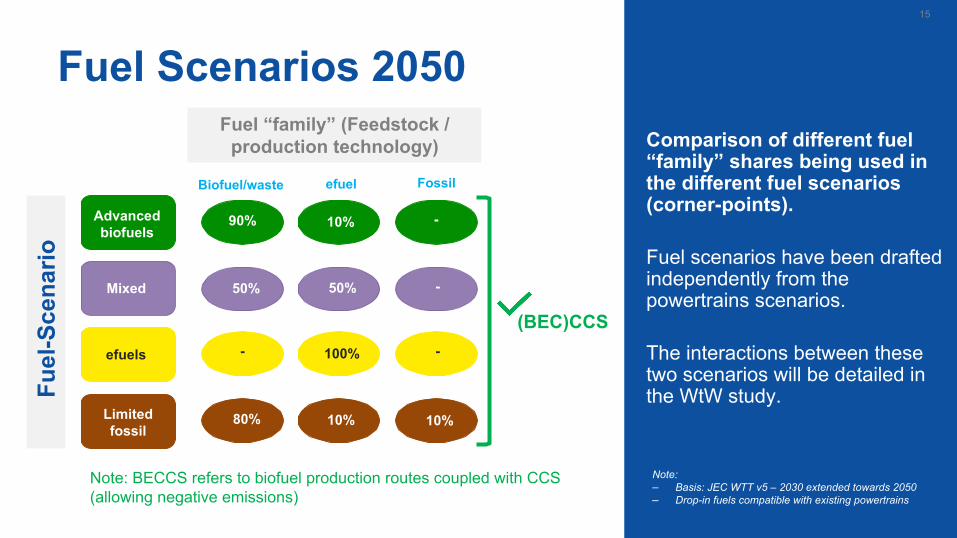
Fuel Scenarios 2050 Comparison of different fuel “family” shares being used in the different fuel scenarios (corner-points).
Fuel scenarios have been drafted independently from the powertrains scenarios.
The interactions between these two scenarios will be detailed in the WtW study.
15
Fue
l-Sce
nario
Fuel “family” (Feedstock / production technology)
Note: BECCS refers to biofuel production routes coupled with CCS (allowing negative emissions)
Biofuel/waste efuel Fossil
Advanced biofuels
Mixed
efuels
Limitedfossil
90% 10% -
-
--
10% 10%
50% 50%
100%
80%
(BEC)CCS
Note:– Basis: JEC WTT v5 – 2030 extended towards 2050 – Drop-in fuels compatible with existing powertrains
www.ertrac.org
The WTT intensity of a fuel is determined by factors such as feedstock used and production technology
16
WTT - Fuel pathways per type of fuel
- Advanced biofuel / waste from wood & agriculture residue (90%) + Waste e.g. UCO (10%). Ratio based on ENSPRESO [JRC 2019].- E-fuels: mix of CO2 from concentrated sources (25%) & Direct Air Capture (75%)- H2: 100% electrolytic but in limited fossil scenario (50% electrolytic + 50% SMR+CCS)- Natural gas: Depending on the fuel scenario, NG, biomethane (from municipal waste and waste wood gasification) or e-
methane have been considered.
Selected WTT pathways for the 2050 projections
Basis: JEC WTT v5 – 2030 / Drop-in fuels compatible with existing powertrains
2030 JEC WTT v5State-of-the-art
Improved WTT values for individual fuels (2050 technology + low carbon electricity)
grouped in the four fuel scenarios:
From individual fuels(different
feedstocks/technologies)
… to fuel scenarios as combinations of different pathways
Feedstock
2030 (JEC) 2050 (ERTRAC)
www.ertrac.org17 29/04/2021
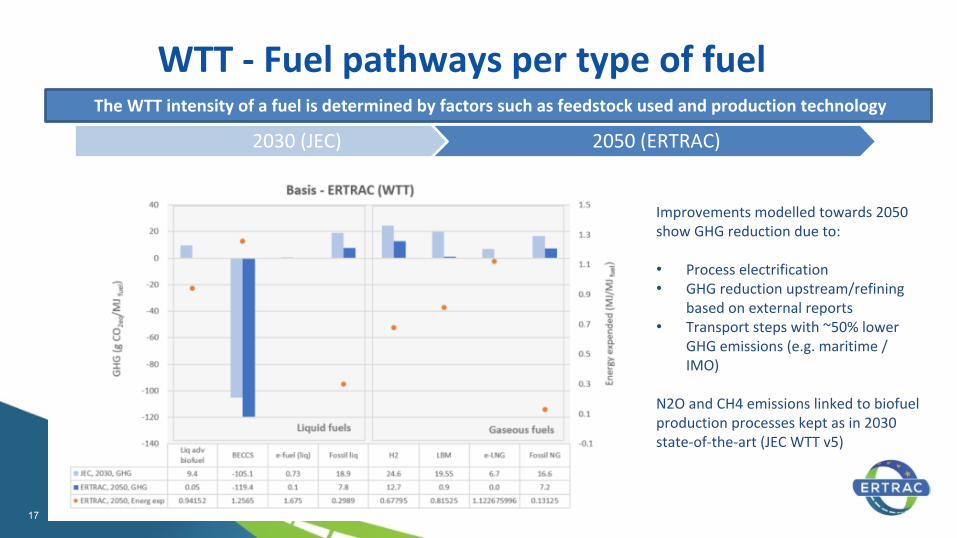
The WTT intensity of a fuel is determined by factors such as feedstock used and production technology
WTT - Fuel pathways per type of fuel
2030 (JEC) 2050 (ERTRAC)
Improvements modelled towards 2050 show GHG reduction due to:
• Process electrification• GHG reduction upstream/refining
based on external reports• Transport steps with ~50% lower
GHG emissions (e.g. maritime / IMO)
N2O and CH4 emissions linked to biofuel production processes kept as in 2030 state-of-the-art (JEC WTT v5)
Overview of the WTT study
18
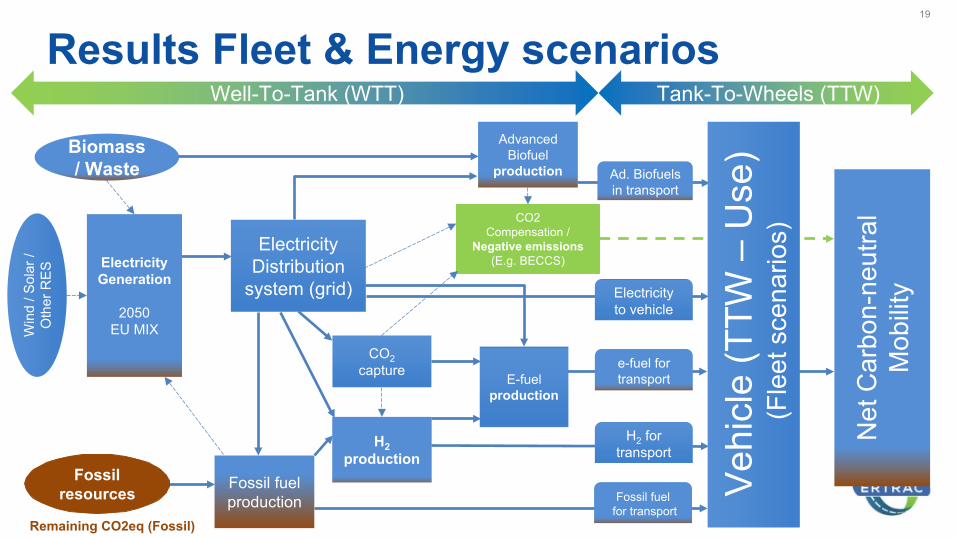
Results Fleet & Energy scenarios19
ElectricityDistribution
system (grid)
CO2capture
H2production
E-fuelproduction
AdvancedBiofuel
production
Net
Car
bon-
neut
ral
Mob
ility
Well-To-Tank (WTT) Tank-To-Wheels (TTW)
CO2Compensation /
Negative emissions(E.g. BECCS)Electricity
Generation
2050 EU MIX
Vehi
cle
(TTW
– U
se)
(Fle
et s
cena
rios)
Biomass / Waste
Fossil resources
Win
d / S
olar
/ O
ther
RES
Ad. Biofuels in transport
Electricity to vehicle
e-fuel for transport
H2 for transport
Fossil fuel for transport
Fossil fuel production
Remaining CO2eq (Fossil)
20
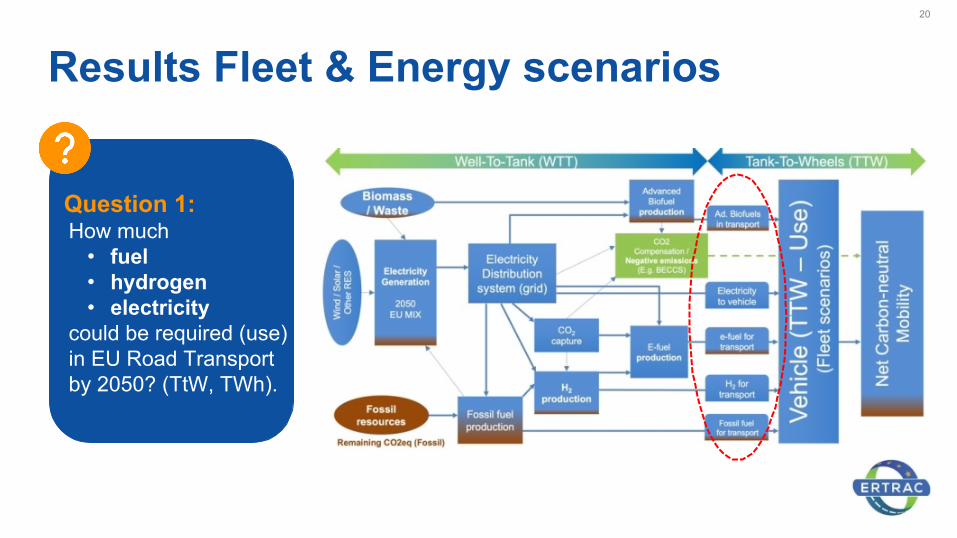
Results Fleet & Energy scenarios
Question 1:How much
• fuel• hydrogen• electricity
could be required (use) in EU Road Transport by 2050? (TtW, TWh).

21
Fuel H2 Electricity0
200400600800
10001200
82
65596
373
Highly electrified + ERSTWH
Optimistic case
Pessmis. case
Total TTW (range)~ 730-1200 TWh
Fuel H2 Electricity
12001000
800600400200
0 71
52334167
260
225
Highly electrified with H2TWH
Total TTW (range)~ 930-1500 TWh
Fuel H2 Electricity0
200400600800
1000120014001600
940
262
573
137
Hybrids ScenariosTWH
Total TTW (range)~1200 – 1900 TWh
Significant reduction of fleet-average TTW Energy Consumption:The total TTW energy consumption could range between ~730 and 1900 TWh. A significant reduction is shown in all scenarios considered (45% to 80% savings) in total energy requirement versus 2015. (As a reference, 290 Mtoe consumed in the EU road transp. 2015 <> 3400 TWh).
Fuel: Significant reduction compared to EU road transport sector in 2015.In the highly electrified scenarios the savings in fuel consumption are up to 98%.The highest use of fuel (Hybrids-Scenario) varies between 940 and 1510 TWh 55% to 70% savings
Hydrogen:The use of Hydrogen ranges between 520 and 780 TWh (Highly electrified with H2 scenario).
Electricity: Road Vehicles consume directly up to 35% of total 2015 EU final electricity consumption. The use of electricity ranges from ~260 up to 1000 TWh (the latter in the highest electrified scenario (HE + ERS scenario) which represents ~35% of total EU-wide electricity consumption in 2015).
Efficiency is paramount (Delta “Optimistic-Pessimistic”)Technical measures (A,B and C) targeting efficiency improvement
• Vehicle• Traffic condition• System improvements
Potential to reduce the energy consumption by ~35-40%, showing the importance of boosting R&D in these areas.
Question 1:How much fuel/hydrogen/electricity could be required (use) in EU Road Transport by 2050? (TtW, TWh).
22
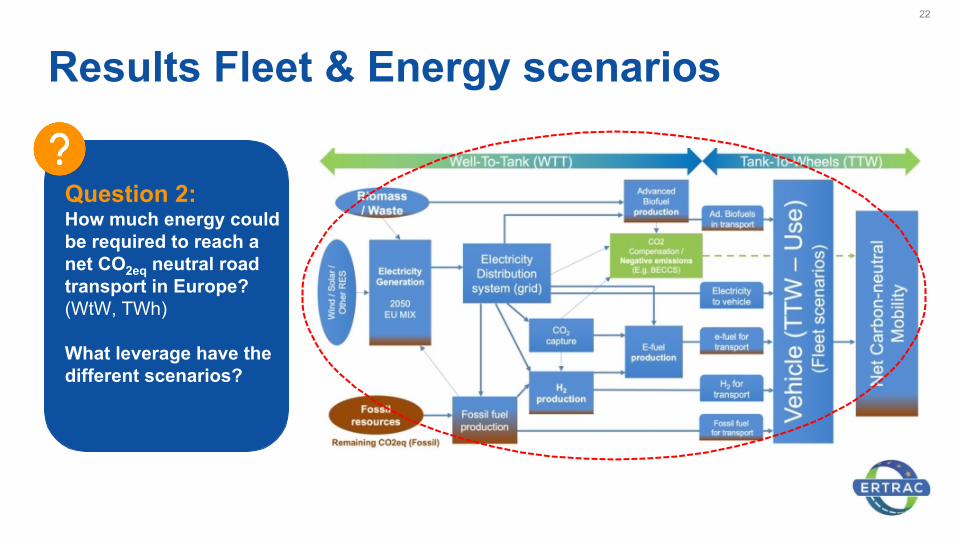
Results Fleet & Energy scenarios
Question 2:How much energy could be required to reach a net CO2eq neutral road transport in Europe? (WtW, TWh)
What leverage have the different scenarios?
23
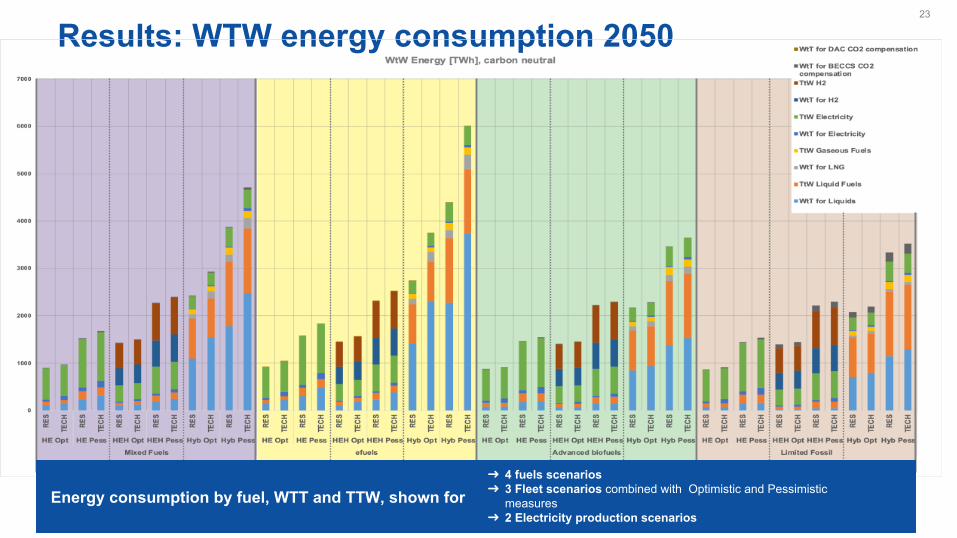
Results: WTW energy consumption 2050
Energy consumption by fuel, WTT and TTW, shown for➜4 fuels scenarios➜3 Fleet scenarios
combined with Optimistic and Pessimistic measures
➜2 Electricity production scenarios
Energy consumption by fuel, WTT and TTW, shown for ➜ 4 fuels scenarios➜ 3 Fleet scenarios combined with Optimistic and Pessimistic
measures ➜ 2 Electricity production scenarios

24
Results Fleet & Energy scenarios
E-Fuels production without 100%
renewable electricity is not a reasonable
scenario!
The variation in the WTW Energy demand between
the fleet scenarios is up to ~3000 TWh
the optimistic–pessimistic case is up to ~1500 TWh
the fuel scenarios is about ~1000 TWh
electricity production scenarios up to ~250 TWh
The share of TTW in the whole WTW energy consumption varies between ~50% up to 90%, increasing with the level of fleet electrification.
Gro
win
g le
vera
ge
Question 2:How much energy could be required to reach a net CO2eq neutral road transport in Europe?What leverage have the different scenarios? (WtW, TWh, CO2 neutral)
DISCLAIMERERTRAC 2050 CO2-StudyRESULTS
➜E-Fuels production without 100% renewable electricity is not a resonable scenario!➜In the following slides we mainly focus on the 100% renewable electricity scenario (RES), combined with all fleet and fuel scenarios.

25
Results Fleet & Fuel scenarios
Total WTW (range)~ 980 - 4700 TWh (1.5TECH)~ 890 - 3700 TWh (100% RES)
Total WTW (range)~ 920 - 3700 TWh (1.5TECH)~ 860 - 3400 TWh (100% RES)
Total WTW (range)~ 910 - 3500 TWh (1.5TECH)~ 860 - 3300 TWh (100% RES)
Total WTW (range)~ 900 - 4400 TWh (100% RES)
~ 13
3%
The fuel-scenarios have a maximum impact of ~33% (Hybrids Scenario)
In highly electrified scenarios, the
differences between the fuel scenarios are not significant
Question 3:How does the fuel-scenarios influence the energy request in a net CO2eq neutral road transport? (WtW, TWh, CO2 neutral)
26
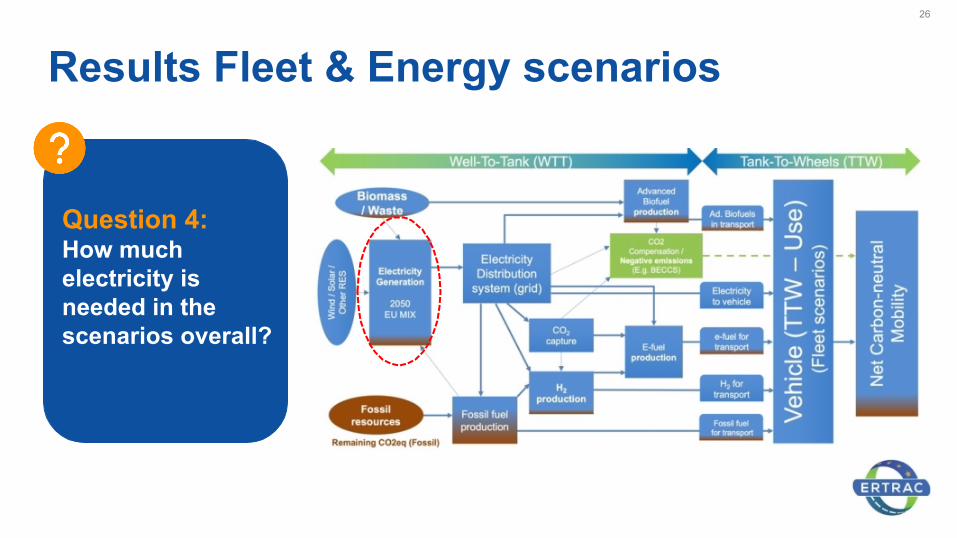
Results Fleet & Energy scenarios
Question 4:How much electricity is needed in the scenarios overall?

Results Fleet & Energy scenarios27
Question 4:How much electricity is needed in the scenarios overall?
Total WTW (range)~ 900 - 3300 TWh (1.5TECH)~ 810 - 2500 TWh (100% RES)
Total WTW (range)~ 900 - 4400 TWh (100% RES)
Total WTW (range)~780- 2100 TWh (1.5TECH)~600- 1240 TWh (100% RES)
Total WTW (range)~ 680 - 1440 TWh (1.5TECH)~ 570 - 1350 TWh (100% RES)
➜ The differences between the electricity scenarios (RES and 1.5TECH) are pretty small.
➜ The total electricity generated responds to the needs for electricity in the fuel production (WTT) as well as the final use in the directly electrified powertrains (BEVs) or indirectly electrified (ICE with e-fuels / FCHEV with green H2).
➜ Wide variation in total electricity request: Range between 600 TWh up to 4400 TWh (representing from ~20% up to ~160% of total EU-28 final electricity consumption in 2019 (2800 TWh).
➜ The limited fossil and advanced biofuel scenario result in the lowest electricity needs (between ~20% to 30% of EU-28 final electricity consumption 2019).
➜ The absolute extreme values for electricity request are always linked with the Hybrid Fleet: In combination with e-Fuels the absolute maximum is reached, in combination with “adv. biofuels” or “limited fossil” the absolute minimum is reached.
➜ In the highly electrified scenarios, the electricity demand is towards the lower-end of the different explored scenarios (~40% to 55% of EU28 el. Cons. 2019).
28
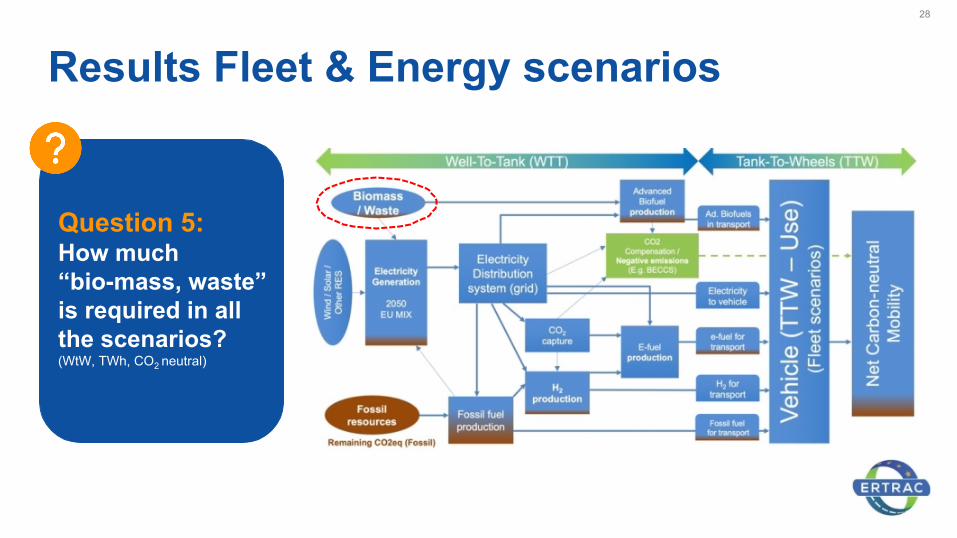
Results Fleet & Energy scenarios
Question 5:How much “bio-mass, waste” is required in all the scenarios? (WtW, TWh, CO2 neutral)

29
Results Fleet & Energy scenariosQuestion 5:How much „biomass and/or waste“ may be required in all the scenarios? (TWh)
The demand from Road Transport for Biomass and/or Waste for the production of advanced biofuels could range from ~5 -100 Mtoe/y.
➜The highest consumption refers to the Hybrids scenario (~65 Mtoe/y up to ~100 Mtoe/y opt. /pess. case)
➜The limited fossil scenario (10% fossil share) reduces a little bit (~10 Mtoe/y) the pressure on biomass.
Additional investigations will be needed to verify the potential considering the needs of other sectors.
According to the ENSPRESO REPORT [JRC 2019], the total sustainable bioenergy supply potential at European level (2050) could range from to ~190 Mtoe/y (~ 8,000 PJ) up to 500 Mtoe/y (~21,000 PJ/y).
30
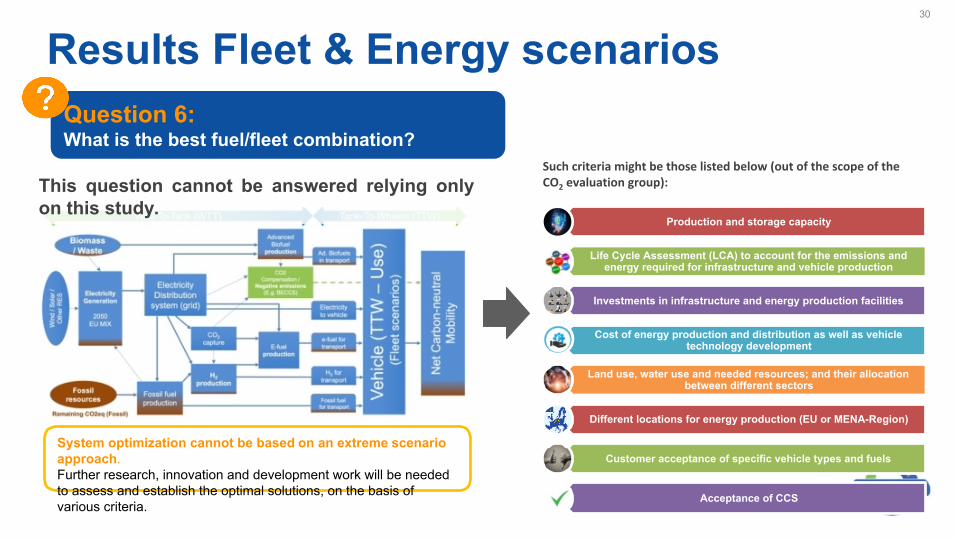
Results Fleet & Energy scenarios
System optimization cannot be based on an extreme scenario approach. Further research, innovation and development work will be needed to assess and establish the optimal solutions, on the basis of various criteria.
This question cannot be answered relying only on this study.
Production and storage capacity
Life Cycle Assessment (LCA) to account for the emissions and energy required for infrastructure and vehicle production
Investments in infrastructure and energy production facilities
Cost of energy production and distribution as well as vehicle technology development
Land use, water use and needed resources; and their allocation between different sectors
Different locations for energy production (EU or MENA-Region)
Customer acceptance of specific vehicle types and fuels
Acceptance of CCS
Such criteria might be those listed below (out of the scope of the CO2 evaluation group):
Question 6:What is the best fuel/fleet combination?

CONCLUSIONS
31

32
Conclusions➜ To achieve “carbon-neutral” road transport (WtW) in 2050, drastic changes
are needed in all three areas: ➜ Vehicle fleet and efficiency, powertrains and traffic technology, ➜ Infrastructure➜ Energy Production (electricity, hydrogen and renewable fuels)
➜ The complete and robust carbon-neutrality of road transport could be achieved with a mix of technologies, where electrification is the key element for the reduction of the CO2 emissions.
➜ BEV (possibly combined with ERS), ➜ PHEV, ➜ FCEV and Advanced Hybrid powertrains.
Note: the mix of these powertrain options will strongly depend on the development of the infrastructure (charging infrastructure, ERS, hydrogen filling stations, production capacities for renewable fuels etc.)
➜ The overall WtW energy demand decreases drastically with fleet electrification
33
Conclusions➜ The energy efficiency measures identified (A, B and C) reduce the
energy / fuel consumption in all scenarios in a very significant way.
➜ The demand for fuels decreases massively in all scenarios (in highly electrified scenarios up to 95% savings).
➜ In strongly electrified scenarios, the WtW differences in energy consumption between the fuel scenarios are quite small.
➜ The total demand for electricity in road transport will increase (energy production + use in vehicle)
➜ 20%-30% of total EU28 el.cons. 2019 in advanced biofuels or limited fossil scenarios combined with hybrid fleet.
➜ 40%-55% of total EU28 el. cons. 2019 in highly electrified scenarios
➜ up to 1.6 time of total EU28 el. cons. 2019 if e-fuels are used along with a hybrid fleet
➜ The largely Carbon-Neutral production of electricity is a prerequisite for “carbon-neutral” road transport in all fleet and fuel scenarios.
34
ConclusionsResearch Recommendations and Priorities:
1. Enable fleet mix change by ➜ Improving powertrain technology: cost, range, functionality, …➜ Adapting infrastructure technology and concepts
2. Efficiency improvements by➜ Measure A: Vehicle➜ Measure B: Traffic conditions➜ Measure C: Traffic Reduction Technologies
Beside Road Transport:➜ Renewable electricity generation capacity (inside and outside of Europe)
➜ Net carbon-neutral H2 and fuel production (inside and outside of Europe)
➜ Technology and capacity of CCS and DAC
➜ Availability of raw materials and sustainable feedstocks (appraised in a life-cycle analysis perspective)

Next steps 35
➜Stay tuned for the detailed presentation to ERTRAC members (tentative date: 29th April)
➜The publication is under finalization.
In the meantime, you can find the previous publication online: EU road vehicle energy consumption and CO2 emissions by 2050 – Expert-based scenarios

Marko GernuksVolkswagen(cars)
OEM
Staffan LundgrenVolvo (trucks)
OEM
Christophe PetitjeanValeo
Supplier
Peter PrenningerAVL
Research Provider
Simon EdwardsRicardo
Research Provider
Zissis SamarasAristotle University
Academia
Gaetano de-PaolaIFPEN
Cities and Regions
Holger HeinfelderUmweltbundesamt (AT)
Member States
Stephan NeugebauerBMW Chair
Georgios FontarasJRC
CO2 assessment for the fleet
Jette KrauseJRC
CO2 assessment for the fleet
Marta YugoConcawe
Energy / CO2 assessment for the
WTT / fuel scenarios
Roland DauphinConcawe
Energy / CO2 assessment for the
WTT / fuel scenarios
36
ERTRAC CO2 Evaluation Group*
* Each Member of ERTRAC Executive Group nominated specific experts

Thank you!
37