care systems analytics for meditech users guide · vmware, inc. 5 about this book vmware...
TRANSCRIPT
Care Systems Analytics for MEDITECHUsers Guide
VMware Care Systems Analytics for MEDITECH Management Pack forvRealize Operations Manager
This document supports the version of each product listed andsupports all subsequent versions until the document is replacedby a new edition. To check for more recent editions of thisdocument, see http://www.vmware.com/support/pubs.

VMware, Inc.3401 Hillview Ave.Palo Alto, CA 94304www.vmware.com
2 VMware, Inc.
Care Systems Analytics for MEDITECH Users Guide
You can find the most up-to-date technical documentation on the VMware Web site at:
http://www.vmware.com/support/
The VMware Web site also provides the latest product updates.
If you have comments about this documentation, submit your feedback to:
Copyright © 2015 VMware, Inc. All rights reserved. Copyright and trademark information
VMware, Inc. 3
Contents
Contents
About This Book 4
Introduction to Care Systems Analytics for MEDITECH 6Operations Manager Features 7
Operations Manager Concepts 7
Collecting Data 7
Analyzing Data 8
Accessing Care Systems Analytics for MEDITECH 9
MEDITECH Components Monitored in Care Systems Analytics 10
MEDITECH Object Hierarchy 10
Care Systems Analytics for MEDITECH Adapter Dashboards 11
MEDITECH Monitored Performance Activities 13
MEDITECH Monitored Applications 15
Monitoring with Care Systems Analytics for MEDITECH 16Log In to the vRealize Operations Manager User Interface 16
Monitor Day‐to‐Day Operations 16
Care Systems Analytics for MEDITECH Dashboards 17
MEDITECH Health Overview Dashboard 17
MEDITECH Applications Dashboard 19
MEDITECH Background Jobs Dashboard 20
MEDITECH Application Database Graph Dashboard 21
MEDITECH Machine Database Graph Dashboard 22
MEDITECH Hub Transfer Queues Dashboard 22
MEDITECH PCS Transfer Queues Dashboard 23
MEDITECH App Analysis Dashboard 25
MEDITECH Database Analysis Dashboard 25
MEDITECH Server Analysis Dashboard 27
MEDITECH Server Top‐N Dashboard 27
MEDITECH Inventory Trees 29
Review Overall Health Indicators 30
Review Troubleshooting Detail in vRealize Operations Manager 32
MEDITECH Symptoms and Alerts 33
VMware, Inc. 4
The Care Systems Analytics for MEDITECH Users Guide describes how to use the VMware® Care Systems
Analytics for MEDITECH Management Pack on vRealize Operations Manager to monitor your MEDITECH®
system.
Intended AudienceThis information is intended for anyone who needs to use the Care Systems Analytics for MEDITECH
management pack.
This information assumes you are experienced with vRealize Operations Manager and MEDITECH. See
VMware vRealize Operations Manager documentation at: http://www.vmware.com/support/. See your
MEDITECH documentation, as needed.
VMware Technical Publications GlossaryVMware Technical Publications provides a glossary of terms that might be unfamiliar to you. For definitions
of terms as they are used in VMware technical documentation go to http://www.vmware.com/support/pubs.
Document FeedbackVMware welcomes your suggestions for improving our documentation. If you have comments, send your
feedback to [email protected].
Technical Support and Education ResourcesThe following sections describe the technical support resources available to you. To access the current version
of this book and other books, go to http://www.vmware.com/support/pubs.
Online and Telephone Support
To use online support to submit technical support requests, view your product and contract information, and
register your products, go to http://www.vmware.com/support.
Customers with appropriate support contracts should use telephone support for the fastest response on
priority 1 issues. Go to http://www.vmware.com/support/phone_support.
Support Offerings
To find out how VMware support offerings can help meet your business needs, go to
http://www.vmware.com/support/services.
About This Book

VMware, Inc. 5
About This Book
VMware Professional Services
VMware Education Services courses offer extensive hands‐on labs, case study examples, and course materials
designed to be used as on‐the‐job reference tools. Courses are available onsite, in the classroom, and live
online. For onsite pilot programs and implementation best practices, VMware Consulting Services provides
offerings to help you assess, plan, build, and manage your virtual environment. To access information about
education classes, certification programs, and consulting services, go to http://www.vmware.com/services.

VMware, Inc. 6
1
VMware® Care Systems Analytics for MEDITECH is an IT management solution designed for healthcare
organizations that use the MEDITECH® platform. The solution extracts system information from the
MEDITECH SIRT share path and integrates it with VMware vRealize Operations Manager to create a single
view of system performance across the Electronic Health Record (EHR) platform and supporting
infrastructure.
Care Systems Analytics for MEDITECH is a management pack for vRealize Operations Manager. This is an
intelligent operations management solutions from VMware. The Care Systems Analytics for MEDITECH
solution improves visibility into the overall performance of the MEDITECH system–from infrastructure to the
point of care. It includes dashboards, widgets, and patented self‐learning techniques to visualize and analyze
performance indicators from MEDITECH specific departmental metrics and related infrastructure (physical
and virtual).
Use this solution to help you increase collaboration across infrastructure, operations, and applications teams;
reduce expensive and disruptive outages by providing insight into application, database, and infrastructure
metrics; and anticipate and prevent potential problems, by quickly troubleshooting issues to resolution.
Figure 1-1. Flow of Care Systems Analytics for MEDITECH component data into the Operations Manager.
Introduction to Care Systems Analytics for MEDITECH 1
NOTE For the purposes of this guide:
The terms Management Pack, Adapter, and Solution are used interchangeably and generally apply to
Care Systems Analytics for MEDITECH.

VMware, Inc. 7
Chapter 1 Introduction to Care Systems Analytics for MEDITECH
Operations Manager Features
The Operations Manager collects performance data from each object at every level of your virtual
environment, from individual virtual machines and disk drives to entire clusters and data centers. It stores and
analyzes the data, and uses that analysis to provide real‐time information about problems, or potential
problems, anywhere in your virtual environment.
The Operations Manager works with existing VMware products to add the following functionality:
Combines key metrics into single scores for environmental health, efficiency, and capacity risk.
Calculates the range of normal behavior for every metric and highlights abnormalities. Adjusts the
dynamic thresholds as incoming data allows it to better define the normal values for a metric.
Presents graphical representations of current and historical states of your entire environment or selected
parts of it.
Figure 1-2. Sample Operations Manager Functions
Operations Manager ConceptsTo use Care Systems Analytics for MEDITECH you need to understand the basic functions of the Operations
Manager. See the VMware documentation specific to your Operations Manager at
http://www.vmware.com/support/pubs.
The Operations Manager uses certain concepts that can help you understand the product, its interface, and
how to use it.
Collecting Data
The Operations Manager collects data from any number of generally available management packs and custom
integrations that interface with external element managers. To understand the concepts of data collection and
how that data is managed with the Operations Manager, review the following terms.
Resources ‐ Solutions adapters, when loaded in to the Operations Manager, create a series of constructs
to support the types of data collected and stored by the adapter. Resources are created as instances of the
Resource Kind definition.
Resource Tags ‐ A type of information, such as Application or GEO Location. Creating resource tags and
tag values makes it easier to find resources and metrics in the Operations Manager. With resource tags,
you select the tag value assigned to a resource and view the list of resources that are associated with that
tag value.
Management Packs (Embedded Adapters) ‐ Gather and send information from resources to the
Operations Manager for processing. These are Java components that run as plug‐ins in the Collector. They
actively connect to a data source and pull values from it.
NOTE Skip this section if you are already familiar with vRealize Operations Manager features and concepts.

VMware, Inc. 8
Chapter 1 Introduction to Care Systems Analytics for MEDITECH
Adapter Instance ‐ Defines the type of adapter to use to connect to a particular data source. It also defines
the information that is required to identify and access that data source. The Operations Manager
administrator must define an adapter instance for each data source that uses an embedded adapter. An
adapter instance definition typically includes the data access method and a host, port, and credential. The
exact information in a particular adapter instance definition depends on the type of adapter.
Attributes ‐ Solutions adapters, when loaded in to the Operations Manager create a series of constructs
to support the types of data collected and stored by the adapter. Attributes are created as definitions of
data types of data points that can be collected by the Operations Manager.
Metric ‐ An instance of an attribute for a specific resource. The Operations Manager collects these metrics,
which are stored as data points with their associated value and timestamp.
Metric Value ‐ A single data point, which is representative of a specific Resource, specific Attribute,
specific timestamp and specific value.
Collect Cycle ‐ Each management pack has adapter instances defined to specify a data source to collect
from using that management packʹs capabilities. These adapter instances have a default data collection
interval of 5 minutes. This interval can be adjusted if necessary, however is not recommended.
Analyzing Data
The Operations Manager performs analysis on the data collected.
Dynamic Thresholds ‐ The Operations Manager defines dynamic thresholds for every metric based on
the current and historical values of the metric. The normal range of values for a metric can differ on
different days at different times because of regular cycles of use and behavior. The Operations Manager
tracks these normal value cycles and sets the dynamic thresholds accordingly. High metric values that are
normal at one time might indicate potential problems at other times. For example, high CPU use on Friday
afternoons, when weekly reports are generated, is normal. The same value on Sunday morning, when
nobody is at the office, might indicate a problem.
The Operations Manager continuously adjusts the dynamic thresholds. The new incoming data allows the
Operations Manager to better define what value is normal for a metric. The dynamic thresholds add
context to metrics that allow the Operations Manager to distinguish between normal and abnormal
behavior.
Dynamic thresholds eliminate the need for the manual effort required to configure hard thresholds for
hundreds or thousands of metrics. More importantly, they are more accurate than hard thresholds.
Dynamic thresholds allow the Operations Manager to detect deviations based on the actual normal
behavior of an object and not on an arbitrary set of limits.
The analytics algorithms take seven days to calculate the initial values for dynamic thresholds. Dynamic
thresholds continue to improve as additional data is collected with significant quality beginning after
about 4 weeks. Dynamic thresholds appear as line segments under the bar graphs for use metrics on the
Details page and on the Scoreboard page. The length and the position of the dynamic threshold line
segment depends on the calculated normal values for the selected use metrics. Dynamic thresholds also
appear as shaded gray areas of the use metrics graphs on the All Metrics page.
Hard Thresholds ‐ Unlike dynamic thresholds, hard thresholds can be set to capture fixed metric values.
Several progressive levels of criticality can be defined using different fixed values. These values must be
set and maintained manually, however they can be helpful in highlighting best practices and known
absolute values.
Key Performance Indicators (KPI) ‐ The Operations Manager defines attributes that are critical to the
performance of an object as key performance indicators. KPI are weighted more heavily in the calculations
that determine the health of an object. Graphs of KPI performance appear before other metrics in several
areas of the product.
VMware, Inc. 9
Chapter 1 Introduction to Care Systems Analytics for MEDITECH
Alerts and Faults ‐ The Operations Manager generates alerts when events occur on the monitored objects,
when data analysis indicates deviations from normal metric values, or when a problem occurs with one
of the Operations Manager components. Use the symptoms and recommendations provided to aid your
analysis of data.
Accessing Care Systems Analytics for MEDITECH
Access and view Care Systems Analytics for MEDITECH status, on vRealize Operations Manager, through the
user interface. The user interface includes:
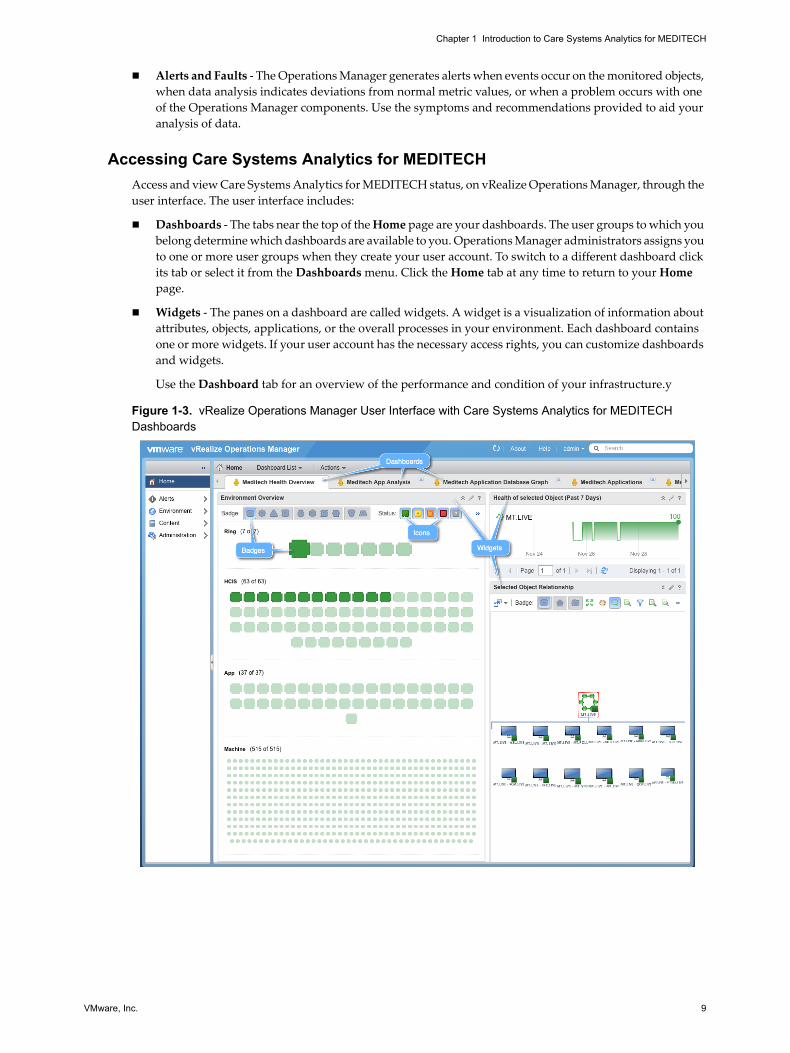
Dashboards ‐ The tabs near the top of the Home page are your dashboards. The user groups to which you
belong determine which dashboards are available to you. Operations Manager administrators assigns you
to one or more user groups when they create your user account. To switch to a different dashboard click
its tab or select it from the Dashboards menu. Click the Home tab at any time to return to your Home
page.
Widgets ‐ The panes on a dashboard are called widgets. A widget is a visualization of information about
attributes, objects, applications, or the overall processes in your environment. Each dashboard contains
one or more widgets. If your user account has the necessary access rights, you can customize dashboards
and widgets.
Use the Dashboard tab for an overview of the performance and condition of your infrastructure.y
Figure 1-3. vRealize Operations Manager User Interface with Care Systems Analytics for MEDITECH Dashboards
VMware, Inc. 10
Chapter 1 Introduction to Care Systems Analytics for MEDITECH
MEDITECH Components Monitored in Care Systems AnalyticsThe Care Systems Analytics for MEDITECH management pack provides integration between the Operations
Manager and the MEDITECH environment. The MEDITECH environment includes:
MEDITECH application ‐ MEDITECHʹs tool for MEDITECH application monitoring. It consolidates data
collected from various resources into a single data file, the SIRT file. The Care Systems Analytics for
MEDITECH management pack uses the MEDITECH SIRT file to gather information about resources and
metrics from the environment running MEDITECH.
MEDITECH SIRT file ‐ MEDITECH’s resource data file, the Statistical Information Retrieval Tool (SIRT).
This file:
Allows for important site statistical information to be communicated back to the MEDITECH from
the MEDITECH installation site.
Allows MEDITECH to be more proactive in supporting customers.
DKACT ‐ DKACT is a time sharing protection mechanism describing the length of the queue for a certain
resource or database structure.
ANP Server Information ‐ Spikes seen here indicate that the ANP service is not able to keep up with disk
activity.
mtJo Lock Retries ‐ A metric that should be close to flatline.
HCIS ‐ HealthCare Information System.
NPR ‐ Non ‐Procedural Representation Language.
M/AT ‐ MEDITECH Advanced Technology.
File Servers ‐ Responsible for all database and file management functions within the MEDITECH
environment.
Background Job Clients ‐ Designated application machines designed for background processing.
MEDITECH Object HierarchyThe monitored component status is displayed through the listed objects. The objects are related through a
hierarchy of parent/child relationships. The following list of objects from parent to related children. Each Ring
is a tenant in MEDITECH.
Ring > HCIS > Database
Ring > HCIS > Facility > Database
MachineRole > Machine
MachineRole > Machine (Machines that are hosting databases) > Database
MachineRole > Machine (Machines that are running background jobs) > Background Job > Database
App > Database
App > Machine
App > Hub Queue > Database
App > PCS Queue > Database
VMware, Inc. 11
Chapter 1 Introduction to Care Systems Analytics for MEDITECH
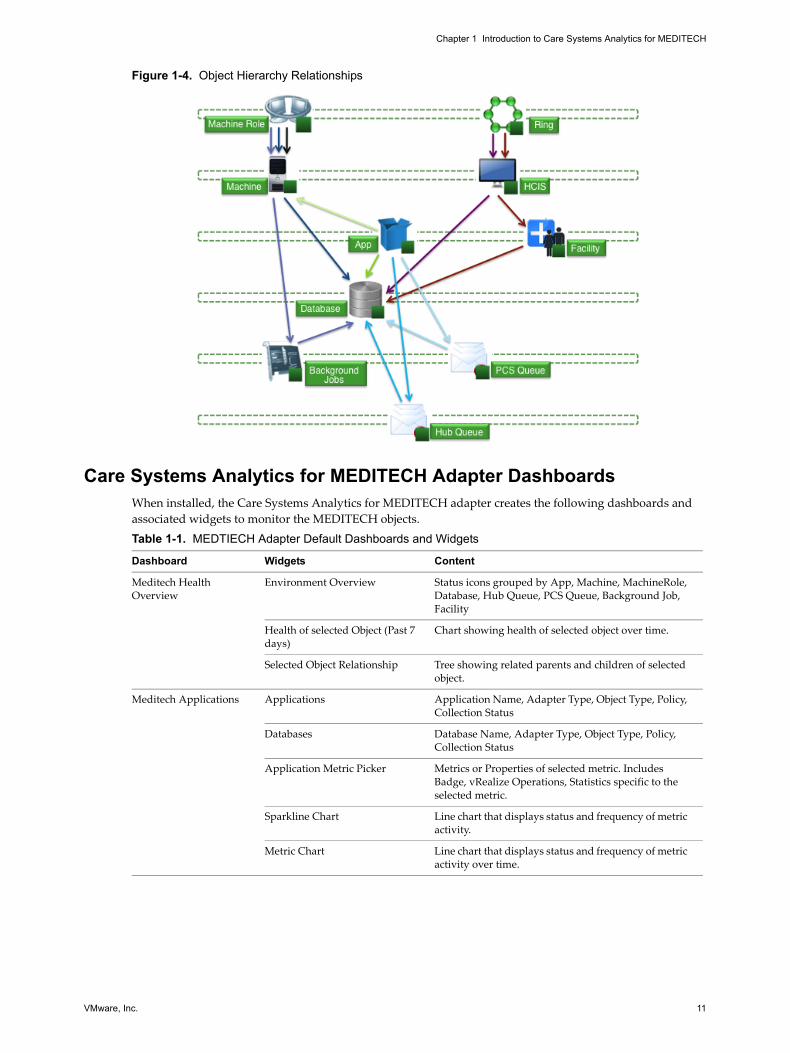
Figure 1-4. Object Hierarchy Relationships
Care Systems Analytics for MEDITECH Adapter DashboardsWhen installed, the Care Systems Analytics for MEDITECH adapter creates the following dashboards and
associated widgets to monitor the MEDITECH objects.
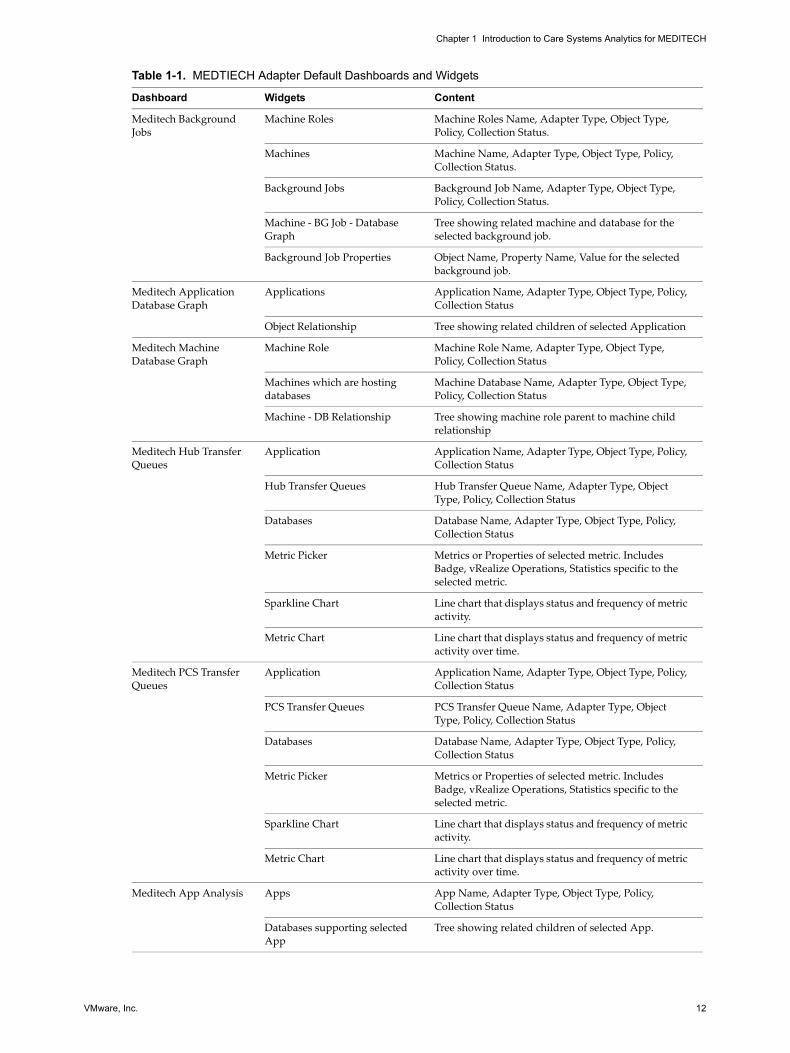
Table 1-1. MEDTIECH Adapter Default Dashboards and Widgets
Dashboard Widgets Content
Meditech Health Overview
Environment Overview Status icons grouped by App, Machine, MachineRole, Database, Hub Queue, PCS Queue, Background Job, Facility
Health of selected Object (Past 7 days)
Chart showing health of selected object over time.
Selected Object Relationship Tree showing related parents and children of selected object.
Meditech Applications Applications Application Name, Adapter Type, Object Type, Policy, Collection Status
Databases Database Name, Adapter Type, Object Type, Policy, Collection Status
Application Metric Picker Metrics or Properties of selected metric. Includes Badge, vRealize Operations, Statistics specific to the selected metric.
Sparkline Chart Line chart that displays status and frequency of metric activity.
Metric Chart Line chart that displays status and frequency of metric activity over time.
VMware, Inc. 12
Chapter 1 Introduction to Care Systems Analytics for MEDITECH
Meditech Background Jobs
Machine Roles Machine Roles Name, Adapter Type, Object Type, Policy, Collection Status.
Machines Machine Name, Adapter Type, Object Type, Policy, Collection Status.
Background Jobs Background Job Name, Adapter Type, Object Type, Policy, Collection Status.
Machine ‐ BG Job ‐ Database Graph
Tree showing related machine and database for the selected background job.
Background Job Properties Object Name, Property Name, Value for the selected background job.
Meditech Application Database Graph
Applications Application Name, Adapter Type, Object Type, Policy, Collection Status
Object Relationship Tree showing related children of selected Application
Meditech Machine Database Graph
Machine Role Machine Role Name, Adapter Type, Object Type, Policy, Collection Status
Machines which are hosting databases
Machine Database Name, Adapter Type, Object Type, Policy, Collection Status
Machine ‐ DB Relationship Tree showing machine role parent to machine child relationship
Meditech Hub Transfer Queues
Application Application Name, Adapter Type, Object Type, Policy, Collection Status
Hub Transfer Queues Hub Transfer Queue Name, Adapter Type, Object Type, Policy, Collection Status
Databases Database Name, Adapter Type, Object Type, Policy, Collection Status
Metric Picker Metrics or Properties of selected metric. Includes Badge, vRealize Operations, Statistics specific to the selected metric.
Sparkline Chart Line chart that displays status and frequency of metric activity.
Metric Chart Line chart that displays status and frequency of metric activity over time.
Meditech PCS Transfer Queues
Application Application Name, Adapter Type, Object Type, Policy, Collection Status
PCS Transfer Queues PCS Transfer Queue Name, Adapter Type, Object Type, Policy, Collection Status
Databases Database Name, Adapter Type, Object Type, Policy, Collection Status
Metric Picker Metrics or Properties of selected metric. Includes Badge, vRealize Operations, Statistics specific to the selected metric.
Sparkline Chart Line chart that displays status and frequency of metric activity.
Metric Chart Line chart that displays status and frequency of metric activity over time.
Meditech App Analysis Apps App Name, Adapter Type, Object Type, Policy, Collection Status
Databases supporting selected App
Tree showing related children of selected App.
Table 1-1. MEDTIECH Adapter Default Dashboards and Widgets
Dashboard Widgets Content

VMware, Inc. 13
Chapter 1 Introduction to Care Systems Analytics for MEDITECH
MEDITECH Monitored Performance ActivitiesThe following performance metrics are monitored for machine objects.
% Processor Time
ANP Server
% Privileged Time
% User Time
Conditional Replace/Sec
mtJo Index File Searches/sec
mtJo Lock Retries
Page File Faults/sec
Page File Bytes
Thread Count
Virtual Bytes
Working Set
Available MBytes
C: and E:
% Idle Time
Active %
Avg Read Q
Avg Reads/Sec
Avg Sec/Read
Avg Sec/Write
Meditech Database Analysis
Databases Database Name, # of Statistics to Analyze for each listed database
Metric Picker Metrics or Properties of selected metric. Includes Badge, vRealize Operations, Statistics specific to the selected metric.
Metric Chart Line chart that displays status and frequency of metric activity over time.
Meditech Server Analysis Machine List Machine Name, Adapter Type, Object Type, Policy, Collection Status
Machine Metric Chart ‐ Past 7 Days
Charts of performance log summaries for activities run on selected machine.
Meditech Server Top‐N Utilization tables Table for each server activity lists Utilization Index, Objects related to activity.
VMAGIC DKACT widgets show activity for this a time sharing protection mechanism describing the length of the queue for a certain resource or database structure.
ANP Server Information widgets indicate when the ANP service is not able to keep up with the listed activity.
Table 1-1. MEDTIECH Adapter Default Dashboards and Widgets
Dashboard Widgets Content

VMware, Inc. 14
Chapter 1 Introduction to Care Systems Analytics for MEDITECH
Avg Write Q
Ave Writes/Sec
Free Space
Read Bytes/Sec
Reads/Sec
Split IO/Sec
Write Bytes/Sec
Write/sec
Cache Bytes (Kernel Headroom)
Connections Established
Connections Reset
Context Switches/sec
Copy Read Hits %
CS Magic, MagicCS
% Privileged time
% User Time
Handle Count
Thread Count
Working Set
Pool Nonpaged Bytes
Pool Paged Bytes
Segments
Received/sec
Retransmitted/sec
Sent/sec
Acquires
Semaphore Acquires
Transition Faults/sec (Thrashing)
VMAGIC
Buffer Pool hits/sec
Buffer Pool misses/sec
DKACT average queue length
DKACT average wait length
DKACT uses/sec
Read Timeouts
Total Rate of queries/sec
Write Timeouts
VMware, Inc. 15
Chapter 1 Introduction to Care Systems Analytics for MEDITECH
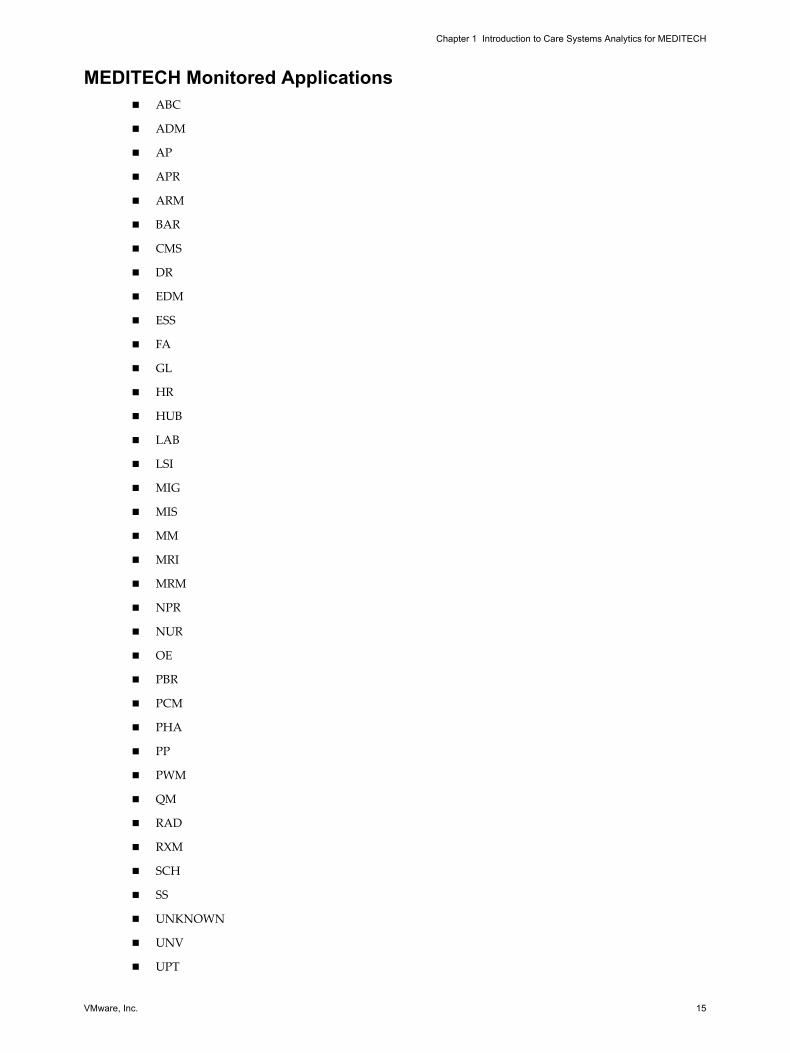
MEDITECH Monitored Applications ABC
ADM
AP
APR
ARM
BAR
CMS
DR
EDM
ESS
FA
GL
HR
HUB
LAB
LSI
MIG
MIS
MM
MRI
MRM
NPR
NUR
OE
PBR
PCM
PHA
PP
PWM
QM
RAD
RXM
SCH
SS
UNKNOWN
UNV
UPT

VMware, Inc. 16
2
Use the vRealize Operations Manager Web console for MEDITECH monitoring and analysis tasks.
Log In to the vRealize Operations Manager User InterfaceAccess to the MEDITECH component monitoring data is through the vRealize Operations Manager user
interface.
Prerequisites
Verify that the Care Systems Analytics for MEDITECH is installed in your vRealize Operations Manager.
See the VMware documentation for the vRealize Operations Manager at
http://www.vmware.com/support/pubs.
Verify that you are using a supported Web browser.
Procedure
1 In your Web browser, type the URL for the vRealize Operations Manager user interface.
https://<vrops>/
where <vrops> is the IP address or fully qualified host name of your vRealize Operations Manager. This
can be, for example, the Product UI of an Analytics cluster node.
2 Type your user name and password.
3 Click Login.
After you log in, the Home page appears in your browser window.
Monitor Day-to-Day OperationsMonitoring day‐to‐day operations involves evaluating the overall health of your enterprise and identifying
health problems for specific resources.
For each resource, the Operations Manager determines a health score, which is a 0 to 100 ranking. One of the
ways that the Operations Manager indicates the health of a resource is to show a colored indicator. The color
is based on the range of the health score.
Monitoring with Care Systems Analytics for MEDITECH 2
NOTE If your session is inactive for 30 minutes, it times out and you must log in again.
Table 2-1. Default Health Color Ranges
COLOR RANGE
Green 76 to 100
Yellow 51 to 75
Orange 26 to 50

VMware, Inc. 17
Chapter 2 Monitoring with Care Systems Analytics for MEDITECH
Care Systems Analytics for MEDITECH DashboardsCare Systems Analytics for MEDITECH resource monitoring data is displayed in default Care Systems
Analytics for MEDITECH dashboards.
MEDITECH Health Overview Dashboard
The MEDITECH Health Overview dashboard displays an overall view of the hierarchy of MEDITECH
resources to detect anomalies from the normal behavior assessed by the analytics engine. It shows details of
key metrics and health.
This dashboard contains the following widgets.
Red 1 to 25
Grey In vRealize Operations Manager, Grey is shown when a metric value is unknown, or ʺ?ʺ, or a resource is currently not collecting data through the Management Packʹs adapter instance.
Table 2-1. Default Health Color Ranges
COLOR RANGE
Widgets Content
Environment Overview Status icons grouped by App, Machine, MachineRole, Database, Hub Queue, PCS Queue, Background Job, Facility
Health of selected Object (Past 7 days) Chart showing health of selected object over time.
Selected Object Relationship Tree showing related parents and children of selected object.

VMware, Inc. 18
Chapter 2 Monitoring with Care Systems Analytics for MEDITECH
Figure 2-1. MEDITECH Health Overview Dashboard Sample
To navigate between the widgets.
1 Select a list item in the Environment Overview.
Related objects are highlighted in the Environment Overview widget.
The Health chart and the Object Relationships tree for that item are displayed.

VMware, Inc. 19
Chapter 2 Monitoring with Care Systems Analytics for MEDITECH
MEDITECH Applications Dashboard
The MEDITECH Applications dashboard provides widgets that display information about MEDITECH
applications and the servers, databases, and background jobs related to the selected application.
This dashboard contains the following widgets.
Figure 2-2. MEDITECH Applications Dashboard Sample
To navigate between the widgets.
1 Select a list item in the Applications widget to filter the Databases list.
2 Select a list item in the Database widget filter the Application Metric Picker list.
3 Double‐click a metric in the Application Metric Picker to add the Sparkline Chart for that metric. Continue
to select metrics to add multiple Sparkline Charts.
4 Double‐click a data point in the Sparkline Chart to display the Metric Chart for that data point.
Widgets Content
Applications Application Name, Adapter Type, Object Type, Policy, Collection Status.
Databases Database Name, Adapter Type, Object Type, Policy, Collection Status.
Application Metric Picker Metrics or Properties of selected metric. Includes Badge, vRealize Operations, Statistics specific to the selected metric.
Sparkline Chart Line chart that displays status and frequency of metric activity.
Metric Chart Line chart that displays status and frequency of metric activity over time.
VMware, Inc. 20
Chapter 2 Monitoring with Care Systems Analytics for MEDITECH
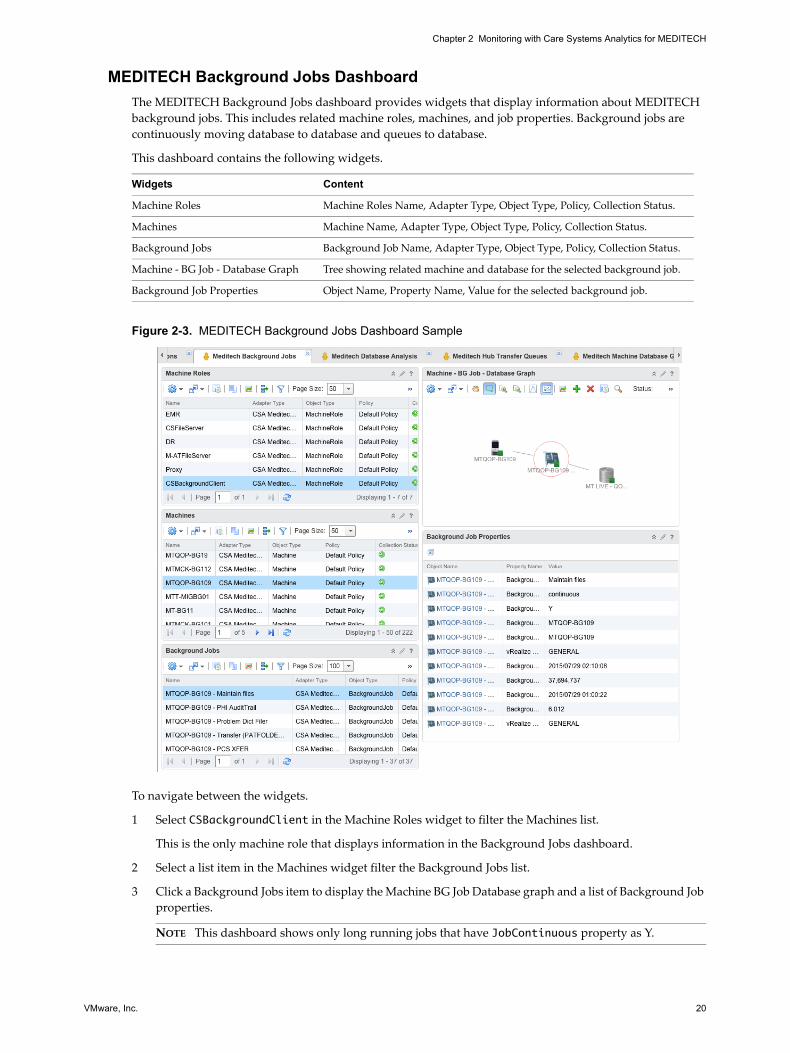
MEDITECH Background Jobs Dashboard
The MEDITECH Background Jobs dashboard provides widgets that display information about MEDITECH
background jobs. This includes related machine roles, machines, and job properties. Background jobs are
continuously moving database to database and queues to database.
This dashboard contains the following widgets.
Figure 2-3. MEDITECH Background Jobs Dashboard Sample
To navigate between the widgets.
1 Select CSBackgroundClient in the Machine Roles widget to filter the Machines list.
This is the only machine role that displays information in the Background Jobs dashboard.
2 Select a list item in the Machines widget filter the Background Jobs list.
3 Click a Background Jobs item to display the Machine BG Job Database graph and a list of Background Job
properties.
Widgets Content
Machine Roles Machine Roles Name, Adapter Type, Object Type, Policy, Collection Status.
Machines Machine Name, Adapter Type, Object Type, Policy, Collection Status.
Background Jobs Background Job Name, Adapter Type, Object Type, Policy, Collection Status.
Machine ‐ BG Job ‐ Database Graph Tree showing related machine and database for the selected background job.
Background Job Properties Object Name, Property Name, Value for the selected background job.
NOTE This dashboard shows only long running jobs that have JobContinuous property as Y.

VMware, Inc. 21
Chapter 2 Monitoring with Care Systems Analytics for MEDITECH
MEDITECH Application Database Graph Dashboard
The MEDITECH Application Database Graph dashboard provides widgets that display information about
MEDITECH applications and related databases and database hosting machines for a selected application.
This dashboard contains the following widgets.
Figure 2-4. MEDITECH Application Database Graph Dashboard Sample
To navigate between the widgets.
1 Select a list item in the Applications widget to display the Object Relationships to the selected item.
Related objects can include relevant file server hosting machines.
2 Double‐click a machine in the Object Relationship widget to display the databases hosted on that machine
and the parent applications.
Widgets Content
Applications Application Name, Adapter Type, Object Type, Policy, Collection Status.
Object Relationship Tree showing related children of selected Application.
VMware, Inc. 22
Chapter 2 Monitoring with Care Systems Analytics for MEDITECH
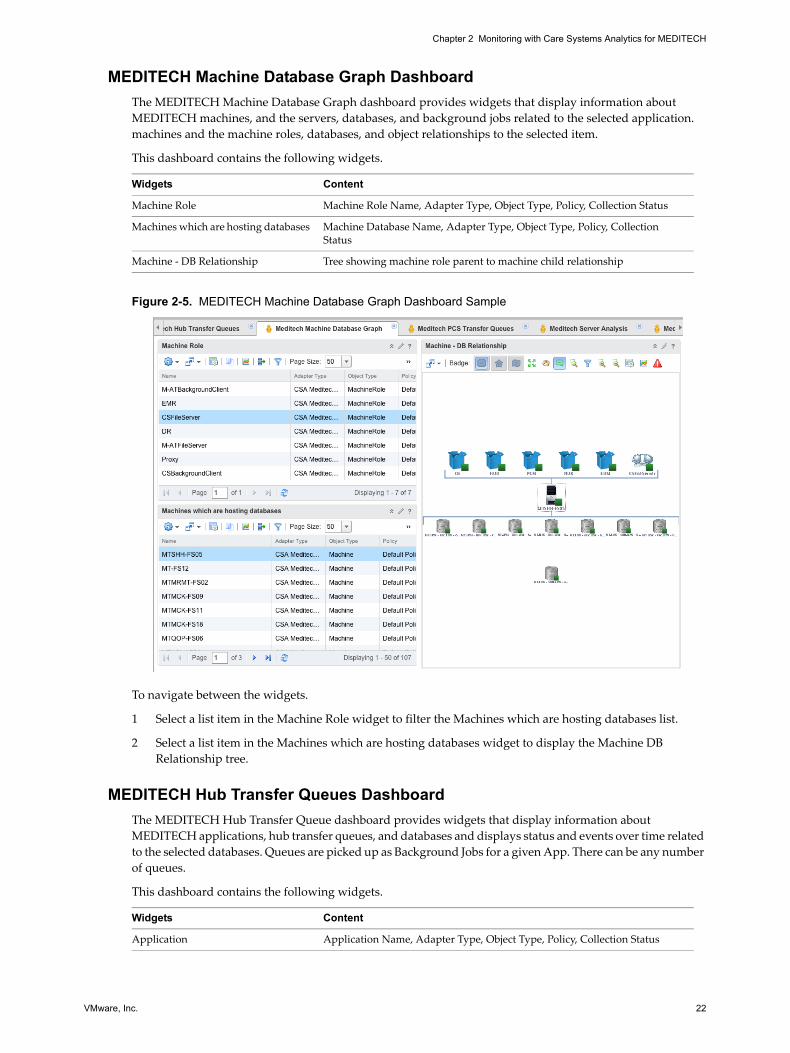
MEDITECH Machine Database Graph Dashboard
The MEDITECH Machine Database Graph dashboard provides widgets that display information about
MEDITECH machines, and the servers, databases, and background jobs related to the selected application.
machines and the machine roles, databases, and object relationships to the selected item.
This dashboard contains the following widgets.
Figure 2-5. MEDITECH Machine Database Graph Dashboard Sample
To navigate between the widgets.
1 Select a list item in the Machine Role widget to filter the Machines which are hosting databases list.
2 Select a list item in the Machines which are hosting databases widget to display the Machine DB
Relationship tree.
MEDITECH Hub Transfer Queues Dashboard
The MEDITECH Hub Transfer Queue dashboard provides widgets that display information about
MEDITECH applications, hub transfer queues, and databases and displays status and events over time related
to the selected databases. Queues are picked up as Background Jobs for a given App. There can be any number
of queues.
This dashboard contains the following widgets.
Widgets Content
Machine Role Machine Role Name, Adapter Type, Object Type, Policy, Collection Status
Machines which are hosting databases Machine Database Name, Adapter Type, Object Type, Policy, Collection Status
Machine ‐ DB Relationship Tree showing machine role parent to machine child relationship
Widgets Content
Application Application Name, Adapter Type, Object Type, Policy, Collection Status

VMware, Inc. 23
Chapter 2 Monitoring with Care Systems Analytics for MEDITECH
Figure 2-6. MEDITECH Hub Transfer Queues Dashboard Sample
To navigate between the widgets.
1 Select a list item in the Application widget to filter the Hub Transfer Queues list.
2 Select a list item in the Hub Transfer Queues widget to filter the Databases list.
3 Select a list item in the Databases widget filter the Metric Picker list.
4 Double‐click a metric in the Metric Picker to add the Sparkline Chart for that metric. Continue to select
metrics to add multiple Sparkline Charts.
5 Double‐click a data point in the Sparkline Chart to display the Metric Chart for that data point.
MEDITECH PCS Transfer Queues Dashboard
The MEDITECH PCS Transfer Queue dashboard provides widgets that display information about
MEDITECH applications, PCS transfer queues, and databases. It displays status and events over time related
to the selected databases to show how busy a queue is over time. Data refreshes every 5 minutes. Queues are
picked up as Background Jobs for a given App. There can be any number of queues.
Hub Transfer Queues Hub Transfer Queue Name, Adapter Type, Object Type, Policy, Collection Status
Databases Database Name, Adapter Type, Object Type, Policy, Collection Status
Metric Picker Metrics or Properties of selected metric. Includes Badge, vRealize Operations, Statistics specific to the selected metric.
Sparkline Chart Line chart that displays status and frequency of metric activity.
Metric Chart Line chart that displays status and frequency of metric activity over time.

VMware, Inc. 24
Chapter 2 Monitoring with Care Systems Analytics for MEDITECH
This dashboard contains the following widgets.
Figure 2-7. MEDITECH PCS Transfer Queues Dashboard Sample
To navigate between the widgets.
1 Select a list item in the Application widget to filter the PCS Transfer Queues list.
2 Select a list item in the PCS Transfer Queues widget to filter the Databases list.
3 Select a list item in the Databases widget filter the Metric Picker list.
4 Double‐click a metric in the Metric Picker to add the Sparkline Chart for that metric. Continue to select
metrics to add multiple Sparkline Charts.
5 Double‐click a data point in the Sparkline Chart to display the Metric Chart for that data point.
Widgets Content
Application Application Name, Adapter Type, Object Type, Policy, Collection Status
PCS Transfer Queues PCS Transfer Queue Name, Adapter Type, Object Type, Policy, Collection Status
Databases Database Name, Adapter Type, Object Type, Policy, Collection Status
Metric Picker Metrics or Properties of selected metric. Includes Badge, vRealize Operations, Statistics specific to the selected metric.
Sparkline Chart Line chart that displays status and frequency of metric activity.
Metric Chart Line chart that displays status and frequency of metric activity over time.

VMware, Inc. 25
Chapter 2 Monitoring with Care Systems Analytics for MEDITECH
MEDITECH App Analysis Dashboard
Use the MEDITECH App Analysis dashboard to view MEDITECH application and the specific databases that
support each application. The applications and databases listed are specific to your installation of MEDITECH.
This dashboard contains the following widgets.
Figure 2-8. MEDITECH App Analysis Dashboard Sample
To navigate between the widgets.
1 Double‐click a list item in the Apps widget.
A tree of related database, machines, and queue objects are displayed in the Databases supporting
selected App widget for that item are displayed.
2 Double‐click an object in the Databases supporting selected App widget to display the related objects
detail.
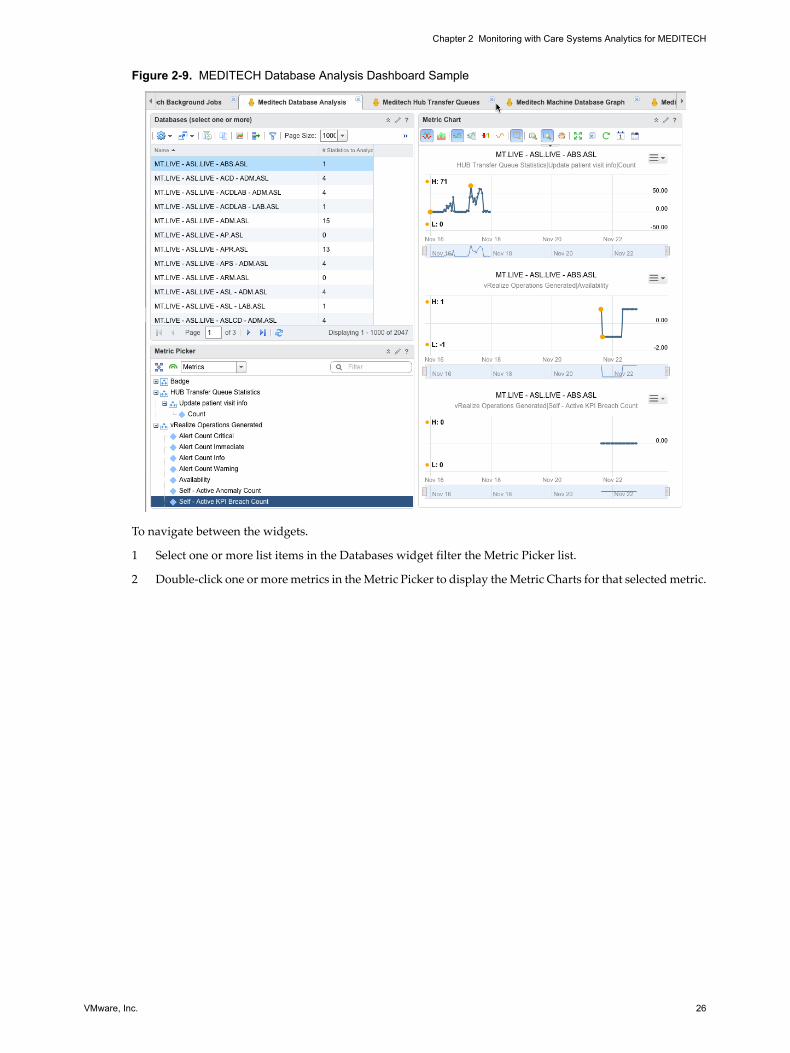
MEDITECH Database Analysis Dashboard
Use the MEDITECH Database Analysis dashboard to view metrics associated with each MEDITECH
databases. Selecting one or more databases in the Databases widget displays associated metrics in the Metric
Picker widget. You can use this to identify which databases store which metrics. This dashboard contains the
following widgets.
Widgets Content
Apps App Name, Adapter Type, Object Type, Policy, Collection Status
Databases supporting selected App Tree showing related children of selected App.
Widgets Content
Databases Database Name, # of Statistics to Analyze for each listed database
Metric Picker Metrics or Properties of selected metric. Includes Badge, vRealize Operations, Statistics specific to the selected metric.
Metric Chart Line chart that displays status and frequency of metric activity over time.
VMware, Inc. 26
Chapter 2 Monitoring with Care Systems Analytics for MEDITECH
Figure 2-9. MEDITECH Database Analysis Dashboard Sample
To navigate between the widgets.
1 Select one or more list items in the Databases widget filter the Metric Picker list.
2 Double‐click one or more metrics in the Metric Picker to display the Metric Charts for that selected metric.
VMware, Inc. 27
Chapter 2 Monitoring with Care Systems Analytics for MEDITECH
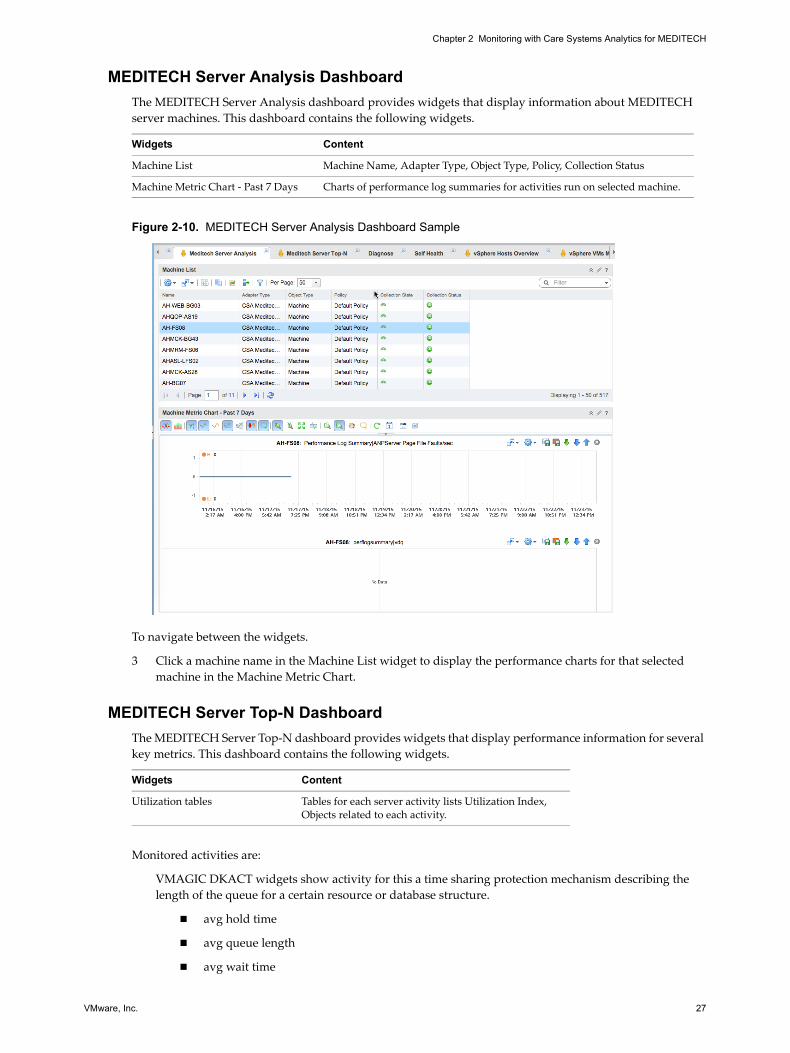
MEDITECH Server Analysis Dashboard
The MEDITECH Server Analysis dashboard provides widgets that display information about MEDITECH
server machines. This dashboard contains the following widgets.
Figure 2-10. MEDITECH Server Analysis Dashboard Sample
To navigate between the widgets.
3 Click a machine name in the Machine List widget to display the performance charts for that selected
machine in the Machine Metric Chart.
MEDITECH Server Top-N Dashboard
The MEDITECH Server Top‐N dashboard provides widgets that display performance information for several
key metrics. This dashboard contains the following widgets.
Monitored activities are:
VMAGIC DKACT widgets show activity for this a time sharing protection mechanism describing the
length of the queue for a certain resource or database structure.
avg hold time
avg queue length
avg wait time
Widgets Content
Machine List Machine Name, Adapter Type, Object Type, Policy, Collection Status
Machine Metric Chart ‐ Past 7 Days Charts of performance log summaries for activities run on selected machine.
Widgets Content
Utilization tables Tables for each server activity lists Utilization Index, Objects related to each activity.

VMware, Inc. 28
Chapter 2 Monitoring with Care Systems Analytics for MEDITECH
users/sec
ANP Server Information widgets indicate when the ANP service is not able to keep up with the listed
activity.
Conditional Replace/Sec
mtJo Index File Searches/sec
mtJo Lock Retries
Page Fault/sec
Semaphore Acquires
C: and E:
Avg Read/Sec
Avg Write/sec
Free Space
Figure 2-11. MEDITECH Server Top-N Dashboard Sample
VMware, Inc. 29
Chapter 2 Monitoring with Care Systems Analytics for MEDITECH
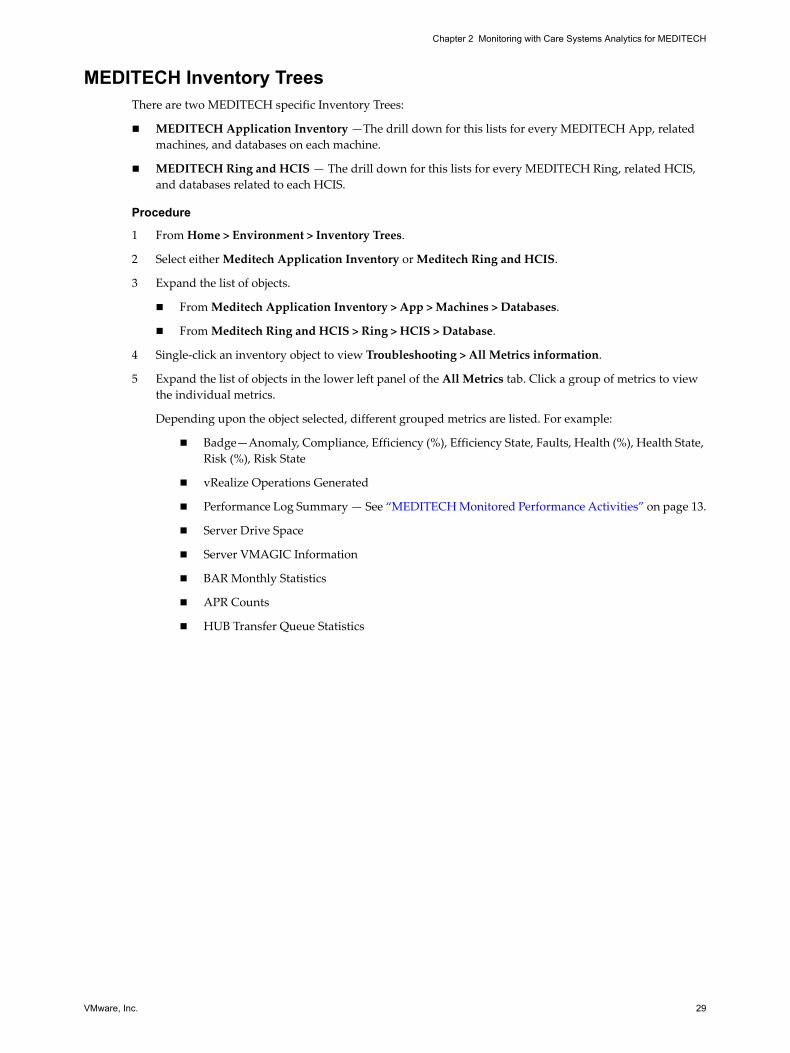
MEDITECH Inventory TreesThere are two MEDITECH specific Inventory Trees:
MEDITECH Application Inventory —The drill down for this lists for every MEDITECH App, related
machines, and databases on each machine.
MEDITECH Ring and HCIS — The drill down for this lists for every MEDITECH Ring, related HCIS,
and databases related to each HCIS.
Procedure
1 From Home > Environment > Inventory Trees.
2 Select either Meditech Application Inventory or Meditech Ring and HCIS.
3 Expand the list of objects.
From Meditech Application Inventory > App > Machines > Databases.
From Meditech Ring and HCIS > Ring > HCIS > Database.
4 Single‐click an inventory object to view Troubleshooting > All Metrics information.
5 Expand the list of objects in the lower left panel of the All Metrics tab. Click a group of metrics to view
the individual metrics.
Depending upon the object selected, different grouped metrics are listed. For example:
Badge—Anomaly, Compliance, Efficiency (%), Efficiency State, Faults, Health (%), Health State,
Risk (%), Risk State
vRealize Operations Generated
Performance Log Summary — See “MEDITECH Monitored Performance Activities” on page 13.
Server Drive Space
Server VMAGIC Information
BAR Monthly Statistics
APR Counts
HUB Transfer Queue Statistics

VMware, Inc. 30
Chapter 2 Monitoring with Care Systems Analytics for MEDITECH
6 Double‐click one or more of the expanded metrics to view the metric activity chart.
7 Double‐click an inventory object to view the Related Hierarchies and Related Objects information. Click
a Related Object to view an expanded list of the selected Related Objects.
Review Overall Health IndicatorsThe Overall Health dashboard provides visibility to the components in your environment.
Procedure
1 Select the MEDITECH Health Overview dashboard tab.
2 View overall resource health. From the Environment Overview widget, click the resource to view.
VMware, Inc. 31
Chapter 2 Monitoring with Care Systems Analytics for MEDITECH
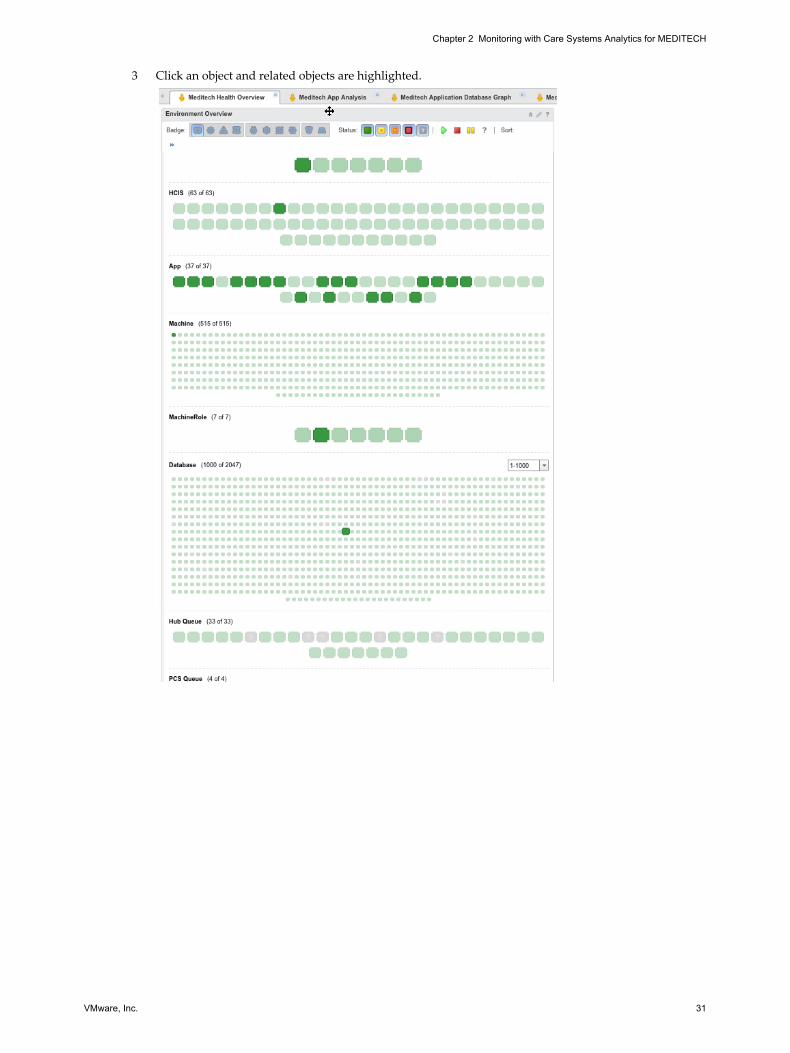
3 Click an object and related objects are highlighted.
VMware, Inc. 32
Chapter 2 Monitoring with Care Systems Analytics for MEDITECH
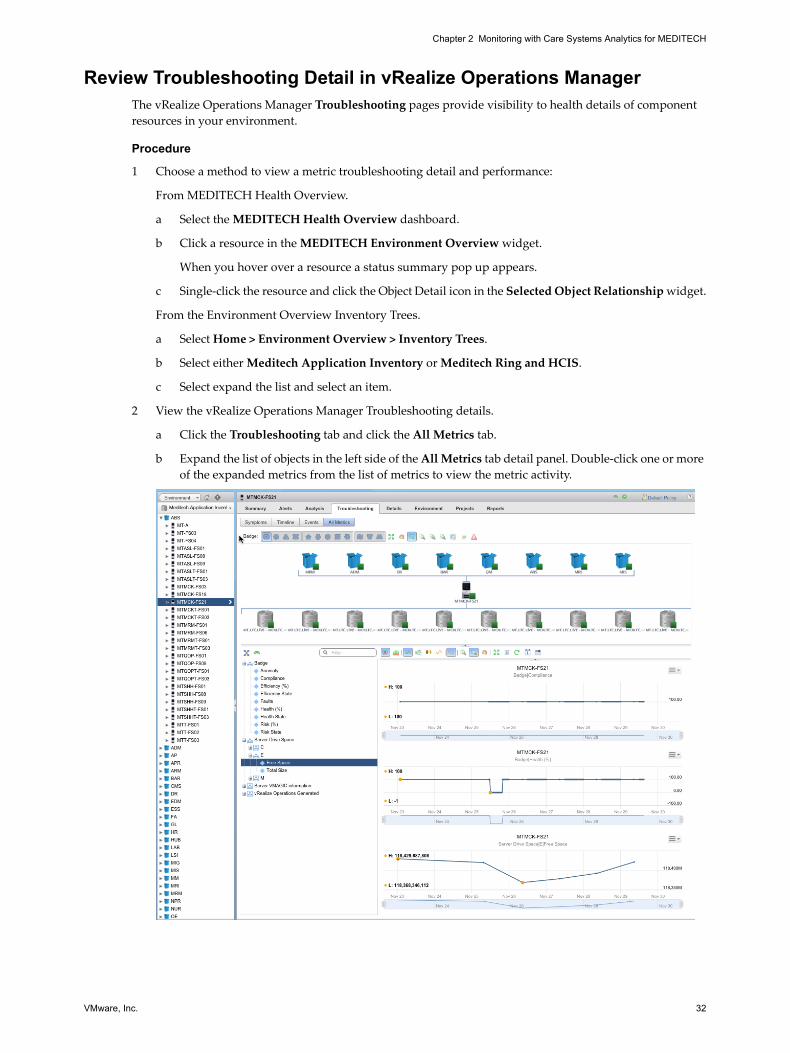
Review Troubleshooting Detail in vRealize Operations ManagerThe vRealize Operations Manager Troubleshooting pages provide visibility to health details of component
resources in your environment.
Procedure
1 Choose a method to view a metric troubleshooting detail and performance:
From MEDITECH Health Overview.
a Select the MEDITECH Health Overview dashboard.
b Click a resource in the MEDITECH Environment Overview widget.
When you hover over a resource a status summary pop up appears.
c Single‐click the resource and click the Object Detail icon in the Selected Object Relationship widget.
From the Environment Overview Inventory Trees.
a Select Home > Environment Overview > Inventory Trees.
b Select either Meditech Application Inventory or Meditech Ring and HCIS.
c Select expand the list and select an item.
2 View the vRealize Operations Manager Troubleshooting details.
a Click the Troubleshooting tab and click the All Metrics tab.
b Expand the list of objects in the left side of the All Metrics tab detail panel. Double‐click one or more
of the expanded metrics from the list of metrics to view the metric activity.

VMware, Inc. 33
Chapter 2 Monitoring with Care Systems Analytics for MEDITECH
MEDITECH Symptoms and AlertsThe MEDITECH symptoms and alerts use the perflogsummary metrics. There is a one to one correspondence
between each symptom and alert. That is, for each symptom, there is an alert. They have dynamic thresholds,
sending an alert when the symptom reaches the configured threshold. When an object has an alert, it’s alert
icon changes color.
Procedure
1 From Home > Alerts > Health view a list of active alerts.
2 From Home > Content.
3 Choose a Alert or Symptom definitions to view.
Alert Definitions to display the alert name and related Alert Type, machine, and Object Type, Hardware (OSI).
VMware, Inc. 34
Chapter 2 Monitoring with Care Systems Analytics for MEDITECH
Symptom Definitions > Metric/Property Symptom Definitions to display the alert name and
associated metric name.
4 Filter the list to display only MEDITECH alerts or symptoms.
Select Filters > Adapter Type. Enter Meditech in the search field.
The Care Systems Analytics for MEDITECH alerts or symptoms are displayed.
Alert Name Definition Metric Name Operator
Abnormal average hold time Triggered if vah metric value is above calculated dynamic threshold
Performance Log Summary | VMAGIC DKACT avg hold time
Above Threshold
Abnormal average queue length
Triggered if vdq metric value is above calculated dynamic threshold
Performance Log Summary | VMAGIC DKACT avg queue length
Above Threshold
Abnormal average wait time Triggered if vaw metric value is above calculated dynamic threshold
Performance Log Summary | VMAGIC DKACT avg wait time
Above Threshold
Abnormal C: free space Triggered if fmc metric value is below calculated dynamic threshold
Performance Log Summary | C: Free Space
Below Threshold
Abnormal C: reads per second Triggered if ldcrs metric value is below calculated dynamic threshold
Performance Log Summary | C:Read/Sec
Below Threshold
Abnormal C: writes per second
Triggered if ldcws metric value is below calculated dynamic threshold
Performance Log Summary | C: Write/sec, E: Avg Write/sec
Below Threshold
Abnormal E: free space Triggered if fme metric value is below calculated dynamic threshold
Performance Log Summary | E: Free Space
Below Threshold
Abnormal E: reads per second Triggered if lders metric value is below calculated dynamic threshold
Performance Log Summary | E: Avg Read/Sec
Below Threshold
Abnormal E: writes per second
Triggered if ldews metric value is below calculated dynamic threshold
Performance Log Summary | E: Avg Write/sec
Below Threshold
Abnormal free space Triggered if freespace metric value is below calculated dynamic threshold
Performance Log Summary | freespace
Below Threshold
Abnormal reads per second Triggered if ddxrs metric value is below calculated dynamic threshold
Performance Log Summary | DataDrive: Reads/Sec
Below Threshold
Abnormal semaphore acquires
Triggered if sa metric value is above calculated dynamic threshold
Performance Log Summary | Semaphore Acquires
Above Threshold
Abnormal server conditional replacements per second
Triggered if anpcrs metric value is above calculated dynamic threshold
Performance Log Summary | ANP Server Conditional Replace/Sec
Above Threshold
Abnormal server index file searches per second
Triggered if anpifs metric value is above calculated dynamic threshold
Performance Log Summary | ANP Server mtJo Index File Searches/sec
Above Threshold
Abnormal server lock retries Triggered if anpilf metric value is above calculated dynamic threshold
Performance Log Summary | ANP Server mtJo Lock Retries
Above Threshold
Abnormal server page faults per second
Triggered if pff metric value is above calculated dynamic threshold
Performance Log Summary | ANP Server Page Fault/sec
Above Threshold

VMware, Inc. 35
Chapter 2 Monitoring with Care Systems Analytics for MEDITECH
Abnormal uses per second Triggered if vus metric value is above calculated dynamic threshold
Performance Log Summary | VMAGIC DKACT users/sec
Above Threshold
Abnormal writes per second Triggered if ddxws metric value is below calculated dynamic threshold
Performance Log Summary | DataDrive Writes/Sec
Below Threshold
Alert Name Definition Metric Name Operator