cas completion report revkw - documents & … completion report revkw operations evaluauon...
TRANSCRIPT

CAS Completion Report Revkw Operations EvaluaUon Department 1
EGYPT CAS COMPLETION REPORT REVIEW
The CASCR provides a good survey of progress and candidly acknowledges shortcomings. The report was prepared well before the new CAS, providing information and lessons on which to base the new strategy. OED agrees with these lessons but adds other equally important ones. OED found that the Bank was (again) over optimistic in its projections for lending, as it had been during the preceding decade, and that it needs to work more closely with other donors, several of whom provide large amounts of grant finding.
Progress toward attaining the main objectives of the FY02-04 CAS program- sustaining high growth to reduce poverty and unemployment, developing human and natural resources-has been mixed. Despite extemal shocks related to September 11, the Iraq war, a decline in OECD growth, uncertainties about exchange rate policies, and slow progress in structural reforms, GDP growth remains resilient at 3 percent p.a. However, this rate is below CAS targets (6 percent) and insuflcient to absorb labor force growth and reduce poverty. As growth has been slowing, poverty-which declined in the latter part of the 1990s to 17percent-may have deteriorated, particularly among those in Upper Egypt. By contrast, substantial progress in almost all areas covered by the MDGs has been made-reducing gender and regional access imbalance, enhancing quality and better managing population growth. Significant progress has also been made in managing natural resources-improving irrigation and area development. Overall, the outcome of the Bank’s assistance program is rated moderately satisfactory.
Government Objectives, CAS Objectives, Overview of Implementation
1. objective o f the CAS was to reduce poverty and unemployment, relevant and consonant with Egypt’s development priorities expressed in both a 1997-2017 twenty-year vision and a 1996/97-2001/02 five-year plan. The CAS objectives emphasized: (i) sustaining high growth by maintaining macroeconomic stabilization, strengthening the private sector environment and the financial sector, promoting privatization, and enhancing trade reform, competitiveness and export promotions; (ii) developing human resource by improvements in education and health; and (iii) developing natural resources by improving irrigation and area development.
The CAS Completion Report (CASCR) covers the FY02-04 CAS. The overarching
2. Only three o f the nine CAS-proposed base case scenario loans were approved b y June 2004, totaling US$68 mi l l ion against a planned US$500 mi l l ion (annex table 1). But the late addition o f a large FY04 infrastructure loan (US$355) not foreseen in the CAS-to stimulate growth by eliminating bottlenecks at airports and boost tourism-brought total approvals close to target. More important, negotiations over a policy-based loan (US$500 million), following the adverse impact o f the September 11 events, revealed hesitancy b y the Government and with the improvement in the balance o f payments, did not come to fruition. Indeed, Egypt has not agreed to a policy-based loan since 1991.
3. limited to areas where Government commitment i s strong, and where the Bank has had positive experience (such as in irrigatiodwater) and proposed, “during FY02-04, no more than 6-7 projects should be planned under the base case scenario.” In particular, the CAS identified “fewer
The FY02-04 CAS cited the 2000 Egypt CAE recommendation that lending should be
Pub
lic D
iscl
osur
e A
utho
rized
Pub
lic D
iscl
osur
e A
utho
rized
Pub
lic D
iscl
osur
e A
utho
rized
Pub
lic D
iscl
osur
e A
utho
rized
Pub
lic D
iscl
osur
e A
utho
rized
Pub
lic D
iscl
osur
e A
utho
rized
Pub
lic D
iscl
osur
e A
utho
rized
Pub
lic D
iscl
osur
e A
utho
rized

CAS Completion Report Review Operations Evaiualion Department 2
dropped projects and average cost of those dropped to be aligned with Bank average” as a target to monitor lending. Although the number and cost of dropped projects fell from FY98, the cost in the last two years i s s t i l l cause for concern (annex table 9), and an FY99 rural credit o f US$300 million o f commitments was canceled. These dropped and canceled projects reflect the Bank’s desire to lend even when the Government i s reluctant to borrow particularly on IBRD terms, and the ease with which the Government has been able to find grant funds. For example, USAID offered cheaper funds for the Bank proposed FY02 Information Znfrastructure Project.
4. Substantially less AAA was undertaken than proposed in the CAS, and only seven of the 13 planned ESW reports (poverty, gender, financial, education, and health reviews and a CPAR and a CFAA) were concluded (annex table 4). Notably absent were core diagnostics: a PER and a social and structural review planned for FY03 and FY04, respectively. However, the Bank was successful in completing a joint poverty assessment in FY02. The absence of sector work on poverty since 1991 had been identified by the Egypt CAE as an important gap in Bank assistance. The assessment reversed years of Government’s resistance and restricted access to household surveys, and ensured a sound basis for future poverty reduction programs (Le., a collaborative Poverty Reduction Strategy followed in FY04). A 2004 QAG review o f AAA gave an overall satisfactory assessment, but rated likely impact as moderately satisfactory, suggesting that the Bank carry out an “integrative, analytical document such as a Development Policy Review, drawing in a coherent way the various policy issues and allowing a more convincing demonstration o f the actions with the highest pay off.” The share o f resources allocated to Egypt’s ESW-averaging16 percent a year-was below the MENA average (21 percent) and Bank-wide average (18 percent).
CAS Implementation by Objectives
Objective 1: Sustain High Growth to Reduce Poverty and Unemployment
5. Egypt’s economic performance has slowed during the CAS period. GDP growth that averaged 5 percent during the late 1990s fell to an average of 3 percent during the CAS period, below the CAS base case targets o f 5.5-5.9 percent and the Government’s 7 percent target, required to absorb labor growth rate and reduce poverty. Contributing factors are vulnerabilities of services to regional instabilities (e.g., Sep. 11 events, Iraq war, and Luxor massacre) and a decline in OECD growth; a slow down in investment (as uncertainties about monetary and exchange rate policy held back capital formation); and industry’s lack of competitiveness. Poverty, which fell from 19 percent in 1995/96 to 17
Figure 1: Egypt-Poverty Trend
40 35 30
25 B 20
15 10 5 0
National Upper Rural Upper Urban
percent in 1999/00 nation-wide, increased in Upper Egypt (figure 1). As growth has slowed since 2000, the poverty situation might have deteriorated. The 2000-05 poverty trends can be discerned once the next household survey (planned for 2005) i s completed and analyzed. Poverty i s higher in Egypt than in other MENA countries (annex table 8). Unemployment, about 10 percent, also remains high, well above the 7.3 percent targeted in the Government plan.
6. Bank program. All new loans (including the airport project) and four ongoing projects supported sustaining high growth (annex table 1). On the analytical side, the Bank supported the objective through the FY02 Financial Sector Assessment Program and Poverty Reduction

CAS Completion Report Review Operalions Evaluation Deparh-" 3
in Egypt, negotiations over a policy-based loan, and monitoring of the economic situation through a number o f Economic Monitoring Notes.
7. Maintaining macroeconomic stabilization. The CAS base case scenario called for consolidating current and investment budgets, scaling back implementation o f mega projects, and completing tax reform. However, budgets have not been consolidated and a number o f mega projects, domestic service payments, and the wage bill, subsidies and transfers have drained the expenditure side of the budget. The fiscal deficit worsened from 4.4 percent of GDP in 2001 to 6.4 percent in 2003, and i s projected to have remained at the same level in 2004 (below CAS base case targets o f gradual improvement). Inflation rose marginally from 2.3 percent in 2001 to 4.3 percent in 2003 and the deficit has been largely financed from domestic sources.
8. proposed in the CAS have been taken to improve the business environment. A newly established Judicial Reform Commission i s reviewing legislative changes to the commercial and business legal framework. New laws on intellectual property rights, money laundering and special economic zones were passed in 2002. But only limited progress has been made in cutting red tape and streamlining cumbersome regulations. Political factors and vested interests have constrained reforms. For example, a proposed competition and antimonopoly bill has been under discussion for almost ten years and has only recently been submitted to the Parliament. Similarly, after nearly a decade of lobbying by various interest groups, and s t i f f opposition from labor unions, a revised labor bill facilitated more flexible labor management, but transaction costs faced by private business were not otherwise reduced significantly. The Bank's report on Doing Business finds that among 135 countries Egypt i s one o f the ten that regulate firing workers the most; more than 3 years o f salary must be paid to a fired worker. Egypt's number o f procedures required to enforce a contract i s also among the ten highest. The proposed TA to strengthen the business environment did not materialize, but the project to improve airport facilities was recently approved. In the financial sector, the Bank completed a financial sector assessment program, provided TA on capital market, and identified privatizing at least one of the four major public banks as a high case trigger. While the capital market law has been amended to promote mortgage development, no public bank has been privatized, and non- performing loans at 17 percent o f total loans are a drag on performance.
Strengthening the private sector environment and theBnancia1 sector. Some measures
9. Promoting privatization. Privatization peaked in FY97-00, with an annual average o f 25-30 transactions worth 2.5-3.5 billion pounds (US$O.7-1.0 billion). I t then slowed in FYO1, with only 13 privatization transactions, generating proceeds o f 1.1 bil l ion pounds. According to the CAS, the Government planned to divest most remaining enterprises during FY02-04. In the event, only five enterprises were privatized in FY02, yielding merely 8 percent of FYOl's already reduced proceeds. Thus the pace o f privatization slowed and important transactions, such as the one pertaining to Egypt Telecom, were taken of f the table. The CASCR notes that the public sector s t i l l accounts for around 30 percent of economic activity.
10. employment and revenue loss, the Government did not revise tariffs, but eliminated tariff surcharges, consistent wi th the base case scenario. The limited trade reform, the constrained business environment, and the uncertainties about the exchange rate regime, contributed to eroding Egypt's competitiveness. This i s illustrated in the country's declining ranking in the
Enhancing trade reform, competitiveness and export promotions. Concerned about
CAS Completion Report Review Operations Evaluafion Department 4
World Economic Forum Growth Competitiveness Index from 44 in 2001 to 58 in 2003 and to 62 out o f 104 countries in 2004. The proposed Agricultural Exports Project was dropped.
Objective II: Develop Human Resource
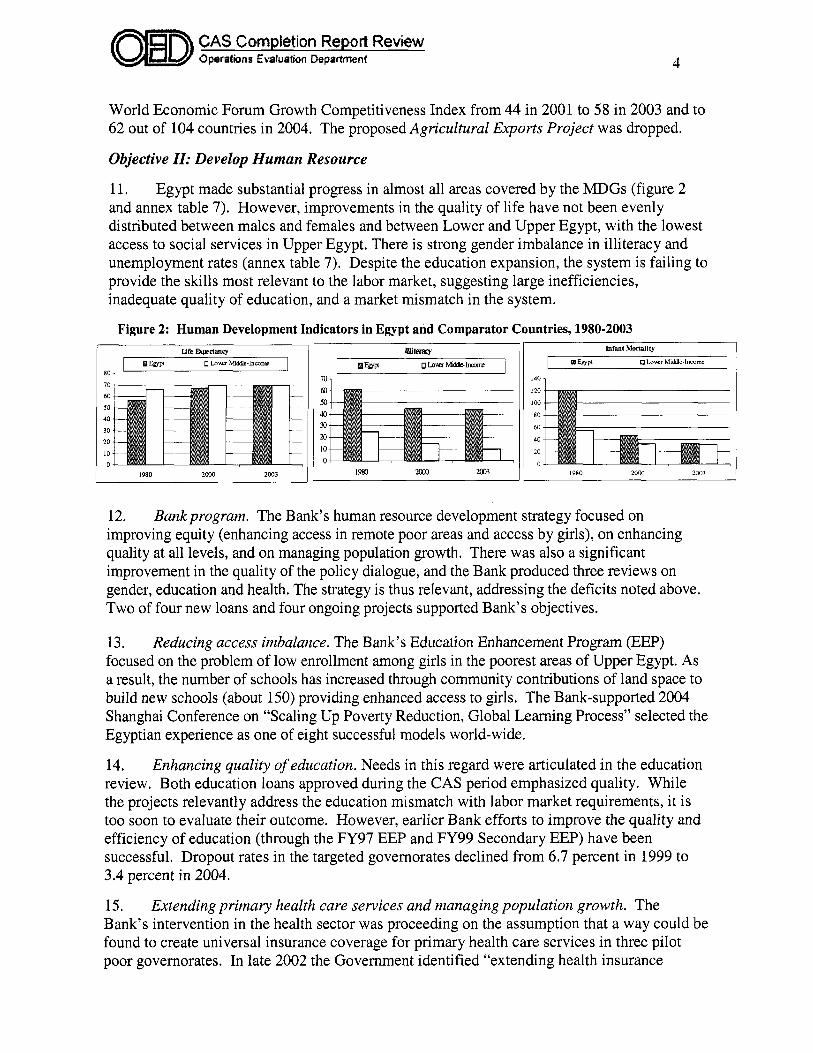
11. and annex table 7). However, improvements in the quality o f l i fe have not been evenly distributed between males and females and between Lower and Upper Egypt, with the lowest access to social services in Upper Egypt. There i s strong gender imbalance in illiteracy and unemployment rates (annex table 7). Despite the education expansion, the system i s failing to provide the sk i l l s most relevant to the labor market, suggesting large inefficiencies, inadequate quality o f education, and a market mismatch in the system.
Egypt made substantial progress in almost all areas covered b y the MDGs (figure 2
Figure 2: Human Development Indicators in Egypt and Comparator Countries, 1980-2003
70 60
50 40 30
20
10 0
I 1980 2000 2W3
12. Bank program. The Bank’s human resource development strategy focused on improving equity (enhancing access in remote poor areas and access by girls), on enhancing quality at all levels, and on managing population growth. There was also a significant improvement in the quality o f the policy dialogue, and the Bank produced three reviews on gender, education and health. The strategy i s thus relevant, addressing the deficits noted above. Two o f four new loans and four ongoing projects supported Bank’s objectives.
13, Reducing access imbalance. The Bank’s Education Enhancement Program (EEP) focused on the problem o f low enrollment among girls in the poorest areas o f Upper Egypt. As a result, the number of schools has increased through community contributions o f land space to build new schools (about 150) providing enhanced access to girls. The Bank-supported 2004 Shanghai Conference on “Scaling Up Poverty Reduction, Global Learning Process” selected the Egyptian experience as one of eight successful models world-wide.
14. review. Both education loans approved during the CAS period emphasized quality. While the projects relevantly address the education mismatch with labor market requirements, i t i s too soon to evaluate their outcome. However, earlier Bank efforts to improve the quality and efficiency of education (through the FY97 EEP and FY99 Secondary EEP) have been successful. Dropout rates in the targeted governorates declined from 6.7 percent in 1999 to 3.4 percent in 2004.
15. Extending primary health care services and managing population growth. The Bank’s intervention in the health sector was proceeding on the assumption that a way could be found to create universal insurance coverage for primary health care services in three pilot poor governorates. In late 2002 the Government identified “extending health insurance
Enhancing quality of education. Needs in this regard were articulated in the education

CAS Completion Report Review Q”s Eva1uah-t Depadment 5
coverage” as one o f the key objectives. However, i t soon became clear that implementation o f this goal depended in large part on reform o f the national Health Insurance Organization, which was not forthcoming. B y March 2005, only 14 percent o f the FY98 IDA health sector credit (US$90 million) had been disbursed. Pending development o f a new health insurance model, the project’s focus shifted to improvement o f health services, including rationalization o f infrastructure. On the population front, Bank intervention helped the country reduce i t s population growth and a population project focusing in rural Upper Egypt i s progressing well.
Objective Ill: Develop Natural Resources 16. growth. These have included removal o f production, price, and delivery quotas and controls on marketing o f agricultural commodities, removal of input subsidies, and privatization o f agricultural input supply and export marketing in most commodities. These have been supported with large investments such as reclamation o f new land for agricultural development. Constraining the further development of agriculture, on which about a third o f the population depends, i s the availability o f water. Better managing Egypt’s natural resource base and developing poor areas are essential for increasing the incomes o f the poor.
Egypt has undertaken substantial policy reforms with impacts on the poor and on
17. Bank program. Ongoing natural resource projects in three areas (FY98 East Delta, FY99 Sohag and FY03 Matruh IZ) and three ongoing irrigation sector loans (FY95 Irrigation Improvement, FY99 Pumping Stations, and FYOO National Drainage) have supported this objective. ESW including the 2002 and 2004 poverty studies, the 2001 Toward Agricultural Competitiveness Study, has fostered policy dialogue.
18. Area development. The 2004 OED Project Performance Assessment Report on Matruh I found satisfactory outcome, including positive poverty impact. The other two area projects are the East Delta where the Bank lent to raise productivity, including non-farm income o f 26,000 poor families recently settled on reclaimed land, and Sohag, where the Bank loan i s financing credit and enabling local authorities to implement infrastructure projects. Although i t i s too soon to evaluate their outcome, the Q A G review o f Sohag Project noted that the issue o f subsidized interest rates on rural loans was inadequately addressed.
19. satisfactory, The Bank’s past support to the sector has also been satisfactory. The Irrigation Improvement Project has focused on institutional and sustainability aspects o f the sector: bringing water users’ associations and water boards into the allocation and pricing o f water.
Irrigation and drainage. Implementation of the ongoing irrigation sector loans has been
Overall OED Assessment
20. The 2001 CAS had relevant objectives, appropriately focused on Egypt’s development priorities. The Bank assistance program helped in the progress observed during the period, but progress was uneven. The Bank assistance supported effectively the objective o f developing human resource, followed by developing natural resources, and with little success, sustaining high growth to reduce poverty and unemployment. GDP growth slowed to an average of 3 percent, reflecting difficulties related to 9/11 and the Iraq war, uncertainties about exchange rate policies, and slow progress in reforms. Some regulatory, financial, privatization and trade reforms were instituted during the CAS period. As growth has slowed, poverty and unemployment have not improved. B y contrast, Bank assistance in human resource has focused on access in poorer areas

CAS Completion Report Review Operations Evaluaih Depardment 6
and on quality, consistent with national priorities and in line with the gender and regional disparities noted. Bank support helped to improve access imbalance, enhance quality, and better manage population growth. Also, the Bank has had positive impact and relations in natural resource management, improving irrigation and area development. Overall, the outcome of the Bank assistance program i s rated moderately satisfactory.
Assessment of the CAS Completion Report
21. The quality o f the CASCR i s satisfactory, providing a balanced assessment o f achievements and candidly acknowledging shortcomings. The CASCR was prepared well before the new CAS, supplying findings and lessons on which to base the new strategy: place emphasis on policy dialogue and ESW, address low water productivity and improve the quality of education. While unobjectionable, the CASCR lessons could have gone further, particularly with respect to the gap between the 2001 CAS plans and results, as discussed below.
Findings
22. The Bank delivered a small proportion o f the ESW program and substituted a large loan not foreseen in the CAS to meet i t s lending target. In addition, the Bank assistance was unable to boost economic growth and adequately address issues o f high poverty rates in rural areas o f Upper Egypt. In the implementation o f the Bank’s strategy, the Bank should help Egypt resume high and equitable growth by accelerating reforms: improve the private sector environment and the financial sector, enhance trade reform and competitiveness, and reduce poverty disparities. Specifically, the Bank should (i) intensify policy dialogue and analysis, bringing together how the various reforms in trade, finance, and private sector could help Egypt reinstate macroeconomic stability and reinvigorate growth to reduce poverty, addressing the benefits and cost o f reforms; and (ii) forge close partnerships with other donors to strengthen prospects for reforms.

7
Annex Table 1: CAS-Proposed versus Actual Commitments (US$ million) Actual Planned rTca Purpose" CAS ProposaUAdditional T T C @
U J 9 uflv FY02 Higher Education Project CAS 50.0 Actual 50.0 a b
Skill Development Project CAS 50.0 Delayed to FY04 and 5.5 a b
Information Infrastructure CAS 10.0 Dropped -
dramatically reduced in size as a pilot
a
FY03 Nat. Resource Management CAS 50.0 Actual but substantially 12.4 a c (Matruh 11)
Early Childhood Development CAS 50.0 Delayed to FY05 - b
reduced in size to 25 percent
FY04 Health Sector Reform I1 CAS 100.0 Postponed pending the outcome o f the first project
Irrigatiordlrainage CAS 100.0 Delayed to FY05 Improvement
Agricultural Exports CAS 40.0 Dropped - a s
Rural WatedSanitation CAS 50.0 Dropped / delayed to - a c FY05
TOTAL 500.0 67.9
Memo item a FY04 Airports development New 335 -
In support of objective 3 sustain high growth, Source: 2001 CAS Table 3: Base Case Bank Assistance Program, FYO2-04, p. 24 and OED Assessment.
develop human resource, or c develop natural resource.

8
L
8 E E .-
3 c"

9
2 m
Y 6 2
9
.e Y
a v) x e, 3
il e El
B N
3
3 IC1
x W - 3 -1
P 9 2 2 .e Y
3
t - N
09 3 N
c
8 s a

10
Annex Table 4: Egypt-Economic and Sector Work Delivery Name Delivery Date Completion Status Product Number
Planned FY 02
Poverty Reduction in Egypt: Diagnosis and Strategy 6/27/2002 Complete PO75052
Early Childhood Development 6/3/2002 Complete PO72053
Analysis of Social Health Insurance n.a. n.a. n.a.
Corporate Govemance Assessment n.a. n.a. n.a.
Gender Assessment 6/30/2003 Complete PO76194
CPAR Update 12/15/2003 Complete PO76800
Planned FY03
Public Expenditure Review
Imgation Improvement Sector Review
Drainable and Waterwaste Reuse
Financial Sector Assessment
CFAA
n.a. n.a. n.a.
n.a. n.a. n.a.
n.a. n.a. n.a.
12/20/2002 Complete n.a.
6/9/2004 Complete PO77 1 15
Planned FY04
CAS n.a. n.a. n.a.
Social and Structural Review I1 n.a. n.a. n.a.
Evaluation of Health Sector Reform n.a. n.a. n.a.
Others
A Poverty Reduction Strategy for Egypt 09/25/2004 Completed Sector Report (27954)
Imgation and Drainage: Rehabilitation Vol. 1 03/3 1/2003 Completed Working Paper (26322)
Irrigation and Drainage: Development Vol. 1 03/3 1/2003 Completed Working Paper (26321)
Water Quality: Assessment and Protection Vol. 1 03/3 1/2003 Completed Working Paper (26124)
Egypt-Strategic Options for Early Childhood Education 9/30/2002 Completed Sector Report (24772)
Egypt-Cost Assessment o f Environmental Degradation 6/29/2002 Completed Sector Report (25 175)
Egypt-Toward Agricultural Competitiveness in the 21" 12/21/2001 Completed Sector Report (23405) Century-An Agricultural Export-Oriented Strategy

11
Annex Table 5: Portfolio Status Indicators by Year, FY98-05
Country Fiscal year 1998 1999 2000 2001 2002 2003 2004 2005
Egypt # Project 17 20 20 18 18 16 17 16 YO At Risk 18 15 20 6 28 13 18 7 Yo Realism 100 100 100 100 80 100 100 75 YO Proactivity 67 100 67 100 100 100 100 67 Net Comm Amt 1,055 1,402 1,448 1,083 1,012 764 1,014 1,015 YO Commit at Risk 15 12 37 1 34 16 2 1
Algeria # Project 10 9 11 10 13 13 11 11 Yo At Risk 50 33 18 20 15 8 27 36 YO Realism 80 100 50 100 100 100 100 100 YO Proactivity 71 100 100 100 100 100 100 0 Net Comm Amt 750 712 773 668 699 561 474 474 YO Commit at Risk 56 45 31 24 25 15 10 29
Jordan # Project 10 12 10 9 8 7 7 7
% Proactivity 100 100 100 100
% At Risk 0 0 0 0 13 14 0 0 % Realism 100 100
Net Comm Amt 319 409 298 292 257 312 320 3 20 YO Commit at Risk 0 0 0 0 2 11 0 0
Morocco # Project 19 20 20 19 18 16 12 11 % At Risk 32 20 15 21 6 13 17 20 % Realism 100 100 100 75 100 100 100 33 % Proactivity 75 100 100 100 100 100 100 100 Net Comm Amt 1,353 982 902 739 595 425 338 253 % Commit at Risk 23 22 15 20 11 23 4 13
MENA # Project 116 122 126 116 114 109 99 98 Yo At Risk 21 16 17 17 22 17 16 23 ?io Realism 83 95 90 85 60 78 88 61 Yo Proactivity 81 95 84 89 88 87 86 73 Net Comm Amt 6,660 6,873 7,174 5,652 5,087 4,763 4,961 5,056 YO Commit at Risk 20 19 19 19 24 16 8 13
Bank-wide # Project 1,540 1,544 1,505 1,457 1,428 1,395 1,346 1,379 % At Risk 25 19 15 13 19 16 17 19 % Realism 68 74 79 79 61 77 82 75 Yo Proactivity 72 83 84 89 85 88 83 64 Net Comm Amt 120,768 123,799 116,164 106,641 102,601 94,772 92,582 93,543 YO Commit at Risk 21 21 16 12 17 15 16 18
Source: World Bank Ware House as of May 27,2005.

12
Annex Table 6: IBRD/ IDA Net Disbursements and Charges Summary Report, FY 98-05 (in US$ millions)
F Y Commitment Gross Disb Repay Net Disb Interest Fees Net Transfer
193 1,522 199 30 1,292 1984 458 1,114
1985
1986
1987
1988
1989
1990
1991
1992
1993
1994
1995
1996
1997
1998
1999
2000
2001
2002
2003
2004
2005
Total
263
70
0
0
24 1
62
524
376
338
121
80
172
75
142
550
50
0
50
12
34 1
20
3,944
260
217
192
163
117
106
105
141
232
183
130
132
132
249
76
78
49
51
71
98
100
4,596
56
82
128
124
143
175
203
20 1
199
199
215
198
187
220
127
116
107
99
112
116
73
3,273
204
134
64
39
-26
-70
-98
-60
33
-16
-84
-67
-55
29
-5 1
-38
-57
-48
-40
-18
26
1,323
66
100
129
136
126
134
149
122
122
118
122
112
90
69
63
55
45
32
35
32
17
2,074
7
5
4
12
6
4
2
2
3
2
1
1
1
1
0
0
2
7
1
1
3
96
131
29
-69
-109
-158
-207
-249
-184
-92
-136
-207
-180
-146
-4 1
-1 14
-94
-105
-87
-76
-5 1
6
-847
w c e : Controller's website as of March 18, 2005.
13
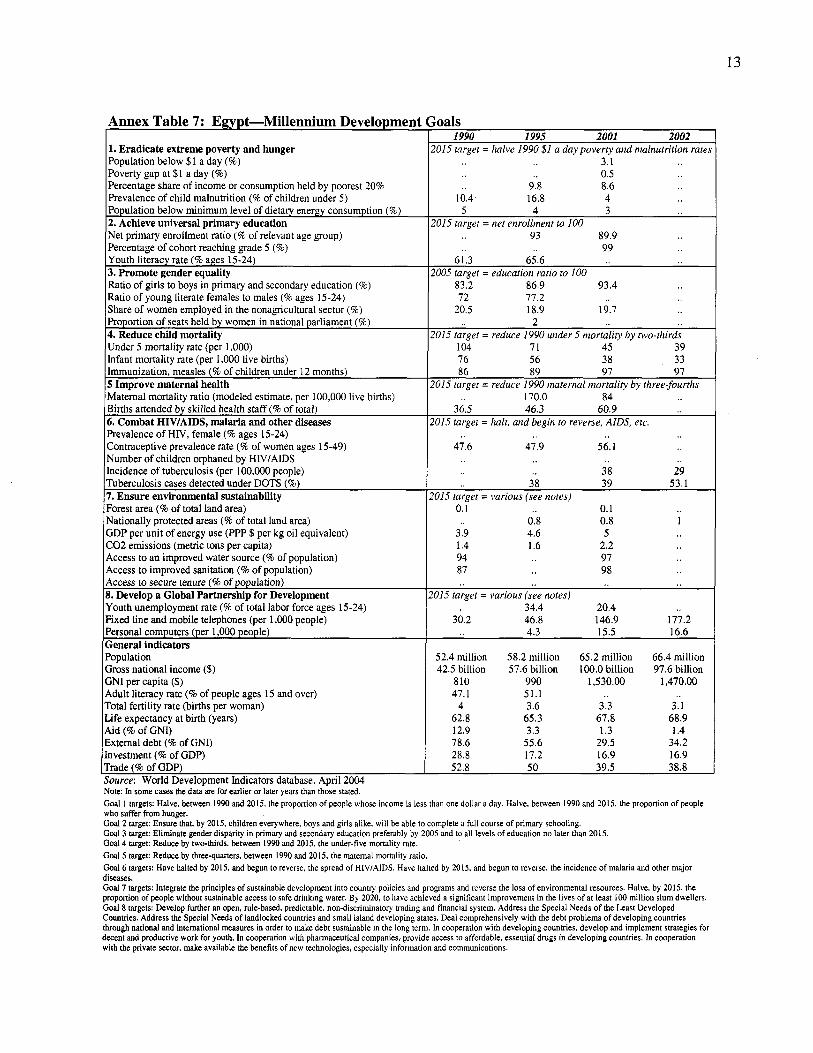
Annex Table 7: Egypt-Millennium Development
1. Eradicate extreme poverty and hunger Population below $1 a day (%) Poverty gap at $1 a day (%) Percentage share of income or consumption held by poorest 20% Prevalence of child malnutrition (% of children under 5) Population below minimum level of dietary energy consumption (%) 2. Achieve universal primary education Net primary enrollment ratio (% o f relevant age group) Percentage of cohort reaching grade 5 (%) Youth literacy rate (% ages 15-24) 3. Promote gender equality Ratio of girls to boys in primary and secondary education (%) Ratio of young literate females to males (% ages 15-24) Share of women employed in the nonagricultural sector (%) Proportion of seats held by women in national parliament (%) 4. Reduce child mortality Under 5 mortality rate (per 1,000) Infant mortalitv rate h e r 1.000 live births) < ~L . Immunization, measles (% of children under 12 months) 5 ImDrove maternal health Maternal mortality ratio (modeled estimate, per 100,000 live births)
Prevalence of HIV, female (% ages 15-24) Contraceptive prevalence rate (% of women ages 15-49) Number of children orphaned by HIV/AIDS Incidence of tuberculosis (per 100,OOO people) Tuberculosis cases detected under DOTS (%) 7. Ensure environmental sustainability Forest area (% of total land area) Nationally protected areas (% of total land area) GDP per unit of energy use (PPP $ per kg oil equivalent) C02 emissions (metric tons per capita) Access to an improved water source (% of population) Access to improved sanitation (% of population) Access to secure tenure (8 of population) 8. Develop a Global Partnership for Development Youth unemployment rate (% of total labor force ages 15-24) Fixed line and mobile telephones (per 1,000 people) Personal computers (per 1,000 people) General indicators Population Gross national income ($) GNI per capita ($) Adult literacy rate (% of people ages 15 and over) Total fertility rate (births per woman) L i fe expectancy at birth (years) Aid (% of GNI) External debt (% of GNI) Investment (% of GDP) Trade (8 of GDP) Source: World Development Indicators database, April 2004. Note: In some cases the data are for earlier or later years than those stated.
ioals 1990 1995 2001 2002
2015 target = halve 1990 $1 a day poverty and nmlnutrition rate 3.1 0.5
9.8 8.6 10.4 16.8 4
5 4 3 2015 target = net enrollment to 100
93 89.9 99
61.3 65.6
83.2 86.9 93.4 72 77.2
20.5 18.9 19.7 2
2005 target = education ratio to 100
2015 target = reduce 1990 under 5 mortality by two-thirds 104 71 45 39 16 56 38 33 86 89 97 97
2015 tareet = reduce 1990 maternal rnortalifv bv three-fourths .. , I
170.0 84 36.5 46.3 60.9
2015 target = halt, and begin to reverse, AIDS, etc.
47.6 47.9 56.1
38 29 38 39 53.1
!015 target = various (see notes) 0.1 0.1
3.9 4.6 5 1.4 1.6 2.2 94 97 87 98
0.8 0.8 1
!015 target = various (see notes) 34.4 20.4
30.2 46.8 146.9 177.2 4.3 15.5 16.6
52.4 million 58.2 million 65.2 million 66.4 million 42.5 billion 57.6 billion 100.0 billion 97.6 billion
810 990 1,530.00 1,470.00 47.1 51.1
4 3.6 3.3 3.1 62.8 65.3 67.8 68.9 12.9 3.3 1.3 1.4 78.6 55.6 29.5 34.2 28.8 17.2 16.9 16.9 52.8 50 39.5 38.8
Goal 1 targets: Halve, between 1990 and 2015. the proportion of people whose income i s less than one dollar a day. Halve, between 1990 and 2015, the proportion o f people who suffer from hunger. Goal 2 target: Ensure that, by 2015, children everywhere, boys and girls alike, wil l be able to complete a full course o f primary schooling. Goal 3 target: Eliminate gender disparity in primary and secondary education preferably by 2005 and to all levels o f education no later than 2015. Goal 4 target: Reduce by two-thirds, between 1990 and 2015, the under-five mortality rate. Goal 5 target: Reduce by three-quarters, between 1990 and 2015, the maternal mortality ratio. Goal 6 targets: Have halted by 2015, and begun to reverse, the spread of HIV/AIDS. Have halted by 2015. and begun to reverse, the incidence o f malaria and other major diseases. Goal I targets: Integrate the principles o f sustainable development into c o u n y policies and programs and reverse the loss of environmental resources. Halve, by 2015, the proportion o f people without sustainable access to safe drinking water. By 2020, to have achieved a significant improvement in the lives o f at least 100 million slum dwellers. Goal 8 targets: Develop further an open, rule-based, predictable, nondiscriminatory trading and financial system. Address the Special Needs o f the Least Developed Countries. Address the Special Needs o f landlocked countries and small island developing states. Deal comprehensively with the debt problems of developing countries through national and international measures in order to make debt sustainable in the long term. In cooperation with developing countries. develop and implement strategies for decent and productive work for youth. In cooperation with pharmaceutical companies, provide access to affordable, essential drugs in developing countries. In cooperation with the private sector, make available the benefits of new technologies, especially information and communications.

14
Cost per dropped project (US$’OOO)
Egypt
MENA
Bank-wide
Annex Table 8: Poverty and Inequality in Egypt, Jordan, Morocco, and Tunisia
FY94 FY9.5 FY96 FY97 FY98 FY03 FY04
330.3 41.1 377.7 60.6 204.0 149.6 82.9
263.4 79.7 140.2 102.6 129.4 55.0 57.2
124.2 68.2 115.2 111.1 110.8 130.7 140.5
Country and
survey year
1981182 199019 1 1995196 1997 1999100
Morocco 1984185 199019 1 1998199
Jordan 1986187 1992 1997 1999a 2001a
Tunisia 1985 1990 1995 2000
m
Urban
Headcount Index (%)
18.2 20.3 22.5 22.5 3.7
17.3 7.6 12.0
2.6 12.4 10.0
4.6 3.5 3.6 1.7
Poverty Gap (%)
3.5 4.3 4.9 5.6
NA 1.5 2.5
NA 3.1 2.1
NA 0.7 0.7
Rural
Headcount Index (%)
16.1 28.6 23.3 24.3 18.3
32.6 18.0 27.2
4.4 21.1 18.2
19.1 13.1 13.9 B.3
Poverty Gap (%)
3.1 4.5 4.3 6.4
NA 3.8 6.7
NA 5.1 4.0
NA 3.2 3.1
Overall
Headcount Index (%)
17.2 25 .O 22.9 23.5 16.7
26.0 13.1 19.0
3 .O 14.4 11.7 12.0 11.6
11.2 7.4 7.6 4.1
Poverty Gap (%)
N A N A N A 6.7
NA 2.7 4.4
0.3 3.6 2.5 3.03 3.01
NA 1.7 1.6
Gini coejjicient
0.394 NA 0.320 0.320
0.446 NA 0.395
0.36 0.40 0.36 0.36 0.36
0.406 NA 0.400 0.4
a World Bank 2002, Jordan Development Policy Review, page 11. Source: Jobs, Growth, and Governance in the Middle East and North Africa - Unlocking the Potential for Prosperity, The World Bank and Adam, Richard and John Page 2003. “Poverty, Inequality and Growth in Selected Middle East and North Africa Countries, 1980-2003.” World Development, Vol. 31, No. 12, pp. 2027-2048.
* No dropped projects reported during FY99-02.

15
Annex Table 10: External Assistance to Egypt, Total Net ODA Disbursements, 1998-2003, in US$ million
1998 1999 2000 2001 2002 2003 Total Australia 12.7 4.1 8.4 7.0 3.3 5.2 40.8
Austria 26.2 22.3 24.9 23.3 19.6 18.1 134.3
Belgium 0.1 0.0 0.0 0.0 -2.0 -1.2 -3.1
Canada 14.7 13.6 9.2 9.6 10.0 11.5 68.5
Denmark 32.1 40.4 42.4 25.2 16.1 41.2 191.3
Finland 2.4 2.7 3.5 3.7 5.2 4.5 21.9
France 308.0 254.1 241.7 201.5 100.1 100.0 1205.4
Germany 111.9 103.6 65.2 106.3 61.9 98.4 547.2
Greece 1.5 0.8 0.7 0.4 0.3 3.6 7.3
Italy 13.3 18.3 -8.1 -7.6 0.8 3.5 20.2
Japan 85.3 132.1 85.9 52.7 12.9 21.7 390.5
Netherlands 24.1 18.6 17.5 20.3 17.1 9.6 107.0
Norway 1.6 1.2 1.1 0.9 0.6 0.7 6.1
Spain 3.58 2.33 -2.08 8.28 13.48 9.38 34.97
Sweden 1.05 0.9 2.57 1.92 2.22 0.93 9.59
Switzerland 11.73 10.84 7.01 3.15 4.27 2.76 39.76
United Kingdom 12.23 5.31 4.1 3.56 12.18 3.54 40.92
United States 810 666.83 634.82 630.08 845.85 441.76 4029.34
Other Bilateral Donors 214.1 73.5 54.0 61.4 30.6 33.1 466.7
Total Bilateral Donors 1686.5 1371.3 1192.8 1151.7 1154.4 808.0 7364.7
AfDF 18 18.4 9.89 14.16 2.23 12.25 14.93
EC 189.82 150.85 72.5 70.97 44.19 58.83 587.16
GEF 1.08 0.63 0.7 0.72 0.1 1 0.07 3.31
I D A 39.28 13.71 26.3 2.5 1 20.5 -3.9 98.4
IFAD 0.64 4.5 5.41 -1.03 1.88 1.21 12.61
UNDP 3.29 3.87 1.98 1.72 1.54 1.19 13.59
UNTA 1.97 3.77 2.08 3.37 2.69 3.32 17.2
UNICEF 4.7 3.31 3.18 3.35 2.65 2.52 19.71
UNHCR 4.13 3.99 2.52 2.27 2.8 2.72 18.43
W I T 3.76 3.64 9.14 1.51 3.22 3.92 25.19
Other UN 0.93 1.61 0.73 1.03 1.81 1.64 7.75
UNFF'A 1.47 3.24 1.9 3.17 1.1 1.94 12.82
Arab Agencies -0.72 -0.72 -0.72 1.26 -0.4 0.05 -1.25
Multilateral ,Total 268.35 210.8 135.61 105.01 84.32 85.76 889.85
ALL Donors, Total 1954.86 1582.14 132838 1256.66 1238.73 893.76 8254.53