casanova, e. , knowles, t. d. j., williams, c., crump, m
TRANSCRIPT

Casanova, E., Knowles, T. D. J., Williams, C., Crump, M., &Evershed, R. (2017). Use of a 700 MHz NMR Microcryoprobe for theIdentification and Quantification of Exogenous Carbon in CompoundsPurified by Preparative Capillary Gas Chromatography forRadiocarbon Determinations. Analytical Chemistry, 89(13), 7090-7098. https://doi.org/10.1021/acs.analchem.7b00987
Peer reviewed versionLicense (if available):CC BY-NCLink to published version (if available):10.1021/acs.analchem.7b00987
Link to publication record in Explore Bristol ResearchPDF-document
This is the author accepted manuscript (AAM). The final published version (version of record) is available onlinevia ACS at http://pubs.acs.org/doi/abs/10.1021/acs.analchem.7b00987. Please refer to any applicable terms ofuse of the publisher.
University of Bristol - Explore Bristol ResearchGeneral rights
This document is made available in accordance with publisher policies. Please cite only thepublished version using the reference above. Full terms of use are available:http://www.bristol.ac.uk/red/research-policy/pure/user-guides/ebr-terms/

Use of a 700 MHz NMR microcryoprobe for the identification and quantification of
exogenous carbon in compounds purified by preparative capillary gas chromatography
for radiocarbon determinations
Emmanuelle Casanova1, Timothy Knowles2, Christopher Williams3,4, Matthew P. Crump3,4 and
Richard P. Evershed1,2*
1 Organic Geochemistry Unit, School of Chemistry, Cantock’s Close, University of Bristol,
Bristol BS8 1TS UK
2 Bristol Radiocarbon Accelerator Mass Spectrometer, 43 Woodland Road, University of
Bristol, Bristol BS8 1UU UK
3 School of Chemistry, Cantock’s Close, University of Bristol, Bristol BS8 1TS UK
4 BrisSynBio, Life Sciences Building, Tyndall Avenue University of Bristol, Bristol BS8
1TQ UK
*author for correspondence: email: [email protected], Fax: +44 (0)117 9251295
ABSTRACT
Preparative capillary gas chromatography (PCGC) is the central technique used for the
purification of volatile or semi-volatile organic compounds for radiocarbon analysis using
accelerator mass spectrometry (AMS). While thicker film columns offer efficient separations,
column bleed of cyclic poly(dimethyl siloxane) (PDMS) stationary phase has been highlighted
as a potential source of contaminant carbon in ‘trapped’ compounds. The dimethylpolysiloxane

CH3 groups are of ‘infinite’ radiocarbon age due to the fossil carbon origin of the feedstock
used in production. Hence, column bleed, if present at sufficiently high concentrations, would
shift the radiocarbon ages of trapped compounds to older ages. Quantification of the column
bleed in trapped samples, however, is extremely challenging and up to now has only been
achieved through indirect 14C determinations of chromatographic blanks, which are used for
post 14C determination ‘corrections’. As part of wider investigations aimed at better
understanding the chemical nature of contamination in compound-specific 14C-determinations,
herein, we report a rigorous approach to column bleed identification and quantification. Using
reference fatty acid methyl esters (FAMEs) 1H nuclear magnetic resonance spectroscopy
(NMR), employing a 700 MHz instrument equipped with a 1.7 mm microcryoprobe optimised
for 1H observation, was able to detect low sub-microgram amounts of low molecular weight
compounds (<500 Da). Direct quantification of PCGC ‘trapped’ FAMEs was achieved based
on the recorded 1H NMR spectra. Gravimetrically prepared calibration mixtures of cyclic
PMDSs and FAMEs, showed column bleed abundance to be below 0.03% w/w of the ‘trapped’
FAMEs, which would lead to a maximum shift in radiocarbon age of <3 years toward older
values. We therefore conclude that column bleed contamination has a negligible effect on the
14C determination of FAMEs prepared using the chromatographic method described. The 1H
NMR analysis also revealed the absence of other protonated carbon-containing components
that would affect radiocarbon determinations at the precisions achievable by AMS.
INTRODUCTION
A critical concern when preparing samples for radiocarbon dating is contamination of
the sample through the introduction of exogenous carbon. Such contamination from sample
treatment can lead to significant offsets (older or younger) of the actual sample age leading to

erroneous dates1,2,3. Contamination becomes particularly problematic with the small sample
sizes, i.e. less than 1 mg of C, that are increasingly commonly analysed due to advances in
sample preparation methods and AMS technologies.
Identification and quantification of exogenous carbon in samples for radiocarbon
analysis has been attempted using various approaches, e.g. FTIR has been used to identify
contamination in bone collagen4 and Raman to determine soil carbon contamination of
charcoal5,6. However, these techniques are ineffective in the case of low-level contamination
of small samples, due to a fundamental lack of sensitivity, precluding quantification of
contamination at the part per thousand level, which would affect radiocarbon determinations.
The question of exogenous contamination is especially critical in compound-specific
14C determinations in which preparative capillary gas chromatography (PCGC) is used to
isolate compounds from extracts of various environmental matrices7,8,9,10, and archaeological
pottery vessels11,12,13. The compound-specific approach routinely involves trapping sub-
milligram amounts of analyte for 14C determinations, hence, the use of PCGC requires
assessment of all potential sources of exogenous carbon likely to arise during the sample pre-
treatment. As the analytes are purified exogenous carbon could potentially be introduced either
from the PCGC used for compound purification, the handling of compounds between isolation,
oxidation and graphitisation. A recognised source of exogenous carbon to compounds isolated
by PCGC is column “bleed”14,15,16 (figure 1), derived from thermal degradation of the
commonly used PDMS stationary phase coating the column through heating in the GC
oven15,16. The cyclic degradation products of the polymer released typically are n = 3 and n =
4 cyclic oligomers of the monomer unit (-[Si(CH3)2-O]n-), with the possibility of higher
homologues up to an n = 717,18.

Several approaches have been considered to identify, limit, and correct for the effects
of ‘column bleed’ from the GC column. Eglinton and co-workers7, who reported the first use
of PCGC to isolate compounds for radiocarbon dating, suggested using columns coated with a
thin film of ultra-low bleed stationary phase (≤0.5 µm). Stott et al.12 attempted to determine
the column bleed concentration by the preparation of chromatographic blanks when isolating
C16:0 and C18:0 FAMEs from archaeological pottery. This was achieved by trapping the column
eluent for almost an entire run after injection of solvent only (~40 times longer than typical
trapping windows). The blanks contained insufficient carbon for radiocarbon analysis (~0.9
µg), thus, the column bleed was assumed to exert an insignificant effect on compound-specific
14C age determinations. In a later study Ziolkowski et al.19 used a column coated with a thicker
stationary phase film (1.5 µm) and generated blanks based on 400 dry injections and trapping
7 min retention time ‘windows’ then normalised the amount of exogenous carbon to 50
injections. This approach assumes that the column releases its stationary phase at constant rate
regardless of time or temperature, thus the amount of column bleed associated with a trapped
compound is proportional the length of the trapping window. It is however known that that the
release of PDMS from GC columns increases with temperature. Another approach adopted by
Ziolkowski et al.19, and probably the most effective of the approaches used up to now20,21 to
assess the effect of column bleed, involved the isolating of reference compounds of known
modern age then investigating shifts in 14C content by radiocarbon analysis. The influence of
column bleed was estimated from deviations in the 14C content of reference materials compared
to those of dry injections, i.e. blanks. The summary is that all the methods used to date to assess
the potential effects of column bleed on 14C determinations are indirect and unable to identify
and quantify the specific chemical contaminants of the PCGC trapped analytes. The specific
analytical hurdle thwarting direct characterisation and quantification until now is the small
quantity of compound isolated by PCGC, typically sub-milligram, combined with the low

concentration of contaminant, i.e. ppt, that could potentially effect 14C determinations. The
latter highlights the need for a new approach for assessing analyte purity for compound-specific
14C determinations.
Nuclear magnetic resonance (NMR) offers the possibility of detecting and quantifying
the presence of contaminant species but has not typically been employed due to perceived
problems with sensitivity. The latest generation of high field NMR spectrometers equipped
with microcryoprobes, however, extends the lower limits of detection of protonated species to
the picomol scale22,23. The extreme sensitivity makes these probes ideal tools to study mass
limited samples such as isolated low abundance proteins, peptides and small molecules and
difficult to express proteins. For example, this technology has been used to determine the
structures of molecules that can only be isolated in minute amounts (micrograms or less) from
natural sources such as deep sea sponges22,23, red algae24 and plants25. It is also used by
structural genomic consortia for high throughput microscale screening of protein targets26,27. In
addition to analysing the structure and purity of molecules, NMR can also be used to determine
the concentration of one more chemical species in solution with a high level of precision in a
non-destructive manner23,28. qNMR has proven to be a reliable, specific and linear over a wide
concentration range with limits of accuracy and precision in the order of 0.5-1%29,30,31. The
method is particularly suited for the simultaneous determination of the active constituents and
impurities in samples from the food, pharmaceutical and chemical industries30,32,33,34.
Furthermore a number of studies have used qNMR to specifically identify and quantify
impurities in agrochemicals35, pharmaceuticals36 and amino acids and peptides37, however this
is the first time to our knowledge that NMR has been used in the field of radiocarbon analysis.
The advent of this analytical technology opens the way for a new approach to the
qualitative and quantitative assessment of contamination in analytes for radiocarbon analysis.

The sensitivity and dynamic range of high field NMR instruments, combined with their
capability for compound identification and quantification, offers hitherto unattainable potential
for use in assessing contamination at the ‰ level in sub-milligram amounts of purified
compounds, trapped in ca. 1 min ‘windows’, instead of extended sequences. This allows for
the first time, the assessment of exogenous carbon in trapped analytes, specifically the
definitive assessment of the degree to which column bleed and other potential sources of carbon
could affect radiocarbon date determinations Herein, we demonstrate: (i) the use of
microcryoprobe-equipped 700 MHz 1H NMR to determine the purity of compounds isolated
with PCGC, (ii) identification of exogenous carbon in the trapped analytes by comparisons
with authentic standards, (iii) quantification of the contamination present using calibration
mixtures, and (iv) the impact of such contamination on high precision 14C dates using AMS
and conclude whether corrections are required.
EXPERIMENTAL
Reference materials and sample preparation
All reference materials were purchased from Sigma Aldrich (Poole, UK). HPLC grade
solvents were purchased from Rathburn Chemical Ltd (Walkerburn, UK) and deuterated
chloroform (“100 %”, 99.96 atom % D) from Sigma Aldrich (Poole, UK).
Organic residues from the pottery vessel were extracted using the method described by
Correa-Ascensio and Evershed38.

Stock solutions containing known concentrations of C18:0 FAME and
hexamethylcyclotrisiloxane were prepared to produce a NMR calibration curve for its
quantification by NMR. These solutions contained the FAME at 1 mg.mL-1 and siloxane in
varying concentrations, from 1 mg.mL-1 to 1.10-6 mg.mL-1 (see table 1), diluted in chloroform-
d solvent.
PCGC analysis
The C16:0 and C18:0 FAMEs from a standard solution (5 µg.µl-1) were isolated by PCGC
using a Hewlett Packard 5890 series II gas chromatograph coupled to a Gerstel preparative
fraction collector. Aliquots (1 µL) of the standard FAME solution were injected repeatedly
using an autosampler (40 runs in a continuous sequence) into a non-polar fused silica capillary
column (Rxi-1ms, 30 m x 0.53 mm i.d., DB1 stationary phase, 1.5 µm film thickness, Restek
(High Wycombe, UK)). The thickness of the column stationary phases is optimal for the
injection of large samples (5 µg per injection), combined with low bleed properties. The GC
temperature program for the standard solution started with an isothermal hold at 50 ºC for 2
min, followed by an increase in oven temperature at 10 ºC min-1 up to 300 ºC, followed by a 3
min hold. For the archaeological pottery extract the temperature programme was modified
slightly due to the presence of compounds with higher boiling points; the temperature
programme started with an isothermal period at 50 ºC for 2 min followed by programming a
temperature ramp at 40 ºC/min to 200 ºC, then 10 ºC/min to 270 ºC, and finally 30 ºC/min to
300 ºC, followed by a hold for 9 min. Helium was used as carrier gas at constant pressure (7
psi for the standard solutions and 10 psi for the archaeological sample). The column terminated
at a zero dead volume effluent splitter to divert 1 % of the eluent to the flame ionisation detector

(FID) to monitor column effluent and 99 % through a deactivated silica transfer line to silica
traps. The FAMEs were isolated in one minute windows based on their respective retention
times. The C16:0 and C18:0 FAMEs were isolated into individual traps, denoted TC16:0and TC18:0,
respectively.
The isolated compounds were recovered from the traps with 1 mL of deuterated
chloroform. The solutions were blown down to dryness under a gentle stream of N2, re-
dissolved in 200 µL of deuterated chloroform, of which a 50 µL aliquot was transferred to a
1.7 mm NMR tube for analysis (see below). Further 50 µL aliquots of each trapped analyte
solution were combined, separately, with 50 µg of an internal standard (n-tetratriacontane),
then blown down and dissolved in 500 µL of hexane for quantification by GC-FID (see below).
The same protocol was applied to an archaeological pottery vessel containing an absorbed
residue comprising high concentrations of C16:0 and C18:0 fatty acids (FAs).
GC, GC/MS and GC-Q-TOF analysis
Aliquots of the standard trapped FAME solutions, containing 50 µg of internal standard
(IS), were submitted to GC analysis to determine trapping efficiencies and quantification of the
amount of FAMEs trapped. The GC analyses were performed using an Agilent technologies
7890A GC fitted with an FID to monitor the effluent. Helium was used as carrier gas at a flow
rate of 2 mL.min-1. The samples were injected into a non-polar fused silica capillary column
(50 m x 0.32 mm i.d., DB1, 0.17 µm film thickness, Agilent technologies (Cheadle, UK)). The
GC oven temperature programme started with a 50 ºC hold for 2 min, followed by a ramp at
13 ºC min-1 to 350 ºC, then an isothermal hold for 2 min. The amount of trapped FAME was
calculated using equation 1:

mFAME = AFAME * (mIS/AIS) (1)
Where Ax and mx are, respectively, the peak area and the mass of the FAME and IS.
GC/MS analyses used a Trace 1300 coupled to a Thermo Scientific ISQ LT single
quadrupole MS. The GC column was the same as used in the GC/FID instrument and the
temperature program the same as used for PCGC analysis. The MS was operated in electron
ionisation mode at 70 eV. Samples were acquired over the range of m/z 50-650 Da. Data were
processed by XCalibur software and the NIST (National Institute of Standards and
Technology) mass spectral library was used to identify eluting compounds.
GC-Q-TOF analyses were performed on an Agilent technologies 7890B GC instrument
coupled to an Agilent technologies 7200 Accurate Mass Q/TOF GC/MS device. The GC
column was the same as the one used above in the GC/FID analysis. The temperature program
started at 50ºC and increased to 300 ºC at a rate of 30º min-1. Data were acquired over the range
of m/z 50-1200 Da, from 5-16 min, to capture the elution window of the cylic poly(dimethyl
siloxane) oligomers and avoid saturation of the instrument with FAMEs and IS. Data were
processed using the NIST database
NMR analysis
The analyses were performed on a Brucker Avance III HD 700 MHz NMR instrument
equipped with a 1.7 mm TCI microcryoprobe. The samples dissolved in CDCl3 (99.96%D)
were transferred to 1.7 mm NMR tubes using a SGE gas tight syringe. Standard 1D 1H spectra
(zg30) were acquired at 25 ºC using a spectral width of 15 ppm and 65536 complex points to

give an acquisition time of 3.12 sec per scans. 5120 scans were acquired per experiment with
an interscan delay of 1 sec. Spectra were referenced to residual solvent signals (1H, δ 7.26 ppm)
and the total measurement time per experiment was 5 hrs 55 mins. The spectra were processed
and analysed in MestreNova v 9. A multiple point background correction was performed by
subtraction of a cubic spline function, on a sample-by-sample basis adjusted by adding manual
points to achieve a flattened area adjacent to the peaks used for quantification. Phase correction
was performed manually using the peak at 1.28 ppm as a pivot position. The spectra were
normalised to the peak at 1.28 ppm. Integration was performed using a peak-by-peak
calculation method, with the cyclic poly(dimethyl siloxane) peaks requiring manual
integration.
Special care was taken to select deuterated solvent without added TMS
(tetramethylsilane) standard as this would have interfered with the resonances of siloxanes
likely to arise from GC column bleed. NMR analysis of the solvent was performed to confirm
its purity and eliminate TMS as a possible source of interference.
RESULTS AND DISCUSSION
The investigation proceeded in three parts: (i) determination of NMR resonances for
cyclic poly(dimethyl siloxanes) appropriate for quantifying column bleed against a background
of FAME signals at three to four orders of magnitude higher abundance; (ii) establishing a
calibration graph for mixtures of FAMEs and cyclic poly(dimethyl siloxane) in varying
proportions, and (iii) determination of the concentrations of cyclic poly(dimethyl siloxane) in

modern reference FAMEs and those of archaeological origin in order to assess the potential
impact of column bleed on 14C determinations by AMS.
Reference spectra and calibration
Each of the reference compounds was analysed by NMR to establish their chemical
shifts (see figure 2 for spectra). The reference degradation products of stationary phase exhibit
peaks at 0.20, 0.12, and 0.10 ppm, respectively, for the n = 3, n = 4, and n = 5 membered ring
cyclic poly(dimethyl siloxanes). The FAMEs, CH3(A)-COO-CH2(B)-CH2 (C)-(CH2)12 (or
14) (D)-CH3(E), display a singlet at 3.69 ppm (A), a triplet centred on 2.32 ppm (B), a singlet at
1.64 ppm (C), a range of peaks at 1.35 - 1.20 ppm (D), and a triplet centred on 0.9 ppm (E).
For the reference FAMEs used for preparing the standard solutions, the baseline was rigorously
inspected to confirm that no impurities were present in the region where the resonances of
protons from column bleed cyclic poly(dimethyl siloxanes) occur, i.e. 0 to 0.3 ppm.
In order to quantify the amount of column bleed collected in the traps together with the
FAMEs during PCGC, a calibration curve was generated covering the concentration range 1
mg.mL-1 to 1.10-6 mg.mL-1 based on the peak areas of the methyl group protons (singlet at 3.69
ppm) of the C18:0 FAME and that of the cyclic poly(dimethyl siloxane) methyl group protons
(singlet at 0.20 ppm) for the hexamethylcyclotrisiloxane (see table 1). The lowest
concentration, i.e. [siloxane]/[FAME] = [siloxane]/[FAME] = 1/100,000 produced
hexamethylcyclotrisiloxane signals too weak for integration and was therefore not included in
the calibration.
The concentration of the standard solutions in mg.mL-1 were converted into the mass
of carbon of the compounds using equation 2:
mCx = [x] * Vx * MC * nbrC / Mx (2)
Where x is either the C18:0 FAME or the hexamethylcyclotrisiloxane, C is carbon atom, mCx
the mass of carbon in the compound in mg, [x] the concentration in mg.ml-1, Vx is the volume
in mL, nbrC the number of carbon atoms in the molecule, and Mx is the molar mass in mg.mol-
1.
Plotting {peak area siloxane / peak area of FAME} against the ratio {mass of C
siloxane/mass of C FAME} (table 1), showed the curve to be described by a linear regression
with a slope of 25.843 ± 0.612 and correlation coefficient R2 = 0.999. The correlation
coefficient confirms a linear calibration curve has been obtained, which can be used for the
required quantitative analyses.
Quantification of exogenous carbon
The C16:0 and C18:0 FAMEs mixtures analysed by 700 MHz microcryoprobe NMR were
formulated to reproduce the trapping of real archaeological samples, i.e. PCGC of FAMEs
containing 200 g of carbon from 40 injections of a solution containing C16:0 and C18:0 FAMEs
at concentrations of 5 g.L-1. The amount of exogenous carbon is defined as the percentage
of exogenous carbon contaminating the compound isolated by PCGC. GC/FID analysis of the
trap contents demonstrated that the FAMEs isolated by PCGC contained only one FAME, i.e.
no C18:0 was detected in the trap intended to trap C16:0 and vice versa. The carbon content of
the isolated FAMEs varied from 112 µg to 264 g of C (table 2). The variation in sample

recovery from the traps could have number of causes; most likely being the increasing
concentration of the standard solution in the autosampler vial due to sample evaporation over
a sequence, or the loss of sample during solvent evaporation under a stream of N2. Overall the
average of sample recovery was of 202 g of C which was very close to the targeted trapping
amount.
The NMR spectrum shown in figure 3a contained resonances at chemical shifts
corresponding to the isolated C18:0 FAME (3.69 ppm, 2.32 ppm, 1.64 ppm, 1.35 - 1.20 ppm,
and 0.9 ppm). In spectrum displayed at full scale, i.e. normalised to the FAME 1.31 ppm peak
only resonances of the FAME are evident. However, unlike the references and blanks, close
inspection of the baseline revealed, in all of the FAMEs isolated by PCGC, peaks were clearly
visible at 0.09 and 0.11 ppm at a relative intensities lower than 0.06%; these are exogenous
carbon derived from the PCGC instrument. Due to their very low intensity, 5120 scans
(corresponding to just under 6 h of analysis) were required to obtain acceptable signal-to-noise
for meaningful comparison between samples. The data collection requires therefore a long
time-slot with the instrument, it is however necessary as more typical NMR spectra (resulting
from 1024 scans recorded over 1 hr 11 mins) were too noisy to perform rigorous integration of
the low intensity contaminant peaks. Knowing that the stationary phase of the column fitted
into the PCGC was a poly(dimethyl siloxane) polymer, and based on known 1H chemical shifts,
the observed resonances can be confidently assigned to cyclic poly(dimethyl siloxane) products
resulting from the thermal degradation of the stationary phase. The chemical shift values of
0.09 and 0.11 ppm indicate that the column derived compounds trapped are likely a mixture of
octamethylcyclotetrasiloxane and decamethycyclopentasiloxane derived from column bleed.
The 1H NMR spectra of some of the trapped compounds also contained a weaker peak at 0.07
ppm likely to correspond to cyclic compounds with n > 6 membered ring. This identification

was confirmed by GC-Q-TOF analysis, that showed the presence of the n = 4, 5, 6, and 7
membered ring cyclic poly(dimethyl siloxane) degradation products in different proportions in
the isolated FAMEs; the n = 3 homologue was undetectable in all the trapped FAMEs. It should
be noted that while other very minor peaks of similar intensity to the cyclic poly(dimethyl
siloxane) are present in the NMR spectra, they also occur in the reference compounds and/or
blank spectra. Therefore these components can be eliminated as deriving from the PCGC,
confirming that column bleed is the only source of exogenous carbon detectable from the
isolation process.
Based on the mass of carbon trapped, the NMR peak areas and the calibration curve
slope, the amount of carbon from the column bleed has been determined using equation 3:
mCcb = (A cb/A FAME) * ( mCFAME /S) (3)
Where mCcb is the mass of carbon of the column bleed, mCFAME the mass of carbon of the
FAME, A cb the peak area of column bleed, A FAME the peak area of methyl group from the
FAME and S the slope of the calibration curve.
The carbon contributing from column bleed in the PCGC trapped FAMEs ranged from
5 ng (sample 2 - TC16:0) to 69 ng (sample 3 – TC16:0; table 2), with a mean of 28 ng. It is
noteworthy that no significant difference was observed in the amount of column bleed detected
in the traps TC16:0 and TC18:0. This confirms that for these trapping windows, under these
conditions, the temperature of the GC oven had no appreciable effect on the amount of column
bleed eluting from the GC column.
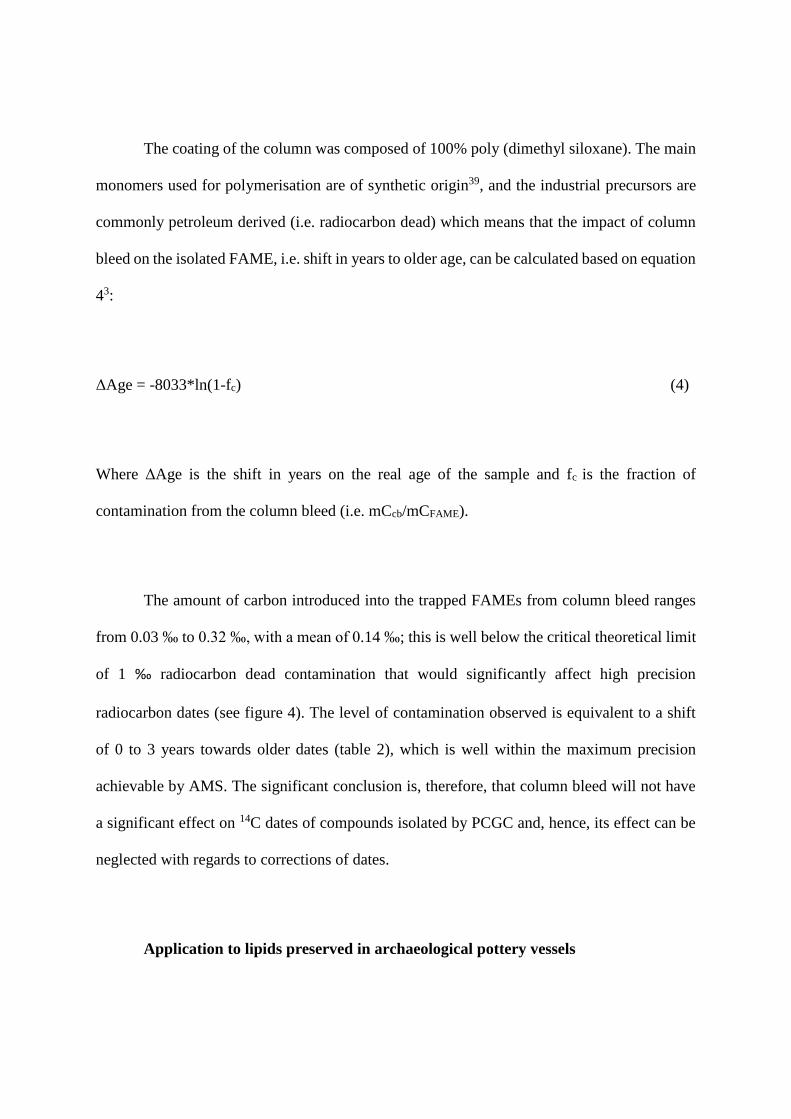
The coating of the column was composed of 100% poly (dimethyl siloxane). The main
monomers used for polymerisation are of synthetic origin39, and the industrial precursors are
commonly petroleum derived (i.e. radiocarbon dead) which means that the impact of column
bleed on the isolated FAME, i.e. shift in years to older age, can be calculated based on equation
43:
ΔAge = -8033*ln(1-fc) (4)
Where ΔAge is the shift in years on the real age of the sample and fc is the fraction of
contamination from the column bleed (i.e. mCcb/mCFAME).
The amount of carbon introduced into the trapped FAMEs from column bleed ranges
from 0.03 ‰ to 0.32 ‰, with a mean of 0.14 ‰; this is well below the critical theoretical limit
of 1 ‰ radiocarbon dead contamination that would significantly affect high precision
radiocarbon dates (see figure 4). The level of contamination observed is equivalent to a shift
of 0 to 3 years towards older dates (table 2), which is well within the maximum precision
achievable by AMS. The significant conclusion is, therefore, that column bleed will not have
a significant effect on 14C dates of compounds isolated by PCGC and, hence, its effect can be
neglected with regards to corrections of dates.
Application to lipids preserved in archaeological pottery vessels
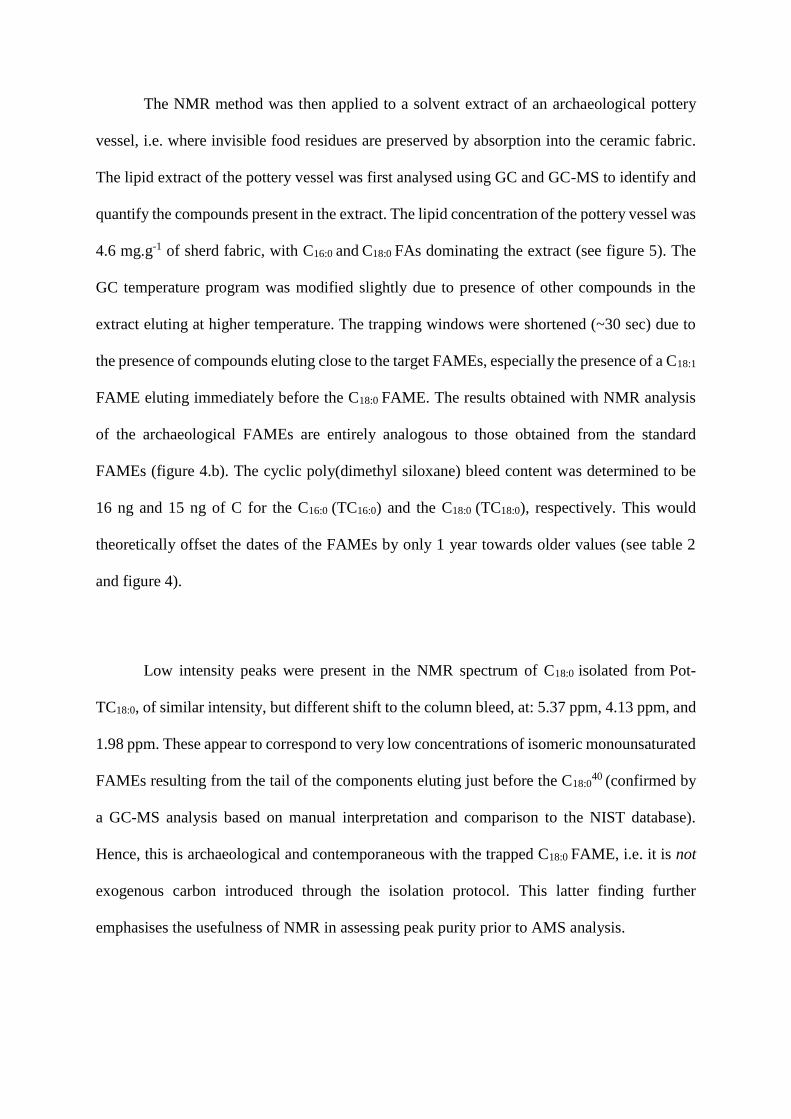
The NMR method was then applied to a solvent extract of an archaeological pottery
vessel, i.e. where invisible food residues are preserved by absorption into the ceramic fabric.
The lipid extract of the pottery vessel was first analysed using GC and GC-MS to identify and
quantify the compounds present in the extract. The lipid concentration of the pottery vessel was
4.6 mg.g-1 of sherd fabric, with C16:0 and C18:0 FAs dominating the extract (see figure 5). The
GC temperature program was modified slightly due to presence of other compounds in the
extract eluting at higher temperature. The trapping windows were shortened (~30 sec) due to
the presence of compounds eluting close to the target FAMEs, especially the presence of a C18:1
FAME eluting immediately before the C18:0 FAME. The results obtained with NMR analysis
of the archaeological FAMEs are entirely analogous to those obtained from the standard
FAMEs (figure 4.b). The cyclic poly(dimethyl siloxane) bleed content was determined to be
16 ng and 15 ng of C for the C16:0 (TC16:0) and the C18:0
(TC18:0), respectively. This would
theoretically offset the dates of the FAMEs by only 1 year towards older values (see table 2
and figure 4).
Low intensity peaks were present in the NMR spectrum of C18:0 isolated from Pot-
TC18:0, of similar intensity, but different shift to the column bleed, at: 5.37 ppm, 4.13 ppm, and
1.98 ppm. These appear to correspond to very low concentrations of isomeric monounsaturated
FAMEs resulting from the tail of the components eluting just before the C18:040 (confirmed by
a GC-MS analysis based on manual interpretation and comparison to the NIST database).
Hence, this is archaeological and contemporaneous with the trapped C18:0 FAME, i.e. it is not
exogenous carbon introduced through the isolation protocol. This latter finding further
emphasises the usefulness of NMR in assessing peak purity prior to AMS analysis.

CONCLUSIONS
The results presented herein represent the first direct identification and quantification
of nanogram quantities of exogenous carbon in samples for radiocarbon dating by AMS. This
novel NMR-based approach overcomes the shortcomings of all pre-existing techniques for
monitoring the presence of exogenous carbon, and other spectroscopic techniques, i.e. FTIR,
which lack the required sensitivity. While other approaches have attempted to indirectly
account for column bleed by monitoring the effect of column bleed on standards with known
radiocarbon content and radiocarbon dead samples, these approaches generally require
excessive/unrealistic trapping windows to provide sufficient column bleed carbon for making
corrections. Microcryoprobe NMR at high field (≥ 700 MHz) is uniquely suited to this
application since it possesses the sensitivity and dynamic range perfectly matched to assessing
the purity of organic compounds for radiocarbon analysis. Our results confirm that exogenous
carbon is readily detectable by 700 MHz NMR at the ‰ concentrations that would affect high
precision radiocarbon determinations by AMS.
Furthermore, our method is preferable to using corrections based on the age shift of
standards isolated via PCGC, as the 700 MHz NMR spectrum provides a comprehensive
overview of all the protonated chemical species present and, thus, is able to molecularly-
identify other sources of extraneous carbon in trapped compounds, in addition to co-eluting
column bleed. The archaeological example given above, which revealed ‰ concentrations of
unsaturated FAMEs, in the C18:0 FAME, resulting from the tailing of the earlier eluting GC
peak, is a case in point. Our NMR results also demonstrate that changing the temperature
programme had no significant effect on column bleed.

Finally, while the results presented here demonstrate that the column bleed from the
DB-1 column coated with a 1.5 µm thickness film is negligible, it is important to be aware that
other phases, phase thickness or even deteriorating cross-linked poly(dimethyl siloxane) coated
columns, or temperature programmes using higher temperatures, may produce sufficient bleed
to have a significant effects on radiocarbon determinations. If the nature of a stationary phase
is not different than 100%-dimethylpolysiloxane then the presence of other ‘bleed’ products
should be considered when applying this method. Thus, to guarantee the reliability of
radiocarbon dates of compounds isolated by PCGC, determinations, such as those described
here should be performed: (i) every time a new column is installed into a PCGC instrument, or
(ii) when a compound with a different boiling point is isolated using adjusted temperature
parameters in the PCGC program.
ACKNOWLEDGEMENT
The research was performed within the context of the NeoMilk project which is
supported by a European Research Council (ERC) grant to RPE (FP7-IDEAS-ERC/324202).
We thank BrisSynBio, a BBSRC/EPSRC-funded Synthetic Biology Research Centre, for the
use of the 700 MHz NMR spectrometer (BB/L01386X/1) and support for CW and MPC.
Philippe Lefranc and Delphine Mini from the Institut National de Recherches Archéologiques
préventives (INRAP, France) are thanked for the provision of the pottery vessel.

REFERENCES
(1) Taylor, R. E. Radiocarbon dating, an archaeological perspective, Academic press, INC:
London. 1987.
(2) Aitken, M. J. Science-based dating in archaeology, Addison Wesley Longman: New York.
1990.
(3) Bowman, S. Radiocarbon dating. Interpreting the past, British Museum Press: London.
1990.
(4) D'Elia, M., Gianfrate, G., Quarta, G., Giotta, L., Giancane, G. and Calcagnile, L.
Radiocarbon. 2007, 49, 201-210
(5) Alon, D., Mintz, G., Cohen, I., Weiner, S. and Boaretto, E. Radiocarbon. 2002, 44, 1-11
(6) Yizhaq, M., Mintz, G., Cohen, I., Khalaily, H., Weiner, S. and Boaretto, E. Radiocarbon.
2005, 47, 193-206
(7) Eglinton, T. I., Aluwihare, L. I., Bauer, J. E., Druffel, E. R. M. and McNichol, A. P. Anal.
Chem. 1996, 68, 904-912
(8) Currie, L. A., Eglinton, T. I., Benner Jr, B. A. and Pearson, A. Nucl. Instrum. Methods Phys.
Res., Sect. B. 1997, 123, 475-486
(9) Eglinton, T. I., Benitez-Nelson, B. C., Pearson, A., McNichol, A. P., Bauer, J. E. and
Druffel, E. R. M. Science. 1997, 277, 796-799
(10) McNichol, A. P., Ertel, J. R. and Eglinton, T. I. Radiocarbon. 2000, 42, 219-227

(11) Stott, A. W., Berstan, R., Evershed, P., Hedges, R. E. M., Ramsey, C. B. and Humm, M.
J. Radiocarbon. 2001, 43, 191-197
(12) Stott, A. W., Berstan, R., Evershed, R. P., Bronk-Ramsey, C., Hedges, R. E. M. and
Humm, M. J. Anal. Chem. 2003, 75, 5037-5045
(13) Berstan, R., Stott, A. W., Minnitt, S., Bronk Ramsey, C., Hedges, R. E. M. and Evershed,
R. P. Antiquity. 2008, 82, 702-713
(14) Grassie, N. and Macfarlane, I. G. Eur. Polym. J. 1978, 14, 875-884
(15) Schomburg, G., Dielman, R., Borwitzky, H. and Husmann, H. J. Chromatogr. A. 1978,
167, 337-354
(16) Grob, K. and Grob, G. J. High Resolut. Chromatogr. 1982, 5, 349-35
(17) Aleksandrova, Y. A., Nikitina, T. S. and Pravednikov, A. N. Polym. Science U.S.S.R.
1968, 10, 1250-1257
(18) Thomas, T. H. and Kendrick, T. C. J. Polym. Sci., Part A-2: Polym. Phys. 1969, 7, 537-
549
(19) Ziolkowski, L. A. and Druffel, E. R. M. Anal. Chem. 2009, 81, 10156-10161
(20) Zencak, Z., Reddy, C. M., Teuten, E. L., Xu, L., McNichol, A. P. and Gustafsson, Ö. Anal.
Chem. 2007, 79, 2042-2049
(21) Coppola, A. I., Ziolkowski, L. A. and Druffel, E. R. M. Radiocarbon. 2013, 55, 1631-
1640
(22) Molinski, T. F. Nat. Prod. Rep. 2010, 27, 321-329
(23) Dalisay, D. S. and Molinski, T. F. J. Nat. Prod. 2010, 73, 679-682
(24) Wolkenstein, K., Sun, H. Falk, H. and Griesinger, C. J. Am. Chem. Soc. 2015, 137,13460-
13463
(25) Williams, RB., Du, L., Norman, V.L., Goering, MG., O'Neil-Johnson, M., Woodbury, S.,
Albrecht, M.A., Powell, D.R., Cichewicz, R.H., Eldridge, G.R. and Starks, C.M. J. Nat. Prod.
2014, 77, 1438-1444
(26) Rossi, P., Swapna, G.V.T., Huang, Y.J., Aramini, J.M., Anklin, C, Conover, K.,
Hamiliton, K, Xiao, R., Acton, T.B., Ertekin, A., Everett, J.k and Montelione, G.T. J. Biomol.
NMR. 2010, 46, 11-22. (27) Aramini, J.M., Tubbs, J.L., Kanugula, S., Rossi, P., Ertekin,
A., Maglaqui, M., Hamilton, K., Ciccosanti, C.T., Jiang, M., Xiao, R., Soong, T.T., Rost,
B., Acton, T.B., Everett, J.K., Pegg, A.E., Tainer, J.A. and Montelione, G.T. J. Biol. Chem.
2010, 285, 13736-13741
(28) Simmler, C., Napolitano, J.G., McAlpine, J.B., Chen, S.N. and Pauli, G.F. Curr. Opin.
Biotech. 2014, 25, 51-9.
(29) Griffiths, L. and Irvine, A.M. Analyst. 1998, 123, 1061−1068.
(30) Maniara, G., Rajamoorthi, K., Rajan, S. and Stockton, G.W. Anal. Chem. 1998, 70,4921–
4928
(31) Weber, M., Hellriegel, C., Rϋck, A., Sauermoser, R. and Wϋtrich, J. Accredit. Qual Assur.
2013, 18, 91-98.

(32) Holzgrabe, U., Diehl, B.W.K. and Wawer, I. J. Pharm. Biomed. Anal. 1998, 17, 557–616
(33) Meusinger, R. Anal. Chim. Acta. 1999, 391, 277-288
(34) Hays, P.A. J. Forensic. Sci. 2005, 50, 1342-60
(35) Wells, R.J., Hook, J.M., Al-Deen, T.S. and Hibbert, D.B. J. Agr. Food. Chem. 2002, 50,
3366-3374.
(36) Nelson, M.A., Bedner, M., Lang, B.E., Toman, B. and Lippa, K.A. Anal. Bioanal. Chem.
2015, 407, 8557-8569
(37) Huang, B.M., Xiao, S.Y., Chen, T.B., Xie, Y., Luo, P., Liu, L. and Zhou, H. J.
Pharmaceut. Biomed. 2017, 139, 193-204
(38) Correa-Ascencio, M. and Evershed, R. P. Anal. Methods 2014, 6, 1330-1340
(39) Chojnowski, J. and Cypryk, M. In Silicon-containing polymers; Jones, R. G., Ando, W.,
Chojnowski, J., Ed; Kluwer Academic Publishers: Netherlands, 2000; pp 3-41.
(40) Mottram, H.R., Dudd, S. N., Lawrence, G. J., Stott, A. W. and Evershed, R. P. J.
Chromatogr. A. 1999, 833, 209-221.

TABLES AND FIGURES
Table 1: Concentration, mass of carbon in the FAMEs and siloxanes and peak areas of the
standards in the solutions prepared for the NMR calibration curve. The NMR peak area of the
FAME corresponds to the CH3 group at 3.6 ppm. The siloxane was hexamethylcyclotrisiloxane
(shift at 0.20 ppm).
[FAME]
(mg.mL-1)
[Siloxane]
(mg.mL-1)
Area
FAME
Area
siloxane
A Siloxane
/ A FAME
mass C
FAME
(mg)
mass C
siloxane
(mg)
mass C
siloxane /
mass C
FAME
1 1.00E+00 1.12 12.23 1.09E+01 3.82E-02 1.62E-02 4.24E-01
1 1.00E-01 0.15 0.21 1.40E+00 3.82E-02 1.62E-03 4.24E-02
1 1.00E-02 0.15 0.02 1.33E-01 3.82E-02 1.62E-04 4.24E-03
1 1.00E-03 4.01 0.05 1.25E-02 3.82E-02 1.62E-05 4.24E-04
1 1.00E-04 3.97 0.01 2.52E-03 3.82E-02 1.62E-06 4.24E-05
1 1.00E-05 1.06 0 0 3.82E-02 1.62E-07 4.24E-06
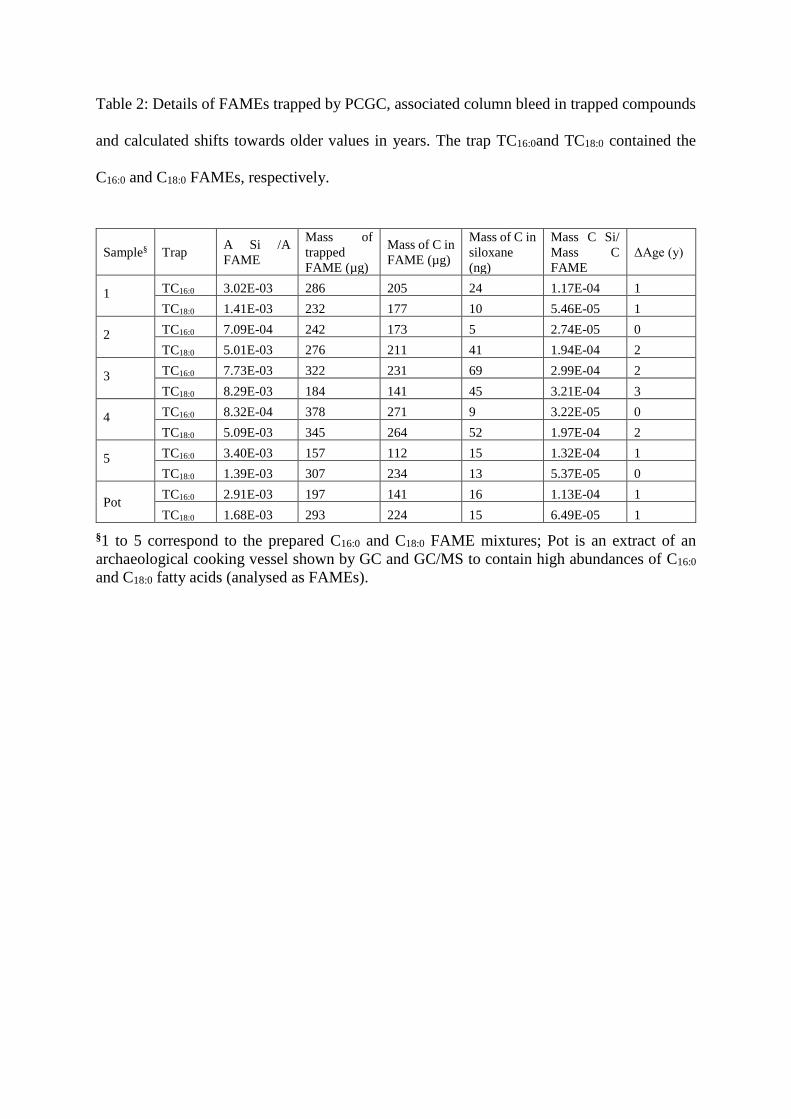
Table 2: Details of FAMEs trapped by PCGC, associated column bleed in trapped compounds
and calculated shifts towards older values in years. The trap TC16:0and TC18:0 contained the
C16:0 and C18:0 FAMEs, respectively.
Sample§ Trap A Si /A
FAME
Mass of
trapped
FAME (µg)
Mass of C in
FAME (µg)
Mass of C in
siloxane
(ng)
Mass C Si/
Mass C
FAME
ΔAge (y)
1
TC16:0 3.02E-03 286 205 24 1.17E-04 1
TC18:0 1.41E-03 232 177 10 5.46E-05 1
2
TC16:0 7.09E-04 242 173 5 2.74E-05 0
TC18:0 5.01E-03 276 211 41 1.94E-04 2
3
TC16:0 7.73E-03 322 231 69 2.99E-04 2
TC18:0 8.29E-03 184 141 45 3.21E-04 3
4
TC16:0 8.32E-04 378 271 9 3.22E-05 0
TC18:0 5.09E-03 345 264 52 1.97E-04 2
5
TC16:0 3.40E-03 157 112 15 1.32E-04 1
TC18:0 1.39E-03 307 234 13 5.37E-05 0
Pot TC16:0 2.91E-03 197 141 16 1.13E-04 1
TC18:0 1.68E-03 293 224 15 6.49E-05 1
§1 to 5 correspond to the prepared C16:0 and C18:0 FAME mixtures; Pot is an extract of an
archaeological cooking vessel shown by GC and GC/MS to contain high abundances of C16:0
and C18:0 fatty acids (analysed as FAMEs).

Figure 1. (a) Structure of the poly(dimethyl siloxane) GC stationary phase. (b) Proposed
mechanism for thermal degradation of poly(dimethyl siloxane) by mid-chain back-biting
elimination leading the formation of hexamethylcyclotrisoloxane as an example of cyclic
poly(dimethyl siloxane) product from column bleed (adapted from Grassie and Macfarlane14).
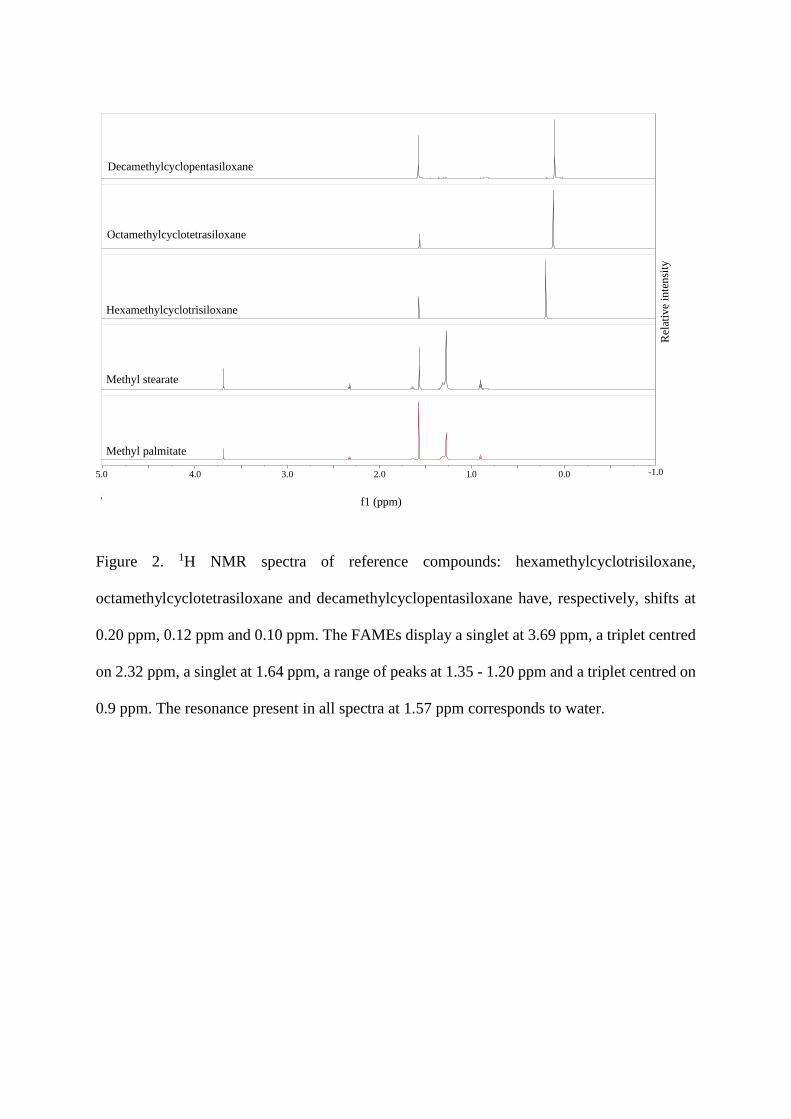
Figure 2. 1H NMR spectra of reference compounds: hexamethylcyclotrisiloxane,
octamethylcyclotetrasiloxane and decamethylcyclopentasiloxane have, respectively, shifts at
0.20 ppm, 0.12 ppm and 0.10 ppm. The FAMEs display a singlet at 3.69 ppm, a triplet centred
on 2.32 ppm, a singlet at 1.64 ppm, a range of peaks at 1.35 - 1.20 ppm and a triplet centred on
0.9 ppm. The resonance present in all spectra at 1.57 ppm corresponds to water.
0.01.02.03.04.0
5f1 (ppm)
-1.05.0
Methyl palmitate
Methyl stearate
Hexamethylcyclotrisiloxane
Decamethylcyclopentasiloxane
Octamethylcyclotetrasiloxane
Rel
ativ
e in
tensi
ty

-0.50.00.51.01.52.02.53.03.54.04.55.0
0
20
40
60
80
100
0.8
90.9
00.9
1
1.2
81.3
1
1.5
71.6
31.6
41.6
5
2.3
12.3
22.3
3
3.6
9
f1 (ppm)
Column bleed
0.00
0.02
0.04
0.06
0.0
70.0
90.1
1
-0.50.00.51.01.52.02.53.03.54.04.55.0
0
20
40
60
80
100
0.8
90.9
00.9
1
1.2
81.3
1
1.5
71.6
31.6
41.6
5
2.3
12.3
22.3
3
3.6
9
0.1
1
0.0
9
0.02
0.00
0.04
0.06
Column bleed
f1 (ppm)
(a)
(b)
x 244
x 238

Figure 3: Normalised NMR spectra of (a) sample 2-TC18:0 with magnification of the column
bleed resonances at 0.07, 0.09 and 0.11 ppm, and (b) sample Pot-TC18:0 with magnification of
the column bleed resonances at 0.09 and 0.11 ppm.

Figure 4: Ratio of the mass of carbon from poly(dimethyl cyclosiloxane) to the mass of
carbon from the trapped FAME, for all the samples investigated (dot). The square
corresponds to the average and error bar shows the standard deviation. The dashed line
corresponds to the threshold of column bleed contamination of 1 ‰ that would affect 14C
determinations by AMS.

Figure 5: (a) Partial gas chromatogram of the invisible residues from the pottery vessel
ROSC4695 with the dashed line correspond to the trapping windows chosen for isolation. (b)
and (c) partial gas chromatograms of the contents of the traps, respectively, Pot-TC16:0 and Pot-
TC18:0 corresponding to the C16:0 and C18:0 trapping windows indicated and (a). IS is the internal
standard added for quantification.

For TOC only