case study of jakarta and surabaya
TRANSCRIPT
1
Urban Environmental Management Capacity Assessment: Case study of Jakarta and Surabaya
Ms. Noriko Kono, Research Associate Institute for Global Environmental Strategies (IGES)
Kitakyushu Office, 3-9-30 Asano, Kokurakita-ku, Kitakyushu 802-0001 Japan Tel: +81-93-513-3711, Fax: +81-93-513-3712, E-mail: [email protected]
I. Urban Environmental Management Capacity Assessment.................................................. 2
I.1 Background ..........................................................................................................................2 I.1.1 Assessing the capacity of a city.......................................................................................2 I.1.2 Role of Three Stakeholders ............................................................................................3 I.1.3 Level at Local Governance.............................................................................................3
I.2. Methodology........................................................................................................................3 II. Case study of Jakarta...................................................................................................... 4
II.1 General Overview of Jakarta..................................................................................................4 II.2 Jakarta Air Quality Condition .................................................................................................4 II.3 Precedent studies on Air Pollution in Jakarta ............................................................................6 II.4 Jakarta’s Capacity Analysis ....................................................................................................7
II.4.1 Institutional Capacity ......................................................................................................7 II.4.2 Regulation Capacity .......................................................................................................7 II.4.3 Communication Capacity ................................................................................................9 II.4.4 Financial Capacity ........................................................................................................10 II.4.5 Technology Capacity ....................................................................................................10
III. Case study of Surabaya ................................................................................................12 III.1 General Overview of Surabaya............................................................................................12 III.2 Surabaya Air Quality Condition ..........................................................................................12 III.3 Precedent studies on Air Pollution in Surabaya......................................................................13 III.4 Surabaya’s Urban Environmental Management Capacity ........................................................13
III.4.1 Institution Capacity .....................................................................................................14 III.4.2 Regulation Capacity ....................................................................................................15 III.4.3 Communication Capacity .............................................................................................16 III.4.4 Financial Capacity.......................................................................................................16 III.4.5 Technology Capacity ...................................................................................................16
IV. Conclusion....................................................................................................................18 IV.1 Summary of Two Cities ......................................................................................................18
IV.1.1 Summary of Jakarta.....................................................................................................18 IV.1.2 Summary of Surabaya..................................................................................................18
IV.2 Capacity Analysis ..............................................................................................................19 IV.3 For further research for the UEM capacity assessment............................................................23

2
I. Urban Environmental Management Capacity Assessment I.1 Background The Kitakyushu Initiative has been seeking ways to evaluate how a city can cope with endless environmental problems. It involves studies to create implementation indicators for a particular city’s environmental management. Mere figures on materialistic and physical conditions will not be useful in future, since urban problems are changeable and ever lasting. Therefore, since 2002, the Kitakyushu Initiative has been developing Urban Environmental Management Capacity Assessment System to measure environment capacity of a city. This assessment system is innovative and practical for Urban Environmental Management in the following three points. First, the system focuses on assessing the environmental management capacity of a city. Second, it has a structure to assess the capacity of three stakeholders; local governments, enterprises, and citizens. Third, the system focuses on the local government level, including the supporting policies/actions of national governments and international cooperation. The characteristics of these points will be discussed in the following paragraphs. I.1.1 Assessing the capacity of a city Recently, capacity or capacity development has been taking centre stage in development studies, and environmental development is no exception. Numerous key players in international development have defined Capacity and Capacity Development in various ways. Fig. 1 shows the definitions from UNDP, OECD/DAC, WB and CIDA. Recently, UNDP has summarised the change of paradigm in capacity development. Fig. 2 explains how Capacity Development can be pursued. In particular, the following two sections justify the other two characteristic s of the system: “capacity development” which states “that the three cross-linked layers of capacity are individual, institutional and societal”, and “most important forms of knowledge” which states the importance of “local knowledge acquired from other countries – in the South or North”. Fig. I-1 Definition of Capacity and Capacity Development Org. Definition: Capacity Definition: Capacity Development UNDP The ability of individuals and organisations or
organisational units to perform functions effectively, efficiently and sustainably.
A concept which is broader than organizational development since it includes an emphasis on the overall system, environment or context within which individuals, organisations and societies operate and interact (and not simp ly a single organisation).
OECD/DAC
The ability of individuals, groups, organisations and institutions in a given context to address environmental issues as part of a range of efforts to achieve sustainable development.
The process by which capacity in environment and appropriate institutional structures is enhanced.
WB Combination of people, institutions and practices that permits countries to reach their development goals
Investment in human capital, institutions and practices
CIDA Organizational and technical abilities, relationships and values that enable countries, organizations, groups and individuals at any level of society to carry out functions and achieve their development objectives over time.
Approaches, strategies and methodologies used by developing country, and/or external stakeholders, to improve performance at the individual, organizational, network/sector or broader system level.
Sources: UNDP. Capacity Assessment and Development: In a Systems and Strategic Management Context; OECD. 1995. Developing Environmental capacity: A Framework for Involvement; World Bank. 1999. Capacity Development: Definitions, Issues and Implications for Planning, monitoring and Evaluation; CIDA (Canadian International Development Agency). 2000. Capacity development: Occasional Series. Fig. I-2 A New Paradigm for Capacity Development
3
Current paradigm New paradigm
NATURE OF DEVELOPMENT
Improvements in economic and social conditions
Social transformation, including building of “right capacities”
CONDITIONS FOR EFFECTIVE DEVELOPMENT COOPERATION
Good policies that can be externally prescribed
Good policies that have to be home-grown
THE ASYMMETRIC DONOR-RECIPIENT RELATIONSHIP
Should be countered generally through a spirit of partnership and mutual respect
Should be specifically addressed as a problem by taking countervailing measures
CAPACITY DEVELOPMENT
Human resource development, combined with stronger institutions
Three cross-linked layers of capacity: individual, institutional and societal
ACQUISITION OF KNOWLEDGE
Knowledge can be transferred Knowledge has to be acquired
MOST IMPORTANT FORMS OF KNOWLEDGE
Knowledge developed in the North for export to the South
Local knowledge acquired from other countries – in the South or North
Source: UNDP. 2002. Capacity for development: New solutions to old problems. I.1.2 Role of Three Stakeholders Nowadays, when referring to environment management, the role of three stakeholders cannot be ignored. Here in this Capacity Assessment System, the stakeholders are: local governments, enterprises and citizens. Many paraphrases can be seen in these three stakeholders. As shown earlier, OECD puts them as individual, institutional and societal; World Bank outlines them as government, markets, and community. The Japanese Government also focuses on this categorisation in their Environment Report. METI’s Environmental Reporting Guidelines 2001- With Focus on Stakeholders – also outlines the importance of these stakeholders. I.1.3 Level at Local Governance The Asia-Pacific Region has not undergone major development over the past century. The national framework of most countries is top-down, rather than bottom-up. Environment policies are usually centralised and surveys at the national level have been sufficient in environmental discussions. When ascertaining the state of the local governance situation, mega-cities are often utilised. The reasons for their frequent usage are that they are front-runners in a country or a region in terms of urban development, economic growth, industrial transformation, lifestyle change, and policy implementation, and these cities consume energy and materials intensively, have had critical environmental experiences and pioneering approaches, and can act as models for small and medium-sized cities. Today, rapid urbanisation in cities sometimes displays characteristics that are different from agrarian nations in the Asia-Pacific Region. Moreover, as cities become industrialised, decentralisation or devolution of power is focused on, and the capacity of the local government is more important than that of the national government, when looking at urban environmental management. Therefore, a focus on local governance is relevant for capacity assessment. I.2. Methodology To assess management capacity, the following five categories are looked at: institutions, regulations, communication, finance, and technology. These categories have been carefully selected after referral of several different studies on capacity development. The definitions of these categories are as follows. 1. INSTITUTIONS INSTITUTIONS include all three stakeholders’ environmental organisations. This includes a city’s environmental division, systematised group of citizens, NGOs, chambers of commerce, and so on. In addition, the national government and local government’s relationship will be mentioned here, such as top-down or bottom-up, decentralised or centralised, and so on. Human resources of each institution fall into this category. This includes experts, educational background, and appointed councillors.

4
2. REGULATIONS REGULATIONS include all written documents in official format by each stakeholder. Constitutions, laws, agreements, municipal by-laws, and ordinances are seen as this category’s components. 3. COMMUNICATION COMMUNICATION encompasses networking and social bonds, serving as lubricants to enhance environmental conditions. Access to information and communication is a prerequisite for sustainable development and can help stakeholders break out of isolation, exchange ideas and learn from the experiences of the others. In concrete terms, it includes public participation, information sharing, study groups, environmental education, meetings between stakeholders, and so on. Opinion polls, the trend of the mass media, and publications also fall into this category. 4. FINANCE FINANCE signifies all the monetary activities of the three stakeholders relating to the environment. For example, this category consists of subsidies, taxation systems, ODA, private sector spending, and bank investments, among others. 5. TECHNOLOGY Technology is advanced knowledge, which can be shared globally to improve the environment condition of a city. This section does not only contain engineering and scientific knowledge, but also economic and social science knowledge such as EMS, environmental accounting, and the ISO14000 series. Some urban planning practices may be classified into this category. II. Case study of Jakarta II.1 General Overview of Jakarta Jakarta is situated in the west of Java Island, the centre island of Indonesia. Jakarta is the capital city of Indonesia, an archipelago country consisting of about 13,000 islands and 200 million people. Jakarta currently has a population of approximately 10 million, which makes it the largest city in Indonesia. Indonesia has a unique diversity of tribes, language, culture, customs and religion. This diversity is mirrored in the capital city of Jakarta. The History of Jakarta dates back from around 500 years ago in a small part of the downstream of Ciliwung River. During centuries later, the city port grew into a bustling international trade centre. The untold stories of Jakarta up until the earlier arrival of European colonialists were very scarce. In the early 16th century, Kelapa was the port's name of a Hindus Kingdom called Sunda with Pajajaran as its capital city. It was located around 40 kilometres near the city of Bogor nowadays. Portugal was the first largest group of Europeans to come to Kelapa Port. The City was then under assault by mobs led by a young man named Fatahillah from another kingdom near Kelapa. Afterwards on June 22, 1527, Fatahillah changed the name of Sunda Kelapa into Jayakarta. Hence, the date is commemorated as the date of birth of the City of Jakarta. The Dutch arrived at the end of the 16th century and took control of Jayakarta. II.2 Jakarta Air Quality Condition Jakarta’s air pollution conditions have become serious in these past few decades, especially from the vehicular sources. Below is the 1997 survey on automobile emissions in Jakarta. Approximately 47.9% of the total vehicles exceed the standard and, based on the type of fuel used by diesel vehicles, more than half exceeded the standard.
Fig. I-3 Automobiles Emission test result in DKI Jakarta, 1997

5
Source: DKI Jakarta The bar graphs below show the ambient air quality in Jakarta (NOx, TSP=total suspended particles, SO2, Pb) in recent five years. NOx emissions are relatively low in all areas, marking below the DKI standard for 0.050 ppm level, except for the two locations in 1998 and 2000. The total suspended particulate emissions are not very admirable, as it exceeds the standard of 0.25 mg/m3 especially in recent years. Fig. I-4 Ambient Air Quality in Jakarta NOx and TSP condition (1997-2001)
0.00000
0.02000
0.04000
0.06000
0.08000
0.10000
NO
x (p
pm
)
A B C D E F G H I
Location
1997
1998
1999
2000
2001
DKI Standard0.000000.100000.200000.300000.400000.500000.60000
TS
P (
mg
/m3
)
A B C D E F G H I
Location
1997
1998
1999
2000
2001
DKI Standard
Source: DKI Jakarta SO2 emissions have improved greatly and all emissions are far below the DKI standard (0.10 ppm). Pb levels are also relatively low and in most location is below the DKI standard (1.0 mg/m3). The introduction of unleaded gas is expected to be conducted in 2001 in Jakarta, so emissions will be lowered in the future. Fig. I-5 Ambient Air Quality in Jakarta SO2 and Pb (1997-2001)
0.00000
0.02000
0.04000
0.06000
0.08000
0.10000
SO
2 (
pp
m)
A B C D E F G H I
Locat ion
Ambien A i r Qua l i ty in Jakar ta , 1997-2001S O 2 ( p p m )
1997
1998
1999
2000
2001
DKI Standard
A m b i e n A i r Q u a l i t y i n J a k a r t a , 1 9 9 7 - 2 0 0 1P b ( m g / m 3 )
0 . 0 0 0 0 0
0 . 2 0 0 0 0
0 . 4 0 0 0 0
0 . 6 0 0 0 00 . 8 0 0 0 0
1 . 0 0 0 0 01 . 2 0 0 0 0
A B C D E F G H I
L o c a t i o n
Pb
(m
g/m
3)
1 9 9 7
1 9 9 8
1 9 9 9
2 0 0 0
2 0 0 1
D K I S t a n d a r d
Source: DKI Jakarta PM10, CO, O3, and NO2 are all satisfactory in that the figures are below DKI standards: PM10 (0.15mg/m3), CO (8 ppm), O3 (50 ppb), NO2 (50ppb). Fig. I-6 Ambient Air Quality in Jakarta PM10, CO, O3, NO2 (Year 2000)
Type of fuel Unit Below Emission Standard Exceed the standard
Unit % Unit %
Gas 31 21 67.74 10 32.26
Premium 6,525 3,986 61.09 2,539 38.91
Diesel 4,324 1,901 43.96 2,423 56.04
Total 10,880 5,908 54.30 4,972 47.90

6
0
0.05
0.1
0.15
0.2
Month
PM
-10
(mg/
M3)
Jan Feb Mar Apr Mei Jun Jul Ags Sep Okt Nov Des
PM-10
DKI Standart
Ambient Air Quality in Jakarta, 2000 ( Jl.Casablanca )PM-10 (mg/m3)
0
2
4
6
8
10
Month
CO
(ppm
)
Jan Feb Mar Apr Mei Jun Jul Ags Sep Okt Nov Des
CO
DKI Standart
Ambient Air Quality in Jakarta, 2000 (Jl. Casablanca )CO (ppm)
0
20
40
60
Month
PM
-10
(mg/
M3)
Jan Feb Mar Apr Mei Jun Jul Ags Sep Okt Nov Des
O3
DKI Standart
Ambient Air Quality in Jakarta, 2000 ( Jl.Casablanca )O3 (ppb)
0
20
40
60
Month
NO
2 (p
pb)
Jan Feb Mar Apr Mei Jun Jul Ags Sep Okt Nov Des
NO2
DKI Standart
Ambient Air Quality in Jakarta, 2000 ( Jl.Casablanca )NO2 (ppb)
Source: DKI Jakarta The figure below shows the air quality in Jakarta from 2000 to 2002. Though the figures included in the “very unhealthy” sections decreases, the figures in the “unhealthy” section demonstrate that the environmental condition is still not stable. Fig. I-7 PSI / ISPU score in Jakarta PM10, CO, O3, NO2 (2000-2002)
PSI/ ISPU 2000 (%) 2001 (%) 2002 (%)till Sept Good 26.00 19.10 7.10 Moderate 74.00 72.05 69.94 Unhealthy - 8.49 28.04 Very Unhealthy - 0.27 - Dangerous
Source: DKI Jakarta II.3 Precedent studies on Air Pollution in Jakarta Air pollution in Jakarta has been one of the biggest concerns of urban environmental problems for many international organisations. From the early 1990s, vigorous discussions were carried out on the future of air quality management in Jakarta. Documents from that period are as follows: l World Bank. Indonesia: Energy and the Environment. 1993. l BAPEDAL. Third Jabotabek Urban Development Project. 1994. l Soedomo. Collections of Data for the URBAIR study in Jakarta. 1993. l COWI Consultant/World Bank. List of 100 industries which may qualify for assistance.1992. l LLAJR Air Pollution Monitoring and Control Project. 1991. l BPPT/KFA. Environmental Impacts of energy strategies for Indonesia.1992. l Bosch. Air Quality Assessment in Medan. 1991 l JSO. Jakarta in Figures. 1991.

7
These documents are more beginning of awareness of air pollution problems than discussions on the solutions for air pollution. In the late 1990s, more and more strategic research was conducted by various international organisations. For example, the World Bank published a document entitled, “Urban Air Quality Management Strategy in Asia: Jakarta report” in 1997, which suggested the following two points for future air quality management in Jakarta: construction of a new institution to research air pollution in the city, and reference to the introduction of cleaner oil, especially unleaded gasoline. Additional research was conducted in 1997 by JICA and BAPEDAL, the precursor of Ministry of Environment of Indonesia. This report proposes the following: air quality monitoring, stationery resources inventory, and non-renewable resources inventory. II.4 Jakarta’s Capacity Analysis
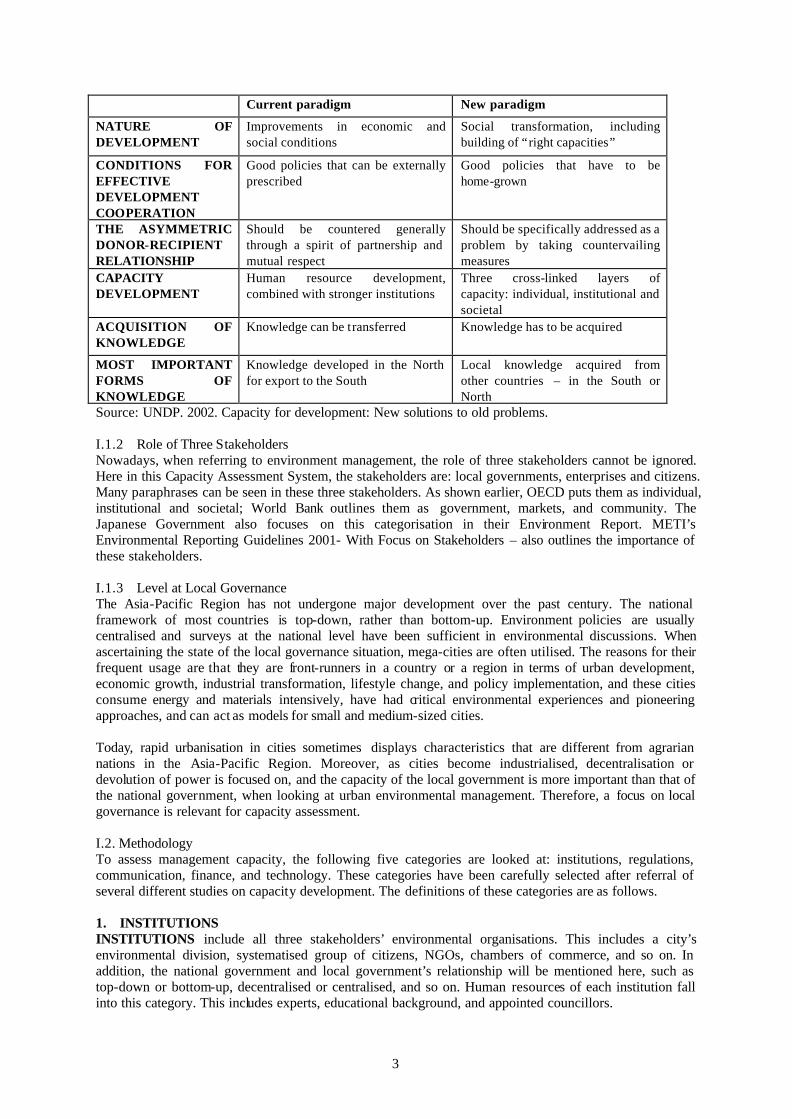
II.4.1 Institutional Capacity Jakarta’s BPLHD: Local Environment Department The institutional capacity of Jakarta is characterised by a strong local government and NGOs. The Environment Department of Jakarta was established in 2001, with the start of the decentralisation policy. BAPEDALDA, the policy implementation centre of BAPEDAL in Jakarta, was a precursor of the Environmental Department of Jakarta and not only kept on the rails of national government policies, but also showed independence. It can be seen through one of the four offices in Jakarta, the Jakarta North Environmental Department (BPLHD). The BPLHD has effectively spent two years as independent organisation. It has set a goal of combating the air pollution, including the Blue Sky Programme, Bio Fuel Oil, Compounded Natural Gas (CNG), I & M Programme, and the MEB (Partnership for the Clean Air). Each programme works well to enhance other capacity, for example, the Blue Sky Programme and the I & M Programme are for regulation capacity, the Bio Fuel Oil and Compounded Natural Gas are for technology capacity, and the MEB (Partnership for Clean Air) encompasses communication capacity. It can be said that the local government works as an ideal institutional by arranging the right direction for other capacity development. Pelangi: a local NGO Other players that strengthen this capacity are NGOs. Traditionally, there are many NGOs in Indonesia that play important roles in decision-making for social problems. One such NGO is Pelangi. Pelangi (“rainbow” in Indonesian”) is an NGO and research organization with 25-30 people. Presently, it conducts activities in four programmes: climate change, forestry, energy, and transportation and air pollution and has been identified as a Type II activity at WSSD. In 2001, Pelangi published a research paper “Loe Loe, Gue Gue”, assessing how the city of Jakarta is developed, in terms of four major areas: human resources capacity, social capacity, environmental capacity, and governance capacity, and targets a liveable Jakarta as well. From this research, Pelangi concluded that Jakarta is not satisfactorily developed. Funding for Pelangi’s activities formerly came directly from CIDA, WB, ADB and so on. Nowadays, it is mainly from the United Nations and local funds. Pelangi commandeers a dominating presence in addressing proposals to local governments’ environmental policy making, not only in Jakarta or other Indonesian cities, but also cities overseas such as Bogota in Colombia. This visibility is enabled by Pelangi’s excellent staff and organisational skills. Pelangi also enhances the relationship between private companies. In 2002, Unocal North Sumatra Geothermal Ltd. agreed to designate its geothermal power plant, Sarulla in North Sumatra, as a pilot project for generating electricity with low emissions in an agreement with Pelangi. This activity also indicates this NGO is extremely stable as an institution. II.4.2 Regulation Capacity Regulations have been strenuously stipulated at the national level from the 1980s. Jakarta, as the capital city, has tried to observe these rules meticulously. The national regulation’s history is as follows and these regulations follow the standards of other Southeast Asian countries. Fig. I-8 Regulations on Environmental issues in Indonesia
8
1990 Governmental regulation of the Republic of Indonesia concerning the control of water population 1994 Procedures for AMDAL commissions (1994) 1994 Decree of the state minister for environment of the Republic of Indonesia concerning general
guidelines for the preparation of environmental impact assessment (1994) 1994 Decree of the state minister for environment of the Republic of Indonesia concerning establishment of
an environmental impact assessment commission for integrated / multi-sectoral activities (1994) 1994 Decree of the state minister for environment of the Republic of Indonesia concerning guidelines for the
determination of significant impact (1994) 1994 procedures for AMDAL commissions (1994)
1994 Governmental regulation of the Republic of Indonesia concerning hazardous and toxic waste management
1995 Decree of the state minister for environment of the Republic of Indonesia concerning quality standards of liquid waste for industry activities
1995 Decree of the state minister for environment of the Republic of Indonesia concerning quality standards of liquid waste for hotel activity
1995 Decree of the state minister for environment of the Republic of Indonesia concerning motor vehicles exhaust gas standards
1995 Decree of the state minister for environment of the Republic of Indonesia concerning emission standards for stationary sources
1996 Decree of the state minister for environment of the Republic of Indonesia concerning blue sky program implementation
1996 Decree of the state minister for environment of the Republic of Indonesia concerning stipulation of the priority province region level 1 as the implementer of blue sky program
1996 Decree of the state minister for environment of the Republic of Indonesia concerning noise level standards
1996 Decree of the state minister for environment of the Republic of Indonesia concerning vibration level standards
1996 Decree of the state minister for environment of the Republic of Indonesia concerning offensive odor level standards
Source: Global Environmental Forum. 1999. Below are regulations on gas emissions that show the Asian countries address this issue. Regulations in Indonesia are rather loose as compared with those of other countries.
9
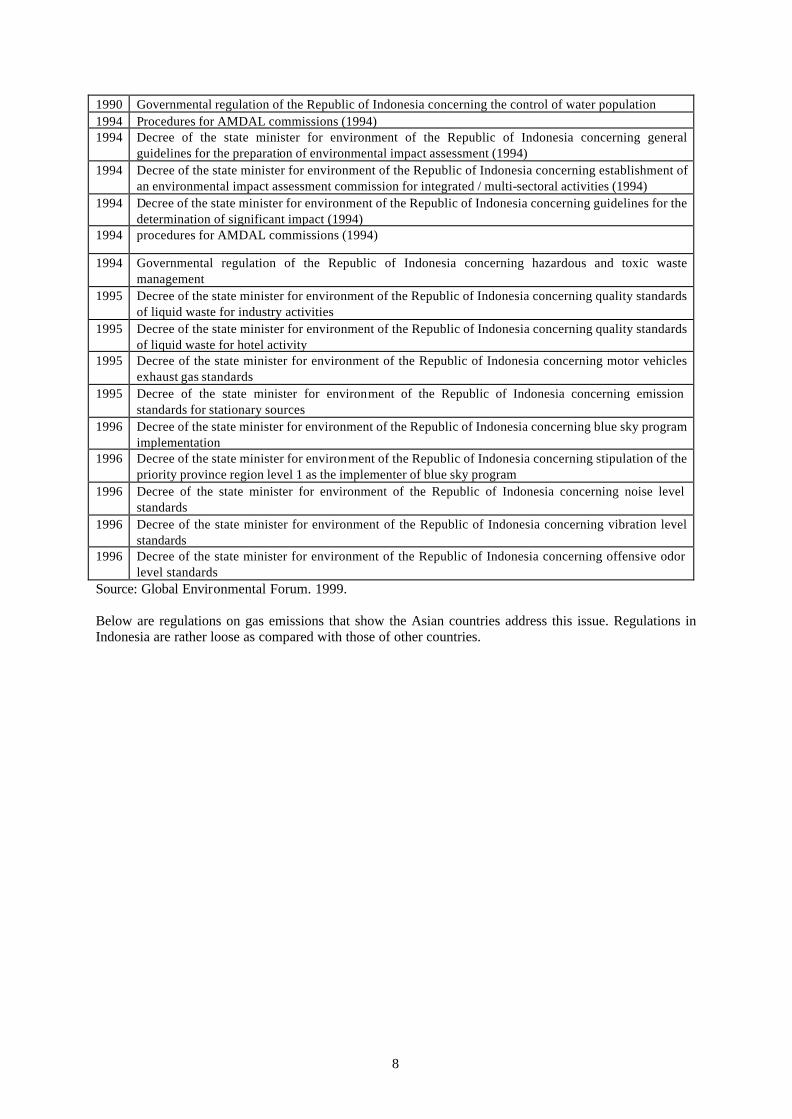
Fig. I-9 Gas Emission Standards in Asian countries Before1995 95 96 97 98 99 0 1 2 3 4 5 6 7 8 9 10
EU 1 2 3
Bangladesh Emission standard s under developmetCanbodia No specific emission for new vehiclesHong Kong 1 2 3Korea 2 3India New Delhi 1 2 3
Metros 1 2 3Other cities 1 2 3Entire coutry 1
Indonesia 1Malaysia 1 2Nepal 1Philippines 1China 1 2Singapore 1 2Sri Lanka No specific emission for new vehiclesTaiwan US tier 1Thailand Passenger Cars 1 2 3
Light Duty 1 2 3 4Heavy Duty 1 2 3
Viet nam gasoline 1 2Diesel 1 2 3
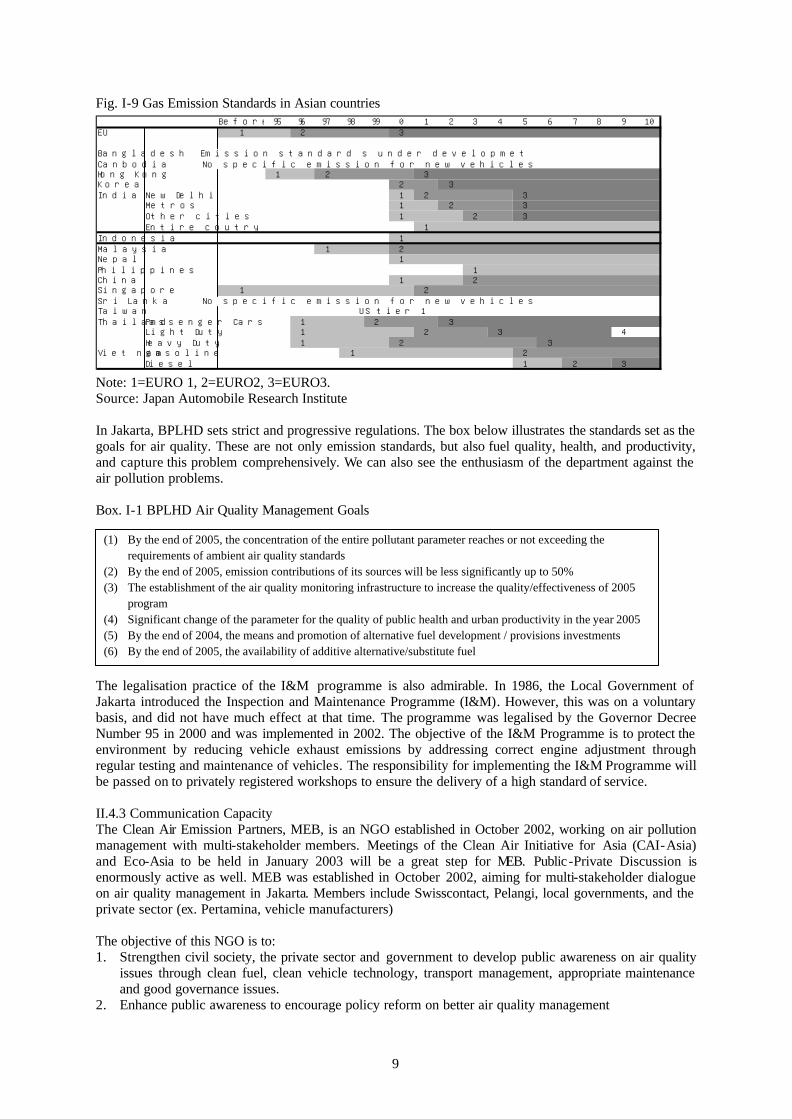
Note: 1=EURO 1, 2=EURO2, 3=EURO3. Source: Japan Automobile Research Institute In Jakarta, BPLHD sets strict and progressive regulations. The box below illustrates the standards set as the goals for air quality. These are not only emission standards, but also fuel quality, health, and productivity, and capture this problem comprehensively. We can also see the enthusiasm of the department against the air pollution problems. Box. I-1 BPLHD Air Quality Management Goals Source: KI Urban Air Quality Management Seminar paper The legalisation practice of the I&M programme is also admirable. In 1986, the Local Government of Jakarta introduced the Inspection and Maintenance Programme (I&M). However, this was on a voluntary basis, and did not have much effect at that time. The programme was legalised by the Governor Decree Number 95 in 2000 and was implemented in 2002. The objective of the I&M Programme is to protect the environment by reducing vehicle exhaust emissions by addressing correct engine adjustment through regular testing and maintenance of vehicles. The responsibility for implementing the I&M Programme will be passed on to privately registered workshops to ensure the delivery of a high standard of service. II.4.3 Communication Capacity The Clean Air Emission Partners, MEB, is an NGO established in October 2002, working on air pollution management with multi-stakeholder members. Meetings of the Clean Air Initiative for Asia (CAI-Asia) and Eco-Asia to be held in January 2003 will be a great step for MEB. Public -Private Discussion is enormously active as well. MEB was established in October 2002, aiming for multi-stakeholder dialogue on air quality management in Jakarta. Members include Swisscontact, Pelangi, local governments, and the private sector (ex. Pertamina, vehicle manufacturers) The objective of this NGO is to: 1. Strengthen civil society, the private sector and government to develop public awareness on air quality
issues through clean fuel, clean vehicle technology, transport management, appropriate maintenance and good governance issues.
2. Enhance public awareness to encourage policy reform on better air quality management
(1) By the end of 2005, the concentration of the entire pollutant parameter reaches or not exceeding the requirements of ambient air quality standards
(2) By the end of 2005, emission contributions of its sources will be less significantly up to 50% (3) The establishment of the air quality monitoring infrastructure to increase the quality/effectiveness of 2005
program (4) Significant change of the parameter for the quality of public health and urban productivity in the year 2005 (5) By the end of 2004, the means and promotion of alternative fuel development / provisions investments (6) By the end of 2005, the availability of additive alternative/substitute fuel
10
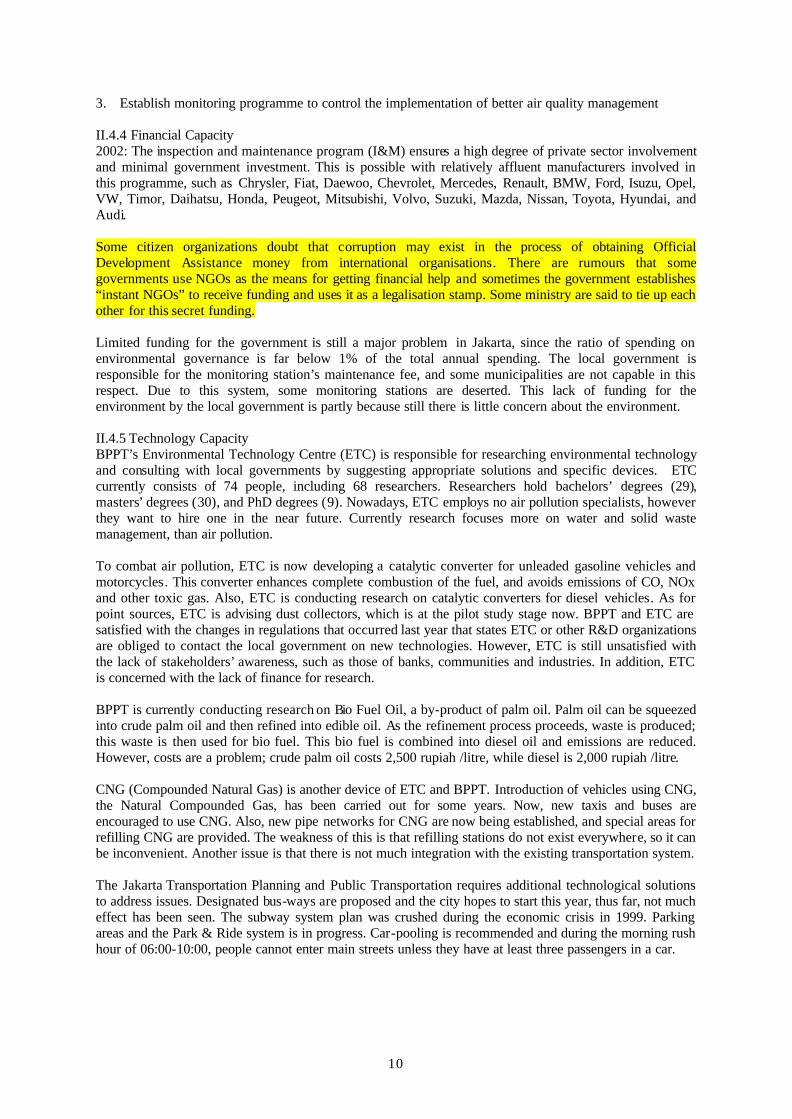
3. Establish monitoring programme to control the implementation of better air quality management II.4.4 Financial Capacity 2002: The inspection and maintenance program (I&M) ensures a high degree of private sector involvement and minimal government investment. This is possible with relatively affluent manufacturers involved in this programme, such as Chrysler, Fiat, Daewoo, Chevrolet, Mercedes, Renault, BMW, Ford, Isuzu, Opel, VW, Timor, Daihatsu, Honda, Peugeot, Mitsubishi, Volvo, Suzuki, Mazda, Nissan, Toyota, Hyundai, and Audi. Some citizen organizations doubt that corruption may exist in the process of obtaining Official Development Assistance money from international organisations. There are rumours that some governments use NGOs as the means for getting financial help and sometimes the government establishes “instant NGOs” to receive funding and uses it as a legalisation stamp. Some ministry are said to tie up each other for this secret funding. Limited funding for the government is still a major problem in Jakarta, since the ratio of spending on environmental governance is far below 1% of the total annual spending. The local government is responsible for the monitoring station’s maintenance fee, and some municipalities are not capable in this respect. Due to this system, some monitoring stations are deserted. This lack of funding for the environment by the local government is partly because still there is little concern about the environment. II.4.5 Technology Capacity BPPT’s Environmental Technology Centre (ETC) is responsible for researching environmental technology and consulting with local governments by suggesting appropriate solutions and specific devices. ETC currently consists of 74 people, including 68 researchers. Researchers hold bachelors’ degrees (29), masters’ degrees (30), and PhD degrees (9). Nowadays, ETC employs no air pollution specialists, however they want to hire one in the near future. Currently research focuses more on water and solid waste management, than air pollution. To combat air pollution, ETC is now developing a catalytic converter for unleaded gasoline vehicles and motorcycles. This converter enhances complete combustion of the fuel, and avoids emissions of CO, NOx and other toxic gas. Also, ETC is conducting research on catalytic converters for diesel vehicles. As for point sources, ETC is advising dust collectors, which is at the pilot study stage now. BPPT and ETC are satisfied with the changes in regulations that occurred last year that states ETC or other R&D organizations are obliged to contact the local government on new technologies. However, ETC is still unsatisfied with the lack of stakeholders’ awareness, such as those of banks, communities and industries. In addition, ETC is concerned with the lack of finance for research. BPPT is currently conducting research on Bio Fuel Oil, a by-product of palm oil. Palm oil can be squeezed into crude palm oil and then refined into edible oil. As the refinement process proceeds, waste is produced; this waste is then used for bio fuel. This bio fuel is combined into diesel oil and emissions are reduced. However, costs are a problem; crude palm oil costs 2,500 rupiah /litre, while diesel is 2,000 rupiah /litre. CNG (Compounded Natural Gas) is another device of ETC and BPPT. Introduction of vehicles using CNG, the Natural Compounded Gas, has been carried out for some years. Now, new taxis and buses are encouraged to use CNG. Also, new pipe networks for CNG are now being established, and special areas for refilling CNG are provided. The weakness of this is that refilling stations do not exist everywhere, so it can be inconvenient. Another issue is that there is not much integration with the existing transportation system. The Jakarta Transportation Planning and Public Transportation requires additional technological solutions to address issues. Designated bus-ways are proposed and the city hopes to start this year, thus far, not much effect has been seen. The subway system plan was crushed during the economic crisis in 1999. Parking areas and the Park & Ride system is in progress. Car-pooling is recommended and during the morning rush hour of 06:00-10:00, people cannot enter main streets unless they have at least three passengers in a car.
11
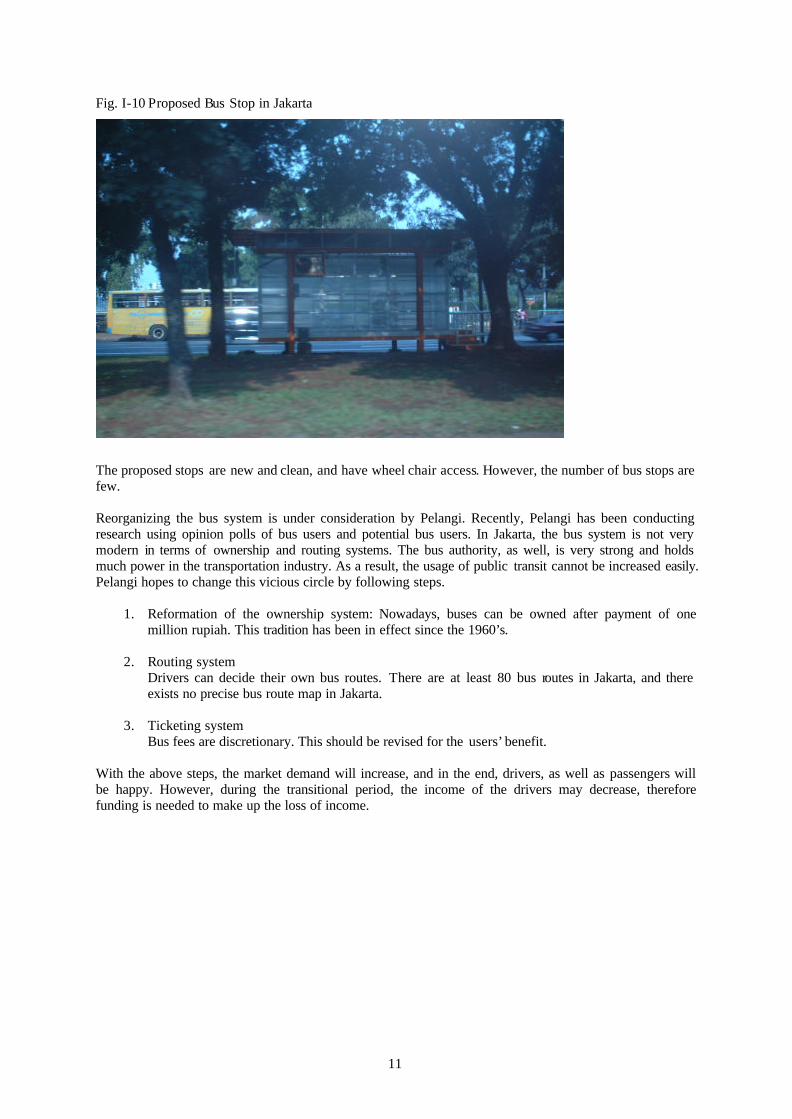
Fig. I-10 Proposed Bus Stop in Jakarta
The proposed stops are new and clean, and have wheel chair access. However, the number of bus stops are few. Reorganizing the bus system is under consideration by Pelangi. Recently, Pelangi has been conducting research using opinion polls of bus users and potential bus users. In Jakarta, the bus system is not very modern in terms of ownership and routing systems. The bus authority, as well, is very strong and holds much power in the transportation industry. As a result, the usage of public transit cannot be increased easily. Pelangi hopes to change this vicious circle by following steps.
1. Reformation of the ownership system: Nowadays, buses can be owned after payment of one million rupiah. This tradition has been in effect since the 1960’s.
2. Routing system
Drivers can decide their own bus routes. There are at least 80 bus routes in Jakarta, and there exists no precise bus route map in Jakarta.
3. Ticketing system
Bus fees are discretionary. This should be revised for the users’ benefit. With the above steps, the market demand will increase, and in the end, drivers, as well as passengers will be happy. However, during the transitional period, the income of the drivers may decrease, therefore funding is needed to make up the loss of income.

12
III. Case study of Surabaya III.1 General Overview of Surabaya Surabaya is the second largest city in Indonesia, with an area of about 326 square kilometres in the coastal and lowland area. The altitude varies from 3 to 10 m above sea level. Surabaya has a tropical climate and its temperature is almost constant throughout year - from 25 °C during the night to 34°C during the day. The average humidity varies from 65% to 85%. The rainy season starts from October to April, and the dry season lasts from May to September. Surabaya has a rich history as a competitive industrial city in Indonesia. The city’s potential in industry has developed since World War II, during the Netherlands East Indies’ rule. Sugar and tobacco represented large plantation in East Jawa Islands in 20th century. Later, these industries began to require innovative technology and revision of the equipment. Machinery was needed to process the crops to enhance the establishment of agricultural manufacturing. The strategic position of Surabaya is selected as an ideal location to establish heavy or manufacturing industries. The area of Surabaya is comparable to other major cities in Indonesia. With a population of 2.5 million and aerial extent of 326 square km, Surabaya is not a mega-city such as Jakarta (9.5 million & 664 sq. km). It is more comparable to Bandung (2.5 million & 177 sq. km), Medan (2 million & 265 sq. km), Palembang (1.4 million & 401 sq. km), Semarang (1.3 million & 374 sq. km), Ujung Pandang (1.1 million & 176 sq. km), Denpasar (1.6 million), and so on. Private vehicles mainly dominate transportation. According to a study in 1995, the composition of the transportation scheme in Surabaya was 35% public transport and 65% private transport. Recently, it can be assumed the percentage of private cars is even higher due to the increase of vehicles. III.2 Surabaya Air Quality Condition Below is the ambient air quality in Surabaya in 2001 and 2002. The scores of PSI and ISPU illustrate better results than Jakarta. However, the “unhealthy” mode has a slight increase, though the “good” mode increased to some extent.
Fig. III-1 PSI/ISPU Score in 2001 and 2002 PSI/ ISPU 2001
Day (%) 2002 Day (%)
Good 27 (8.82) 40 (10.96) Moderate 272 (88.89) 314 (86.03) Unhealthy 7 (2.29) 11 (3.01) Very Unhealthy 0 0 Dangerous 0 0
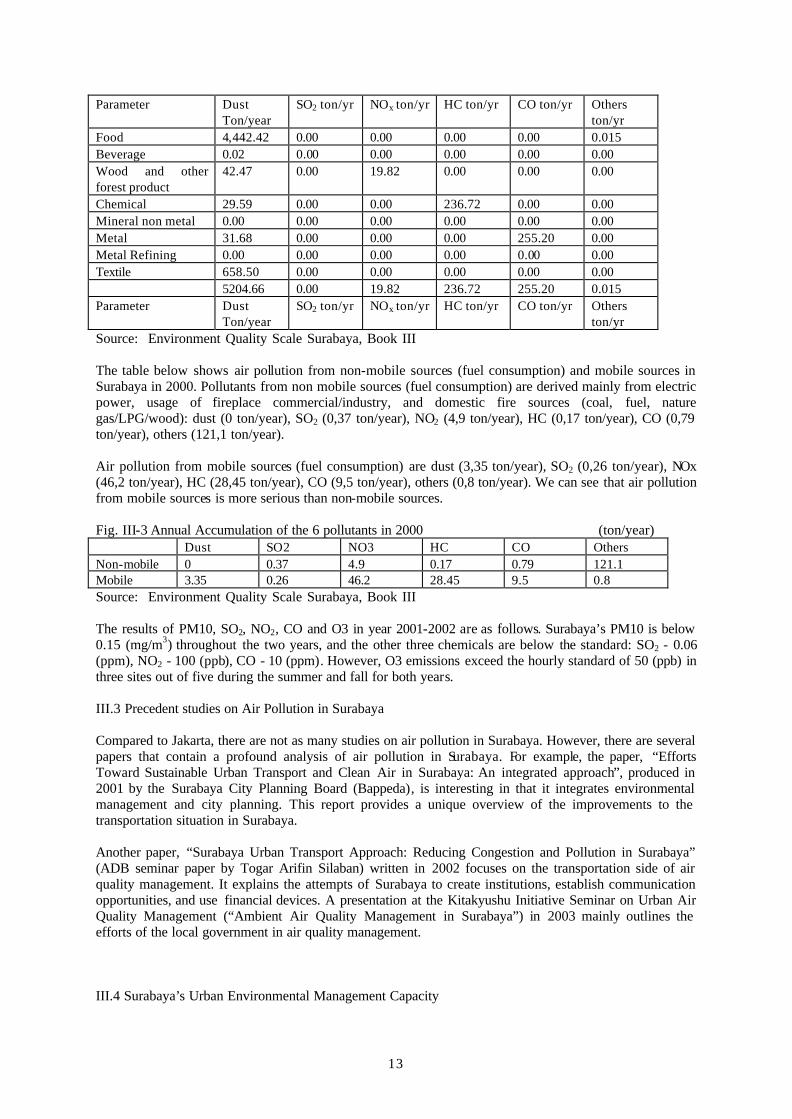
Source: Surabaya Environment Department Below is an illustration of air pollution from a refining industry. The figure of dust is extremely high in the food industry, followed by textiles and wood and other forest products. NOx is also high in wood and other forest products and HC is high in chemical. CO is high in the metal industry. Fig. III-2 Air Pollution from refining industry
13
Parameter Dust Ton/year
SO2 ton/yr NOx ton/yr HC ton/yr CO ton/yr Others ton/yr
Food 4,442.42 0.00 0.00 0.00 0.00 0.015 Beverage 0.02 0.00 0.00 0.00 0.00 0.00 Wood and other forest product
42.47 0.00 19.82 0.00 0.00 0.00
Chemical 29.59 0.00 0.00 236.72 0.00 0.00 Mineral non metal 0.00 0.00 0.00 0.00 0.00 0.00 Metal 31.68 0.00 0.00 0.00 255.20 0.00 Metal Refining 0.00 0.00 0.00 0.00 0.00 0.00 Textile 658.50 0.00 0.00 0.00 0.00 0.00 5204.66 0.00 19.82 236.72 255.20 0.015 Parameter Dust
Ton/year SO2 ton/yr NOx ton/yr HC ton/yr CO ton/yr Others
ton/yr Source: Environment Quality Scale Surabaya, Book III The table below shows air pollution from non-mobile sources (fuel consumption) and mobile sources in Surabaya in 2000. Pollutants from non mobile sources (fuel consumption) are derived mainly from electric power, usage of fireplace commercial/industry, and domestic fire sources (coal, fuel, nature gas/LPG/wood): dust (0 ton/year), SO2 (0,37 ton/year), NO2 (4,9 ton/year), HC (0,17 ton/year), CO (0,79 ton/year), others (121,1 ton/year). Air pollution from mobile sources (fuel consumption) are dust (3,35 ton/year), SO2 (0,26 ton/year), NOx (46,2 ton/year), HC (28,45 ton/year), CO (9,5 ton/year), others (0,8 ton/year). We can see that air pollution from mobile sources is more serious than non-mobile sources. Fig. III-3 Annual Accumulation of the 6 pollutants in 2000 (ton/year) Dust SO2 NO3 HC CO Others Non-mobile 0 0.37 4.9 0.17 0.79 121.1 Mobile 3.35 0.26 46.2 28.45 9.5 0.8 Source: Environment Quality Scale Surabaya, Book III The results of PM10, SO2, NO2, CO and O3 in year 2001-2002 are as follows. Surabaya’s PM10 is below 0.15 (mg/m3) throughout the two years, and the other three chemicals are below the standard: SO2 - 0.06 (ppm), NO2 - 100 (ppb), CO - 10 (ppm). However, O3 emissions exceed the hourly standard of 50 (ppb) in three sites out of five during the summer and fall for both years.
III.3 Precedent studies on Air Pollution in Surabaya Compared to Jakarta, there are not as many studies on air pollution in Surabaya. However, there are several papers that contain a profound analysis of air pollution in Surabaya. For example, the paper, “Efforts Toward Sustainable Urban Transport and Clean Air in Surabaya: An integrated approach”, produced in 2001 by the Surabaya City Planning Board (Bappeda), is interesting in that it integrates environmental management and city planning. This report provides a unique overview of the improvements to the transportation situation in Surabaya. Another paper, “Surabaya Urban Transport Approach: Reducing Congestion and Pollution in Surabaya” (ADB seminar paper by Togar Arifin Silaban) written in 2002 focuses on the transportation side of air quality management. It explains the attempts of Surabaya to create institutions, establish communication opportunities, and use financial devices. A presentation at the Kitakyushu Initiative Seminar on Urban Air Quality Management (“Ambient Air Quality Management in Surabaya”) in 2003 mainly outlines the efforts of the local government in air quality management. III.4 Surabaya’s Urban Environmental Management Capacity

14
III.4.1 Institution Capacity The Environment Department of Surabaya, DLHKS, consists of five sections and focuses on three environmental quality management areas: Environment Quality Control by activity, Environment Pollution and Damage Control by activity and Environment Quality Improvement by activity. There are approximately 70 people working in the DLHKS in 2003, increased more than the double of the first size of 30 people in 2001. At the beginning, staff is invited from other departments such as agriculture, flooding, cleaning, and urban planning. The emergence of this keeps with the trend toward decentralization of government and local autonomy. Including its precursor BAPEDALDA, the air quality management in Surabaya dates back in 1995, when the Blue Sky Program started. The one of the most recent activities is CNG, which is now being enforced throughout the city. The Air Quality laboratory monitors the air quality every 30 minutes, and displays the information on a board inside the city. Stickers are also provided to citizens with slogans such as “Reduce Private Cars”. Tree planting is also encouraged, as well as the establishment of green spaces, and collection/sales of used books in order to buy trees. The picture below is of Surabaya City Hall. The City Hall is located at the centre of the city. The environmental department laboratory is well equipped with high capacity computers and fast Internet connections. Three full-time employees work in the laboratory and work on data collection and reduction and maintenance of the machines. Outputs have been kept on file since 1996 - the year air monitoring began. Fig. III-4 Surabaya City Hall (Interior and Exterior)
Source: Surabaya Environmental Department There are dozens of environmental NGOs in Surabaya. Tunas Hijau (English: green buds) is a local NGO mainly consisting of students; the president himself is a student now. They are mainly in charge of planting trees in the city centre, educating children on the environment, and pursuing student exchange programmes. The Fellows Prince and Princess of Environment Tunas Hijau Club held a Family Tree Planting on Sunday, 12 January 2003. Through this event they have invited families to come and join the campaign by bringing their own trees. The trees have been planted on Green Space of Fellows Prince and Princess of Environment Tunas Hijau Club. Tree planting is gaining more and more popularity these days in the city. In 2002, tree planting was carried out five times in July, October, November and December. In total, thirty-three families have joined and more than 400 trees have been planted in this event. The Program Director of “Millennium Kids Australia”, an Australian NGO, has also joined this program. Tunas Hijau Club helps to create awareness of the environment through environment education and international communication.

15
Year 2002 - Measurement test gas emission from motor vehicles. - The effective regulation for the feasibility of public vehicle test; (Regulation for the Emission Test
of Public and Private Transports). - Execution Blue Sky Program Campaign with activity distribution of manufacturer to motorcyclist,
public transport (bus), plantation work along with Tunas Hijau NGO that involving elementary school.
- Car Free Day at several streets in the heart of the city. - Data application of Ambient Air Quality in Surabaya by university students
Year 1996 – 2000. - Ambient air quality monitoring along the high-density road, with the dominant result of
measurement - Taxi with gas fuel (BBG) since 1997, and its own fill ing station. - Conducting guidance and monitoring program to potential industries. - Founding the KPPLH Team (the Commission for Operation and Controlling the Environment
Pollution) in 1999 to monitor the industry with potency for air pollution.
Year 2003 - Mathematical Model of Air Quality Distribution Pattern in Surabaya. - Organizing Inspection and Maintenance for Personal Car Passenger. - Campaign for using CNG fuel for motor vehicles (100 Government Vehicles) executed by the
Government of Surabaya since year 2002/2003. - Car Free Day at several streets in the heart of the city.
Year 2001 - Measurement of Hb and Pb concentration in blood, especially society that is close to the source of
pollution (enclosed). - Measurement of ambient air quality and noise from transportation and industry sector. - Measurement of emission air quality from industrial sectors. - Monitoring of ambient air quality using automatic instrument and integrated continuously with the
Monitoring Center in the Minister Office of Environment - Jakarta executed every day. - Car Free Day (CFD) started.
III.4.2 Regulation Capacity In Surabaya, national regulations are followed and unique or stricter targets are developed. The Blue Sky Programme is the programme most symbolic to the city’s environment management. The programme contains the following project. From 1996-2000, regulations or agreements were mainly between the government and enterprises. Box. III-1 Blue Sky Program 1996-2000
In 2001, the local government began health checks of people living in communities located nearby pollutants. Car Free Day also began at this time and worked well in improving the interest of citizens regarding air pollution. This year was meaningful for citizens as their awareness of environmental issues was raised and they became involved in activities. Box. III-2 Blue Sky Program 2001
In 2002, the Blue Sky Programme stipulated stricter regulations. The reasoning for these regulations seems to be clearer than previous years. Several research papers suggest the effect of acid rain on the air quality and the concentration of COHb in blood. Box. III-3 Blue Sky Program 2002
In 2003, the Blue Sky Programme established the fundamentals for further advancement. Research in previous years had come to a point of demonstration of a mathematical model of the air pollution distribution pattern. Identification of the conditions of personal passenger cars also started along the right lines. Car Free Day has continuously been carried out for three consecutive years. Box. III-4 Blue Sky Program 2003

16
III.4.3 Communication Capacity The Public Awareness Campaign, which was suggested by the local government, involves all sectors of the community, companies, and policy makers in campaign planning and working groups. The campaign determines themes and objectives, messages, phases, priority targets and plans in detail for each activity. All activities are based on prior assessment of cost effectiveness in reaching priority target groups. Partners contribute to cost of every activity. It also involves campaign managers in many project activities. DLHKS promotes cooperation with other organizations such as GTZ, ICLEI, Asia-Urbs, Umweltbundesamt, Swisscontact, IEA, World Business Council for Sustainable Development (WBCSD) and others to combat air pollution. The GEF have also expressed initial support for the approach in Surabaya to reducing CHG emissions. Working Groups were formed in each key subject area to bring main stakeholders together on a regular basis. Their key subject areas are: public transport, non-motorized transport, inspection and maintenance, CNG, economic instrument, and public awareness campaigns. The working groups develop and redefine proposals and implementation schedules and are expected to assist in implementation and monitoring results. Where working groups are not formed, major stakeholders are regularly brought to discuss major developments and agree on courses of action. Fig. III-5 Activities of Tunas Hijau
Source: Tunas Hijau homepage, 2002 Right: Kalimas Riverbank tree planting the site planted with 45 trees such as ketapang, dadap merah, sawo kecik, kupu-kupu (butterfly), sawo manila, mango, tanjung and matoa. Left: Contest of the Prince and Princess of Environment III.4.4 Financial Capacity Compared to Jakarta, Surabaya is less likely to receive a large portion of money for air pollution management from the central government and from major automobile companies. The money for environmental management is mainly single-round project oriented from international organisations. More integrated approaches will be needed in the future financial plans. The working groups mentioned in the communication capacity section developed several innovative approaches in fund raising. They set these as long-term goals so while it may not be realised immediately, they are heading in the right direction. Surcharges on gasoline are used to fund CNG investments and retrofits of government vehicles. Transport and environment trust funds are to work as sources of funds from gasoline fees and surcharges, as well as licensing. Reforms of annual vehicle taxation are planned to reverse the current approaches to high taxation on new vehicles into low taxes on old ones, which are heavily polluting vehicles. Congestion pricing mechanisms are also under consideration.
III.4.5 Technology Capacity Introducing CNG (Compound Natural Gas) cars is one project in which DLHKS puts a great amount of effort. There are 700 CNG taxis in Surabaya called taxizebra, and two CNG stations in the city, subsidized by the central government. CNG is an inexpensive and an ideal energy resource, since it can go 200 km for about 7,500 rupiah without any emissions, while gas costs 2,000 rupiah to go 9 km with some emission. However, CNG is not fully recognized by the citizens yet. First, not many CNG stations are established in the city. Second, people might think it may have a chance of explosion, which demonstrates a lack of understanding.

17
Fig. III-6 CNG vehicle in Surabaya
Right: The CNG tank in the back seat. Left: Oil change in a CNG car In 2001, five monitoring stations and five public displays were established in Surabaya. These stations are well maintained and networked to display stations. They display the results from the five monitoring stations every 30 minutes. The goals for the Surabaya Ambient Air Quality Monitoring Network are: knowing the condition of air quality, supporting the decision maker in developing strategies to control air pollution, evaluation of the Blue Sky Programme, and informing the public of the condition of the air quality. The displayed results help frame the concerns of the citizens. Below are the locations of the equipment Surabaya Ambient Air Quality Network. Fig. III-7 Integrated Ambient Air Quality Monitoring Networking in Surabaya
In addition to the Surabaya Environment Management Section, the City Planning Section is very eager to engage in the air quality management. Particularly, transportation planning holds great concern; the relations between congestion and pollution, and traffic safety were recently discussed. One major approach is the public transport usage. The Dorsch Consult in a study for the World Bank showed that in 1995 around 65% of motorised trips were done with private cars and motorcycles, and only 35% with public transport (including taxis). It was projected that this will decline to 77% of motorised trips with private vehicles and only 23% with public transport by 2010, if measures are not taken. Therefore the planning department set goals for future transportation planning. The box below is an excerpt taken from their ideas and principles. They mention fundamental approaches for transportation focused urban planning, such as designing pedestrian friendly streets, and organisation of public
Monitoring
RAQMC
Surabaya
Main
Center
Public Data
Display
Data Display
National

18
#1: Access The city should be designed for people, not cars. It should be at least as convenient to live in a city without a personal motor vehicle as with one. #2: Equity Highest priority should go to public transport, walking and non-motorized vehicles that are accessible to almost everyone and have low impacts. #5: Public participation and Transparency It is important that they be given adequate and appropriate support, including information about the issues involved, as well as the benefit and costs of the array of potential alternatives. #6: Integrated planning Transportation decision makers have a responsibility to pursue more integrated approaches to planning. #7: Economy and low cost Users of cars and motorcycles should be charged for the full economic, environmental and social costs of their transportation.
transportation usage campaigns and stakeholders’ awareness promotions. This approach is prevalent in the developed world, so it is prescient for Surabaya to have these targets. Fig. III-8 Solutions for Air Pollution from Mobile Source: From urban planning point of view (excerpt)
Source: Efforts Toward Sustainable Urban Transport and Clean Air in Surabaya: AN INTEGRATED APPROACH IV. Conclusion IV.1 Summary of Two Cities IV.1.1 Summary of Jakarta Jakarta, with a population of approximately 10 million, is the largest city of Indonesia. As it is close to the central government, the City of Jakarta rich in various aspects of capacity, such as human resources, finance, and technology. In particular, BPPT’s ETC is a good example of human resources and technology, as it entails numerous well-educated engineers and researchers, and proposes new technologies to local government agencies, such as BPLHD (Jakarta’s environmental department) for enhancing environmental management capacity. Being a big city is also advantageous for NGO activities. Pelangi is not only an international cooperation organisation that in charge of lobbying and education but is also a research institute, which can show logical reasoning for their activities. This dual character is only possible with their rich human resources, as an organisation situated in a big city. In particular, their research on transportation proposes drastic measures for implementing an innovative bus system in Jakarta. IV.1.2 Summary of Surabaya Though Surabaya is the second largest city in Indonesia, the environmental management section was only established in 2001, and the precursor of the environmental department was not as active as that of Jakarta. Compared to Jakarta, Surabaya is not as well informed of recent technologies or other information, being located away from central research institutes such as BPPT’s ETC. Tunas Hijau is a local NGO, and incredibly active internationally. It consists of young members and university students and we can hope that the future environmental governance leaders of Surabaya will emerge from this organisation. There are around 20 environmental NGOs in Surabaya and they have meetings with the government about once every two months. Around 10 NGOs attend this meeting at city hall. Though there still seems much room for improvement compared to Jakarta, the City of Surabaya is very
19
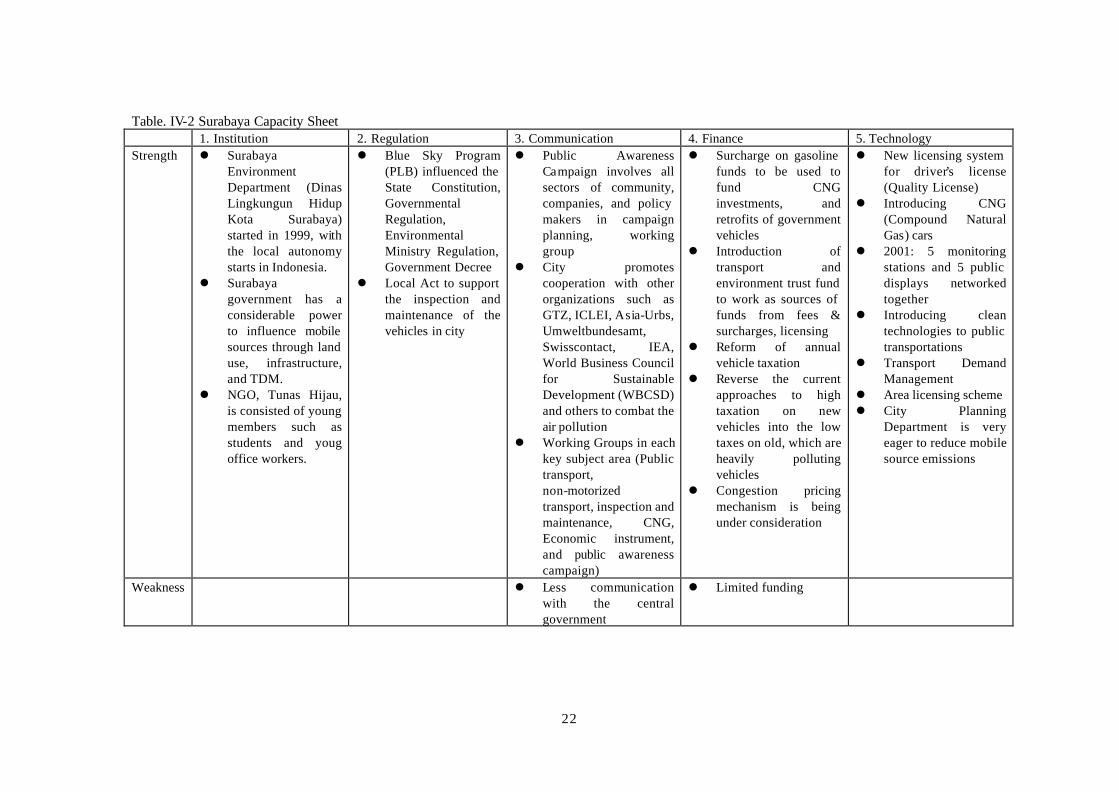
active in obtaining knowledge on air quality management and plan to hold workshops on air quality management. In 2003, they will be organising workshops on air quality management with ICLEI in April and with ESCAP in June. IV.2 Capacity Analysis Tables 1 and 2 show capacity of the City of Jakarta and City of Surabaya. Further research is needed for some of the elements. For example, institutional capacity requires additional studies and investigation. Regulations are very obvious in both cities, but it may need to be looked at in a time series base. Financial mechanisms are not clearly assessed in both cases. One reason is that the Environment Department in Indonesian local governments is still very new and they have not determined the details of spending for environment.

20
Table. IV-1 Jakarta Capacity Sheet 1. Institution 2. Regulation 3. Communication 4. Finance 5. Technology Strength l Jakarta Office
of Environment (precursor Bapedalda DKI Jakarta ― 2001 BPLHD Jakarta )
l Local NGOs are
active (Pelangi and MEB)
l 1985: regular measurement of air pollution Bapedalda DKI Jalarta started
l Prodasih (Programme Udara Bersih = Clean Air Programme) stipulates standard of ambient air quality and noise / mobile source emission / point source emission
l 2000: MoE annual exhaust emission tests on drivable vehicles
l 2002: Governance Decree Number 95 Inspection and maintenance program (I&M) …regular testing and maintenance of vehicles
l Cleaner Fuels Programmes requires public transportations to use LNG and CNG fuel converters.
l Introducing and supplying the unleaded gasoline to Jabotabek area through PERTAMINA (national oil enterprise)
l Agreement with companies (7 steel melting, 3 power plant, 4 glass melting, and 6 textiles) on the air emission standard by 2004.
l Private surveillance organization monitor private registered workshop.
l Publicity Campaign: encourage people awareness and increase public participation on the Clean Air Programs.
l Workshops for the Inspection and maintenance program (I&M) entail a lot of private sector’s cooperation.
l Daily monitoring using Pollution Standard Index increases awareness of air pollution and their participation in reducing the pollution.
l 2002: Inspection and maintenance program (I&M) ensure the high degree private sector involvement and a minimal government investment.
l Improving Traffic management (promotion the use of public participation, expanding and improving transport and parking facilities)
l 2002: Inspection and maintenance program (I&M) can not be done without the technology of the private sectors.
l 12 monitoring stations and four continuous stations run by MOE. Continuous monitoring informs the public on a daily basis using the Pollution Standard Index.
l As Cleaner Fuels Programmes requires public transportations to use LNG and CNG fuel converters, it enhances improving technology of the future vehicles.
l Supplying the unleaded gasoline to Jabotabek area

21
through PERTAMINA (national oil enterprise)
l Catalytic converter is now under pilot study.
Weakness l Bus authority organization has strong influence to the existing bus system.
l Limited funding for the government
l Corruptions might exist in some process of getting ODA money in international organizations.
22
Table. IV-2 Surabaya Capacity Sheet 1. Institution 2. Regulation 3. Communication 4. Finance 5. Technology Strength l Surabaya
Environment Department (Dinas Lingkungun Hidup Kota Surabaya) started in 1999, with the local autonomy starts in Indonesia.
l Surabaya government has a considerable power to influence mobile sources through land use, infrastructure, and TDM.
l NGO, Tunas Hijau, is consisted of young members such as students and youg office workers.
l Blue Sky Program (PLB) influenced the State Constitution, Governmental Regulation, Environmental Ministry Regulation, Government Decree
l Local Act to support the inspection and maintenance of the vehicles in city
l Public Awareness Campaign involves all sectors of community, companies, and policy makers in campaign planning, working group
l City promotes cooperation with other organizations such as GTZ, ICLEI, Asia-Urbs, Umweltbundesamt, Swisscontact, IEA, World Business Council for Sustainable Development (WBCSD) and others to combat the air pollution
l Working Groups in each key subject area (Public transport, non-motorized transport, inspection and maintenance, CNG, Economic instrument, and public awareness campaign)
l Surcharge on gasoline funds to be used to fund CNG investments, and retrofits of government vehicles
l Introduction of transport and environment trust fund to work as sources of funds from fees & surcharges, licensing
l Reform of annual vehicle taxation
l Reverse the current approaches to high taxation on new vehicles into the low taxes on old, which are heavily polluting vehicles
l Congestion pricing mechanism is being under consideration
l New licensing system for driver’s license (Quality License)
l Introducing CNG (Compound Natural Gas) cars
l 2001: 5 monitoring stations and 5 public displays networked together
l Introducing clean technologies to public transportations
l Transport Demand Management
l Area licensing scheme l City Planning
Department is very eager to reduce mobile source emissions
Weakness l Less communication with the central government
l Limited funding
Reference 8: Verification and improvements to quantitative indicators for evaluation of urban environmental improvement
Urban Environmental Management Capacity Assessment: Case studies of Jakarta and Surabaya
23
IV.3 For further research for the UEM capacity assessment This paper has looked at the urban environmental management capacity of two Indonesian cities. The capacity became clearer by sorting out the existing information. However, if we plan to make UEM capacity indicators or assessment questionnaires, we need to solve these following points. 1. Gathering time series data and information by doing hearing with the previous officers or retired
persons 2. City’s peculiarity awareness in socio economic view 3. Getting information on local NGOs Regarding the first point, the limitation of the present officers in charge are sometimes felt when we ask historical questions. Historical documents are not usually written by the Environment Department, since it is quite new. So we need to be introduced to a key person who is aware of the history of Environmental Department in future. Obtaining demographic data more carefully during the visit can address the second point. Mere environmental section data or hearing would not show their capacity, so socio economic knowledge would be an asset. Local NGOs are incredibly important sources of understanding citizens’ conditions. However, if the contact person is at the government side, the NGOs tend to be biased to the government. Getting contacts with citizen oriented NGOs would be focused in the further research.