casp14 refinement assessment - prediction center
TRANSCRIPT

CASP14 Refinement Assessment
Dan Rigden plus...

Filomeno Sanchez Rodriguez Adam Simpkin
Shahram MesdaghiRonan Keegan
Andriy KryshtafovychMarcus Hartmann and Joana Pereira

Overview
Refinement target selection and properties
Group assessments, overall and by kinds of target
Refinability
Self-assessment of models and residues
Special targets - extended and NMR
Applications - Structure-based function prediction and Molecular Replacement
Conclusions

Target selection and properties

Refinement target selection: Andriy with my input30 targets. Size <~280 residues, GDT_HA in range 28-80
Often aimed for best server model
Check structural context of errors in multidomain/complex proteins i.e. at least some refinement seemed plausible without knowledge of position of another domain or chain. 7 were domains deriving from multi-domain targets
Initially selected few 427 (later = AlphaFold2) group models (too good!) but then decided that perfecting 427 models is just as important a challenge as improving worse models. (Arguably more so if 427 methods become the norm)
Seven double-barrelled targets (v1/v2) (GDT_HA group 427 53-80; non-427 30-53)
Seven extended targets (x1 or x2) - 6 weeks instead of usual 3 weeks

Refinement targetsTarget class
Number of targets (CASP13)
Size in residues
min max mean
TBM-easy 5 (13) 103 246 165 (132)
TBM-hard 8 (5) 119 221 160 (130)
FM/TBM 6 (5) 75 171 107 (142)
FM 11 (6) 95 276 157 (137)
all 30 (29) 75 (77) 276 (204) 149 (134)

Group assessments, overall and by kinds of target

Standard rankings of group performanceScore comes from ML exercise in CASP12 paper.
“To benefit from manual assessment while minimizing the pitfalls of subjectiveness and avoiding the definition of arbitrary weights for the different metrics, we used a machine learning approach to devise a linear combination of standard scores based on the visual inspection. Four assessors (LH, VO, HY, and GS) visually inspected all “model 1” predictions for 14 targets (33%) and each independently scored them.”
Andriy kindly updated the CASP page to allow analysis on different size and different quality targets
Cα positional accuracy Quality Control Score
Molprobity Score
SCASP12 = 0.46 ZRMSD+ 0.17 ZGDT_HA + 0.2 ZSphGr + 0.15 ZQCS + 0.02 ZMolPrb

Standard rankings of group performance (model_1)Only four groups -BAKER, FEIG, FEIG-S, DellaCorte outperform the naive predictor
Same groups high on %improved models, but joined by two more servers MULTICOM-CLUSTER and Seok-server.
Only FEIG group improved more than half

More groups consistently improve small targets. DellaCorteLab, FEIG ahead of BAKER
But only one, BAKER, beats the naive predictor on the largest targets when DelleCorteLab, FEIG well down
>200 res, n=8
<100 res, n=4
100-150 res, n=16
150-200 res, n=9
(double-barrelled count 2; excludes extended targets)

More groups can consistently beat naive for worst starting structures. BAKER is the standout performer on the worst, followed by BAKER-experimental
No group consistently beats naive for the best quality targets
GDT<40, n=6
GDT>70, n=7
40 < GDT< 50, n=8
50 < GDT< 60, n=10
60 < GDT< 70, n=6

CASP on CASP analysis
% improved: in line with or arguably worse than previous years
(excluded double-barreled predictions for one group)

Visualisation of the best* refinement (Beta group)
R1030-D2, Beta, deltaGDT_HA = 23.52
Starting model with target Refined model with target
*that we’re permitted to show

Visualisation of a BAKER group refinement
R1065s2, BAKER group, deltaGDT_HA = 12.99
Starting model with target Refined model with target

Visualisation of a group FEIG-S refinement
R1090, FEIG-S group, deltaGDT_HA = 16.01
Starting model with target Refined model with target

ΔGDTHA distributions for individual groups

Refinability

Defining refinability
∑ΔGDT_HA
Six potential refinability all groupsor top four x _1 alone of _1 to _5or the best correlate well
Therefore looked first at all groups, all models
Then at least correlated measure top groups, best model

Refinability -all groups, all models. Size and %regular secondary structure not correlated
Starting model quality GDT_HA and GDT_SC clearly correlated
AlphaFold2 models are special

For top groups best models, the correlation of refinability and starting GDT_HA is much weaker i.e. the best groups do almost as well with good targets as with poor ones
But, AlphaFold2 models, unrefinable!
High-quality models by other groups are refinable
Refinability -top groups, best models.

AlphaFold2 models have anomalously low refinability
AlphaFold2 refinement targets can barely and rarely be improved.
Other targets of similar quality can be refined
*=NMR +=CryoEM
Low
sta
rting
GD
T_H
A H
igh
star
ting
GD
T_H
A
*
*+

AlphaFold2 models have anomalously low refinabilitySame goes when AlphaFold2 and other targets are compared for FlexE
Measures energy of deformation between model and crystal structure. Somewhat orthogonal to coordinate accuracy Lo
w s
tarti
ng G
DT_
HA
Hig
h st
artin
g G
DT_
HA
Perez et al (2012) J. Chem. Theory Comput. 8, 3985

Most Alphafold2 ‘errors’ are at lattice contacts
T1041 (GDT_HA = 70)

Most Alphafold2 ‘errors’ are at lattice contacts
Target Errors near lattice contacts
Errors near domain contacts
Errors near chain contacts
Uncomplicated errors
1040 1 (16 residues)
1041 1 (12) 1 (5)
1042 1 (6) 1 (6) 1 (3)
1043 3 (8,3,4)
1053 1 (6)
1067 1 (20)
1074 1 (6)
Total regions 8 2 2
Total residues 75 11 9

Other refinement targets contain refinable errors
T1091 (GDT_HA = 61)

CASP on CASP analysis without AlphaFold2
Excluding ‘unrefinable’ AlphaFold2 models improves these stats, but still comparable to previous years

Self-assessment of models and residues

Ability of groups to rank their predictions
Most groups have positive CC between assigned _1 to _5 ordering and actual order of quality
19/26 put best as _1 more than 20% of the time
Top four groups vary
Only targets where 5 unique models submittedGroup Name # targets Spearman CC % correct model 1
Seok 31 0.57 35.48
BAKER-experimental 34 0.45 55.88
Spider 19 0.42 31.58
Frustration_Refine 28 0.41 35.71
FEIG-S 32 0.37 50.00
FEIG 33 0.32 30.30
DeepMUSICS 13 0.29 38.46
Kiharalab_Refine 33 0.24 33.33
laufer_ros 23 0.18 43.48
PerezLab_Gators 25 0.17 40.00
DellaCorteLab 27 0.13 11.11
Seok-server 22 0.10 18.18
BAKER 29 0.09 34.48
AWSEM_PCA 25 0.07 20.00
Bhattacharya 21 0.05 19.05
UNRES-template 27 0.05 18.52
Kiharalab 23 0.01 65.22
Bhattacharya-Server 28 0.00 25.00
UNRES 24 0.00 29.17
AILON 30 -0.07 13.33
AIR 19 -0.09 21.05
Beta 19 -0.11 5.26
MUFOLD 11 -0.18 18.18
McGuffin 6 -0.23 0.00
MULTICOM-CLUSTER 4 -0.38 25.00
Protein-blacksmith 29 -0.45 0.00
SHORTLE 0 Na Na
Risoluto 0 Na Na
Pharmulator 0 Na Na
Seminoles 0 Na Na
PerillaGroup 0 Na Na

Ability of groups to estimate residue level errors (ASE)
Groups ordered by overall z-score ranking
No error estimates from two groups and excluded three groups since quality predictions looked backward
The best refinement groups are among the best in self-assessment of error too. Probably no coincidence… Includes FEIG-S
Calculated on all submissions _1 to _5
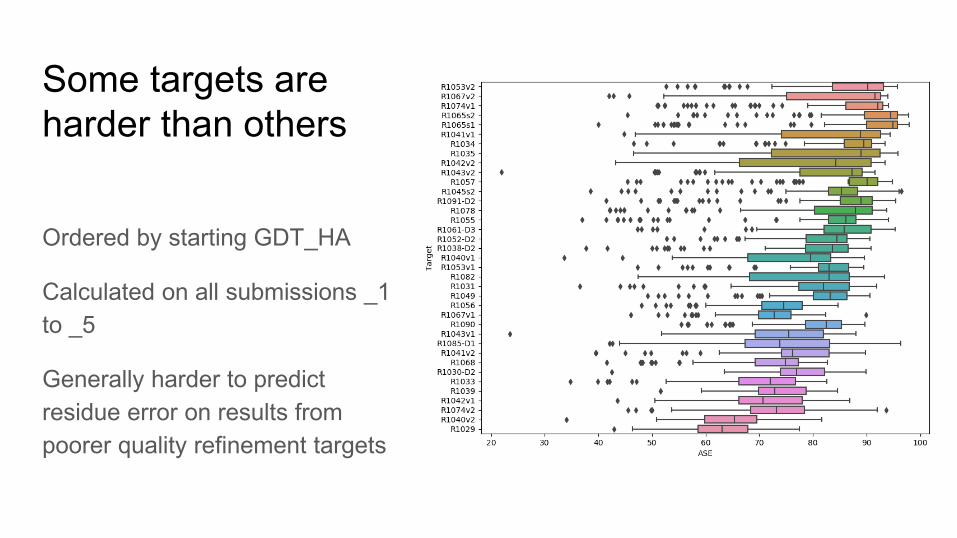
Some targets are harder than others
Ordered by starting GDT_HA
Calculated on all submissions _1 to _5
Generally harder to predict residue error on results from poorer quality refinement targets

Factors (not) correlated with ASEThe better the model, the better the accuracy of per-residue error estimates
No relationship with size, regular structure or class
Error estimates of refined AlphaFold2 models are worse than those of other refined models of similar initial quality

Special targets - extended and NMR

Extended targets
6 weeks results are worse than 3 weeks as often as they’re betterOnly best server FEIG-S, benefits overall among top four groups

NMR structuresThese lack the complications eg crystal packing of other targets, and have extra information on multiple ‘correct’ conformations in the ensembles. Unfortunately, R1029 and R1055 ensembles were too tight to be very interesting
ensembleunrefined
refinednot present in refined models
Refined region, but ensemble ~identical here

NMR structures
Unfortunately, R1029 and R1055 ensembles were too tight to be very interesting
ensembleunrefined
refinednot present in refined models
Major changed region, but not really improved and, in any case, ensemble ~identical here
8 residue loop where ensemble members vary. Very little change in structure on refinement

Applications - Structure-based function prediction and Molecular Replacement

Structure-based function prediction
We wanted to assess whether refinement made a real-world difference to the ability to infer function from a structure. If crystal structure predicted a function, did refined versions out-perform the original refinement target?
Four enzymes, one double-barrelled
Catalytic site motifs sought using ProFunc and Catsid
Two DNA-binding proteins
Nucleic acid binding predicted with DNA_BIND and BindNA
Three protein-protein interactions
Protein-protein docking done with ClusPro

T1057 N4-cytosine methyltransferase

T1057 T1057TS209_2GDT_HA 64.4
R1057TS473_2GDT_HA 67.8

ClusPro protein-protein interactionT0145: Correct interface not identified, even from crystal structures.No helpful covariance. T1055: Was a crystal structure (5n2e) for partner and some site-directed mutagenesis on both sides. Nevertheless, plausible complex not foundT1065: Both partners were refinement targets
Original models give decent result
Refinement of s2 tends to degrade results
But refinement of s1 tends to improve results
Refining both leans towards bad
------ PPDbench -------

Molecular replacementRandy Read’s scripts used to measure Phaser LLG of placed and rigid-body refined xtal/model, given rest of asu (thanks Marcus, Joana!)
”The LLG is the difference between the likelihood of the model and the likelihood calculated from a Wilson distribution, so it measures how much better the data can be predicted with your model than with a random distribution of the same atoms.”
These can use (i) a constant B factor, (ii) interpret predicted residue error as B-factor or (iii) apply per-residue B factor based on the supplied per-residue error estimates
Low LLG scores, improved on refinement, assessed for real world impact
Phaser or Molrep used for MR via MrBUMP
Correctness of placement checked by local and global map CC calculation in Phenix

Constant B-factor vs B-factor from error estimate
Looking at the top 4 groups, the calculated LLG is consistently better when using the B-factors from error estimate

Refinement tends to improve best available LLG
Best predictions across all groups for each target. For all but 3 the best refined model had a better LLG (B from predicted errors) than the starting modelTook a closer look at the starting models with an LLG < 120. Several large improvements

Refinement often takes predictions over LLG>60 threshold
T1090crystal structureAlphaFold2 modelsother modelsrefinements

MR and refinement of non-AlphaFold2 targets
Target GDT_HAmol/ asu Res. (Å)
Refinement target
solves?
Refined version solves?
Best refined version
LLGBest map
CCPhaser
solutionsMolrep
solutions
Number of groups
producing successful refinements
Change with B-factors
from error estimates
Best LLG, B-factors from error estimates
T1030 40 1 3.03 no yes 63 0.567 3 0 1 yes (p+3) 61
T1034 70 4 2.057 yes yes 868 0.572 196 177 35
T1038 57 3 2.5 no no 20 0.126 0 0 0 no 82
T1049 51 1 1.75 no yes 53 0.275 10 4 6 yes (p+4) 47
T1052 58 1 1.976 no yes 15 0.399 2 0 1 no (p-2) 20
T1053 53 4 3.294 no no 56 0.059 0 0 0
T1056 50 1 2.3 no yes 58 0.416 11 38 14yes (p+28,
m+4) 52
T1067 46 1 1.44 no yes 67 0.418 8 15 11 yes (p+21) 133
T1074 36 1 1.5 no yes 132 0.501 15 18 7yes (p+4,
m+1) 134
T1082 53 3 1.147 no no 45 0.06 0 0 0
T1085 43 1 2.491 no yes 40 0.57 4 2 3 yes (p+1) 42
T1090 44 1 1.77 no yes 83 0.4 12 14 7yes (p+8,
m+2) 116
T1091 61 1 2.994 no no - 0.079 0 0 0 yes (p+11) 80
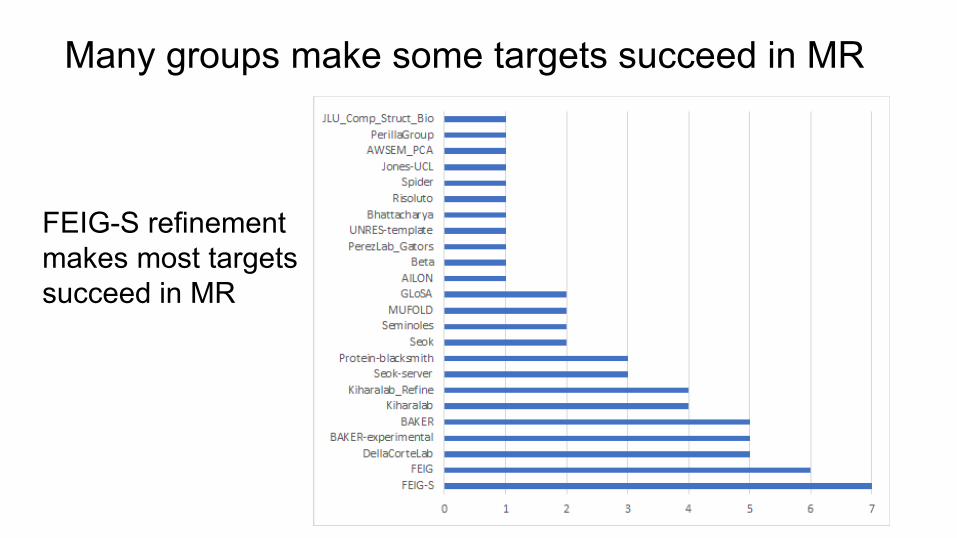
Many groups make some targets succeed in MR
FEIG-S refinement makes most targets succeed in MR
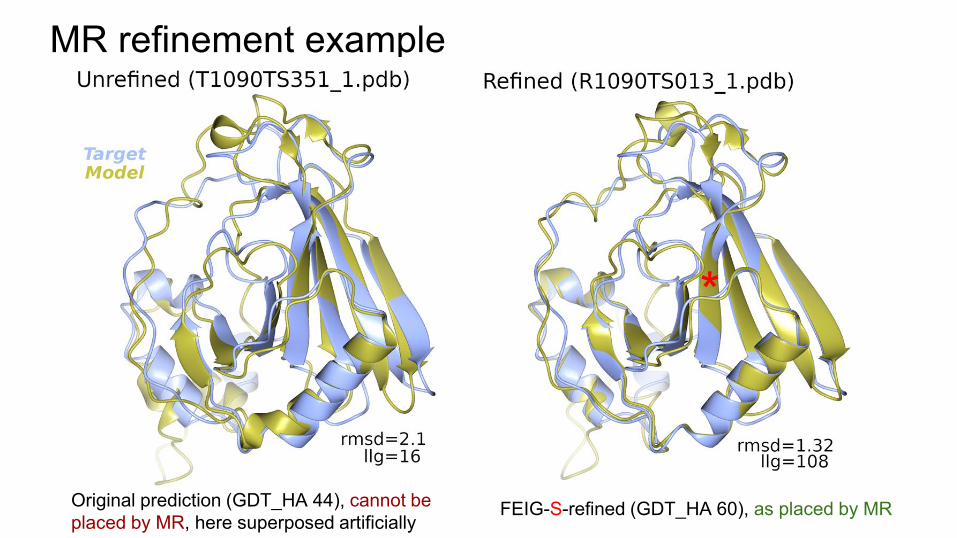
MR refinement example
Original prediction (GDT_HA 44), cannot be placed by MR, here superposed artificially
FEIG-S-refined (GDT_HA 60), as placed by MR
*

MR refinement example
Original prediction, cannot be placed by MR, here superposed artificially
FEIG-S-refined, as placed by MR

Conclusionsvs previous CASPs, similar improvements on similar quality refinement targets. Suggests performance maintained but not really improved
Best groups have quite distinct approaches. MD-centred approaches more conservative, smaller range from best to worse results. Best for small proteins. Rosetta-based methods more of a gamble - bigger potential gains and losses. Can improve largest targets
Mixed results with extended targets
Structure-based function prediction results show small differences but often in the right direction
Refinement makes a big real-world difference to MR with poor models. Accurate residue error estimates further help