catalysts for h2 production - unibo.itamsdottorato.unibo.it/427/1/tesi_dottorato_rosetti... ·...
TRANSCRIPT
Alma Mater Studiorum – Università di Bologna
FACOLTÀ DI CHIMICA INDUSTRIALE DIPARTIMENTO DI CHIMICA INDUSTRIALE E DEI MATERIALI
DOTTORATO DI RICERCA IN CHIMICA INDUSTRIALE
Catalysts for H2 production
Tesi di Dottorato di Ricerca di Coordinatore:Dott. Rosetti Valentina
Chiar.mo Prof. Luigi Angiolini
Relatore: Dr. Francesco Basile
Correlatori:
Prof. G. Fornasari Prof. A. Vaccari
XIX CICLO
Settore CHIM/04
Catalysts for H2 production
KEY WORDS
CATALYTIC PARTIAL OXIDATION OF METHANE
STEAM REFORMING OF METHANE
NI AND/OR RH ACTIVE PHASE
HYDROTALCITE-TYPE CATALYST PRECURSORS
PEROVSKITE –TYPE CATALYSTS
STRUCTURED CATALYSTS (SIC, FECRALY ALLOY)
Catalysts for H2 production
The research of new catalysts for the hydrogen production described in this
thesis was inserted within a collaboration of Department of Industrial Chemistry
and Materials of University of Bologna and Air Liquide (Centre de Recherche
Claude-Delorme, Paris).
The aim of the work was focused on the study of new materials, active and stable
in the hydrogen production from methane, using either a new process, the
catalytic partial oxidation (CPO), or a enhanced well-established process, the
steam methane reforming (SMR).
Two types of catalytic materials were examined:
1) Bulk catalysts, i.e. non-supported materials, in which the active metals (Ni
and/or Rh) are stabilized inside oxidic matrix, obtained from perovskite type
compounds (PVK) and from hydrotalcite type precursors (HT);
2) Structured catalysts, i.e. catalysts supported on materials having high thermal
conductivity (SiC and metallic foams).
As regards the catalytic partial oxidation, the effect of the metal (Ni and/or Rh),
the role of the metal/matrix ratio and the matrix formulation of innovative catalysts
obtained from hydrotalcite type precursors and from perovskites were examined.
In addition, about steam reforming process, the study was carried out first on
commercial type catalysts, examining the deactivation in industrial conditions, the
role of the operating conditions and the activity of different type of catalysts.
Then, innovative materials bulk (PVK and HT) and structured catalysts (SiC and
metallic foam) were studied and a new preparation method was developed.
Catalysts for H2 production I
INDEX
INTRODUCTION 1
1. H2 relevance and applications 3
1.1. Ammonia synthesis 5
1.1.1. Reaction mechanism 6
1.1.2. Ammonia synthesis catalysts 7
1.1.3. Ammonia plants 11
1.2. Direct Reduction of iron ore (DRI) 15
1.3. Methanol synthesis 17
1.3.1. Methanol synthesis catalysts 18
1.3.2. Reaction mechanism 24
1.3.3. Methanol plants 26
1.4. Dimethyl ether synthesis 28
1.5. Fischer-Tropsch synthesis 31
1.5.1. FT synthesis catalysts 35
1.5.2. Thermodynamics and reaction mechanism 37
1.5.3. FT synthesis plants 42
1.6. Fuel cells 47
2. Processes for H2 and/or syngas production 53
2.1. Steam reforming process 54
2.1.1. Chemistry of steam reforming: Thermodynamics 55
2.1.2. Kinetics and reaction mechanism 62
2.1.3. Steam reforming catalysts 68
2.1.4. Carbon formation on reforming catalyst 86
2.1.5. Sintering of reforming catalysts 96
2.1.6. Catalyst shape and dimensions 102
2.1.7. Practical aspects of steam reformers 104
2.1.8. Water gas shift reaction (WGS) 110
2.2. Partial oxidation of fossil fuels (POX) 115
2.3. Autothermal reforming (ATR) 117
2.4. Catalytic partial oxidation of methane (CPO) 119
II Catalysts for H2 production
EXPERIMENTAL SESSION 126
1. Catalysts preparation 126
1.1. Perovskite type catalysts (PVK) 126
1.2. Catalysts obtained from hydrotalcite type precursors 127
2. Characterization of the catalysts 128
2.1. X-Ray diffraction analysis (XRD) 128
2.2. Surface area and porosimetry analyses 129
2.3. Temperature programmed reduction (TPR) and oxidation (TPO) 129
2.4. H2 Chemisorption analysis 129
2.5. Shaping in form of the catalysts 131
2.6. CPO laboratory plant 131
2.7. SMR laboratory plant 134
RESULTS AND DISCUSSION 139
1. Aim of the work 139
2. Catalytic partial oxidation of methane 140
2.1. Perovskite (PVK) type catalysts 140
2.1.1. Effect of Rh amount (La1Fe(0.7-z)Ni0.3Rhz) 142
2.1.2. Effect of Ce amount (La(1-x)CexFe0.69Ni0.3Rh0.01) 145
2.1.3. Effect of Ni amount (La0.8Ce0.2Fe(0.98-y)NiyRh0.02) 149
2.1.4. Effect of calcination temperature: 900 or 1100°C
(La0.8Ce0.2Fe0.7Ni0.25Rh0.05) 155
2.2. Catalysts obtained from hydrotalcite (HT) type precursor 159
2.2.1. Role of the M2+/M3+ ratio and role of the active metal 163
2.2.2. Role of the hydrotalcite type matrix as support 175
3. Steam reforming of methane 185
3.1. Characterization of spent industrial catalysts 185
3.1.1. Characterization of Portugal used samples 186
3.1.2. Characterization of USA used samples 194
3.1.3. Activity of industrial spent samples 202
3.2. Comparison of different commercial catalyst 216
3.2.1. Characterization of commercial catalysts 216
Catalysts for H2 production III
3.2.2. Effect of the operative parameter on the steam reforming reaction
carried out in the laboratory plant 221
3.2.3. Activity of commercial catalysts 229
3.2.4. Characterization of used commercial catalysts 234
3.3. Catalyst obtained from hydrotalcite (HT) type precursor 238
3.4. Catalyst obtained from perovskite (PVK) 255
3.5. Comparison among ex-HT sil, PKV and commercial catalysts 261
3.6. Structured catalysts: support with high thermal conductivity 263
3.6.1. Ni/SiC catalysts 263
3.6.2. Electrochemical deposition of hydrotalcite type precursors on
metallic foams 269
CONCLUSIONS 276
REFERENCES 281
Catalysts for H2 production 1
INTRODUCTION
Hydrogen is a “building block” product of remarkable industrial interest and it is
indicated as energy carrier of increasing relevance. Hydrogen is found naturally
in hydrogen-rich compounds; it cannot be extracted like natural gas or oil, but
needs to be released by applying energy. On the one hand, this represents a
drawback because the process requires the input of primary energy carriers like
coal, natural gas or biomass, of electricity or high temperatures. The advantage is
that a wide range of different feedstocks and energy sources can be used for
hydrogen production. It can be manufactured from a wide range of energy
sources and in particular from fossil fuels, biofuels by thermochemical way and
from water by electrolytic way. Currently, the main sources for the next two or
three decades will remain fossil fuels and in particular the natural gas1.
The synthesis gas is a mixture of hydrogen and carbon monoxide; it may contain
carbon dioxide together with some nitrogen and other inert gases, depending
from the used source and the production process. Synthesis gas may be
manufactured by coke and biomass gasification, by steam reforming or partial
oxidation of hydrocarbons, usually natural gas.
Today, “hydrogen economy” is high on the political agenda and on the priorities
of agencies funding research. Hydrogen is claimed to replace hydrocarbons and
to provide a clean fuel with no carbon emissions for use in stationary and mobile
applications as well. Fuel cells will play a key role for both applications. However,
hydrogen is an energy carrier, not a fuel2.
The world energy production is dominated by fossil fuels as energy sources. It
amounted to 88 % in 2003 with oil responsible for 37 %. The energy consumption
is growing fast in Asia (7 % in 2003), and China has become the world’s second
largest consumer of oil behind the United States. The proven reserves of oil are
concentrated in the Middle East (63 %) and those of natural gas in the Middle
East (41 %) followed by Russia. Coal is more evenly distributed between Asia,
Europe and North America.

2 Introduction
With the present world production, the oil reserves known today would be used
up within about 40 years. This figure should be considered with care. It does not
include reserves still to be discovered and it does not include the changes in
consumption (for instance the growth in Asia). It has been emphasized the need
for flexibility in the energy network and the need for alternative fuels. Oil is the
most versatile of the fossil fuels with high energy density and ease of
transportation.
The power industry is very flexible to feedstocks. Coal can be transported over
long distances to big centralized power plants close to deep water harbors.
Natural gas in large quantities is provided by pipeline or as liquefied natural gas
(LNG). The automotive sector represents a special challenge as the energy
conversion is strongly decentralized. So far oil derived products have been the
solution, but in view of the limited reserves, a number of alternative fuels are
being considered, such as LPG (liquefied petroleum gas), natural gas, methanol,
DME (dimethyl ether), ethanol, bio-diesel, Fischer-Tropsch synthetic fuels, and
hydrogen.
Biofuels represent a “sustainable” response for liquid fuels. It may be based on
ethanol and bio-diesel derived from conventional agricultural products or from
synfuels via gasification of biomass.
As an example, the manufacture of ethanol from biomass requires the use of
fossil energy that for methanol from corn, the ratio of the energy from ethanol
divided by the amount of no renewable energy to produce it is only slightly above
one if no other waste of the process are used to recover energy. This energy is
used for fertilizer, harvesting, transportation, and processing. Ethanol may be
produced more efficiently from sugar cane when the bagasse is also used to
produce heat, as in Brazil, but it remains a challenge to find routes converting
cellulose into ethanol.
Comparing the alternative fuels with conventional oil-derived fuels is a
comparison against a moving target, since technologies for making and using
conventional fuels are developing as well2.
In locations with high natural gas prices, the energy efficiency becomes critical
and the feedstock costs may amount to 2/3 of the total production costs. This
means that the potential for reduction in hydrogen production costs are limited if
energy costs are high.

Catalysts for H2 production 3
1. H2 relevance and applications
The development of hydrogen production technologies requires identification of
potential markets and the constraints associated with those markets.
For non-carbon-dioxide-emitting hydrogen production technologies (nuclear,
renewable, and fossil fuels with carbon dioxide sequestration), restrictions on
carbon dioxide emissions to the atmosphere are an important factor in the
increasing potential size of a future markets3. Existing and potential hydrogen
markets were identified as follows3:
• Industrial. The two major industrial markets for hydrogen are fertilizer production
(ammonia), steel, methanol and H2 for cracking and hydrodesulphurization. All
nitrate fertilizers require hydrogen in their production processes. Some but not all
steel production processes require hydrogen. These are large-scale facilities that
match large-scale hydrogen production systems.
• Vehicle. Transportation requirements can be met with different fuels (methanol,
dimethyl ether, Fischer-Tropsch fuels or gasoline, diesel, jet fuel and in the future
H2 itself). Each fuel requires different amounts of hydrogen in the production
process and has different economics of scale.
• Power. Hydrogen is a candidate for power production, particularly as a vector
for storage and use for production when necessary.
• Commercial. Hydrogen is being considered for commercial applications in
buildings with the co-generation of power and heat.
With interest in its practical applications dating back almost 200 years, hydrogen
energy use is hardly a novel idea. What is new is the confluence of factors since
the mid-1990s that increase the attractiveness of hydrogen energy economy.
Those factors include persistent urban air pollution, demand for low or zero-
emission vehicles, the need to reduce foreign oil imports, carbon dioxide
emissions and global climate change, and the need to store renewable electricity
supplies. These considerations are not confined to a single nation or region, and
make hydrogen a virtually ideal energy carrier that is abundantly and equitably
available to humanity4.
The interest on hydrogen-based energy systems surged in response to the first
oil crisis and the growing concerns about environmental issues. The advantages
are the hydrogen nearly zero emissions, its potential role in reducing greenhouse
gases (improving air quality), reducing climate changes and the possibility of local
4 Introduction
production on the basis of a variety of fuels (decreasing dependence on imported
oil). In fact, the high end-use efficiency in fuel cells and the possibility to produce
hydrogen from non-fossil sources or clean fossil fuels (fossil fuel combustion in
combination with coke capture and storage – CCS) could reduce greenhouse gas
emissions from the energy system5. Currently, most hydrogen production
technologies for energy purposes (large-scale and low cost) are currently still in
the laboratory phase or at best in the demonstration phase. Natural gas plays an
important role, almost all transition scenarios start with small-scale production of
hydrogen from natural gas via steam reforming (SR), possibly in combination with
electrolysis. In long term, literature shows three different possible configurations
of the large-scale hydrogen energy system:
- large scale production of hydrogen from fossil sources, mainly coal and
natural gas;
- a situation with climate constraints, when a fossil based hydrogen system
can be combined with CCS (coke capture and storage);
- renewable hydrogen production, based on biomass gasification, direct
solar thermal hydrogen production and electrolysis from solar or wind
electricity.
These configurations do not necessarily exclude each other. The costs of
producing hydrogen consist largely of feedstock and investment costs. Future
hydrogen production costs are generally assumed to be lower than current values
as a result of technology development. For small-scale, steam reforming (SR)
costs are generally significantly higher than that of large scale, but some authors
expect cost declines down to the level of large scale reformers5.
Catalysts for H2 production 5
1.1. Ammonia synthesis Ammonia is used in various applications, such as textile processing, water
purification, and manufacturing explosives. The main part, however, is used as
fertilizer6. Ammonia production consumes about half the hydrogen produced
today and is the primary chemical industry use of hydrogen. Ammonia is currently
made where there is inexpensive natural gas that provides economical hydrogen
and shipped to the costumer. The low cost of shipping ammonia favors very large
ammonia production plants with very large demands for hydrogen3.
At the beginning of the 20th century, the use of nitrogenous fertilizers was already
well established. Haber and Bosch developed the direct synthesis of ammonia
from hydrogen and nitrogen7.
The synthesis of ammonia from nitrogen and hydrogen is a clean reaction, in that
it is not complicated by the formation of byproducts, such as hydrazine, and the
thermodynamics are seemingly straightforward.
∆H°700K = - 52.5 kJ mol-1
1/2 N2 + 3/2 H2 NH3 ∆G°700K = + 27.4 kJ mol-1
∆S°700K = + 288 J mol-1K-1
The reaction is exothermic and is accompanied by a decrease in volume at
constant pressure. The value of the equilibrium constant (Kp) therefore increases
as the temperature is lowered, and the equilibrium ammonia concentration
increases with increasing pressure.
The formation of ammonia is favored by operation at high pressure and low
temperature. The optimum pressure for economic operation with the available
catalysts has been in the range 150 - 350 bar. Normally, the advantages of the
higher equilibrium concentration of ammonia at very high pressure are more than
offset by the higher costs of both gas compression and additional plant capital.
The temperature at which the synthesis process is operated is determined by the
activity characteristics of the catalyst. Thermodynamically, low temperature is
advantageous, but for kinetic reasons high temperatures have to be used. The
most effective catalyst is clearly the one that will give the highest rate of
conversion of ammonia at the lowest temperature.
As the synthesis reaction proceeds, the heat of reaction causes the temperature
to rise down the bed, so making the specific rate of reaction faster. Since the
equilibrium becomes less favorable at higher temperatures, the rate of the

6 Introduction
reverse reaction is progressively increased and the overall conversion becomes
equilibrium-controlled. Careful control of the temperature profile is therefore
necessary for the equilibrium balance to be obtained between the limit set by the
thermodynamic equilibria, and by the kinetics of the catalyzed reactions in both
forward (synthesis) and reverse (ammonia decomposition) directions.
1.1.1. Reaction mechanism
The ammonia synthesis reaction from N2 and H2 is composed of several steps:
dissociation of N2, dissociation of H2, and formation of N-H bonds.
On the best elementary metal catalyst (Ru, Fe) the branchless NH3 synthesis
proceeds along a well-defined Langmuir–Hinshelwood reaction path. Hence, the
stepwise addition of adsorbed H to the N-compounds can be written as:
N2 + 2 * 2 N*
H2 + 2 * 2 H*
N* + H* NH* + *
NH* + H* NH2* + *
NH2* + H* NH3* + *
NH3* NH3 + *
where * and X* correspond to an empty site and an adsorbed X chemical
compound, respectively.
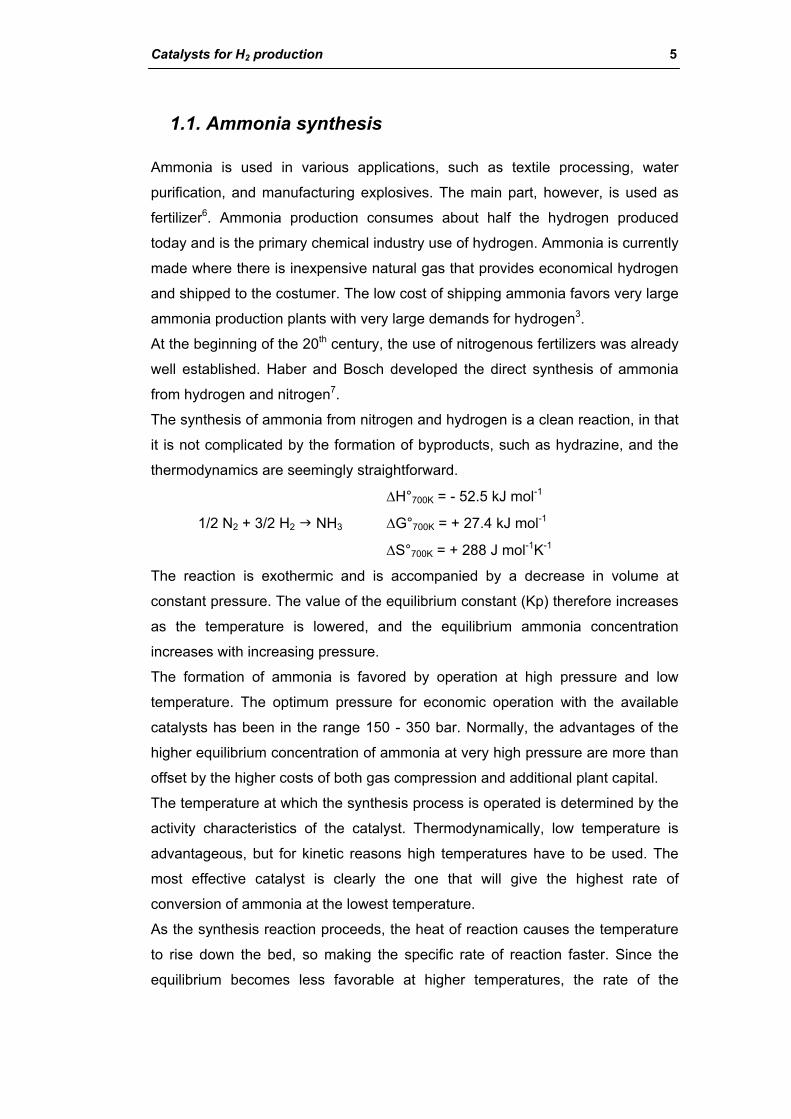
The main role of the ammonia catalyst is to dissociate the N2 bond. Under
industrial conditions, this is the rate-determining step (RDS) for NH3 synthesis on
Ru, due to the high bond energy (Fig. 1. 1). The dissociation takes place at
defects and steps, rendering the NH3 synthesis extremely structure sensitive6.
Catalysts for H2 production 7
Fig. 1. 1 - The reaction pathway for NH3 synthesis on the flat (dashed line) and stepped (solid line) Ru surface. The transition state (TS) configurations of the N2 dissociation over the terrace and step sites are shown in the inserts6.
1.1.2. Ammonia synthesis catalysts
All commercial ammonia synthesis catalysts are currently based on metallic iron
promoted with alkali (K), and various metal oxides, such as those of aluminum,
calcium or magnesium. The principal material used to make these catalysts is
usually magnetite (Fe3O4), with some of the components in the catalyst
originating as impurities in the magnetite. A typical catalyst contains
approximately 0,8 % K2O, 2.0 % CaO, 0.3 % MgO, 2.5 % Al2O3 and 0.4 % SiO2,
as well as traces of TiO2, ZrO2 and V2O5. In developing the process to
manufacture catalysts of this sort, it was recognized that these minor components
could have a large effect on the performance of the final catalyst, since they may
also interact with each other, giving rise to both harmful and beneficial effects. In
modern catalysts, these factors have been taken onto account, resulting in
optimized performance in terms of high activity and long life.
The main component of the catalyst, iron, has remained unchanged since the
catalyst was first introduced in 1913, despite a large amount of research into
alternative formulations. Magnetite has a spinel structure (similar to that of
8 Introduction
MgAl2O4) consisting of a cubic packing of oxygen ions, in the interstices of which
Fe2+ and Fe3+ ions are distributed. During reduction, oxygen is removed from the
crystal lattice without shrinkage, so the metallic iron is obtained as a
pseudomorph of the original magnetite. Metallic iron produced in this way is
therefore extremely porous, and the way in which porosity is developed is an
important factor affecting the activity of the final catalyst. Another major factor is
the size of the individual crystals of iron produced during reduction. This is largely
determined by the nature and amounts of promoters present and of course of the
actual conditions during reduction.
The most important promoters are alumina and potash, which generate the so-
called “doubly promoted” catalyst, but several other oxides may also be added.
Promoters as calcium oxide, silica, magnesia and the oxide of manganese,
chromium, zirconium and vanadium, are conveniently classified as structural or
electronic, depending on their accepted mode of action.
The production and preservation of a porous structure during the reduction of the
catalyst is of fundamental importance in obtaining high activity, and the prime role
of structural promoters (Al2O3, MgO and Cr2O3) is to facilitate the formation of
porous, high area, metallic iron.
Silica and other acidic components are common impurities in natural magnetite
used for catalysts production, and consequently they become incorporated into
the structure of the final catalyst. They have the effect of neutralizing the
electronic promotional effect of basic components such as K2O and CaO, and
their presence in excess can result in lower catalyst activities. However, silica
also has a stabilizing effect like alumina, and high-silica catalysts tend to be more
resistant to both water poisoning and sintering.
The presence of alkali-metal species in the ammonia synthesis catalyst is
essential to obtain high activity. Although all of the alkali metals are effective to
some extent, the best are potassium, rubidium and cesium, with potassium being
the most cost effective. On reduction of the catalyst, much of the potash remains
associated with the somewhat acidic support phase, though some interacts with
the iron particles and greatly increases their activity.
In the early 1970s, an alkali-metal-promoted carbon-supported Ru catalyst was
introduced, it exhibited a 10-fold increase in activity over the conventional iron-
based catalyst under similar conditions. In 1992 using this kind of graphite-
supported ruthenium catalyst, a 600 tonn NH3 per day plant has begun to
Catalysts for H2 production 9
produce ammonia under milder condition compared with the plants using iron-
based catalysts. Thus, it is believed that Ru-based catalyst could become the
second-generation catalyst for ammonia synthesis. However, the ruthenium-
based catalysts are not widely employed in industrial ammonia synthesis
because they are expensive8.
Because of the advance in the ruthenium-based catalyst for ammonia synthesis,
a number of research groups have investigated the roles of support and promoter
of the catalyst played in the catalytic reaction. Various supports, such as active
carbon and graphite, alumina, carbon-coated alumina, magnesia, a series of
zeolites and even rare-earth metal oxides were used in Ru-based catalysts for
the ammonia synthesis. The promoters used are mainly alkali metal, alkaline
earth metal, rare earth metal and their oxides or hydroxides. However, it seems
that the ruthenium supported on carbon material with promoters is the most
promising catalyst for commercial applications. This is due to the many attributes
linked with carbon materials, such as specific electronic properties, variable
surface functional groups, and easy metal recovery by the burning of the support.
For the above-mentioned reason, Li and coworkers9 carried out studies to
investigate in detail the ammonia synthesis on the ruthenium catalysts supported
on different carbon materials promoted with K and Ba compounds under
moderate pressure. They found that the Ba and K promoters change Ru
dispersion, modify electron properties on Ru surface, and neutralize the surface
groups of carbon supports; as a result, these promoters significantly enhance the
ammonia synthesis activity of Ru/C catalysts. The Ba-promoted Ru/AC (active
carbon) catalyst gives the highest ammonia concentration, because Ru metal is
well dispersed on the support, while Ru-Ba/ACF (active carbon fiber) gives the
highest TOF value (turnover frequency). This is due to the high purity and
electronic conductivity of ACF. The low activity on the CMS (carbon molecular
sieve) support can be attributed to the low surface area and the lower
graphitization. Therefore, the carbon supports with high purity, high electronic
conductivity and high surface area favor the high activity of Ru-based catalysts
for ammonia synthesis. The ammonia synthesis on Ru/C catalyst is structure
sensitive and exhibits higher activity, but the TOF becomes constant when Ru
particle size is beyond about 5nm9.
To avoid methanation and the easy loss of the carbon support, Liao and
coworkers8 studied bimetallic catalysts (Ru-M, M = Fe, Co, Ni, Mo) with low

10 Introduction
ruthenium loadings and without a carbon support, but MgAl2O4, MgO and a Mg-Al
complex oxide obtained by calcining hydrotalcite type precursors at 800°C. It was
shown that the bimetallic Ru-Co/MgO exhibited good ammonia synthesis
activity8.
Ru-based catalysts are known to be active for NH3 synthesis at atmospheric
pressure and low temperature10,11. The most stable and commercially available
Ru precursor used for ammonia synthesis is RuCl3. The main advantage of this
metal precursor is its low cost in comparison to other metal precursors, but the
main disadvantage of using RuCl3 is the strong binding of chlorine atom with the
metal surface even after reduction. Alkali metal nitrate used as a promoter is
thought to have two effects: one is to remove chlorine ions from the catalyst and
the other is to donate electrons to ruthenium. The promoting effect of alkali metal
to Ru on NH3 synthesis activity is found to be inversely proportional to the
electronegativity of the alkali metal in the order of Cs > Ba > K > Na.
It has been observed that the high activity of the active carbon supported
promoted ruthenium catalysts are attributed to the electron deficient graphite
lattice of active carbon. The MgO support shows less activity because of strong
interaction with chlorine in RuCl3. The strong chemisorption of product ammonia
on the acid centers of alumina makes it a less attractive support for ruthenium.
Hydrotalcite-like compounds are a class of precursors useful for the preparation
of catalytically active oxides showing basic properties. Rama Rao et al11 shows in
a recent work the comparison of activity studies of ammonia synthesis over Ru
supported on mixed oxide support obtained from Mg–Al HT precursor (with Mg/Al
ratio of 2) with the Ru catalysts supported on simple oxides MgO and Al2O3 under
atmospheric pressure. They found that calcined hydrotalcite precursor is the
promising support for the ammonia synthesis, because it is highly basic,
thermally stable, and is resistant to Cl- when compared to MgO support.
Ruthenium with cesium promoter over novel Mg–Al HT support is found to be
very efficient for the synthesis of ammonia at atmospheric pressure compared to
Cs–Ru catalysts on MgO and Al2O3 supports. The higher activity of the Cs–
Ru/HT catalyst has been attributed to the presence of easily reducible Ru species
and nano-particles of Ru in highly dispersed form over calcined Mg–Al HT
support11.
In a recent work, Liao et al12 studied new supported catalysts to develop catalysts
with high stabilization (MgO) and high activity (CNTs = carbon nanotubes). They
Catalysts for H2 production 11
studied K-Ru/MgO and K-Ru/CNTs separately and then combined at different
weight ratio to obtain a combination-type catalyst. For the as-prepared
combination-type ruthenium catalysts, ruthenium particles well disperse on the
surfaces of MgO and CNTs relatively. The optimal weight ratio of K-Ru/MgO to K-
Ru/CNTs for the preparation of the combination-type ruthenium catalysts is 1/1,
that is because the combination between MgO and CNTs is strong and the
interactional effects are prominent at this weight ratio. A complementary
interaction between two supports is suggested, which promotes electron transfer
from alkali metallic atoms to the B5-sites of ruthenium more easily. Due to the
high catalytic activity and high thermal stability under operating conditions, the
combination-type ruthenium catalyst of K-Ru/MgO and K-Ru/CNTs may be a
good catalyst for ammonia synthesis.
1.1.3. Ammonia plants
The principle of circulating gases over the catalyst, which was first appreciated by
Haber in 1908, is still an important feature of modern ammonia plants. Synthesis
gas of the appropriate composition passes through the catalyst beds, and the
ammonia produced is condensed and recovered. Unreacted gas, to which fresh
make-up gas is added, is then recirculated through the catalyst. Using heater
exchangers the temperature of the recirculating gas is raised in two stages to a
reaction temperature of about 400°C and, at the same time, the temperature of
the converter effluent gas is reduced. To prevent accumulation of inert gases
generally present in the synthesis gas, part of the circulating gas is purged. The
residual ammonia in the purge gas is usually recovered, and the hydrogen
content is either used as fuel in the primary reformer or recovered and
recirculated7.
In modern ammonia plants, it takes 28-30 GJ/te to produce ammonia from natural
gas by the overall reaction:
Natural gas + water + air 3 H2 + N2 + CO2 ammonia + CO2
The exergy consumption for ammonia production depends strongly on the
ammonia synthesis loop design. In general, even at high pressure up to 300 bar,
not more than the 20-25 % of the synthesis gas is converted to ammonia per
pass13. After the removal of ammonia by its condensation at low temperatures,
the unreacted hydrogen – nitrogen mixture is returned to the reactor. Therefore,

12 Introduction
since its first development in 1913 by Haber and Bosch, industrial ammonia
synthesis always has been implemented as a recycle process. Thus, to produce
1 Kg ammonia, 4-6 Kg synthesis gas must be recycled through the reactor.
Fig. 1. 2 - Flowsheet of typical ammonia synthesis loop.
The energy efficiency of an industrial ammonia synthesis process depends on
two types of parameters:
• Parameters defined by external systems: pressure and inerts (CH4+Ar) content
of the make-up gas, refrigeration plant and purge recovery.
• Internal parameters defined by the loop design: degree of conversion (or
recycle ratio), reaction approach to equilibrium, inerts (CH4+Ar) content in the
circulating gas and reaction heat- and cold recovery system parameters.
The exergy efficiency of an ammonia synthesis loop depends strongly on the
degree of conversion, respectively, on the recycle ratio. The higher the
conversion is (respectively the lower the recycled/fresh gas ratio), the better the
heat utilization and the less the exergy consumption for gas recycling and for
ammonia condensation. However, exergy efficiency increases when the reaction
approaches equilibrium, because exergy consumption for ammonia condensation
decreases.
Catalysts for H2 production 13
The equilibrium concentrations of components in the ammonia synthesis reaction
depend on the pressure and the temperature, and, to a lesser extent, on the
concentration of inerts. Since catalysts are active over the narrow temperature
range of 380–500°C and unable to approach more than 80 % of the equilibrium,
the maximum ammonia concentration in the recycling gas at the reactor outlet
depends in fact only on the pressure.
Actually, outlet ammonia concentration is being chosen somewhat lower in order
to reduce the catalyst volume, and the reactor costs. In most cases, the inlet and
outlet ammonia concentrations are connected depending on the reactor design.
The oldest “quench” and “cooling tube” reactors afford a degree of conversion of
no more than 10–11 %. Modern reactor designs with intercoolers between
catalyst beds provide a degree of conversion as high as 15 %. With maximum
outlet ammonia concentration of 20 %, a degree of conversion of more than 16 %
may be reached only in the case of full removal of ammonia from recycling gas
mixture, e.g. by water absorption. However, water absorption is not used in
industrial ammonia plants and ammonia condensation is still the only way to
separate ammonia from the unreacted gas mixture.
The inlet ammonia concentration depends on the vapor–liquid equilibrium (VLE)
in the system NH3–N2–H2–CH4–Ar. Ammonia is the only component of this
system, which might be condensed at non-cryogenic temperatures. However, the
VLE position of ammonia in the presence of non-condensable gases at high
pressures (80–300 bar) is very unfavorable. The real vapor pressure of ammonia
in this system is up to twice as high as the equilibrium pressure of pure ammonia
at the same temperature. Thus, the partial condensation of ammonia from the
outlet gas mixture, containing 20 % ammonia at 300 bar, begins at relatively low
temperature (65 – 70°C). To obtain ammonia content as low as 2%, the gas
mixture must be cooled down to temperatures such as – 20°C. Therefore, the
first stage of condensation is carried out in water-cooled or air-cooled
condensers. But the ammonia content at temperatures 25–30 °C is still high (7 –
8 %) and in most modern ammonia plants an ammonia refrigeration unit is used
to cool the recycling gas down to – 20 / + 10°C in order to decrease the converter
inlet ammonia concentration down to 2 – 5 %.
In the first stage, the ammonia condensation heat is released to the environment
and some power is consumed in the air coolers or in the cooling water system. In
the second stage, cold recovery could not be complete because the heat
14 Introduction
capacity flow rate of the warm gas, in which the ammonia condensation occurs, is
much greater than the heat capacity flow rate of the cold gas exiting the ammonia
separator. In most ammonia plants, a simple vapor-compression refrigeration
cycle is used to reject the condensation heat at low temperatures. In this case, all
this heat is rejected from the recycle gas at the lowest temperature in the
synthesis loop and the irreversible losses are too large. If the ammonia content at
the reactor inlet is given, the minimum temperature approaches in the cold
exchanger and in the chiller are the only independent parameters of the second-
stage ammonia condensation subsystem.
The exergy efficiency of modern ammonia synthesis plants is improved by the
use of well-developed heat- and cold recovery. In most ammonia plants, the
reaction heat is utilized at a relatively low temperature, e.g. for boiler feed water
(BFW) preheating. The temperature approach in high temperature (HT) heat
exchanger depends only on the degree of conversion. A small temperature
approach (about 10 – 20°C) along the low temperature (LT) heat exchanger is
possible and then a substantial (90 – 95 %) part of the reaction heat could be
utilized. However, the temperature level of heat utilization is low and the exergy
efficiency of the entire heat utilization system is small. If the degree of conversion
is given, the minimum temperature approach in the low temperature heat
exchanger and the hot gas BFW preheater input temperature are the only
independent parameters of heat recovery and utilization subsystem.
Fig. 1. 3 - Ammonia plant.
Catalysts for H2 production 15
1.2. Direct Reduction of iron ore (DRI)
Direct reduction of iron ore is today's major process for generating metallic iron,
necessary in the iron and steel industry. World production of direct reduce iron
(DRI) has grown from near zero in 1970 to 45.1 Mt in 20023,14.
In the production processes for converting iron ores into iron and steel, carbon,
primarily in the form of coke, has been traditionally used to reduce the iron oxides
to iron metal. However, in the last several decades, there has been increasing
production of iron using the direct reduction iron (DRI) process. In 1998, about 4
% of the primary iron in the world was produced by the DRI process with rapid
growth in iron production. In the DRI process, syngas (a mixture of hydrogen and
carbon monoxide) made from natural gas is used to reduce iron ores to iron. The
major chemical reactions are as follows:
Fe3O4 + CO → 3 FeO + CO2
Fe3O4 + H2 → 3 FeO + H2O
FeO + CO → Fe + CO2
FeO + H2 → Fe + H2O
The DRI process has lower capital costs than alternative methods used to
produce iron, but requires a low-cost source of hydrogen. The primary market for
DRI is to provide a purified iron feed for electric arc furnaces (EAFs) that produce
various steel products. EAFs have lower capital costs than traditional steel mills
and are environmentally cleaner operations than blast furnaces. Over a third of
the world's steel production uses this process. It is predicted that by 2010 up to
45 % of the world's steel may be made with EAFs. Historically, scrap metal has
been the traditional feed for EAFs. However, there are two constraints: the
availability of scrap metal and the various difficult-to-remove impurities (copper,
nickel, chrome, molybdenum, etc.) that are present in the lower-grade scrap
metal. Blending clean DRI-process iron with scrap metal dilutes the impurities
below the level that affect product quality. Traditional steel-making processes
using coke result in iron with a high carbon content and various other impurities
from the coke.
Iron production is potentially a significant existing market for hydrogen. If low-cost
hydrogen is available, the DRI process would replace other methods of iron
production. The economics of DRI relative to other processes (and the potential
demand for hydrogen) depend upon three factors.

16 Introduction
• Technological developments: The continuing improvements in EAF technology
in terms of reduced production costs and increased capabilities to produce
higher-quality steel have expanded the market share of this technology. That, in
turn, creates the demand for more high-purity iron by the DRI process as
traditional sources of scrap metal are exhausted.
• Environmental protection: Traditional steel processes use coal and generate
large quantities of pollutants. Clean air requirements strongly affect the
economics of these competing processes.
• Hydrogen costs: The process is used where there is low-cost natural gas for
hydrogen production near iron deposits.
Catalysts for H2 production 17
1.3. Methanol synthesis
Methanol is inside the top 10 produced molecules. Methanol has been a common
chemical feedstock for several important chemicals such as acetic acid, methyl
ter-butyl ether (MTBE), formaldehyde and chloromethane. Moreover, methanol
being a clean liquid fuel could provide convenient storage of energy for fuel cell
applications, particularly in transportation and mobile devices15. In additions, over
the last few decades, methanol-to-hydrocarbons (MTHC) technologies, in
particular methanol-to-olefin (MTO) and methanol-to-gasoline (MTG), have been
the focus for a large number of researcher dealing with the upgrading of natural
resources beneficial both for the petrolchemistry and fuel industries16,17,18.
The process to synthesize methanol from carbon monoxide and hydrogen was
introduced by BASF in 1923 and it was the second large-scale application of
catalysis (after ammonia synthesis) and high-pressure technology (100-300 bar)
to the chemical industry7.
Like the ammonia process, methanol synthesis was dependent on the
development of an effective catalyst, but unlike the ammonia synthesis catalyst,
the methanol catalyst had to be selective as well as active.
The reactions involved in the methanol synthesis are:
(A) CO + 2 H2 CH3OH ∆H°298K = - 90.6 kJ mol-1
∆G°298K = - 25.3 kJ mol-1
(B) CO2 + 3 H2 CH3OH + H2O ∆H°298K = - 49.5 kJ mol-1
∆G°298K = + 3.3 kJ mol-1
(C) CO + H2O CO2 + H2 ∆H°298K = - 41.2 kJ mol-1
∆G°298K = - 28.6 kJ mol-1
Reaction (B) and (C) combined are equivalent to reaction (A), so that either, or
both, of the carbon oxides can be the starting point for methanol synthesis.
Reactions (A) – (C) are exothermic; reactions (A) and (B) are accompanied by a
decrease in volume. Hence, the value of the equilibrium constant decreases with
temperature and increases with pressure (Kp = pCH3OH / pCOp2H2). Thus, high
conversions to methanol, given a sufficiently active catalyst, will be obtained at
high pressures and low temperatures.
In addition to the synthesis of methanol, both carbon monoxide and carbon
dioxide can take part in other hydrogenation reactions, producing by-products
such as hydrocarbons, ethers and higher alcohols:
18 Introduction
(D) CO + 3 H2 CH4 + H2O ∆H°298K = - 206.2 kJ mol-1
∆G°298K = - 142.2 kJ mol-1
(E) 2 CO + 4 H2 CH3OCH3 + H2O ∆H°298K = - 204.8 kJ mol-1
∆G°298K = - 67.2 kJ mol-1
(F) 2 CO + 4 H2 C2H5OH + H2O ∆H°298K = - 255.6 kJ mol-1
∆G°298K = - 122.6 kJ mol-1
These reactions are much more exothermic than the methanol synthesis
reactions and methanol is thermodynamically less stable and less likely to be
formed from carbon monoxide and hydrogen than the other possible products,
such as methane. Which of the products is formed is controlled by kinetics
factors; that is, by the catalyst being selective in favoring a reaction path leading
to the desired product.
The catalytic synthesis of methanol from syngas has been conventionally carried
out in two-phase reactors with the syngas and products in the vapor phase and
the catalyst as solid phase. The large exothermic heat of reaction in addition to
the low heat capacity of the vapor increases the potential for thermal runaway
and damage to the catalyst in the vapor phase, thus limiting the maximum
operable reaction temperature19.
1.3.1. Methanol synthesis catalysts
There are two class of catalysts studied and used for methanol synthesis: high-
pressure and low-pressure catalysts (Tab. 1. 1).
High-pressure catalysts
The catalyst used in the original process was derived by empirical methods. It
contains zinc oxide and chromia and was used in the high-pressure process for
40 years. Zinc oxide alone was a good catalyst for methanol synthesis at high
pressure and temperature above 350°C, but it was not stable and quickly lost its
activity. It was found that die-off could be retarded by the incorporation of
chromia, which acted as a stabilizer preventing the growth of the zinc oxide
crystals.
Catalysts for H2 production 19
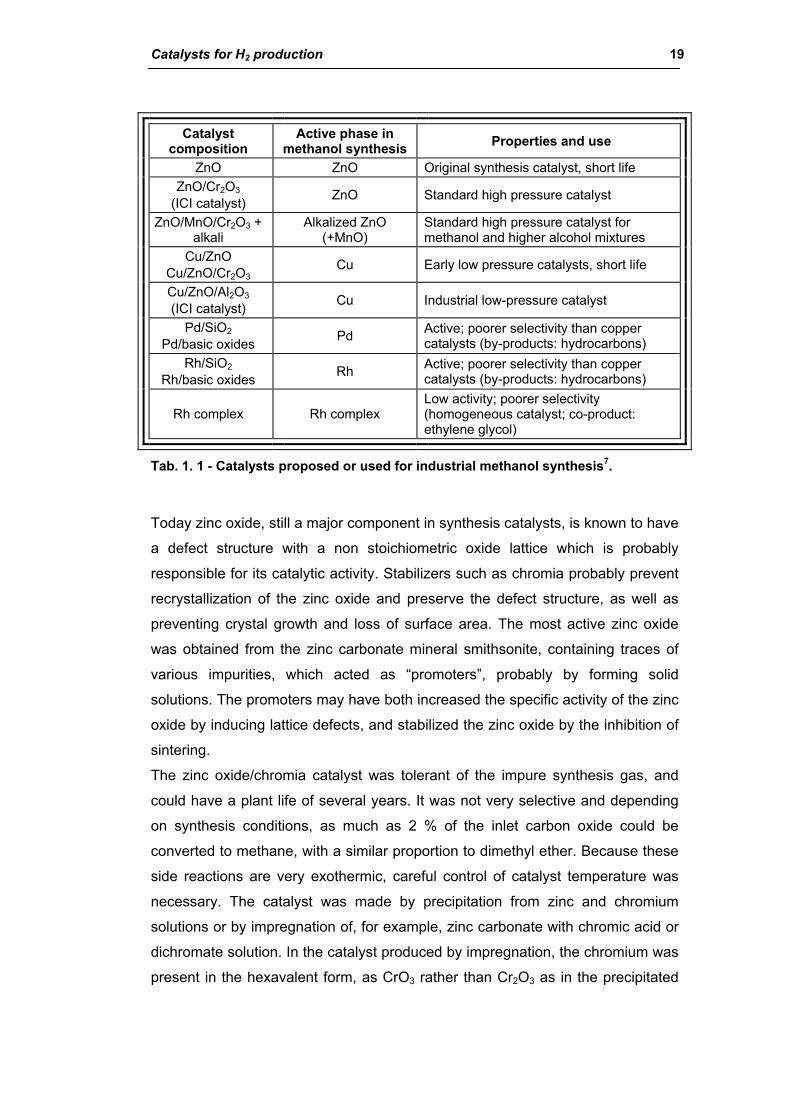
Catalyst composition
Active phase in methanol synthesis Properties and use
ZnO ZnO Original synthesis catalyst, short life ZnO/Cr2O3
(ICI catalyst) ZnO Standard high pressure catalyst
ZnO/MnO/Cr2O3 + alkali
Alkalized ZnO (+MnO)
Standard high pressure catalyst for methanol and higher alcohol mixtures
Cu/ZnO Cu/ZnO/Cr2O3
Cu Early low pressure catalysts, short life
Cu/ZnO/Al2O3
(ICI catalyst) Cu Industrial low-pressure catalyst
Pd/SiO2 Pd/basic oxides Pd Active; poorer selectivity than copper
catalysts (by-products: hydrocarbons) Rh/SiO2
Rh/basic oxides Rh Active; poorer selectivity than copper catalysts (by-products: hydrocarbons)
Rh complex Rh complex Low activity; poorer selectivity (homogeneous catalyst; co-product: ethylene glycol)
Tab. 1. 1 - Catalysts proposed or used for industrial methanol synthesis7.
Today zinc oxide, still a major component in synthesis catalysts, is known to have
a defect structure with a non stoichiometric oxide lattice which is probably
responsible for its catalytic activity. Stabilizers such as chromia probably prevent
recrystallization of the zinc oxide and preserve the defect structure, as well as
preventing crystal growth and loss of surface area. The most active zinc oxide
was obtained from the zinc carbonate mineral smithsonite, containing traces of
various impurities, which acted as “promoters”, probably by forming solid
solutions. The promoters may have both increased the specific activity of the zinc
oxide by inducing lattice defects, and stabilized the zinc oxide by the inhibition of
sintering.
The zinc oxide/chromia catalyst was tolerant of the impure synthesis gas, and
could have a plant life of several years. It was not very selective and depending
on synthesis conditions, as much as 2 % of the inlet carbon oxide could be
converted to methane, with a similar proportion to dimethyl ether. Because these
side reactions are very exothermic, careful control of catalyst temperature was
necessary. The catalyst was made by precipitation from zinc and chromium
solutions or by impregnation of, for example, zinc carbonate with chromic acid or
dichromate solution. In the catalyst produced by impregnation, the chromium was
present in the hexavalent form, as CrO3 rather than Cr2O3 as in the precipitated
20 Introduction
catalyst. Cr(VI) is particularly toxic and present a health hazard in the handling of
the catalyst. The chromate also has to be reduced with great care to avoid a
temperature runaway, because the reduction of CrO3 to Cr2O3 with hydrogen is
extremely exothermic:
2 CrO3 (s) + 3 H2 (g) Cr2O3 (s) + 3 H2O (g) ∆H°298K = - 695 kJ mol-1
Although the low pressure process based on high-activity catalysts has almost
entirely taken the place of the high pressure process, there have been occasions
when high pressure plant being supplied with pure synthesis gas could, to
advantage, use a catalyst of higher activity. The copper/zinc oxide/alumina type
was found to be very satisfactory, although at the synthesis pressure of 350 bar,
with high partial pressure of water, sintering processes are accelerated.
Low-pressure catalysts
The methanol synthesis process has been operated at high pressure since its
invention by BASF in 1920s. With the development of newer catalysts, the
operating pressure was obviously decreased15. Among those catalysts copper
oxide appeared to have little activity itself, but was very effective when added to
zinc oxide. This was also the case when copper was added to the zinc
oxide/chromia catalyst, so it could be used at temperature as low as 300°C.
However, the catalysts containing copper were not stable and lost activity. For
example, a Zn/Cu/Cr catalyst in atomic proportions of 6/3/1 lost 40 % of its
activity in 72 hours. However, as a result of the ICI work on methanol catalysts,
stable copper catalysts were produced. The loss of activity of the early copper
catalysts in use was almost certainly due to loss of copper surface area and
sintering, despite the presence of zinc oxide and other stabilizers. Although ZnO
has activity for methanol synthesis, this is so much less than that of copper that
acts as an inert diluent in copper/zinc oxide catalysts.
In an oversimplified model, the catalyst can be considered as particles of copper
metal, surrounded and kept apart by stabilizer particles. The smaller the diameter
of the refractory spacers, the higher is the practical copper loading and the higher
the activity. High metal concentrations are used in industrial catalysts: in use,
both metal and spacer dimensions increase and the rough relationship still holds.
In the copper/zinc oxide/alumina, synthesis catalysts high activity and stability are
obtained by optimizing the compositions and producing very small particles of the
components in a very intimate mixture. By precipitation at a controlled pH, in
Catalysts for H2 production 21
which the acidic and alkaline solutions were mixed continuously, a catalyst of
optimum composition and particle size is obtained. Although chromia had been
effective as a stabilizer in the high pressure catalyst, alumina is superior to it as
the third component in the low pressure catalyst. The alumina, present as a high
surface area, poorly crystalline phase, is more effective than zinc oxide in
preventing the sintering of copper crystallites. It might then be thought that a
copper/alumina catalyst would be superior to the ternary catalysts, but there are
several reasons why this is not so.
High area aluminas have acidic sites on the surface, which catalyze the parasitic
reaction of methanol to dimethyl ether, so Cu/Al2O3 catalysts have poor
selectivity. In the ternary catalysts, formation of dimethyl ether is very low,
showing that the acidic sites are neutralized by the basic zinc oxide (either as a
surface reaction only or in bulk reaction to zinc spinel).
The chemistry of the metal and support precursors, formed in the precipitation
process, gives smaller copper crystallites with zinc oxide support than with
alumina. Hence, the optimum combination of high initial activity and catalyst
stability is obtained with the ternary Cu/ZnO/Al2O3 catalyst.
Although poisoning is not usually a significant problem in well-run methanol
plants, the presence of a “poison-soak” in the support phase can be useful. Zinc
oxide is much more effective than alumina in picking up and holding typical
poisons, such as sulphur and chlorine compounds.
Cu/ZnO/Al2O3 catalysts are still widely used and studied for the industrial
synthesis of methanol. Various methods have been developed for the preparation
of these kinds of catalysts. The difference in preparation methods, synthesis
conditions, and pre-treatment have a considerable influence on the structure of
the catalysts, which finally leads to disparities in the catalytic performance. It is
generally accepted that a large specific Cu surface area leads to an active
methanol synthesis catalyst. In addition, the metal-support interaction plays a key
role in this catalytic reaction20.
22 Introduction
Hydrocarbons and higher alcohol are thermodynamically more stable than
methanol and could be formed. The extent to which this occurs is controlled by
the selectivity of the catalyst. In this respect, the Cu catalysts are superior to the
ZnO/Cr2O3 catalyst. Methanation needs to be minimized, both because it is a loss
of feedstock and, as a highly exothermic reaction, it can cause temperature
runaways. As the by-products are formed in parasitic (parallel) reactions and not
by any intrinsic inefficiency of the synthesis reaction itself, improved activity for
methanol synthesis alone, also give improved selectivity. Thus, the copper
catalysts are more selective than ZnO catalysts under the same process
conditions, but there is a further benefit. The higher activity allows the use of
lower process temperatures, so by-products formation is further decreased
relative to methanol synthesis, because most of the parasitic reactions have
higher activation energies. The formation of by products is influenced markedly
by any impurities in the catalyst, either left in the catalyst during its manufacture
or introduced during use. Thus, alkaline impurities can result in the production of
higher alcohols and, in addition, cause some decrease in activity. Similarly, acidic
impurities (for example silica) can lead to the formation of high molecular weight
waxes on the catalyst, which can cause loss of activity by blocking some of the
smaller pores. The weaker acidity found on the surface of high area aluminas
does not give waxes, but it catalyses the dehydration of methanol to dimethyl
ether. These potential problems are eliminated by careful design and
manufacture of the catalyst.
The presence of VIII group metals, such as iron, is particularly undesirable, as
they increase hydrogenation activity and promote the dissociation of carbon
monoxide and dioxide, leading to formation of methane and long-chain paraffins
and/or waxes by Fischer-Tropsch type reaction. Methanation was always a
problem with the high-pressure catalyst, and it is thought that this was mainly
caused by iron impurities. Other VIII group metals, as cobalt or nickel, can also
catalyze methanation but they have been found to have a further deleterious
effect. Methanol synthesis itself is inhibited, probably by surface coverage of
copper crystallites with support oxide. Thus, alkali, acidic species and VIII group
metals can be regarded as poisons for synthesis catalysts. In addition, traces of
sulphur and chlorine can reduce the activity of the copper catalyst by reacting
with the active surface. Chlorine is particularly undesirable because, in addition to
poisoning of copper surface, the copper chloride produced is mobile and cause

Catalysts for H2 production 23
rapid sintering of the metal. Chlorine and sulphur also react with the free zinc
oxide in the catalyst, so that much of the uptake occurs on the catalyst near the
inlet to the bed, which therefore acts as a guard for the rest of the bed. Poisoning
of synthesis catalyst is not normally a problem except as a result of maloperation.
Although extensive studies have been carried out, controversies remain
concerning the role of active sites involved in the catalysts, the effect of the
additions of various promoters and the reaction mechanism15. The active sites in
Cu/ZnO catalysts have long been studied. On this issue, researchers are roughly
divided in two groups: one insists that metallic Cu atoms are homogeneously
active for the methanol synthesis, and the other claims that special sites (or
active sites) exist in addition to metallic Cu atoms21.
Also for ZnO the model proposed are divided in four groups (i) ZnO increases the
dispersion of Cu; (ii) ZnO acts as a reservoir for atomic hydrogen spilling over
onto the Cu surface to promote hydrogenation process; (iii) ZnO stabilizes some
active planes of Cu or the morphology of Cu particles and (iv) ZnO creates active
sites on the Cu surface21.
Several non-conventional catalyst types have attracted attention because of their
high activity for methanol synthesis23. These include:
- Alloys: Raney - The Raney methods has been utilized for catalyst
preparation, dissolving aluminum from CuAl2 alloys with or without the
presence of dissolved zinc. Catalysts so prepared have high activity and
selectivity. Properties depended on leaching conditions, and it was found that
greatly improved catalysts could be obtained by low temperature leaching in
caustic solutions that contain near-saturation levels of sodium zincate.
- Alloys: Cu- rare earths – Binary copper-thorium alloys were prepared,
followed by oxidation of the thorium to thoria, then reducing the copper oxide
formed to copper metal. This catalyst was active for methanol synthesis over
a range of conditions. Catalysts derived from rare earth-copper intermetallic
alloy precursors have been found to exhibit extraordinarily high activity for CO
hydrogenation to methanol. Typical precursor alloys were prepared by
melting Cu with Ce or La. Methanol synthesis over Cu-La catalysts was
observed at temperatures as low as 100°C.
- Supported platinum group VIII metals – Catalysts containing Pd can produce
sizeable amounts of methanol when operated under conditions where
methanol is thermodynamically stable. Of the platinum group metals, rhodium

24 Introduction
catalysts have received most attention. Supported rhodium catalysts
containing large amounts of molybdenum are particularly active. While
selectivity towards alcohols is enhanced by molybdenum additions to about
60 % alcohols and 40 % hydrocarbons at 250°C such selectivity is not
attractive commercially.
1.3.2. Reaction mechanism
The methanol synthesis reaction has been the subject of many mechanistic
studies since the process was first introduced. Bridger and Spencer in a detailed
analysis, reported in the Catalyst Handbook7, show how the results of many
studies are often conflicting due to the properties of different type of catalysts
(which often depend on details of preparation), to the different bulk phases
present in the operating catalyst (varying with process conditions), to the reaction
conditions and poisons.
All industrial plants operate with CO/CO2/H2 mixtures and it is not obvious which
carbon oxide is the source of methanol. In most studies, it was concluded or
assumed that adsorption of carbon monoxide is the starting point, but also
evidence has been obtained indicating that methanol is synthesized directly from
carbon dioxide. Certainly, the presence of CO2 in the reacting gas has a market
effect in increasing reaction rate, and the effect is reversible, even if it was found
also that using a zinc/chromia catalyst the carbon dioxide decrease the synthesis
rate.
On Cu/Zn/Al2O3 catalysts, the role of carbon dioxide on the methanol synthesis
reaction is very important19, 22. It was observed that the optimal loading of carbon
dioxide depends upon the operating temperature. The reactions describing the
methanol synthesis over Cu/Zn/Al2O3 catalyst primarily involve the CO2
hydrogenation reaction and the forward water gas shift reaction:
CO2 + 3 H2 CH3OH + H2O
CO + H2O CO2 + H2
The CO2 concentration in the syngas feedstock is very important to the right
balance of the two reactions. If the CO2 concentration is too high, the direction of
the WGS reaction is reversed and carbon dioxide is competitively consumed in
both the reactions. If the CO2 concentration is too low, the potential for carbon
Catalysts for H2 production 25
deposition and the reduction of catalyst oxides is increased, thereby increasing
the catalyst deactivation. The catalytic activity drops significantly and
progressively when it is exposed to a CO2-free syngas feed. The catalyst
deactivates in absence of carbon dioxide19,15.
For what concern the state of the active metals in a working catalyst, it was
demonstrated that the catalyst surface is in a dynamic state.
The support oxides play a minor role in the reaction mechanism, but it has been
observed that the coverage of adsorbed oxygen varies with different support
oxides.
A surface formate is the pivotal intermediate over both zinc oxide and supported
copper catalysts. Surface formate is made by the hydrogenation of adsorbed
carbon dioxide, and the rate determining step in methanol synthesis appears to
be hydrogenolysis of the formate intermediate first to methoxy and then to
methanol. The remaining adsorbed oxygen is removed by carbon monoxide or
hydrogen, depending on the reaction conditions, to give CO2 or H2O. The
concurrent water gas shift reaction probably occurs via adsorbed oxygen rather
than formate intermediate:
H2 2 H (ads)
CO2 CO2 (ads)
CO2 (ads) + H (ads) HCOO (ads)
2 H (ads) + HCOO (ads) CH3O (ads) + O (ads)
H (ads) + CH3O (ads) CH3OH
H2O H2 + O (ads)
O (ads) + CO CO2
The active sites are on the surface of the copper metal crystallites. The surface of
copper is mobile under reaction conditions and it is partially covered by a mobile
layer of adsorbed oxygen. Adsorbed hydrogen mostly is present on the
uncovered copper metal (even if requiring O(ads) for adsorption), whereas carbon
dioxide adsorbs on the oxidized surface. Thus, the site of reaction consists of
bare copper metal atoms next to an oxide surface site, i.e. a Cu(0)/Cu(I) site, but
this occur in different parts of the surface as the reaction proceeds.
The mechanism of the synthesis of methanol on copper catalysts from CO2-free
gas mixtures is not well understood. Formate intermediates, made from residual
O(ads), may be involved again or successive additions of H(ads) to adsorbed carbon
monoxide may give first adsorbed methoxy and then methanol.
26 Introduction
1.3.3. Methanol plants
Although the chemistry of methanol manufacture is simple, CO + 2 H2 CH3OH,
several process steps are required for a modern plant for methanol production23.
Conversion of syngas to methanol per pass in present commercial operation is
limited to 25 vol. % or less by thermodynamic restrictions, even with modern
catalysts and plant design, costly recycle is required23.
Synthesis gas of an appropriate composition (ideally: pH2 = 2 pCO + 3 pCO2) is
supplied to the loop and circulated continuously, so that unreacted gas is
recycled over the catalyst. From the converter the gas passes to a condenser,
which removes the crude methanol liquor, and then to the circulator, which takes
the gas back to the converter. Fresh “make-up gas” is supplied continuously to
maintain the pressure in the loop as the synthesis proceeds. This gas always
departs from the ideal composition to some degree: methane and other inert
gases are present and frequently there is excess hydrogen, depending on the
feedstock and processes used to manufacture the make-up gas. To prevent
these gases from building up in the loop and diluting the reactants, a continuous
purge is taken off. Depending on process economics, the purge may be used as
fuel for the reformer or it gives a supply of hydrogen after passage through a
pressure swing adsorption unit.
The crude methanol is distilled to separate the methanol from water and
impurities such as higher alcohols, ethers, etc., that are present in low
concentrations.
The use of low conversion per pass together with the recycling of the unreacted
gas around the loop facilitates the control of temperature in the catalyst bed.
Nevertheless, the highly exothermic nature of the reaction requires the use of
special reactor designs.
Part of the circulating gas is preheated and fed to the inlet of the reactor. The
remainder is used as quench gas and is admitted to the catalyst bed through
lozenge distributors in order to control bed temperatures. Temperature control
within the catalyst bed can also be achieved using tube-cooled or steam raising
reactor designs. The tube-cooled reactor combines a lower capital cost than the
quench reactor with simplicity of operation and very flexible design. Circulating
gas is pre-heated by passing it through tubes in the catalyst bed. This removes
the heat of reaction from the catalyst bed. Temperature control is achieved by
Catalysts for H2 production 27
using a gas bypass around the catalyst bed and by controlling heat recovery in a
feed-effluent heat exchanger immediately downstream. Two configurations are
possible with the steam-raising type of reactor. The catalyst may be contained
within the tubes of a shell-and-tube heat exchanger, with boiling water acting as
coolant on the shell side. Alternatively, the catalyst may be contained within the
shell with boiling water in the tubes, and this arrangement is similar to that used
in the tube-cooled reactor design, as in both reactors the catalyst bed is cooled
by fluid flow through tubes in the bed. Since the design with catalyst on the shell
side allows the heat transfer surface area to be reduced to as little as one-
seventh that of the design with catalyst in the tubes, the former is the preferred
configuration.
In the ICI steam-raising reactor design, circulating gas enters through a vertical
distribution plate and flows transversely across the catalyst bed. This allows the
steam coils to be placed asymmetrically within the catalyst bed, so optimizing
heat removal, and giving a small pressure drop. In plants based on natural gas,
steam-raising reactors are less efficient at recovering the heat of reaction than
quench or tube-cooled designs. This is because heat can be recovered into boiler
feed water from the quench or tube-cooled designs, which can then be used to
generate high pressure rather than intermediate-pressure steam7.
Chem Systems first developed the liquid phase methanol synthesis process
(LPMeOHTM) in the late 1970s19,23. The novel feature of this technology is that
methanol is derived from synthesis gas over a finely powdered commercial
Cu/Zn/Al2O3 catalyst dispersed in an inert liquid. The slurry phase operation
facilitates easy heat removal, thus enabling isothermal conditions in the reactor
system. High agitation rates in the reactor provide for a reaction environment
without temperature and concentration gradients. The salient features of the
liquid phase process are:
(i) use of CO rich gas;
(ii) enhanced heat transfer of exothermic heat;
(iii) high once-through conversion of syngas.
The liquid acts as a heat sink and, by making possible efficient heat exchange,
limits temperature increase. The catalyst size must be 1-10 µm and need in situ
activation.
28 Introduction
1.4. Dimethyl ether synthesis
Dimethyl ether (DME) is an alternative fuel that could potentially replace
petroleum-based fuels24. Dimethyl ether is the simplest ether (CH3OCH3). The
physical properties of DME are similar to those of liquefied petroleum gases
(propane and butane). It burns with a visible blue flame and is non-peroxide
forming in the pure state or in aerosol formulations. Unlike methane, DME does
not require an odorant because it has a sweet ether-like odor. It is a volatile
organic compound, but is non-carcinogenic, non-teratogenic, non-mutagenic and
non-toxic24.
Currently, the major usage of DME is as a propellant in the aerosols industry. In
addition, it can be used as a clean-burning fuel in diesel engines, as a household
fuel (LPG alternative) for heating and cooking, as a fuel for gas and turbines in
power generation, as a fuel for fuel cells, and as a chemical feedstock for higher
ethers and oxygenates19,25.
Traditionally, DME has been produced in a two steps process where syngas is
first converted to methanol, followed by methanol dehydration to dimethyl ether.
CO + 2 H2 CH3OH ∆H°298K = - 90.6 kJ mol-1
2 CH3OH CH3OCH3 + H2O ∆H°298K = + 23.4 kJ mol-1
H2O + CO H2 + CO2 ∆H°298K = - 41.2 kJ mol-1
Net reaction:
3 CO + 3 H2 CH3OCH3 + CO2 ∆H°298K = + 258.6 kJ mol-1
Natural gas is not the only resource that can be used to generate syngas, coal
and biomass can also be used. Hence, DME production is not limited to one
feedstock and the price of DME synthesis process is directly related to the price
of the feedstock. New processes are being commercialized to produce DME in a
single step via autothermal reactors and slurry phase reactors.
DME can be introduced and exploited with existing technologies, and enable the
eventual implementation of advanced technologies, such as fuel cells. Because
DME is produced from natural gas, coal or biomass, it can increase the energy
security by displacing petroleum derived fuels.
Catalysts for H2 production 29
The prominent advantages of DME as a fuel and energy carrier are24:
─ DME, due to its high cetane number26, can be used in the most efficient
engine technology currently produced. DME demonstrated lower NOx and
SOx than conventional diesel, is sootless27.
─ Using exiting engine technology, DME produces the least amount of well-to-
wheel greenhouse gas emissions compared to FT diesel, FT naptha, bio-
diesel, bio-naptha, methanol, methane and ethanol.
─ Excluding natural gas, DME has the highest well-to-wheel efficiency of all
non-petroleum based fuels using conventional, hybrid and fuel processor fuel
cell vehicle technologies.
─ DME can be used as a residential fuel for heating and cooking.
─ On-board automotive fuel processors using methanol and DME exhibit the
lowest start-up energies and the lowest fuel processor volumes – correlating
to higher overall efficiencies as compared to ethanol, methane and gasoline
fuel processor fuel cell vehicles.
─ The infrastructure of DME is less cost intensive than that for hydrogen
because DME can use the existing LPG and natural gas infrastructures for
transport and storage.
Synthesis of DME from syngas in a single step is more favorable in
thermodynamic and economical26,25.
Single-stage DME synthesis in the vapor phase suffers from low per pass
conversions23, due, in part, by the effects of high temperature on the catalysts.
Gas-phase DME synthesis processes, in general, suffer from the drawbacks of
low hydrogen and CO conversions per pass, along with low yield and selectivity
of DME, coupled with a high yield of carbon dioxide. These processes are
typically expensive due to high capital costs for reactors and heat exchangers,
and high operating costs due to inefficient CO utilization and high recycle rates.
Using an inert liquid as a heat sink for highly exothermic reactions offers a
number opportunities in syngas processing. Heat generated by the exothermic
reactions is readily accommodated by the inert liquid medium. This enables the
reaction to be run isothermally; minimizing catalyst deactivation commonly
associated with the more adiabatic gas phase technologies19.
The single stage, liquid phase DME synthesis process, investigated in detail,
incorporates the sequential reaction of methanol synthesis and methanol
30 Introduction
dehydration in a slurry phase reactor system. Combining these reversible
reactions in a single step makes each reaction thermodynamically more favorable
by utilizing its inhibiting products as reactants in the subsequent reaction. In
addition to the superior heat management allowed by the liquid phase operation,
the synergistic effect of these reactions occurring together yields higher quantities
of DME than that could be obtained from sequential processing.
The process is based on dual-catalytic synthesis in a single reactor stage, and
based on a combination of an equilibrium limited reaction (methanol synthesis)
and an equilibrium unlimited reaction (methanol dehydration). The methanol
synthesis and the water gas shift reaction take place over the coprecipitated
Cu/Zn/Al2O3 catalyst and the methanol dehydration takes place over γ- Al2O3 or
zeolite26,25,27 catalysts. Moreover, by varying the mass ratios of methanol
synthesis catalyst, it is possible to co-produce DME and methanol in any fixed
proportion, from 5 % DME to 95 % DME19.
Catalysts for H2 production 31
1.5. Fischer-Tropsch synthesis
The growing reliance on imported oil gave the synthetic fuels a fresh impetus in
the 1980s28,23. The Fischer-Tropsch synthesis (FTS) is the exothermic reaction of
carbon monoxide and hydrogen to mainly hydrocarbons together with water and
carbon dioxide. It can be represented by the following reaction equation:
n CO + (2n +1) H2 → CnH2n+2 + n H2O
Sabatier was the first to react carbon monoxide and hydrogen over a nickel
catalyst in 1902. The result was the production of methane and water. Then, in
1923 Franz Fischer and Hans Tropsch of the Kaiser Wilhelm Institute (Germany)
developed the Fischer-Tropsch process (i.e. Synthol process), in which a carbon
monoxide and hydrogen flow, in the presence of iron, cobalt or nickel catalyst at
180-250°C and at pressures from atmospheric to 150 bar, produced a mixture of
straight hydrocarbons and smaller amounts of oxygenates. The initial objective of
this process was gasoline production. Experience at high and medium reactor
pressures was disappointing from an unacceptably high oxygenate product
content point of view. Hence, it was adopted an atmospheric reactor pressure.
Cobalt became strongly favored as catalytic element, since iron was less active
and deactivated rapidly at atmospheric pressure synthesis operation, while nickel
gave high methane selectivity and was affected by its loss due to volatile nickel
tetracarbonyls production29, 30.
The best catalyst was found to be based on cobalt, supported on Kieselguhr with
thoria and magnesium oxide as promoters (100g Co / 5g ThO / 8g MgO / 200g
Kieselguhr).
In recent years, we assist to a second renewal of interest in the F-T process for
producing liquid hydrocarbons. This new interest centers on making synthetic
fuels from natural gas instead of coal.
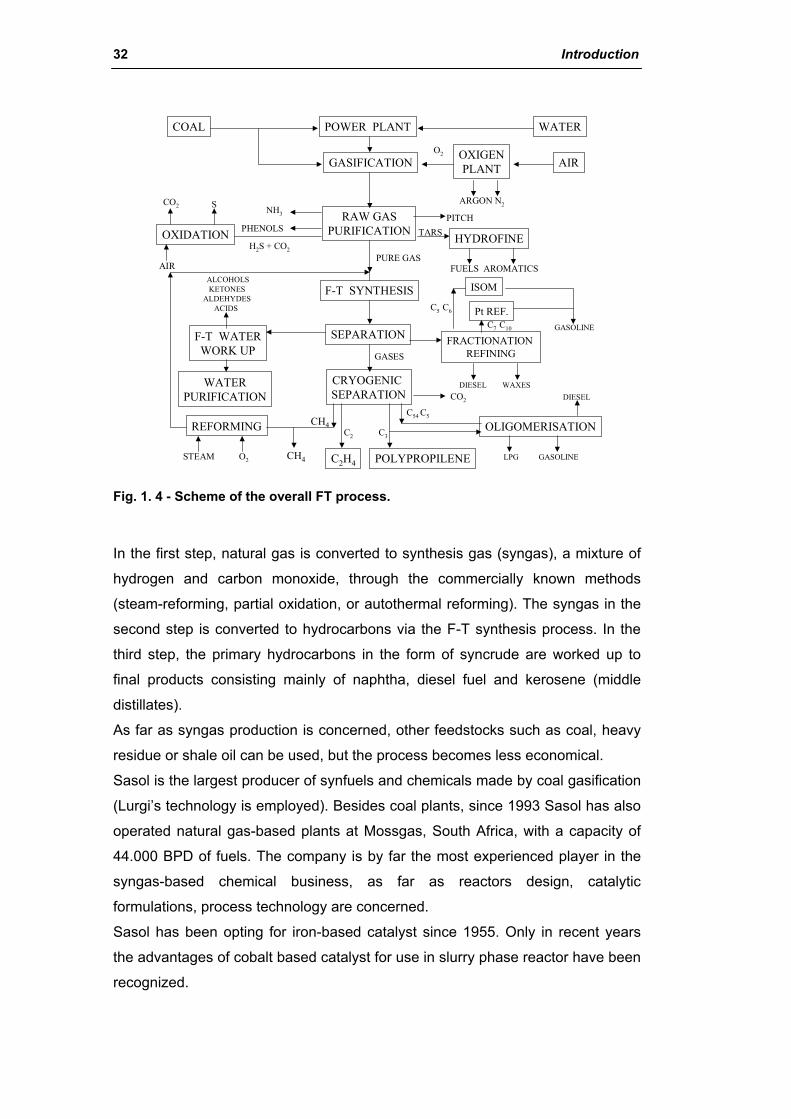
The process of converting natural gas or coal into marketable liquid hydrocarbons
comprises three main elements: 1) synthesis gas production, 2) hydrocarbon
synthesis via the F-T conversion process, 3) products work-up (Fig. 1. 4).
32 Introduction
COAL POWER PLANT WATER
GASIFICATIONOXIGENPLANT AIR
ARGON N2
O2
RAW GASPURIFICATION
NH3
PHENOLSPITCH
TARS HYDROFINE
FUELS AROMATICS
OXIDATION
CO2 S
AIR
H2S + CO2PURE GAS
F-T SYNTHESIS
SEPARATION
CRYOGENIC SEPARATION
F-T WATERWORK UP
ALCOHOLSKETONES
ALDEHYDESACIDS
WATERPURIFICATION
FRACTIONATION REFINING
ISOM
GASOLINE
Pt REF.C5 C6
C7 C10
DIESEL WAXES CO2
CH4REFORMING
O2STEAM CH4 C2H4
C2 C3
C54 C5
POLYPROPILENE
OLIGOMERISATION
GASOLINE
DIESEL
LPG
GASES
Fig. 1. 4 - Scheme of the overall FT process.
In the first step, natural gas is converted to synthesis gas (syngas), a mixture of
hydrogen and carbon monoxide, through the commercially known methods
(steam-reforming, partial oxidation, or autothermal reforming). The syngas in the
second step is converted to hydrocarbons via the F-T synthesis process. In the
third step, the primary hydrocarbons in the form of syncrude are worked up to
final products consisting mainly of naphtha, diesel fuel and kerosene (middle
distillates).
As far as syngas production is concerned, other feedstocks such as coal, heavy
residue or shale oil can be used, but the process becomes less economical.
Sasol is the largest producer of synfuels and chemicals made by coal gasification
(Lurgi’s technology is employed). Besides coal plants, since 1993 Sasol has also
operated natural gas-based plants at Mossgas, South Africa, with a capacity of
44.000 BPD of fuels. The company is by far the most experienced player in the
syngas-based chemical business, as far as reactors design, catalytic
formulations, process technology are concerned.
Sasol has been opting for iron-based catalyst since 1955. Only in recent years
the advantages of cobalt based catalyst for use in slurry phase reactor have been
recognized.
Catalysts for H2 production 33
For the preparation of Synthol catalyst, Sasol uses iron oxides: the suitable iron
oxide is fused together with the required chemical and structural promoters. The
fused ingots are milled to a specified particle size range (for optimum fluidization
properties). The catalyst is pre-reduced with H2 at about 400°C and then loaded
in the F-T reactors. Because of the simplicity of the preparation and the low cost
of the row materials, the cost of Synthol catalyst is a minor part of the overall
process31.
The catalyst used in the fixed bed process is more expensive as it is prepared by
wet chemical means. Iron oxide is precipitated by adding an alkaline solution to
an iron nitrate solution. The precipitate is washed, re-slurried, silica based
support and promoters added and the gel is then extruded. The surface area and
pore size distribution of this catalyst is largely determined by the conditions used
in the initial iron oxide precipitation step, these effects, such as precipitation time,
temperature, order of addition etc., have been quantified. Because of the high
surface area and the presence of reduction promoters (i.e. Cu), the catalyst is
pre-reduced under mild condition and then coated with wax to prevent re-
oxidation30, 31.
The advantages of iron are the following:
1. it is the cheapest metal to use,
2. it has a higher selectivity to olefins,
3. it is an active water-gas shift catalyst.
The latter is important since feed gases with H2/CO ratio below 2 can be utilized
directly. A disadvantage of iron is that it deactivates faster than cobalt due to
oxidation and coke deposition.
Studies performed at Sasol on the commercial spray dried precipitated iron
catalyst and Co/Al2O3 slurry phase FTS catalyst, resulted in the following
conclusions:
1. the cobalt does not show any significant water-gas-shift activity and no water
inhibition of the F-T reaction rate,
2. the cobalt catalyst is the preferred option if high per pass conversions are
required,
3. desired stabilized intrinsic activity levels can be achieved with cobalt catalyst,
implying that extended slurry phase synthesis runs can be realized,
4. cobalt derived hydrocarbon product selectivities show greater sensitivity
towards process conditions (i.e. reactor pressure) than that of iron. Iron catalyst,
34 Introduction
on the other hand, shows marked sensitivity towards chemical promotion. Indeed,
the geometric tailoring of pre-shaped support materials can be an optimization
tool for effecting increased wax selectivities with cobalt based catalyst, an
approach also suggested by others (Exxon, Shell).
The conversion of synthesis gas to hydrocarbons (Fischer-Tropsch synthesis)
has been widely studied and extensively described. A number of synthesis
reactions can occur and the whole are quite exothermic, ∆H = -170 kJ (C atom-1):
Methanation: CO + 3 H2 CH4 + H2O
Paraffins: n CO + (2n + 1) H2 CnH2n+2 + n H2O
Olefins: n CO + 2n H2 CnH2n + n H2O
Alcohols: n CO + 2n H2 CnH2n+1OH + (n-1) H2O
Some other reactions, such as the water-gas shift or Boudouard reaction also
occur:
WGS: CO + H2O CO2 + H2
Boudouard: 2 CO C(s) + CO2
The free energy changes (∆G°) in the above reactions are such that the
hydrocarbon synthesis is normally favored below about 400°C. Over the
temperature range of 200-400°C, the formation of methane is favored. However,
since the thermodynamic equilibrium is reached slowly in FT synthesis, it is
possible to take advantage of kinetic factors by using suitable catalysts, so that
heavier hydrocarbons or alcohols are produced in suitable quantity28.
The production of hydrocarbons using traditional FT catalysts, such as Fe or Co,
is governed by chain growth or polymerization kinetics. The so-called “surface
carbide” mechanism is a plausible one for the interaction of CO and H2 with the
catalytic surface and the subsequent synthesis of hydrocarbons. Ample evidence
shows that this is the prevalent mode of activation of CO at elevated
temperatures on the Group VIII metal catalysts Fe, Co, Ni and Ru23,28. The model
can be used as a starting point for understanding the formation of various
molecular species during FT synthesis and also for examining hydrocarbon chain
growth28.
The process is only provided to indicate how chain growth can occur. Several
models of chain growth have been discussed in the literature: repeated carbon
insertion as indicated above results in chain growth. As a certain stage of chain
growth, the hydrocarbon species is desorbed. If an unsatured surface species is
Catalysts for H2 production 35
desorbed, one obtains an olefinic product. Desorption after hydrogenation results
in paraffin species. In some instances, CO insertion into the metal-alkyl bond and
subsequent desorption results in an oxygenated species, such as an alcohol. The
nature of the product and the product distribution among the carbon numbers will
depend upon the catalyst surface, composition (H2/CO ratio) and the rate of flow
feed gas, reaction pressure and the temperature at which FT synthesis is
performed. The above parameters will affect the rate of hydrogen and CO
dissociation, hydrogenation, degree of polymerization and desorption of the
product species28.
At low temperatures, the main primary products are linear 1-alkenes, alkanes,
alcohols and aldehydes. The linearity of the product is important for many of their
applications. It gives the waxes with high melting point and low viscosity.
The C9 to C15 olefins are ideal for the manufacture of biodegradable detergents.
The C10 to C18 cut is an excellent diesel fuel (with the high cetane number of 75
and zero aromatics). On the other hand, the product linearity is a disadvantage
for gasoline production, since a high octane number requires branched alkane
and aromatics. Hence, the gasoline requires extensive isomerization and
aromatization.
At higher synthesis temperatures secondary reactions occur, i.e branched
hydrocarbons and aromatics are formed. In that way, the diesel cetane number
decreases, while the gasoline octane number increases. Olefins in the
hydrocarbons reach a maximum at C3 or C4 (up to 90 %), to then decrease
continuously, the waxes being essentially paraffinic30.
1.5.1. FT synthesis catalysts
Most Group VIII metals have significant CO hydrogenation activity, being the
product distribution the distinguishing feature. The specific activity of various
Group VIII metals was determined: Ru > Fe > Ni > Co > Rh > Pd > Pt, while the
average hydrocarbon molecular weight decreased in the order: Ru > Fe > Co >
Rh > Ni > Ir > Pt > Pd.
The catalysts that were active for F-T synthesis were compared in order to
identify common properties32. It was found that:
- they are active for hydrogenation reactions
- they are capable for metal carbonyl formation
36 Introduction
- the F-T reaction conditions (T, P) are not far from those where thermodynamics
would allow the metals to be converted into metal carbonyl.
From the latter observation, it was suggested that ‘surface carbonyls’ play an
essential mechanistic role in the formation of hydrocarbons.
Iron and cobalt are the only metals used until now for industrial application. Nickel
tends to form volatile nickel carbonyl at elevated pressure and is most selective
for methane relative to Co, Fe and Ru catalysts. Ruthenium is the most active F-
T catalyst, working at the lowest reaction temperature of about 150°C, and it is
selective towards high molecular weight products. However, it is most active in
the pure form, i. e. supports and/or promoters appear to have no beneficial effect.
Even under conditions favorable for high wax yields, Ru tends to have high
methane selectivity. Ruthenium has a high potential as catalyst for converting
synthesis gas to a variety of hydrocarbons, but its high price and limited world
resources exclude possible industrial application.
Other Group VIII metals, namely Rh, Re, Os, Pd, Pt and Ir, yield mostly
oxygenated compounds partly because CO does not chemisorb dissociatively on
these metals. Mo is not a Group VIII metal, but it exhibits moderate F-T activity
and its nitride and carbide show excellent alkene synthesis rate. It is attractive
because of its sulphur-resistant characteristics33, 30.
Iron catalysts are commonly used because of their low costs. They have a high
selectivity to olefins and a high water-gas shift activity. The latter aspect is
important since it means that CO2 can also be hydrogenated to hydrocarbons
and that feed gases with H2/CO ratios below 2 can be utilized directly. A
disadvantage of Fe is that it deactivates faster due to oxidation and coke
deposition. In fact, metallic iron is extremely active for the F-T reaction but it is
not thermodynamically stable under F-T conditions and is rapidly converted to
more stable, but less active, iron carbides. With time, the carbides are also slowly
oxidized by water vapor to inert magnetite. Another factor that contributes to
deactivation is poisoning by S-containing compounds such as H2S. Poisoning by
chemisorbed S is permanent. Chlorine, although to a lesser extent, also
deactivates iron catalysts.
Cobalt catalysts do not oxidize or carburize under normal F-T conditions and
because of this should deactivate less rapidly than iron catalysts. Co catalysts
can give high yields of liquid hydrocarbons and waxes but under similar
conditions the methane yields are usually higher and the olefin yields are lower
Catalysts for H2 production 37
than for iron catalysts, i.e. they are more hydrogenating. The yields of
oxygenated compounds are lower for cobalt catalysts and this can be an
advantage if they are not desired.
The relatively high cost of Co makes of fundamental importance its distribution on
suitable supports (i.e. Al2O3, TiO2, SiO2). The activity of supported Co catalysts
increases linearly with loading in the range 5 to 30 mass % Co and so a
compromise between cost and activity has to be made. Under F-T conditions, Co
is a poor water gas shift catalyst and so the feed gas needs to be adjusted to
about 2, as required by the stoichiometry of the F-T reaction. Poisoning by S-
containing compounds causes the permanent deactivation of cobalt-based
catalysts. Cobalt is the most widely Group VIII used in natural gas-to-liquids
research project.
F-T catalysts are often prepared by precipitation, impregnation, ion exchange,
and synthesis from organometallic compounds and vapor phase deposition in
which the metal precursor is loaded onto the support surface. This is then
followed by drying, calcination and catalyst activation (via reduction of the metal
precursor to generate the metallic phase). The interplay of catalyst composition
and preparation conditions determines the activity and selectivity behavior for a
given set of process parameters. The selection of the ‘best’ catalyst is the most
crucial step in F-T technology.
1.5.2. Thermodynamics and reaction mechanism
The Fischer-Tropsch synthesis is a highly exothermic reaction:
n CO + (2n +1) H2 → CnH2n+2 + n H2O ∆H° ≅ - 40 kcal/mol
n CO + 2n H2 → CnH2n + n H2O ∆H° ≅ - 35 kcal/mol
n CO + 2n H2 → CnH2n+1 OH + (n-1) H2O ∆H° ≅ - 35 kcal/mol
Thermodynamically, the formation of methane and other hydrocarbons is
energetically favorable, that means negative Gibbs energy. For example, ∆G°
values at 227°C for the formation of ethane and propane are -29.2 and -37.3
kcal/mol respectively, while at 200°C ∆H° values for the formation of methane,
ethane and propane are about -50, -42, and -29 kcal/mol, so confirming the
exothermic nature of the process.
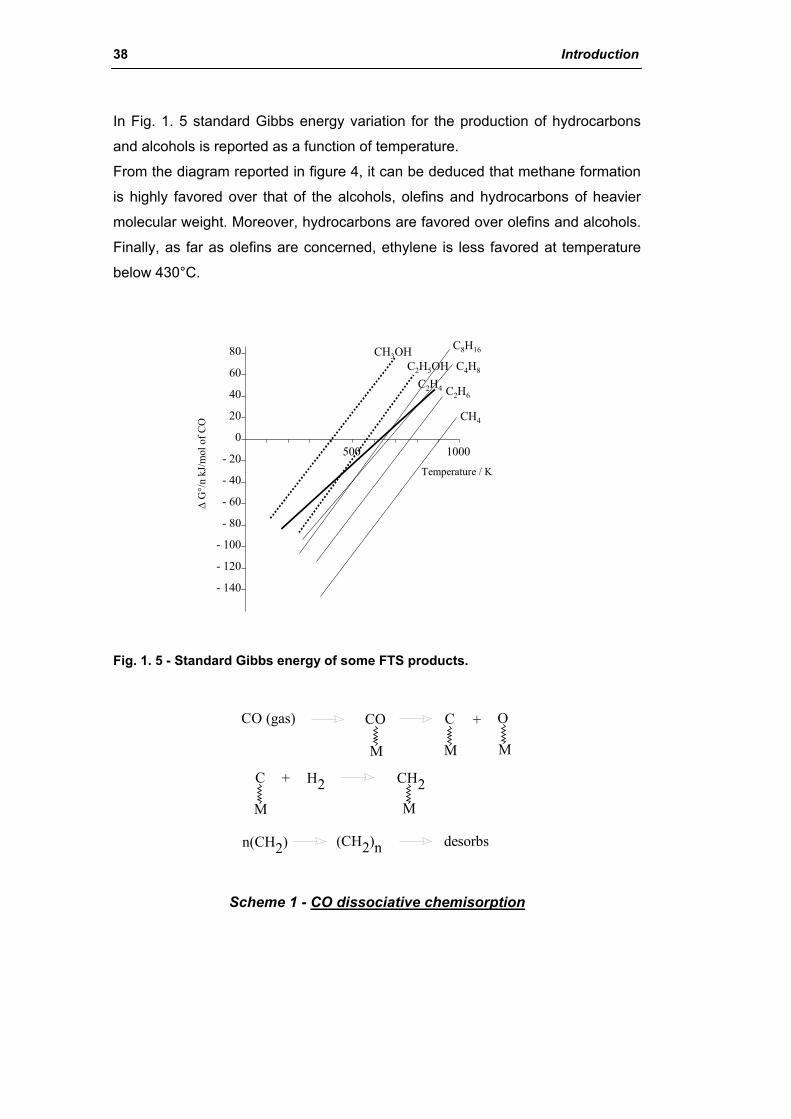
38 Introduction
In Fig. 1. 5 standard Gibbs energy variation for the production of hydrocarbons
and alcohols is reported as a function of temperature.
From the diagram reported in figure 4, it can be deduced that methane formation
is highly favored over that of the alcohols, olefins and hydrocarbons of heavier
molecular weight. Moreover, hydrocarbons are favored over olefins and alcohols.
Finally, as far as olefins are concerned, ethylene is less favored at temperature
below 430°C.
0
80
60
40
20
- 20
- 40
- 60
- 80
- 100
- 120
- 140
500 1000
Temperature / K
∆G
°/n
kJ/m
ol o
f CO
CH3OHC2H5OH
CH4
C2H6C2H4
C8H16
C4H8
Fig. 1. 5 - Standard Gibbs energy of some FTS products.
CO (gas) CO C O
M M M
+
C +
M
H2 CH2M
n(CH2) (CH2)n desorbs
Scheme 1 - CO dissociative chemisorption
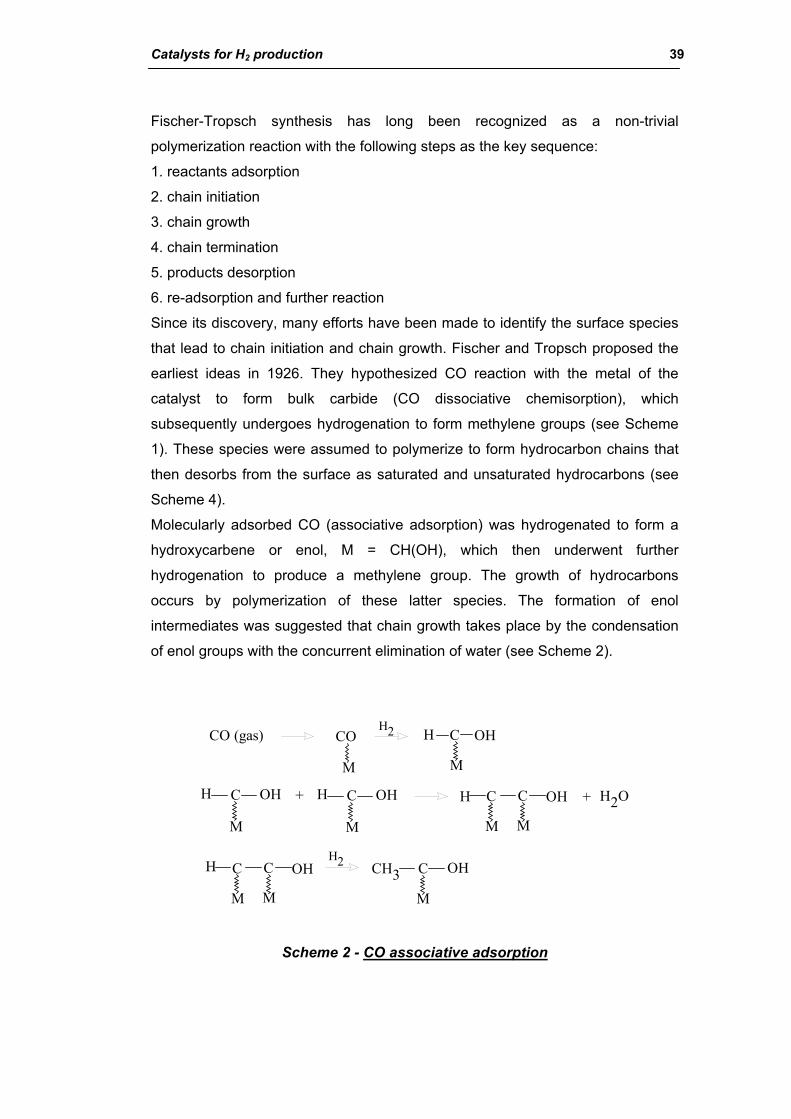
Catalysts for H2 production 39
Fischer-Tropsch synthesis has long been recognized as a non-trivial
polymerization reaction with the following steps as the key sequence:
1. reactants adsorption
2. chain initiation
3. chain growth
4. chain termination
5. products desorption
6. re-adsorption and further reaction
Since its discovery, many efforts have been made to identify the surface species
that lead to chain initiation and chain growth. Fischer and Tropsch proposed the
earliest ideas in 1926. They hypothesized CO reaction with the metal of the
catalyst to form bulk carbide (CO dissociative chemisorption), which
subsequently undergoes hydrogenation to form methylene groups (see Scheme
1). These species were assumed to polymerize to form hydrocarbon chains that
then desorbs from the surface as saturated and unsaturated hydrocarbons (see
Scheme 4).
Molecularly adsorbed CO (associative adsorption) was hydrogenated to form a
hydroxycarbene or enol, M = CH(OH), which then underwent further
hydrogenation to produce a methylene group. The growth of hydrocarbons
occurs by polymerization of these latter species. The formation of enol
intermediates was suggested that chain growth takes place by the condensation
of enol groups with the concurrent elimination of water (see Scheme 2).
CO (gas) CO C OH
M M
C +
M
H2
C
M
H2O
H
OHH C
M
OHH C
M
OHH +
C
M
C OHH
M
H2 C OH
M
CH3
Scheme 2 - CO associative adsorption

40 Introduction
Another mechanism for chain growth was proposed: molecular CO was
postulated to insert into the metal-carbon bond of an adsorbed alkyl species.
Hydrogenation of the resulting acyl group was assumed to produce water and a
new alkyl group containing an additional methylene unit. The chain is initiated by
methyl groups formed by stepwise hydrogenation of molecularly adsorbed CO
(see Scheme 3).
CO C
M MM
+H +
M
H2H2
M
H2OCH3O
R CO
M
+ C=O
M
R2H2 CH2
M
R
+ H2O
Scheme 3 - Undissociated CO insertion
In Scheme 4 the three different proposals are resumed and a global view of chain
growth and chain termination to various types of products is given.
The mechanism proposed by Fischer (‘carbide’ theory) did not explain the
production of relatively large amounts of oxygenated products, i.e. alcohols.
Mechanisms described by the Schemes 2 and 3, explained the formation of
oxygenated products, nevertheless recent experimental evidence indicated the
mechanism of Scheme 1 is possible.
In drawing Scheme 4, it was suggested that non-oxygenated, rather than
oxygenated, intermediates play a dominant role in the synthesis of hydrocarbons
from CO and H2. Moreover, results obtained from the fields of surface science,
organometallic chemistry, and catalysis strongly support that hydrocarbon
synthesis is initiated by the dissociation of CO30.
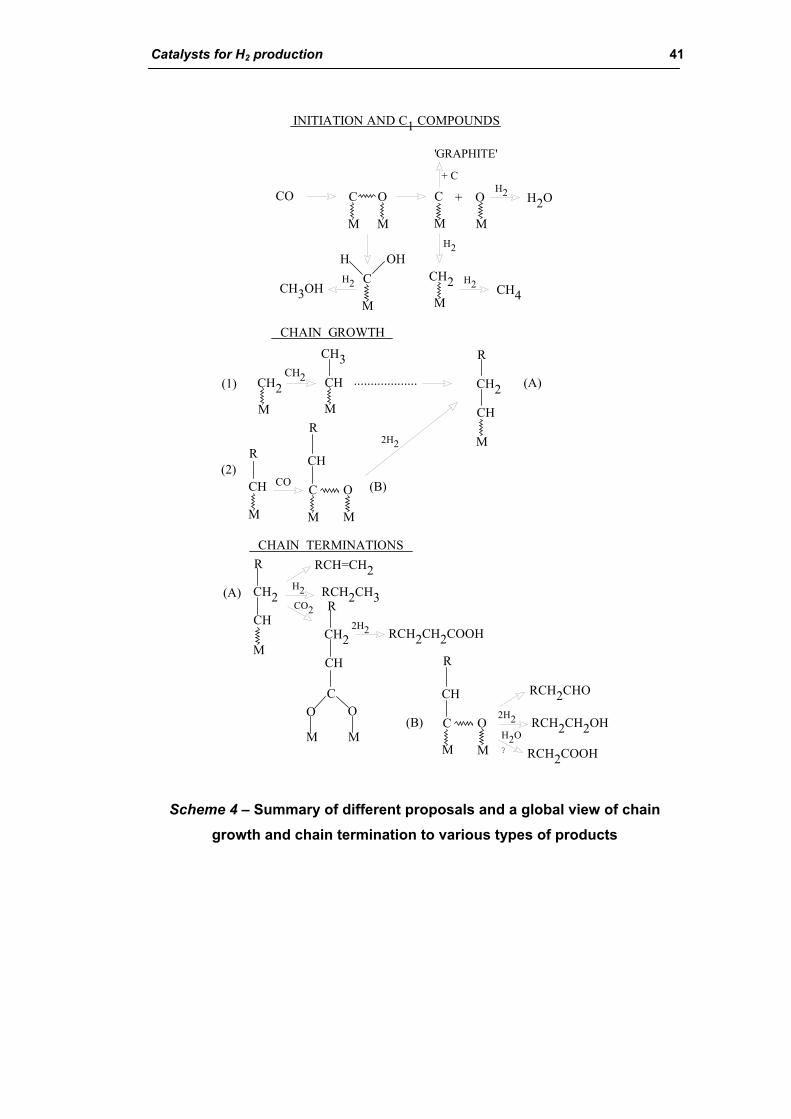
Catalysts for H2 production 41
CO C O C O
M M M
+
C
M
H2
CH2M
CH3OH
H2O
INITIATION AND C1 COMPOUNDS
M
+ C
'GRAPHITE'
OHHH2
H2
H2 CH4
(1) CH ...................
M M
M
C
M
R
M
CH
CH2
CHAIN GROWTH
O
CH
2H2
CH3
CH2CH2
CH
R
(A)
(2) (B) CO
M
R
CHAIN TERMINATIONS
(A)
M
CH2
CH
R RCH=CH2H2CO2
RCH2CH3
CH
R
CH2
CO O
MM
2H2 RCH2CH2COOH
C
M
R
M
O
CH
(B) 2H2H2O?
RCH2CH2OH
RCH2CHO
RCH2COOH
Scheme 4 – Summary of different proposals and a global view of chain growth and chain termination to various types of products

42 Introduction
1.5.3. FT synthesis plants Sasol is the largest producer of synfuels and chemicals made by coal
gasification. Besides coal plants, since 1993 Sasol has also operated natural
gas-based plants at Mossgas, South Africa. The company is by far the most
experienced player in the syngas-based chemical business, as far as reactors
design, catalytic formulations, process technology are concerned.
Since 1955, Sasol has operated with the Fischer-Tropsch synthesis at either low
temperatures (LTFT) to produce a syncrude with a large fraction of heavy, waxy
hydrocarbons, or at high temperatures (HTFT) to produce a light syncrude and
olefins. Until the nineties, two types of F-T reactors have been used, the tubular
fixed bed (TFB) reactor for LTFT and the circulating fluidized bed (CFB) reactor
for HTFT.
The TFB, also known as Arge reactor, has been in use at its Sasolburg plants in
South Africa for the production of wax since 1955. This type of reactor consists of
a shell containing 2050 tubes, 12 m long, 5 cm in internal diameter and operates
at a shell side temperature range of 220-250°C and a reactor pressure of 25 bar
for the earlier reactors and 45 bar for a reactor commissioned in 1987. It
produces heavy waxy hydrocarbons that are subsequently hydrocracked and/or
isomerized for diesel production (Fig. 1. 6-A).
The TFB reactor makes use of extruded on silica precipitated iron-based catalyst,
promoted with a small amount of potassium and packed into the tubes.
Syngas is passed downward through the catalyst bed and is converted to
hydrocarbons. The exothermic heat of the F-T reaction is removed through the
tube wall to produce steam on the shell side of the reactor. That gives rise to
axial and radial temperature profiles. For maximum reaction rates, a maximum
average temperature is required. This is limited however by the maximum
allowable temperature peak, which cannot be exceeded in order to prevent
catalyst deactivation and carbon formation on the catalyst. Carbon formation
causes break up of the catalyst with a consequent loss in conversion efficiency
and necessity to catalyst replacement.
Product selectivities are temperature dependent and flexibility with respect to
temperature control would be advantageous. The choice of temperature level is
however limited by the need to not exceed the maximum peak temperature.
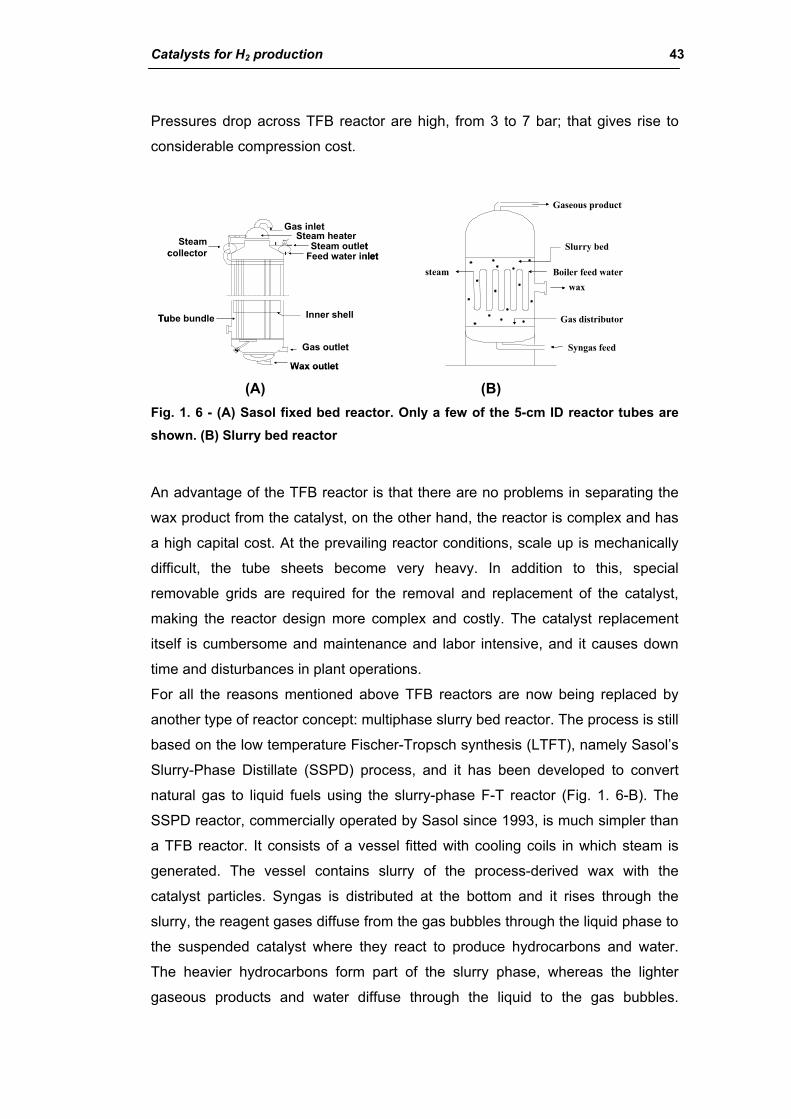
Catalysts for H2 production 43
Pressures drop across TFB reactor are high, from 3 to 7 bar; that gives rise to
considerable compression cost.
Gas inlet
Feed water inletSteam outlet
Steam heaterSteam collector
Inner shell
Gas outlet
Tube bundle
Wax outlet
Gas inlet
Feed water inletSteam outlet
Steam heaterSteam collector
Inner shell
Gas outlet
Tube bundle
Wax outlet
Syngas feed
Gas distributor
waxsteam Boiler feed water
Slurry bed
Gaseous product
Syngas feed
Gas distributor
waxsteam Boiler feed water
Slurry bed
Gaseous product
(A) (B) Fig. 1. 6 - (A) Sasol fixed bed reactor. Only a few of the 5-cm ID reactor tubes are shown. (B) Slurry bed reactor
An advantage of the TFB reactor is that there are no problems in separating the
wax product from the catalyst, on the other hand, the reactor is complex and has
a high capital cost. At the prevailing reactor conditions, scale up is mechanically
difficult, the tube sheets become very heavy. In addition to this, special
removable grids are required for the removal and replacement of the catalyst,
making the reactor design more complex and costly. The catalyst replacement
itself is cumbersome and maintenance and labor intensive, and it causes down
time and disturbances in plant operations.
For all the reasons mentioned above TFB reactors are now being replaced by
another type of reactor concept: multiphase slurry bed reactor. The process is still
based on the low temperature Fischer-Tropsch synthesis (LTFT), namely Sasol’s
Slurry-Phase Distillate (SSPD) process, and it has been developed to convert
natural gas to liquid fuels using the slurry-phase F-T reactor (Fig. 1. 6-B). The
SSPD reactor, commercially operated by Sasol since 1993, is much simpler than
a TFB reactor. It consists of a vessel fitted with cooling coils in which steam is
generated. The vessel contains slurry of the process-derived wax with the
catalyst particles. Syngas is distributed at the bottom and it rises through the
slurry, the reagent gases diffuse from the gas bubbles through the liquid phase to
the suspended catalyst where they react to produce hydrocarbons and water.
The heavier hydrocarbons form part of the slurry phase, whereas the lighter
gaseous products and water diffuse through the liquid to the gas bubbles.
44 Introduction
Gaseous products together with unreacted syngas pass through the slurry bed to
the freeboard above the bed and then to the gas outlet.
The main difficulty with the commercial application of the SSPD is the separation
of the wax product from the catalyst. This is especially true for the relatively
friable precipitated iron catalysts. Sasol has developed a proprietary solid-
separation technique. The catalyst particles are removed from the product liquid
hydrocarbons and returned into the process after reactivation. The heavy
hydrocarbons from SSPD reactor are hydrogenated and converted to specialty
waxes. These waxy hydrocarbons can easily be hydrocracked to excellent diesel
with a cetane number of more than 70. The products have a negligible aromatic
and a zero sulphur content. The waxy hydrocarbons, upon hydroisomerization,
give lube oils. In addition, the olefins obtained in the reactor are mainly straight-
chain α-olefin. These are commercially valuable products and can be used in the
manufacture of oxo-alcohols, lubrificants, and detergents or easily hydrogenated
to straight-chain paraffin. According to Sasol, the SSPD reactor is much simpler
in construction than the TFB reactor. The suspended cooling coils and the gas
distributor are cheaper than the tube and the tube-sheet arrangement. Scale-up
of a TFB reactor is difficult and is achieved by increasing the shell diameter and
the number of tubes. In the case of SSPD reactor, capacity can be increased by
increasing both diameter and height of the reactor, resulting in a significant
advantage in terms of economy of scale. In fact, the largest Arge TBF reactor has
been designed for about 1.500 BPD, while the present SSPD commercial reactor
has been designed for a capacity of about 2.500 BPD. A single SSPD reactor
with a capacity of at least 10.000 bbl is planned to be built.
What is more, the SSPD reactor gives much greater flexibility towards
temperature control, because the slurry phase is well mixed favoring isothermal
operation. Temperatures, on average, can be much higher than in a TFB reactor
without the danger of catalyst deactivation, carbon formation and break-up of
catalyst. A much better control of product selectivities becomes possible at higher
average conversions. This also makes the reactor ideal for higher activity
catalysts that, in the case of TFB reactor, add to problems of temperature
gradients and peaks.
The pressure drop across the bed is practically that of the static hydraulic head
and is much lower than the pressure drop for the TFB reactor. That implies
considerable savings in recompression costs where recycle is required.
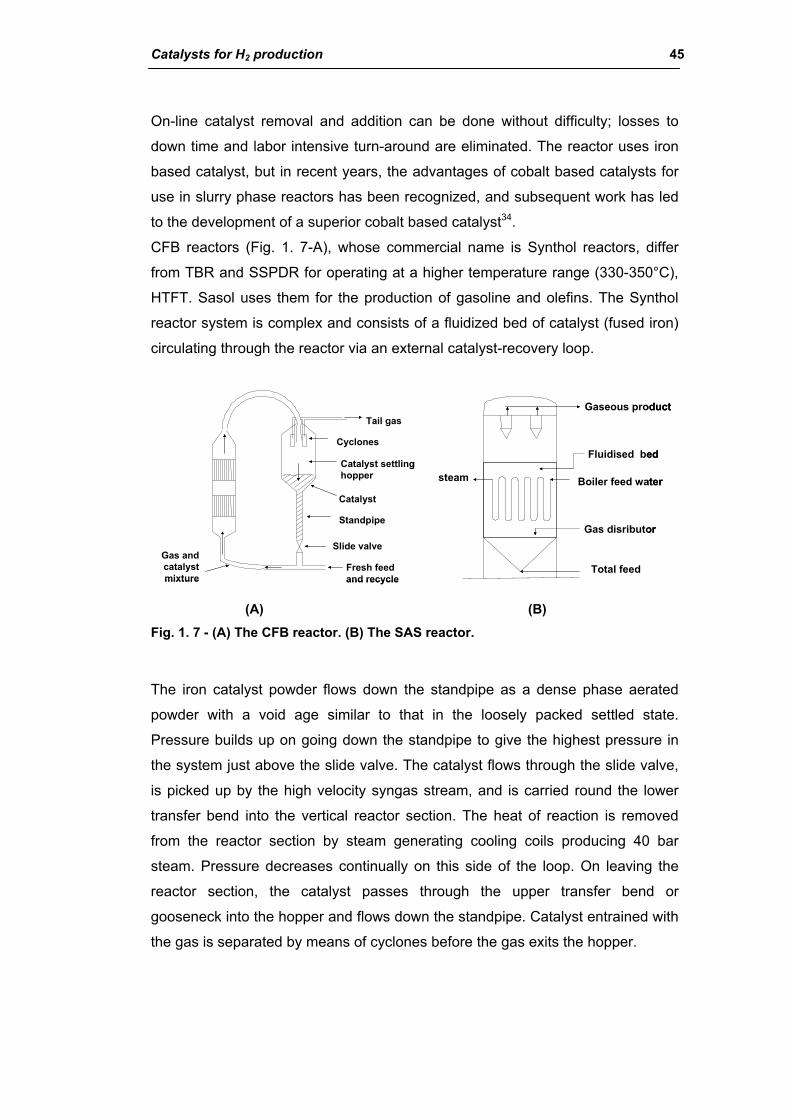
Catalysts for H2 production 45
On-line catalyst removal and addition can be done without difficulty; losses to
down time and labor intensive turn-around are eliminated. The reactor uses iron
based catalyst, but in recent years, the advantages of cobalt based catalysts for
use in slurry phase reactors has been recognized, and subsequent work has led
to the development of a superior cobalt based catalyst34.
CFB reactors (Fig. 1. 7-A), whose commercial name is Synthol reactors, differ
from TBR and SSPDR for operating at a higher temperature range (330-350°C),
HTFT. Sasol uses them for the production of gasoline and olefins. The Synthol
reactor system is complex and consists of a fluidized bed of catalyst (fused iron)
circulating through the reactor via an external catalyst-recovery loop.
Fresh feed and recycle
Gas and catalyst mixture
Slide valve
Standpipe
Catalyst
Catalyst settling hopper
Cyclones
Tail gas
Fresh feed and recycle
Gas and catalyst mixture
Slide valve
Standpipe
Catalyst
Catalyst settling hopper
Cyclones
Tail gas
Total feed
Gas disributor
steam Boiler feed water
Fluidised bed
Gaseous product
Total feed
Gas disributor
steam Boiler feed water
Fluidised bed
Gaseous product
(A) (B)
Fig. 1. 7 - (A) The CFB reactor. (B) The SAS reactor.
The iron catalyst powder flows down the standpipe as a dense phase aerated
powder with a void age similar to that in the loosely packed settled state.
Pressure builds up on going down the standpipe to give the highest pressure in
the system just above the slide valve. The catalyst flows through the slide valve,
is picked up by the high velocity syngas stream, and is carried round the lower
transfer bend into the vertical reactor section. The heat of reaction is removed
from the reactor section by steam generating cooling coils producing 40 bar
steam. Pressure decreases continually on this side of the loop. On leaving the
reactor section, the catalyst passes through the upper transfer bend or
gooseneck into the hopper and flows down the standpipe. Catalyst entrained with
the gas is separated by means of cyclones before the gas exits the hopper.
46 Introduction
The large tonnage of circulating catalyst results in high-pressure drop across the
reactor system. Moreover, because of increased erosion, system downtime is
high, as are maintenance costs.
The SAS reactor is a vessel containing a fluidized bed consisting of fused and
reduced iron catalyst (similar to that used for the Synthol CFB reactor) (Fig. 1. 7-
B)
Syngas is bubbled by means of a gas distributor through the bed where it is
catalytically converted to hydrocarbons. The reactor is designed to operate at
pressures ranging from 20 to 40 bars. It typically operates at a temperature of
around 340°C. Cooling coils are in the bed, and cyclones retain all the catalyst
particles within the reactor, hence eliminating the requirement of an external
catalyst recovery system. The catalyst/gas ratio in the reaction zone for the SAS
reactor is about twice that for the CFB reactor. That is because less than a half of
the catalyst in the CFB reactor is in the reaction zone, although the same quantity
of catalyst is overall contained. In the SAS reactor, the whole of the catalyst
inventory is always in the reaction zone. That strongly affects the relative
conversion performance of the two types of Synthol reactors.
The higher gas velocities needed to transport the catalyst through the CFB
reactor results in a narrower diameter reactor section compared to the SAS
reactor. The CFB reactor design is strictly constrained, while constraints are no
longer relevant for the simple cylindrical configuration of the SAS reactor. A SAS
reactor has a larger capacity than a CFB reactor, so that a plant can achieve the
benefits of economy of scale. For an SAS reactor, the capacity can be increased
to 20.000 BPD, while for a CFB reactor the capacity is of about 8000 BPD. The
scale-up of a CFB reactor is complex and problematic unlike the SAS reactor
scale-up where only the reactor diameter must be increased. Finally, the SAS
reactor is characterized by a reduced pressure drop (half than that of a CFB
reactor) and a decreased recycle ratio, leading to a much lower cost for the
compression of the recycled tail gas.
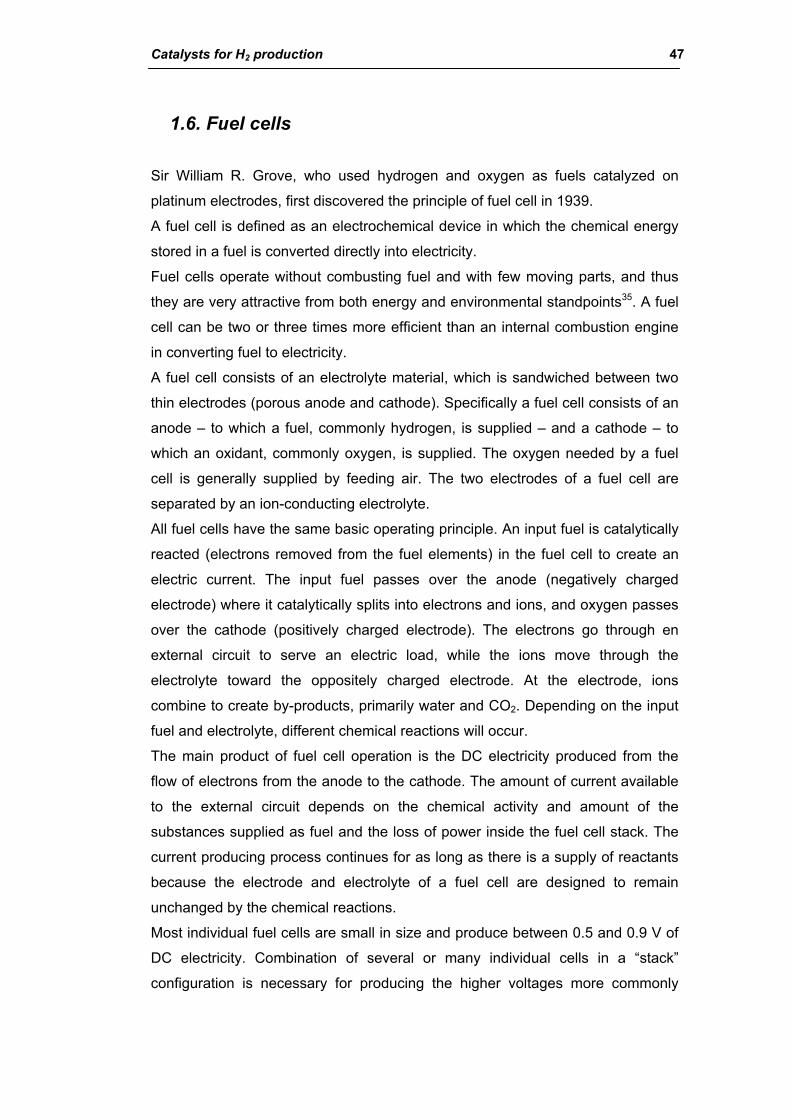
Catalysts for H2 production 47
1.6. Fuel cells
Sir William R. Grove, who used hydrogen and oxygen as fuels catalyzed on
platinum electrodes, first discovered the principle of fuel cell in 1939.
A fuel cell is defined as an electrochemical device in which the chemical energy
stored in a fuel is converted directly into electricity.
Fuel cells operate without combusting fuel and with few moving parts, and thus
they are very attractive from both energy and environmental standpoints35. A fuel
cell can be two or three times more efficient than an internal combustion engine
in converting fuel to electricity.
A fuel cell consists of an electrolyte material, which is sandwiched between two
thin electrodes (porous anode and cathode). Specifically a fuel cell consists of an
anode – to which a fuel, commonly hydrogen, is supplied – and a cathode – to
which an oxidant, commonly oxygen, is supplied. The oxygen needed by a fuel
cell is generally supplied by feeding air. The two electrodes of a fuel cell are
separated by an ion-conducting electrolyte.
All fuel cells have the same basic operating principle. An input fuel is catalytically
reacted (electrons removed from the fuel elements) in the fuel cell to create an
electric current. The input fuel passes over the anode (negatively charged
electrode) where it catalytically splits into electrons and ions, and oxygen passes
over the cathode (positively charged electrode). The electrons go through en
external circuit to serve an electric load, while the ions move through the
electrolyte toward the oppositely charged electrode. At the electrode, ions
combine to create by-products, primarily water and CO2. Depending on the input
fuel and electrolyte, different chemical reactions will occur.
The main product of fuel cell operation is the DC electricity produced from the
flow of electrons from the anode to the cathode. The amount of current available
to the external circuit depends on the chemical activity and amount of the
substances supplied as fuel and the loss of power inside the fuel cell stack. The
current producing process continues for as long as there is a supply of reactants
because the electrode and electrolyte of a fuel cell are designed to remain
unchanged by the chemical reactions.
Most individual fuel cells are small in size and produce between 0.5 and 0.9 V of
DC electricity. Combination of several or many individual cells in a “stack”
configuration is necessary for producing the higher voltages more commonly
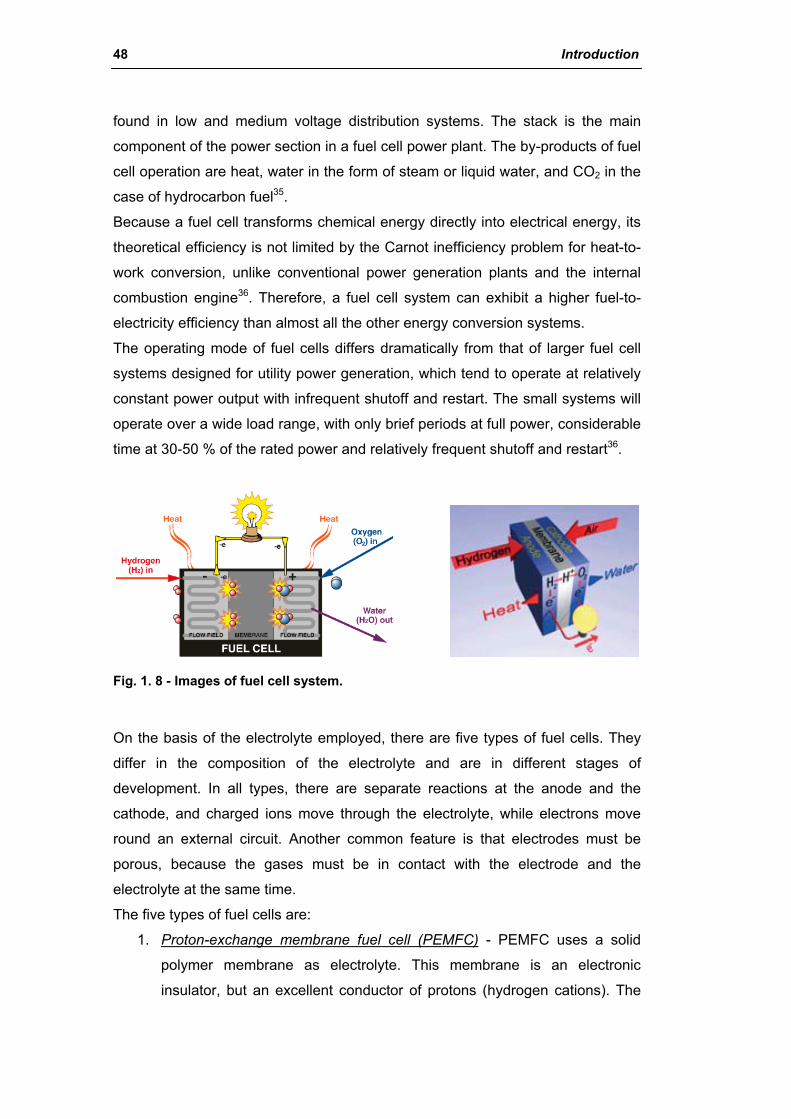
48 Introduction
found in low and medium voltage distribution systems. The stack is the main
component of the power section in a fuel cell power plant. The by-products of fuel
cell operation are heat, water in the form of steam or liquid water, and CO2 in the
case of hydrocarbon fuel35.
Because a fuel cell transforms chemical energy directly into electrical energy, its
theoretical efficiency is not limited by the Carnot inefficiency problem for heat-to-
work conversion, unlike conventional power generation plants and the internal
combustion engine36. Therefore, a fuel cell system can exhibit a higher fuel-to-
electricity efficiency than almost all the other energy conversion systems.
The operating mode of fuel cells differs dramatically from that of larger fuel cell
systems designed for utility power generation, which tend to operate at relatively
constant power output with infrequent shutoff and restart. The small systems will
operate over a wide load range, with only brief periods at full power, considerable
time at 30-50 % of the rated power and relatively frequent shutoff and restart36.
Fig. 1. 8 - Images of fuel cell system.
On the basis of the electrolyte employed, there are five types of fuel cells. They
differ in the composition of the electrolyte and are in different stages of
development. In all types, there are separate reactions at the anode and the
cathode, and charged ions move through the electrolyte, while electrons move
round an external circuit. Another common feature is that electrodes must be
porous, because the gases must be in contact with the electrode and the
electrolyte at the same time.
The five types of fuel cells are:
1. Proton-exchange membrane fuel cell (PEMFC) - PEMFC uses a solid
polymer membrane as electrolyte. This membrane is an electronic
insulator, but an excellent conductor of protons (hydrogen cations). The
Catalysts for H2 production 49
ion-exchange membrane used is fluorinated sulfonic acid polymer. The
acid molecules are fixed to the polymer and cannot leak out, but the
protons on these acid groups are free to migrate through the membrane.
The solid electrolyte exhibits excellent resistance to gas crossover.
Typically, the anode and cathode catalysts consist of one or more
precious metals, particularly platinum supported on carbon. Because of
the limitation on the temperature imposed by the polymer and water
balance, the operating temperature of PEMFC is less than 120°C, usually
between 70 and 90°C. The PEMFC technology is primarily suited for
residential/commercial (business) and transportation applications. The
use of a solid polymer electrolyte eliminates the corrosion and safety
concerns associated with liquid electrolyte fuel cells.
In addition to pure hydrogen, the PEMFC can also operate on reformed
hydrocarbon fuels without removal of the by-product CO2. However, the
anode catalyst is sensitive to CO, so the traces of carbon monoxide
produced during the reforming process must be converted to carbon
dioxide by selective oxidation.
Water management is critical: the fuel cell must operate under conditions
where the by-product water does not evaporate faster than it is produced
because the membrane must be hydrated35.
2. Phosphoric acid fuel cell (PAFC) – The PAFC uses liquid, concentrated
phosphoric acid as the electrolyte. The phosphoric acid is usually
contained in a Teflon bonded silicon carbide matrix. The small pore
structure of this matrix preferentially keeps the acid in place through
capillary action. Some acid may be entrained in the fuel or oxidant
streams and addition of acid may be required after many hours of
operation.
Platinum supported on porous carbon is used on both anode and cathode
sides of the electrolyte. PAFC operates at 180-220°C, typically around
200°C, so PAFC plant also produces heat for domestic hot water and
space heating35.
3. Alkaline fuel cell (AFC) – The AFC uses aqueous solution of potassium
hydroxide (KOH) as electrolyte, which is retained in a solid matrix (usually
asbestos), and a wide range of electro-catalysts can be used, including
nickel, metal oxides, spinels and noble metals electrode.
50 Introduction
The operating range of temperatures can be higher than PAFC: they can
work up to 250°C by using concentrated KOH (85%), or at temperature
lower than 120°C by using less concentrated KOH (35-50%).
The fuel supply is limited to hydrogen, CO is a poison and CO2 reacts with
KOH to form K2CO3, thus changing the electrolyte35.
4. Molten carbonate fuel cell (MCFC) – the MCFC uses a molten carbonates
salt mixture as electrolyte. The composition of the electrolyte varies, but
usually consist of lithium carbonate and potassium carbonate (Li2CO3-
K2CO3). At the operating temperature of about 650°C, the salt mixture is
liquid and a good ionic conductor. The electrolyte is suspended in a
porous, insulating and chemically inert ceramic (LiAl2O) matrix. At the
high operating temperature, noble metals are not required for electrodes,
nickel or its alloy with chromium or aluminum can be used as anode, and
nickel oxide as cathode. The cell performance is sensitive to operating
temperature; a change in cell temperature from 650 to 600°C results in a
drop in cell voltage of almost 15 %. The reduction in cell voltage is due to
increase ionic and electrical resistance and a reduction in electrode
kinetics. The disadvantages of MCFC are that the electrolytes is corrosive
and mobile, and a source of CO2 is requires at the cathode to form the
carbonate ion35.
5. Solid oxide fuel cell (SOFC) – SOFC uses a ceramic, solid phase
electrolyte, which reduces corrosion considerations and eliminates the
electrolyte management problems associated with the liquid electrolyte
fuel cells. To achieve adequate ionic conductivity in such a ceramic,
however, the system must operate at high temperatures in the range of
650-1000°C, typically 800-1000°C in the current technology. The
preferred electrolytes material, dense yttria (Y2O3) - stabilized zirconia
(ZrO2), is an excellent conductor of negatively charged oxygen (oxide)
ions at high temperatures. The SOFC is a solid-state device and shares
certain properties and fabrication techniques with semiconductor devices.
The anode is typically a porous nickel-zirconia (Ni-ZrO2) cermet (ceramic-
metal composite) or cobalt zirconia (Co-ZrO2) cermet, while the cathode is
typically magnesium-doped lanthanum manganate or strontium-doped
lanthanum manganate (LaMnO3).

Catalysts for H2 production 51
At the operating temperature, internal reforming of most hydrocarbon
fuels should be possible, and the waste heat from such a device would be
easily utilized by conventional thermal electricity generating plants to yield
excellent fuel efficiency. On the other hand, the high operating
temperature has its own drawbacks due to the demand and thermal
stressing on the materials including the sealants and the longer start up
time. Because the electrolyte is solid, the cell can be cast into various
shapes such as tubular, planar, or monolithic. Operation up to 1000°C
allows more flexibility in the choice of fuels and can produce better
performance in combined-cycle applications35.
The general advantages of fuel cells are reflected by the following desirable
characteristic:
(i) High energy conversion efficiency;
(ii) Extremely low emissions of pollutants;
(iii) Extremely low noise or acoustical pollutions;
(iv) Effective reduction of greenhouse gas (CO2) formation at the source
compared to low-efficiency devices;
(v) Process simplicity for conversion of chemical energy to electrical
energy35.
Depending on the specific types of fuel cells, other advantages may include fuel
flexibility and existing infrastructure of hydrocarbon fuel supplies, co-generation
capability, modular design for mass production and relatively rapid load
response. Therefore, fuel cells have great potential to penetrate into markets for
both stationary power plants (for industrial, commercial and residential home
applications) and mobile power plants for transportation by cars, buses, trucks,
trains and ship, as well as man-portable micro-generators35.
Unlike power plants that use combustion technologies, fuel cells plants that
generate electricity and usable heat can be built in a wide range of sizes – from
200 kW units suitable for powering commercial buildings, to 100MW plants that
can add base-load capacity to utility power plants35.
The disadvantages or challenges to be overcome include the costs of fuel cells
and that the hydrogen fuel is not readily available and thus on-site or on-board H2
production via reforming is necessary. There are no readily and affordable ways
for on-board or on-site desulphurization of hydrocarbon fuels and this presents a
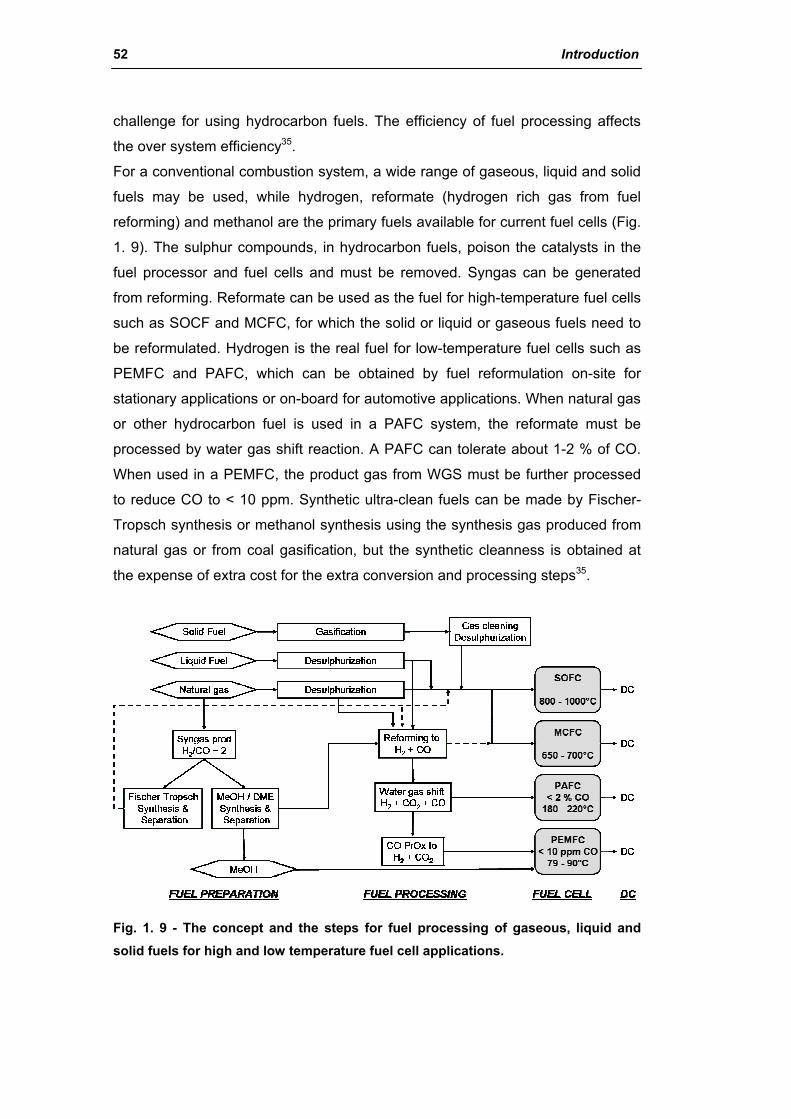
52 Introduction
challenge for using hydrocarbon fuels. The efficiency of fuel processing affects
the over system efficiency35.
For a conventional combustion system, a wide range of gaseous, liquid and solid
fuels may be used, while hydrogen, reformate (hydrogen rich gas from fuel
reforming) and methanol are the primary fuels available for current fuel cells (Fig.
1. 9). The sulphur compounds, in hydrocarbon fuels, poison the catalysts in the
fuel processor and fuel cells and must be removed. Syngas can be generated
from reforming. Reformate can be used as the fuel for high-temperature fuel cells
such as SOCF and MCFC, for which the solid or liquid or gaseous fuels need to
be reformulated. Hydrogen is the real fuel for low-temperature fuel cells such as
PEMFC and PAFC, which can be obtained by fuel reformulation on-site for
stationary applications or on-board for automotive applications. When natural gas
or other hydrocarbon fuel is used in a PAFC system, the reformate must be
processed by water gas shift reaction. A PAFC can tolerate about 1-2 % of CO.
When used in a PEMFC, the product gas from WGS must be further processed
to reduce CO to < 10 ppm. Synthetic ultra-clean fuels can be made by Fischer-
Tropsch synthesis or methanol synthesis using the synthesis gas produced from
natural gas or from coal gasification, but the synthetic cleanness is obtained at
the expense of extra cost for the extra conversion and processing steps35.
Fig. 1. 9 - The concept and the steps for fuel processing of gaseous, liquid and solid fuels for high and low temperature fuel cell applications.
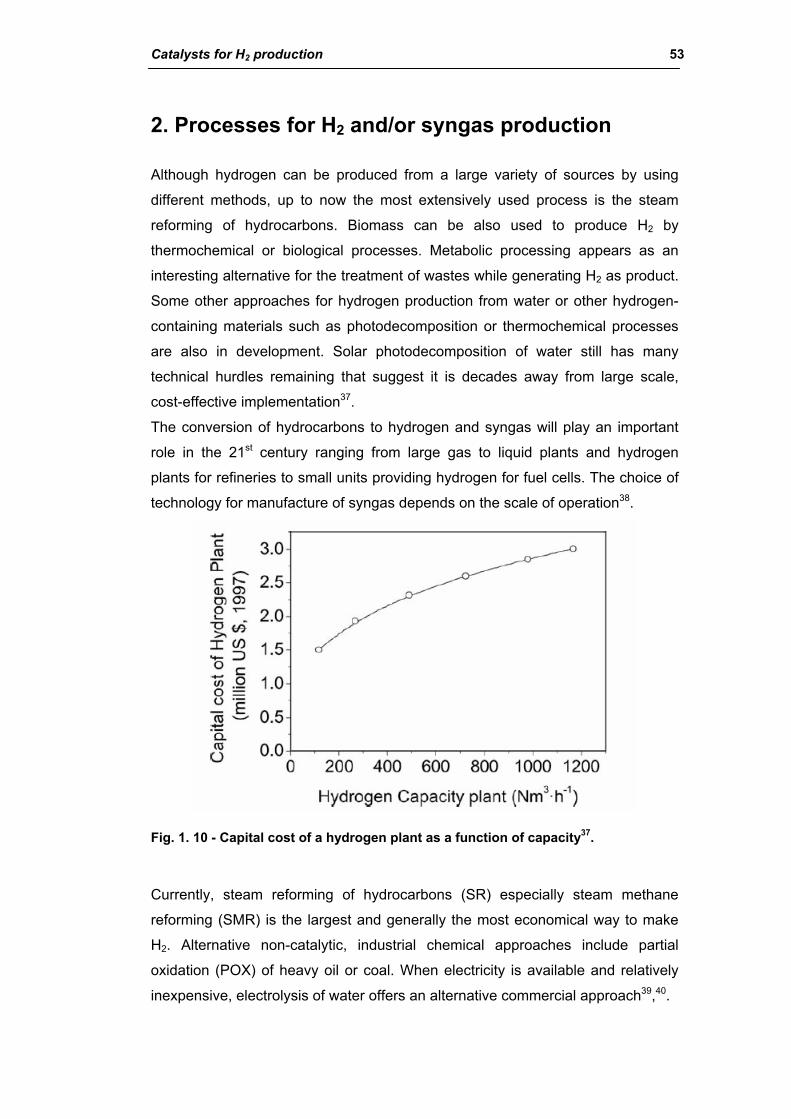
Catalysts for H2 production 53
2. Processes for H2 and/or syngas production
Although hydrogen can be produced from a large variety of sources by using
different methods, up to now the most extensively used process is the steam
reforming of hydrocarbons. Biomass can be also used to produce H2 by
thermochemical or biological processes. Metabolic processing appears as an
interesting alternative for the treatment of wastes while generating H2 as product.
Some other approaches for hydrogen production from water or other hydrogen-
containing materials such as photodecomposition or thermochemical processes
are also in development. Solar photodecomposition of water still has many
technical hurdles remaining that suggest it is decades away from large scale,
cost-effective implementation37.
The conversion of hydrocarbons to hydrogen and syngas will play an important
role in the 21st century ranging from large gas to liquid plants and hydrogen
plants for refineries to small units providing hydrogen for fuel cells. The choice of
technology for manufacture of syngas depends on the scale of operation38.
Fig. 1. 10 - Capital cost of a hydrogen plant as a function of capacity37.
Currently, steam reforming of hydrocarbons (SR) especially steam methane
reforming (SMR) is the largest and generally the most economical way to make
H2. Alternative non-catalytic, industrial chemical approaches include partial
oxidation (POX) of heavy oil or coal. When electricity is available and relatively
inexpensive, electrolysis of water offers an alternative commercial approach39,40.

54 Introduction
Industrially, two main reactions are important in the conversion of natural gas to
syngas41:
(i) Steam reforming (SR),
(ii) Non-catalytic partial oxidation (POX).
While most syngas is produced by steam reforming, two other process may be
more attractive, depending on factors such as H2:CO ratio, downstream use,
product purity, the presence of CO2, N2, H2O and CH4, plant capacity, feedstock
availability, purity and cost, including O2. These processes are:
(i) Autothermal catalytic reforming (ATR),
(ii) Catalytic partial oxidation (CPO).
2.1. Steam reforming process
In areas where natural gas is available in large quantities, interest is centered on
steam reforming of methane as hydrogen source7. The process is more
economic than that based on coal. The hydrogen content of the hydrocarbon
improved the yield of hydrogen per unit of carbon in the feedstock compared with
coal, and there were also fewer unwanted by-products. The methane steam
technology was pioneered in the first quarter of 20th century by BASF who
established the essential configuration of the primary steam reformer, and the
technology was used in 1931 by Standard Oil of New Jersey to produce
hydrogen from off-gases at its Baton Rouge and Bayway refineries.
The methane reforming process was adopted mainly in the US where natural gas
was easily available as feedstock, whereas reformers in Europe where initially
reduced to operate on propane and LPG42.
The steam reforming reaction took place over catalyst in vertical tubes, which
were supported in parallel rows in a radiant furnace. The endothermic heat of
reaction was supplied by burning fuel in the furnace. The process was
considerably improved by ICI, who developed the fundamental engineering data
for the design of the furnace, improved the catalyst formulation and introduced
the desulphurization step using zinc oxide. The process was used to produce
hydrogen from off gases for coal hydrogenation plants, which ICI built in 1936
and 1940. The ICI technology was subsequently used in the development of the
North American ammonia industry when plants were constructed at El Dorado,
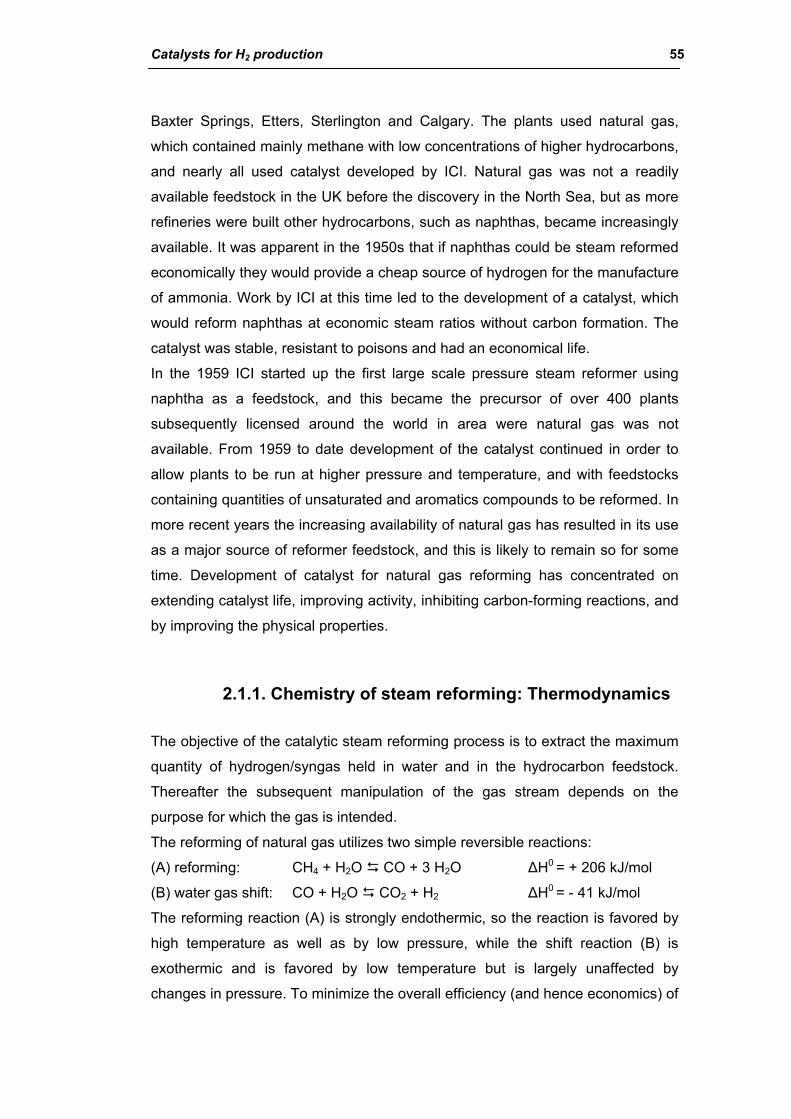
Catalysts for H2 production 55
Baxter Springs, Etters, Sterlington and Calgary. The plants used natural gas,
which contained mainly methane with low concentrations of higher hydrocarbons,
and nearly all used catalyst developed by ICI. Natural gas was not a readily
available feedstock in the UK before the discovery in the North Sea, but as more
refineries were built other hydrocarbons, such as naphthas, became increasingly
available. It was apparent in the 1950s that if naphthas could be steam reformed
economically they would provide a cheap source of hydrogen for the manufacture
of ammonia. Work by ICI at this time led to the development of a catalyst, which
would reform naphthas at economic steam ratios without carbon formation. The
catalyst was stable, resistant to poisons and had an economical life.
In the 1959 ICI started up the first large scale pressure steam reformer using
naphtha as a feedstock, and this became the precursor of over 400 plants
subsequently licensed around the world in area were natural gas was not
available. From 1959 to date development of the catalyst continued in order to
allow plants to be run at higher pressure and temperature, and with feedstocks
containing quantities of unsaturated and aromatics compounds to be reformed. In
more recent years the increasing availability of natural gas has resulted in its use
as a major source of reformer feedstock, and this is likely to remain so for some
time. Development of catalyst for natural gas reforming has concentrated on
extending catalyst life, improving activity, inhibiting carbon-forming reactions, and
by improving the physical properties.
2.1.1. Chemistry of steam reforming: Thermodynamics
The objective of the catalytic steam reforming process is to extract the maximum
quantity of hydrogen/syngas held in water and in the hydrocarbon feedstock.
Thereafter the subsequent manipulation of the gas stream depends on the
purpose for which the gas is intended.
The reforming of natural gas utilizes two simple reversible reactions:
(A) reforming: CH4 + H2O CO + 3 H2O ∆H0 = + 206 kJ/mol
(B) water gas shift: CO + H2O CO2 + H2 ∆H0 = - 41 kJ/mol
The reforming reaction (A) is strongly endothermic, so the reaction is favored by
high temperature as well as by low pressure, while the shift reaction (B) is
exothermic and is favored by low temperature but is largely unaffected by
changes in pressure. To minimize the overall efficiency (and hence economics) of
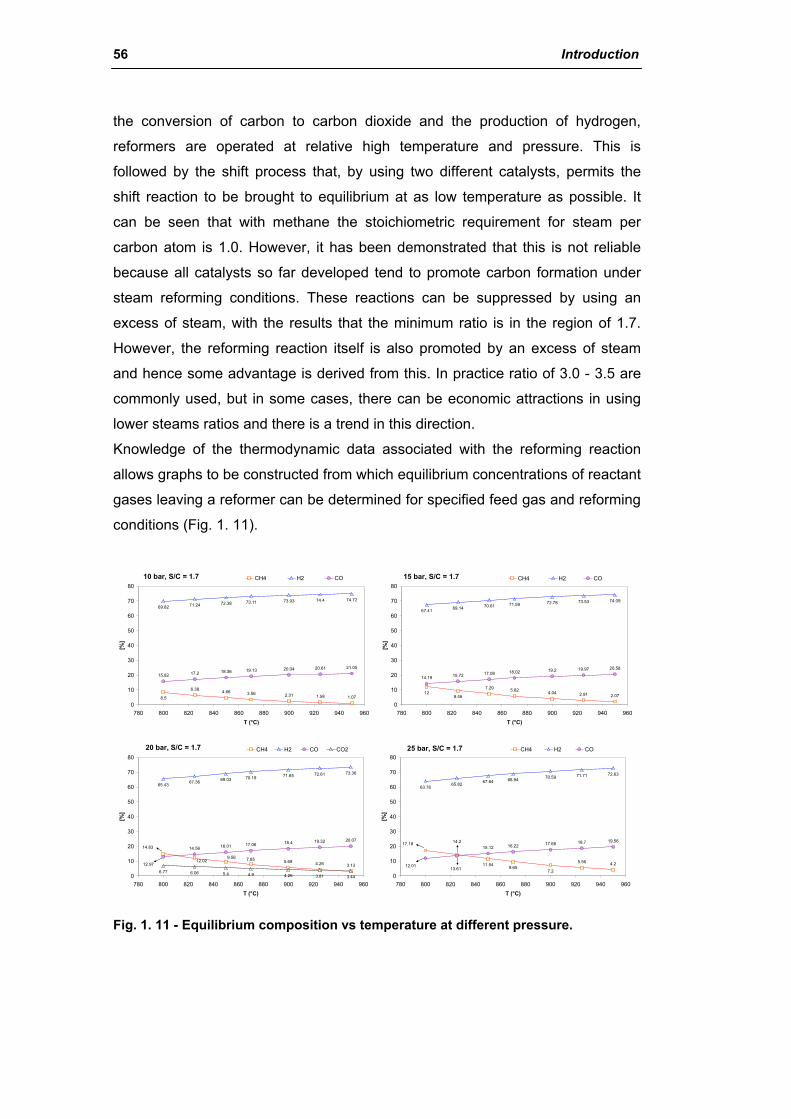
56 Introduction
the conversion of carbon to carbon dioxide and the production of hydrogen,
reformers are operated at relative high temperature and pressure. This is
followed by the shift process that, by using two different catalysts, permits the
shift reaction to be brought to equilibrium at as low temperature as possible. It
can be seen that with methane the stoichiometric requirement for steam per
carbon atom is 1.0. However, it has been demonstrated that this is not reliable
because all catalysts so far developed tend to promote carbon formation under
steam reforming conditions. These reactions can be suppressed by using an
excess of steam, with the results that the minimum ratio is in the region of 1.7.
However, the reforming reaction itself is also promoted by an excess of steam
and hence some advantage is derived from this. In practice ratio of 3.0 - 3.5 are
commonly used, but in some cases, there can be economic attractions in using
lower steams ratios and there is a trend in this direction.
Knowledge of the thermodynamic data associated with the reforming reaction
allows graphs to be constructed from which equilibrium concentrations of reactant
gases leaving a reformer can be determined for specified feed gas and reforming
conditions (Fig. 1. 11).
10 bar, S/C = 1.7
6.38 4.66 3.56 2.31 1.58 1.07
69.82 71.24 72.38 73.93 74.4 74.72
15.82 17.2 18.36 19.13 20.04 20.61 21.05
8.5
73.11
0
10
20
30
40
50
60
70
80
780 800 820 840 860 880 900 920 940 960T (°C)
[%]
CH4 H2 CO 15 bar, S/C = 1.7
7.29
2.07
67.41 69.14 70.6172.78 73.53 74.09
14.19 15.72 17.08 18.02 19.2 19.97 20.58
129.46
5.822.914.04
71.59
0
10
20
30
40
50
60
70
80
780 800 820 840 860 880 900 920 940 960T (°C)
[%]
CH4 H2 CO
20 bar, S/C = 1.7
65.43 67.36 69.0371.65 72.61 73.36
14.56 16.01 17.06 18.4 19.32 20.07
6.77 6.06 5.4 4.9 4.26 3.81 3.44
9.56
3.13
14.83
12.02 7.854.265.69
70.19
12.97
0
10
20
30
40
50
60
70
80
780 800 820 840 860 880 900 920 940 960T (°C)
[%]
CH4 H2 CO CO2 25 bar, S/C = 1.7
11.54
63.7665.82 67.64
70.59 71.71 72.63
15.12 16.22 17.68 18.7 19.56
4.2
17.18 14.2
9.655.56
7.2
68.94
13.6112.01
0
10
20
30
40
50
60
70
80
780 800 820 840 860 880 900 920 940 960T (°C)
[%]
CH4 H2 CO
Fig. 1. 11 - Equilibrium composition vs temperature at different pressure.
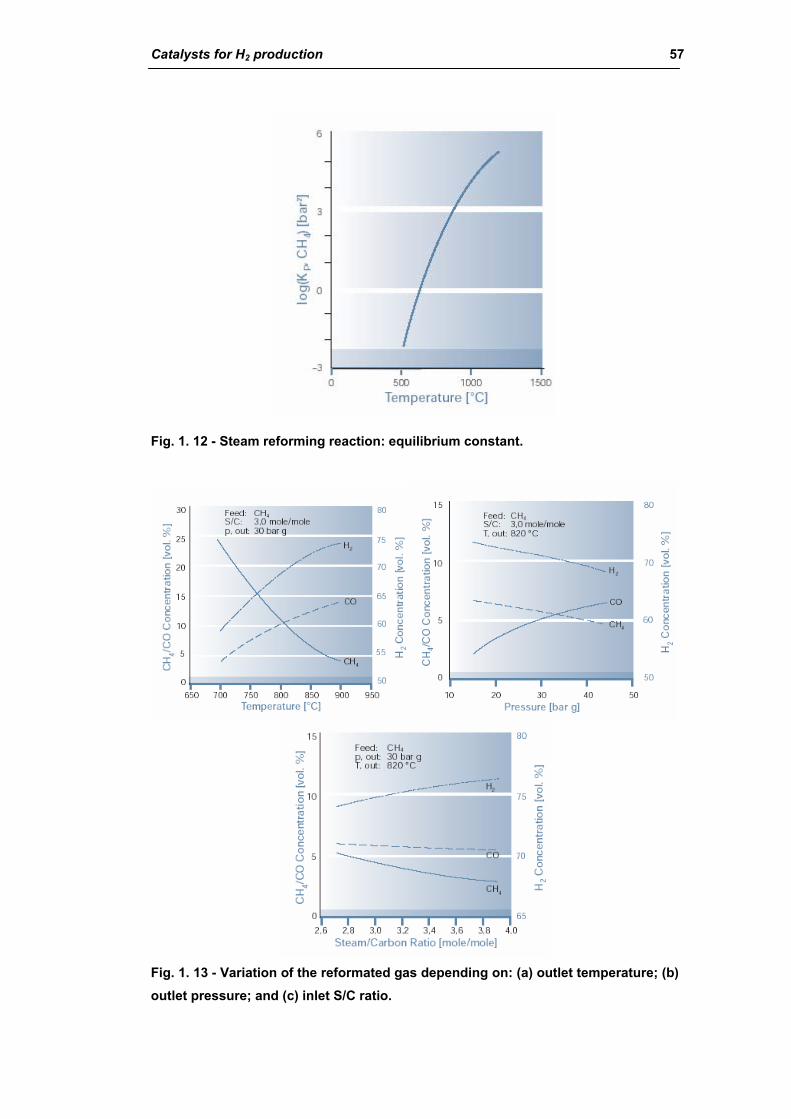
Catalysts for H2 production 57
Fig. 1. 12 - Steam reforming reaction: equilibrium constant.
Fig. 1. 13 - Variation of the reformated gas depending on: (a) outlet temperature; (b) outlet pressure; and (c) inlet S/C ratio.
58 Introduction
The reforming of saturated naphthas of general formula CnH2n+2 is based on the
following reaction:
(C) CnH2n+2 + n H2O n CO + (2n + 1) H2
(D) CO + 3 H2O CH4 + H2O ∆H = - 206 kJ/mol
Reaction (C) is strongly endothermic, absorbing more heat than the following
methanation reaction (D) and shift reaction (B) evolve, thus making the overall
process normally an endothermic one.
Analogously to methane, the naphtha reforming reaction is favored by high
temperature and low pressure, while the shift reaction is inhibited by high
temperature but largely unaffected by pressure. The tendency towards carbon
formation on catalysts when stoichiometric ratios of carbon and steam are used is
greater with naphtha than with methane, and the minimum practical ratio is about
2.2. As with methane, the excess steam favors the reforming reaction, and in
practice steam/carbon ratios of 3.5 - 4.5 are common. At low steam/carbon ratio
the methanation reaction begins to dominate, and under certain conditions of
pressure and temperature can cause the overall reaction to be exothermic. As
with methane reforming, it is possible to calculate the equilibrium methane,
carbon monoxide, carbon dioxide, hydrogen and water concentrations from inlet
steam/carbon ratios and the operating conditions of a reformer7.
Lutz and co-workers43 examined the thermodynamics of the steam reforming
process. SR is achieved by reaction over a catalyst at high temperature. In
addition to the energy required to provide the steam, the overall reaction is
endothermic, so energy must be added to drive it. The process must burn either a
second fuel, a fraction of the primary fuel, or the residual fuels that remain in the
reformate stream. This last option is often done in practice to recover heating
value that would otherwise be wasted. The analysis presented by Lutz considers
two levels of sophistication in treating the chemistry. The first uses a global
species balance that assumes that the reforming reaction goes to completion. An
energy balance for the reaction allows to examine the definition of thermal
efficiency. This analysis provides a theoretical upper limit on the thermal
efficiency that is independent of temperature or other influences on the reaction
kinetics. The second analysis replaces the global reaction step with a calculation
of chemical equilibrium for the reforming reaction. The equilibrium computation
brings in temperature dependence, without requiring detailed information
regarding the specific reactions or catalyst performance.
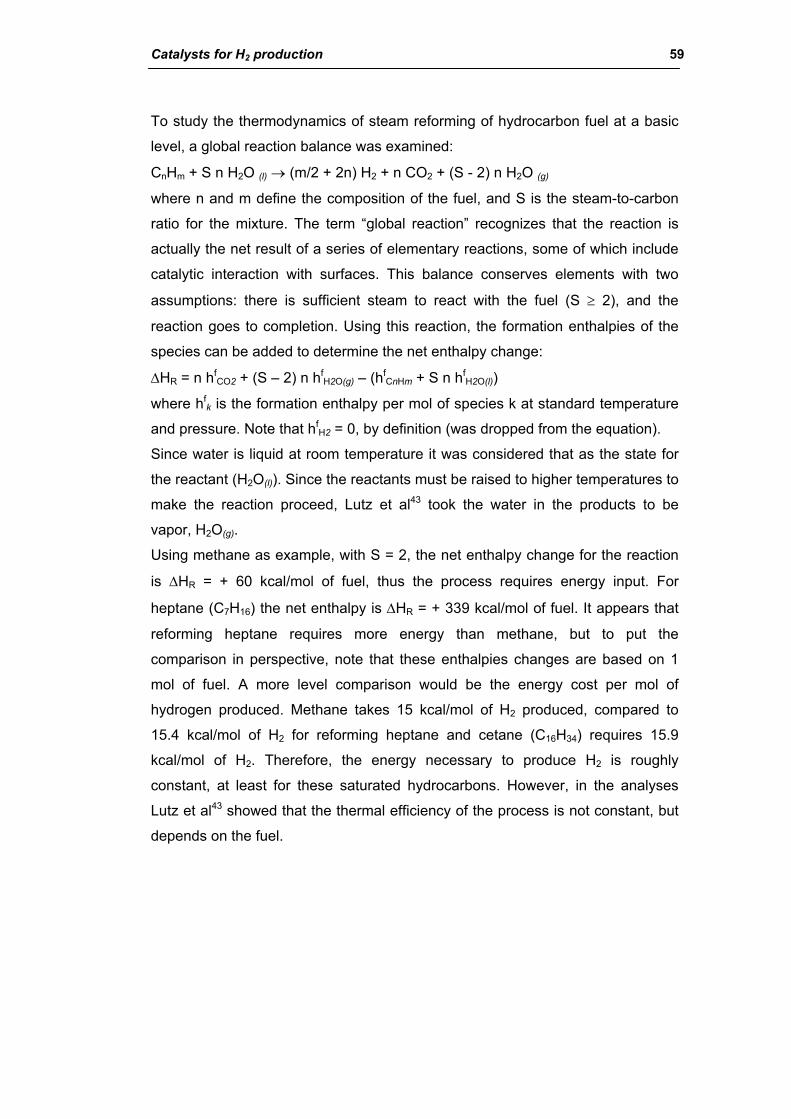
Catalysts for H2 production 59
To study the thermodynamics of steam reforming of hydrocarbon fuel at a basic
level, a global reaction balance was examined:
CnHm + S n H2O (l) → (m/2 + 2n) H2 + n CO2 + (S - 2) n H2O (g)
where n and m define the composition of the fuel, and S is the steam-to-carbon
ratio for the mixture. The term “global reaction” recognizes that the reaction is
actually the net result of a series of elementary reactions, some of which include
catalytic interaction with surfaces. This balance conserves elements with two
assumptions: there is sufficient steam to react with the fuel (S ≥ 2), and the
reaction goes to completion. Using this reaction, the formation enthalpies of the
species can be added to determine the net enthalpy change:
∆HR = n hfCO2 + (S – 2) n hf
H2O(g) – (hfCnHm + S n hf
H2O(l))
where hfk is the formation enthalpy per mol of species k at standard temperature
and pressure. Note that hfH2 = 0, by definition (was dropped from the equation).
Since water is liquid at room temperature it was considered that as the state for
the reactant (H2O(l)). Since the reactants must be raised to higher temperatures to
make the reaction proceed, Lutz et al43 took the water in the products to be
vapor, H2O(g).
Using methane as example, with S = 2, the net enthalpy change for the reaction
is ∆HR = + 60 kcal/mol of fuel, thus the process requires energy input. For
heptane (C7H16) the net enthalpy is ∆HR = + 339 kcal/mol of fuel. It appears that
reforming heptane requires more energy than methane, but to put the
comparison in perspective, note that these enthalpies changes are based on 1
mol of fuel. A more level comparison would be the energy cost per mol of
hydrogen produced. Methane takes 15 kcal/mol of H2 produced, compared to
15.4 kcal/mol of H2 for reforming heptane and cetane (C16H34) requires 15.9
kcal/mol of H2. Therefore, the energy necessary to produce H2 is roughly
constant, at least for these saturated hydrocarbons. However, in the analyses
Lutz et al43 showed that the thermal efficiency of the process is not constant, but
depends on the fuel.
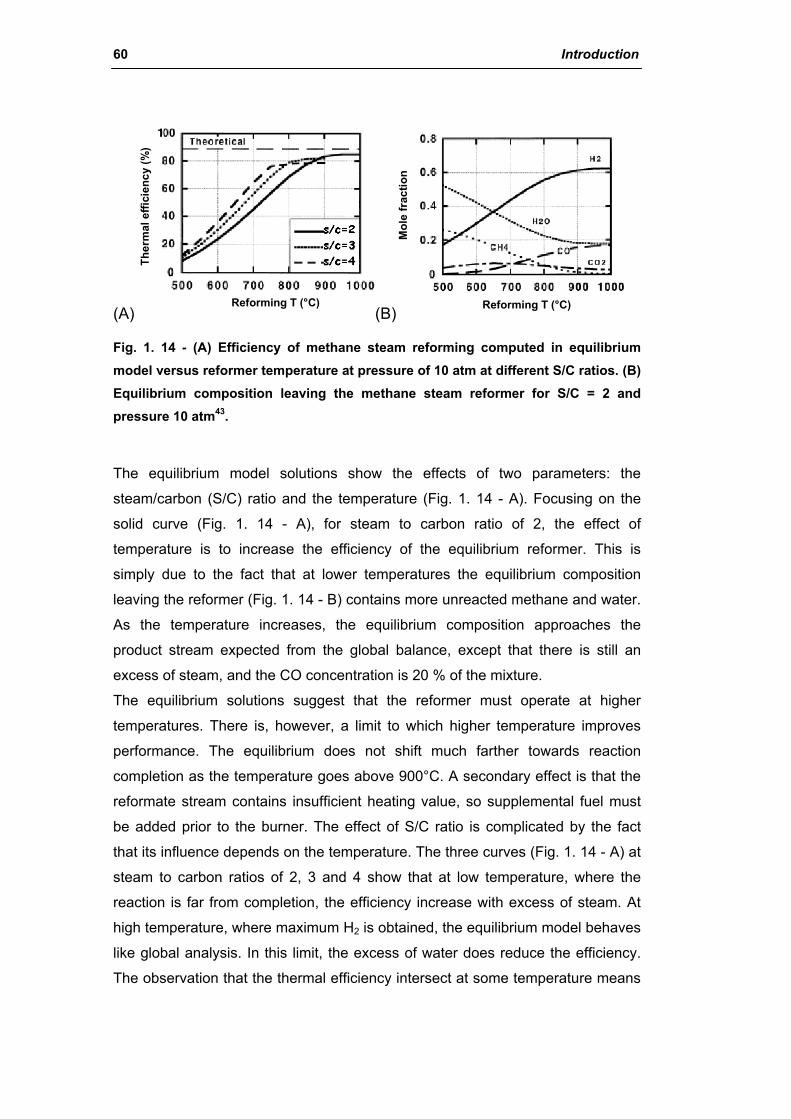
60 Introduction
(A)
Ther
mal
effi
cien
cy (%
)
Reforming T (°C)
Ther
mal
effi
cien
cy (%
)
Reforming T (°C)
Ther
mal
effi
cien
cy (%
)
Reforming T (°C)(B)
Mol
e fr
actio
n
Reforming T (°C)
Mol
e fr
actio
n
Reforming T (°C)
Fig. 1. 14 - (A) Efficiency of methane steam reforming computed in equilibrium model versus reformer temperature at pressure of 10 atm at different S/C ratios. (B) Equilibrium composition leaving the methane steam reformer for S/C = 2 and pressure 10 atm43.
The equilibrium model solutions show the effects of two parameters: the
steam/carbon (S/C) ratio and the temperature (Fig. 1. 14 - A). Focusing on the
solid curve (Fig. 1. 14 - A), for steam to carbon ratio of 2, the effect of
temperature is to increase the efficiency of the equilibrium reformer. This is
simply due to the fact that at lower temperatures the equilibrium composition
leaving the reformer (Fig. 1. 14 - B) contains more unreacted methane and water.
As the temperature increases, the equilibrium composition approaches the
product stream expected from the global balance, except that there is still an
excess of steam, and the CO concentration is 20 % of the mixture.
The equilibrium solutions suggest that the reformer must operate at higher
temperatures. There is, however, a limit to which higher temperature improves
performance. The equilibrium does not shift much farther towards reaction
completion as the temperature goes above 900°C. A secondary effect is that the
reformate stream contains insufficient heating value, so supplemental fuel must
be added prior to the burner. The effect of S/C ratio is complicated by the fact
that its influence depends on the temperature. The three curves (Fig. 1. 14 - A) at
steam to carbon ratios of 2, 3 and 4 show that at low temperature, where the
reaction is far from completion, the efficiency increase with excess of steam. At
high temperature, where maximum H2 is obtained, the equilibrium model behaves
like global analysis. In this limit, the excess of water does reduce the efficiency.
The observation that the thermal efficiency intersect at some temperature means
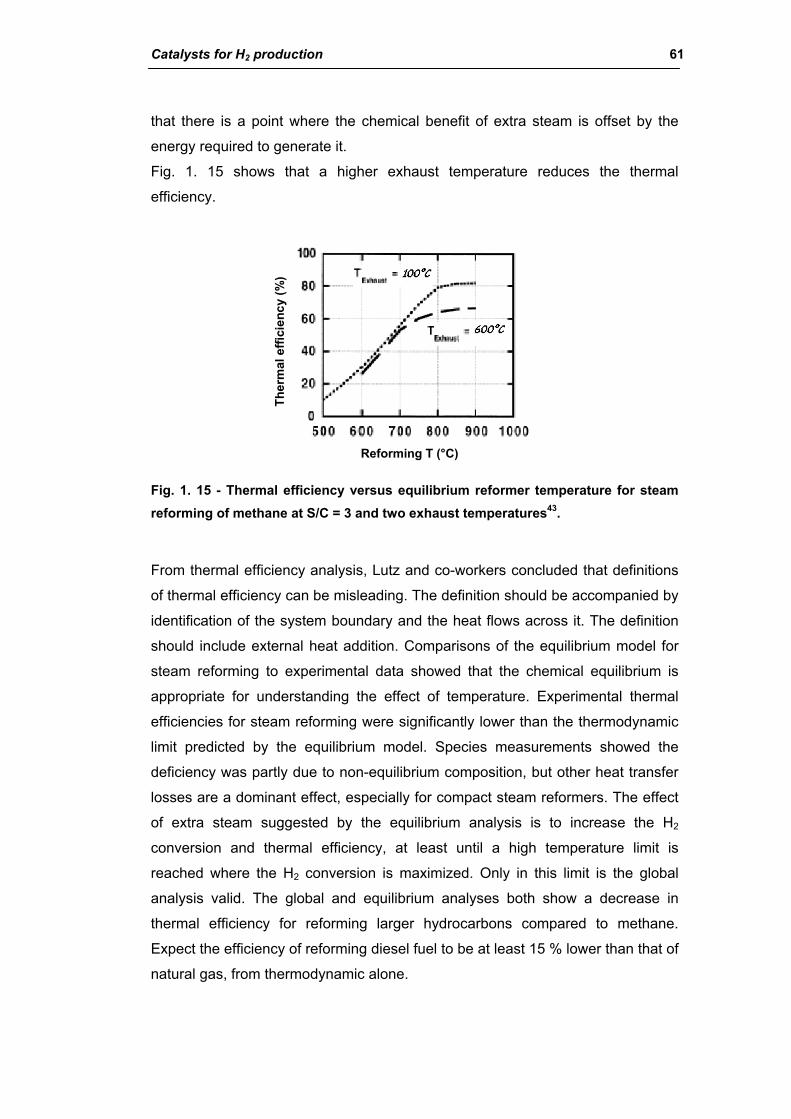
Catalysts for H2 production 61
that there is a point where the chemical benefit of extra steam is offset by the
energy required to generate it.
Fig. 1. 15 shows that a higher exhaust temperature reduces the thermal
efficiency.
Ther
mal
effi
cien
cy (%
)
Reforming T (°C)
Ther
mal
effi
cien
cy (%
)
Reforming T (°C)
Fig. 1. 15 - Thermal efficiency versus equilibrium reformer temperature for steam reforming of methane at S/C = 3 and two exhaust temperatures43.
From thermal efficiency analysis, Lutz and co-workers concluded that definitions
of thermal efficiency can be misleading. The definition should be accompanied by
identification of the system boundary and the heat flows across it. The definition
should include external heat addition. Comparisons of the equilibrium model for
steam reforming to experimental data showed that the chemical equilibrium is
appropriate for understanding the effect of temperature. Experimental thermal
efficiencies for steam reforming were significantly lower than the thermodynamic
limit predicted by the equilibrium model. Species measurements showed the
deficiency was partly due to non-equilibrium composition, but other heat transfer
losses are a dominant effect, especially for compact steam reformers. The effect
of extra steam suggested by the equilibrium analysis is to increase the H2
conversion and thermal efficiency, at least until a high temperature limit is
reached where the H2 conversion is maximized. Only in this limit is the global
analysis valid. The global and equilibrium analyses both show a decrease in
thermal efficiency for reforming larger hydrocarbons compared to methane.
Expect the efficiency of reforming diesel fuel to be at least 15 % lower than that of
natural gas, from thermodynamic alone.
62 Introduction
2.1.2. Kinetics and reaction mechanism
The results of a number of studies on the kinetics of the methane steam
reforming have been published. There is general agreement that the reaction is
first order in methane, but there is less agreement with other kinetic parameters.
In part, this is due to the use of different catalysts and experimental conditions,
but often it has resulted from a lack of consideration of diffusion and heat transfer
limitations. Thus, reported activation energies are spread in a wide range of
values due to different degrees of diffusion limitation, and these can also cause
misleading total pressure effect. Indeed, with the relatively large catalyst particle
sizes used in industrial steam reformers, these effects results in very low
effectiveness of the catalyst. Effectiveness factors (η) may, depending on
conditions, only be as high as 0.3 at the inlet region, and perhaps as low as 0.01
at the exit. Because of this, apparent activity increases as the particle size is
made smaller, but the increased pressure drop, which arises across the reformer,
restricts the size of the catalyst that can be used in practice7.
There has been some debate about the first formed products of the steam
reforming reactions, and it appears that the relative concentrations of carbon
monoxide and carbon dioxide leaving the catalyst surface depend on the
efficiency of the catalyst in the water gas shift reaction. With rhodium-based
catalysts the CO/CO2 ratio of the initially formed carbon oxides is relatively high
(in keeping with poor shift activity), whereas with nickel catalysts the amount of
carbon monoxide is lower7.
A wide variety of rate expressions for the steam reforming of methane have been
proposed. These models range in complexity from simple first order dependency
on methane, involving two parameters, to complex Langmuir–Hinshelwood
models with over ten parameters44. It is generally agreed that the rate of methane
reforming has a first order dependency on methane. Furthermore, it is also
agreed that the rate-determining step in the reforming process is the formation of
adsorbed carbon species: CH4 + * – Metalsite → CAds – *+2 H2
This mechanism leads to the formulation of rate equations of the following form:
rCH4 = – k pCH4 p H2
α
In this equation, the value of α is found to depend on temperature, having a value
close to −1 at low temperatures (< 700°C) and approaching 0 at high
temperatures (> 700°C).
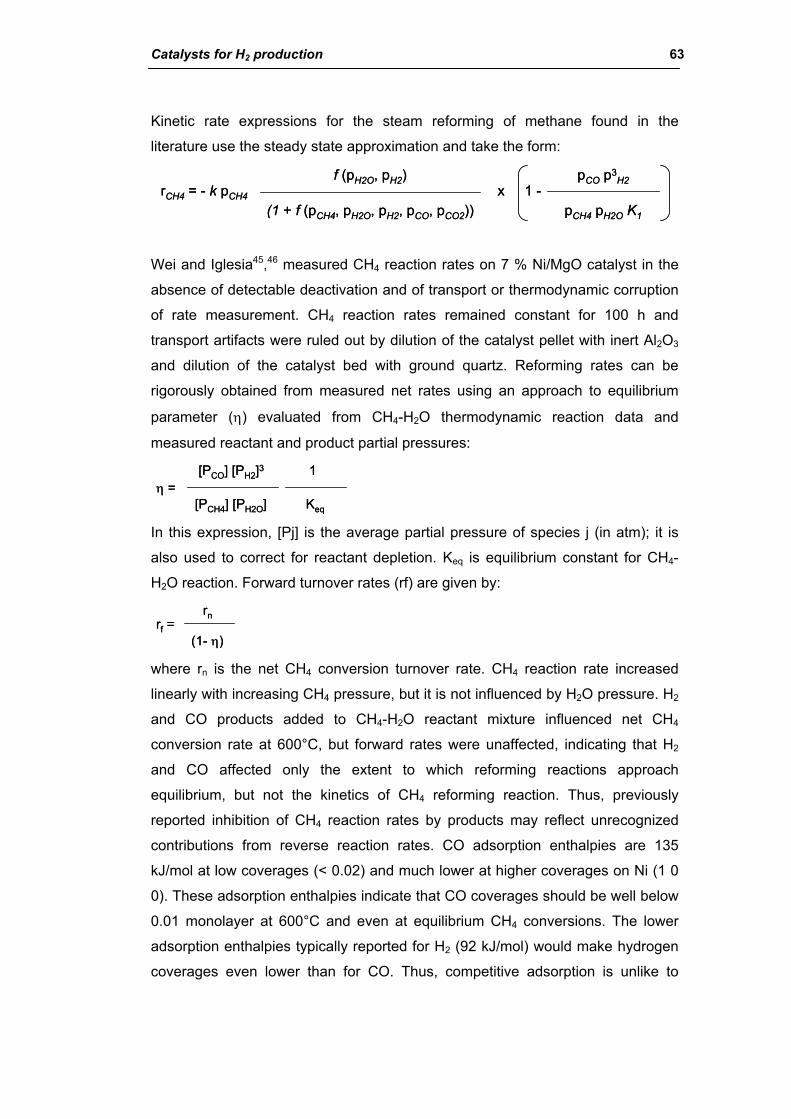
Catalysts for H2 production 63
Kinetic rate expressions for the steam reforming of methane found in the
literature use the steady state approximation and take the form:
rCH4 = - k pCH4 x 1 -f (pH2O, pH2)
(1 + f (pCH4, pH2O, pH2, pCO, pCO2))
pCO p3H2
pCH4 pH2O K1
rCH4 = - k pCH4 x 1 -f (pH2O, pH2)
(1 + f (pCH4, pH2O, pH2, pCO, pCO2))
pCO p3H2
pCH4 pH2O K1
Wei and Iglesia45,46 measured CH4 reaction rates on 7 % Ni/MgO catalyst in the
absence of detectable deactivation and of transport or thermodynamic corruption
of rate measurement. CH4 reaction rates remained constant for 100 h and
transport artifacts were ruled out by dilution of the catalyst pellet with inert Al2O3
and dilution of the catalyst bed with ground quartz. Reforming rates can be
rigorously obtained from measured net rates using an approach to equilibrium
parameter (η) evaluated from CH4-H2O thermodynamic reaction data and
measured reactant and product partial pressures:
η =[PCO] [PH2]3
[PCH4] [PH2O]
1
Keq
η =[PCO] [PH2]3
[PCH4] [PH2O]
1
Keq In this expression, [Pj] is the average partial pressure of species j (in atm); it is
also used to correct for reactant depletion. Keq is equilibrium constant for CH4-
H2O reaction. Forward turnover rates (rf) are given by:
rf =rn
(1- η)rf =
rn
(1- η) where rn is the net CH4 conversion turnover rate. CH4 reaction rate increased
linearly with increasing CH4 pressure, but it is not influenced by H2O pressure. H2
and CO products added to CH4-H2O reactant mixture influenced net CH4
conversion rate at 600°C, but forward rates were unaffected, indicating that H2
and CO affected only the extent to which reforming reactions approach
equilibrium, but not the kinetics of CH4 reforming reaction. Thus, previously
reported inhibition of CH4 reaction rates by products may reflect unrecognized
contributions from reverse reaction rates. CO adsorption enthalpies are 135
kJ/mol at low coverages (< 0.02) and much lower at higher coverages on Ni (1 0
0). These adsorption enthalpies indicate that CO coverages should be well below
0.01 monolayer at 600°C and even at equilibrium CH4 conversions. The lower
adsorption enthalpies typically reported for H2 (92 kJ/mol) would make hydrogen
coverages even lower than for CO. Thus, competitive adsorption is unlike to
64 Introduction
influence the availability of metal sites for CH4 activation and reported inhibition
effects predominately reflect contributions from reverse reactions.
These kinetic responses to reactant and product concentrations are consistent
with determining CH4 activation steps on surfaces, essentially free of reactive
intermediates or co-adsorbed products. CH4-derived chemisorbed intermediates
appear to be readily removed via reactions with H2O co-reactant; as a result, the
identity and concentration of co-reactant become kinetically irrelevant and
forward rate data for the steam reforming reaction is accurately described by:
rf = k PCH4 Catalytic reaction of CH4 with H2O to form H2-CO mixtures on Ni depends only on
the rate of the initial activation of C — H bonds, catalyzed by surface Ni atoms.
Co-reactant activation is easy and CH4-derived intermediates, including reactive
chemisorbed carbon, are kept well below monolayer coverages by their rapid
reactions with intermediates derived from H2O.
Isotopic tracing and exchange measurements confirmed the mechanism
proposed based on measured kinetic effects of reactant and product
concentrations of forward reaction rates.
Methane decomposes to chemisorbed carbon (C*) via sequential elementary H-
abstraction steps, which become faster as H atoms are sequentially abstracted
from CH4 reactants. Density-functional theory led to an activation energy of 142
kJ/mol for the first H-abstraction step in CH4 on Ni clusters, which decreased to
25-40 kJ/mol for CH2 formation from CH3. This cascade process leads to low CH*
coverages and to C* as the most abundant carbon-containing reactive
intermediate. Chemisorbed carbon is then removed using CO2 or H2O as co-
reactants (Fig. 1. 16)45. These elementary steps are consistent also with kinetic
and isotopic measurement on Ru, Pt, Ir and Rh catalysts. When exposed metal
atoms (*) are the most abundant surface species, only the rate constant for the
activation of the first C — H bond in CH4 appears in the rate expression and
reaction rates become first order in CH4 and independent of the presence or
concentration of H2O or CO2 co-reactants. Wei and Iglesia noted that these
elementary steps provide pathways for reactions of CH4 with either H2O or CO2
and also for water gas shift reaction which have been typically, but
inappropriately and non-rigorously, treated as independent kinetic process during
CH4 reforming45,46.
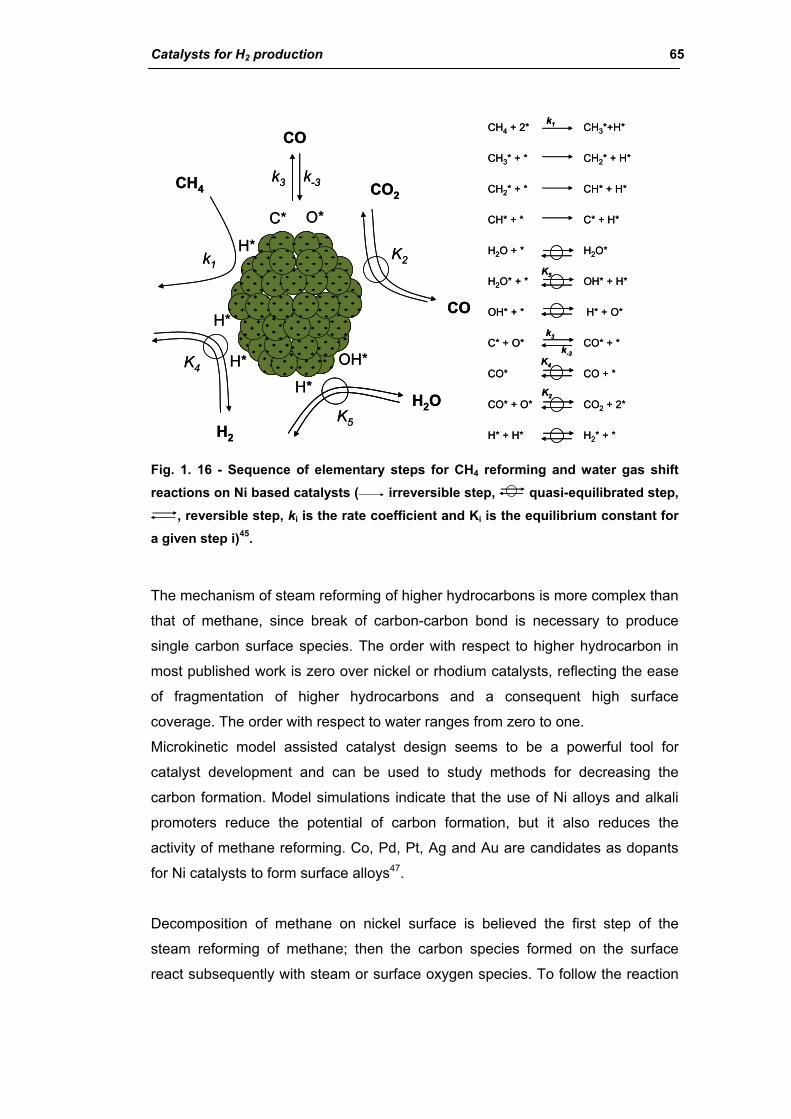
Catalysts for H2 production 65
C* O*
CO
CO
CO2
H2O
OH*
H*H*
H*
H2
CH4
H*
k3 k-3
K2
K5
K4
k1
C* O*
CO
CO
CO2
H2O
OH*
H*H*
H*
H2
CH4
H*
k3 k-3
K2
K5
K4
k1
CH4 + 2* CH3*+H*
CH3* + * CH2* + H*
CH2* + * CH* + H*
CH* + * C* + H*
H2O + * H2O*
H2O* + * OH* + H*
OH* + * H* + O*
C* + O* CO* + *
CO* CO + *
CO* + O* CO2 + 2*
H* + H* H2* + *
k1
K4
k3
k-3
K2
K5
CH4 + 2* CH3*+H*
CH3* + * CH2* + H*
CH2* + * CH* + H*
CH* + * C* + H*
H2O + * H2O*
H2O* + * OH* + H*
OH* + * H* + O*
C* + O* CO* + *
CO* CO + *
CO* + O* CO2 + 2*
H* + H* H2* + *
k1
K4
k3
k-3
K2
K5
Fig. 1. 16 - Sequence of elementary steps for CH4 reforming and water gas shift reactions on Ni based catalysts ( irreversible step, quasi-equilibrated step,
, reversible step, ki is the rate coefficient and Ki is the equilibrium constant for a given step i)45.
The mechanism of steam reforming of higher hydrocarbons is more complex than
that of methane, since break of carbon-carbon bond is necessary to produce
single carbon surface species. The order with respect to higher hydrocarbon in
most published work is zero over nickel or rhodium catalysts, reflecting the ease
of fragmentation of higher hydrocarbons and a consequent high surface
coverage. The order with respect to water ranges from zero to one.
Microkinetic model assisted catalyst design seems to be a powerful tool for
catalyst development and can be used to study methods for decreasing the
carbon formation. Model simulations indicate that the use of Ni alloys and alkali
promoters reduce the potential of carbon formation, but it also reduces the
activity of methane reforming. Co, Pd, Pt, Ag and Au are candidates as dopants
for Ni catalysts to form surface alloys47.
Decomposition of methane on nickel surface is believed the first step of the
steam reforming of methane; then the carbon species formed on the surface
react subsequently with steam or surface oxygen species. To follow the reaction
66 Introduction
steps, Matsumura and Nakamori48 separately fed methane and steam to the
catalysts at 500°C and analyzed the mechanism at the initial stage of the reaction
in which surface-active species participate.
The rate of the reaction of methane in absence of steam is significantly lower
than that of the steady steam reforming, suggesting that the presence of steam
which can oxidize the surface of Ni accelerates the decomposition of methane to
hydrogen48. The formation rate of hydrogen is high at the initial stage of the
reaction with methane on Ni/SiO2 and Ni/Al2O3 catalysts, and formation of carbon
oxides, which evidences presence of surface oxygen species, is accompanied.
Carbon monoxide is selectively formed in the reaction with methane over the
catalyst containing NiO. Hence, the reduction of nickel oxide results in formation
of carbon monoxide.
Formation of hydroxyl group on the surface of nickel (Ni-OH) is hypothesized in
the reduction process of NiO particles. It is also supposed that the hydroxyl group
is more reactive to methane and/or carbon monoxide than the lattice oxygen of
nickel oxide. Accumulation of oxygen on the surface of these catalysts can be
detected at the initial stage of the reaction with steam after methane
decomposition. In this process, reaction of:
H2O → H2 + O(surface)
and
2 H2O + C(surface) → CH4 + 2 O(surface)
are also probable. However, the contribution will be small because formation of
carbon monoxide, which is produced in presence of nickel oxide is small in the
reaction with methane after the contact with steam. Since the formation rates of
hydrogen and carbon dioxide increases gradually in the reaction with steam,
carbon dioxide cannot be formed in the direct reaction between steam and
surface carbon, but probably formed by the reaction with surface hydroxyl groups
whose concentration should be saturated under the continuous feed of steam.
That is:
C(surface) + 2 OH(surface) → H2 + CO2
will take place on the surface. Little methane is formed after the formation rate of
carbon dioxide is saturated, implying that the surface is mostly oxidized, because
formation of methane does not proceed in absence of metallic nickel which
accepts the oxygen in steam. After the feed of steam, following the reaction with
methane, formation of carbon dioxide
Catalysts for H2 production 67
CH4 + 2 OH(surface) → CO2 + 3 H2
can be observed with re-feed of methane, suggesting formation of surface
hydroxyl groups during the previous reaction with steam.
Mechanism of methane steam reforming at low temperature can be schematized
as:
CH4 + n S* → CHx-S*n + (4-x)/2 H2
CHx-S*n + O-S* → ½ x H2 + (n+1) S*
H2O + S* → O-S* + H2
H2 + 2 S* → 2 H-S*
In the mechanism, where S* represents an active site, the presence of oxide
causes formation of carbon monoxide and the process is similar to:
CH4 + O(surface) → CO + 2 H2
in the reaction solely with the methane
No reaction was observed at the initial stage of the methane decomposition over
20 % Ni/ZrO2 without reduction, suggesting that methane does not reduce nickel
oxide. Just after the induction period, CHx is probably formed on the partially
reduced surface and this leads to the formation of carbon monoxide and
hydrogen which also reduces the surface. Thus, formation of CO in the steam
reforming at 500°C will be caused from surface NiO species.
Since formation of carbon dioxide takes place in the presence of surface hydroxyl
groups [CH4 + 2 OH(surface) → CO2 + 3 H2, and C(surface) + 2 OH(surface) → CO2 + H2],
CHx-S*n + 2 HO-S* → CO2 + (1/2 x +1) H2 + (n+ 2) S*
may proceed on the surface in the steam reforming. Formation of hydroxyl
groups on the surface should be an important step also in the steam reforming at
500°C. In the case of Ni/ZrO2, accumulation of water on the support assists
formation of the hydroxyl groups, and this is probably the reason why zirconia is
an effective support of nickel in the steam reforming at 500°C. Formation of
carbon dioxide from carbon monoxide by water–gas shift reaction is possible in
the reaction mechanism, but no relationship between production of carbon
monoxide and carbon dioxide can be found in the reactions solely with methane
or steam7.
68 Introduction
2.1.3. Steam reforming catalysts
The catalyst must promote the desired reaction and be as inactive as possible
towards unwanted side-reactions, particularly to the formation of carbon. The
catalyst should also be as resistant as possible to poisons7.
The catalyst must be able to maintain its activity under the demanding process
conditions, necessary to promote the desired reaction (800-1000°C and 20-30
bar). With impregnated catalysts, an important parameter in maintaining activity
over prolonged periods is the nature of the support material and its pore
structure7.
The catalyst must be strong enough to withstand the handling it receives; from
manufacture to charging into the reformer, as well as the stresses generated by
the process conditions and the thermal cycles arising from plant start-up and
shutdown. The catalyst also must be of a suitable physical shape to provide an
appropriate geometric surface area to give an acceptable activity per unit volume
of packed bed whilst possessing acceptably low-pressure drop characteristics.
The support must not be affected by water condensing on it, nor must it produce
an unacceptable quantity of dust and material carryover, which could foul heat
exchangers and other catalysts downstream7.
For many years nickel has been recognized as the most suitable metal for steam
reforming of hydrocarbons, other metals can be used; for example cobalt
platinum, palladium, iridium, ruthenium and rhodium. Although some precious
metals are considerably more active per unit weight than nickel, nickel is much
cheaper and sufficiently active to enable suitable catalysts to be produce
economically.
The reforming reaction takes place on the nickel surface, so the catalyst must be
manufactured in a form that produces the maximum stable nickel surface area
available to reactants. This is generally done by dispersing the nickel as small
crystallites on a refractory support, which must be sufficiently porous to allow
access by the gas to the nickel surface.
This is usually achieved by precipitating nickel as insoluble compound, from a
soluble salt, in the presence of a refractory support such as mixtures of aluminum
oxide, magnesium oxide, calcium oxide and calcium aluminate cement.
Alternatively, the nickel can be incorporated by impregnating a preformed catalyst
Catalysts for H2 production 69
support, such as alumina or an aluminate, with a solution of a nickel salt which is
subsequently decomposed by heating to the oxide.
In either case, the nickel oxide is reduced to the metal by hydrogen supplied from
another plant, or by cracking a suitable reactant gas (e.g. ammonia) over the
catalyst as the reformer is being started up. In some instances process gas it self
is used to reduce the nickel oxide to metal as the reformer is gradually brought on
line.
Impregnated catalysts are generally stronger than precipitated catalysts, and this
is one of the reasons for their widespread use.
The activity of a steam reforming catalyst in service is closely related to the
available surface area of the nickel metal and the access the reactants have to it.
Most commercial natural gas catalysts are now of the impregnated type and give
a relatively high surface area when first reduced, but under normal reforming
conditions the surface area falls as sintering of nickel crystallites occurs. The
higher the temperature is, the more rapidly the sintering proceeds.
Activity is a function of the overall nickel content. However, it has been
demonstrated that with both impregnated and precipitated catalyst there is an
optimum beyond which an increase in nickel content does not produce any
further significant increase in activity. Typically, these optima are approximately
20 % for precipitated and up about 15 % for impregnated catalyst, but this
depends on the nature and physical properties of the actual support.
Steam reforming catalysts differ in the ease with which they reduce, and the
extent of reduction is influenced by the chemical nature of the catalyst support,
the reduction temperature and time, and the composition of the reducing gas.
The highest initial nickel surface area is obtained when the reduction is done
using pure hydrogen (rather than steam and hydrogen) and when the reduction
temperature is ~ 600°C. Below this temperature, reduction can be slow and
incomplete. Above 600°C, some sintering may take place, which lowers the
nickel surface area.
When steam is present, the surface areas can results lower, because sintering is
enhanced, and this process proceeds further to give even lower surface areas if
excessive reduction periods are employed. Nevertheless, for some catalyst,
particularly precipitated catalysts for naphtha reforming, reduction periods up to
twenty-four hours are recommended.

70 Introduction
In order to optimize the development of superior catalysts, it is essential to
understand the catalyst surface at the molecular level18. Choudhary and
Goodman18 summarize the studies related to methane activation on Ni catalyst.
The interaction of methane with Ni surfaces is of considerable importance
because steam reforming of methane is carried out on nickel catalysts.
The dissociation of methane is considered to be the rate-limiting step in SMR.
This has led to a great interest in investigating the fundamental sticking process
of methane on nickel single crystals. Ni single crystal studies have shown
methane dissociation to be structure sensitive18.
At a given temperature and for a given hydrocarbon feed carbon will be formed
below a critical S/C ratio49. This critical S/C ratio increases with temperature. By
promotion of the catalyst, it is possible to push this limit towards the
thermodynamic limit reflecting the principle of the equilibrated gas: “Carbon
formation is to be expected on nickel catalysts if the gas shows affinity for carbon
after the establishment of the methane reforming and the shift equilibria”.
By use of noble metals or sulphur passivation, it is possible to push the limit at
lower values. A safe design criterion is to require that the actual gas shows no
affinity for carbon formation. Whether carbon free operation is possible depends
on the kinetic balance as illustrated in the simplified two-step mechanism:
CH4 + * CHx*
CHx* C* [C, Ni] bulk whisker carbon
CHx* + OHy* gas
C* + OHy* gas
k 1
k 2
k 3
k 4
CH4 + * CHx*
CHx* C* [C, Ni] bulk whisker carbon
CHx* + OHy* gas
C* + OHy* gas
k 1
k 2
k 3
k 4
where * represents nickel site disregarding the ensemble size7.
For a nickel catalyst, carbon is normally formed by the whisker mechanism.
Adsorbed carbon atoms that do not react to gaseous molecules are dissolved in
the nickel crystal and carbon whiskers nucleate from the nickel support interface
of the crystal. Carbon formation is avoided when the concentration of carbon
dissolved in the nickel crystal is smaller than that at equilibrium, in other words,
when the steady state activity of carbon is smaller than one. The steady state
activity is proportional with [C*] which can be expressed by:
Catalysts for H2 production 71
ac
s ~ [C*] ~ ·k1 k2
k3 k4
1
[OH y*]2ac
s ~ [C*] ~ ·k1 k2
k3 k4
1
[OH y*]2 Hence, the steady state carbon activity can be decreased by:
─ Enhancing the adsorption of steam or CO2
─ Enhancing the rate of the surface reaction
─ Decreasing the rate and degree of methane activation and dissociation.
The whisker mechanism may also be blocked by use of noble metal catalysts
because these metals do not dissolve carbon.
Kinetic studies indicated that the adsorption of steam was enhanced by active
magnesia and alkali and that spill-over of adsorbed steam to the metal surface
may play a role. This was reflected by negative reaction orders with respect to
steam.
The improved adsorption of steam on magnesia supports, resulting in improved
resistance to carbon formation, is not a static but a dynamic effect. Enhanced
steam adsorption cannot reflect a true equilibrium constant. This would violate
the principle of microscopic reversibility, because steam is also adsorbed directly
on the nickel surface.
H2O + *sup H2O*sup
H2O*sup + *sup OH*sup + H*sup
OH*sup + *Ni OH*Ni + *sup
H2O + 2 *Ni OH*Ni + H*Ni
The above means that the spill-over of steam probably involves OH species
instead of molecular water7.
Apart from the enhanced steam adsorption on alkali promoted catalyst, it is well
known that the addition of alkali to steam reforming catalysts results in a
decrease of the reforming rate sometimes by more than one order of magnitude.
The effect has been observed on a number of different group VIII metals and on
a variety of supports. The decrease in reaction rate is due to lower pre-
exponential factors whereas the activation energies are almost uncharged. In
contrast, the enhancement of steam activation on magnesia-based catalyst has
no impact on pre-exponential factor. It is remarkable that the decline in activity
when promoting with alkali is also observed when testing the catalyst for
hydrogenolysis of ethane, i.e. without the presence of steam.
The impact of alkali is stronger on less acidic supports, which suggest that the
alkali partial pressure over the catalyst is important. A less acidic support has a
72 Introduction
weaker bounding of alkali resulting in easier transport (via the gas phase) from
the support to the metal. This effect of alkali on the activity of nickel is not fully
understood7.
The influence of alkali on the chemisorption of a number of different molecules on
transition metal surfaces has been explained as the result of electrostatic
interaction. It was found that, above a critical alkali coverage, the adsorbed H2O
is dissociated into OH and H. The maximum OH coverage is equal to the alkali
coverage. Both adsorbed H2O and OH are strongly stabilized by the presence of
alkali7.
A direct blockage of surface nickel atoms, with resulting ensemble control, was
observed over partly sulphur poisoned nickel catalysts. By controlling the sulphur
content in the feed, it is possible to establish a situation on the nickel surface with
ensembles available for the dissociation of methane, but not for the dissolution of
carbon atoms into the nickel crystal and nucleation of the whisker carbon. This
way of obtaining carbon free operation was brought into practice in the SPARG
process. Carbon formation on noble metals is probably prevented because
carbon is not dissolved in these metals, thus preventing the diffusion of carbon
through the metal to form whisker carbon. Palladium is the only noble metal that
still forms carbon, probably because of the formation of a carbide7.
Takehira et al50, 51, 52, 53 have proposed a solid phase crystallization (spc-)
method for the preparation of well-dispersed and stable metal supported catalyst,
starting from perovskite compounds (PVK) and hydrotalcite-like compounds
(HTlc) as the precursors. Starting from Mg–Al hydrotalcite precursors containing
Ni at the Mg sites, spc-Ni/MgAl catalysts have been prepared and were
successfully applied in the partial oxidation, the steam reforming, and the CO2
reforming of CH4.
There has been for the past decade an increased interest in the preparation of
mixed oxide catalysts using hydrotalcite-like compounds as precursors for
various reactions. Recently it was reported that spc-Ni/MgAl catalyst showed high
and stable activity for both steam reforming and autothermal reforming of CH4.
Such characteristics are equal to the ability of 1 wt. % Rh/MgO, reported as the
best catalyst. In spite of such good catalytic performance due to stable and highly
dispersed Ni metal particles, spc-Ni/MgAl catalysts have a drawback. Active Ni
species distribute uniformly from the surface skin to the core of catalyst particles,
since the catalysts was prepared by heating Mg(Ni)–Al hydrotalcite to form
Catalysts for H2 production 73
Mg(Al)–Ni–O solid solutions, followed by the reduction of Ni(II) included in the
structure. As a result, a considerable amount of Ni included in the catalyst bulk
becomes irreducible and therefore ineffective for catalysis. The preparation of
metal-loaded catalysts in egg shell-type will be anticipated, since active metal
species are concentrated in the surface layer of the catalyst particles where gas-
phase reactions preferentially proceed in the micro- or meso-porous space52.
Hydrotalcite is an anionic clay, layered mixed hydroxide containing exchangeable
anions and affords the mixed oxide by heating; it shows an interesting property,
i.e., a “memory effect”. This “memory effect” allows the reconstitution of the
original hydrotalcite structure under mild conditions when the product of the
thermal treatment is brought into contact with aqueous solutions containing
anions. By adopting this “memory effect” on the surface of Mg–Al mixed oxide
particle after thermal treatment, Takehira and coworkers52 have prepared egg
shell-type Ni-loaded catalysts. When the Mg–Al mixed oxide particles were
dipped in aqueous solution of Ni(II) nitrate, Mg–Al hydrotalcite was reconstituted
on the surface of particles and Ni(II) substituted for the Mg(II) sites. After the
calcination followed by the reduction of the particles, active spc-Ni/MgAl phase
was formed in the surface layer of the particle, resulting in the formation of egg
shell-type Ni-loaded catalyst as s(surface)-spc-Ni/MgAl. The egg shell-type
loading was substantially affected by the heating rate and the calcinations
temperature of Mg–Al hydrotalcite to the mixed oxide and by the dipping
conditions, i.e., pH of aqueous solution of Ni(II) nitrate and the dipping time.
Surface-solid phase crystallization (s-spc) Ni/MgAl catalyst was prepared by
adopting the “memory effect”, i.e., reconstitution of Mg–Al hydrotalcite from Mg–
Al mixed oxide and spc-method was just applied in the surface layer of the mixed
oxide particle. Mg–Al (3/1) mixed oxide particles were prepared as the catalyst
supports starting from Mg–Al (3/1) hydrotalcite, [Mg6Al2(OH)16CO3] • 4 H2O, and
were dipped in an aqueous solution of Ni(II) nitrate. Upon dipping, reconstitution
of Mg–Al hydrotalcite took place in the surface layer and a part of the Mg(II) sites
were replaced by Ni(II). After the calcination, followed by the reduction, s-spc-
Ni/MgAl catalysts were obtained and showed high activity due to surface
enrichment of highly dispersed Ni metal particles. Egg shell-type Ni-loaded
catalysts showed a high and stable activity in the steam reforming of CH4. It was
concluded that the high activity is mainly due to the enrichment of stable and
highly dispersed Ni metal particles in the surface layer of the catalyst particles52.
74 Introduction
Catalysts were prepared from hydrotalcite precursors, characterized and tested in
the reaction of methane steam reforming to produce hydrogen also by Assaf and
Fonseca54. The precursors were synthesized by the traditional technique, with co-
precipitation of Ni, Mg and Al nitrates with carbonate; co-precipitation of Mg and
Al nitrates with pre-synthesized nickel chelate and anion-exchange of NO3− of
hydrotalcite with nickel chelate. The catalytic tests demonstrated high methane
conversion, high activity for hydrogen production and high stability during the time
of reaction for a molar ratio in the feed H2O:CH4 = 2:1. The low quantity of carbon
formed on the catalysts surface confirmed the hypothesis that the structure of
hydrotalcite layers leads to a homogeneous distribution of the active phase.
Comparing the different methods of preparation, it was shown that the precursors
obtained by means of Ni chelates were the most active in converting methane,
with a high hydrogen yield, probably because they provided the best distribution
of the active phase54.
Recently, Strurzenegger and coworkers55 have tested nickel iron oxide (NiFe2O4)
as a combined catalyst precursor and oxygen transfer material for improved
conversion of methane into syngas.
Alloying Fe3O4 with NiO to a spinel-type nickel iron oxide turned out to be a
promising path for adding catalytic functionality to the native iron oxide. The
reaction of the ternary metal oxide with humidified CH4 comprises two
characteristic phases. During the early phase, oxidation of methane by lattice
oxygen is the prevailing reaction. This leads to a two-phase mixture consisting of
a nickel-deprived spinel phase and a Ni-rich alloy. As the amount of the Ni-rich
alloy increases, catalyzed steam reforming of CH4 becomes increasingly
important. Once all Ni is deprived from the spinel phase, the bulk reaction
terminates and steam reforming of methane is the only reaction.
The reduction of the bed material is reversed by exposure to steam. Though this
reaction is slower than that with pure or diluted O2, it is advantageous because it
produces H2 rather than heat. The reaction with steam is also a key step in
catalyst regeneration. First, oxidation and re-integration of Ni drives off many
prominent catalyst poisons, specifically sulfur, as thermodynamics predicts
conversion of nickel sulfides into nickel iron oxides at high water vapor pressure.
Recycling of the parent spinel phase has thus a similar purification effect as re-
crystallization and minimizes the accumulation of undesired elements in the fixed

Catalysts for H2 production 75
bed. Second, each recovery of the parent spinel phase re-disperses the nickel on
an atomic scale, allowing for a repeated formation of fresh Ni-alloy particles
under conditions similar to those during the first reduction. The benefit of re-
dispersion was also emphasized by Provendier et al.56 while discussing
regeneration of Ni/LaFeO3/La2O3 to the parent perovskite-type LaNi1−xFexO3 by
calcination in air.
The design of a steam reforming catalyst support must reflect the need for it to be
robust at high temperature and pressure. It must also be suitable for the
dispersion of nickel crystallites and allow access of the reacting species, but it
must not interfere with their activity. If possible, it should promote or at least
sustain the activity of the nickel, but it must not catalyze side-reactions,
particularly those which produce carbon deposits.
Good physical properties can be obtained by using a simple α-alumina that is
calcined at 1500°C.
A particularly useful range of catalysts are produced from a support which is
derived from a mixture of alumina and hydraulic cement that is processed to a
porous calcium aluminate. This support is less acidic than α-alumina, and is
therefore less susceptible to carbon formation initiated by hydrocarbon-cracking
reactions.
Spinel is a ternary oxide with a chemical formula of AB2O4, where A is a divalent
metallic cation in a tetrahedral site and B is a trivalent metallic cation in an
octahedral site of the cubic structure57. Magnesium aluminate spinel (MgAl2O4)
has a specific combination of desirable properties such as: high melting point
(2135°C), high resistance to chemical attack, good mechanical strength from
room temperature to high temperatures, low dielectric constant, excellent optical
properties, low thermal expansion and good catalytic properties. Conventionally,
the spinel (MgAl2O4) is prepared through a reaction in the solid state using MgO
and Al2O3. In this process, the mixture is calcined at high temperatures such as
1400–1600°C. An effort to synthesize MgAl2O4 at lower temperatures has been
reached by using chemical synthesis processes, especially chemical co-
precipitation and sol–gel processes, where the spinel phase is formed at
temperatures around 700°C. The MgAl2O4 can be formed at temperatures lower
than 675°C by the co-precipitation method involving the dehydration of a solution
of metallic ion complexes with tri-ethanolamine. However, these chemical
76 Introduction
processes have disadvantages over the conventional solid-state reaction. The
co-precipitation method has difficulties in pH control because there is solid
precipitation and the removal of anions that are in the solids as impurities,
changing the final composition. The sol–gel method, which uses a mixture of
aluminum and magnesium salts that are submitted to pyrolysis, also has
impurities in the solids. Catalysts obtained through nickel impregnation in
inorganic supports have been employed in industry to catalyze the steam
reforming of hydrocarbons. Due to its resistance to sintering, the magnesium
aluminate spinel has been used as a catalyst support for methane reforming. It
was observed a high activity and stability of a Ni/MgAl2O4 catalyst for dry
reforming of methane, which was attributed to the interaction between the active
phase Ni and the support, resulting in highly dispersed active Ni species. This
catalyst exhibited higher activity and better stability when compared to Ni/γ-Al2O3
and Ni/MgO-γ-Al2O3 catalysts.
The addition of small amounts of Pt (0.09%) to Ni/Al2O3 catalyst resulted in a
significant increase of its activity in methane reforming with CO2 and O2. It was
found that the addition of Pt, Pd and Ir (< 0.3 %, by weight) in Ni/γ-Al2O3 catalysts
(15 % Ni, w/w) strongly promoted conversion of methane in an autothermal
reforming reaction.
MgAl2O4 was synthesized by Foletto and coworkers57 through hydrolysis of
metallic alkoxides of Mg2+ and Al3+. The formed spinel precursor phase was
calcined at temperatures between 600 and 1100°C, for 4 h. The spinel was
utilized as a Ni/Pt catalyst support. The Ni/MgAl2O4 catalysts (15 % Ni, w/w)
containing small amounts of Pt were tested for methane steam reforming. The
spinel phase was formed at temperatures above 700°C. The addition of small
amounts of Pt to Ni/MgAl2O4 promoted an increase in surface area. This noble
metal promoted an increase in the surface area. This probably caused the
considerable increase in methane conversion57.
Nickel is increasingly studied for the methane-reforming catalysis with various
oxides, either classical (Al2O3, SiO2, MgO, TiO2) or less conventional ones (ThO2,
CeO2, ZrO2, Cr2O3, Nb2O5)58. It appears that, besides the elaboration process, the
nature of the interaction between the nickel and the support, in the form of
specific phases, plays a determinant role for the catalytic properties. For
example, the formation of phases, such as nickel aluminate spinel, NiAl2O4, on
Catalysts for H2 production 77
alumina leads after reduction to highly dispersed catalysts with a high selectivity
and a great resistance against sintering and poisoning. However, these phases
are only partially reduced by conventional methods (hydrogen reduction at high
temperature) and their activity is drastically low. Nevertheless, even though the
role of the tight interaction support metal is widely studied, it is still subject to
discussion and yet far from being well understood. The catalyst properties may
be due to a combination of intrinsic size effects and support effects58.
As an alternative way, irradiation has been proven to be a powerful tool to reduce
metal ions into highly dispersed and size-controlled metal clusters. Actually, the
specific properties, distinct from the bulk, of ‘quasi-atomic’ metal were
demonstrated for the first time for nascent metal produced by irradiation. The
aggregates of a few atoms only were much easily oxidized than the bulk metal.
These new specific properties could explain why nanosized metal clusters are
difficult to stabilize but they could induce higher activity. The radiation-induced
reduction of metal ions into atoms is achieved by solvated electrons generated
from the solvent and by electrons generated from the support, both having the
strongest reducing power. Therefore, all ions, including non-noble metals, are
reducible by electrons. Due to the radiation penetration, the reducing species are
produced - without any chemical additive. In addition, the reduction is carried out
at room temperature, which is favorable to prevent sintering. The radiolytic
process has been extensively used to synthesize noble metals as nanocolloids or
supported clusters. Using the radiolytic technique in both regimes (steady-state
and pulsed radiolysis), it was improved the understanding of the primary steps of
the formation of mono- and multi-metal aggregates and the nucleation–
coalescence processes. This has permitted to obtain clusters of controlled size
and structure (alloyed or core shell)58.
Non-noble metal clusters are still more difficult to synthesize at very small sizes,
since their fragility to oxidation still exists up to high nuclearities. The atoms and
the primary oligomers are highly oxidable and can be corroded as soon as they
are produced. However, using appropriate conditions, nickel and other metal
nanocolloids were produced by radiation-induced reduction. Irradiation has also
been used in some cases as a complementary treatment of Ni-alumina samples,
before or after the classical reduction by hydrogen gas, in view of creating
defects in the support and improving the catalytic properties of the solids58.
78 Introduction
A series of Ni aggregates supported on α-Al2O3 at different nickel contents are
prepared by ionic exchange of Ni2+ followed by γ-irradiation under inert
atmosphere. The radiation-induced reduction of Ni ions and the synthesis of Ni
clusters, under wet conditions already known for nanocolloids, was successfully
adapted to the elaboration of Ni particles supported on α-alumina. When used as
catalysts for the steam-reforming methane reaction to produce synthesis gas,
they act with a remarkable high selectivity in CO (80%), even at low temperature
(550°C). The reasons are probably due to combination of the influence of the
radiation on both the metal and the support, particularly on the interface58.
The presence of silica would further increase the already adequate strength of
the support, but as silica is volatile in the presence of steam at high temperatures
only very small quantities can be used, except in naphtha steam reforming
catalysts when it is combined with potassium which significantly reduces its
partial pressure under reforming conditions.
Magnesia can also be included in some formulations, but has to be used with
caution and understanding, however, as under certain conditions, it can hydrate
and markedly weaken the catalyst. During start-up or shutdown in the presence
of reaction steam only, hydration of the magnesia can take place below 425°C
and, since the molar volume of Mg(OH)2 is almost twice that of MgO, a dramatic
weakening of the support may result unless the MgO is formulated in such a way
that is chemically associated with other refractory oxides. If this is not done
reformer start-ups and shutdowns must ensure that, the catalyst is in a dry
atmosphere whilst temperatures are below the critical hydration temperatures7.
Effects of supports such as silica, γ-alumina, and zirconia for nickel catalysts
have been studied in steam reforming of methane at 500°C48. The activity of the
nickel supported on silica reduced with hydrogen at 500°C decreases with
oxidation of nickel particles by steam during the reaction. Nickel supported on γ-
alumina is not much reduced with hydrogen at 500°C and is inactive in the
reforming at 500°C. However, the catalyst reduced at 700°C is fairly active while
nickel is partially oxidized during the reaction. Nickel supported on zirconia is the
most effective in the steam reforming at 500°C7.
Fujimoto and coworkers59 studied a Ni-Mg-O solid solution with low Ni content
(Ni0.03Mg0.97O, atomic ratio) which was reduced at high temperature (> 800°C)
and was found to be an active and stable catalyst for the steam reforming of
Catalysts for H2 production 79
methane in a steam to carbon ratio of 1.0. The reduced Ni0.03Mg0.97O catalyst
showed higher activity and much higher stability than a commercial reforming
catalyst (Ni/Al2O3-MgO). The catalyst kept its activity for 60 h or more at 900°C
and a steam to carbon ratio of 1.0, giving little coke on the catalyst (< 1 wt %),
whereas the commercial steam reforming catalyst lost its activity at 20 h because
of severe coking under the same reaction conditions. For both Ni0.03Mg0.97O and
Ni/Al2O3-MgO, the rate equations were similar. Thus, it was suggested that the
suppressed coke formation of the Ni0.03Mg0,97O catalyst is caused by the very
small nickel particles and the difference in the composition of surface
carbonaceous species on the Ni metal particles as the reaction intermediate.
Ni0.03Mg0,97O solid solution catalyst has high resistance to carbon deposition in
steam and dry reforming of methane, but the deactivation due to oxidation of
active nickel species was observed under some reaction conditions. This
deactivation was avoidable by the addition of hydrogen to reactant gas. On
Ni0.03Mg0,97O catalyst, nickel particles were much more dispersed than that on 3
mol % Ni/MgO and CO2 was adsorbed on Ni0.03Mg0,97O similarly to MgO. In
addition, CO2 was activated on Ni0.03Mg0,97O at 60°C lower temperature than on 3
mol % Ni/MgO. This is suggested to be promoted by large interface between
metal and support, and strong interaction of CO2 with support surface. Combined
with the results of reaction order, it is suggested that high resistance to carbon
deposition in methane dry reforming is closely related to high ability of CO2
activation and this causes rapid oxidation if carbon species on nickel before
converting to deposited carbon60.
Reactions used to model the steam reforming of natural gas show that the
influence of the support on the performances of the metal is minimal. On the
other hand, hydrogen produced during the reactions adsorbs on the metal and
can spill over to the support. The spilt over hydrogen could be responsible in part
for the gasification of carbonaceous residues61.
In the industrial viewpoint, Al2O3-based supports are preferred because of their
easier availability in the reforming processes. Therefore, Ni/Al2O3 and Ni/MgAl2O4
have been used as catalysts for SMR. As an alternative, Ni/γ-Al2O3 could be
considered. However, it is unstable at high temperature (>700°C) because of the
thermal deterioration of the γ-Al2O3 support that causes sintering and leads to
pore closing and reduction in surface area as well as phase transformation into

80 Introduction
α-Al2O3 which changes an active surface layer and promotes a low surface area
structure. Thus, Jun and coworkers62, 63, 64 carefully changed γ-Al2O3 into θ-Al2O3
and modified θ-Al2O3 with Ce–ZrO2 because Ni/Ce–ZrO2 exhibited good
performance in methane reforming reactions. The catalyst was remarkably
deactivated by steam treatment but reversibly regenerated by H2-reduction. The
steam treatment resulted in the formation of NiAl2O4, which is inactive for SMR,
but it was reversibly converted to Ni by the reduction. The reversible oxidation-
reduction of Ni state was evidenced and it was observed that the formation of
NiAl2O4 is more favorable at higher temperature. It is most likely that the alumina
support is only partially covered with Ce–ZrO2 and most Ni directly interacts with
θ-Al2O3, which would probably make easy formation of NiAl2O4 in the presence of
steam alone. The results imply that, during the start-up procedure in SMR, too
high concentration of steam could deactivate seriously Al2O3 supported Ni
catalysts62.
Xu et al65 had explored the use of oxide nanoparticles for catalysts founding that
the Ni catalyst ‘supported’ by small nanoparticles of ZrO2 (7–25 nm) or MgO (10–
12 nm) can be highly active and extremely stable for the steam and the dry
methane reforming reactions at 700–800°C. In contrast to conventional oxide-
supported metal catalyst having discrete metal nanocrystals (1–20 nm) supported
on oxide particles that are often one to several orders of magnitude larger than
the metal nanocrystals, the stable Ni/ZrO2 catalysts appear as nanocomposites of
comparably sized Ni-metal (10–15 nm) and zirconia nanocrystals (7–25 nm). Ni
catalysts supported on conventional oxide supports are not able to avoid coking
and deactivate rapidly under the same conditions. They tested nanocomposite
Ni/ZrO2 catalyst for the SMR reaction with a stoichiometric mixture of steam and
methane in a wide range of feed space velocities. The nanocomposite catalyst is
claimed to be superior to Ni catalysts supported on bigger particles of
conventional oxides (Ni/ZrO2 and Ni/Al2O3) for the SMR reaction65.
Addition of promoters into the catalysts is the simplest and cheapest way to
improve their quality. For example, molybdenum added to nickel catalysts in
small amounts (≤ 0.5 wt. %) is a promoter, which significantly increases catalysts
resistance to coking in the steam reforming (decreasing coking rate and
lengthening induction time). With the addition of such amounts of Mo, loss of
Catalysts for H2 production 81
catalytic activity was not observed66. Effectiveness of promoter depends on the
type of hydrocarbon reaction (reforming, hydrogenolysis, cracking), and in the
case of steam reforming on the ratios of reactants (H2O/CnHm) and pH2O/pH2 in the
reaction mixture. The prepared catalyst66 was Ni–Mo/γ-Al2O3. Heating of the
catalysts in the H2O : H2 mixtures at the temperature 500–600°C caused
important changes in the mean oxidation number of surface Mo atoms. The same
treatment at the higher temperature resulted in the bulk changes and the
formation of MoO2 phase. H2O into gaseous atmosphere affects the oxidation
states of Mo and Ni. Concentration of oxygen atoms on the surface of Ni–
Mo/Al2O3 catalysts after heating in the H2O : H2 mixture (so at conditions similar
to the steam reforming of hydrocarbons) was higher than that on the nickel
catalyst surface. The experiments confirmed surface reactions between water
vapor and molybdenum under the conditions of steam reforming of hydrocarbons,
which change the oxidation state of promoter atoms due to their oxidation.
Hence, it was supposed that in the steam reforming reaction of hydrocarbons the
presence of larger number of oxygen atoms on the surface of Ni–Mo catalysts
may facilitate gasification of the “CHx species” and limit their transformation into
inactive deposit. It decreases the rate of carbon deposit formation66.
Nickel catalysts supported on silica–zirconia mixed oxides were prepared67 by
homogeneous precipitation in sol–gel-derived wet silica gel. Their structural
properties and catalytic performance in steam-reforming of methane were
investigated from the viewpoint of steam resistance. Ni/SiO2 without zirconia
readily loses its catalytic activity during the reaction because the coarsening of
silica that occurs in the presence of high-temperature steam hinders the active
surface of Ni. The addition of zirconia drastically increases the steam resistance
of silica. Ni/SiO2-ZrO2 catalyst shows steady activity in steam-reforming of
methane without any changes in pore structure67.
From an industrial point of view, the development of nickel catalysts with greater
resistance to coking is thus an attractive research goal68.
An effective approach to developing such nickel catalysts is to focus on the
selection and modification of catalyst supports. It is widely accepted that the
addition of alkali, alkali earth oxides and rare earth metal oxides to the α-Al2O3
support or the use of basic metal oxides as the support improves resistance to
82 Introduction
coking. This positive effect is understood to result from the enhancement in
steam adsorption, in the oxidation rate of CHx fragments adsorbed on metallic
nickel and/or the reduction of methane activation and dissociation.
Although improvements of the support greatly influence catalytic activity and/or
resistance to coking, limited attempts have been made to apply oxygen-ion
conducting oxides, for instance CeO2 and perovskite-type oxides, to the steam
reforming catalysts.
It is mechanistically expected that oxidation of CHx fragments adsorbed on
metallic nickel would be promoted by the lattice oxygen in oxygen-ion conducting
oxides and that the consumed lattice oxygen would be regenerated by steam.
Such a mechanism has specifically been proposed for CO oxidation and dry
reforming of methane. Huang and coworkers69, 70, 71 have evaluated the activity
of nickel supported on ceria-based ion-conducting oxides for dry reforming of
methane and have pointed out that the lattice oxygen in modified ceria may play
some positive roles in the activation of methane and carbon dioxide. Takehira et
al.50 have reported that the perovskite-type oxides such as SrTiO3, CaTiO3,
BaTiO3 that contain a small amount of nickel in the titanium sites show high
catalytic activities with high resistance to coking, due to the high dispersion of
nickel. These researchers also examined oxygen mobility in perovskites, and
found that the high resistance to coking might be partly due to the migration of
mobile oxygen from the perovskite support to the metallic nickel particles.
The catalytic activity and resistance to coking of nickel catalysts supported on a
variety of the perovskite-type oxides (LaAlO3, LaFeO3, SrTiO3, BaTiO3,
La0.4Ba0.6Co0.2Fe0.8O3−δ) were compared to those of the conventional Ni/α-Al2O3
catalyst for steam reforming of methane under the conditions of 800°C,
atmospheric pressure and a molar H2O/CH4 ratio of 268. To investigate
differences in catalytic activity among the Ni/perovskite catalysts examined, the
dispersion and reduction properties of nickel and the roles of the lattice oxygen
on the catalytic activity and carbon deposition were examined. Ni/LaAlO3 and
Ni/SrTiO3 showed high catalytic activities among the Ni/perovskites and longer-
term stabilities than the conventional catalyst. Temperature programmed
oxidation of carbon deposited on used catalysts revealed that inactive carbon
species detected on Ni/α-Al2O3 were not formed in the case of Ni/LaAlO3. The
results of temperature programmed reduction confirmed that consumption and
recovery of the lattice oxygen in perovskites occurred during the reaction, and
Catalysts for H2 production 83
that the reducibility of perovskites had a great impact on the steam reforming
activity. The lattice oxygen in perovskites is considered to play important roles in
promoting the oxidation of CHx fragments adsorbed on metallic nickel.
Both the reducibility and the particle size of nickel were found to be related to
catalytic activities. These results suggest that the lattice oxygen in LaAlO3 and
SrTiO3 accesses CHx fragments adsorbed on nickel readily due to the large
amount of lattice oxygen near the surface of the perovskite, and interfaces
between the nickel particles and the support. Thus, Ni/LaAlO3 and Ni/SrTiO3 have
high catalytic activities. The lattice oxygen in LaAlO3 and SrTiO3, thus plays a
positive role in both promoting the oxidation of CHx fragments adsorbed on
metallic nickel and in hindering the production of inactive carbon species68.
A novel anode La1−xSrxCr1−yNiyO3−δ (x = 0.1, 0.2, 0.3, 0.4 and y = 0.05, 0.1) for
solid oxide fuel cells (SOFCs) operated under methane has been tested
regarding its catalytic activity for methane steam reforming and its structure
characterized72. Powders were synthesized by solid-state reaction. The
steam/methane ratio was between 0.5 and 1.
The strontium and nickel-doped lanthanum chromite has been shown to have
some catalytic activity for methane steam reforming. The main point was the
absence of carbon deposition for a steam/methane ratio equal to 1 or less at
850°C. The highest catalytic activity was obtained with 30 mol % of strontium and
5 mol % of nickel, synthesized at 1400°C during 4 h. This synthesis temperature
seems to be necessary in order to obtain a complete solid-state reaction. The
maximum in conductivity seemed to be either between 30 and 40 mol % of
strontium, or slightly above 40 mol %. With nickel content higher than 5 mol % of
nickel, the catalytic activity decreased and some nickel/chromium agglomerations
were observed after catalytic tests72.
Wang et al prepared a series of Rh/MgO - Al2O3 catalysts with varying Rh
loadings (1, 5 and 10 %) and 6 wt % MgO by an incipient wetness method. Rh
loading was optimized on a stable MgO - Al2O3 support to improve the volumetric
productivity for methane conversion. Catalyst activities were stable over a wide
range of steam/carbon ratios. In particular, experimental results demonstrated
that Rh/MgO - Al2O3 catalysts are extremely active for methane steam reforming
and are resistant to coke formation at stoichiometric steam/carbon ratio of 1 for
84 Introduction
over 14 h time-on-stream with no sign of deactivation. Methane steam reforming
activities on this catalyst were compared in both a microchannel reactor and a
conventional micro-tubular reactor. Significant performance enhancement was
observed in microchannel reactors owing to improved heat and mass transfer73.
Highly active and coke-resistant Rh catalysts were developed for methane steam
reforming in micro-channel chemical reactors73. Conventional methane steam
reforming processes suffer severe mass and heat transfer limitation, and the
effectiveness factors of catalysts are typically less than 5%. Micro-channel
reaction technology, which has been developed over the past decade, provides a
potential breakthrough solution to the challenge of methane steam reforming
processes. Micro-channel reactors have a sandwich-like multi-layer structure
consisting of a large number of closely spaced channels with a gap of less than 1
mm, which reduces heat and mass transport distance and thus enhancing the
overall efficiency. Consequently, micro-channel reactors allow process
intensification and unprecedented temperature control. Heat transfer coefficients
in micro-channel reactors are as high as 10,000–35,000 W/m2K compared to
100–700 W/m2K in conventional reactors. Such high heat transfer coefficients
coupled with the high surface-to-volume ratio achievable in micro-channel
reactors permit the operation of highly endothermic methane steam reforming at
near isothermal conditions and provide the potential to improve significantly the
efficiency of methane steam reforming process73.
The effect of Ru loading added to the Ni-catalyst was investigated74, it was found
that the presence of Ru strongly enhances the catalytic performance of the Ni-
based catalyst when increasing Ru loading up to 2 wt %. Effect of Ni loading to
the Ru-based catalyst system was also investigated. It was found that the
addition of nickel to the Ru-based catalyst up to 15 wt% enhanced significantly
the catalytic activity of the catalyst. The lifetime of the Ru–Ni catalysts in the
reforming of m-cresol was tested at 750°C (m-cresol was used as a
representative model compound for the coal tar or lignin-derived oils). In
agreement with general observations of the use of Ni monometallic catalyst,
deactivation of the catalyst due to the carbon deposition reaction already
occurred in the reforming of the oxygenated compound. On the other hand, a
reasonable high resistant on the carbon deposition in the reforming of m-cresol
Catalysts for H2 production 85
was given by the 2 wt % Ru – 15 wt % Ni catalyst system. An effort in improving
the strength of the catalyst support with this catalyst system was also conducted,
and the catalyst showed significant increase in the stability of the reforming of
oxygenated aromatic compound74.
Palladium (Pd) supported on CeO2-promoted γ-Al2O3 with various CeO2 (ceria)
crystallinities, were used as catalysts in the methane steam reforming reaction75.
Pd was found present on the oxidized CeO2-promoted catalysts as Pd0, Pd+ and
Pd2+, at ratios strongly dependent on CeO2 structure. Pd was well dispersed
(particles < 2 nm) on crystalline CeO2 and was agglomerated as large clusters
(particles in 10–20 nm range) on amorphous CeO2. After pre-treatment under H2
or in the presence of amorphous CeO2, partial encapsulation of Pd particles
occurred. CeO2 structure influenced the CH4 steam reforming reaction rates.
Crystalline CeO2 and dispersed Pd favor high reaction rates (low activation
energy). The presence of CeO2 as a promoter conferred high catalytic activity to
the alumina-supported Pd catalysts. The catalytic activity was significantly lower
on Pd/γ-Al2O3 or on amorphous (reduced) CeO2/Al2O3 catalysts. The reaction
rates were found two orders of magnitude higher on Pd/CeO2/γ-Al2O3 than on
Pd/γ-Al2O3, due to a catalytic synergism between Pd and CeO2. The low rates on
the reduced Pd/CeO2/Al2O3 catalysts were correlated with the loss of Pd sites
through encapsulation or particle agglomeration, a process found mostly
irreversible after catalyst regeneration75.
CeO2 (ceria) has been extensively employed as a textural and structural
promoter for supported noble metal catalysts. Its promotion effect was attributed
to excellent thermal and mechanical resistance, propensity to non-stoichiometry
and oxygen-storage capacity. Due to its properties, structure and capabilities of
storing and releasing oxygen, CeO2 is an important component in automotive,
emission-control (oxidation) catalysts, selective oxidation in fine chemicals
synthesis and solid oxide fuel cell applications.
CeO2 addition to a Ni-supported catalyst was found to decrease carbon
deposition and increase the catalyst life and activity. Noble metal based catalysts
(Pt, Pd and Rh) deposited on various supports such as Al2O3, CeO2, ZrO2, or
NiO, tested in regular tubular reactors or more recently in membrane design
reactors, provided good catalytic activity in methane, propane or n-butane steam
reforming reactions. The promoting effect of CeO2 on Pt, Pd and Rh catalysts

86 Introduction
was proven for CO oxidation, water gas shift and CH4 steam reforming. The state
of CeO2 reduction affects the activity of Pt/Ce–Zr oxides in CO oxidation. For
various CeOx stoichiometries corresponding to various degrees of reduction, the
activation energy increases as the degree of ceria reduction increases.
2.1.4. Carbon formation on reforming catalyst
Coking or the formation of carbonaceous deposits is an important side reaction in
many industrial processes. Very often, measures to eliminate or depress coke
formation are more decisive for the process layout than, for instance, the activity
of the catalyst76.
Deactivation of supported metal catalysts by carbon or coke formation is a
problem of serious magnitude in steam reforming. Its causes are generally
threefold:
1) fouling of the metal surface,
2) blockage of catalysts pores and voids,
3) actual physical disintegration of the catalyst support.
Carbon may chemisorb strongly, as a monolayer, or physically adsorb in multi-
layers and, in either case, block access of reactants to metal surface sites.
Furthermore, carbon may totally encapsulate a metal particle, and thereby
completely deactivate that particle, and plug micro- and macropores such that
access of reactants is denied to many crystallites inside this pores. Finally, in
extreme cases, strong carbon filaments may build-up in pores to the extent that
they stress and fracture the support material, ultimately causing disintegration of
catalyst pellets and plugging of reactor voids77.
Since loss of catalytic activity and physical destruction of the catalyst by carbon
deposits can occur rapidly (within hours or days) under unfavorable conditions,
understanding and control of these effects are of major technological and
economical importance78.
Carbon accumulation can also cause spalling and pulverization of catalysts,
which can also lead to poor heat distribution79.
Carbon is a product of CO disproportionation while coke is produced by
decomposition or condensation of hydrocarbon on metals. Nevertheless, coke
forms may vary from high molecular weight hydrocarbons such as condensed

Catalysts for H2 production 87
polyaromatics to carbon such as graphite, depending upon the conditions under
which the coke was formed and aged (Fig. 1. 17).
CnHm (a) Cα (a) + H (a) + CHx(a) + C2Hy (a) + … + CnHz
C in Ni (carbon in solid solution) Cv (vermicular carbon)
Cα (a) Cγ (s) (metal carbide)
Cβ (s) CC (s) (amorphous and graphitic carbons)
CH4 (a) CH4 (g)
2 H (a) H2 (a) H2 (g)
CH4 (a) CH4 (g)
CHx
condensed high mol. Wt. HC (a) Cα, Cβ, CC + H2 (g)
(coke) (carbon)
C2Hy + … + CnHz
4 H (a)
+ (4 – x) H (a)
Fig. 1. 17 - Formation, gasification and transformation of coke and carbons on metal surfaces from hydrocarbons (a = adsorbed, g = gaseous, s = solid).
Three different kinds of carbon or coke species are observed in steam reforming
(Tab. 1. 2):
1) whiskers like carbon formed at temperature greater than 450°C,
2) encapsulating hydrocarbon films formed by polymerization at less
than 500°C,
3) pyrolytic carbon from cracking of hydrocarbon above 600°C.
Formation of carbon deposits via CO decomposition (Fig. 1. 18) may involve the
production and transformation of various carbon forms, adsorbed atomic carbon
(Cα), amorphous carbon (Cβ), vermicular carbon (CV), bulk nickel carbide (Cγ) and
crystalline, graphitic carbon (CC), the structural reactivities of which are
summarized in the Tab. 1. 3. The presence of dispersed or atomic carbon, stable
below 325°C, which can be also surface nickel carbide, and polymerized carbon
stable above 325°C was confirmed. Nickel carbide can be easily removed by H2
at the same temperature.
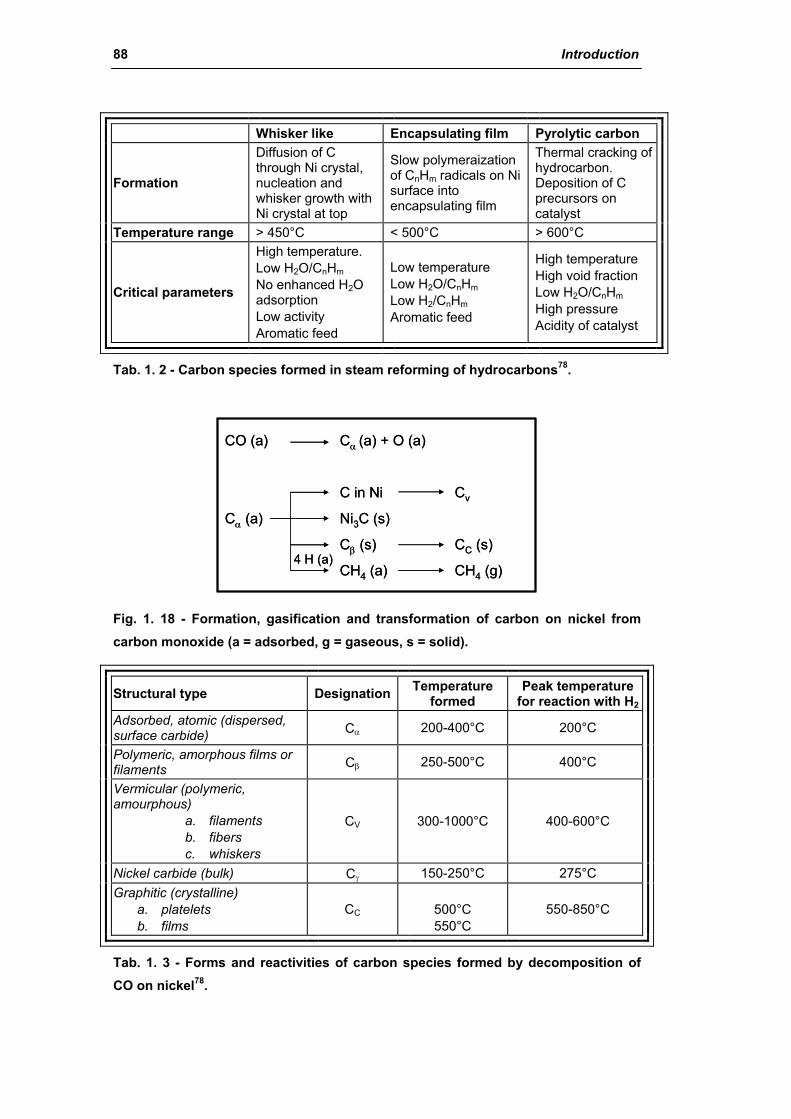
88 Introduction
Whisker like Encapsulating film Pyrolytic carbon
Formation
Diffusion of C through Ni crystal, nucleation and whisker growth with Ni crystal at top
Slow polymeraization of CnHm radicals on Ni surface into encapsulating film
Thermal cracking of hydrocarbon. Deposition of C precursors on catalyst
Temperature range > 450°C < 500°C > 600°C
Critical parameters
High temperature. Low H2O/CnHm No enhanced H2O adsorption Low activity Aromatic feed
Low temperature Low H2O/CnHm Low H2/CnHm Aromatic feed
High temperature High void fraction Low H2O/CnHm High pressure Acidity of catalyst
Tab. 1. 2 - Carbon species formed in steam reforming of hydrocarbons78.
CO (a) Cα (a) + O (a)
C in Ni Cv
Cα (a) Ni3C (s)
Cβ (s) CC (s)
CH4 (a) CH4 (g)4 H (a)
CO (a) Cα (a) + O (a)
C in Ni Cv
Cα (a) Ni3C (s)
Cβ (s) CC (s)
CH4 (a) CH4 (g)4 H (a)
Fig. 1. 18 - Formation, gasification and transformation of carbon on nickel from carbon monoxide (a = adsorbed, g = gaseous, s = solid).
Structural type Designation Temperature formed
Peak temperature for reaction with H2
Adsorbed, atomic (dispersed, surface carbide) Cα 200-400°C 200°C
Polymeric, amorphous films or filaments Cβ 250-500°C 400°C
Vermicular (polymeric, amourphous)
a. filaments b. fibers c. whiskers
CV 300-1000°C 400-600°C
Nickel carbide (bulk) Cγ 150-250°C 275°C Graphitic (crystalline)
a. platelets b. films
CC
500°C 550°C
550-850°C
Tab. 1. 3 - Forms and reactivities of carbon species formed by decomposition of CO on nickel78.
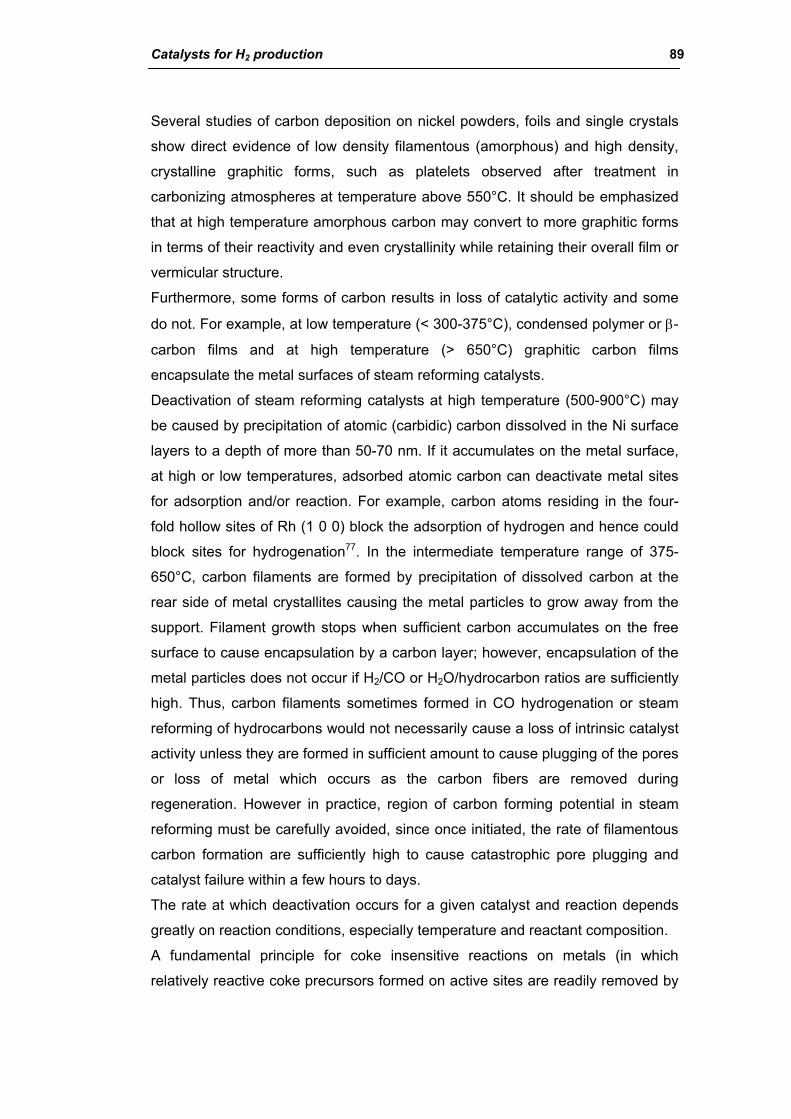
Catalysts for H2 production 89
Several studies of carbon deposition on nickel powders, foils and single crystals
show direct evidence of low density filamentous (amorphous) and high density,
crystalline graphitic forms, such as platelets observed after treatment in
carbonizing atmospheres at temperature above 550°C. It should be emphasized
that at high temperature amorphous carbon may convert to more graphitic forms
in terms of their reactivity and even crystallinity while retaining their overall film or
vermicular structure.
Furthermore, some forms of carbon results in loss of catalytic activity and some
do not. For example, at low temperature (< 300-375°C), condensed polymer or β-
carbon films and at high temperature (> 650°C) graphitic carbon films
encapsulate the metal surfaces of steam reforming catalysts.
Deactivation of steam reforming catalysts at high temperature (500-900°C) may
be caused by precipitation of atomic (carbidic) carbon dissolved in the Ni surface
layers to a depth of more than 50-70 nm. If it accumulates on the metal surface,
at high or low temperatures, adsorbed atomic carbon can deactivate metal sites
for adsorption and/or reaction. For example, carbon atoms residing in the four-
fold hollow sites of Rh (1 0 0) block the adsorption of hydrogen and hence could
block sites for hydrogenation77. In the intermediate temperature range of 375-
650°C, carbon filaments are formed by precipitation of dissolved carbon at the
rear side of metal crystallites causing the metal particles to grow away from the
support. Filament growth stops when sufficient carbon accumulates on the free
surface to cause encapsulation by a carbon layer; however, encapsulation of the
metal particles does not occur if H2/CO or H2O/hydrocarbon ratios are sufficiently
high. Thus, carbon filaments sometimes formed in CO hydrogenation or steam
reforming of hydrocarbons would not necessarily cause a loss of intrinsic catalyst
activity unless they are formed in sufficient amount to cause plugging of the pores
or loss of metal which occurs as the carbon fibers are removed during
regeneration. However in practice, region of carbon forming potential in steam
reforming must be carefully avoided, since once initiated, the rate of filamentous
carbon formation are sufficiently high to cause catastrophic pore plugging and
catalyst failure within a few hours to days.
The rate at which deactivation occurs for a given catalyst and reaction depends
greatly on reaction conditions, especially temperature and reactant composition.
A fundamental principle for coke insensitive reactions on metals (in which
relatively reactive coke precursors formed on active sites are readily removed by
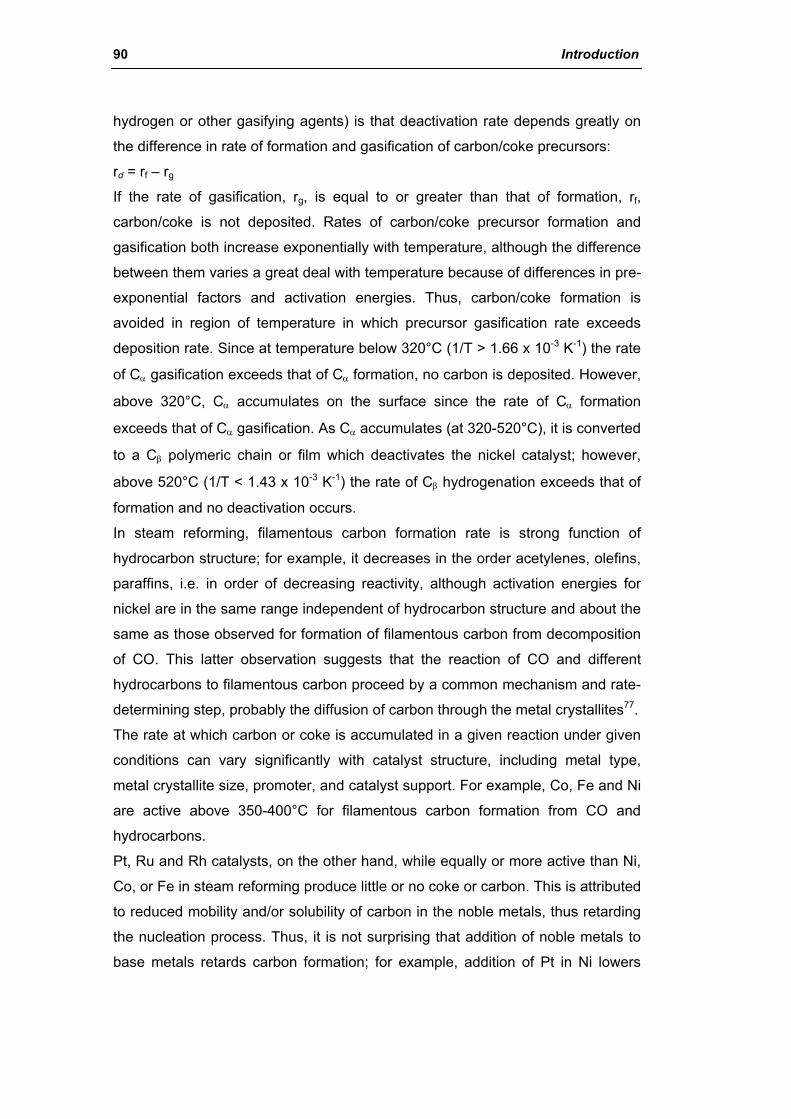
90 Introduction
hydrogen or other gasifying agents) is that deactivation rate depends greatly on
the difference in rate of formation and gasification of carbon/coke precursors:
rd = rf – rg
If the rate of gasification, rg, is equal to or greater than that of formation, rf,
carbon/coke is not deposited. Rates of carbon/coke precursor formation and
gasification both increase exponentially with temperature, although the difference
between them varies a great deal with temperature because of differences in pre-
exponential factors and activation energies. Thus, carbon/coke formation is
avoided in region of temperature in which precursor gasification rate exceeds
deposition rate. Since at temperature below 320°C (1/T > 1.66 x 10⁻³ K-1) the rate
of Cα gasification exceeds that of Cα formation, no carbon is deposited. However,
above 320°C, Cα accumulates on the surface since the rate of Cα formation
exceeds that of Cα gasification. As Cα accumulates (at 320-520°C), it is converted
to a Cβ polymeric chain or film which deactivates the nickel catalyst; however,
above 520°C (1/T < 1.43 x 10⁻³ K-1) the rate of Cβ hydrogenation exceeds that of
formation and no deactivation occurs.
In steam reforming, filamentous carbon formation rate is strong function of
hydrocarbon structure; for example, it decreases in the order acetylenes, olefins,
paraffins, i.e. in order of decreasing reactivity, although activation energies for
nickel are in the same range independent of hydrocarbon structure and about the
same as those observed for formation of filamentous carbon from decomposition
of CO. This latter observation suggests that the reaction of CO and different
hydrocarbons to filamentous carbon proceed by a common mechanism and rate-
determining step, probably the diffusion of carbon through the metal crystallites77.
The rate at which carbon or coke is accumulated in a given reaction under given
conditions can vary significantly with catalyst structure, including metal type,
metal crystallite size, promoter, and catalyst support. For example, Co, Fe and Ni
are active above 350-400°C for filamentous carbon formation from CO and
hydrocarbons.
Pt, Ru and Rh catalysts, on the other hand, while equally or more active than Ni,
Co, or Fe in steam reforming produce little or no coke or carbon. This is attributed
to reduced mobility and/or solubility of carbon in the noble metals, thus retarding
the nucleation process. Thus, it is not surprising that addition of noble metals to
base metals retards carbon formation; for example, addition of Pt in Ni lowers
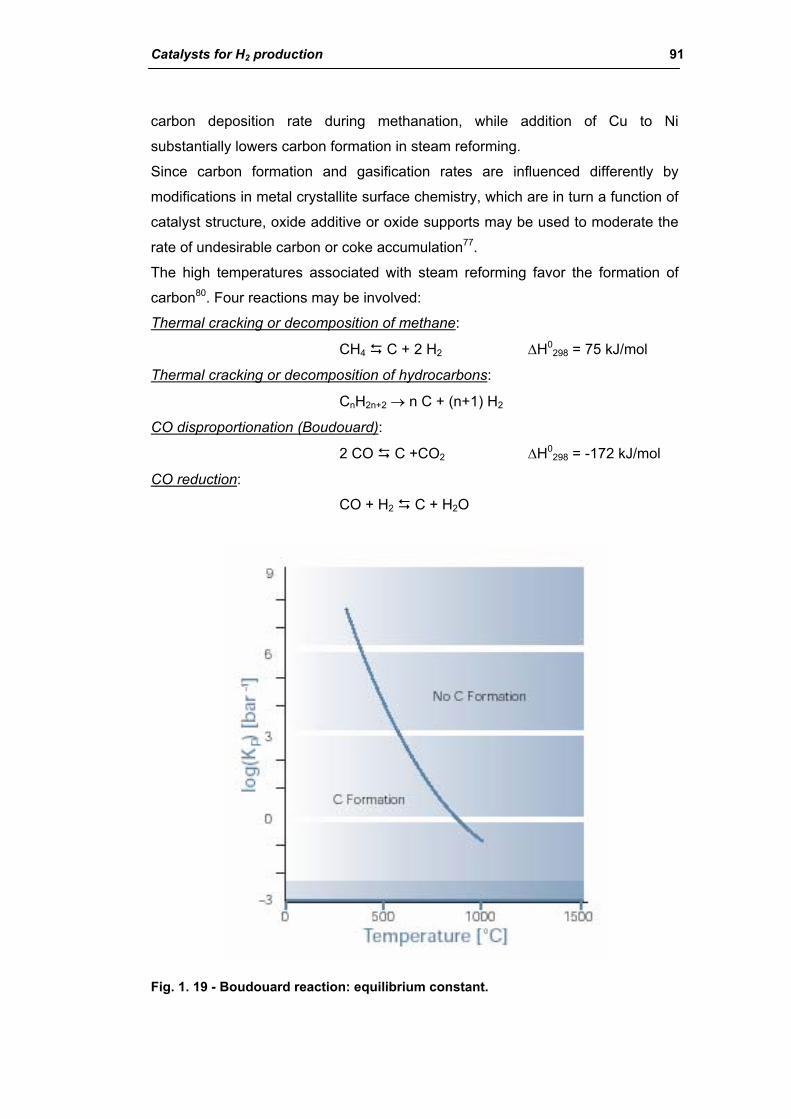
Catalysts for H2 production 91
carbon deposition rate during methanation, while addition of Cu to Ni
substantially lowers carbon formation in steam reforming.
Since carbon formation and gasification rates are influenced differently by
modifications in metal crystallite surface chemistry, which are in turn a function of
catalyst structure, oxide additive or oxide supports may be used to moderate the
rate of undesirable carbon or coke accumulation77.
The high temperatures associated with steam reforming favor the formation of
carbon80. Four reactions may be involved:
Thermal cracking or decomposition of methane:
CH4 C + 2 H2 ∆H0298 = 75 kJ/mol
Thermal cracking or decomposition of hydrocarbons:
CnH2n+2 → n C + (n+1) H2
CO disproportionation (Boudouard):
2 CO C +CO2 ∆H0298 = -172 kJ/mol
CO reduction:
CO + H2 C + H2O
Fig. 1. 19 - Boudouard reaction: equilibrium constant.

92 Introduction
For naphtha the decomposition is more complex because carbon can be formed
by direct thermal cracking and also from various intermediates, particularly
unsaturated species.
When methane or naphthas are reformed, the formation of carbon within the
nickel catalyst can be prevented by ensuring the steam/hydrocarbon ratio (S/C)
exceeds a certain minimum ratio. This minimum varies with pressure and
temperature, and thermodynamic data can be used to calculate the minimum S/C
ratio under different conditions. The exact values calculated depend on
thermodynamic parameters assumed for “carbon”, and a considerable amount of
research has shown that different forms of carbon can be produced, depending
on the prevailing conditions. There is a greater tendency for higher hydrocarbon
than for methane to form carbon, because on pyrolysis the readily formed initial
intermediates is an important factor, and is critical in influencing the delicate
balance between carbon-forming and carbon-removing reactions.
Both the nickel and the support play dual roles, contributing to the reforming
process and to the formation of carbon. This problem was solved (by ICI) by
introducing an alkali metal component into the catalyst. This accelerates the
carbon-steam reaction and, at the same time, the alkali neutralizes the acidity in
the catalyst support, so retarding cracking and polymerization. The most effective
alkali was found to be K2O (potash). The potassium is effective by being mobile
on the catalyst surface.
Accurate formulation combines the potassium as a complex potassium alumina-
silicate (Kalsilite: K2O.Al2O3.SiO2) and monticellite (CaO.MgO.SiO2). The
potassium is liberated at a very slow rate as non-volatile K2CO3 which is
hydrolyzed as fast it is formed, producing KOH, which is very mobile on the
catalyst surface and is the effective carbon-removing agent. Potassium is
therefore slowly lost from the catalyst into the product gases, but the rate of
evolution is very slow, being kinetically controlled by its release from the Kalsilite
compounds. The higher the temperature and the higher the feedstock
throughput, the more rapid is the potassium depletion. Careful formulation of the
catalyst ensures that lives of several years are obtained in most reformers.
Most of the complex reactions associated with naphtha reforming are completed
in the top half of the catalyst bed, with methane reforming taking place in the
lower part of the tubes. It is therefore possible to use an non-alkalized steam
reforming catalyst in the bottom half of the reformer tube. This has several

Catalysts for H2 production 93
beneficial effects. It reduces the total quantity of potash in the reformer, and takes
potash out of the hottest part of the reformer. Since the potash depresses the
activity of the nickel catalyst to some degree with respect to the methane
reforming, a non-alkalized catalyst at the bottom of the reformer improves the
approach to equilibrium at the exit of the reformer for a given throughput and exit
temperature.
Non-acidic magnesium spinel (MgAl2O4) based catalysts containing no mobile
alkali are effective under certain operating conditions, but formulation is critical.
However, given good control of temperature throughout a reformer, it is possible
to achieve the delicate balance between carbon formation and removal. Systems
of this sort have lower tolerance to variation in operating conditions, changes in
reformer firing patterns or temperature profiles which can disturb the balance and
give carbon lay-down7.
The reduction or elimination of coke formation often results in constraints on the
operating conditions to be applied. Steam and hydrogen are the most important
retarding reactants. In steam reformers, carbon will be formed below a certain
steam to carbon ratio which means that in many cases the steam reformer has to
operate with a surplus of steam and, hence that a larger reformer is required.
When using a catalyst with enhanced steam adsorption, the critical steam to
carbon ratio can be reduced. This can be obtained by adding alkali to the catalyst
or using active magnesia as support. In tubular reforming, no carbon is accepted
because of the break-down of the catalyst will result in build up of pressure drop
with uneven flow distribution and hot spots. The progressive deactivation can be
followed from the movement of temperature profile of the catalytic bed.
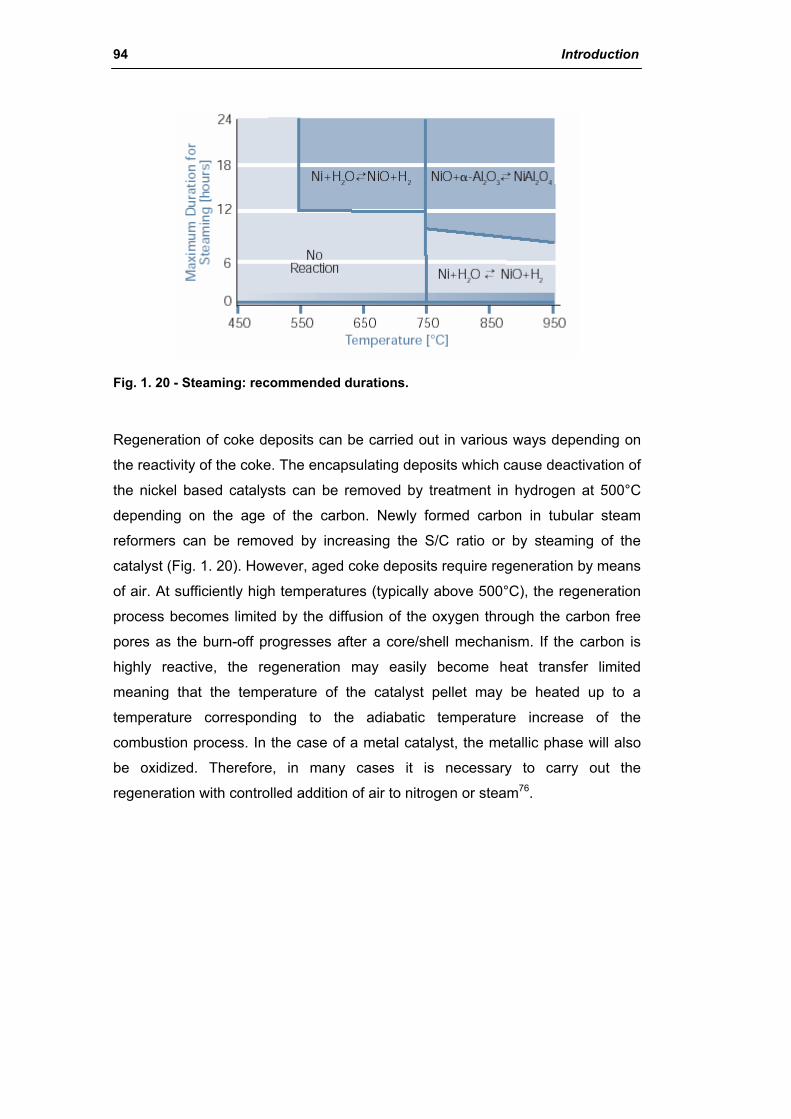
94 Introduction
Fig. 1. 20 - Steaming: recommended durations.
Regeneration of coke deposits can be carried out in various ways depending on
the reactivity of the coke. The encapsulating deposits which cause deactivation of
the nickel based catalysts can be removed by treatment in hydrogen at 500°C
depending on the age of the carbon. Newly formed carbon in tubular steam
reformers can be removed by increasing the S/C ratio or by steaming of the
catalyst (Fig. 1. 20). However, aged coke deposits require regeneration by means
of air. At sufficiently high temperatures (typically above 500°C), the regeneration
process becomes limited by the diffusion of the oxygen through the carbon free
pores as the burn-off progresses after a core/shell mechanism. If the carbon is
highly reactive, the regeneration may easily become heat transfer limited
meaning that the temperature of the catalyst pellet may be heated up to a
temperature corresponding to the adiabatic temperature increase of the
combustion process. In the case of a metal catalyst, the metallic phase will also
be oxidized. Therefore, in many cases it is necessary to carry out the
regeneration with controlled addition of air to nitrogen or steam76.
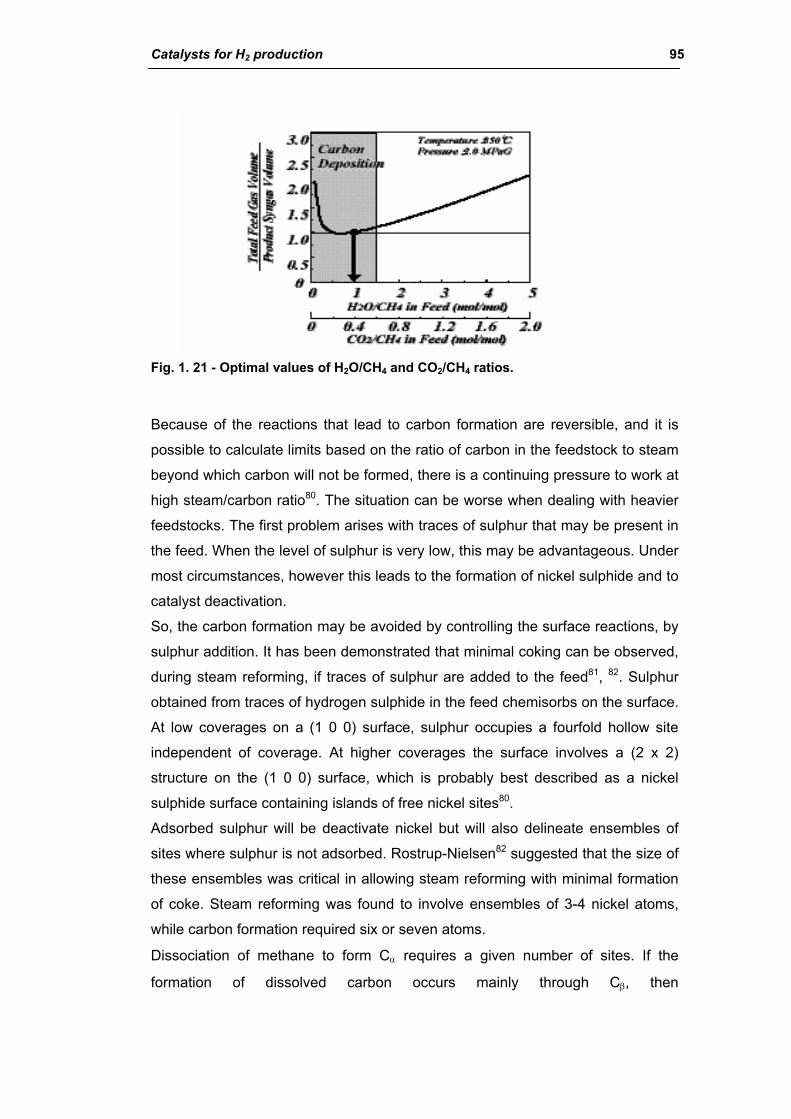
Catalysts for H2 production 95
Fig. 1. 21 - Optimal values of H2O/CH4 and CO2/CH4 ratios.
Because of the reactions that lead to carbon formation are reversible, and it is
possible to calculate limits based on the ratio of carbon in the feedstock to steam
beyond which carbon will not be formed, there is a continuing pressure to work at
high steam/carbon ratio80. The situation can be worse when dealing with heavier
feedstocks. The first problem arises with traces of sulphur that may be present in
the feed. When the level of sulphur is very low, this may be advantageous. Under
most circumstances, however this leads to the formation of nickel sulphide and to
catalyst deactivation.
So, the carbon formation may be avoided by controlling the surface reactions, by
sulphur addition. It has been demonstrated that minimal coking can be observed,
during steam reforming, if traces of sulphur are added to the feed81, 82. Sulphur
obtained from traces of hydrogen sulphide in the feed chemisorbs on the surface.
At low coverages on a (1 0 0) surface, sulphur occupies a fourfold hollow site
independent of coverage. At higher coverages the surface involves a (2 x 2)
structure on the (1 0 0) surface, which is probably best described as a nickel
sulphide surface containing islands of free nickel sites80.
Adsorbed sulphur will be deactivate nickel but will also delineate ensembles of
sites where sulphur is not adsorbed. Rostrup-Nielsen82 suggested that the size of
these ensembles was critical in allowing steam reforming with minimal formation
of coke. Steam reforming was found to involve ensembles of 3-4 nickel atoms,
while carbon formation required six or seven atoms.
Dissociation of methane to form Cα requires a given number of sites. If the
formation of dissolved carbon occurs mainly through Cβ, then
96 Introduction
polymerization/isomerization of Cα to Cβ is required. This, in turn, requires at least
twice the number of sited associated with the formation of Cα. The critical
ensemble size was found to be generated at sulphur coverages in excess of 0.7-
0.8 (corresponding to H2S/H2 ratios of greater than about 7.5 x 10⁻⁷). The rate of
steam reforming was decreased, but carbon formation was essentially eliminated.
Some amorphous carbon was laid down and it was possible, under extreme
conditions, to produce carbon whiskers80.
The formation of carbon is very dependent on the system pressure, and the
industry seeks high pressure H2/CO, not low-pressure product. It is known that if
one operates these reforming reactions at elevate pressures (~ 12 atm), dramatic
increases in the rates of coke formation are observed over most types of Ni
based catalysts. Formation of carbon on a catalyst can be difficult to follow at
elevated pressure running in continuous mode79.
Carbon formation may also have an effect on construction materials. Pyrolytic
coke deposited on the tube walls may lead to harmful carburization of the high
alloy steel tubes. A critical phenomenon is metal dusting corrosion, which may
take place if a CO-containing process gas is cooled below the equilibrium
temperature of the CO-decomposition reaction. The resulting carbon will typically
react with the steel forming iron carbide which will decompose and fall off leaving
the construction material with heavy pitting76.
2.1.5. Sintering of reforming catalysts
Nickel steam-reforming catalysts are subject to several deactivation mechanisms
including coking, poisoning, and sintering. Sintering is the reason for loss of
activity for many industrial catalyst systems.
Thermally induced deactivation of catalysts results from77:
(i) loss of catalytic surface area due to crystallite growth of the catalytic
phase;
(ii) loss of support area due to support collapse and of catalytic surface
area due to pore collapse on crystallites of the active phase,
(iii) chemical transformations of catalytic phases to non-catalytic phases.
Sintering processes generally take place at high reaction temperatures (> 500°C)
and are generally accelerated by water vapor.
Catalysts for H2 production 97
Sintering of heterogeneous catalysts is often referred to as the loss of catalytic
surface area due to growth of large particles at the expense of smaller particles.
Sintering is complex and may be influenced by many parameters such as
sintering time, temperature, chemical environment, catalyst composition and
structure, and support morphology. A good understanding of the sintering
mechanism is necessary, both to predict the extent of deactivation by sintering
and to design catalysts that maintain a high activity83.
Particle growth via sintering influences the resistance of the catalyst toward
coking and poisoning with sulfur. The coking limits are affected by the nickel
particle size and the nickel surface area determines the sulfur capacity of the
catalyst. Furthermore, the activity of a steam-reforming catalyst is related to the
nickel surface area. To model an industrial reformer with regard to activity and
the effect of sulfur poisoning, it is necessary to know the nickel surface area as a
function of time, temperature, feed gas composition, chemical composition
including promoters, and extent of poisoning.
Several studies of sintering of Ni particles supported on a ceramic carrier are
reported in the literature. The most important parameters are the sintering
temperature and the composition of the gas over the catalyst. Increasing
temperature and the presence of steam accelerates the sintering process. High
surface areas of the carrier, on the other hand, increase the stability toward
sintering.
Three mechanisms for the metal particle growth have been proposed:
(i) particle migration, where entire crystallites migrate over the support
followed by coalescence;
(ii) Ostwald ripening (atom migration), where metal atoms emitted from
one crystallite migrate over the support and are captured by another
crystallite;
(iii) vapor transport between particles (at high temperatures).

98 Introduction
SUPPORT
AABB
METAL CRYSTALLITE
SUPPORT
AABB
METAL CRYSTALLITE
Fig. 1. 22 - Two conceptual models for crystallite growth due to sintering by (A) atomic migration or (B) crystallite migration77.
Crystallite migration involves the migration of entire crystallites over the support
surface followed by collision and coalescence. Atomic migration involves
detachment of metal atoms from crystallites, migration of these atoms over the
support surface and ultimately, capture by large crystallites77.
Each of the three sintering mechanisms is a simplification, which ignores the
possibility that all mechanisms may occur simultaneously and may be coupled
with each other through complex physicochemical processes including:
a) dissociation and emission of metal atoms or metal-containing molecules
from metal crystallites,
b) adsorption and trapping of metal atoms or metal-containing molecules on
the support surface,
c) diffusion of metal crystallites across support surfaces,
d) metal or metal oxide particle spreading,
e) support surface wetting by metal or metal oxide particles,
f) metal particle nucleation,
g) coalescence of, or bridging between, two metal particles,
h) capture of atoms or molecules by metal particles,
i) liquid formation,
j) metal volatilization through volatile compound formation,
k) splitting of crystallites in O2 atmosphere due to formation of oxides of a
different specific volume,
l) metal atom vaporization.
Catalysts for H2 production 99
Depending upon reaction or redispersion conditions, a few or all of these
processes may be important; thus, the complexity of sintering/redispersion
process is emphasized.
In general, sintering processes are kinetically slow at moderate reaction
temperature and irreversible or difficult to reverse. Thus, sintering is more easily
prevented than cured77.
Temperature, atmosphere, metal type, metal dispersion, promoters/impurities
and support surface area texture and porosity, are the principal parameters
affecting rates of sintering. Sintering rates increase exponentially with
temperature. Metals sinter relatively rapidly in oxygen and relatively slowly in
hydrogen, although depending upon the support. Water also increases the
sintering rate of supported metals. In reducing atmosphere, metal crystallite
stability generally decreases with decreasing metal melting temperature, in the
order: Ru > Ir > Rh > Pt > Pd > Ni > Cu > Ag, although this order may be affected
by relatively stronger metal –support interactions.
Promoters or impurities affect the sintering by either increasing (chlorine and
sulphur) or decreasing (oxygen, calcium and cesium) metal atom mobility on the
support. Similarly, support surface defects or pores impede surface migration of
metal particles, especially micropores and mesopores with pore diameters about
the same size as the metal crystallite.
Sehested et al.84 studied the mechanism for sintering of nickel steam-reforming
catalysts at 500°C, 30 bar, H2O : H2 = 10 : 1 and concluded on the basis of the
particle size distributions that sintering occurred via the crystallite migration
mechanism. For this sintering mechanism, mass transport by diffusion of nickel
atoms on the nickel crystallite surfaces is necessarily an important step, so the
diffusivity and concentration of single metal atoms and small clusters are central
parameters in the understanding of the sintering phenomenon.
Campbell et al.85 reported that the heat of adsorption of metal atoms to metal
particles depends more strongly on the particle size than assumed previously
leading to faster rates of sintering via both Ostwald ripening and particle
migration and coalescence. This phenomenon is most important for small
particles (diameter < 50 Å for Pb particles). A nickel particle with a diameter of
approximately 36 Å contains the same number of atoms as a Pb particle with a
diameter of 50 Å due to the size difference of the atoms. In the study of
Sehested83, the nickel particles are generally larger than this particle size. The
100 Introduction
smallest average nickel particle diameters estimated from the nickel surface
areas in the catalysts used are of the order of 75–90 Å, indicating that the effect
of fast sintering of small particles can be ignored. On the contrary, ASAXS
(anomalous small angle X-ray scattering) gives lower estimates of the nickel
particle diameters, indicating that sintering of small particles is significant.
However, they believe that the measurements of the nickel areas in that case
give the most reliable estimates of the nickel particle diameters as these
measurements are carried out using reduced catalysts as opposed to ASAXS,
where passivated catalysts are used. Nickel may move significantly during
passivation.
Recently, a simple expression for the development of the nickel surface area as a
function of time, temperature, nickel loading, and carrier surface area was
derived86.
ANi = π ccatdNi2 = const. XNi dNi
-1 ≈ const.XNi
0.86 (1 - XNi)0.14 Acar0.14
K10.14 DNi
0.14 t 0.14ANi = π ccatdNi
2 = const. XNi dNi-1 ≈ const.
XNi0.86 (1 - XNi)0.14 Acar
0.14
K10.14 DNi
0.14 t 0.14
ANi = nickel surface area
ccat = number of particles per gram of catalyst
dNi = number averaged particle diameter
XNi = fractional mass of nickel (g metal/g catalyst)
Acar = surface area of the carrier (m2/g of the carrier)
K1 = equilibrium constant for the reaction:
Ni(111) + Ni(bulk) Ni add-atom on Ni(111)
DNi = diffusion coefficient of an add-atom on a Ni surface
t = time
To obtain the expression it was assumed that the sintering mechanism was
particle migration and coalescence, that the particle sizes were log normally
distributed with constant relative standard deviation, and that the carrier acted
only as an area dispersing the metal particles. The expression included a
parameter, which depends on the atmosphere over the catalyst and the chemical
environment on the catalyst. It was investigated experimentally and theoretically
the effects of steam and hydrogen over nickel catalysts as a function of
temperature. The relative nickel areas of Al2O3 and MgAl2O4-supported nickel
catalysts are determined after sintering at 1, 31, and 40 bar total pressure at
various steam and hydrogen ratios.

Catalysts for H2 production 101
The increased rate of sintering in the presence of steam is attributed to formation
of Ni2-OH species at the surface of nickel particles. The energy of formation of
this species at the nickel surface is low, compared to that of nickel atoms while
the energy of diffusion is highest for the Ni2-OH complex. It was concluded that,
in the presence of steam and hydrogen, the surface transport at nickel particles
will be dominated by Ni2-OH dimers. The calculated energies of formation and
diffusion are used in a simple model that is able to predict the rate of sintering of
nickel catalysts. The predicted dependencies of temperature, PH2O, and PH2 are in
good agreement with those obtained experimentally.
The experimental data showed a change in the activation energy of sintering at
high temperatures. The temperature for this change is at approximately 600°C at
40 bar total pressure and H2O:H2 = 2.5:1 when the catalyst is sintering for 700 h.
At ambient pressure, the change is observed to happen at approximately 700°C
after sintering at 1 bar total pressure and H2O:H2 = 1:1 for 50 h. It is speculated
that the rate of sintering, at high temperatures, may be determined by Ostwald
ripening83.
Sintering of the support may also occur. Single-phase oxide carriers sinter by one
or more of the following processes:
1) surface diffusion,
2) solid-state diffusion,
3) evaporation/condensation of volatile atoms or molecules,
4) grain boundary diffusion,
5) phase transformation.
Additives and impurities affect the thermal properties of carriers by occupying
defect sites or forming new phases. Alkali metals, for example, accelerate
sintering, while calcium, barium, nickel and lanthanum oxides form thermally
stable spinel phases with alumina. Steam accelerates support sintering by
forming mobile surface hydroxyl groups that are subsequently volatilized at
higher temperatures. Chlorine also promotes sintering and grain growth in
magnesia and titania during high temperature calcination.
Dispersed metals, in supported metal catalysts, can also accelerate support
sintering, for example, dispersed nickel accelerates the loss of Al2O3 surface area
in Ni/Al2O3 catalysts77.
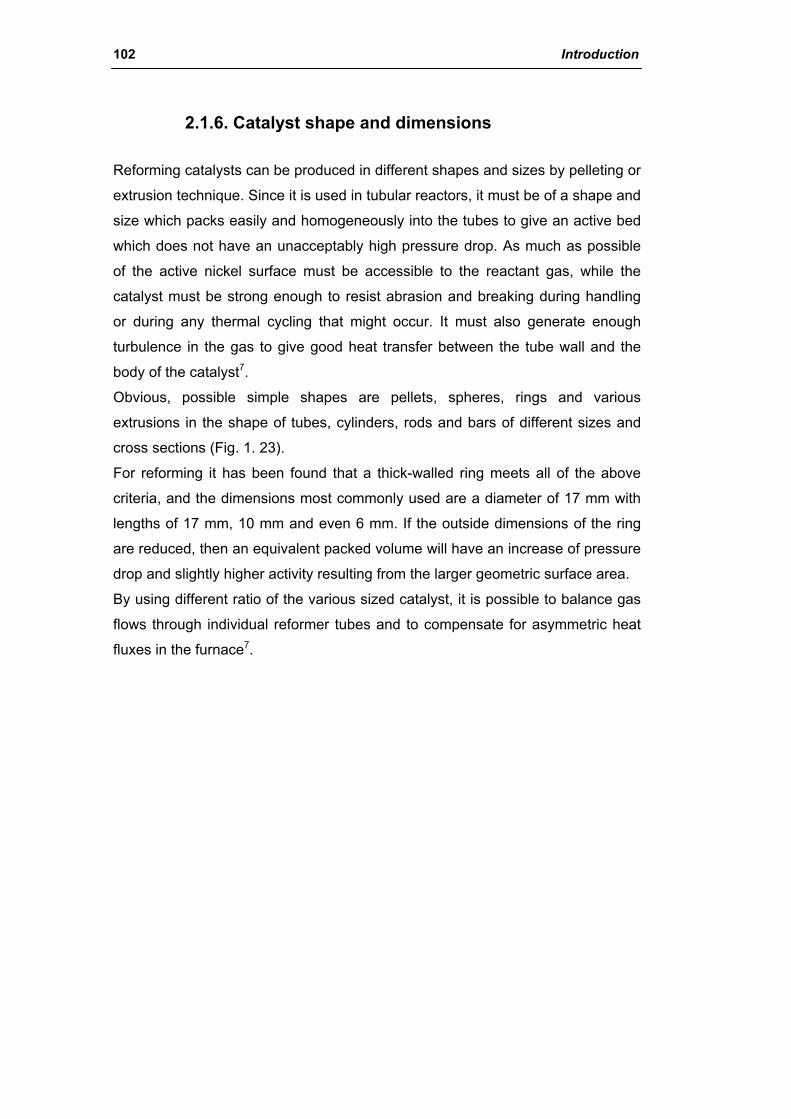
102 Introduction
2.1.6. Catalyst shape and dimensions
Reforming catalysts can be produced in different shapes and sizes by pelleting or
extrusion technique. Since it is used in tubular reactors, it must be of a shape and
size which packs easily and homogeneously into the tubes to give an active bed
which does not have an unacceptably high pressure drop. As much as possible
of the active nickel surface must be accessible to the reactant gas, while the
catalyst must be strong enough to resist abrasion and breaking during handling
or during any thermal cycling that might occur. It must also generate enough
turbulence in the gas to give good heat transfer between the tube wall and the
body of the catalyst7.
Obvious, possible simple shapes are pellets, spheres, rings and various
extrusions in the shape of tubes, cylinders, rods and bars of different sizes and
cross sections (Fig. 1. 23).
For reforming it has been found that a thick-walled ring meets all of the above
criteria, and the dimensions most commonly used are a diameter of 17 mm with
lengths of 17 mm, 10 mm and even 6 mm. If the outside dimensions of the ring
are reduced, then an equivalent packed volume will have an increase of pressure
drop and slightly higher activity resulting from the larger geometric surface area.
By using different ratio of the various sized catalyst, it is possible to balance gas
flows through individual reformer tubes and to compensate for asymmetric heat
fluxes in the furnace7.
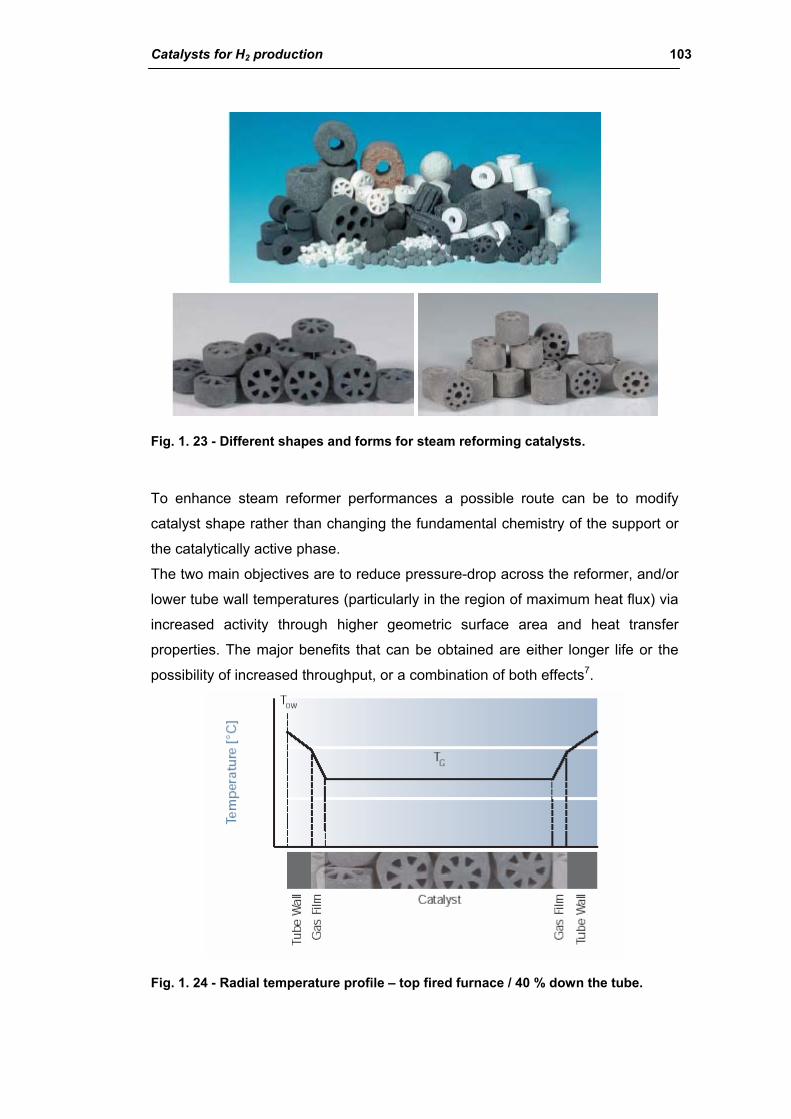
Catalysts for H2 production 103
Fig. 1. 23 - Different shapes and forms for steam reforming catalysts.
To enhance steam reformer performances a possible route can be to modify
catalyst shape rather than changing the fundamental chemistry of the support or
the catalytically active phase.
The two main objectives are to reduce pressure-drop across the reformer, and/or
lower tube wall temperatures (particularly in the region of maximum heat flux) via
increased activity through higher geometric surface area and heat transfer
properties. The major benefits that can be obtained are either longer life or the
possibility of increased throughput, or a combination of both effects7.
Fig. 1. 24 - Radial temperature profile – top fired furnace / 40 % down the tube.
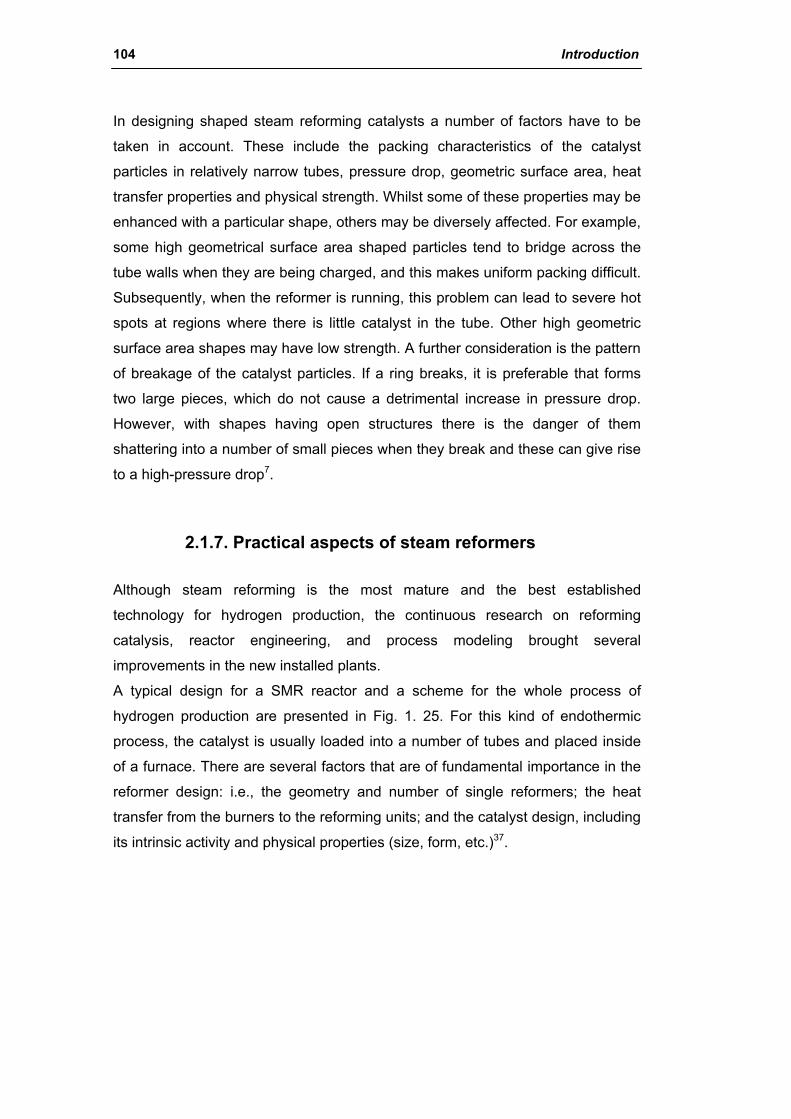
104 Introduction
In designing shaped steam reforming catalysts a number of factors have to be
taken in account. These include the packing characteristics of the catalyst
particles in relatively narrow tubes, pressure drop, geometric surface area, heat
transfer properties and physical strength. Whilst some of these properties may be
enhanced with a particular shape, others may be diversely affected. For example,
some high geometrical surface area shaped particles tend to bridge across the
tube walls when they are being charged, and this makes uniform packing difficult.
Subsequently, when the reformer is running, this problem can lead to severe hot
spots at regions where there is little catalyst in the tube. Other high geometric
surface area shapes may have low strength. A further consideration is the pattern
of breakage of the catalyst particles. If a ring breaks, it is preferable that forms
two large pieces, which do not cause a detrimental increase in pressure drop.
However, with shapes having open structures there is the danger of them
shattering into a number of small pieces when they break and these can give rise
to a high-pressure drop7.
2.1.7. Practical aspects of steam reformers
Although steam reforming is the most mature and the best established
technology for hydrogen production, the continuous research on reforming
catalysis, reactor engineering, and process modeling brought several
improvements in the new installed plants.
A typical design for a SMR reactor and a scheme for the whole process of
hydrogen production are presented in Fig. 1. 25. For this kind of endothermic
process, the catalyst is usually loaded into a number of tubes and placed inside
of a furnace. There are several factors that are of fundamental importance in the
reformer design: i.e., the geometry and number of single reformers; the heat
transfer from the burners to the reforming units; and the catalyst design, including
its intrinsic activity and physical properties (size, form, etc.)37.
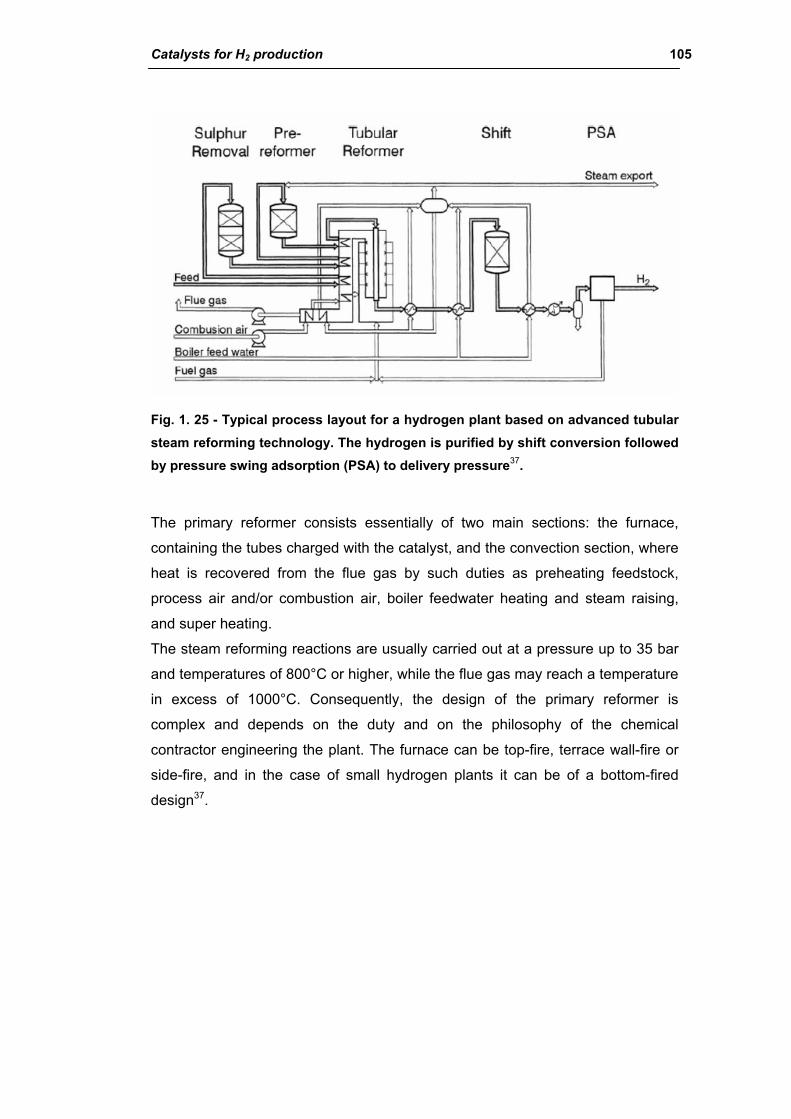
Catalysts for H2 production 105
Fig. 1. 25 - Typical process layout for a hydrogen plant based on advanced tubular steam reforming technology. The hydrogen is purified by shift conversion followed by pressure swing adsorption (PSA) to delivery pressure37.
The primary reformer consists essentially of two main sections: the furnace,
containing the tubes charged with the catalyst, and the convection section, where
heat is recovered from the flue gas by such duties as preheating feedstock,
process air and/or combustion air, boiler feedwater heating and steam raising,
and super heating.
The steam reforming reactions are usually carried out at a pressure up to 35 bar
and temperatures of 800°C or higher, while the flue gas may reach a temperature
in excess of 1000°C. Consequently, the design of the primary reformer is
complex and depends on the duty and on the philosophy of the chemical
contractor engineering the plant. The furnace can be top-fire, terrace wall-fire or
side-fire, and in the case of small hydrogen plants it can be of a bottom-fired
design37.
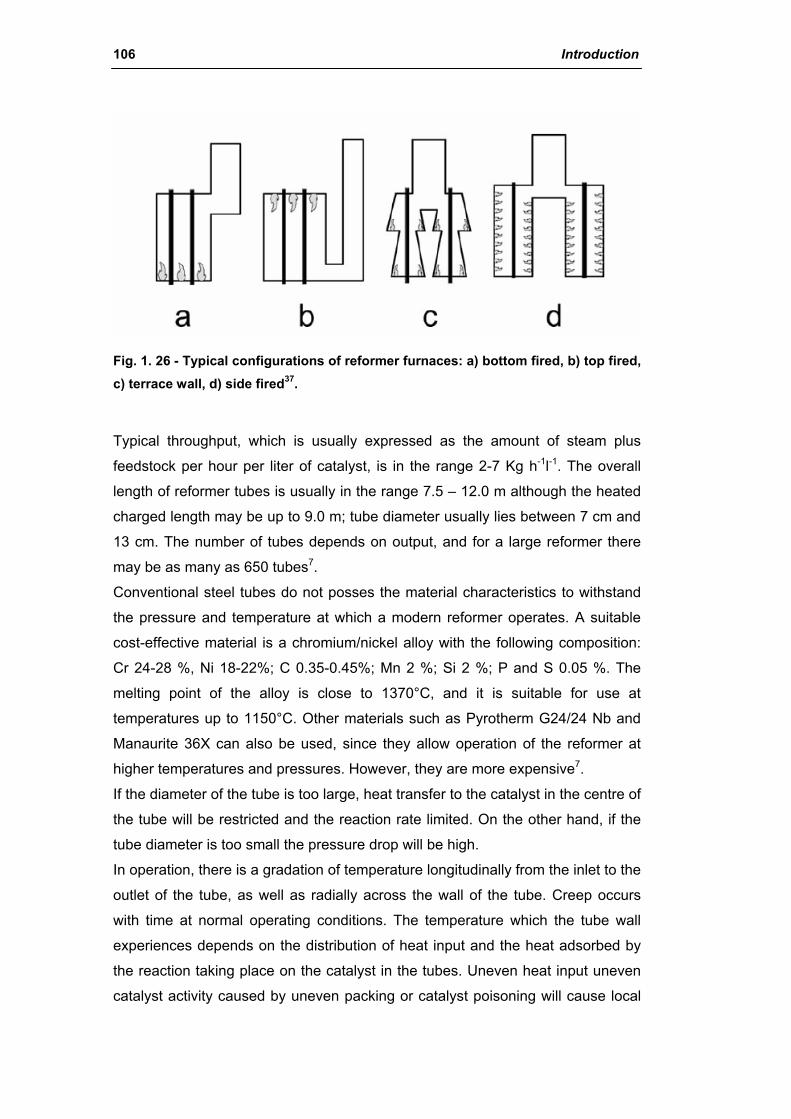
106 Introduction
Fig. 1. 26 - Typical configurations of reformer furnaces: a) bottom fired, b) top fired, c) terrace wall, d) side fired37.
Typical throughput, which is usually expressed as the amount of steam plus
feedstock per hour per liter of catalyst, is in the range 2-7 Kg h-1l-1. The overall
length of reformer tubes is usually in the range 7.5 – 12.0 m although the heated
charged length may be up to 9.0 m; tube diameter usually lies between 7 cm and
13 cm. The number of tubes depends on output, and for a large reformer there
may be as many as 650 tubes7.
Conventional steel tubes do not posses the material characteristics to withstand
the pressure and temperature at which a modern reformer operates. A suitable
cost-effective material is a chromium/nickel alloy with the following composition:
Cr 24-28 %, Ni 18-22%; C 0.35-0.45%; Mn 2 %; Si 2 %; P and S 0.05 %. The
melting point of the alloy is close to 1370°C, and it is suitable for use at
temperatures up to 1150°C. Other materials such as Pyrotherm G24/24 Nb and
Manaurite 36X can also be used, since they allow operation of the reformer at
higher temperatures and pressures. However, they are more expensive7.
If the diameter of the tube is too large, heat transfer to the catalyst in the centre of
the tube will be restricted and the reaction rate limited. On the other hand, if the
tube diameter is too small the pressure drop will be high.
In operation, there is a gradation of temperature longitudinally from the inlet to the
outlet of the tube, as well as radially across the wall of the tube. Creep occurs
with time at normal operating conditions. The temperature which the tube wall
experiences depends on the distribution of heat input and the heat adsorbed by
the reaction taking place on the catalyst in the tubes. Uneven heat input uneven
catalyst activity caused by uneven packing or catalyst poisoning will cause local
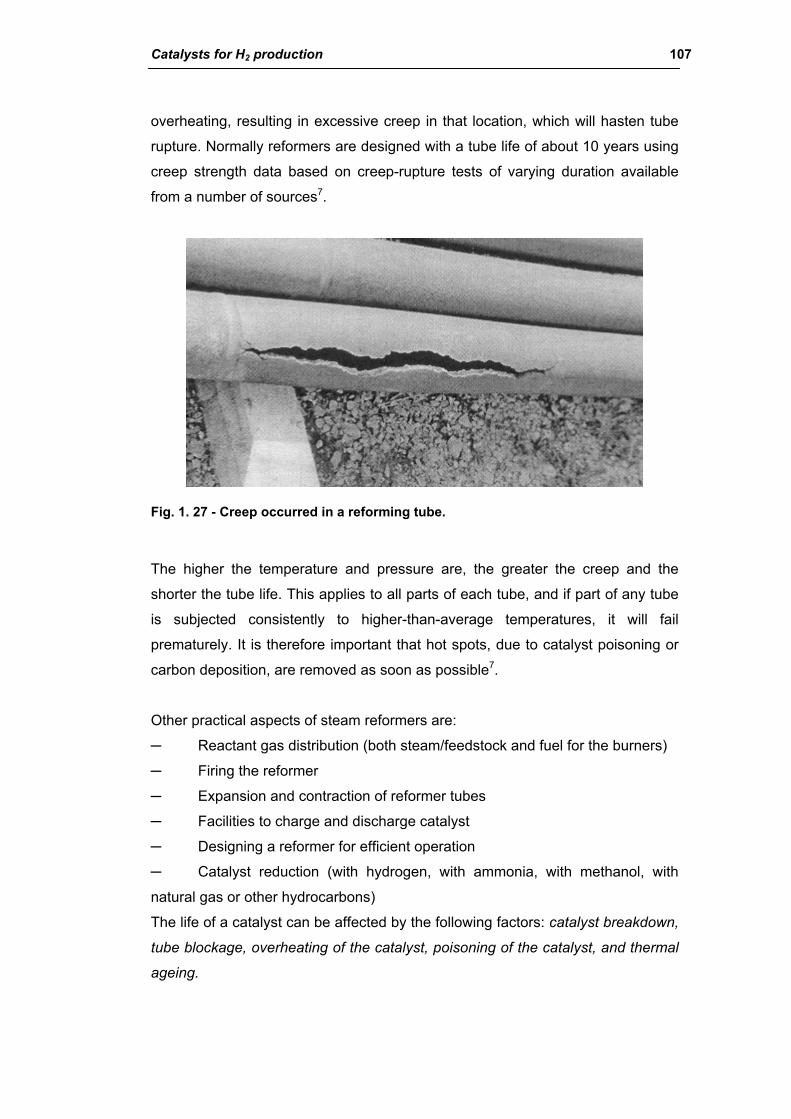
Catalysts for H2 production 107
overheating, resulting in excessive creep in that location, which will hasten tube
rupture. Normally reformers are designed with a tube life of about 10 years using
creep strength data based on creep-rupture tests of varying duration available
from a number of sources7.
Fig. 1. 27 - Creep occurred in a reforming tube.
The higher the temperature and pressure are, the greater the creep and the
shorter the tube life. This applies to all parts of each tube, and if part of any tube
is subjected consistently to higher-than-average temperatures, it will fail
prematurely. It is therefore important that hot spots, due to catalyst poisoning or
carbon deposition, are removed as soon as possible7.
Other practical aspects of steam reformers are:
─ Reactant gas distribution (both steam/feedstock and fuel for the burners)
─ Firing the reformer
─ Expansion and contraction of reformer tubes
─ Facilities to charge and discharge catalyst
─ Designing a reformer for efficient operation
─ Catalyst reduction (with hydrogen, with ammonia, with methanol, with
natural gas or other hydrocarbons)
The life of a catalyst can be affected by the following factors: catalyst breakdown,
tube blockage, overheating of the catalyst, poisoning of the catalyst, and thermal
ageing.
108 Introduction
Catalyst breakage and blockage of the tubes causes an increased pressure drop
across the reformer, and if the effect is random, it shows as an uneven
appearance of the tubes in the furnace. More fundamentally, it can lead to
overheating of the catalyst, loss of activity and a reduction of throughput. All of
these effects may be caused by the deposition of carbon. Overheating of the
catalyst can also be caused by maloperation of the reformer. Loss of activity
through poisoning by contaminants in the process gas is important, since this can
cause carbon deposition and result in overheating, catalyst breakage and, in
extreme cases, even partial blocking of the tubes. Gradual loss of activity or
thermal ageing caused by progressive loss of nickel surface area through
sintering places a limit on the life of a catalyst charge, and for a particular
catalyst, this depends on the actual operating conditions. In practice, the most
important effects are catalyst sintering, catalyst poisons and carbon formation7.
Carbon can be deposited in primary reforming catalyst by different mechanisms
and to varying degrees. Complete loss of reaction steam results in a massive
deposit of carbon, and the reformer will develop a very large pressure drop within
a few seconds. It will not then be possible to run the reformer again without
replacing the catalyst. Running a reformer with a slightly deficient steam/carbon
ratio will result in slight carbon deposition, which will slowly increase the reformer
pressure drop, and the tubes will appear hotter than normal. If detected soon
enough this carbon can often be removed satisfactorily, but this depends on the
type of catalyst being employed. Removing the feed flow and sustaining normal
reformer temperatures with only steam and hydrogen will convert the carbon to
carbon dioxide, which can be detected by an analyzer at the reforming exit. The
hydrogen will keep the catalyst in a reduced form. When the carbon has been
deposited within the catalyst pores by carbon monoxide disproportionation,
steaming will increase the reformer pressure drop. In this case, the carbon
expands within the catalyst pores and cracks the pellet and, although the carbon
in situ retains the pellet strength, when the carbon is removed, the pellet
collapses. If this happens, it is necessary to change the catalyst7.
Slow deposition of carbon can occur for a number of reasons. Careful catalyst
formulation is essential to maximize selectivity, and to eliminate acid sites, which
can promote carbon formation. When a predominantly methane feedstock is
reformed, low catalyst activity in the inlet portion of the tube can lead to carbon
deposition, which restricts heat transfer and give rise to the phenomenon known

Catalysts for H2 production 109
as “hot bands”. Both the CO disproportionation and reduction reactions are
always in the carbon-free side of the equilibrium throughout the reformer tube,
regardless of catalyst activity. However, the methane cracking reaction is on the
carbon forming side equilibrium for a significant portion of the tube. Carbon is not,
however, produced at the lower temperatures near the inlet, because both
reactions which remove carbon (reverse CO disproportionation and reverse CO
reduction) are faster at these temperatures than the rate of carbon formation by
methane cracking. However, as the temperature increases, so does the rate of
carbon formation and at a temperature of about 650°C, the carbon forming
reaction becomes faster than the carbon removing ones. If the rates of these
reactions are fixed, then it is essential that the catalyst has enough activity to
produce sufficient hydrogen via steam reforming below this temperature, so that
the gas\composition lies on the carbon removal side of the methane cracking
equilibrium7.
“Hot bands” always format about the same position on all tubes in the furnace
and approximately the same position in all reforming furnaces.
As expected, heavily loaded top-fired furnaces are the most susceptible to
forming “hot bands”. The low catalyst activity can arise from a number of causes
– catalyst may be old and at the end of its useful life, it may be poisoned or
inadequately reduced. If no hydrogen is recycled with the feedstock, then the
catalyst in the inlet portion remains in the oxidized state until reforming or
cracking of the feedstock occurs, and produces some hydrogen. This increases
the load on the catalyst further down the tube, since the inlet portion is then
functioning simply as a heat exchanger. Further, if reformer conditions change,
then unreduced catalyst may be called upon to do some reforming. It will be
unable to do so, carbon will be deposited and hot areas will appear at the top of
the tubes7.

110 Introduction
2.1.8. Water gas shift reaction (WGS)
The water gas shift reaction is moderately exothermic and hence its equilibrium
constant decreases with temperature and high conversions are favored by low
temperatures. The water gas shift reaction is:
CO + H2O CO2 + H2 ∆H = - 41.1 kJ/mol
The position of equilibrium is virtually unaffected by pressure. As expected,
additions of greater than stoichiometric quantities of steam improve conversion.
Under adiabatic conditions, conversion in a single bed of catalyst is
thermodynamically limited – as the reaction proceeds the heat of reaction
increases the operating temperature, and so restricts of the conversion are
possible. Typical carbon monoxide levels that are achieved at the exit with a
single adiabatic bed of chromia-supported iron-based shift catalyst in an
ammonia plant are in the range 2-4 %, and because it is necessary to operate
these catalysts at high inlet temperatures (typically in the range 370-400°C) they
are known as high temperature (HT) shift catalysts7.
The thermodynamic equilibrium limitation on the reaction can be reduced by
using two ore more beds of HT shift catalyst with inter-bed cooling and, perhaps,
removal of carbon dioxide between the stages. In this way, it was possible in the
late 1950s to decrease the thermodynamic limitation, and achieve carbon
monoxide levels of less than 1 % at the exit. The limitation on conversion was
then catalyst activity.
When a single stage or two stages of HT shift were used, the final carbon
monoxide removal stage was generally absorption in copper liquor, although
some plants used a methanator, because of the simplicity of the process, and
accepted the attendant hydrogen loss. At this time, attempts were made to
improve the carbon monoxide conversion so that methanation could be used
more economically as a means of removing the remaining traces of carbon
oxides. This impetus led to the development and introduction of copper-based
shift catalysts in the early 1960s7.
A significant improvement in the conversion of the carbon monoxide could then
be obtained with two-bed operation, with the second bed operating at the lowest
possible inlet temperature, which in practice was dictated by the dew-point (about
200°C). The conventional iron based catalysts are not sufficiently active for such
low temperature operation, but copper based water gas shift catalyst are, and
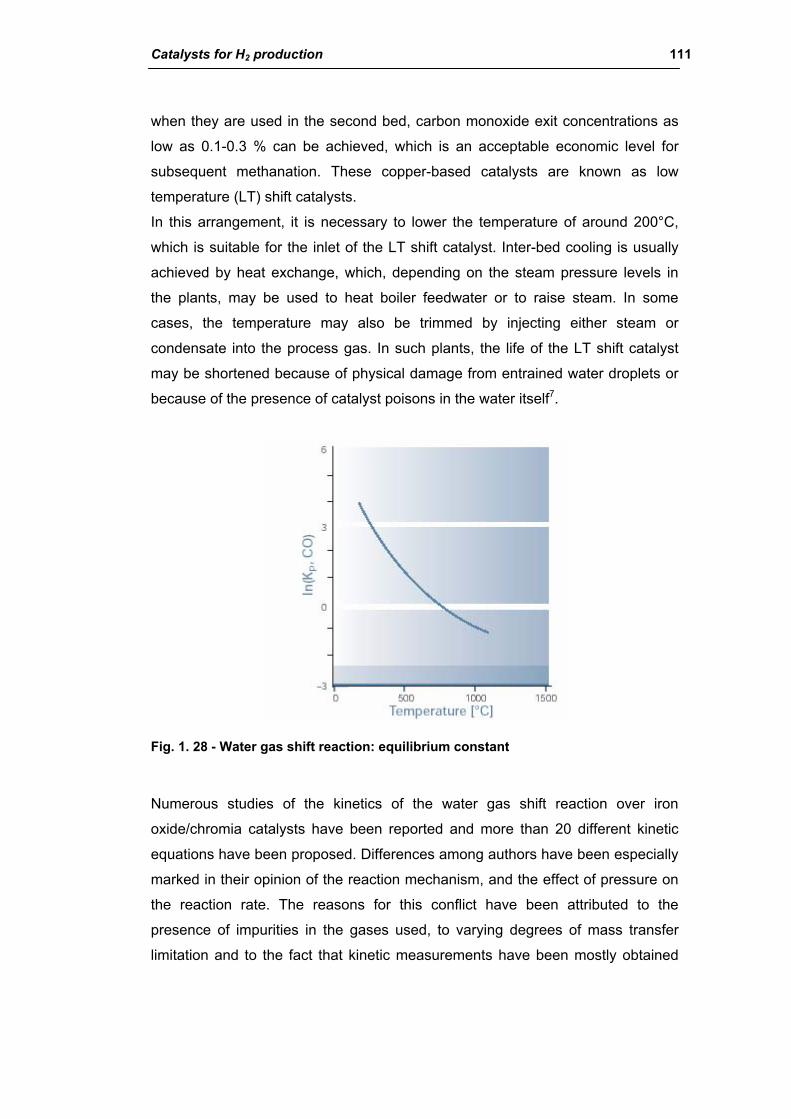
Catalysts for H2 production 111
when they are used in the second bed, carbon monoxide exit concentrations as
low as 0.1-0.3 % can be achieved, which is an acceptable economic level for
subsequent methanation. These copper-based catalysts are known as low
temperature (LT) shift catalysts.
In this arrangement, it is necessary to lower the temperature of around 200°C,
which is suitable for the inlet of the LT shift catalyst. Inter-bed cooling is usually
achieved by heat exchange, which, depending on the steam pressure levels in
the plants, may be used to heat boiler feedwater or to raise steam. In some
cases, the temperature may also be trimmed by injecting either steam or
condensate into the process gas. In such plants, the life of the LT shift catalyst
may be shortened because of physical damage from entrained water droplets or
because of the presence of catalyst poisons in the water itself7.
Fig. 1. 28 - Water gas shift reaction: equilibrium constant
Numerous studies of the kinetics of the water gas shift reaction over iron
oxide/chromia catalysts have been reported and more than 20 different kinetic
equations have been proposed. Differences among authors have been especially
marked in their opinion of the reaction mechanism, and the effect of pressure on
the reaction rate. The reasons for this conflict have been attributed to the
presence of impurities in the gases used, to varying degrees of mass transfer
limitation and to the fact that kinetic measurements have been mostly obtained
112 Introduction
with integral rather than differential reactors, which were often only operating at
or near atmospheric pressure7.
The importance of mass transfer effects in the reaction over a commercial
catalyst was assessed and the conclusions obtained were:
1. the activation energy in the absence of diffusion effects for the water gas
shift reaction over iron oxide / chromia catalyst is 121.8 kJ/mol
2. the reaction over 5.4 x 3.6 mm pellets is not pore diffusion limited at
temperatures below 370°C and at pressure up to 31 bar. Over larger pellets, 8.5
x 10.5 mm, the reaction becomes diffusion limited at temperature above 350°C at
31 bar pressure.
Fewer publication have appeared on the mechanism and kinetics of the water
gas shift reaction over copper based catalysts than over high temperature iron
based catalysts, but similar types of kinetic expressions have been proposed.
Indeed, the pore diffusion limited version of the Langmuir-Hinshelwood equation
for copper-based shift catalysts is consistent with plant data and semi-technical
scale results. There is little doubt that the copper LT shift catalysts generally
operate in a pore-diffusion limited regime, although there is debate over the
extent of this limitation on typical industrial catalyst pellets. In addition, they are
often self- guarding with respect to poisons (sulphur and chlorine compounds).
The pick-up of which is evidently a very rapid process and may itself also be
pore-diffusion limited.
The mechanism of the catalyzed shift reaction remains in dispute for copper and
iron-based catalysts. Briefly, two types of mechanism have been proposed –
adsorptive and regenerative.
In the former mechanism, reactants adsorb on the catalyst surface, where they
react to form surface intermediates such as formate, followed decomposition to
products and desorption from the surface.
In the regenerative mechanism, the surface undergoes successive oxidation and
reduction cycles by water and carbon monoxide, respectively, to form the
corresponding hydrogen and carbon dioxide products of the water gas shift
reaction.
Dealing first with iron oxide/chromia catalysts, the adsorption mechanism has
been supported by tracer studies and apparent stoichiometric number analyses.
Unfortunately, however, the kinetics of the water gas shift reaction can equally
Catalysts for H2 production 113
well be described either by the adsorptive mechanism or by the regenerative
mechanism, which was first proposed. Support for the regenerative mechanism is
that the rate at which water oxidized the magnetite surface and carbon monoxide
reduces it, corresponds to the rate of the water gas shift reaction. In an in situ
gravimetric study of oxygen removal from and incorporation into
magnetite/chromia catalyst in CO2/CO and H2O/H2 gas mixtures at about 350°C
further supported the regenerative mechanism.
For the copper based LT shift catalysts the regenerative mechanism was rejected
on the basis that neither cupric nor cuprous oxide could be formed under reaction
conditions from copper metal and steam. An adsorptive mechanism with a
surface formate intermediate was proposed. However, an analysis of transient
kinetics of the shift reaction over a Cu/ZnO catalyst supports the regenerative
mechanism. With both Cu/ZnO/Al2O3 catalysts and unsupported polycrystalline
copper catalysts, it was also produced results consistent with the regenerative
mechanism. The occurrence of the four separate steps needed for both forward
and reverse reaction shown in the following equations (in which S is a vacant
site) has been demonstrated on copper.
CO + O(a) → CO2 + S
H2O + S → H2 + O(a)
For oxygen coverage of half-monolayer or less there is no equilibrium limitation to
the second reaction, in contrast with the equivalent reaction forming cuprous
oxide, so that objection to regenerative mechanism is invalid for adsorbed oxygen
formation. Therefore, it seems likely that the water gas shift reaction proceeds by
the same regenerative mechanism on both Fe3O4/Cr2O3 and Cu/ZnO/Al2O3
catalysts.
The catalyst used for HT-WGS duty consists of magnetite crystallites stabilized
with the addition of a small amount of chromia, although fresh unreduced catalyst
contains hematite (Fe2O3) 90-95% with 5-10% Cr2O3.
Iron based catalysts are not very sensitive to poisoning by sulphur, which is
commonly present in feed gas derived from coal or fuel oil, and if the catalyst
must be operated under highly sulphiding conditions the deactivated effect can
be compensated for by increasing the volume of catalyst used.
Magnetite (Fe3O4) has good activity for the reaction at moderately high
temperatures and, provided the magnetite crystallites are stabilized by the

114 Introduction
addition of a refractory oxide component such as chromia (Cr2O3), satisfactory
long lives are obtained.
The formulation of LT shift catalyst is important in terms of selectivity and
resistance to poisoning, as well as activity. Selectivity is important because under
LT shift conditions methanation of both carbon monoxide and carbon dioxide is
thermodynamically very favorable:
CO + 3 H2 CH4 + H2O ∆H = - 206.2 kJ/mol
CO2 + 4 H2 CH4 + 2 H2O ∆H = - 164.9 kJ/mol
If these reactions take place to any extent, then valuable hydrogen would be
consumed; in addition, since they are very exothermic they could give rise to
dramatic and dangerously destructive rises in temperature.
Copper based catalyst have good activity for the water gas shift reaction, and
have no methanation activity so they are well suited for use in water gas shift
duties.
Alumina together with zinc oxide was a desirable support that could significantly
stabilize the copper crystallite against thermally induced sintering, and also
enhanced the strength of the catalyst and minimize shrinkage during reduction.
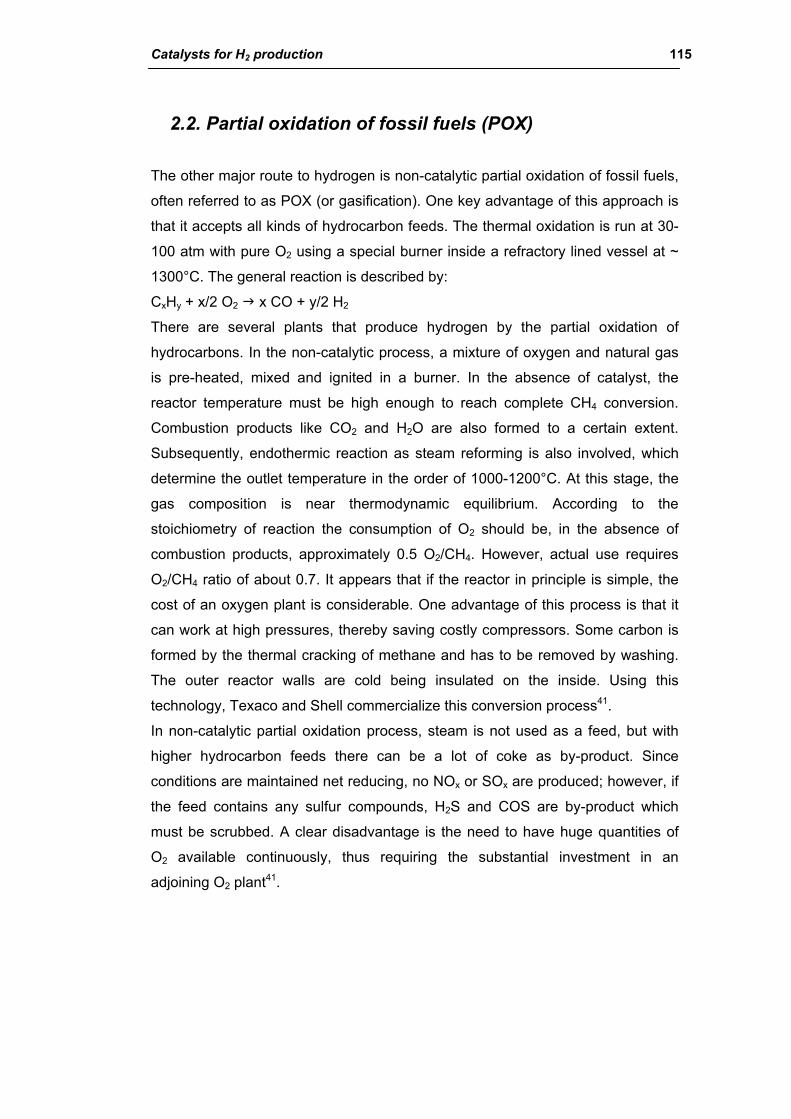
Catalysts for H2 production 115
2.2. Partial oxidation of fossil fuels (POX)
The other major route to hydrogen is non-catalytic partial oxidation of fossil fuels,
often referred to as POX (or gasification). One key advantage of this approach is
that it accepts all kinds of hydrocarbon feeds. The thermal oxidation is run at 30-
100 atm with pure O2 using a special burner inside a refractory lined vessel at ~
1300°C. The general reaction is described by:
CxHy + x/2 O2 x CO + y/2 H2
There are several plants that produce hydrogen by the partial oxidation of
hydrocarbons. In the non-catalytic process, a mixture of oxygen and natural gas
is pre-heated, mixed and ignited in a burner. In the absence of catalyst, the
reactor temperature must be high enough to reach complete CH4 conversion.
Combustion products like CO2 and H2O are also formed to a certain extent.
Subsequently, endothermic reaction as steam reforming is also involved, which
determine the outlet temperature in the order of 1000-1200°C. At this stage, the
gas composition is near thermodynamic equilibrium. According to the
stoichiometry of reaction the consumption of O2 should be, in the absence of
combustion products, approximately 0.5 O2/CH4. However, actual use requires
O2/CH4 ratio of about 0.7. It appears that if the reactor in principle is simple, the
cost of an oxygen plant is considerable. One advantage of this process is that it
can work at high pressures, thereby saving costly compressors. Some carbon is
formed by the thermal cracking of methane and has to be removed by washing.
The outer reactor walls are cold being insulated on the inside. Using this
technology, Texaco and Shell commercialize this conversion process41.
In non-catalytic partial oxidation process, steam is not used as a feed, but with
higher hydrocarbon feeds there can be a lot of coke as by-product. Since
conditions are maintained net reducing, no NOx or SOx are produced; however, if
the feed contains any sulfur compounds, H2S and COS are by-product which
must be scrubbed. A clear disadvantage is the need to have huge quantities of
O2 available continuously, thus requiring the substantial investment in an
adjoining O2 plant41.
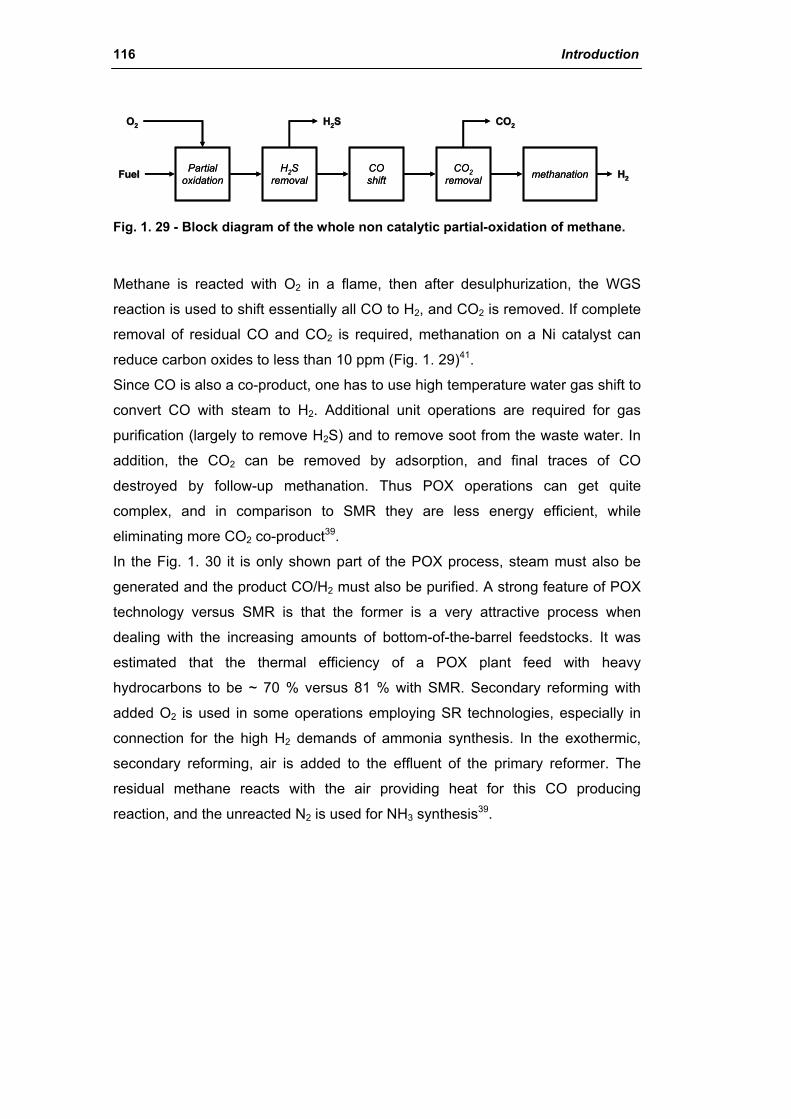
116 Introduction
Partial oxidation
H2Sremoval
COshift
CO2removal methanationFuelFuel
OO22 HH22SS COCO22
HH22Partial
oxidationH2S
removalCOshift
CO2removal methanationFuelFuel
OO22 HH22SS COCO22
HH22
Fig. 1. 29 - Block diagram of the whole non catalytic partial-oxidation of methane.
Methane is reacted with O2 in a flame, then after desulphurization, the WGS
reaction is used to shift essentially all CO to H2, and CO2 is removed. If complete
removal of residual CO and CO2 is required, methanation on a Ni catalyst can
reduce carbon oxides to less than 10 ppm (Fig. 1. 29)41.
Since CO is also a co-product, one has to use high temperature water gas shift to
convert CO with steam to H2. Additional unit operations are required for gas
purification (largely to remove H2S) and to remove soot from the waste water. In
addition, the CO2 can be removed by adsorption, and final traces of CO
destroyed by follow-up methanation. Thus POX operations can get quite
complex, and in comparison to SMR they are less energy efficient, while
eliminating more CO2 co-product39.
In the Fig. 1. 30 it is only shown part of the POX process, steam must also be
generated and the product CO/H2 must also be purified. A strong feature of POX
technology versus SMR is that the former is a very attractive process when
dealing with the increasing amounts of bottom-of-the-barrel feedstocks. It was
estimated that the thermal efficiency of a POX plant feed with heavy
hydrocarbons to be ~ 70 % versus 81 % with SMR. Secondary reforming with
added O2 is used in some operations employing SR technologies, especially in
connection for the high H2 demands of ammonia synthesis. In the exothermic,
secondary reforming, air is added to the effluent of the primary reformer. The
residual methane reacts with the air providing heat for this CO producing
reaction, and the unreacted N2 is used for NH3 synthesis39.
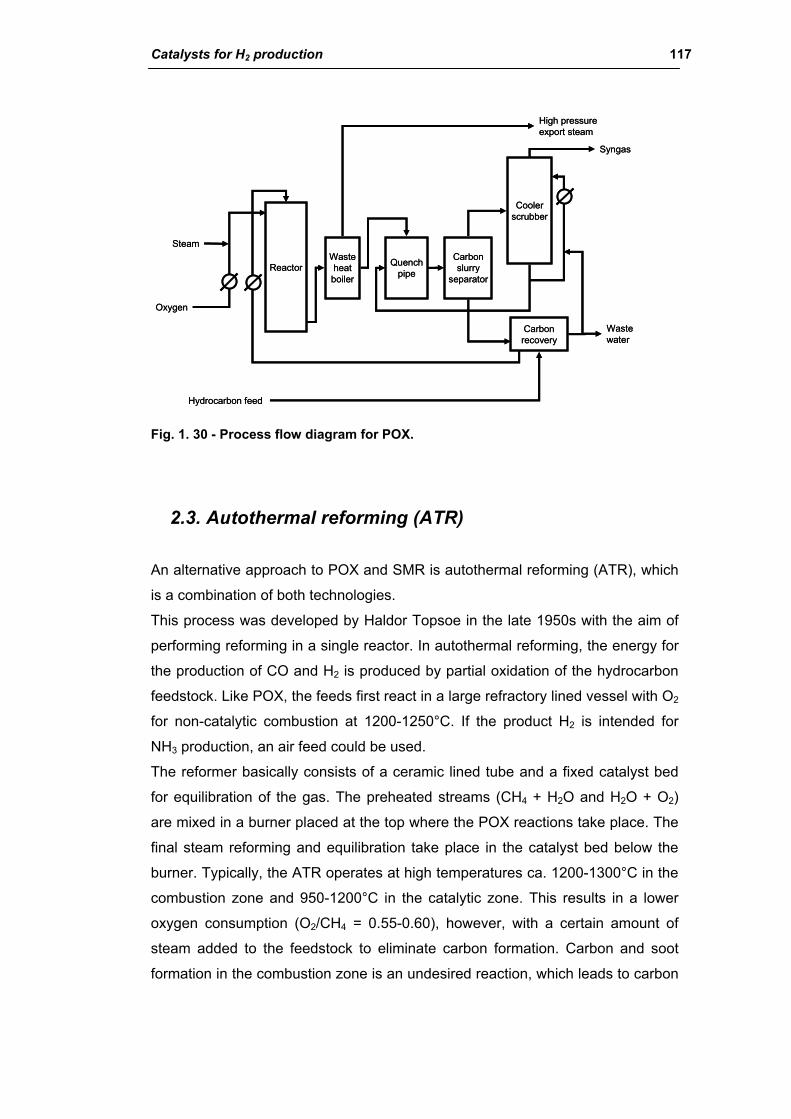
Catalysts for H2 production 117
Reactor
Oxygen
Steam
Hydrocarbon feed
Waste heat boiler
Quench pipe
Carbon slurry
separator
Cooler scrubber
Carbon recovery
Waste water
High pressure export steam
Syngas
Reactor
Oxygen
Steam
Hydrocarbon feed
Waste heat boiler
Quench pipe
Carbon slurry
separator
Cooler scrubber
Carbon recovery
Waste water
High pressure export steam
Syngas
Fig. 1. 30 - Process flow diagram for POX.
2.3. Autothermal reforming (ATR)
An alternative approach to POX and SMR is autothermal reforming (ATR), which
is a combination of both technologies.
This process was developed by Haldor Topsoe in the late 1950s with the aim of
performing reforming in a single reactor. In autothermal reforming, the energy for
the production of CO and H2 is produced by partial oxidation of the hydrocarbon
feedstock. Like POX, the feeds first react in a large refractory lined vessel with O2
for non-catalytic combustion at 1200-1250°C. If the product H2 is intended for
NH3 production, an air feed could be used.
The reformer basically consists of a ceramic lined tube and a fixed catalyst bed
for equilibration of the gas. The preheated streams (CH4 + H2O and H2O + O2)
are mixed in a burner placed at the top where the POX reactions take place. The
final steam reforming and equilibration take place in the catalyst bed below the
burner. Typically, the ATR operates at high temperatures ca. 1200-1300°C in the
combustion zone and 950-1200°C in the catalytic zone. This results in a lower
oxygen consumption (O2/CH4 = 0.55-0.60), however, with a certain amount of
steam added to the feedstock to eliminate carbon formation. Carbon and soot
formation in the combustion zone is an undesired reaction, which leads to carbon
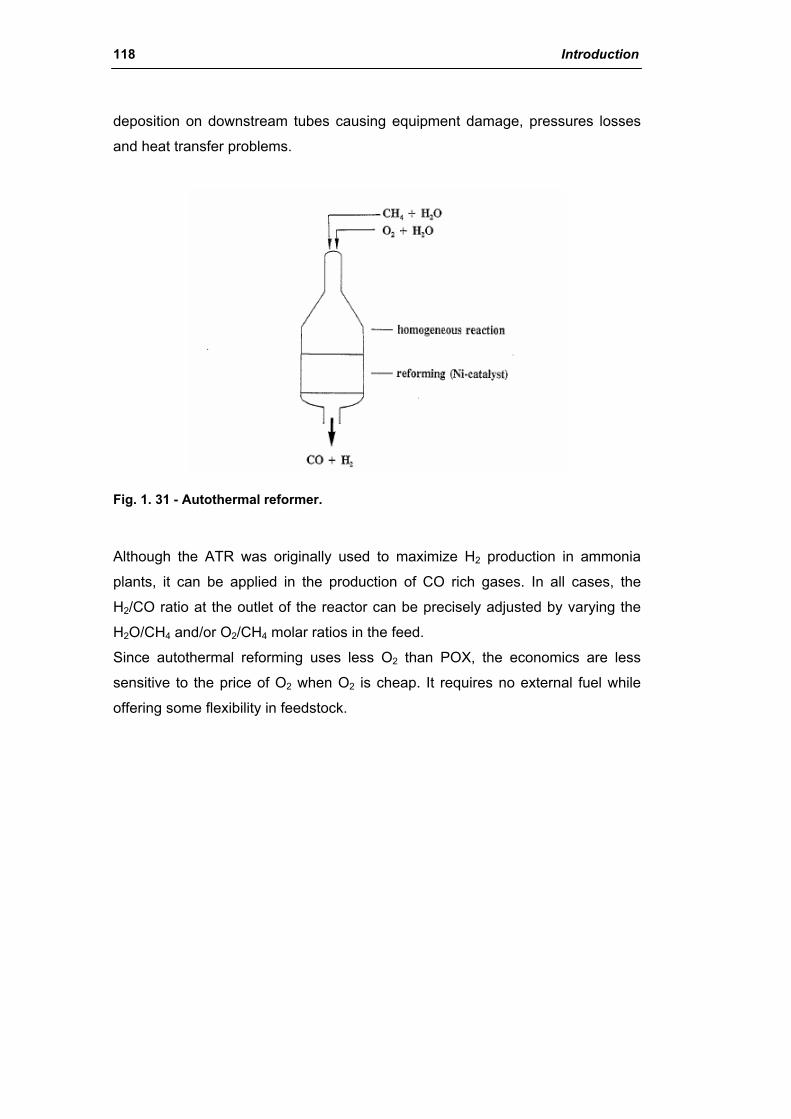
118 Introduction
deposition on downstream tubes causing equipment damage, pressures losses
and heat transfer problems.
Fig. 1. 31 - Autothermal reformer.
Although the ATR was originally used to maximize H2 production in ammonia
plants, it can be applied in the production of CO rich gases. In all cases, the
H2/CO ratio at the outlet of the reactor can be precisely adjusted by varying the
H2O/CH4 and/or O2/CH4 molar ratios in the feed.
Since autothermal reforming uses less O2 than POX, the economics are less
sensitive to the price of O2 when O2 is cheap. It requires no external fuel while
offering some flexibility in feedstock.
Catalysts for H2 production 119
2.4. Catalytic partial oxidation of methane (CPO)
A new interesting process for conversion of methane into synthesis gas is
catalytic partial oxidation. In the 1940s, Prettre et al first reported the formation of
synthesis gas by the catalytic partial oxidation of CH4:
CH4 + 1/2 O2 → CO + 2 H2 ∆H0298 = - 36 kJ/mol
They used a Ni-containing catalyst. In contrast to steam reforming of methane,
methane partial oxidation is exothermic. However, the partial oxidation requires
pure oxygen, which is produced in expensive air separation units that are
responsible for up to 40% of the cost of a synthesis gas plant (in contrast, the
steam reforming process does not require pure oxygen)87.
In the early 1990s, several papers88, 89, 90, 91, 92 reported that one can reach CO
and H2 concentrations in excess of those expected at thermodynamic equilibrium
by operating the CH4 oxidation reaction at exceptionally high space velocities
(GHSV = 52,000 ml (g catalyst)-1 h-1) in a fixed-bed reactor. The following
catalysts were employed: Ni/Yb2O3, Co/rare earth oxide, Co/MgO, and Ni/Al2O3.
According to the partial oxidation reaction, such a process yields the desired
H2/CO molar ratio of 2 required for methanol or Fischer-Tropsch synthesis. From
thermodynamic simulations, it is clear that the reaction is favored at T > 850°C in
excess of CH4, although both CO and H2 selectivities are modified by the
formation of CO2 and H2O in combustion reactions which are much more
exothermic:
CH4 + 1.5 O2 → CO + 2 H2O ∆H0298 = - 519 kJ/mol
CH4 + 2 O2 → CO2 + 2 H2O ∆H0298 = - 802 kJ/mol
Since CPO reaction is slightly exothermic, a process based on this reaction
would be much more energy efficient than the energy intensive SMR process. In
addition the partial oxidation reaction is also much faster than the reforming
reactions, suggesting that a single stage process for syngas production would be
an attractive alternative to SMR and also results in smaller reactors and higher
productivity.
The direct oxidation has not been developed at industrial scale, and it is difficult
to study because it involves co-feeding CH4/O2 mixtures and reaction close
flammable or even explosive conditions.
120 Introduction
Local hot spot are usually formed which can irreversible damage the active
catalyst. Moreover the gas phase reactions in a high reducing atmosphere can
led to carbon and soot deposition over the catalyst surface.
The actual reaction temperatures could be much higher than those reported. By
using an optical pyrometer, it was found that, during the catalytic oxidation of
methane to CO and H2, the combination of a high space velocity, an exothermic
reaction, and an active catalyst (Ni/Yb2O3) gave rise to steep temperature
gradients (hot spots). Furthermore, the temperature of the hot spot was greater
by as much as 370°C than the temperature measured with a thermocouple
located at a distance of only 1 mm from the hot spot in the catalyst bed. If a
temperature lower than that of the hot spot is used to calculate the equilibrium
concentrations of CH4, CO, CO2, and H2, one can draw the conclusion that the
concentrations of CO and H2 exceeded their thermodynamic equilibrium values.
However, if the true maximum (hot spot) temperature is used in the calculation,
the observed concentrations are found to be somewhat less than those predicted
at equilibrium. Indeed, using a careful temperature measurement method, in
which a thermocouple end contacted just the top surface of the catalyst bed, it
was found that the CH4 conversion in the presence of Ni/Al2O3 catalyst was less
than that predicted by thermodynamic equilibrium.
Furthermore, Hu and Ruckenstein93 observed hot layers (thinner than 1 mm) in
NiO/MgO solid solution catalysts and in NiO/Al2O3 and NiO/SiO2 catalysts during
the partial oxidation of methane in a fixed-bed reactor. The hottest layers were
located at the top of the bed of the NiO/MgO and NiO/Al2O3 catalysts, but they
were observed to move down and then up for the NiO/SiO2 catalyst bed. The
down-and-up movement resulted in an oscillatory temperature of the NiO/SiO2
catalyst at a given position in the bed, which was absent when the catalyst was
NiO/MgO or NiO/Al2O3.
The different temperature behaviors of the three catalysts were attributed to the
different strengths of the interactions between the metal oxide and the support.
Temperature-programmed reduction (TPR) experiments with 4% H2 in argon
indicated that the initial reduction temperature was about 330°C for 13.6 wt %
NiO/SiO2, which is near that of pure NiO (about 300°C). In contrast, for 13.6 wt %
NiO/Al2O3 the initial reduction temperature was high (670°C) and no marked
reduction peak could be detected even at 800°C for 13.6 wt % NiO/MgO. These
Catalysts for H2 production 121
results clearly indicate that there are weak interactions between NiO and SiO2
and much stronger interactions between NiO and Al2O3 and between NiO and
MgO. The weak interactions in Ni/SiO2 might have been responsible for the
temperature oscillation by allowing a facile redox behavior of the active nickel
sites, namely, the oxidation of Ni0 to NiO by O2 and the reduction of NiO to Ni0 by
CH4. The strong interactions characteristic of NiO/Al2O3 and NiO/MgO were
inferred to inhibit in part the redox behavior of the nickel sites. In the case of
NiO/SiO2, according to this interpretation, the freshly reduced NiO located at the
inlet of the bed became highly active, causing a hot layer to be generated. The
high temperature of this hot layer resulted in sintering of the nickel particles,
which led to the loss of activity. Therefore, the reaction is inferred to have taken
place in the neighboring section of the catalyst. As a result, a hot layer
propagated downward in the reactor. However, the sintered nickel particles were
re-dispersed on the SiO2 support when they were re-oxidized by O2, because the
oxygen concentration is high when the reaction of CH4 with O2 does not take
place. After a certain time, the re-oxidized layer near the entrance was again
reduced by CH4 and became active again, resulting in a hot layer. The following
part of re-oxidized nickel on SiO2 can be reduced rapidly by H2 and CO
generated near the entrance of the reactor. The redox of the Ni/SiO2 catalyst
constitutes a cycle of deactivation and reactivation in each part of the catalyst.
The hot layer moved downward in the bed during the time required for the
reduction of the entrance layer. Consequently, the time scale of the oscillations
was determined by the time scale of the reduction–oxidation process.
Furthermore, Basile et al. 94 used IR thermography to monitor the surface
temperature of the nickel foil during the methane partial oxidation reaction by
following its changes with the residence time and reactant concentration. Their
results demonstrate that the surface temperature profile was strongly dependent
on the catalyst composition and the tendency of nickel to be oxidized.
In the 1940s, Prettre et al. reported the formation of synthesis gas via the
catalytic partial oxidation of CH4 catalyzed by a 10 wt % refractory supported
nickel, at temperatures between 700 and 900°C. Thermodynamic equilibrium
corresponding to the catalyst bed exit temperature was achieved under all
conditions investigated. In 1970, it was examined the effect of diffusion on
methane partial oxidation catalyzed by a single grain of Ni/mullite catalyst in the
temperature range of 760 and 900°C and examined the ignition and extinction

122 Introduction
characteristics of this catalyst. It was observed that the nickel catalyst deactivated
in an oxidative environment but could recover on reduction. In 1984, Gavalas et
al95 investigated the effects of the calcination temperature, pre-reduction, and
feed ratio on the reaction of CH4/O2 mixtures catalyzed by NiO/α-Al2O3 at 570–
800°C. However, under their experimental conditions, the main products were
CO2 and H2O. Since 1990, researchers have continued to examine nickel-
containing catalysts for the partial oxidation of methane, and they also started to
use noble metals as catalysts. In 1990, it was reported a methane conversion of
about 90 % and more than 90 % selectivity to CO and H2 at 770°C, atmospheric
pressure, and at the high GHSV of 4 x 10⁴ ml (ml catalyst)-1 h-1 for a reaction
catalyzed by lanthanide ruthenium oxides, such as Pr2Ru2O7, Eu2Ru2O7,
Gd2Ru2O7, Dy2Ru2O7, or Lu2Ru2O7. In 1992, Hickman and Schmidt96 used
platinum monoliths to achieve high selectivities to CO and H2 in the partial
oxidation of methane. In the following 10 years, various noble metal catalysts
have been examined. Compared with the non-noble metal catalysts, the noble
metals exhibit high stability with excellent activities and selectivities. The major
drawback of the noble metal catalysts is their high cost, which restricts their
potential use in industrial processes. Non-noble metal catalysts, particularly those
containing nickel, have also been investigated extensively since 1990.
The authors observed that, under their operating conditions, the calcined catalyst
bed consisted of three regions, NiAl2O4 (upstream, section), NiO + Al2O3 (middle
section), and reduced Ni/Al2O3 (downstream section). In the upstream section of
the reactor, the CH4/O2/He feed contacted NiAl2O4, which exhibited only a
moderate activity for the complete oxidation of methane to CO2 and H2O. The
next section of the reactor contained NiO + Al2O3, which catalyzed the complete
exothermic oxidation of methane to CO2. Because of the complete consumption
of O2 in the second section, the third (downstream) section of the catalyst bed
consisted of a reduced Ni/Al2O3. The formation of the CO and H2 products,
corresponding to thermodynamic equilibrium at the temperature of the bed exit,
occurred in this section, as a result, of the reforming reactions of CH4 with CO2
and H2O produced during the complete oxidation reaction catalyzed by the
NiO/Al2O3.
The activity of NiO in the total oxidation reaction was excluded by Basile et al94
using IR thermography and evidencing the low temperature of oxidized Ni
particles placed at the entrance of the bed.
Catalysts for H2 production 123
Choudhary et al. reported a high conversion of CH4 and high selectivities to CO
and H2 with Ni/CaO, Ni/Al2O3, NiO-rare earth oxide, and Co/rare earth oxide
catalysts88, 89, 90, 91, 92.
The major problem encountered with these non-noble metal catalysts is their
relatively low stability. The main causes of the deactivation of the catalysts are
carbon deposition and metal sintering in the catalyst. Nevertheless, numerous
effective nickel-containing catalysts have been developed by incorporation in
suitable supports, such as La2O3, MgO, SrTiO3, and CeO2; effective promoters,
including La2O3, Li2O, and iron oxide; and novel preparation methods, such as a
solid phase crystallization method, a sol–gel method, and a citrate method87.
However, because the high stabilities reported for these effective nickel-
containing catalysts were based on short-term tests (< 100 h), it is unclear how
stable these catalysts will be in long term tests (> 1000 h), which is the first step
that any candidate catalyst for commercialization must pass.
In the last decade, numerous attempts have been made to understand the
mechanism of the partial oxidation of methane. Mechanistic investigations of the
partial oxidation are still challenging, because this exothermic reaction is very fast
and causes extremely high catalyst temperature rises, so that the usual methods
of investigation are unsuitable.
Two kinds of pathways have been suggested:
(i) a combustion-reforming pathway, in which CO2 and H2O are the
primary products, and CO and H2 are formed by their reactions with
CH4,
(ii) a pyrolysis or dissociative adsorption pathway, in which CO is the
primary product formed by the dissociation of methane, CH4 → CHx +
(2 – 1/2 x) H2; followed by the oxidation of carbon containing species
to give CO without the pre-formation of CO2.
For methane partial oxidation to syngas, the thermodynamic calculation results
suggest a high temperature is advantageous for high methane conversion and
selectivity to CO and H2. However, increasing the pressure in the reactor is
unfavorable for CH4 conversion and CO and H2 selectivity. The prediction of the
CH4 conversion and product selectivity under specific conditions is shown in two-
dimensional forms (Fig. 1. 32 (a) and (b)). Apparently, under 1 bar at 800°C,
theoretical CH4 conversion should be up to 90 %, and selectivities to CO and H2
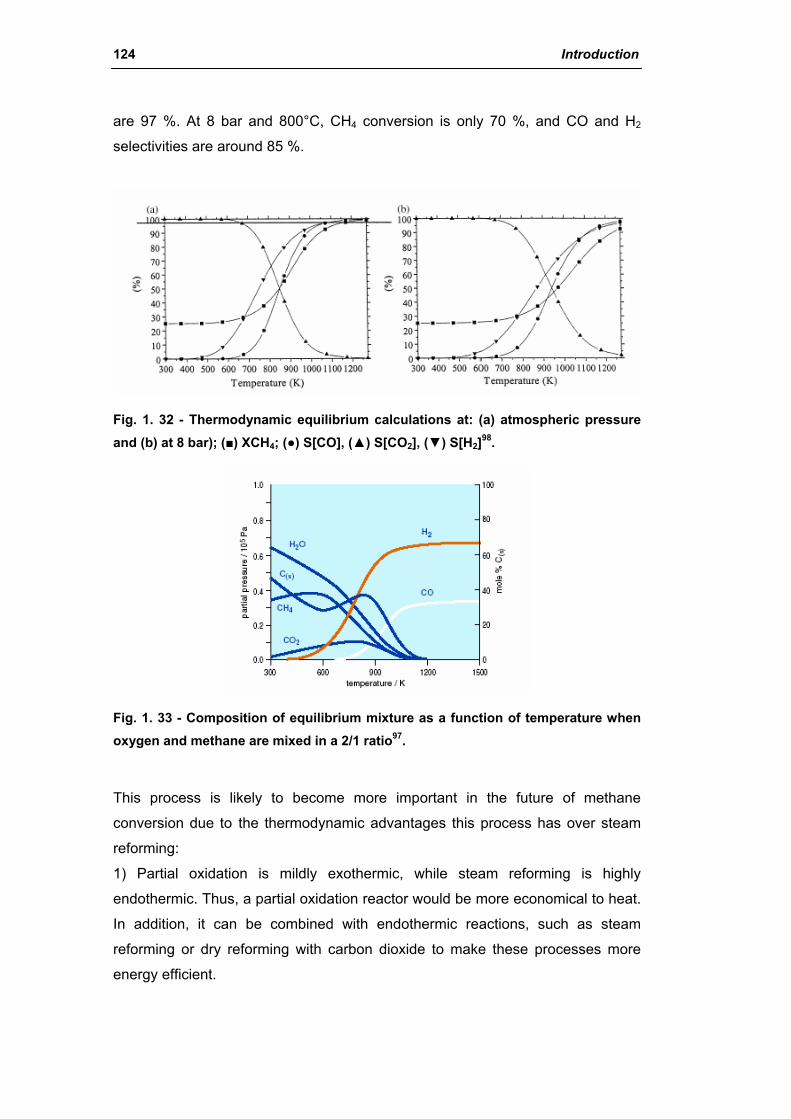
124 Introduction
are 97 %. At 8 bar and 800°C, CH4 conversion is only 70 %, and CO and H2
selectivities are around 85 %.
Fig. 1. 32 - Thermodynamic equilibrium calculations at: (a) atmospheric pressure and (b) at 8 bar); (■) XCH4; (●) S[CO], (▲) S[CO2], (▼) S[H2]98.
Fig. 1. 33 - Composition of equilibrium mixture as a function of temperature when oxygen and methane are mixed in a 2/1 ratio97.
This process is likely to become more important in the future of methane
conversion due to the thermodynamic advantages this process has over steam
reforming:
1) Partial oxidation is mildly exothermic, while steam reforming is highly
endothermic. Thus, a partial oxidation reactor would be more economical to heat.
In addition, it can be combined with endothermic reactions, such as steam
reforming or dry reforming with carbon dioxide to make these processes more
energy efficient.
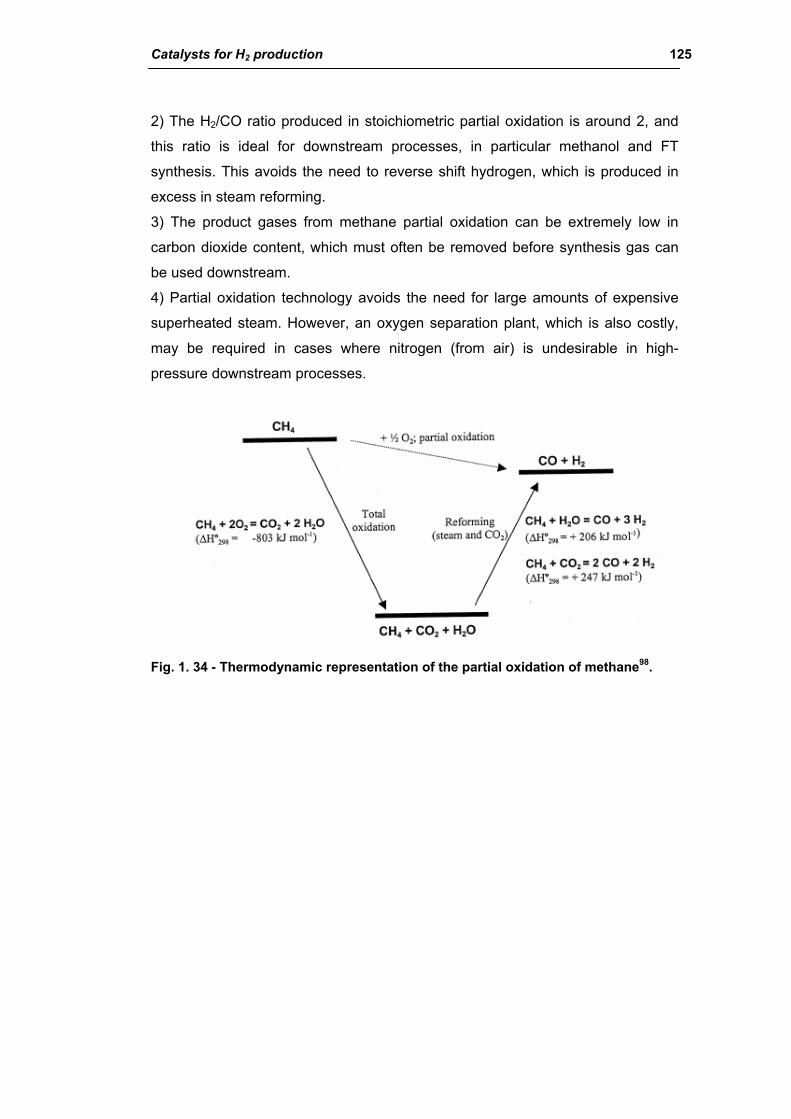
Catalysts for H2 production 125
2) The H2/CO ratio produced in stoichiometric partial oxidation is around 2, and
this ratio is ideal for downstream processes, in particular methanol and FT
synthesis. This avoids the need to reverse shift hydrogen, which is produced in
excess in steam reforming.
3) The product gases from methane partial oxidation can be extremely low in
carbon dioxide content, which must often be removed before synthesis gas can
be used downstream.
4) Partial oxidation technology avoids the need for large amounts of expensive
superheated steam. However, an oxygen separation plant, which is also costly,
may be required in cases where nitrogen (from air) is undesirable in high-
pressure downstream processes.
Fig. 1. 34 - Thermodynamic representation of the partial oxidation of methane98.
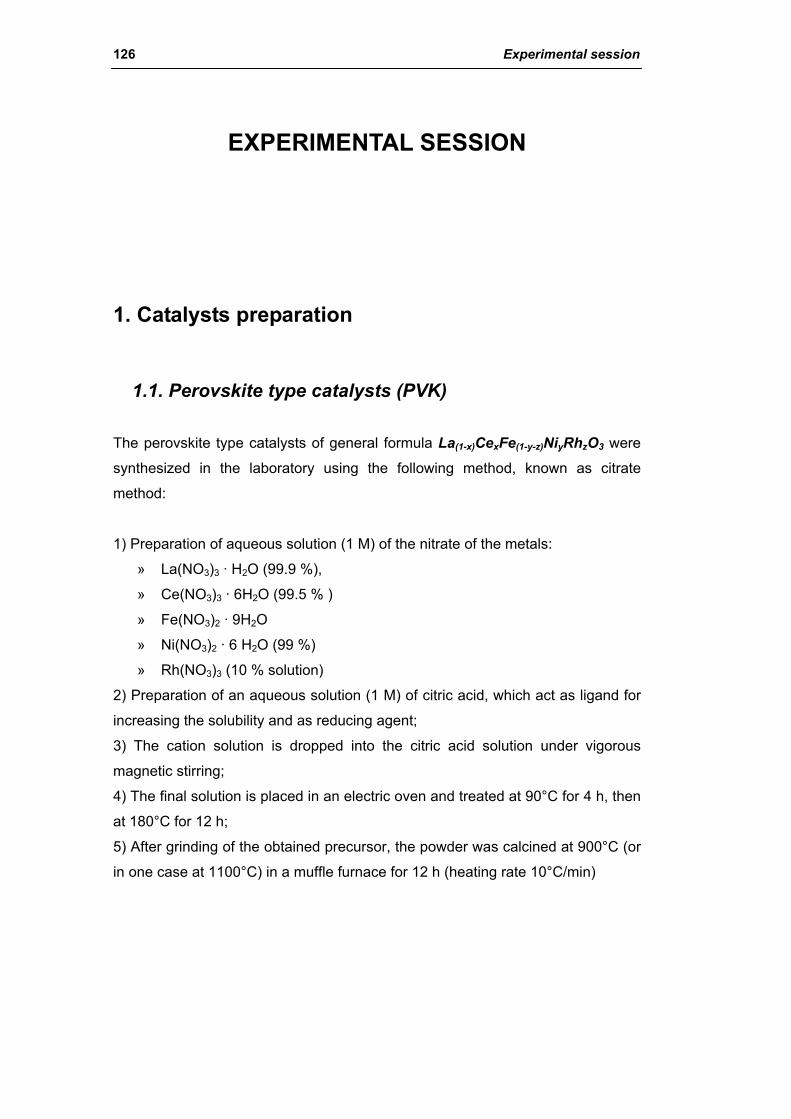
126 Experimental session
EXPERIMENTAL SESSION
1. Catalysts preparation
1.1. Perovskite type catalysts (PVK)
The perovskite type catalysts of general formula La(1-x)CexFe(1-y-z)NiyRhzO3 were
synthesized in the laboratory using the following method, known as citrate
method:
1) Preparation of aqueous solution (1 M) of the nitrate of the metals:
» La(NO3)3 · H2O (99.9 %),
» Ce(NO3)3 · 6H2O (99.5 % )
» Fe(NO3)2 · 9H2O
» Ni(NO3)2 · 6 H2O (99 %)
» Rh(NO3)3 (10 % solution)
2) Preparation of an aqueous solution (1 M) of citric acid, which act as ligand for
increasing the solubility and as reducing agent;
3) The cation solution is dropped into the citric acid solution under vigorous
magnetic stirring;
4) The final solution is placed in an electric oven and treated at 90°C for 4 h, then
at 180°C for 12 h;
5) After grinding of the obtained precursor, the powder was calcined at 900°C (or
in one case at 1100°C) in a muffle furnace for 12 h (heating rate 10°C/min)
Catalysts for H2 production 127
1.2. Catalysts obtained from hydrotalcite type precursors
The hydrotalcite type precursors (HT) of general formula
[M2+(1-x)M3+
x(OH)2]b+ · (An-b/n) · m H2O
with M2+ = Ni2+ and Mg2+
M3+ = Rh3+ and Al3+
An- = silicate
were synthesized in the laboratory using the following coprecipitation method:
1) Preparation of aqueous solution (0.2 M) of the nitrate of the metals:
» Mg(NO3)2 · 6H2O (99 %)
» Al(NO3)3 · 9H2O (98 %)
» Ni(NO3)2 · 6H2O (99 %)
» Rh(NO3)3 (10 % solution)
2) Preparation of aqueous silicate solution (30 % in excess with respect to the
amount required by the stoichiometry)
» SiO2·NaOH 27%
3) The cation solution is dropped, under magnetic stirring, into the solution of
silicates, at constant temperature (50-60°C). The pH was maintained constant
(10.5 ± 0.1) by adding NaOH (3 M). Once the dropping was finished, the obtained
dispersion was maintained under magnetic stirring for 45 minutes (at 50-60°C
and pH = 10.5).
4) The precipitate has been then separated from the mother liquor by filtration
under vacuum, washed with abundant hot water (60°C) and dried overnight at
100°C.
5) The dried precursor samples were grinded to obtain powder.
The catalysts (ex-HT) were obtained from the precursors by calcination at 900°C
for 12 h (heating rate 10°C/min).

128 Experimental session
2. Characterization of the catalysts
2.1. X-Ray diffraction analysis (XRD)
The XRD powder analyses were carried out using a Philips PW1050/81
diffractometer equipped with a graphite monochromator in the diffracted beam
and controlled by a PW1710 unit (Cu Kα, λ = 0.15418 nm). A °2θ range from 10°
to 80° was investigated at a scanning speed of 70°/h.
X-ray tube
Soller slit
Sample
Divergence slit
Anti-scatter
slitReceveing slit
Soller slit
Secondary monochromator
Detector
Detector slit
X-ray tube
Soller slit
Sample
Divergence slit
Anti-scatter
slitReceveing slit
Soller slit
Secondary monochromator
Detector
Detector slit
Fig. 2. 1 – Scheme of the instrument for the X-ray diffraction analysis.
The analysis of the phases present in the patterns were analyzed using the
Bragg’s Law:
ϑλ dsenn 2= in order to calculate the d values to compare with those reported in the literature
[Powder Diffraction Files - Inorganic Phase, ICDD (International Centre for
Diffraction Data)]. In addition, the particle sizes are calculated using the
Sherrer’s Law:
22cos bBkD
−=
ϑλ
Catalysts for H2 production 129
2.2. Surface area and porosimetry analyses
The surface area of the catalysts were determined by N2 adsorption at 77 K using
the one point B.E.T. method, using a Carlo Erba Sorpty Instrument (model 1700).
The porosimetry analysis were carried out with a Micromeritics ASAP 2020
(Accelerated Surface Area and Porosimetry System). This instrument measures
the adsorption and desorption isothermal curve (at 77 K) by the volume of
adsorbed/desorbed N2, as a function of relative pressure.
2.3. Temperature programmed reduction (TPR) and oxidation (TPO)
The reduction and oxidation profiles have been measured using a ThermoQuest
Instrument TPD/R/O 1100 Catalytic Surface Analyzer. The analyses were carried
out loading 0.1 g of sample, using the following procedure:
─ Pre-treatment : the sample was pre-treated under N2 (20 ml/min) from room
temperature to 150°C (temperature rate of 20°C/min) and hold for 30 minutes
at 150°C.
─ Reduction : after cooling until 100°C, the reduction analysis was carried out
with 5 % of H2 in Ar (20 ml/min) from 100 to 950°C (temperature rate of
10°C/min) and hold for 30 minutes at 950°C.
─ Oxidation : after cooling until 100°C, the oxidation analysis was carried out
with 5 % of O2 in He (20 ml/min) from 100 to 950°C (temperature rate of
10°C/min) and hold for 30 minutes at 950°C.
The oxidation step was carried out after the reduction on fresh samples to
evaluate the reoxidation of the active metals, or after the pretreatment (coupled
with quadrupole mass analyzer) on the used samples to evaluate possible carbon
deposits on the surface of the catalyst.
2.4. H2 Chemisorption analysis
The instrument used for the H2 chemisorption analysis is a ASAP 2020C
(Micromeritics) in which the analysis were carried after a pre-treatment under
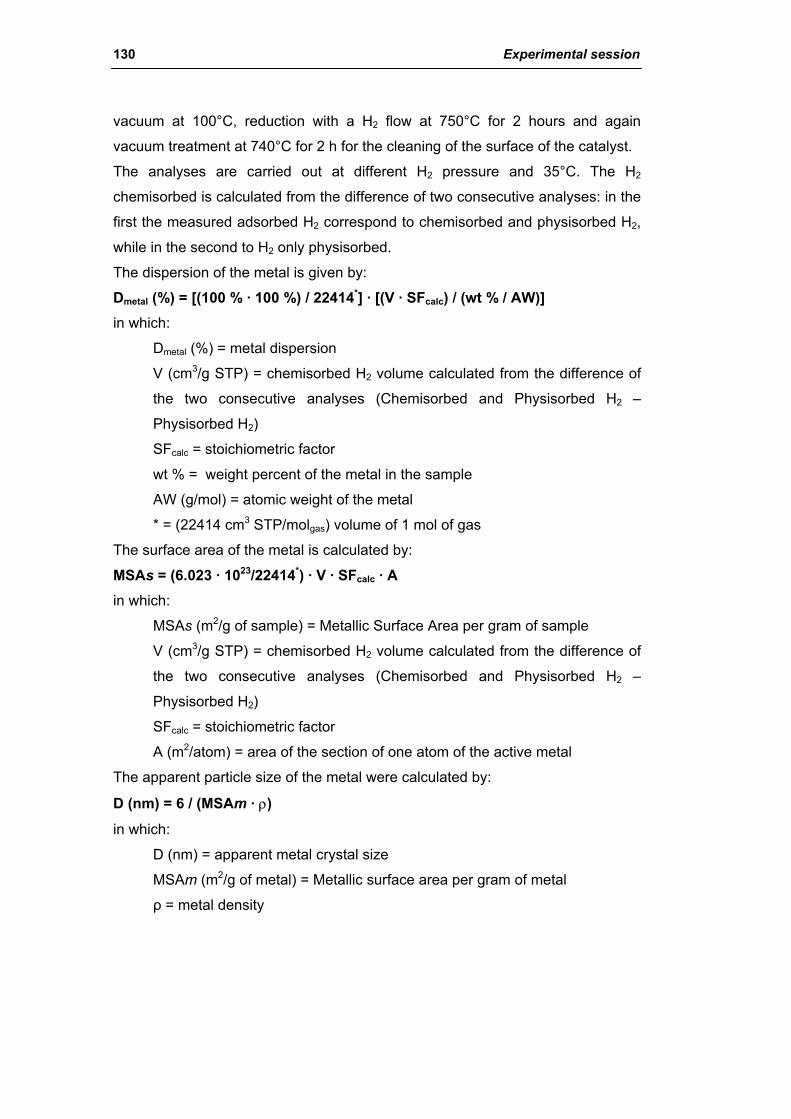
130 Experimental session
vacuum at 100°C, reduction with a H2 flow at 750°C for 2 hours and again
vacuum treatment at 740°C for 2 h for the cleaning of the surface of the catalyst.
The analyses are carried out at different H2 pressure and 35°C. The H2
chemisorbed is calculated from the difference of two consecutive analyses: in the
first the measured adsorbed H2 correspond to chemisorbed and physisorbed H2,
while in the second to H2 only physisorbed.
The dispersion of the metal is given by:
Dmetal (%) = [(100 % · 100 %) / 22414*] · [(V · SFcalc) / (wt % / AW)] in which:
Dmetal (%) = metal dispersion
V (cm3/g STP) = chemisorbed H2 volume calculated from the difference of
the two consecutive analyses (Chemisorbed and Physisorbed H2 –
Physisorbed H2)
SFcalc = stoichiometric factor
wt % = weight percent of the metal in the sample
AW (g/mol) = atomic weight of the metal
* = (22414 cm3 STP/molgas) volume of 1 mol of gas
The surface area of the metal is calculated by:
MSAs = (6.023 · 1023/22414*) · V · SFcalc · A in which:
MSAs (m2/g of sample) = Metallic Surface Area per gram of sample
V (cm3/g STP) = chemisorbed H2 volume calculated from the difference of
the two consecutive analyses (Chemisorbed and Physisorbed H2 –
Physisorbed H2)
SFcalc = stoichiometric factor
A (m2/atom) = area of the section of one atom of the active metal
The apparent particle size of the metal were calculated by:
D (nm) = 6 / (MSAm · ρ)
in which:
D (nm) = apparent metal crystal size
MSAm (m2/g of metal) = Metallic surface area per gram of metal
ρ = metal density

Catalysts for H2 production 131
2.5. Shaping in form of the catalysts
The powder catalysts prepared in the laboratory (PVK or ex-HT) were pressed, at
10 tonn for 30 min, in form of round plate pellet (diameter ∼ 1 cm and thickness ∼
4 mm) and then shivered in smaller particles, using apposite sieves, of different
dimensions depending on the catalytic process requirements:
- for CPO tests, the pellets were between 0.841 and 0.595 mm (corresponding to
granulometry of 20-40 mesh),
- for SMR tests, the pellets were between 1.410 and 0.841 mm (corresponding to
granulometry of 14-20 mesh).
For what concern the commercial catalysts, both fresh and used samples, being
already in form of large pellets, were directly crushed and sieved
2.6. CPO laboratory plant
The scheme of the reactor used for the catalytic partial oxidation tests of methane
are reported in the Fig. 2. 2.
The catalytic tests were carried out in a quartz microreactor (fixed bed) with a
internal diameter of 0.8 cm. the reactor was packed firstly inserting a monolith of
α-Al2O3 in the part of the reactor where there is a restriction of the quartz tube.
The monolith has the function of support for a layer of quartz wool used to create
a plane and uniform surface where the catalytic bed can be placed.
In the middle of the catalytic bed, a quartz thermocouple shell is positioned. The
cromel-alumel thermocouple, of 0.5 mm diameter, inserted in the shell can be
moved in the axial direction in order to measure the outlet and the maximum
temperatures of catalytic bed.
The reactor is placed inside an electric oven (500 W). The catalytic partial
oxidation process is carried out at atmospheric pressure, which was monitored by
a manometer placed before the reactor.
The feed gas (CH4/O2/He) flow was injected from the top, passed through the
catalytic bed and the produced syngas (CH4/H2/CO/CO2/H2O/He) leave the
reactor from the bottom. The syngas pass through a condenser and a trap
containing dehydrator agent (Drierite, CaSO4, 8 mesh, containing an indicator) in
order to remove all the water produced during the reaction (Fig. 2. 3).
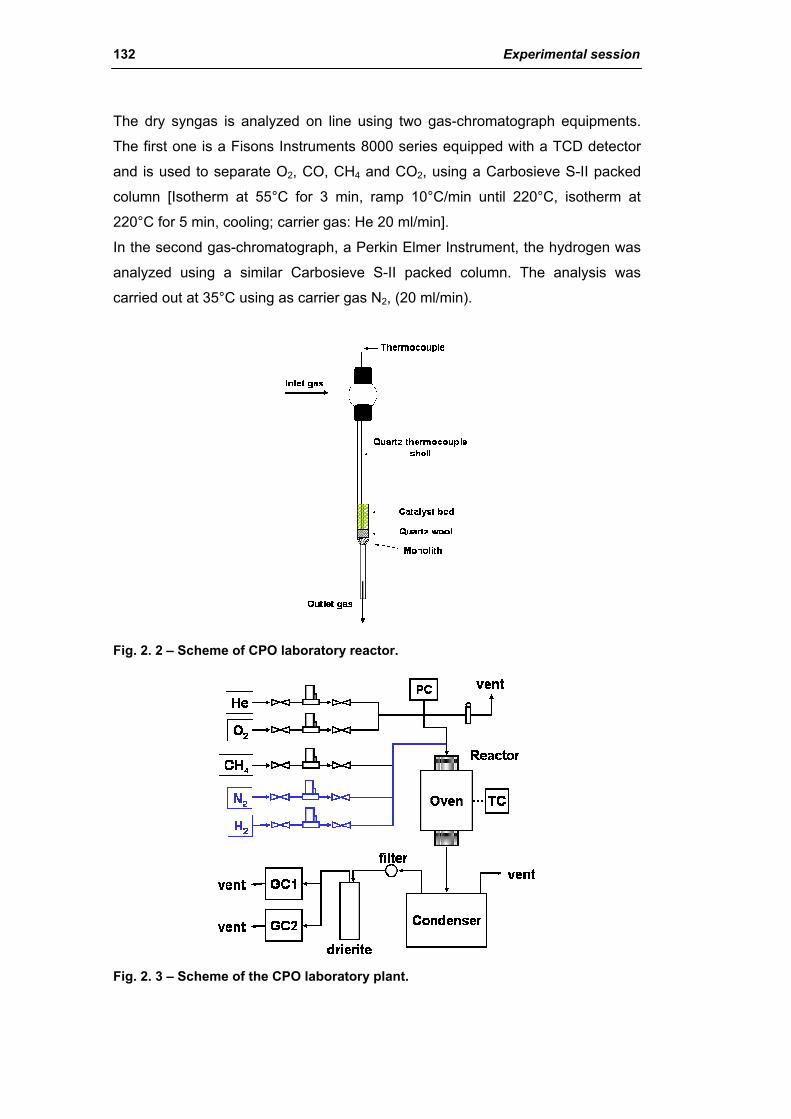
132 Experimental session
The dry syngas is analyzed on line using two gas-chromatograph equipments.
The first one is a Fisons Instruments 8000 series equipped with a TCD detector
and is used to separate O2, CO, CH4 and CO2, using a Carbosieve S-II packed
column [Isotherm at 55°C for 3 min, ramp 10°C/min until 220°C, isotherm at
220°C for 5 min, cooling; carrier gas: He 20 ml/min].
In the second gas-chromatograph, a Perkin Elmer Instrument, the hydrogen was
analyzed using a similar Carbosieve S-II packed column. The analysis was
carried out at 35°C using as carrier gas N2, (20 ml/min).
Fig. 2. 2 – Scheme of CPO laboratory reactor.
Fig. 2. 3 – Scheme of the CPO laboratory plant.
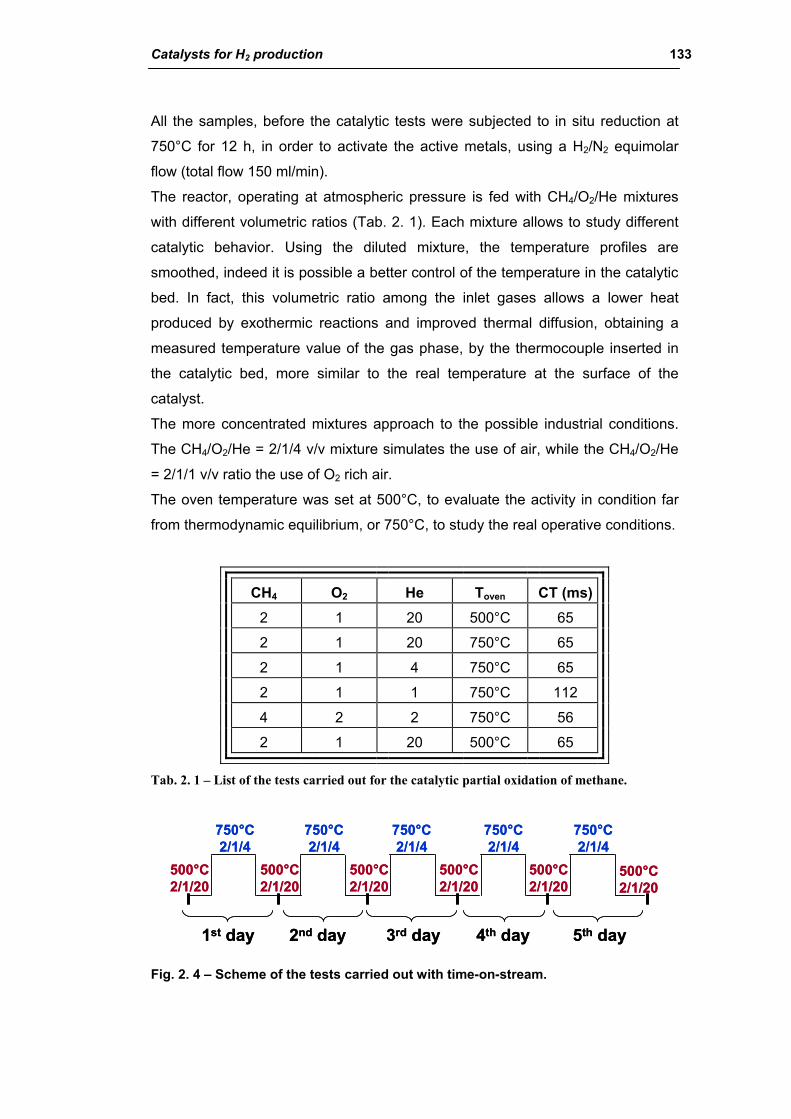
Catalysts for H2 production 133
All the samples, before the catalytic tests were subjected to in situ reduction at
750°C for 12 h, in order to activate the active metals, using a H2/N2 equimolar
flow (total flow 150 ml/min).
The reactor, operating at atmospheric pressure is fed with CH4/O2/He mixtures
with different volumetric ratios (Tab. 2. 1). Each mixture allows to study different
catalytic behavior. Using the diluted mixture, the temperature profiles are
smoothed, indeed it is possible a better control of the temperature in the catalytic
bed. In fact, this volumetric ratio among the inlet gases allows a lower heat
produced by exothermic reactions and improved thermal diffusion, obtaining a
measured temperature value of the gas phase, by the thermocouple inserted in
the catalytic bed, more similar to the real temperature at the surface of the
catalyst.
The more concentrated mixtures approach to the possible industrial conditions.
The CH4/O2/He = 2/1/4 v/v mixture simulates the use of air, while the CH4/O2/He
= 2/1/1 v/v ratio the use of O2 rich air.
The oven temperature was set at 500°C, to evaluate the activity in condition far
from thermodynamic equilibrium, or 750°C, to study the real operative conditions.
CH4 O2 He Toven CT (ms) 2 1 20 500°C 65
2 1 20 750°C 65
2 1 4 750°C 65
2 1 1 750°C 112
4 2 2 750°C 56
2 1 20 500°C 65
Tab. 2. 1 – List of the tests carried out for the catalytic partial oxidation of methane.
500°C 2/1/20
750°C2/1/4
750°C2/1/4
750°C2/1/4
750°C2/1/4
750°C2/1/4
500°C 2/1/20
500°C 2/1/20
500°C 2/1/20
500°C 2/1/20
500°C 2/1/20
1st day 2nd day 3rd day 4th day 5th day
500°C 2/1/20
750°C2/1/4
750°C2/1/4
750°C2/1/4
750°C2/1/4
750°C2/1/4
500°C 2/1/20
500°C 2/1/20
500°C 2/1/20
500°C 2/1/20
500°C 2/1/20
1st day 2nd day 3rd day 4th day 5th day
Fig. 2. 4 – Scheme of the tests carried out with time-on-stream.
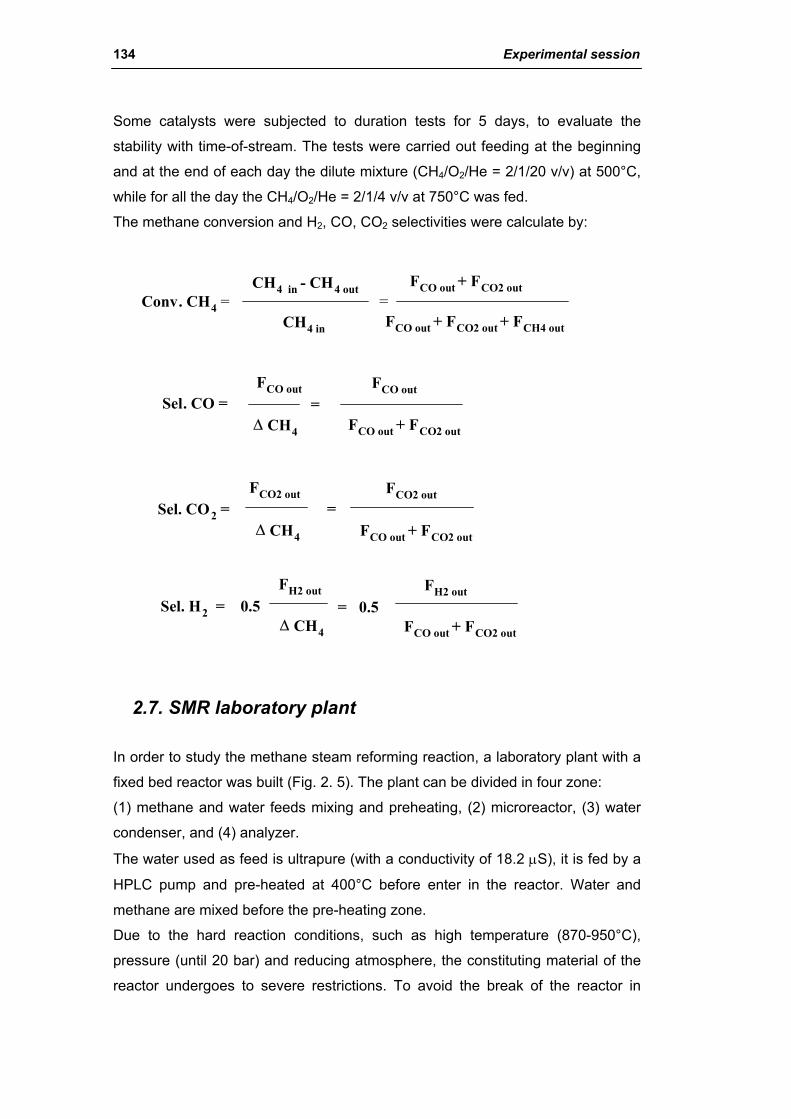
134 Experimental session
Some catalysts were subjected to duration tests for 5 days, to evaluate the
stability with time-of-stream. The tests were carried out feeding at the beginning
and at the end of each day the dilute mixture (CH4/O2/He = 2/1/20 v/v) at 500°C,
while for all the day the CH4/O2/He = 2/1/4 v/v at 750°C was fed.
The methane conversion and H2, CO, CO2 selectivities were calculate by:
Sel. CO2 =FCO2 out
∆ CH4
=FCO2 out
FCO out + FCO2 out
Sel. H2 = 0.5FH2 out
∆ CH4
= 0.5FH2 out
FCO out + FCO2 out
CH4 in - CH4 outConv. CH4 =
CH4 in
=FCO out + FCO2 out
FCO out + FCO2 out + FCH4 out
Sel. CO =FCO out
∆ CH4
=FCO out + FCO2 out
FCO out
2.7. SMR laboratory plant
In order to study the methane steam reforming reaction, a laboratory plant with a
fixed bed reactor was built (Fig. 2. 5). The plant can be divided in four zone:
(1) methane and water feeds mixing and preheating, (2) microreactor, (3) water
condenser, and (4) analyzer.
The water used as feed is ultrapure (with a conductivity of 18.2 µS), it is fed by a
HPLC pump and pre-heated at 400°C before enter in the reactor. Water and
methane are mixed before the pre-heating zone.
Due to the hard reaction conditions, such as high temperature (870-950°C),
pressure (until 20 bar) and reducing atmosphere, the constituting material of the
reactor undergoes to severe restrictions. To avoid the break of the reactor in

Catalysts for H2 production 135
these conditions, it was built in a special alloy material (Incoloy 800HT)
constituted by chromium (20-25%), nickel (30-35 %) and iron (40-45 %).
Fig. 2. 5 - Scheme of the SMR laboratory plant.
Fig. 2. 6 – Scheme of the laboratory SMR reactor.
136 Experimental session
Inside the reactor (Fig. 2. 6), along the axial direction a thermocouple shell is
inserted, in this fixed shell it is possible to move the cromel-alumel thermocouple
(0.8 mm of diameter) in the axial direction in order to measure the axial thermal
profile during reaction. The reactor is placed inside an electric oven.
The wet syngas, going out from the reactor, pass through a water condenser that
separates the major amount of non reacted water and through a trap containing a
dehydrator agent (Drierite, CaSO4, 8 mesh, containing an indicator) in order to
remove any residual traces of water.
Between the water condenser and the dehydration trap, a pressure regulator is
placed to maintain the feed zone and the microreactor under the operative
pressure conditions, while after this control device the pressure is atmospheric,
that is useful for the analysis.
The dry syngas is then analyzed on line using two gas-chromatograph
equipments (the system is the same used for catalytic partial oxidation plant).
The first gas-chromatograph is a Fisons Instruments 8000 series equipped with a
TCD detector and is used to separate O2, CO, CH4 and CO2, using a Carbosieve
S-II packed column [Isotherm at 55°C for 3 min, ramp 10°C/min until 220°C,
isotherm at 220°C for 5 min, cooling; carrier gas: He 20 ml/min].
The second gas-chromatograph is a Perkin Elmer Instrument, for the hydrogen
analysis using a similar Carbosieve S-II packed column. The analysis was carried
out at 35°C using as carrier gas N2, (20 ml/min).
The catalytic tests were carried out in the following reaction conditions:
• P = 10 bar, 15 bar and 20bar
• CT = 4 s, 2 s, 1.1 s and 0.83 s
• Tout = 870°C and 930°C (measured temperature at the outlet of the catalytic
bed)
• Toven = 800°C and 950°C (oven set temperature)
• S/C = 1.7 and 2.5 ml/mol (and in one case 1.1, 1.4, 3 and 4 mol/mol)
• Dp = 1.410 - 0.841 mm (granulometry of 14-20 mesh)
• Vcat = 6 ml, 10 ml and 12 ml.
Before testing catalysts, the laboratory plant was subjected to preliminary activity
tests loading all the reactor tube with corundum beads (α-Al2O3), to evaluate the
activity of this material chosen as inert and to evaluate if the reactor itself has
some activity due to the high % of Ni in the special alloy material (30-35%).
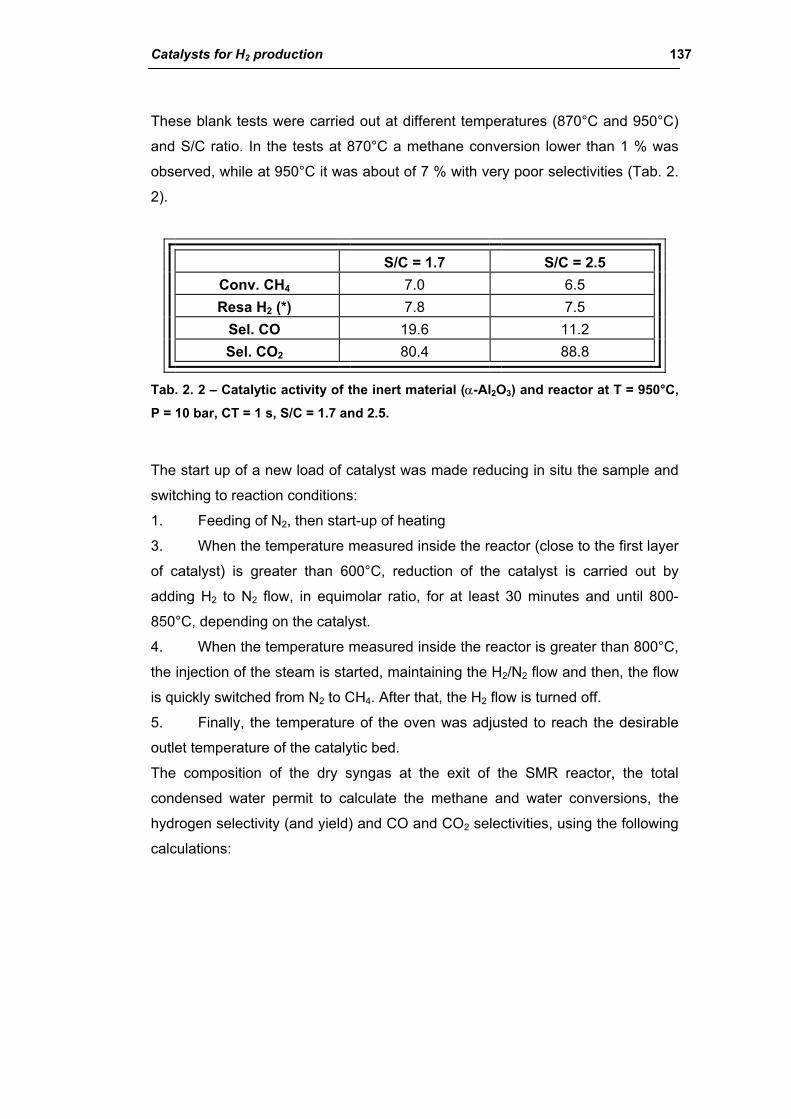
Catalysts for H2 production 137
These blank tests were carried out at different temperatures (870°C and 950°C)
and S/C ratio. In the tests at 870°C a methane conversion lower than 1 % was
observed, while at 950°C it was about of 7 % with very poor selectivities (Tab. 2.
2).
S/C = 1.7 S/C = 2.5 Conv. CH4 7.0 6.5 Resa H2 (*) 7.8 7.5
Sel. CO 19.6 11.2 Sel. CO2 80.4 88.8
Tab. 2. 2 – Catalytic activity of the inert material (α-Al2O3) and reactor at T = 950°C,
P = 10 bar, CT = 1 s, S/C = 1.7 and 2.5.
The start up of a new load of catalyst was made reducing in situ the sample and
switching to reaction conditions:
1. Feeding of N2, then start-up of heating
3. When the temperature measured inside the reactor (close to the first layer
of catalyst) is greater than 600°C, reduction of the catalyst is carried out by
adding H2 to N2 flow, in equimolar ratio, for at least 30 minutes and until 800-
850°C, depending on the catalyst.
4. When the temperature measured inside the reactor is greater than 800°C,
the injection of the steam is started, maintaining the H2/N2 flow and then, the flow
is quickly switched from N2 to CH4. After that, the H2 flow is turned off.
5. Finally, the temperature of the oven was adjusted to reach the desirable
outlet temperature of the catalytic bed.
The composition of the dry syngas at the exit of the SMR reactor, the total
condensed water permit to calculate the methane and water conversions, the
hydrogen selectivity (and yield) and CO and CO2 selectivities, using the following
calculations:
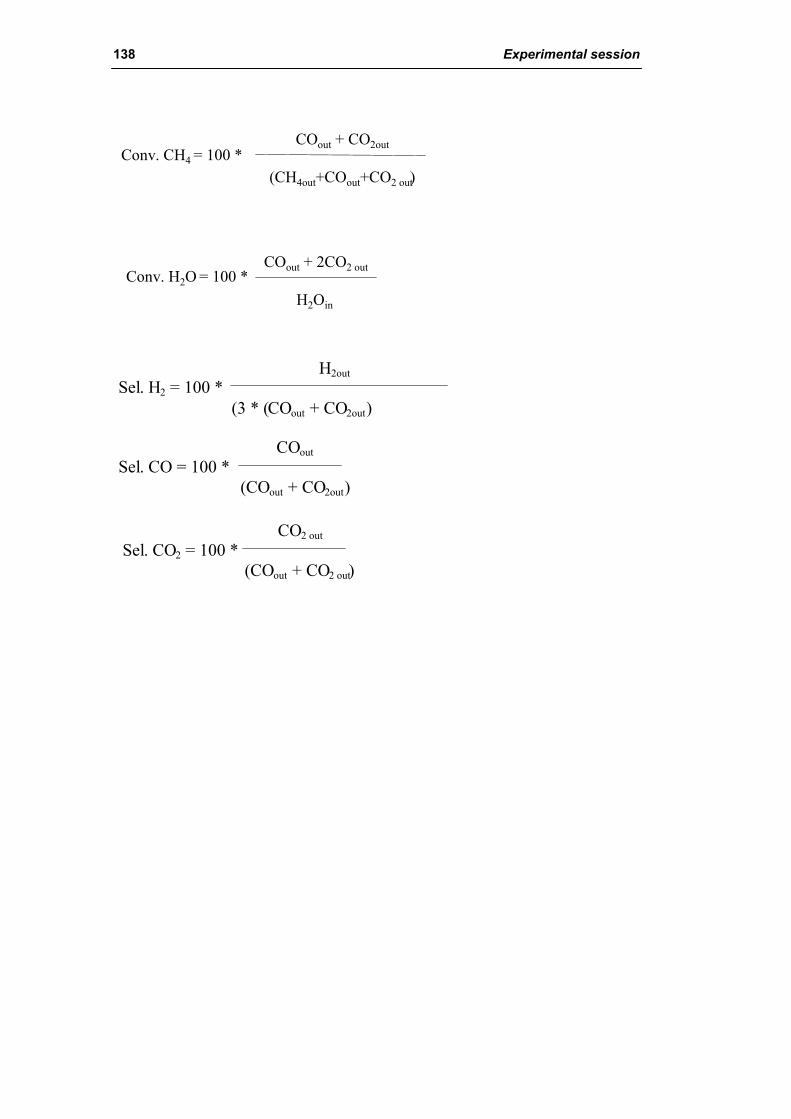
138 Experimental session
Conv. H2O = 100 *
Conv. CH4 = 100 *COout + CO2out
(CH4out+COout+CO2 out)
COout + 2CO2 out
H2Oin
Sel. H2 = 100 *H2out
(3 * (COout + CO2out)
Sel. CO = 100 *COout
(COout + CO2out)
Sel. CO2 = 100 *CO2 out
(COout + CO2 out)
Catalysts for H2 production 139
RESULTS AND DISCUSSION
1. Aim of the work
The aim of this work was the study of new catalysts, active and stable in the
hydrogen production from methane/natural gas, using either a new process, the
catalytic partial oxidation (CPO), or a enhanced well-established process, the
steam methane reforming (SMR).
Two types of catalytic materials were examined:
■ Bulk catalysts, i.e. non-supported materials, in which the active metals (Ni
and/or Rh) are stabilized inside oxidic matrix, obtained from perovskite type
compounds (PVK) and from hydrotalcite type precursors (HT);
■ Structured catalysts, i.e. catalysts supported on materials having high
thermal conductivity (SiC and metallic foams).
The study of the two reactions was carried out differently due to the different
industrial development stage of these processes.
As first, regarding the catalytic partial oxidation, new catalysts (PVK and HT)
were examined. The effect of the metal, the role of the metal/matrix ratio and the
matrix formulation was studied extensively.
In the second part of the work related to the steam methane reforming, the study
was carried out first on the commercial catalysts examining the deactivation in
industrial conditions, the role of the operating conditions (P, T, CT, S/C, Vcat and
Dp) and the activity of different type of catalysts. Then, innovative materials bulk
(PVK and HT) and structured catalysts (SiC and metallic foam) were studied.

140 Results and discussion
2. Catalytic partial oxidation of methane
The study of new catalysts, active and stable in the catalytic partial oxidation
reaction, was focused on two types of bulk active materials: perovskite type
catalysts (PVK) and catalysts obtained from hydrotalcite type precursors (HT).
In both cases the effect of the metal, the role of the metal/matrix ratio and the
matrix formulation was studied.
2.1. Perovskite (PVK) type catalysts
Perovskite-type oxides (general formula ABO3) with the typical crystal structure of
perovskite, shown in the Fig. 3. 1, ave been used99. The A cations are in
dodecahedral sites, while the B cations are in octahedral sites.
A B O
A A -- CellCell B B -- CellCell
A B O
A A -- CellCell B B -- CellCell
Fig. 3. 1 - Crystal structure of perovskite-t ype oxides (ABO3). A: La, Sr, Ba, Ca, etc. B: Ti, V, Cr, Mn, Fe, Co, Ni, Cu, Zr, Nb, Ru, etc.
Catalysts for H2 production 141
One of the more successful applications is their use as combustion catalysts in
exhaust gas cleaning utilizing low temperature burners. Furthermore, the
perovskite materials can found important application in O2- active membrane
applications. The reason for the catalytic intent of perovskite oxides lies mainly in
the high mobility of oxygen and the stabilization of unusual cations oxidation
states in this structure, together with their stability at high temperature.
Modulation of these characteristics could be done by appropriate partial
substitution of cations in A and B positions. The substitution in B position has the
additional advantage that the cations in these sites are transition cations that
usually have an important role in the catalytic processes99.
Provendier et al100 reported that LaFeO3 was relatively stable and the substitution
of a part of Fe with Ni resulted in an increase in the activity in partial oxidation of
methane, in which Ni alone was reduced to form the highly dispersed metal
particles without collapsing the LaFeO3 perovskite structure. This system permits
to control the reversible migration of nickel from the structure to the surface. The
best system for the partial oxidation of CH4 is LaNi0.3Fe0.7O3, which showed no
deactivation at 800°C during 250 h and no coke formation. These results strongly
suggest that stable perovskite permit to produce stable finely dispersed Ni metal
particles on the supports, which should be effective for the CH4 reforming
reaction.
In this work, perovskite type catalysts were studied with the general formula101
La(1-x)CexFe(1-y-z)NiyRhzO3.
Varying the amount of the different cations and the calcination temperature,
different type of catalyst were prepared in order to study the role and the effect of
the active metal, the role of the metal/matrix ratio and the matrix formulation and
in order to find the best catalyst composition. Different catalysts were prepared
varying:
■ the Rh amount z = 0.00 0.01 0.1
■ the Ce amount x = 0.0 0.1 0.2
■ the Ni amount y = 0.0 0.1 0.3 0.5
■ the calcination temperature 900°C 1100°C

142 Results and discussion
All the PVK samples tested in the partial oxidation reaction were characterized
before and after use by X-ray diffraction analysis and single point B.E.T. surface
area analysis. The surface areas of all the samples were very low (< 5 m2g-1),
indeed it was impossible using this technique to distinguish among the samples
and to determine if deactivation by support sintering occurs.
The activity was studied monitoring the methane conversion and the synthesis
gas selectivity during reaction in different reaction conditions (see the
experimental section chapter). The oxygen conversion is not reported because it
is 100%. Before the catalytic tests, all the samples were pretreated in a H2/N2
flow in order to reduce the active metal for the reaction.
2.1.1. Effect of Rh amount (La1Fe(0.7-z)Ni0.3Rhz)
The insertion of Rh was suggested from previous studies on hydrotalcite type
precursors where Ni/Rh catalysts show to be the best formulation.
The catalyst chosen for studying the effect and the role of the rhodium content
and role have the general formulation La1Fe(0.7-z)Ni0.3Rhz with z = 0.0, 0.01 and
0.1. The rhodium content was increased 10 times: z = 0.01 corresponds to about
0.4 wt %, while z = 0.1 to 4 wt %. In the XRD patterns of all the fresh samples it is
possible to observe that only the perovskite and a side NiO phases are present,
while no rhodium containing phases are detected due to its complete insertion in
the PVK structure (Fig. 3. 2).
The samples were reduced in situ at 750°C for 12 h before the use in the partial
oxidation reaction to extract the rhodium from the structure in the metallic form.
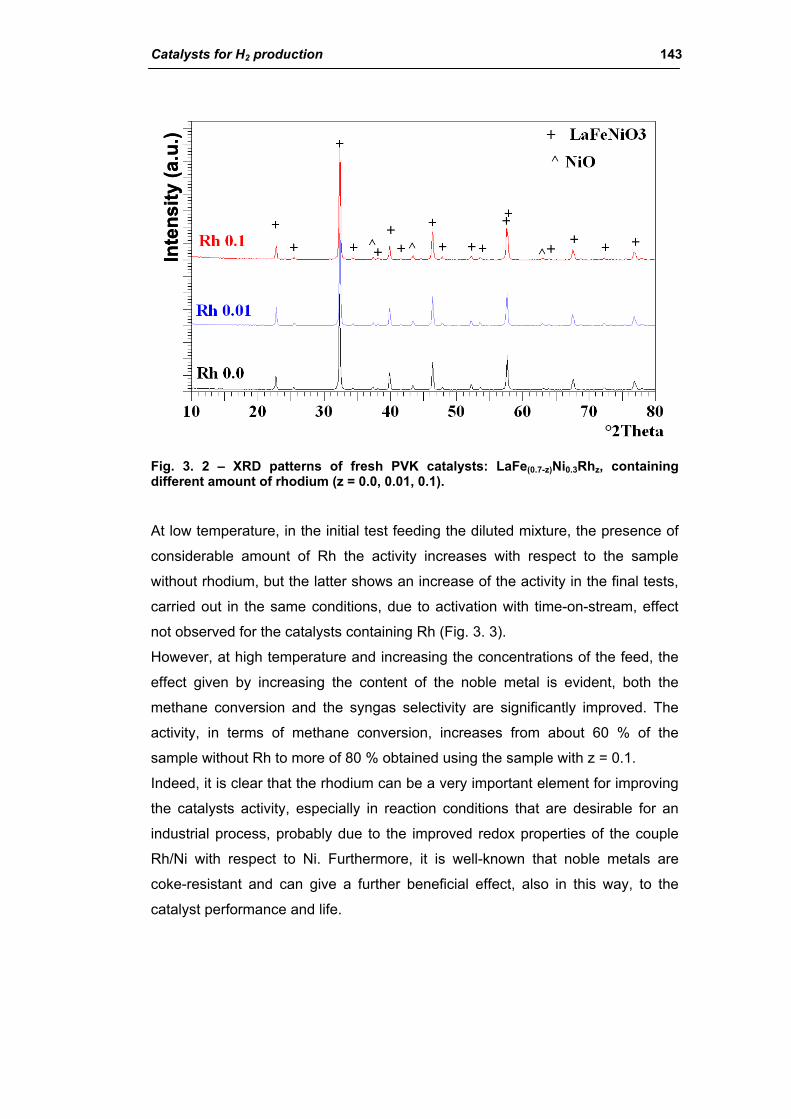
Catalysts for H2 production 143
Inte
nsity
(a.u
.)In
tens
ity (a
.u.)
Fig. 3. 2 – XRD patterns of fresh PVK catalysts: LaFe(0.7-z)Ni0.3Rhz, containing different amount of rhodium (z = 0.0, 0.01, 0.1).
At low temperature, in the initial test feeding the diluted mixture, the presence of
considerable amount of Rh the activity increases with respect to the sample
without rhodium, but the latter shows an increase of the activity in the final tests,
carried out in the same conditions, due to activation with time-on-stream, effect
not observed for the catalysts containing Rh (Fig. 3. 3).
However, at high temperature and increasing the concentrations of the feed, the
effect given by increasing the content of the noble metal is evident, both the
methane conversion and the syngas selectivity are significantly improved. The
activity, in terms of methane conversion, increases from about 60 % of the
sample without Rh to more of 80 % obtained using the sample with z = 0.1.
Indeed, it is clear that the rhodium can be a very important element for improving
the catalysts activity, especially in reaction conditions that are desirable for an
industrial process, probably due to the improved redox properties of the couple
Rh/Ni with respect to Ni. Furthermore, it is well-known that noble metals are
coke-resistant and can give a further beneficial effect, also in this way, to the
catalyst performance and life.
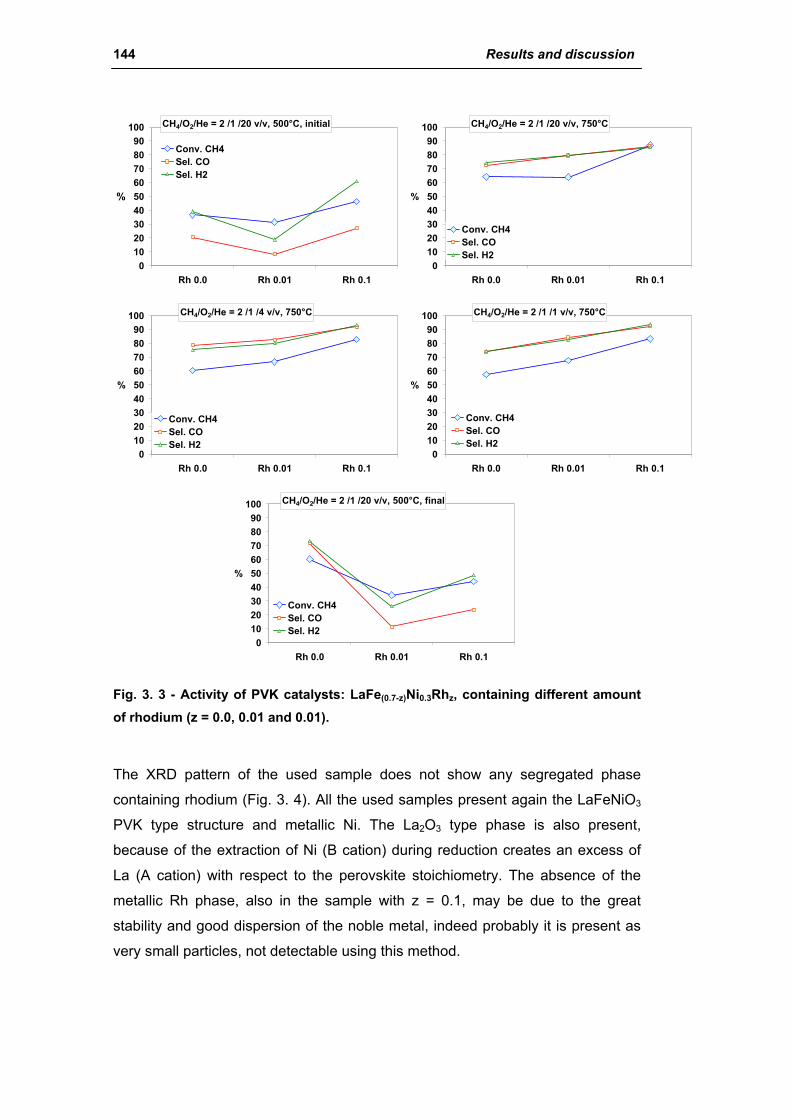
144 Results and discussion
CH4/O2/He = 2 /1 /20 v/v, 500°C, initial
0102030405060708090
100
Rh 0.0 Rh 0.01 Rh 0.1
%
Conv. CH4Sel. COSel. H2
CH4/O2/He = 2 /1 /20 v/v, 750°C
0102030405060708090
100
Rh 0.0 Rh 0.01 Rh 0.1
%
Conv. CH4Sel. COSel. H2
CH4/O2/He = 2 /1 /4 v/v, 750°C
0102030405060708090
100
Rh 0.0 Rh 0.01 Rh 0.1
%
Conv. CH4Sel. COSel. H2
CH4/O2/He = 2 /1 /1 v/v, 750°C
0102030405060708090
100
Rh 0.0 Rh 0.01 Rh 0.1
%
Conv. CH4Sel. COSel. H2
CH4/O2/He = 2 /1 /20 v/v, 500°C, final
0102030405060708090
100
Rh 0.0 Rh 0.01 Rh 0.1
%
Conv. CH4Sel. COSel. H2
Fig. 3. 3 - Activity of PVK catalysts: LaFe(0.7-z)Ni0.3Rhz, containing different amount of rhodium (z = 0.0, 0.01 and 0.01).
The XRD pattern of the used sample does not show any segregated phase
containing rhodium (Fig. 3. 4). All the used samples present again the LaFeNiO3
PVK type structure and metallic Ni. The La2O3 type phase is also present,
because of the extraction of Ni (B cation) during reduction creates an excess of
La (A cation) with respect to the perovskite stoichiometry. The absence of the
metallic Rh phase, also in the sample with z = 0.1, may be due to the great
stability and good dispersion of the noble metal, indeed probably it is present as
very small particles, not detectable using this method.

Catalysts for H2 production 145
Inte
nsity
(a.u
.)In
tens
ity (a
.u.)
Fig. 3. 4 - XRD patterns of used PVK catalysts: LaFe(0.7-z)Ni0.3Rhz, containing different amount of rhodium (z = 0.0, 0.01, 0.1).
2.1.2. Effect of Ce amount (La(1-x)CexFe0.69Ni0.3Rh0.01)
The catalysts used to study the role of the cerium and the effect of its amount
have a general formula La(1-x)CexFe0.69Ni0.3Rh0.01 (x = 0.0, 0.1 and 0.2). These
samples were prepared by the citrate method and were calcined in static air at
900°C for 12 h (heating rate 10°C/min).
The cerium was introduced because it can easily store and release oxygen atoms
due to the redox properties of Ce ions (Ce4+ to Cex+, x < 4), facilitating the
oxidation reaction of adsorbed carbon atoms during the reaction. Theoretically,
the Ce cations is inserted in the perovskite structure in the A dodecahedral sites
together with the lanthanum cations. However, the XRD pattern of the fresh
samples shows, besides the perovskite structure, LaFeNiO3, a minor phase
constituted of CeO2 that increase with increasing the amount of Ce added during
the preparation. Probably, only low amount of cerium can be inserted in the
perovskitic structure and part of it segregate to cerium oxide during the thermal
treatment at 900°C, due to the high stability of the CeO2 phase. It can be noted
from the XRD pattern that, increasing the cerium amount, the crystallinity of the
perovskitic structure is lower and the reflections are slightly shift towards higher
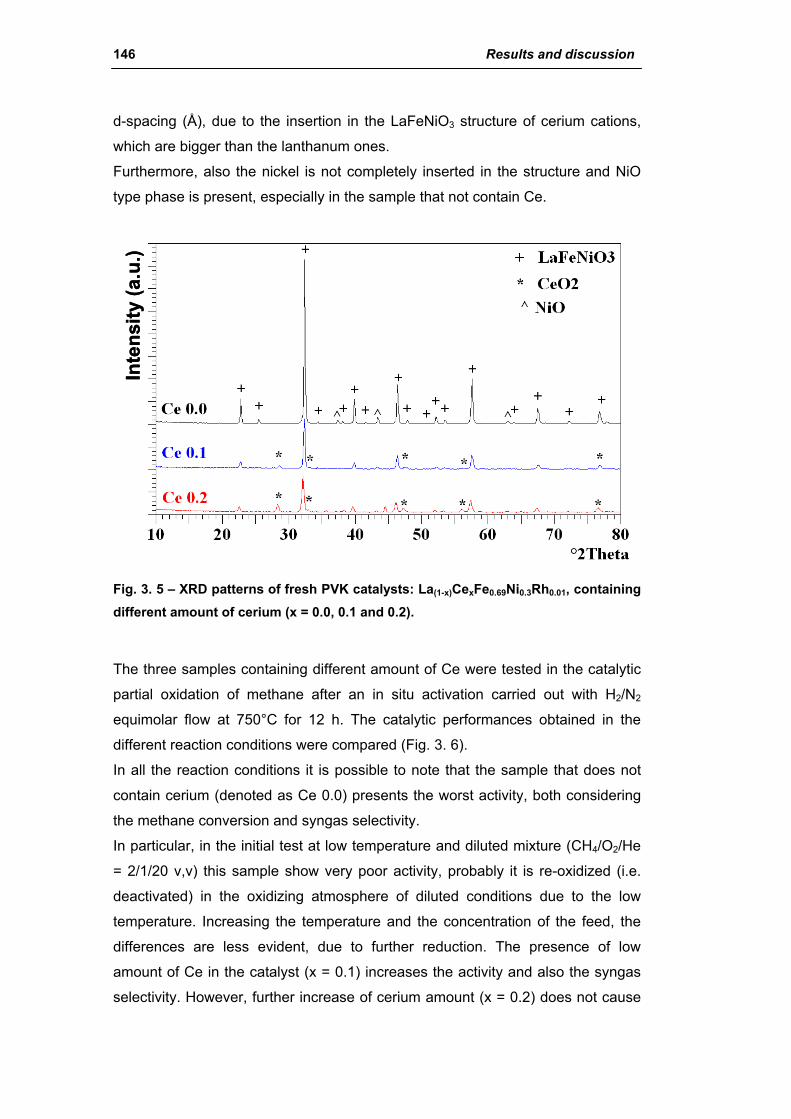
146 Results and discussion
d-spacing (Å), due to the insertion in the LaFeNiO3 structure of cerium cations,
which are bigger than the lanthanum ones.
Furthermore, also the nickel is not completely inserted in the structure and NiO
type phase is present, especially in the sample that not contain Ce.
Inte
nsity
(a.u
.)In
tens
ity (a
.u.)
Fig. 3. 5 – XRD patterns of fresh PVK catalysts: La(1-x)CexFe0.69Ni0.3Rh0.01, containing different amount of cerium (x = 0.0, 0.1 and 0.2).
The three samples containing different amount of Ce were tested in the catalytic
partial oxidation of methane after an in situ activation carried out with H2/N2
equimolar flow at 750°C for 12 h. The catalytic performances obtained in the
different reaction conditions were compared (Fig. 3. 6).
In all the reaction conditions it is possible to note that the sample that does not
contain cerium (denoted as Ce 0.0) presents the worst activity, both considering
the methane conversion and syngas selectivity.
In particular, in the initial test at low temperature and diluted mixture (CH4/O2/He
= 2/1/20 v,v) this sample show very poor activity, probably it is re-oxidized (i.e.
deactivated) in the oxidizing atmosphere of diluted conditions due to the low
temperature. Increasing the temperature and the concentration of the feed, the
differences are less evident, due to further reduction. The presence of low
amount of Ce in the catalyst (x = 0.1) increases the activity and also the syngas
selectivity. However, further increase of cerium amount (x = 0.2) does not cause

Catalysts for H2 production 147
a further improvement, but neither a decrease of the catalyst performances. In
fact, the Ce 0.2 sample shows about the same activity of the Ce 0.1. Effectively,
the cerium oxide present on the surface of the catalyst can release oxygen atoms
and actively participate to the CPO reaction.
CH4/O2/He = 2 /1 /20 v/v, 500°C, initial
0
10
20
30
40
50
60
70
80
90
100
Ce 0.0 Ce 0.1 Ce 0.2
%
Conv. CH4Sel. COSel. H2
CH4/O2/He = 2 /1 /20 v/v, 750°C
0102030405060708090
100
Ce 0.0 Ce 0.1 Ce 0.2
%
Conv. CH4Sel. COSel. H2
CH4/O2/He = 2 /1 /4 v/v, 750°C
0102030405060708090
100
Ce 0.0 Ce 0.1 Ce 0.2
%
Conv. CH4Sel. COSel. H2
CH4/O2/He = 2 /1 /1 v/v, 750°C
0102030405060708090
100
Ce 0.0 Ce 0.1 Ce 0.2
%
Conv. CH4Sel. COSel. H2
CH4/O2/He = 2 /1 /20 v/v, 500°C, final
0102030405060708090
100
Ce 0.0 Ce 0.1 Ce 0.2
%
Conv. CH4Sel. COSel. H2
Fig. 3. 6 – Activity of PVK catalysts: La(1-x)CexFe0.69Ni0.3Rh0.01, containing different amount of cerium (x = 0.0, 0.1 and 0.2).
The XRD pattern of the used catalyst without cerium shows, after reaction, a
slight decrease of crystallinity and, besides the reduction of nickel oxide to
metallic nickel, the segregation of La2O3 (Fig. 3. 7). On the contrary, increasing
the amount of cerium leads to lower La2O3 segregation and a decrease of the
CeO2 phase with respect the respective fresh samples, probably due to insertion
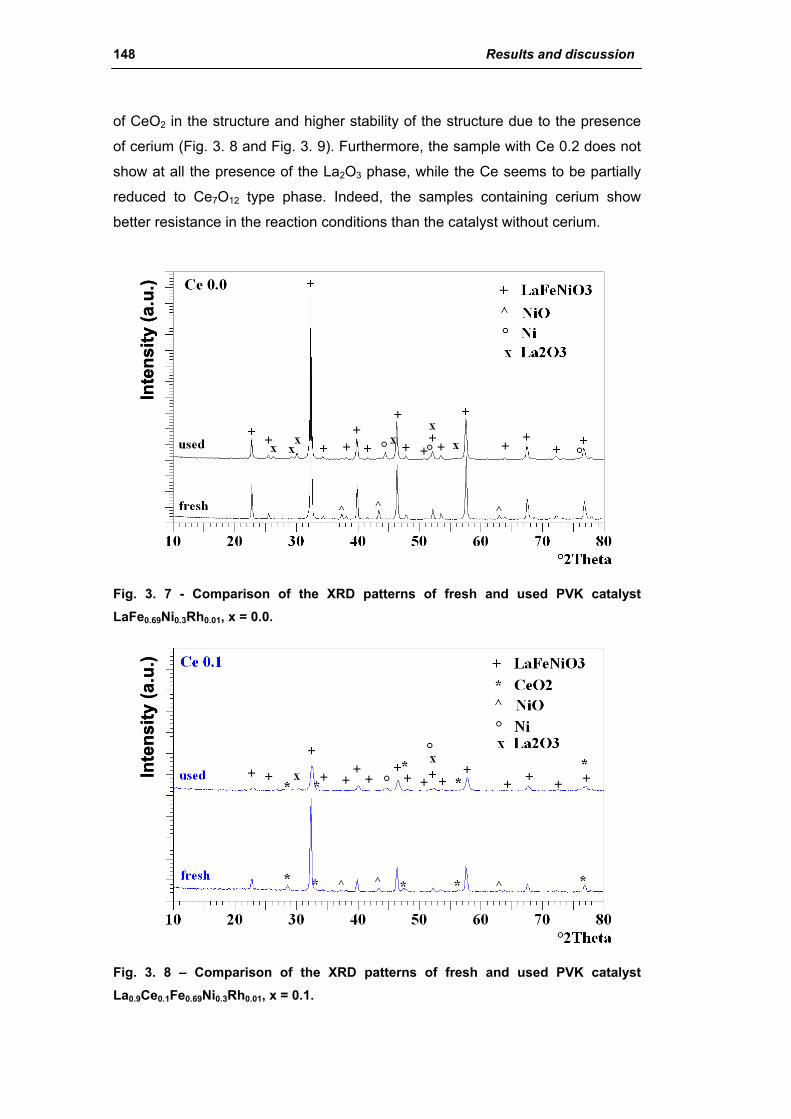
148 Results and discussion
of CeO2 in the structure and higher stability of the structure due to the presence
of cerium (Fig. 3. 8 and Fig. 3. 9). Furthermore, the sample with Ce 0.2 does not
show at all the presence of the La2O3 phase, while the Ce seems to be partially
reduced to Ce7O12 type phase. Indeed, the samples containing cerium show
better resistance in the reaction conditions than the catalyst without cerium.
Inte
nsity
(a.u
.)In
tens
ity (a
.u.)
Fig. 3. 7 - Comparison of the XRD patterns of fresh and used PVK catalyst LaFe0.69Ni0.3Rh0.01, x = 0.0.
Inte
nsity
(a.u
.)In
tens
ity (a
.u.)
Fig. 3. 8 – Comparison of the XRD patterns of fresh and used PVK catalyst La0.9Ce0.1Fe0.69Ni0.3Rh0.01, x = 0.1.
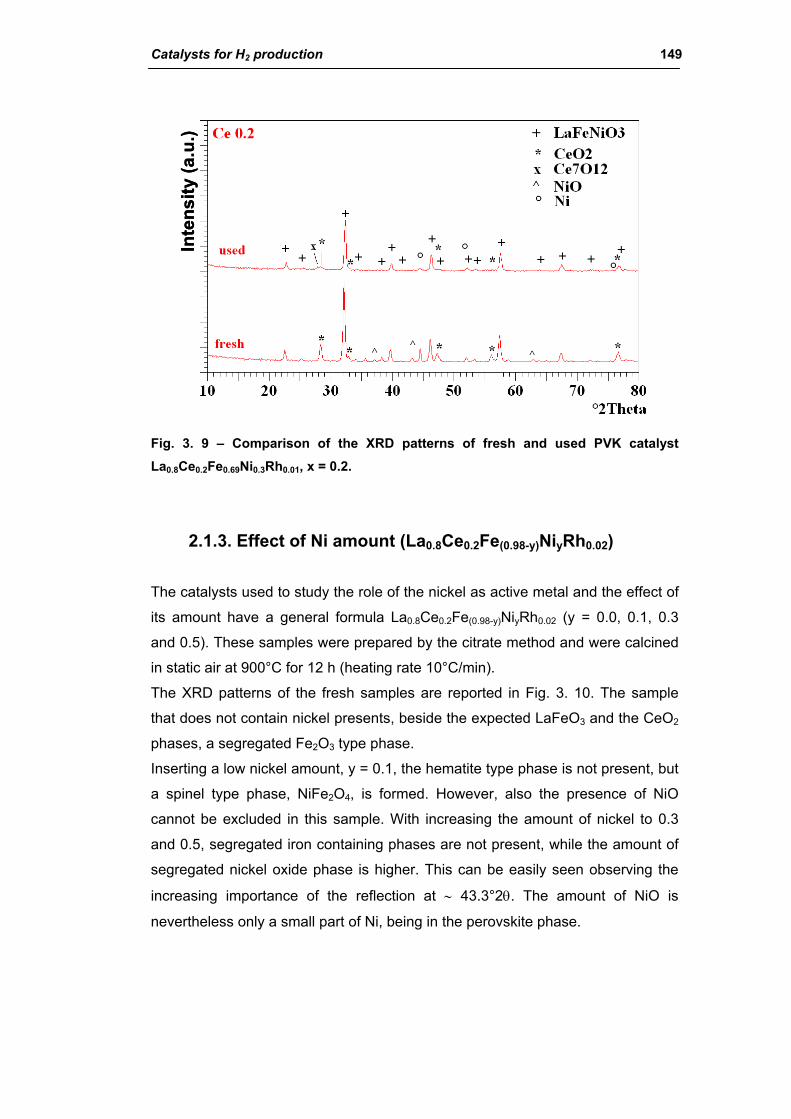
Catalysts for H2 production 149
Inte
nsity
(a.u
.)In
tens
ity (a
.u.)
Fig. 3. 9 – Comparison of the XRD patterns of fresh and used PVK catalyst La0.8Ce0.2Fe0.69Ni0.3Rh0.01, x = 0.2.
2.1.3. Effect of Ni amount (La0.8Ce0.2Fe(0.98-y)NiyRh0.02)
The catalysts used to study the role of the nickel as active metal and the effect of
its amount have a general formula La0.8Ce0.2Fe(0.98-y)NiyRh0.02 (y = 0.0, 0.1, 0.3
and 0.5). These samples were prepared by the citrate method and were calcined
in static air at 900°C for 12 h (heating rate 10°C/min).
The XRD patterns of the fresh samples are reported in Fig. 3. 10. The sample
that does not contain nickel presents, beside the expected LaFeO3 and the CeO2
phases, a segregated Fe2O3 type phase.
Inserting a low nickel amount, y = 0.1, the hematite type phase is not present, but
a spinel type phase, NiFe2O4, is formed. However, also the presence of NiO
cannot be excluded in this sample. With increasing the amount of nickel to 0.3
and 0.5, segregated iron containing phases are not present, while the amount of
segregated nickel oxide phase is higher. This can be easily seen observing the
increasing importance of the reflection at ∼ 43.3°2θ. The amount of NiO is
nevertheless only a small part of Ni, being in the perovskite phase.
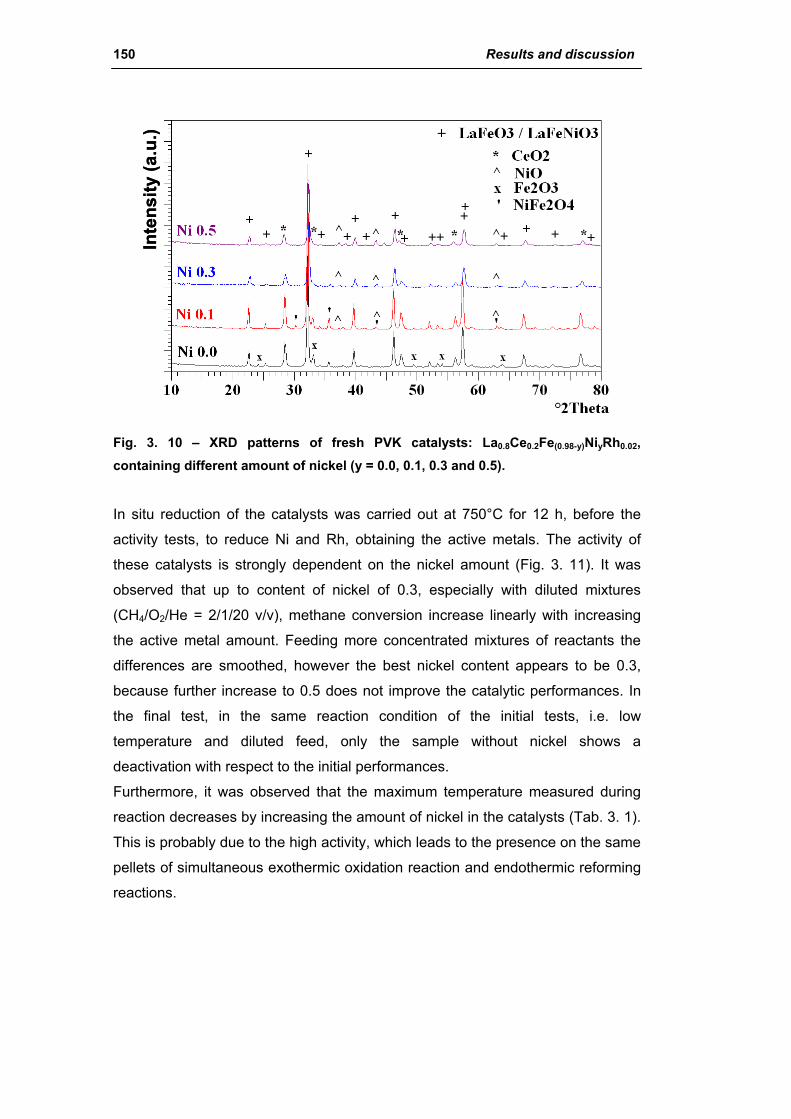
150 Results and discussion
Inte
nsity
(a.u
.)In
tens
ity (a
.u.)
Fig. 3. 10 – XRD patterns of fresh PVK catalysts: La0.8Ce0.2Fe(0.98-y)NiyRh0.02, containing different amount of nickel (y = 0.0, 0.1, 0.3 and 0.5).
In situ reduction of the catalysts was carried out at 750°C for 12 h, before the
activity tests, to reduce Ni and Rh, obtaining the active metals. The activity of
these catalysts is strongly dependent on the nickel amount (Fig. 3. 11). It was
observed that up to content of nickel of 0.3, especially with diluted mixtures
(CH4/O2/He = 2/1/20 v/v), methane conversion increase linearly with increasing
the active metal amount. Feeding more concentrated mixtures of reactants the
differences are smoothed, however the best nickel content appears to be 0.3,
because further increase to 0.5 does not improve the catalytic performances. In
the final test, in the same reaction condition of the initial tests, i.e. low
temperature and diluted feed, only the sample without nickel shows a
deactivation with respect to the initial performances.
Furthermore, it was observed that the maximum temperature measured during
reaction decreases by increasing the amount of nickel in the catalysts (Tab. 3. 1).
This is probably due to the high activity, which leads to the presence on the same
pellets of simultaneous exothermic oxidation reaction and endothermic reforming
reactions.
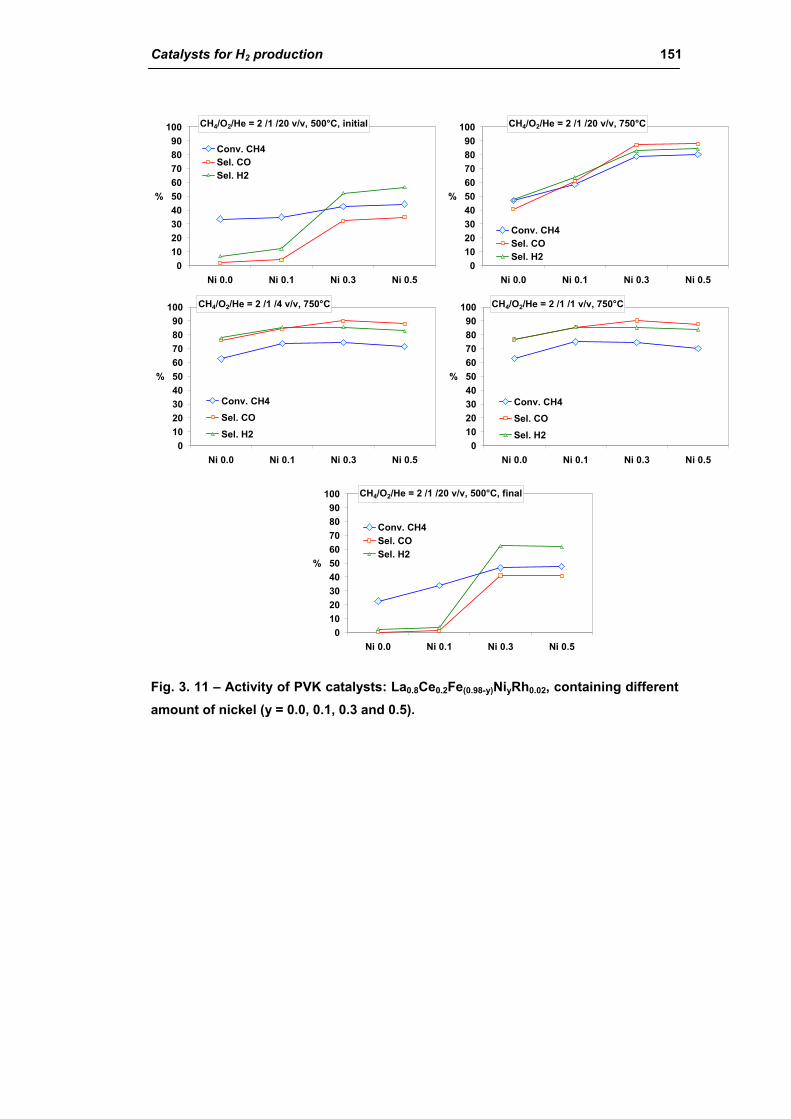
Catalysts for H2 production 151
CH4/O2/He = 2 /1 /20 v/v, 500°C, initial
0102030405060708090
100
Ni 0.0 Ni 0.1 Ni 0.3 Ni 0.5
%
Conv. CH4Sel. COSel. H2
CH4/O2/He = 2 /1 /20 v/v, 750°C
0102030405060708090
100
Ni 0.0 Ni 0.1 Ni 0.3 Ni 0.5
%
Conv. CH4Sel. COSel. H2
CH4/O2/He = 2 /1 /4 v/v, 750°C
0102030405060708090
100
Ni 0.0 Ni 0.1 Ni 0.3 Ni 0.5
%
Conv. CH4Sel. COSel. H2
CH4/O2/He = 2 /1 /1 v/v, 750°C
0102030405060708090
100
Ni 0.0 Ni 0.1 Ni 0.3 Ni 0.5
%
Conv. CH4Sel. COSel. H2
CH4/O2/He = 2 /1 /20 v/v, 500°C, final
0102030405060708090
100
Ni 0.0 Ni 0.1 Ni 0.3 Ni 0.5
%
Conv. CH4Sel. COSel. H2
Fig. 3. 11 – Activity of PVK catalysts: La0.8Ce0.2Fe(0.98-y)NiyRh0.02, containing different amount of nickel (y = 0.0, 0.1, 0.3 and 0.5).
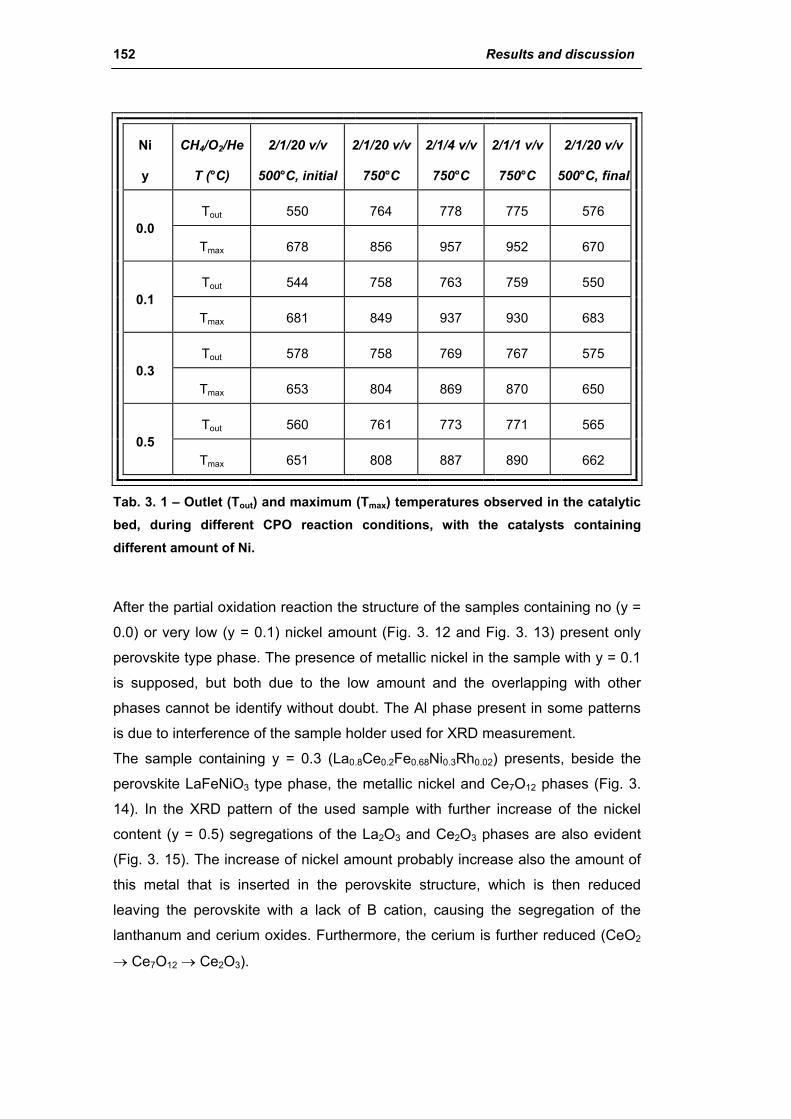
152 Results and discussion
Ni
y
CH4/O2/He
T (°C)
2/1/20 v/v
500°C, initial
2/1/20 v/v
750°C
2/1/4 v/v
750°C
2/1/1 v/v
750°C
2/1/20 v/v
500°C, final
Tout 550 764 778 775 576 0.0
Tmax 678 856 957 952 670
Tout 544 758 763 759 550 0.1
Tmax 681 849 937 930 683
Tout 578 758 769 767 575 0.3
Tmax 653 804 869 870 650
Tout 560 761 773 771 565 0.5
Tmax 651 808 887 890 662
Tab. 3. 1 – Outlet (Tout) and maximum (Tmax) temperatures observed in the catalytic bed, during different CPO reaction conditions, with the catalysts containing different amount of Ni.
After the partial oxidation reaction the structure of the samples containing no (y =
0.0) or very low (y = 0.1) nickel amount (Fig. 3. 12 and Fig. 3. 13) present only
perovskite type phase. The presence of metallic nickel in the sample with y = 0.1
is supposed, but both due to the low amount and the overlapping with other
phases cannot be identify without doubt. The Al phase present in some patterns
is due to interference of the sample holder used for XRD measurement.
The sample containing y = 0.3 (La0.8Ce0.2Fe0.68Ni0.3Rh0.02) presents, beside the
perovskite LaFeNiO3 type phase, the metallic nickel and Ce7O12 phases (Fig. 3.
14). In the XRD pattern of the used sample with further increase of the nickel
content (y = 0.5) segregations of the La2O3 and Ce2O3 phases are also evident
(Fig. 3. 15). The increase of nickel amount probably increase also the amount of
this metal that is inserted in the perovskite structure, which is then reduced
leaving the perovskite with a lack of B cation, causing the segregation of the
lanthanum and cerium oxides. Furthermore, the cerium is further reduced (CeO2
→ Ce7O12 → Ce2O3).
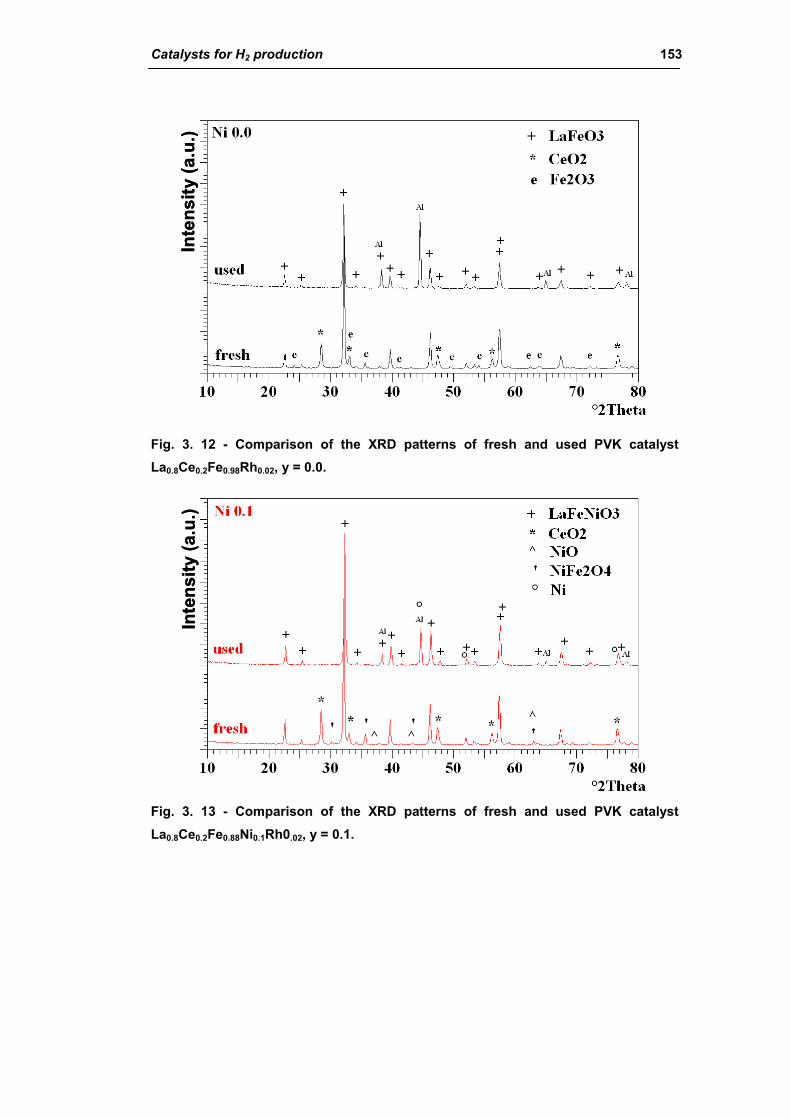
Catalysts for H2 production 153
Inte
nsity
(a.u
.)In
tens
ity (a
.u.)
Fig. 3. 12 - Comparison of the XRD patterns of fresh and used PVK catalyst La0.8Ce0.2Fe0.98Rh0.02, y = 0.0.
Inte
nsity
(a.u
.)In
tens
ity (a
.u.)
Fig. 3. 13 - Comparison of the XRD patterns of fresh and used PVK catalyst La0.8Ce0.2Fe0.88Ni0.1Rh0.02, y = 0.1.
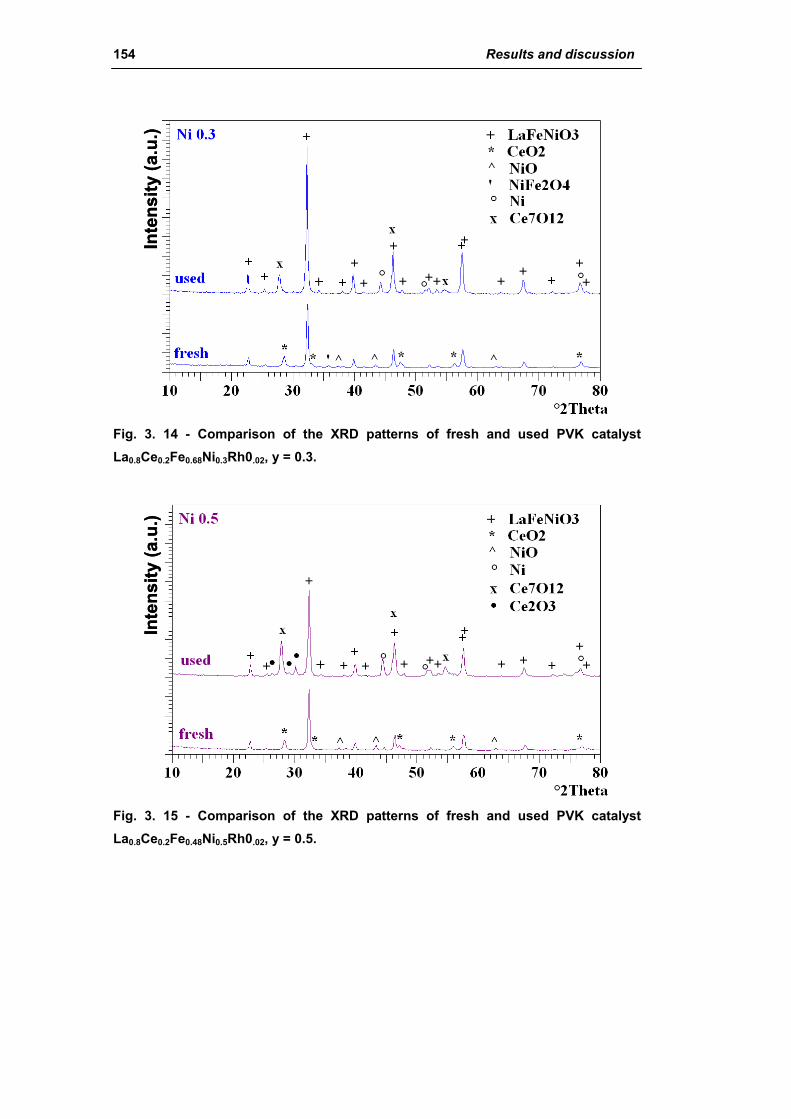
154 Results and discussion
Inte
nsity
(a.u
.)In
tens
ity (a
.u.)
Fig. 3. 14 - Comparison of the XRD patterns of fresh and used PVK catalyst La0.8Ce0.2Fe0.68Ni0.3Rh0.02, y = 0.3.
Inte
nsity
(a.u
.)In
tens
ity (a
.u.)
Fig. 3. 15 - Comparison of the XRD patterns of fresh and used PVK catalyst La0.8Ce0.2Fe0.48Ni0.5Rh0.02, y = 0.5.
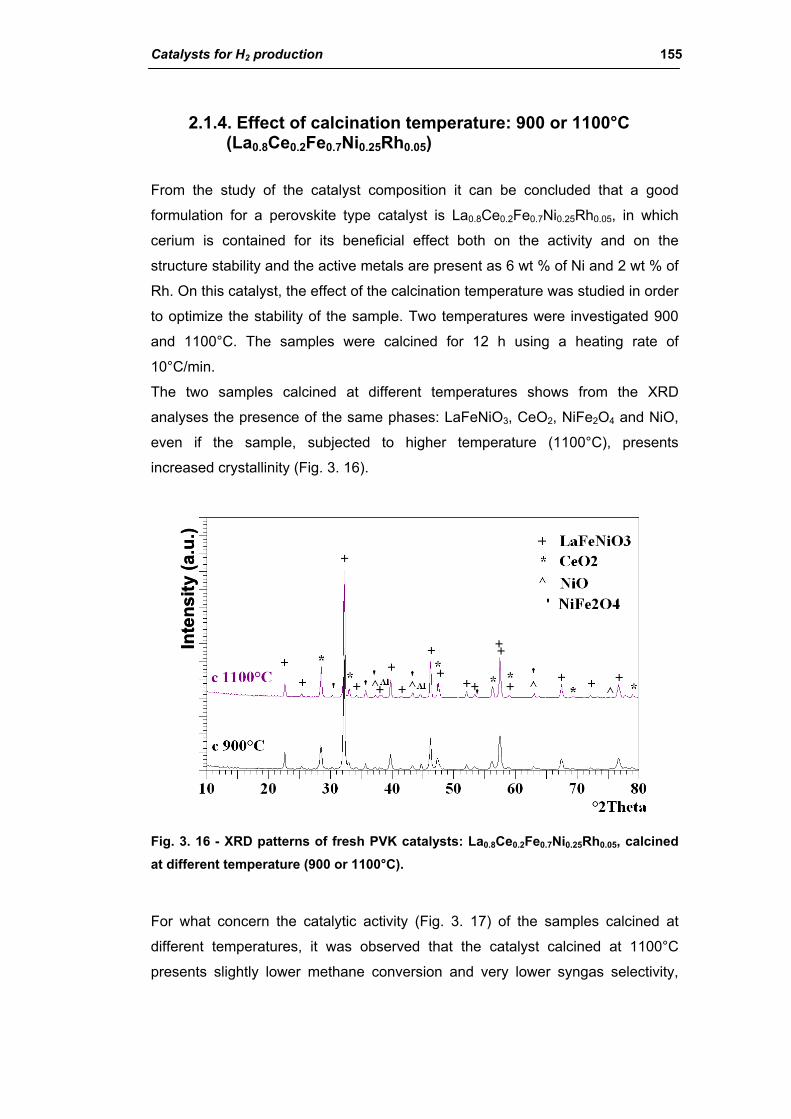
Catalysts for H2 production 155
2.1.4. Effect of calcination temperature: 900 or 1100°C (La0.8Ce0.2Fe0.7Ni0.25Rh0.05)
From the study of the catalyst composition it can be concluded that a good
formulation for a perovskite type catalyst is La0.8Ce0.2Fe0.7Ni0.25Rh0.05, in which
cerium is contained for its beneficial effect both on the activity and on the
structure stability and the active metals are present as 6 wt % of Ni and 2 wt % of
Rh. On this catalyst, the effect of the calcination temperature was studied in order
to optimize the stability of the sample. Two temperatures were investigated 900
and 1100°C. The samples were calcined for 12 h using a heating rate of
10°C/min.
The two samples calcined at different temperatures shows from the XRD
analyses the presence of the same phases: LaFeNiO3, CeO2, NiFe2O4 and NiO,
even if the sample, subjected to higher temperature (1100°C), presents
increased crystallinity (Fig. 3. 16).
Inte
nsity
(a.u
.)In
tens
ity (a
.u.)
Fig. 3. 16 - XRD patterns of fresh PVK catalysts: La0.8Ce0.2Fe0.7Ni0.25Rh0.05, calcined at different temperature (900 or 1100°C).
For what concern the catalytic activity (Fig. 3. 17) of the samples calcined at
different temperatures, it was observed that the catalyst calcined at 1100°C
presents slightly lower methane conversion and very lower syngas selectivity,
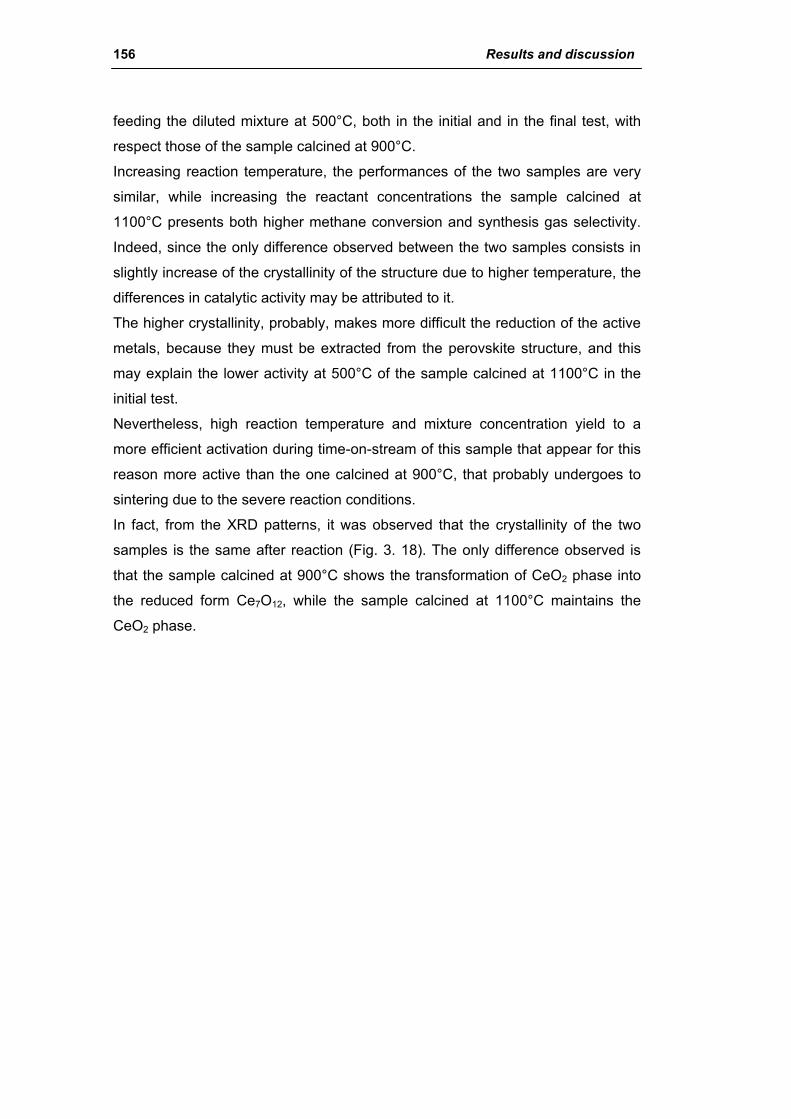
156 Results and discussion
feeding the diluted mixture at 500°C, both in the initial and in the final test, with
respect those of the sample calcined at 900°C.
Increasing reaction temperature, the performances of the two samples are very
similar, while increasing the reactant concentrations the sample calcined at
1100°C presents both higher methane conversion and synthesis gas selectivity.
Indeed, since the only difference observed between the two samples consists in
slightly increase of the crystallinity of the structure due to higher temperature, the
differences in catalytic activity may be attributed to it.
The higher crystallinity, probably, makes more difficult the reduction of the active
metals, because they must be extracted from the perovskite structure, and this
may explain the lower activity at 500°C of the sample calcined at 1100°C in the
initial test.
Nevertheless, high reaction temperature and mixture concentration yield to a
more efficient activation during time-on-stream of this sample that appear for this
reason more active than the one calcined at 900°C, that probably undergoes to
sintering due to the severe reaction conditions.
In fact, from the XRD patterns, it was observed that the crystallinity of the two
samples is the same after reaction (Fig. 3. 18). The only difference observed is
that the sample calcined at 900°C shows the transformation of CeO2 phase into
the reduced form Ce7O12, while the sample calcined at 1100°C maintains the
CeO2 phase.
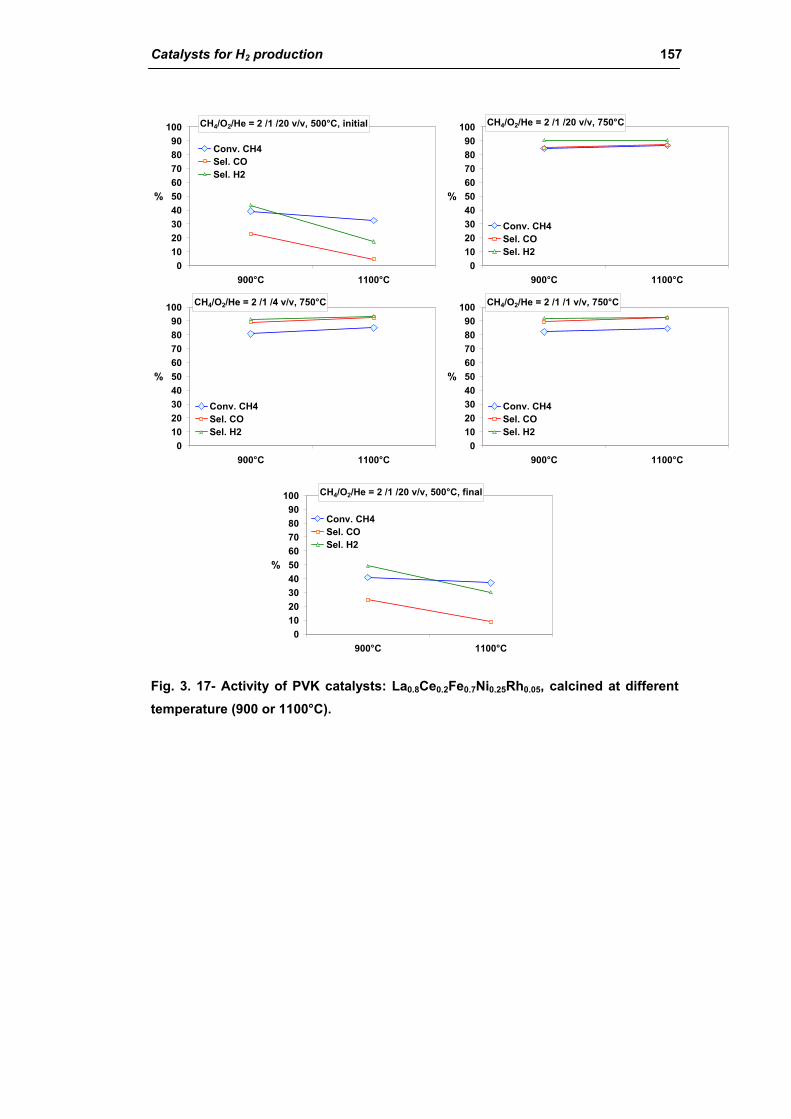
Catalysts for H2 production 157
CH4/O2/He = 2 /1 /20 v/v, 500°C, initial
0102030405060708090
100
900°C 1100°C
%
Conv. CH4Sel. COSel. H2
CH4/O2/He = 2 /1 /20 v/v, 750°C
0102030405060708090
100
900°C 1100°C
%
Conv. CH4Sel. COSel. H2
CH4/O2/He = 2 /1 /4 v/v, 750°C
0102030405060708090
100
900°C 1100°C
%
Conv. CH4Sel. COSel. H2
CH4/O2/He = 2 /1 /1 v/v, 750°C
0102030405060708090
100
900°C 1100°C
%
Conv. CH4Sel. COSel. H2
CH4/O2/He = 2 /1 /20 v/v, 500°C, final
0102030405060708090
100
900°C 1100°C
%
Conv. CH4Sel. COSel. H2
Fig. 3. 17- Activity of PVK catalysts: La0.8Ce0.2Fe0.7Ni0.25Rh0.05, calcined at different temperature (900 or 1100°C).
158 Results and discussion
Inte
nsity
(a.u
.)In
tens
ity (a
.u.)
Fig. 3. 18 - XRD patterns of used PVK catalysts: La0.8Ce0.2Fe0.7Ni0.25Rh0.05, calcined at different temperature (900 or 1100°C).
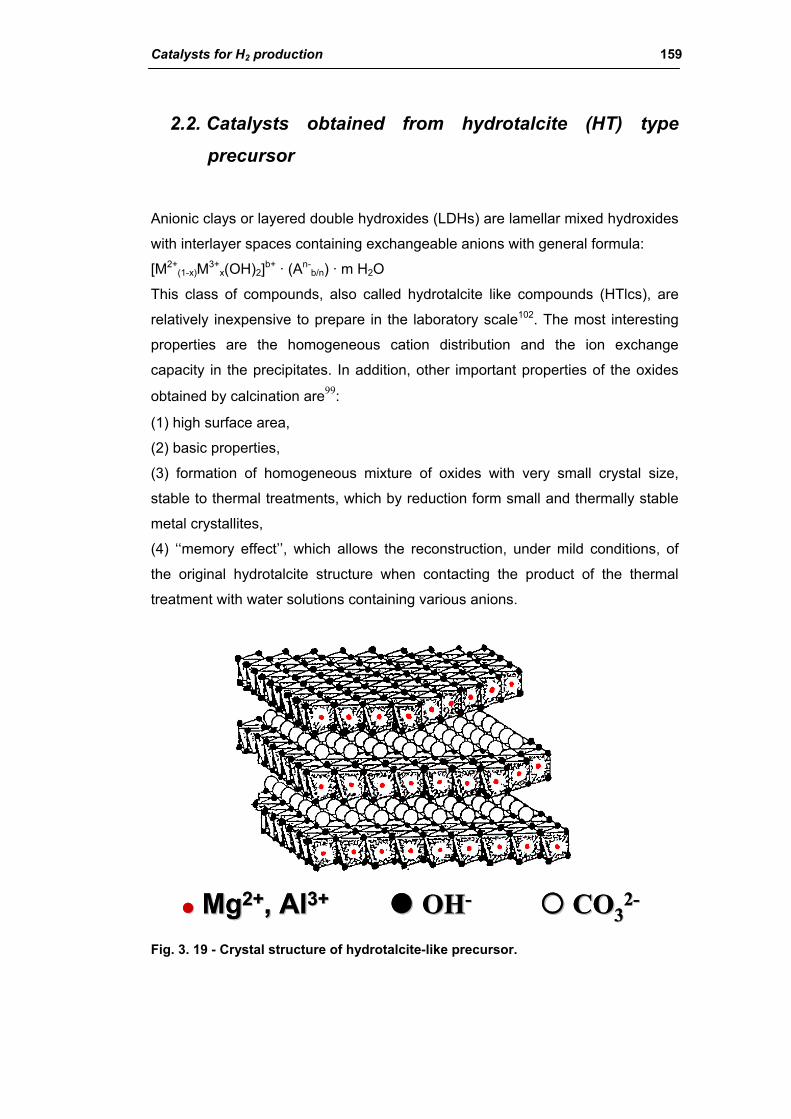
Catalysts for H2 production 159
2.2. Catalysts obtained from hydrotalcite (HT) type
precursor
Anionic clays or layered double hydroxides (LDHs) are lamellar mixed hydroxides
with interlayer spaces containing exchangeable anions with general formula:
[M2+(1-x)M3+
x(OH)2]b+ · (An-b/n) · m H2O
This class of compounds, also called hydrotalcite like compounds (HTlcs), are
relatively inexpensive to prepare in the laboratory scale102. The most interesting
properties are the homogeneous cation distribution and the ion exchange
capacity in the precipitates. In addition, other important properties of the oxides
obtained by calcination are99:
(1) high surface area,
(2) basic properties,
(3) formation of homogeneous mixture of oxides with very small crystal size,
stable to thermal treatments, which by reduction form small and thermally stable
metal crystallites,
(4) ‘‘memory effect’’, which allows the reconstruction, under mild conditions, of
the original hydrotalcite structure when contacting the product of the thermal
treatment with water solutions containing various anions.
MgMg2+2+, Al, Al3+3+ OHOH-- COCO3322--MgMg2+2+, Al, Al3+3+ OHOH-- COCO3322--
Fig. 3. 19 - Crystal structure of hydrotalcite-like precursor.

160 Results and discussion
To understand the structure of these compounds, it is necessary to start from the
structure of brucite [Mg(OH)2], where octahedra of Mg2+ (6-fold coordinated to
OH-) share edges to form infinite sheets. These sheets are stacked on top of
each other and are held together by hydrogen bonding (Fig. 3. 20). When Mg2+
ions are substituted by a trivalent ion having a suitable ionic radius (such as Al3+
for hydrotalcite compounds), a positive charge is generated in the hydroxyl sheet.
This net positive charge is compensated by (CO3)2- anions, which lie in the
interlayer region between the two brucite-like sheets, In the free space of this
interlayer the water of crystallization also finds a place.
Fig. 3. 20 - Crystal structure of hydrotalcite-like precursor (2).
The hydrotalcite-derived catalysts (ex-HT), containing carbonates as interlayer
anions, have already been reported as effective catalysts in the production of
synthesis gas, using as active phase Ni, Rh and Ni/Rh. The characterization of
these catalysts has revealed that the structure is made of MgO type and spinel
type phases containing Rh and/or the Ni, which can be extracted to form rather
stable metal particles.
High activity may be due to the highly dispersed Ni metal particles. Mg–Al
hydrotalcite precursor, in which a part of the Mg sites were substituted by Ni,
decomposed to Mg(Al)O mixed oxide still containing Ni2+ at the Mg2+ site. When
the mixed oxide was reduced, Ni2+ was reduced to Ni0, migrated to the surface,
and crystallized to form fine Ni metal particles on Mg(Al)O mixed oxide as the
support (Fig. 3. 21). Takehira99 observed that the crystal growths of both Ni metal
and MgAl2O4 spinel after CPO reaction for 560 h, no decline was observed in the
activity during the reaction under space velocity of 1.156 104 ml h-1 g-cat-1. TEM
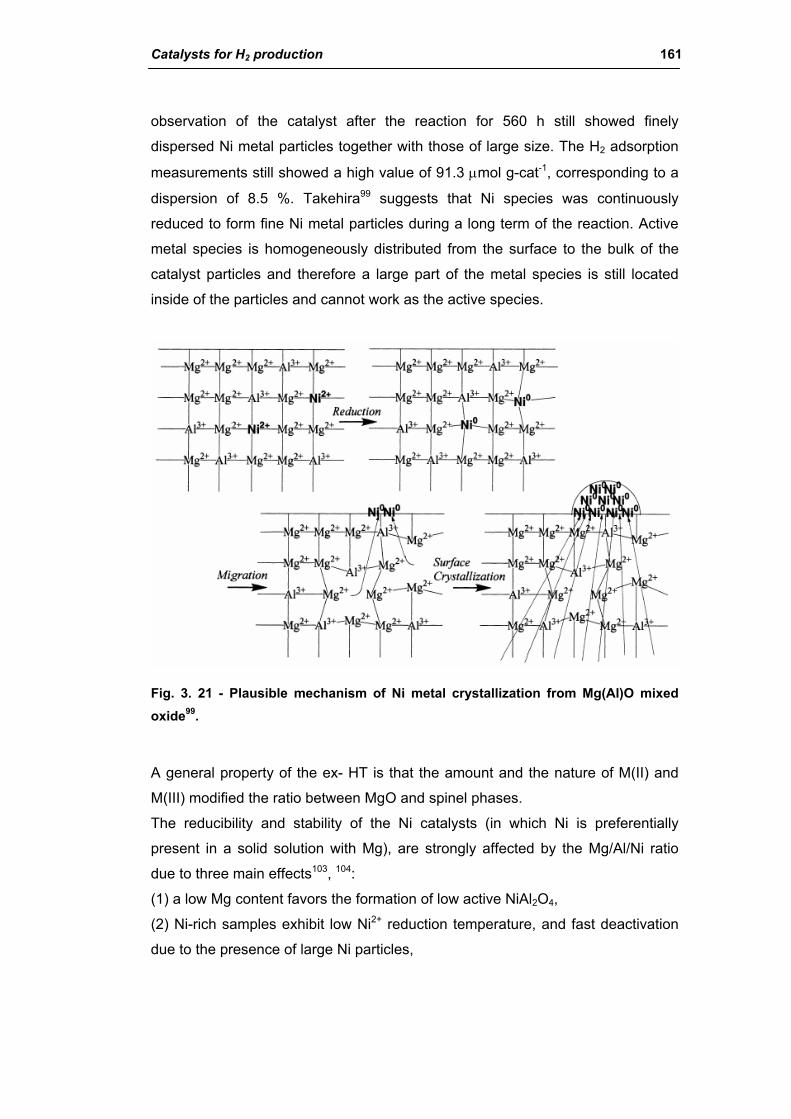
Catalysts for H2 production 161
observation of the catalyst after the reaction for 560 h still showed finely
dispersed Ni metal particles together with those of large size. The H2 adsorption
measurements still showed a high value of 91.3 µmol g-cat-1, corresponding to a
dispersion of 8.5 %. Takehira99 suggests that Ni species was continuously
reduced to form fine Ni metal particles during a long term of the reaction. Active
metal species is homogeneously distributed from the surface to the bulk of the
catalyst particles and therefore a large part of the metal species is still located
inside of the particles and cannot work as the active species.
Fig. 3. 21 - Plausible mechanism of Ni metal crystallization from Mg(Al)O mixed oxide99.
A general property of the ex- HT is that the amount and the nature of M(II) and
M(III) modified the ratio between MgO and spinel phases.
The reducibility and stability of the Ni catalysts (in which Ni is preferentially
present in a solid solution with Mg), are strongly affected by the Mg/Al/Ni ratio
due to three main effects103, 104:
(1) a low Mg content favors the formation of low active NiAl2O4,
(2) Ni-rich samples exhibit low Ni2+ reduction temperature, and fast deactivation
due to the presence of large Ni particles,
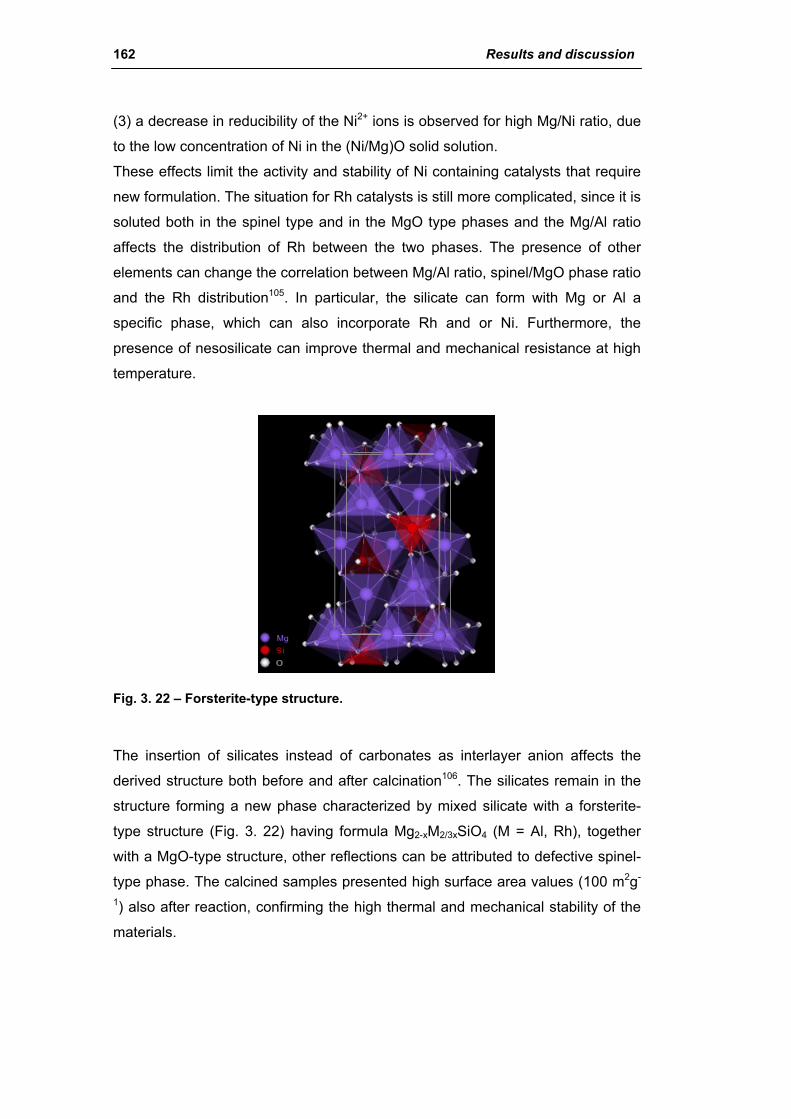
162 Results and discussion
(3) a decrease in reducibility of the Ni2+ ions is observed for high Mg/Ni ratio, due
to the low concentration of Ni in the (Ni/Mg)O solid solution.
These effects limit the activity and stability of Ni containing catalysts that require
new formulation. The situation for Rh catalysts is still more complicated, since it is
soluted both in the spinel type and in the MgO type phases and the Mg/Al ratio
affects the distribution of Rh between the two phases. The presence of other
elements can change the correlation between Mg/Al ratio, spinel/MgO phase ratio
and the Rh distribution105. In particular, the silicate can form with Mg or Al a
specific phase, which can also incorporate Rh and or Ni. Furthermore, the
presence of nesosilicate can improve thermal and mechanical resistance at high
temperature.
Fig. 3. 22 – Forsterite-type structure.
The insertion of silicates instead of carbonates as interlayer anion affects the derived structure both before and after calcination106. The silicates remain in the
structure forming a new phase characterized by mixed silicate with a forsterite-
type structure (Fig. 3. 22) having formula Mg2-xM2/3xSiO4 (M = Al, Rh), together
with a MgO-type structure, other reflections can be attributed to defective spinel-
type phase. The calcined samples presented high surface area values (100 m2g-
1) also after reaction, confirming the high thermal and mechanical stability of the
materials.
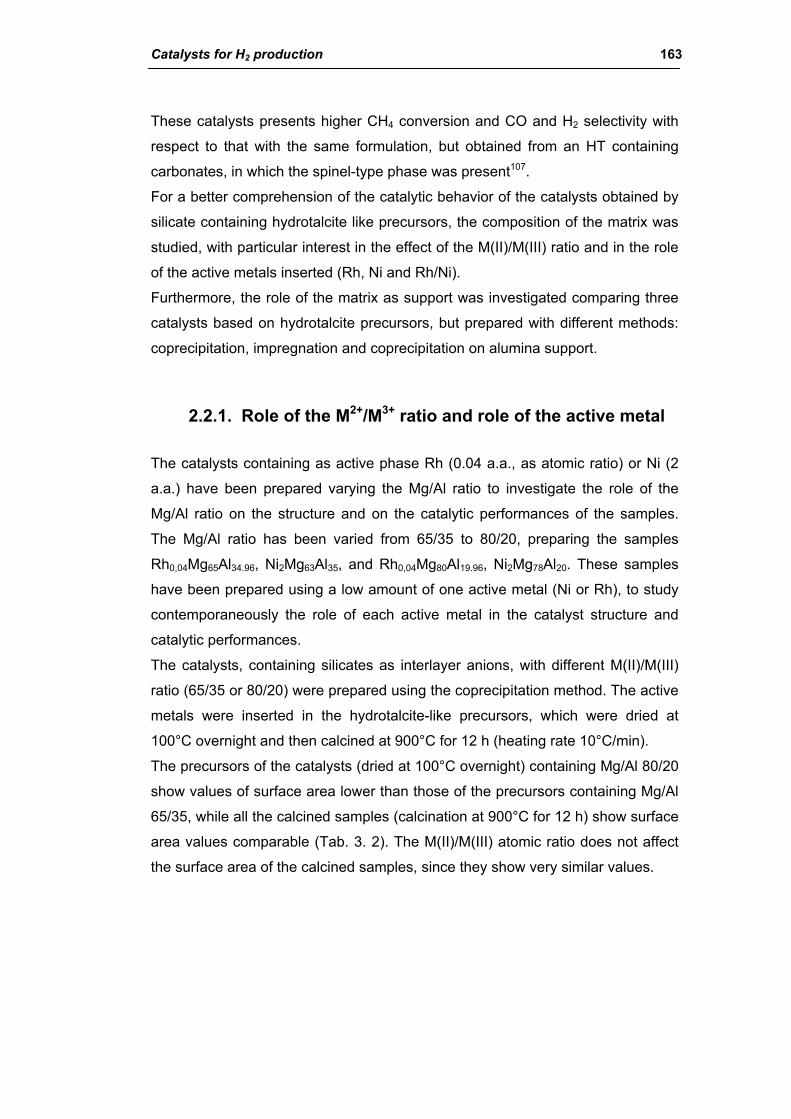
Catalysts for H2 production 163
These catalysts presents higher CH4 conversion and CO and H2 selectivity with
respect to that with the same formulation, but obtained from an HT containing
carbonates, in which the spinel-type phase was present107.
For a better comprehension of the catalytic behavior of the catalysts obtained by
silicate containing hydrotalcite like precursors, the composition of the matrix was
studied, with particular interest in the effect of the M(II)/M(III) ratio and in the role
of the active metals inserted (Rh, Ni and Rh/Ni).
Furthermore, the role of the matrix as support was investigated comparing three
catalysts based on hydrotalcite precursors, but prepared with different methods:
coprecipitation, impregnation and coprecipitation on alumina support.
2.2.1. Role of the M2+/M3+ ratio and role of the active metal
The catalysts containing as active phase Rh (0.04 a.a., as atomic ratio) or Ni (2
a.a.) have been prepared varying the Mg/Al ratio to investigate the role of the
Mg/Al ratio on the structure and on the catalytic performances of the samples.
The Mg/Al ratio has been varied from 65/35 to 80/20, preparing the samples
Rh0,04Mg65Al34.96, Ni2Mg63Al35, and Rh0,04Mg80Al19.96, Ni2Mg78Al20. These samples
have been prepared using a low amount of one active metal (Ni or Rh), to study
contemporaneously the role of each active metal in the catalyst structure and
catalytic performances.
The catalysts, containing silicates as interlayer anions, with different M(II)/M(III)
ratio (65/35 or 80/20) were prepared using the coprecipitation method. The active
metals were inserted in the hydrotalcite-like precursors, which were dried at
100°C overnight and then calcined at 900°C for 12 h (heating rate 10°C/min).
The precursors of the catalysts (dried at 100°C overnight) containing Mg/Al 80/20
show values of surface area lower than those of the precursors containing Mg/Al
65/35, while all the calcined samples (calcination at 900°C for 12 h) show surface
area values comparable (Tab. 3. 2). The M(II)/M(III) atomic ratio does not affect
the surface area of the calcined samples, since they show very similar values.

164 Results and discussion
B.E.T. surface area (m2/g) Composition Atomic ratio M2+/M3+
100°C 900°C
Rh / Mg / Al 0.04 / 65 / 34.96 65/35 262 88
Ni / Mg / Al 2 / 63 / 35 65/35 118 86
Rh / Mg / Al 0.04 / 80 / 19.96 80/20 125 82
Ni / Mg / Al 2 / 78 / 20 80/20 71 86
Tab. 3. 2 – List of the catalysts and their surface area values, after drying at 100°C overnight and after calcination at 900°C for 12 h. .
Inte
nsity
(a.u
.)In
tens
ity (a
.u.)
Fig. 3. 23 - XRD patterns of the HT precursors of the catalysts: (A) Rh0,04Mg65Al34.96, (B) Ni2Mg63Al35, (C) Rh0,04Mg80Al19.96 and (D) Ni2Mg78Al20.
The XRD analysis of the precursors (HT) of the catalysts (ex-HT) containing
Mg/Al 65/35 (Fig. 3. 23, A and B) are very similar each other, so as the patterns
of the precursors of the catalysts containing Mg/Al 80/20 (Fig. 3. 23, C and D).
The precursors show the typical reflections of the hydrotalcite like-compounds
containing silicates instead of carbonates anions: their broadness is due to the
insertion of the silicates anions between the hydroxyl sheets. The higher amount
of Mg in the samples with M(II)/M(III) = 80/20 leads to a slightly crystalline
structure of the precursors.
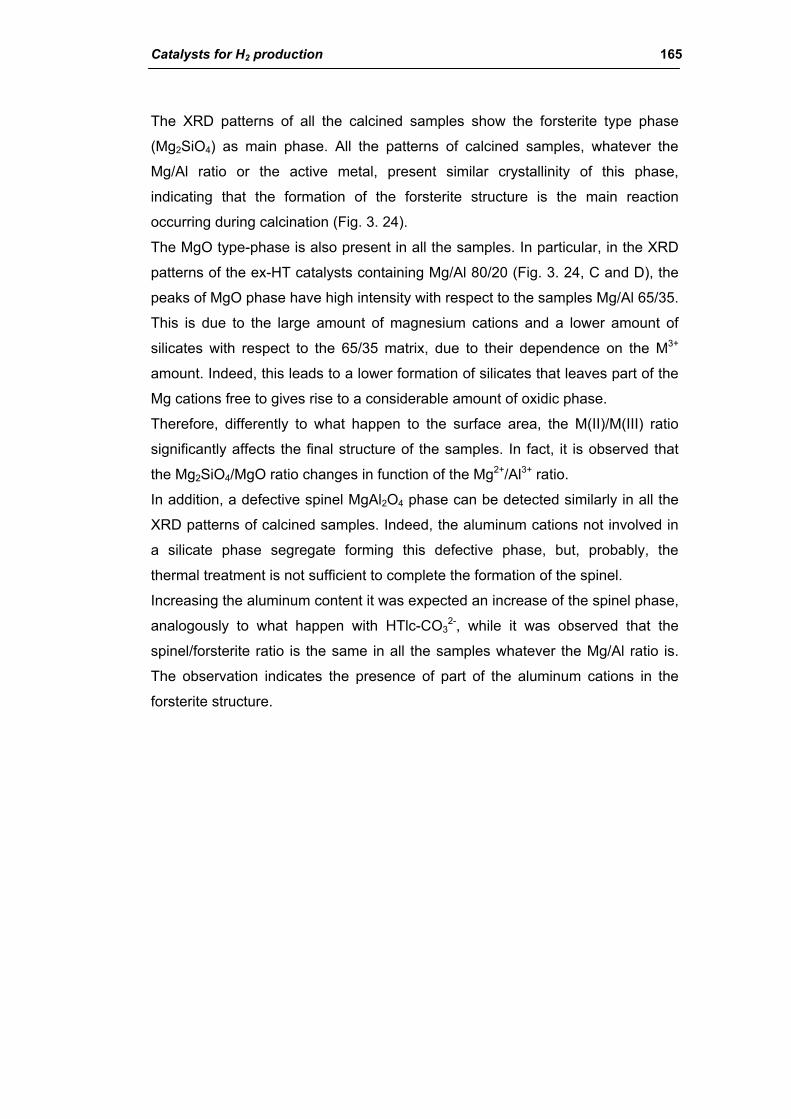
Catalysts for H2 production 165
The XRD patterns of all the calcined samples show the forsterite type phase
(Mg2SiO4) as main phase. All the patterns of calcined samples, whatever the
Mg/Al ratio or the active metal, present similar crystallinity of this phase,
indicating that the formation of the forsterite structure is the main reaction
occurring during calcination (Fig. 3. 24).
The MgO type-phase is also present in all the samples. In particular, in the XRD
patterns of the ex-HT catalysts containing Mg/Al 80/20 (Fig. 3. 24, C and D), the
peaks of MgO phase have high intensity with respect to the samples Mg/Al 65/35.
This is due to the large amount of magnesium cations and a lower amount of
silicates with respect to the 65/35 matrix, due to their dependence on the M3+
amount. Indeed, this leads to a lower formation of silicates that leaves part of the
Mg cations free to gives rise to a considerable amount of oxidic phase.
Therefore, differently to what happen to the surface area, the M(II)/M(III) ratio
significantly affects the final structure of the samples. In fact, it is observed that
the Mg2SiO4/MgO ratio changes in function of the Mg2+/Al3+ ratio.
In addition, a defective spinel MgAl2O4 phase can be detected similarly in all the
XRD patterns of calcined samples. Indeed, the aluminum cations not involved in
a silicate phase segregate forming this defective phase, but, probably, the
thermal treatment is not sufficient to complete the formation of the spinel.
Increasing the aluminum content it was expected an increase of the spinel phase,
analogously to what happen with HTlc-CO32-, while it was observed that the
spinel/forsterite ratio is the same in all the samples whatever the Mg/Al ratio is.
The observation indicates the presence of part of the aluminum cations in the
forsterite structure.
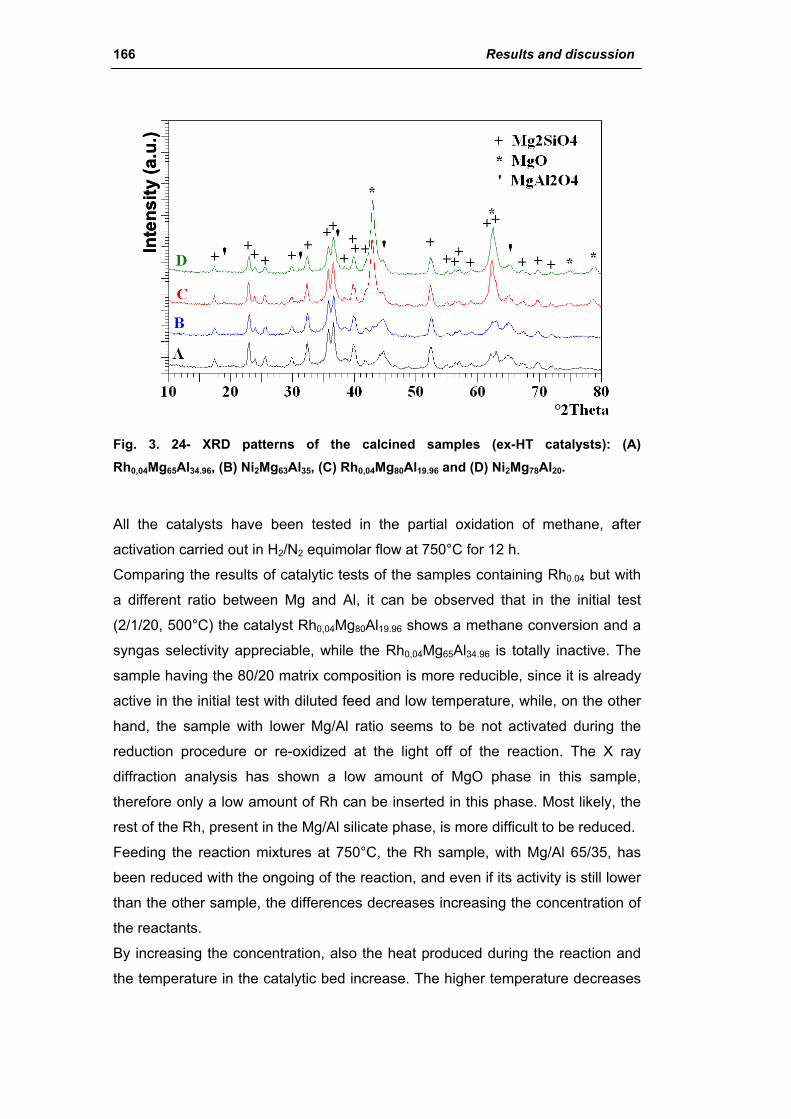
166 Results and discussion
Inte
nsity
(a.u
.)In
tens
ity (a
.u.)
Fig. 3. 24- XRD patterns of the calcined samples (ex-HT catalysts): (A) Rh0,04Mg65Al34.96, (B) Ni2Mg63Al35, (C) Rh0,04Mg80Al19.96 and (D) Ni2Mg78Al20.
All the catalysts have been tested in the partial oxidation of methane, after
activation carried out in H2/N2 equimolar flow at 750°C for 12 h.
Comparing the results of catalytic tests of the samples containing Rh0.04 but with
a different ratio between Mg and Al, it can be observed that in the initial test
(2/1/20, 500°C) the catalyst Rh0,04Mg80Al19.96 shows a methane conversion and a
syngas selectivity appreciable, while the Rh0,04Mg65Al34.96 is totally inactive. The
sample having the 80/20 matrix composition is more reducible, since it is already
active in the initial test with diluted feed and low temperature, while, on the other
hand, the sample with lower Mg/Al ratio seems to be not activated during the
reduction procedure or re-oxidized at the light off of the reaction. The X ray
diffraction analysis has shown a low amount of MgO phase in this sample,
therefore only a low amount of Rh can be inserted in this phase. Most likely, the
rest of the Rh, present in the Mg/Al silicate phase, is more difficult to be reduced.
Feeding the reaction mixtures at 750°C, the Rh sample, with Mg/Al 65/35, has
been reduced with the ongoing of the reaction, and even if its activity is still lower
than the other sample, the differences decreases increasing the concentration of
the reactants.
By increasing the concentration, also the heat produced during the reaction and
the temperature in the catalytic bed increase. The higher temperature decreases

Catalysts for H2 production 167
the differences between the catalyst performances which are pushed towards the
equilibrium.
In the final test at 500°C and diluted mixture the sample with M(II)/M(III) 80/20
presents the same activity than in the initial test, while the other catalyst
(Rh0,04Mg65Al34.96) is activated and maintains good yields in syn gas.
0
20
40
60
80
100
500°C 750°C 750°C 750°C 750°C 500°C
2/1/20 2/1/20 2/1/4 2/1/1 4/2/2 2/1/20-RET
Conv
CH
4 (%
)
Rh 0,04 / Mg 80 / Al 19,96Rh 0,04 / Mg 65 / Al 34,96
0
20
40
60
80
100
500°C 750°C 750°C 750°C 750°C 500°C
2/1/20 2/1/20 2/1/4 2/1/1 4/2/2 2/1/20-RET
Sel
. CO
(%)
Rh 0,04 / Mg 80 / Al 19,96Rh 0,04 / Mg 65 / Al 34,96
0
20
40
60
80
100
500°C 750°C 750°C 750°C 750°C 500°C
2/1/20 2/1/20 2/1/4 2/1/1 4/2/2 2/1/20-RET
Sel.
H2 (%
)
Rh 0,04 / Mg 80 / Al 19,96Rh 0,04 / Mg 65 / Al 34,96
Fig. 3. 25 - Comparison among CH4 conversion and syngas selectivity of the catalysts Rh0,04Mg80Al19.96 and Rh0,04Mg65Al34.96.
The comparison between the activity results obtained using the catalysts
containing Ni2 but different ratio Mg/Al (80/20 and 65/35) are shown in Fig. 3. 26.
In this case, both the catalysts present about the same activity and show quite
the same performances. This means that the two catalysts are well reduced and
keep the reduced state also at low temperature. The sample Ni2Mg78Al20
presents, in all reaction conditions, slightly higher yields in syn gas than those of
the sample Ni2Mg63Al35, even if by concentrating the feeds the differences are
smoothed.
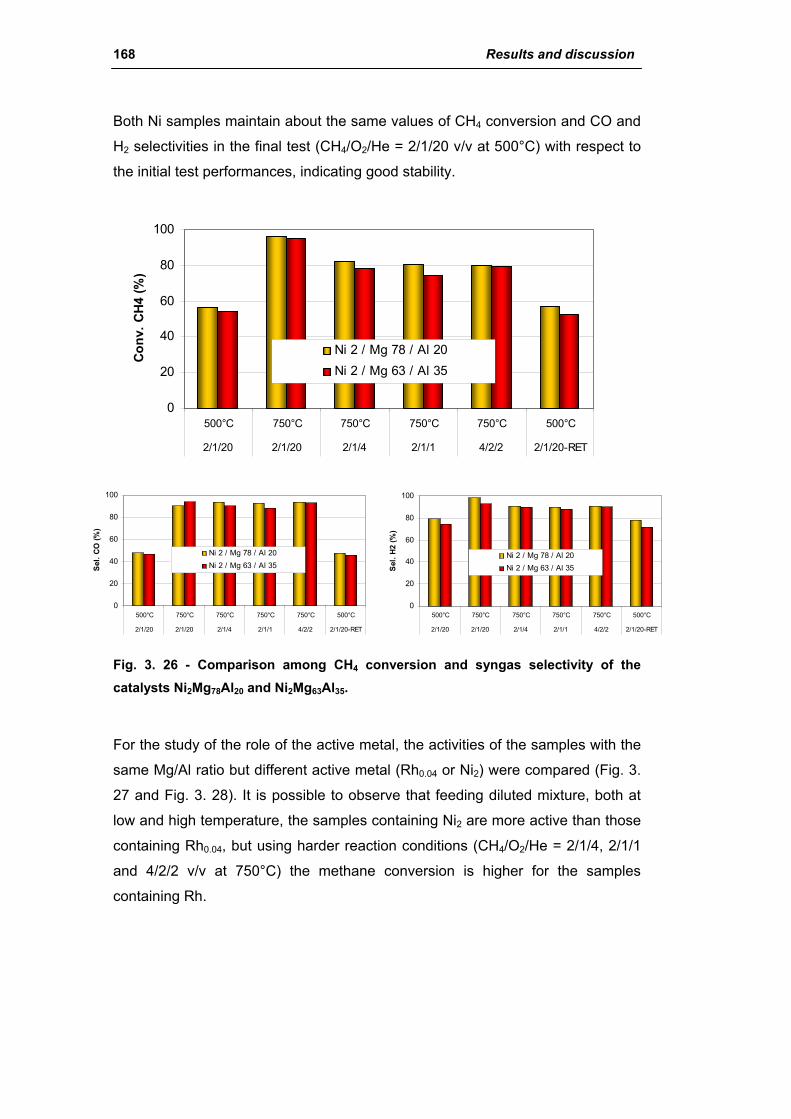
168 Results and discussion
Both Ni samples maintain about the same values of CH4 conversion and CO and
H2 selectivities in the final test (CH4/O2/He = 2/1/20 v/v at 500°C) with respect to
the initial test performances, indicating good stability.
0
20
40
60
80
100
500°C 750°C 750°C 750°C 750°C 500°C
2/1/20 2/1/20 2/1/4 2/1/1 4/2/2 2/1/20-RET
Conv
. CH
4 (%
)
Ni 2 / Mg 78 / Al 20Ni 2 / Mg 63 / Al 35
0
20
40
60
80
100
500°C 750°C 750°C 750°C 750°C 500°C
2/1/20 2/1/20 2/1/4 2/1/1 4/2/2 2/1/20-RET
Sel.
CO
(%)
Ni 2 / Mg 78 / Al 20Ni 2 / Mg 63 / Al 35
0
20
40
60
80
100
500°C 750°C 750°C 750°C 750°C 500°C
2/1/20 2/1/20 2/1/4 2/1/1 4/2/2 2/1/20-RET
Sel
. H2
(%)
Ni 2 / Mg 78 / Al 20Ni 2 / Mg 63 / Al 35
Fig. 3. 26 - Comparison among CH4 conversion and syngas selectivity of the catalysts Ni2Mg78Al20 and Ni2Mg63Al35.
For the study of the role of the active metal, the activities of the samples with the
same Mg/Al ratio but different active metal (Rh0.04 or Ni2) were compared (Fig. 3.
27 and Fig. 3. 28). It is possible to observe that feeding diluted mixture, both at
low and high temperature, the samples containing Ni2 are more active than those
containing Rh0.04, but using harder reaction conditions (CH4/O2/He = 2/1/4, 2/1/1
and 4/2/2 v/v at 750°C) the methane conversion is higher for the samples
containing Rh.
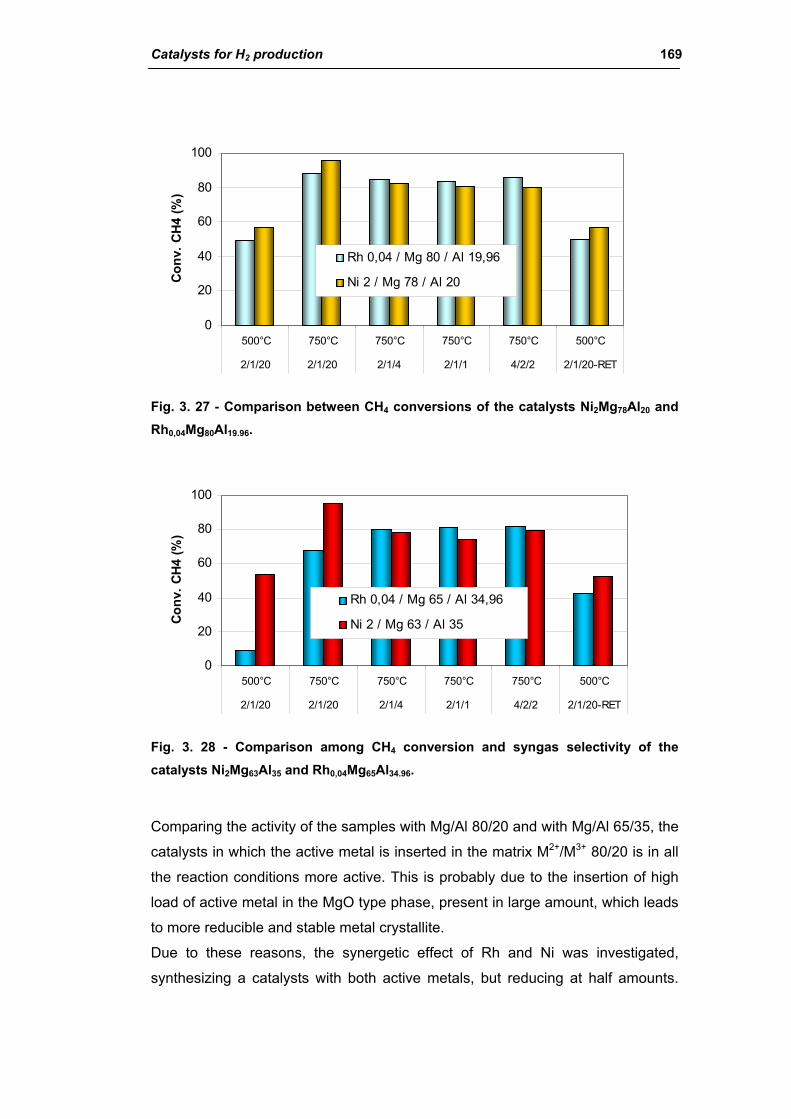
Catalysts for H2 production 169
0
20
40
60
80
100
500°C 750°C 750°C 750°C 750°C 500°C
2/1/20 2/1/20 2/1/4 2/1/1 4/2/2 2/1/20-RET
Con
v. C
H4 (%
)
Rh 0,04 / Mg 80 / Al 19,96
Ni 2 / Mg 78 / Al 20
Fig. 3. 27 - Comparison between CH4 conversions of the catalysts Ni2Mg78Al20 and Rh0,04Mg80Al19.96.
0
20
40
60
80
100
500°C 750°C 750°C 750°C 750°C 500°C
2/1/20 2/1/20 2/1/4 2/1/1 4/2/2 2/1/20-RET
Conv
. CH4
(%)
Rh 0,04 / Mg 65 / Al 34,96
Ni 2 / Mg 63 / Al 35
Fig. 3. 28 - Comparison among CH4 conversion and syngas selectivity of the catalysts Ni2Mg63Al35 and Rh0,04Mg65Al34.96.
Comparing the activity of the samples with Mg/Al 80/20 and with Mg/Al 65/35, the
catalysts in which the active metal is inserted in the matrix M2+/M3+ 80/20 is in all
the reaction conditions more active. This is probably due to the insertion of high
load of active metal in the MgO type phase, present in large amount, which leads
to more reducible and stable metal crystallite.
Due to these reasons, the synergetic effect of Rh and Ni was investigated,
synthesizing a catalysts with both active metals, but reducing at half amounts.
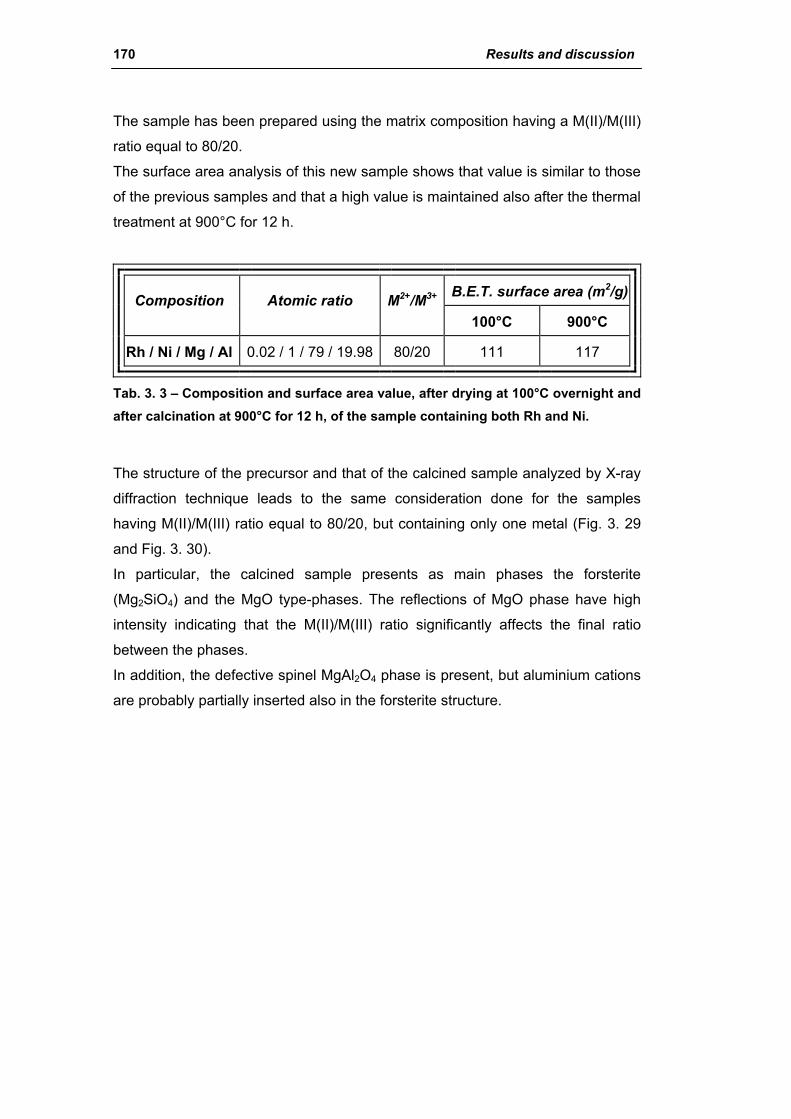
170 Results and discussion
The sample has been prepared using the matrix composition having a M(II)/M(III)
ratio equal to 80/20.
The surface area analysis of this new sample shows that value is similar to those
of the previous samples and that a high value is maintained also after the thermal
treatment at 900°C for 12 h.
B.E.T. surface area (m2/g) Composition Atomic ratio M2+/M3+
100°C 900°C
Rh / Ni / Mg / Al 0.02 / 1 / 79 / 19.98 80/20 111 117
Tab. 3. 3 – Composition and surface area value, after drying at 100°C overnight and after calcination at 900°C for 12 h, of the sample containing both Rh and Ni.
The structure of the precursor and that of the calcined sample analyzed by X-ray
diffraction technique leads to the same consideration done for the samples
having M(II)/M(III) ratio equal to 80/20, but containing only one metal (Fig. 3. 29
and Fig. 3. 30).
In particular, the calcined sample presents as main phases the forsterite
(Mg2SiO4) and the MgO type-phases. The reflections of MgO phase have high
intensity indicating that the M(II)/M(III) ratio significantly affects the final ratio
between the phases.
In addition, the defective spinel MgAl2O4 phase is present, but aluminium cations
are probably partially inserted also in the forsterite structure.
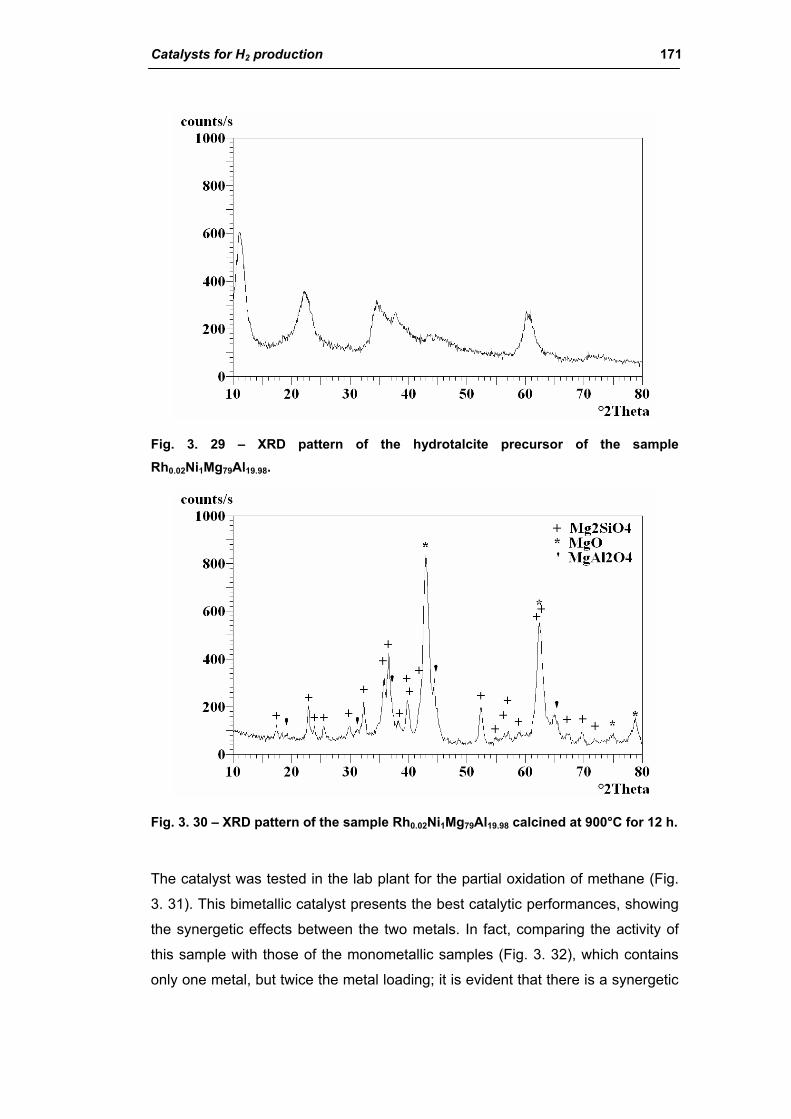
Catalysts for H2 production 171
Fig. 3. 29 – XRD pattern of the hydrotalcite precursor of the sample Rh0.02Ni1Mg79Al19.98.
Fig. 3. 30 – XRD pattern of the sample Rh0.02Ni1Mg79Al19.98 calcined at 900°C for 12 h.
The catalyst was tested in the lab plant for the partial oxidation of methane (Fig.
3. 31). This bimetallic catalyst presents the best catalytic performances, showing
the synergetic effects between the two metals. In fact, comparing the activity of
this sample with those of the monometallic samples (Fig. 3. 32), which contains
only one metal, but twice the metal loading; it is evident that there is a synergetic
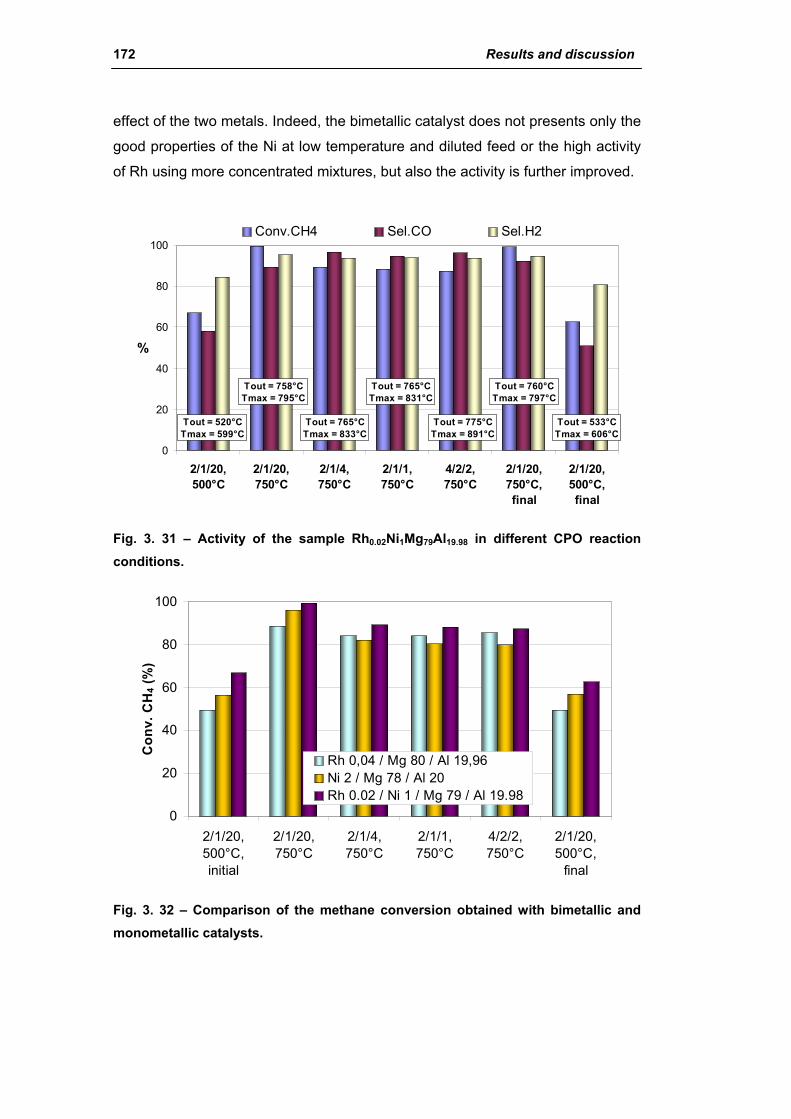
172 Results and discussion
effect of the two metals. Indeed, the bimetallic catalyst does not presents only the
good properties of the Ni at low temperature and diluted feed or the high activity
of Rh using more concentrated mixtures, but also the activity is further improved.
0
20
40
60
80
100
2/1/20,500°C
2/1/20,750°C
2/1/4,750°C
2/1/1,750°C
4/2/2,750°C
2/1/20,750°C,final
2/1/20,500°C,final
%
Conv.CH4 Sel.CO Sel.H2
Tout = 520°CTmax = 599°C
Tout = 758°CTmax = 795°C
Tout = 765°CTmax = 833°C
Tout = 765°CTmax = 831°C
Tout = 760°CTmax = 797°C
Tout = 775°CTmax = 891°C
Tout = 533°CTmax = 606°C
Fig. 3. 31 – Activity of the sample Rh0.02Ni1Mg79Al19.98 in different CPO reaction conditions.
0
20
40
60
80
100
2/1/20,500°C,initial
2/1/20,750°C
2/1/4,750°C
2/1/1,750°C
4/2/2,750°C
2/1/20,500°C,
final
Con
v. C
H4 (
%)
Rh 0,04 / Mg 80 / Al 19,96Ni 2 / Mg 78 / Al 20Rh 0.02 / Ni 1 / Mg 79 / Al 19.98
Fig. 3. 32 – Comparison of the methane conversion obtained with bimetallic and monometallic catalysts.
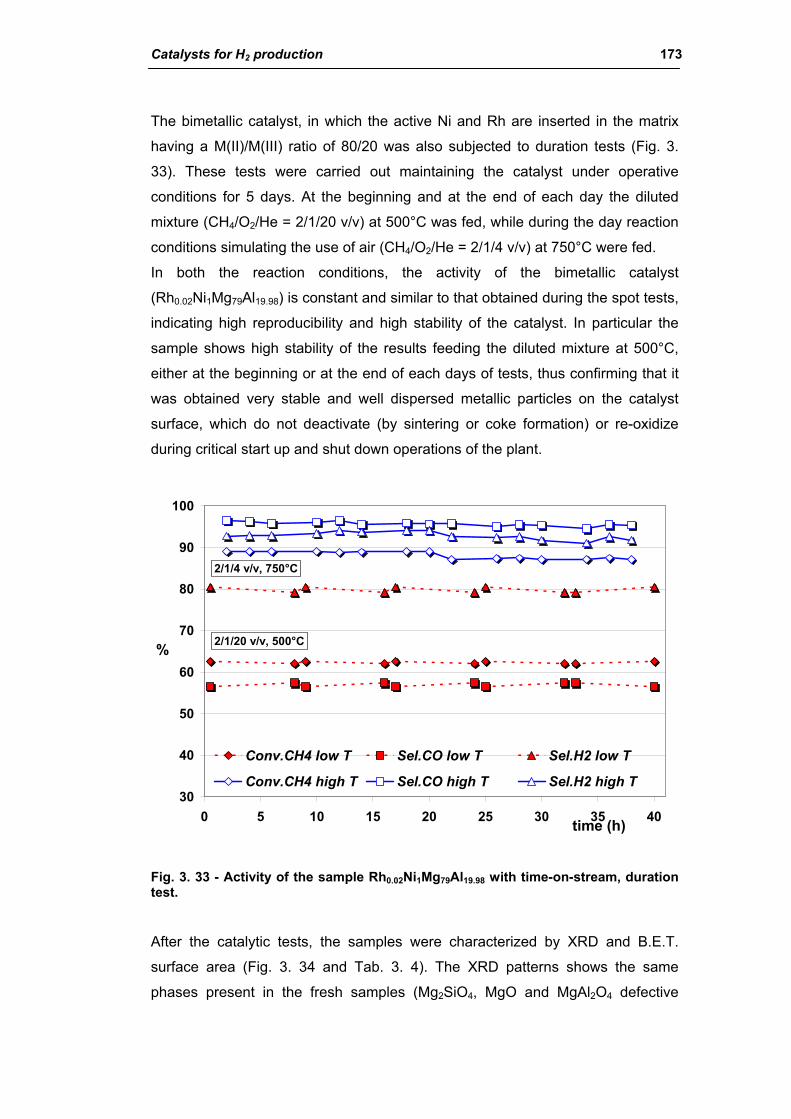
Catalysts for H2 production 173
The bimetallic catalyst, in which the active Ni and Rh are inserted in the matrix
having a M(II)/M(III) ratio of 80/20 was also subjected to duration tests (Fig. 3.
33). These tests were carried out maintaining the catalyst under operative
conditions for 5 days. At the beginning and at the end of each day the diluted
mixture (CH4/O2/He = 2/1/20 v/v) at 500°C was fed, while during the day reaction
conditions simulating the use of air (CH4/O2/He = 2/1/4 v/v) at 750°C were fed.
In both the reaction conditions, the activity of the bimetallic catalyst
(Rh0.02Ni1Mg79Al19.98) is constant and similar to that obtained during the spot tests,
indicating high reproducibility and high stability of the catalyst. In particular the
sample shows high stability of the results feeding the diluted mixture at 500°C,
either at the beginning or at the end of each days of tests, thus confirming that it
was obtained very stable and well dispersed metallic particles on the catalyst
surface, which do not deactivate (by sintering or coke formation) or re-oxidize
during critical start up and shut down operations of the plant.
30
40
50
60
70
80
90
100
0 5 10 15 20 25 30 35 40time (h)
%
Conv.CH4 low T Sel.CO low T Sel.H2 low T
Conv.CH4 high T Sel.CO high T Sel.H2 high T
2/1/20 v/v, 500°C
2/1/4 v/v, 750°C
Fig. 3. 33 - Activity of the sample Rh0.02Ni1Mg79Al19.98 with time-on-stream, duration test.
After the catalytic tests, the samples were characterized by XRD and B.E.T.
surface area (Fig. 3. 34 and Tab. 3. 4). The XRD patterns shows the same
phases present in the fresh samples (Mg2SiO4, MgO and MgAl2O4 defective
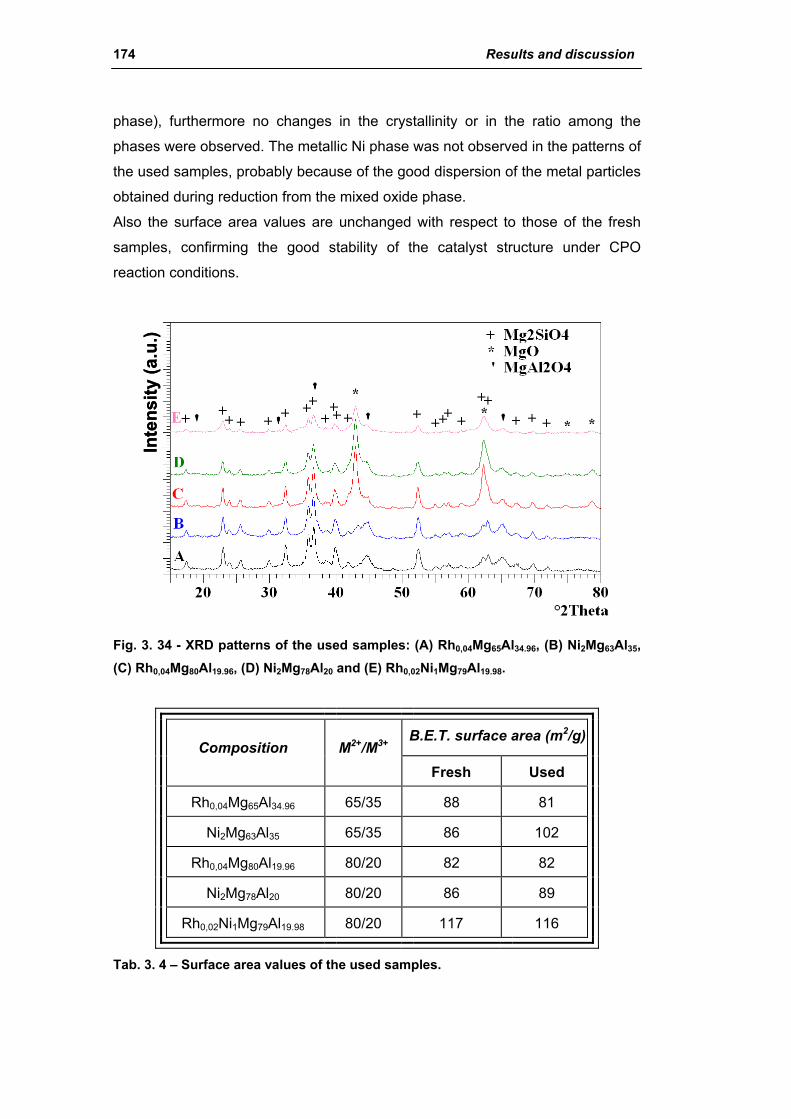
174 Results and discussion
phase), furthermore no changes in the crystallinity or in the ratio among the
phases were observed. The metallic Ni phase was not observed in the patterns of
the used samples, probably because of the good dispersion of the metal particles
obtained during reduction from the mixed oxide phase.
Also the surface area values are unchanged with respect to those of the fresh
samples, confirming the good stability of the catalyst structure under CPO
reaction conditions.
Inte
nsity
(a.u
.)In
tens
ity (a
.u.)
Fig. 3. 34 - XRD patterns of the used samples: (A) Rh0,04Mg65Al34.96, (B) Ni2Mg63Al35, (C) Rh0,04Mg80Al19.96, (D) Ni2Mg78Al20 and (E) Rh0,02Ni1Mg79Al19.98.
B.E.T. surface area (m2/g) Composition M2+/M3+
Fresh Used
Rh0,04Mg65Al34.96 65/35 88 81
Ni2Mg63Al35 65/35 86 102
Rh0,04Mg80Al19.96 80/20 82 82
Ni2Mg78Al20 80/20 86 89
Rh0,02Ni1Mg79Al19.98 80/20 117 116
Tab. 3. 4 – Surface area values of the used samples.
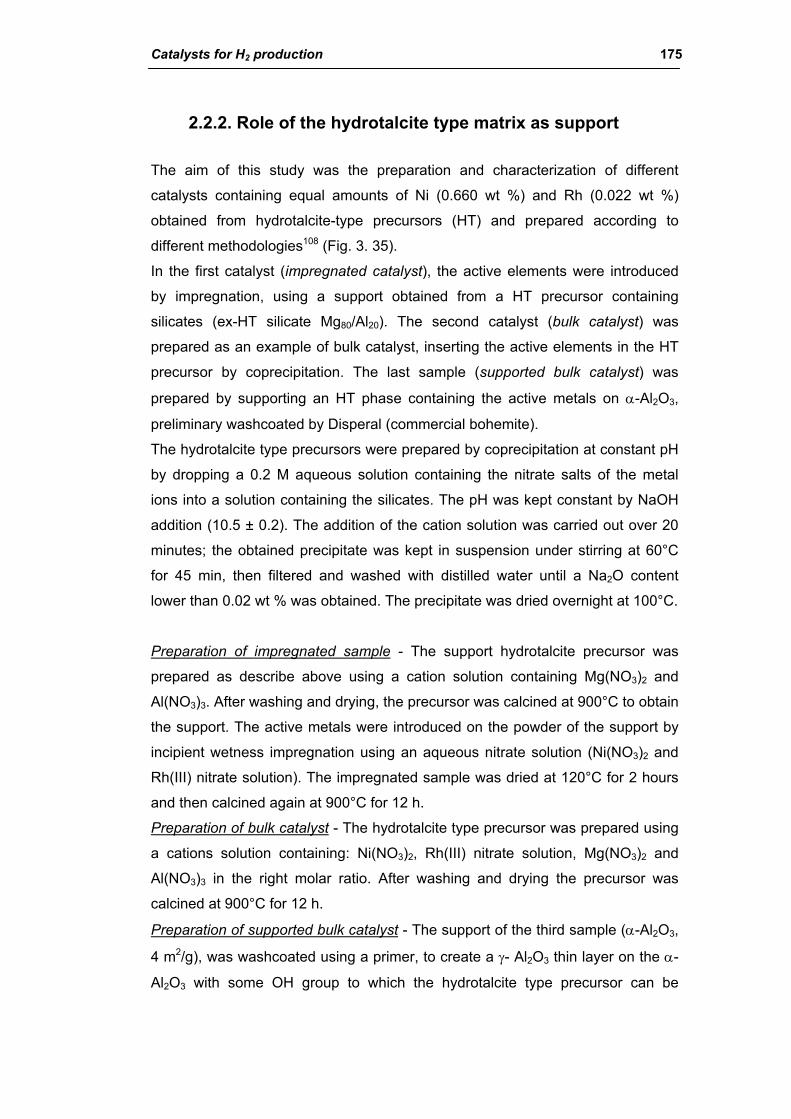
Catalysts for H2 production 175
2.2.2. Role of the hydrotalcite type matrix as support
The aim of this study was the preparation and characterization of different
catalysts containing equal amounts of Ni (0.660 wt %) and Rh (0.022 wt %)
obtained from hydrotalcite-type precursors (HT) and prepared according to
different methodologies108 (Fig. 3. 35).
In the first catalyst (impregnated catalyst), the active elements were introduced
by impregnation, using a support obtained from a HT precursor containing
silicates (ex-HT silicate Mg80/Al20). The second catalyst (bulk catalyst) was
prepared as an example of bulk catalyst, inserting the active elements in the HT
precursor by coprecipitation. The last sample (supported bulk catalyst) was
prepared by supporting an HT phase containing the active metals on α-Al2O3,
preliminary washcoated by Disperal (commercial bohemite).
The hydrotalcite type precursors were prepared by coprecipitation at constant pH
by dropping a 0.2 M aqueous solution containing the nitrate salts of the metal
ions into a solution containing the silicates. The pH was kept constant by NaOH
addition (10.5 ± 0.2). The addition of the cation solution was carried out over 20
minutes; the obtained precipitate was kept in suspension under stirring at 60°C
for 45 min, then filtered and washed with distilled water until a Na2O content
lower than 0.02 wt % was obtained. The precipitate was dried overnight at 100°C.
Preparation of impregnated sample - The support hydrotalcite precursor was
prepared as describe above using a cation solution containing Mg(NO3)2 and
Al(NO3)3. After washing and drying, the precursor was calcined at 900°C to obtain
the support. The active metals were introduced on the powder of the support by
incipient wetness impregnation using an aqueous nitrate solution (Ni(NO3)2 and
Rh(III) nitrate solution). The impregnated sample was dried at 120°C for 2 hours
and then calcined again at 900°C for 12 h.
Preparation of bulk catalyst - The hydrotalcite type precursor was prepared using
a cations solution containing: Ni(NO3)2, Rh(III) nitrate solution, Mg(NO3)2 and
Al(NO3)3 in the right molar ratio. After washing and drying the precursor was
calcined at 900°C for 12 h.
Preparation of supported bulk catalyst - The support of the third sample (α-Al2O3,
4 m2/g), was washcoated using a primer, to create a γ- Al2O3 thin layer on the α-
Al2O3 with some OH group to which the hydrotalcite type precursor can be

176 Results and discussion
grafted. The bohemite primer was prepared by dispersing the commercial
bohemite in HNO3 aqueous solution. After mixing for 10 min, a stable dispersion
of bohemite was obtained. The support, α-Al2O3, in the right molar ratio, was
added very slowly to the bohemite dispersion and then kept under stirring for at
least 30 min at room temperature. The slurry was dried at room temperature
overnight. Then the obtained α-Al2O3/Disperal was added to the aqueous solution
of the silicates and kept under stirring at 50-60°C, forming a homogeneous
dispersion. The 0.2 M aqueous solution of the nitrates of the metals was
prepared and dropped into the silicates/α-Al2O3/Disperal dispersion, maintaining
the pH constant (10.5 ± 0.2). At the end of the dropping, the solution was left
under stirring for 45 minutes and then filtered. After washing the catalyst was
dried at 100°C overnight and then calcined at 900°C for 12 h.
Ex-HT silicate Mg80/Al20
Coprecipitation
Calcination at900°C
Support
Incipient wetnessimpregnation
Ex-HT silicate Mg80/Al20
Rh Ni Rh Ni
Catalyst
An-:silicatespH = 10
T = 40-60°C
NaOHMg2+, Al3+,Ni2+, Rh3+
Calcination at900°C
Coprecipitation Hydrotalcite typeprecursor
(M/Mg/Al)2SiO4
Ex-HT sil Rh/Ni/Mg/Al
α-Al2O3
bohemiteα-Al2O3 + bohemite
Support preparation usingthe washcoating
+ Silicates
NaOH Mg2+, Al3+,Ni2+, Rh3+
Coprecipitation
pH = 10 T = 40-60°Cα-Al2O3
bohemite
Calcination at900°C
HT precursor/bohemite / α-Al2O3
Fig. 3. 35 - Schematic preparation methods of the three investigated catalysts.
The impregnated and the bulk catalysts present high surface area values, typical
of the HT samples (Tab. 3. 5). The supported bulk sample, in which the HT active
phase is supported on α-Al2O3 shows a surface area only slightly higher than that
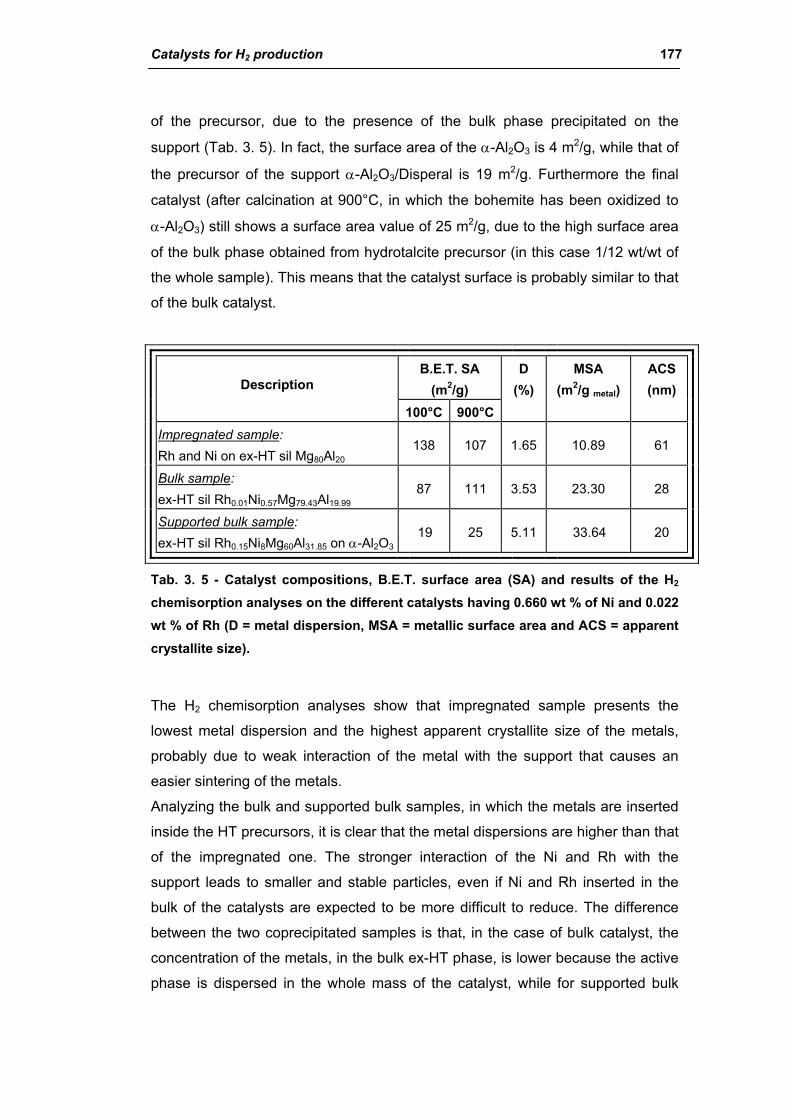
Catalysts for H2 production 177
of the precursor, due to the presence of the bulk phase precipitated on the
support (Tab. 3. 5). In fact, the surface area of the α-Al2O3 is 4 m2/g, while that of
the precursor of the support α-Al2O3/Disperal is 19 m2/g. Furthermore the final
catalyst (after calcination at 900°C, in which the bohemite has been oxidized to
α-Al2O3) still shows a surface area value of 25 m2/g, due to the high surface area
of the bulk phase obtained from hydrotalcite precursor (in this case 1/12 wt/wt of
the whole sample). This means that the catalyst surface is probably similar to that
of the bulk catalyst.
B.E.T. SA (m2/g) Description
100°C 900°C
D (%)
MSA (m2/g metal)
ACS (nm)
Impregnated sample: Rh and Ni on ex-HT sil Mg80Al20
138 107 1.65 10.89 61
Bulk sample: ex-HT sil Rh0.01Ni0.57Mg79.43Al19.99
87 111 3.53 23.30 28
Supported bulk sample: ex-HT sil Rh0.15Ni8Mg60Al31.85 on α-Al2O3
19 25 5.11 33.64 20
Tab. 3. 5 - Catalyst compositions, B.E.T. surface area (SA) and results of the H2 chemisorption analyses on the different catalysts having 0.660 wt % of Ni and 0.022 wt % of Rh (D = metal dispersion, MSA = metallic surface area and ACS = apparent crystallite size).
The H2 chemisorption analyses show that impregnated sample presents the
lowest metal dispersion and the highest apparent crystallite size of the metals,
probably due to weak interaction of the metal with the support that causes an
easier sintering of the metals.
Analyzing the bulk and supported bulk samples, in which the metals are inserted
inside the HT precursors, it is clear that the metal dispersions are higher than that
of the impregnated one. The stronger interaction of the Ni and Rh with the
support leads to smaller and stable particles, even if Ni and Rh inserted in the
bulk of the catalysts are expected to be more difficult to reduce. The difference
between the two coprecipitated samples is that, in the case of bulk catalyst, the
concentration of the metals, in the bulk ex-HT phase, is lower because the active
phase is dispersed in the whole mass of the catalyst, while for supported bulk
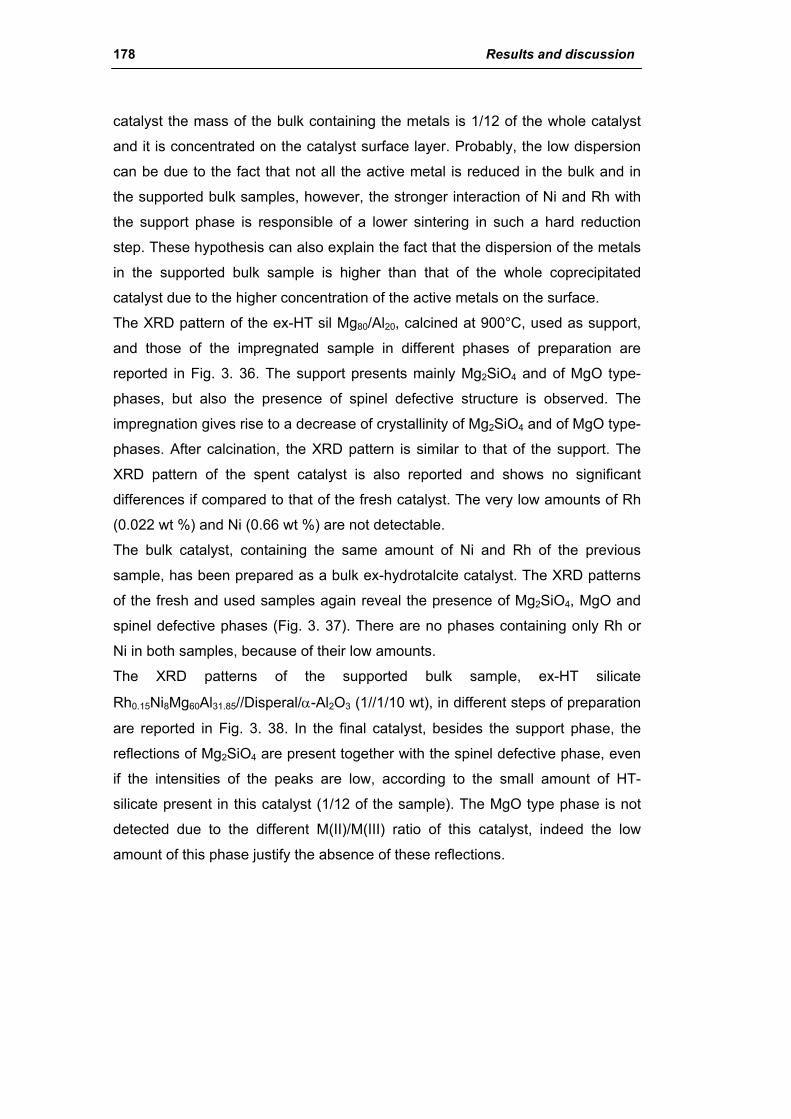
178 Results and discussion
catalyst the mass of the bulk containing the metals is 1/12 of the whole catalyst
and it is concentrated on the catalyst surface layer. Probably, the low dispersion
can be due to the fact that not all the active metal is reduced in the bulk and in
the supported bulk samples, however, the stronger interaction of Ni and Rh with
the support phase is responsible of a lower sintering in such a hard reduction
step. These hypothesis can also explain the fact that the dispersion of the metals
in the supported bulk sample is higher than that of the whole coprecipitated
catalyst due to the higher concentration of the active metals on the surface.
The XRD pattern of the ex-HT sil Mg80/Al20, calcined at 900°C, used as support,
and those of the impregnated sample in different phases of preparation are
reported in Fig. 3. 36. The support presents mainly Mg2SiO4 and of MgO type-
phases, but also the presence of spinel defective structure is observed. The
impregnation gives rise to a decrease of crystallinity of Mg2SiO4 and of MgO type-
phases. After calcination, the XRD pattern is similar to that of the support. The
XRD pattern of the spent catalyst is also reported and shows no significant
differences if compared to that of the fresh catalyst. The very low amounts of Rh
(0.022 wt %) and Ni (0.66 wt %) are not detectable.
The bulk catalyst, containing the same amount of Ni and Rh of the previous
sample, has been prepared as a bulk ex-hydrotalcite catalyst. The XRD patterns
of the fresh and used samples again reveal the presence of Mg2SiO4, MgO and
spinel defective phases (Fig. 3. 37). There are no phases containing only Rh or
Ni in both samples, because of their low amounts.
The XRD patterns of the supported bulk sample, ex-HT silicate
Rh0.15Ni8Mg60Al31.85//Disperal/α-Al2O3 (1//1/10 wt), in different steps of preparation
are reported in Fig. 3. 38. In the final catalyst, besides the support phase, the
reflections of Mg2SiO4 are present together with the spinel defective phase, even
if the intensities of the peaks are low, according to the small amount of HT-
silicate present in this catalyst (1/12 of the sample). The MgO type phase is not
detected due to the different M(II)/M(III) ratio of this catalyst, indeed the low
amount of this phase justify the absence of these reflections.

Catalysts for H2 production 179
Inte
nsity
(a.u
.)In
tens
ity (a
.u.)
Fig. 3. 36 - XRD patterns of impregnated catalyst in different steps of preparation and after reaction: (a) Ex-HT Mg80Al20, support calcined at 900°C, (b) Ex-HT Mg80Al20 impregnated with Rh and Ni, not calcined, (c) Ex-HT Mg80Al20 impregnated with Rh and Ni, calcined at 900°C, (d) Ex-HT Mg80Al20 impregnated with Rh and Ni, calcined at 900°C, used sample.
Inte
nsity
(a.u
.)In
tens
ity (a
.u.)
Fig. 3. 37 - XRD patterns of bulk catalyst, Ex-HT silicate Rh0.01Ni0.57Mg79.43Al19.99 (a) before and (b) after reaction.
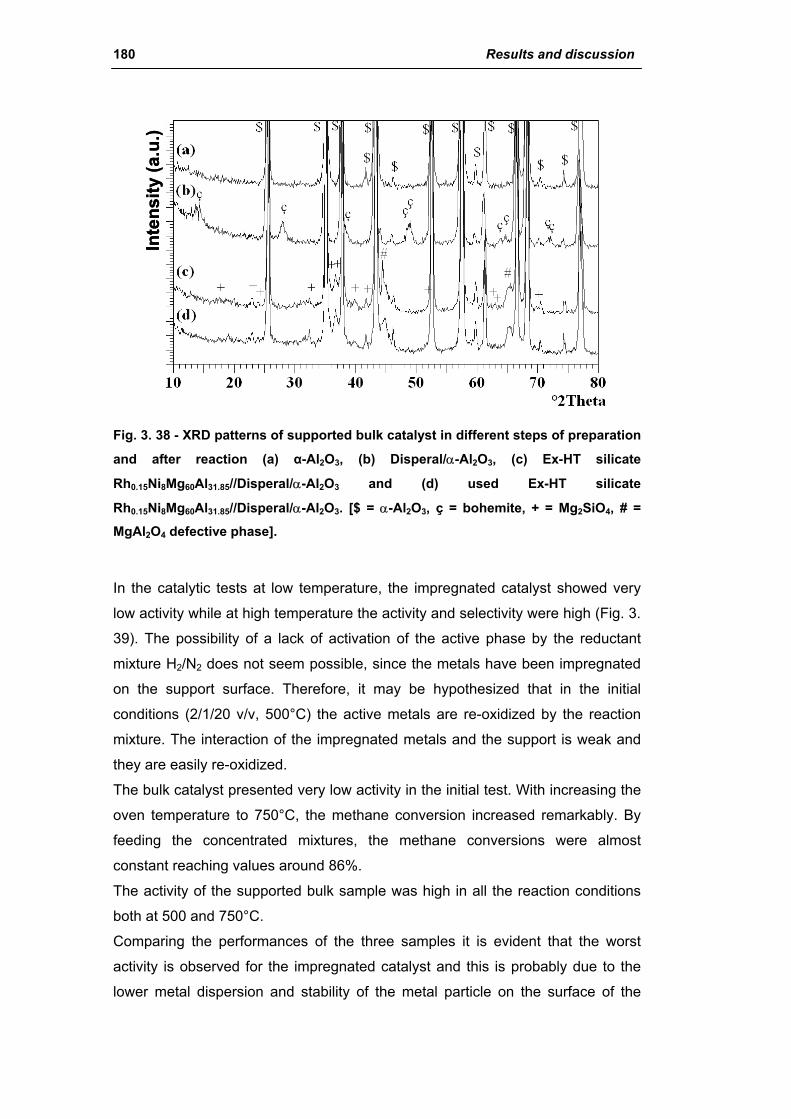
180 Results and discussion
Inte
nsity
(a.u
.)In
tens
ity (a
.u.)
Fig. 3. 38 - XRD patterns of supported bulk catalyst in different steps of preparation
and after reaction (a) α-Al2O3, (b) Disperal/α-Al2O3, (c) Ex-HT silicate
Rh0.15Ni8Mg60Al31.85//Disperal/α-Al2O3 and (d) used Ex-HT silicate
Rh0.15Ni8Mg60Al31.85//Disperal/α-Al2O3. [$ = α-Al2O3, ç = bohemite, + = Mg2SiO4, # =
MgAl2O4 defective phase].
In the catalytic tests at low temperature, the impregnated catalyst showed very
low activity while at high temperature the activity and selectivity were high (Fig. 3.
39). The possibility of a lack of activation of the active phase by the reductant
mixture H2/N2 does not seem possible, since the metals have been impregnated
on the support surface. Therefore, it may be hypothesized that in the initial
conditions (2/1/20 v/v, 500°C) the active metals are re-oxidized by the reaction
mixture. The interaction of the impregnated metals and the support is weak and
they are easily re-oxidized.
The bulk catalyst presented very low activity in the initial test. With increasing the
oven temperature to 750°C, the methane conversion increased remarkably. By
feeding the concentrated mixtures, the methane conversions were almost
constant reaching values around 86%.
The activity of the supported bulk sample was high in all the reaction conditions
both at 500 and 750°C.
Comparing the performances of the three samples it is evident that the worst
activity is observed for the impregnated catalyst and this is probably due to the
lower metal dispersion and stability of the metal particle on the surface of the
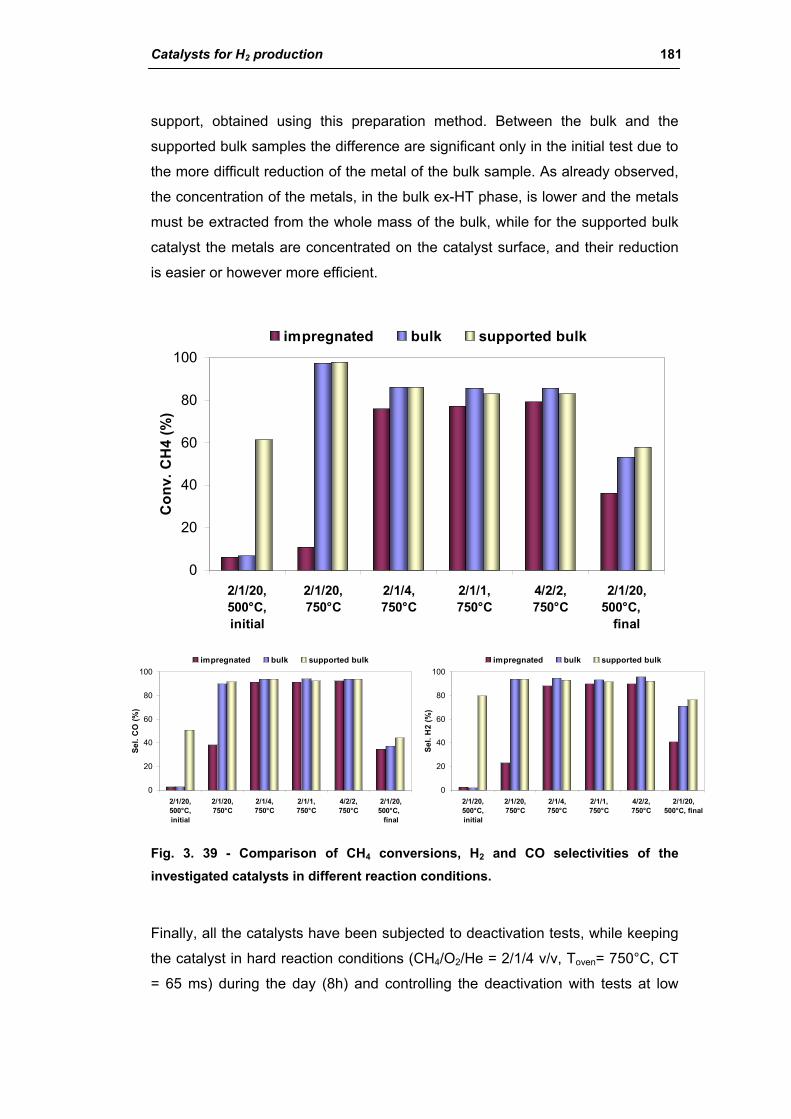
Catalysts for H2 production 181
support, obtained using this preparation method. Between the bulk and the
supported bulk samples the difference are significant only in the initial test due to
the more difficult reduction of the metal of the bulk sample. As already observed,
the concentration of the metals, in the bulk ex-HT phase, is lower and the metals
must be extracted from the whole mass of the bulk, while for the supported bulk
catalyst the metals are concentrated on the catalyst surface, and their reduction
is easier or however more efficient.
0
20
40
60
80
100
2/1/20,500°C,initial
2/1/20,750°C
2/1/4,750°C
2/1/1,750°C
4/2/2,750°C
2/1/20,500°C,
final
Con
v. C
H4
(%)
impregnated bulk supported bulk
0
20
40
60
80
100
2/1/20,500°C,initial
2/1/20,750°C
2/1/4,750°C
2/1/1,750°C
4/2/2,750°C
2/1/20,500°C,
final
Sel.
CO
(%)
impregnated bulk supported bulk
0
20
40
60
80
100
2/1/20,500°C,initial
2/1/20,750°C
2/1/4,750°C
2/1/1,750°C
4/2/2,750°C
2/1/20,500°C, final
Sel.
H2
(%)
impregnated bulk supported bulk
Fig. 3. 39 - Comparison of CH4 conversions, H2 and CO selectivities of the investigated catalysts in different reaction conditions.
Finally, all the catalysts have been subjected to deactivation tests, while keeping
the catalyst in hard reaction conditions (CH4/O2/He = 2/1/4 v/v, Toven= 750°C, CT
= 65 ms) during the day (8h) and controlling the deactivation with tests at low
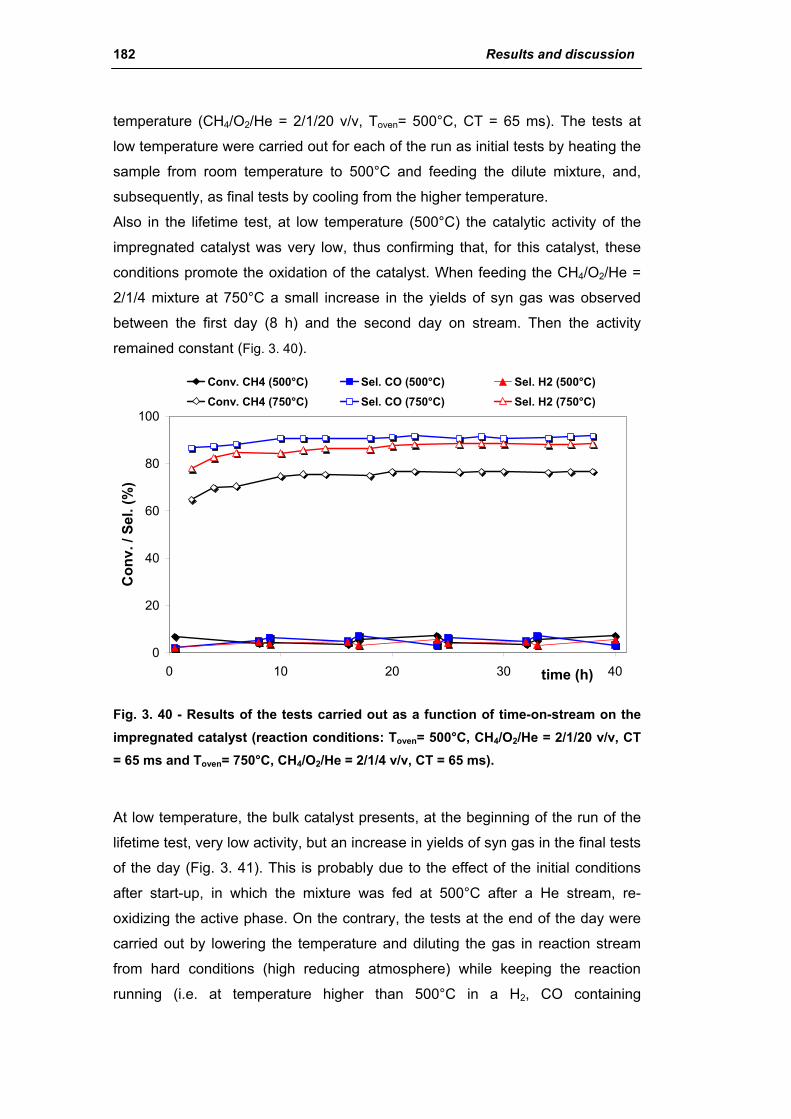
182 Results and discussion
temperature (CH4/O2/He = 2/1/20 v/v, Toven= 500°C, CT = 65 ms). The tests at
low temperature were carried out for each of the run as initial tests by heating the
sample from room temperature to 500°C and feeding the dilute mixture, and,
subsequently, as final tests by cooling from the higher temperature.
Also in the lifetime test, at low temperature (500°C) the catalytic activity of the
impregnated catalyst was very low, thus confirming that, for this catalyst, these
conditions promote the oxidation of the catalyst. When feeding the CH4/O2/He =
2/1/4 mixture at 750°C a small increase in the yields of syn gas was observed
between the first day (8 h) and the second day on stream. Then the activity
remained constant (Fig. 3. 40).
0
20
40
60
80
100
0 10 20 30 40time (h)
Con
v. /
Sel.
(%)
Conv. CH4 (500°C) Sel. CO (500°C) Sel. H2 (500°C)Conv. CH4 (750°C) Sel. CO (750°C) Sel. H2 (750°C)
Fig. 3. 40 - Results of the tests carried out as a function of time-on-stream on the impregnated catalyst (reaction conditions: Toven= 500°C, CH4/O2/He = 2/1/20 v/v, CT = 65 ms and Toven= 750°C, CH4/O2/He = 2/1/4 v/v, CT = 65 ms).
At low temperature, the bulk catalyst presents, at the beginning of the run of the
lifetime test, very low activity, but an increase in yields of syn gas in the final tests
of the day (Fig. 3. 41). This is probably due to the effect of the initial conditions
after start-up, in which the mixture was fed at 500°C after a He stream, re-
oxidizing the active phase. On the contrary, the tests at the end of the day were
carried out by lowering the temperature and diluting the gas in reaction stream
from hard conditions (high reducing atmosphere) while keeping the reaction
running (i.e. at temperature higher than 500°C in a H2, CO containing
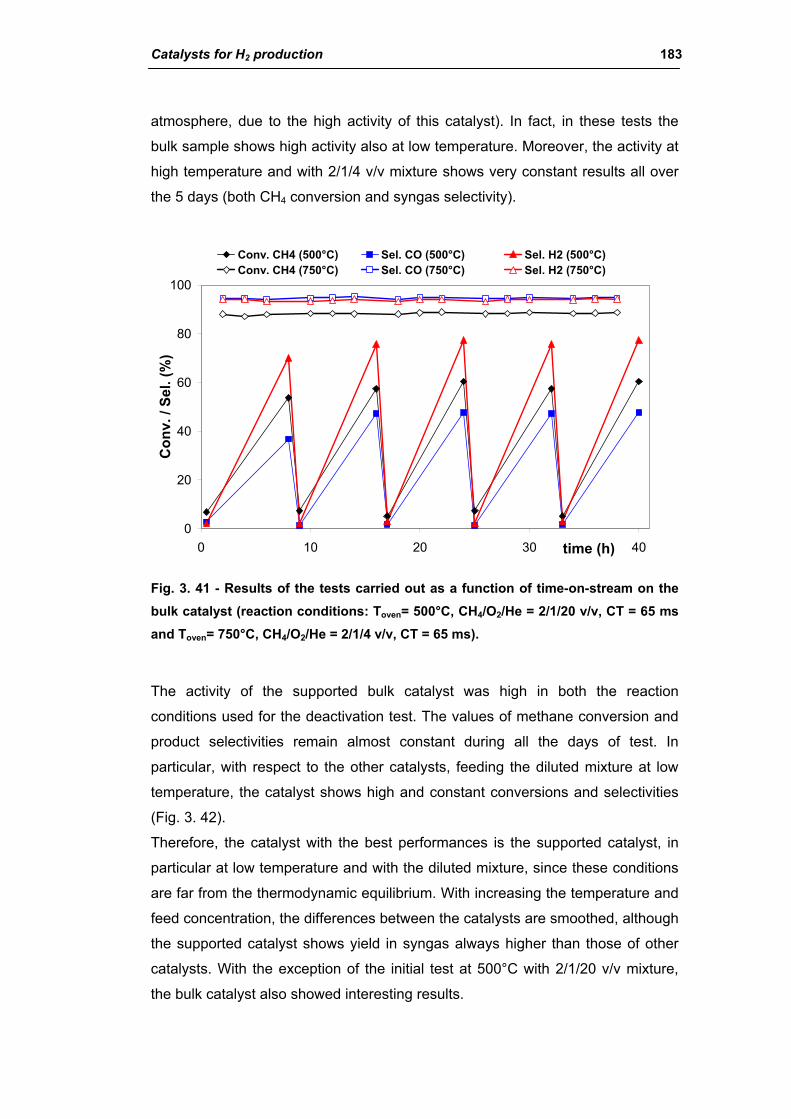
Catalysts for H2 production 183
atmosphere, due to the high activity of this catalyst). In fact, in these tests the
bulk sample shows high activity also at low temperature. Moreover, the activity at
high temperature and with 2/1/4 v/v mixture shows very constant results all over
the 5 days (both CH4 conversion and syngas selectivity).
0
20
40
60
80
100
0 10 20 30 40time (h)
Con
v. /
Sel.
(%)
Conv. CH4 (500°C) Sel. CO (500°C) Sel. H2 (500°C)Conv. CH4 (750°C) Sel. CO (750°C) Sel. H2 (750°C)
Fig. 3. 41 - Results of the tests carried out as a function of time-on-stream on the bulk catalyst (reaction conditions: Toven= 500°C, CH4/O2/He = 2/1/20 v/v, CT = 65 ms and Toven= 750°C, CH4/O2/He = 2/1/4 v/v, CT = 65 ms).
The activity of the supported bulk catalyst was high in both the reaction
conditions used for the deactivation test. The values of methane conversion and
product selectivities remain almost constant during all the days of test. In
particular, with respect to the other catalysts, feeding the diluted mixture at low
temperature, the catalyst shows high and constant conversions and selectivities
(Fig. 3. 42).
Therefore, the catalyst with the best performances is the supported catalyst, in
particular at low temperature and with the diluted mixture, since these conditions
are far from the thermodynamic equilibrium. With increasing the temperature and
feed concentration, the differences between the catalysts are smoothed, although
the supported catalyst shows yield in syngas always higher than those of other
catalysts. With the exception of the initial test at 500°C with 2/1/20 v/v mixture,
the bulk catalyst also showed interesting results.
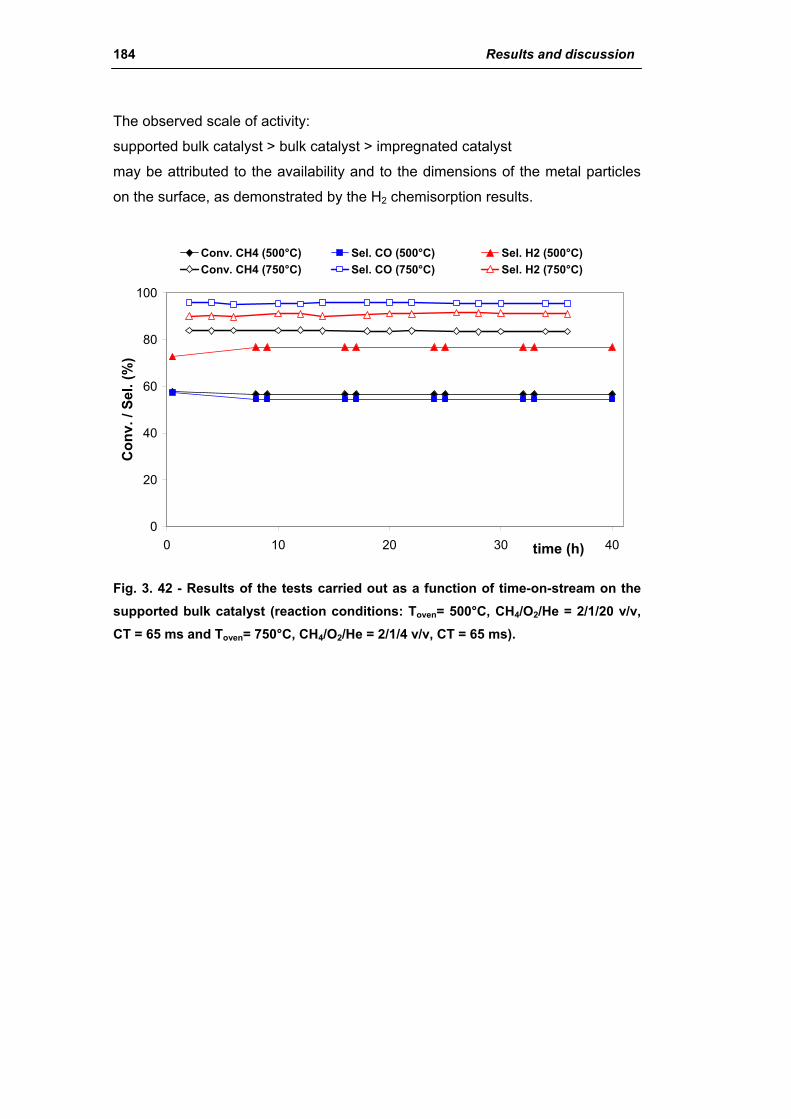
184 Results and discussion
The observed scale of activity:
supported bulk catalyst > bulk catalyst > impregnated catalyst
may be attributed to the availability and to the dimensions of the metal particles
on the surface, as demonstrated by the H2 chemisorption results.
0
20
40
60
80
100
0 10 20 30 40time (h)
Con
v. /
Sel.
(%)
Conv. CH4 (500°C) Sel. CO (500°C) Sel. H2 (500°C)Conv. CH4 (750°C) Sel. CO (750°C) Sel. H2 (750°C)
Fig. 3. 42 - Results of the tests carried out as a function of time-on-stream on the supported bulk catalyst (reaction conditions: Toven= 500°C, CH4/O2/He = 2/1/20 v/v, CT = 65 ms and Toven= 750°C, CH4/O2/He = 2/1/4 v/v, CT = 65 ms).

Catalysts for H2 production 185
3. Steam reforming of methane
The second part of the research regards the steam methane reforming and the
needs to further develop the industrial process. The study was initially focused on
the investigation of commercial catalysts, examining the deactivation in industrial
conditions, the role of the operating conditions (P, T, CT, S/C, Vcat and Dp) and
the activity of different type of catalysts.
Successively, innovative materials, as bulk (PVK and HT) and structured
catalysts, (SiC and metallic foam) were studied in view of the preparation of
structured reactor (wall reactor, monolith reactor and membrane reactor) that
could enhance the H2 production by SR.
3.1. Characterization of spent industrial catalysts
Two series of used samples of the same commercial catalyst (13 wt %
Ni/MgAl2O4) delivered by Air Liquide and unloaded from two industrial steam
reforming plants, one locate in Portugal and the other in USA, were characterized
to study the deactivation occurred during real time-on-stream.
Fig. 3. 43 – Spent samples coming from the two industrial steam reforming plant.
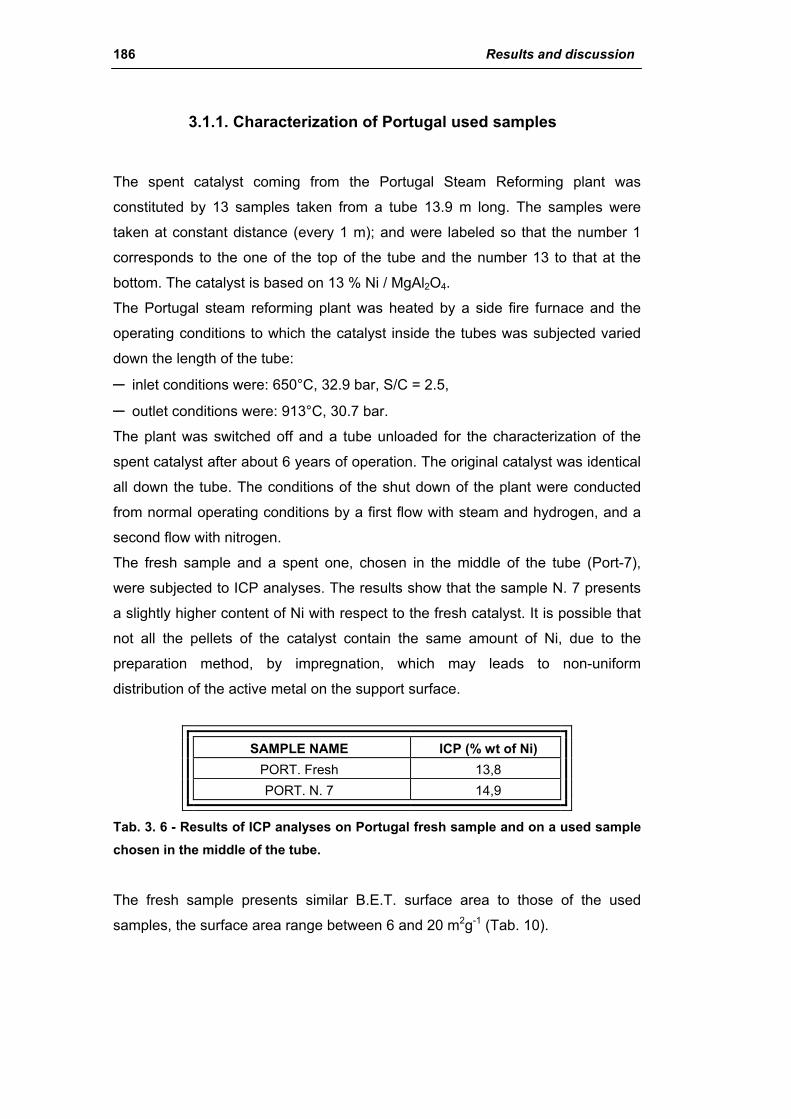
186 Results and discussion
3.1.1. Characterization of Portugal used samples
The spent catalyst coming from the Portugal Steam Reforming plant was
constituted by 13 samples taken from a tube 13.9 m long. The samples were
taken at constant distance (every 1 m); and were labeled so that the number 1
corresponds to the one of the top of the tube and the number 13 to that at the
bottom. The catalyst is based on 13 % Ni / MgAl2O4.
The Portugal steam reforming plant was heated by a side fire furnace and the
operating conditions to which the catalyst inside the tubes was subjected varied
down the length of the tube:
─ inlet conditions were: 650°C, 32.9 bar, S/C = 2.5,
─ outlet conditions were: 913°C, 30.7 bar.
The plant was switched off and a tube unloaded for the characterization of the
spent catalyst after about 6 years of operation. The original catalyst was identical
all down the tube. The conditions of the shut down of the plant were conducted
from normal operating conditions by a first flow with steam and hydrogen, and a
second flow with nitrogen.
The fresh sample and a spent one, chosen in the middle of the tube (Port-7),
were subjected to ICP analyses. The results show that the sample N. 7 presents
a slightly higher content of Ni with respect to the fresh catalyst. It is possible that
not all the pellets of the catalyst contain the same amount of Ni, due to the
preparation method, by impregnation, which may leads to non-uniform
distribution of the active metal on the support surface.
SAMPLE NAME ICP (% wt of Ni) PORT. Fresh 13,8 PORT. N. 7 14,9
Tab. 3. 6 - Results of ICP analyses on Portugal fresh sample and on a used sample chosen in the middle of the tube.
The fresh sample presents similar B.E.T. surface area to those of the used
samples, the surface area range between 6 and 20 m2g-1 (Tab. 10).
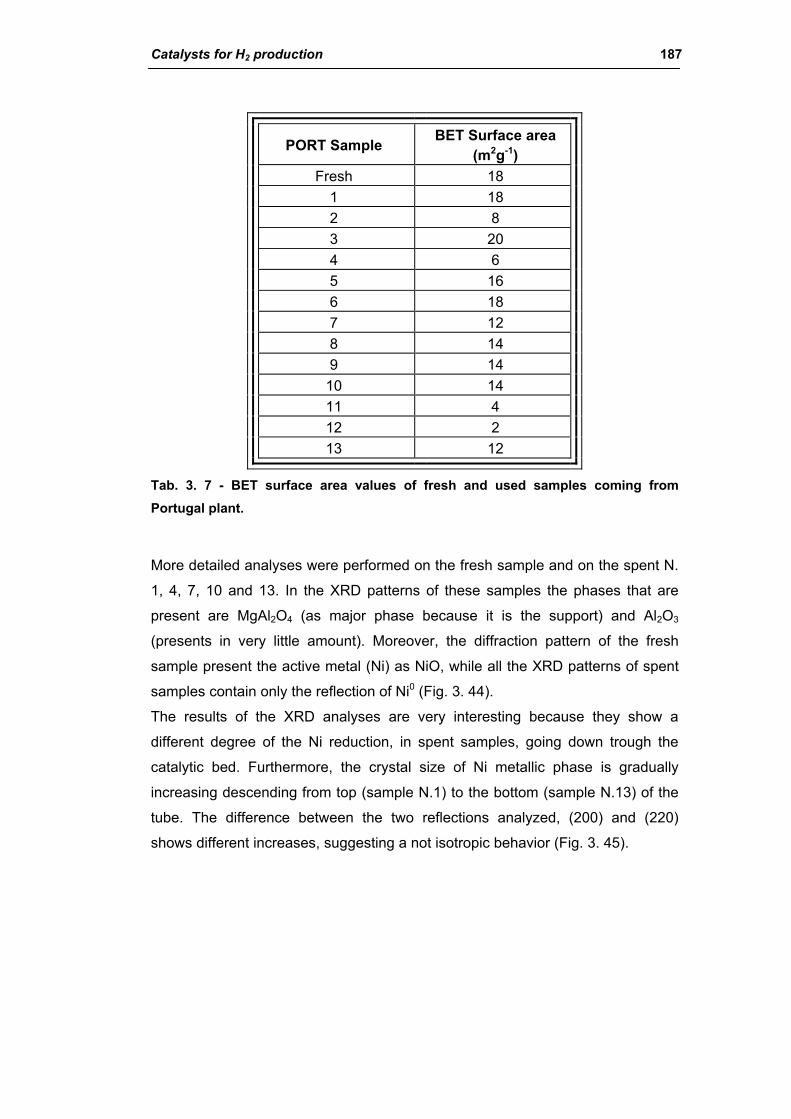
Catalysts for H2 production 187
PORT Sample BET Surface area (m2g-1)
Fresh 18 1 18 2 8 3 20 4 6 5 16 6 18 7 12 8 14 9 14
10 14 11 4 12 2 13 12
Tab. 3. 7 - BET surface area values of fresh and used samples coming from Portugal plant.
More detailed analyses were performed on the fresh sample and on the spent N.
1, 4, 7, 10 and 13. In the XRD patterns of these samples the phases that are
present are MgAl2O4 (as major phase because it is the support) and Al2O3
(presents in very little amount). Moreover, the diffraction pattern of the fresh
sample present the active metal (Ni) as NiO, while all the XRD patterns of spent
samples contain only the reflection of Ni0 (Fig. 3. 44).
The results of the XRD analyses are very interesting because they show a
different degree of the Ni reduction, in spent samples, going down trough the
catalytic bed. Furthermore, the crystal size of Ni metallic phase is gradually
increasing descending from top (sample N.1) to the bottom (sample N.13) of the
tube. The difference between the two reflections analyzed, (200) and (220)
shows different increases, suggesting a not isotropic behavior (Fig. 3. 45).
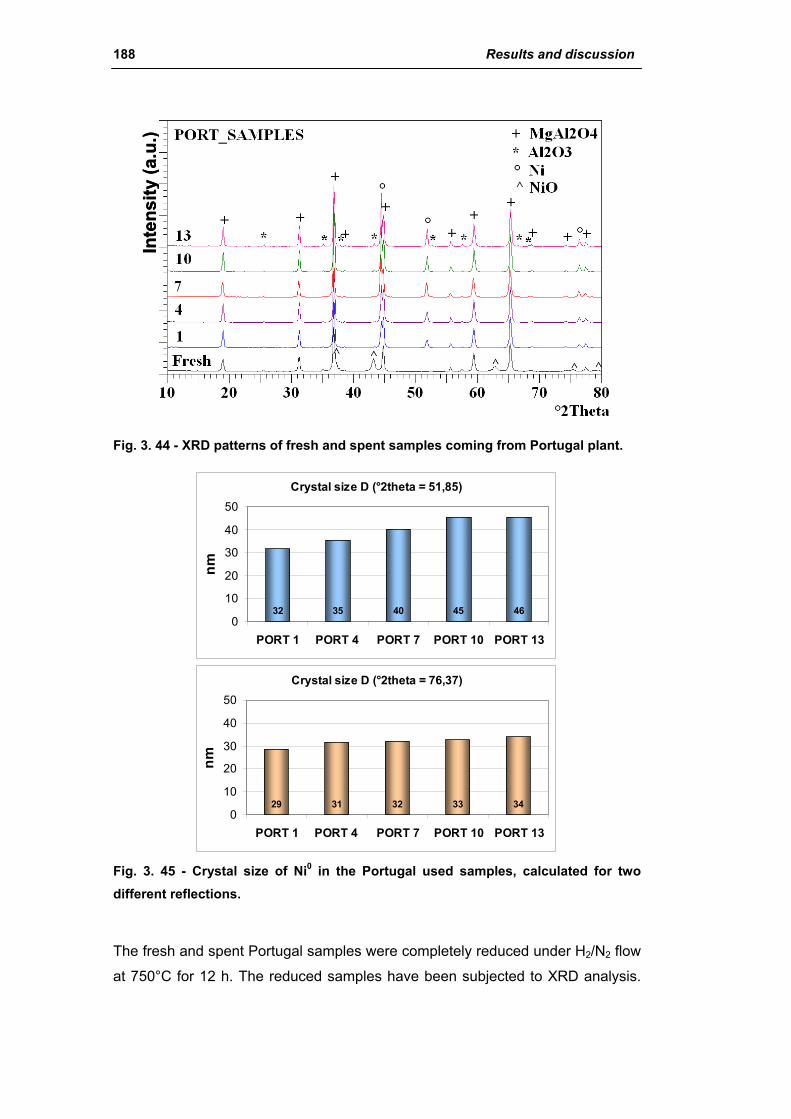
188 Results and discussion
Inte
nsity
(a.u
.)In
tens
ity (a
.u.)
Fig. 3. 44 - XRD patterns of fresh and spent samples coming from Portugal plant.
Crystal size D (°2theta = 51,85)
32 35 40 45 460
10
20
30
40
50
PORT 1 PORT 4 PORT 7 PORT 10 PORT 13
nm
Crystal size D (°2theta = 76,37)
29 31 32 33 340
10
20
30
40
50
PORT 1 PORT 4 PORT 7 PORT 10 PORT 13
nm
Fig. 3. 45 - Crystal size of Ni0 in the Portugal used samples, calculated for two different reflections.
The fresh and spent Portugal samples were completely reduced under H2/N2 flow
at 750°C for 12 h. The reduced samples have been subjected to XRD analysis.

Catalysts for H2 production 189
The Ni crystal sizes were calculated again for the two reflections d200 and d220
and compared to those of the unreduced samples.
The fresh sample shows the lowest value due to the fact that it was not subjected
to the reaction conditions, as the used samples, and the Ni particles were not
sintherized. Going down through the catalytic bed, the Ni crystal size increases,
both for the unreduced samples and for the reduced catalysts, but lower values
have been observed for the reduced samples.
Not Reduced Samples Reduced Samples SAMPLES D (nm)
°2θ = 51.85 D (nm)
°2θ = 76.37 D (nm)
°2θ = 51.85 D (nm)
°2θ = 76.37 PORT_Fresh - - 15 19
PORT_1 32 29 38 32 PORT_5 35 31 35 29 PORT_9 40 32 36 31 PORT_13 45 33 41 33 PORT_16 46 34 39 32
Fig. 3. 46 - Ni crystal size of the USA samples calculated for two reflection.
Furthermore, the Portugal samples have been oxidized at 900°C in air for 12 h, to
estimate the NiO crystal size (Fig. 3. 47).
The results of the NiO crystal size confirm the observation carried out with the
Ni0. In fact also the dimension of the NiO crystal size increases, going down
through the catalytic bed the because of the increase of the drastic reaction
conditions in the bottom of the tube.
NiO Crystal size of oxidized samples (°2θ= 43.29)
21 23 29 35 40 45 470
10
20
30
40
50
fresh fresh ox Port_1 ox Port_4 ox Port_7 ox Port_10 ox Port_13 ox
D (n
m)
Fig. 3. 47 - NiO crystal size of calcined Portugal samples.
190 Results and discussion
The samples were analyzed by temperature programmed reduction and oxidation
analyses (TPR/O), using the following procedure:
─ Pre-treatment : 0.1g of the samples (20-40 mesh) were pre-treated under N2
(20 ml/min) from room temperature to 150°C (temperature rate of 20°C/min)
and hold for 30 minutes at 150°C.
─ Reduction : after cooling until 100°C, the reduction analyses were performed
with 5 % of H2 in Ar (20 ml/min) from 100 to 950°C (temperature rate of
10°C/min) and hold for 30 minutes at 950°C.
─ Oxidation : after cooling until 100°C, the oxidation analyses were performed
with 5 % of O2 in He (20 ml/min) from 100 to 950°C (temperature rate of
10°C/min) and hold for 30 minutes at 950°C.
The differences among the fresh sample and the used samples are clear. Beside
The NiO is responsible of the sharp reduction peak at low temperature, which for
used samples is of lower intensity than the fresh sample, due to the presence of
Ni partially as Ni0. In all these samples, a peak at high temperature attributable to
a different oxidized Ni species is also present. Moreover, going down through the
catalytic bed the TPR shows very complicated pattern in a range among 250-
500°C in which free NiO species are reduced, maybe due to different size of the
Ni species or access of the gas to the Ni sites.
As reported in literature109, 110, 111, 112, 113, 114, 115, 116, 117, it is possible to identify
different NiO type phases that are reduced at higher temperature while the
strength of interaction with the support increases and when it forms a solid
solution with the Mg contained in the support. Furthermore, from the literature
data it is clear that the two reduction steps at 850-890°C and at over 950°C are
typical of the spinel phases with increasing reducing temperature by insertion of
Mg in the spinel (Ni-MgAl2O4). A summary of the main reduction temperatures of
the Portugal samples is shown in Tab. 3. 8. The NiAl2O4, which cannot be
identified by XRD analysis due to the overlapping of the reflections of this phase
with those of the support, is present in all the samples in a solid solution with
MgAl2O4. The formation of the nickel spinel phase is due to the drastic conditions
at which the Ni particles were subjected during reaction, while only the fresh
sample contains peak attributable to pure NiAl2O4.

Catalysts for H2 production 191
0
200
400
600
800
1000
0 1000 2000 3000 4000 5000 6000 7000
1310
7
4
1
Fresh
TCD
sig
nal (
a.u.
)
Time (s)
T (°
C)
Fig. 3. 48 - TPR patterns of the fresh and used samples coming from Portugal plant.
Port_Fresh Port_1 Port_4 Port_7 Port_10 Port_13NiO → Ni0
Free NiO, 220-300°C 238°C 252°C 266°C 259°C 252°C 240°C
NiO → Ni0 NiO slightly bounded with the
support, 400-500°C 440°C
310-437°C
312-460°C
325-464°C
360-460°C
340-475°C
NiO → Ni0 NiO strongly interacting with
the support, 500-600°C 538°C 578°C 570°C 516°C 552°C
Ni1-xMgxO → Ni0 Solid solution, 720°C
720°C 720°C 720°C
NiAl2O4 → Ni0 Free NiAl2O4, 850°C
840°C
Ni1-yMgyAl2O4 → Ni0 Solid solution, 1000°C
957°C 957°C 957°C 957°C 957°C
Tab. 3. 8 - Summary of the reduction temperatures observed in the TPR patterns of the Portugal fresh and spent samples.
The TPO analysis (Fig. 3. 49) shows a monotonic shift of the oxidation peaks
towards higher temperature by moving from the fresh (338°C) to the used sample
and from the sample N°1 (480°C) to the sample N° 13 (600°C). The differences
between the samples are due to the differences in the temperature of the
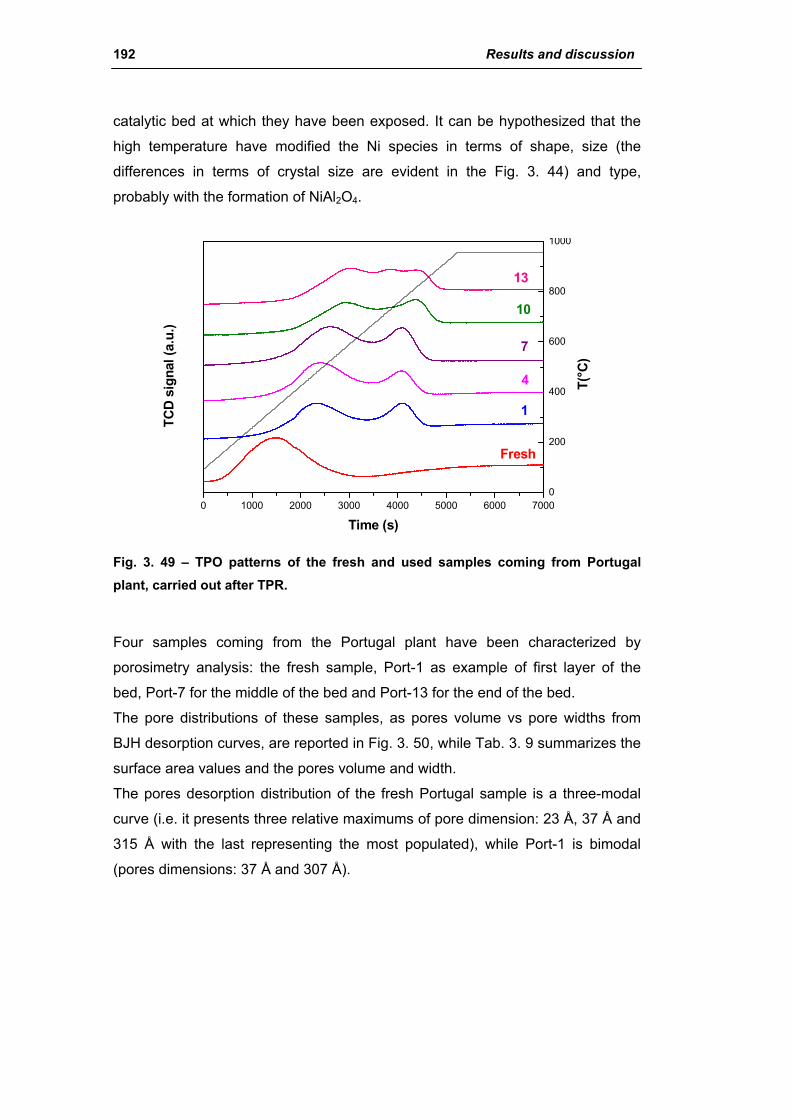
192 Results and discussion
catalytic bed at which they have been exposed. It can be hypothesized that the
high temperature have modified the Ni species in terms of shape, size (the
differences in terms of crystal size are evident in the Fig. 3. 44) and type,
probably with the formation of NiAl2O4.
0
200
400
600
800
1000
0 1000 2000 3000 4000 5000 6000 7000
13
10
7
4
1
Fresh
TCD
sig
nal (
a.u.
)
Time (s)
T(°
C)
Fig. 3. 49 – TPO patterns of the fresh and used samples coming from Portugal plant, carried out after TPR.
Four samples coming from the Portugal plant have been characterized by
porosimetry analysis: the fresh sample, Port-1 as example of first layer of the
bed, Port-7 for the middle of the bed and Port-13 for the end of the bed.
The pore distributions of these samples, as pores volume vs pore widths from
BJH desorption curves, are reported in Fig. 3. 50, while Tab. 3. 9 summarizes the
surface area values and the pores volume and width.
The pores desorption distribution of the fresh Portugal sample is a three-modal
curve (i.e. it presents three relative maximums of pore dimension: 23 Å, 37 Å and
315 Å with the last representing the most populated), while Port-1 is bimodal
(pores dimensions: 37 Å and 307 Å).

Catalysts for H2 production 193
Pore Width (Å)10 100 1,000
Pore
Vol
ume
(cm
³/g·Å
)
0.00000.0000
0.0001
0.0002
FRESH PORT-1 PORT-7 PORT-13
Fig. 3. 50 - Pore distribution for the Portugal samples from BJH.
Port-1 shows similar porosity with respect to the fresh sample for what concern
large mesopores, while smaller pores disappear. Going down through the
catalytic bed, smaller porosity further decrease, but also large mesopores
significantly decrease (the maximum at around 310 Å almost disappears) and the
maximum is shifted at higher values. Only macroporosity remains constant (pores
with width higher than 1000 Å) and, in this region, the curves are identical for the
whole series of the samples. This leads to a different pores volume, which is
double for fresh Port and Port-1 with respect to the Port-7 and Port-13 (with Port
7 having higher pore volume than Port-13). The analyses confirm the progressive
decrease of the surface areas going down towards the end of the bed.
The pore volume decreases from Port-7 to Port-13 can be due to the sintering of
the support, in fact the spinel crystal size, calculated from XRD patterns, are 43
nm for Port-7, and 53nm for Port-13. On the other side, the disappearing of the
large mesopores can be due to occlusion of the pores or to modification of the
crystal and particles structure/morphology in a more close arrangement.
Two hypotheses can be done:
(a) the increase of the Ni crystal size dimensions occludes the pores.
This hypothesis is corroborated by the dimension of the Ni crystal size in Port-13
and Port-7 that is analogous to the dimensions of the pores that disappeared;
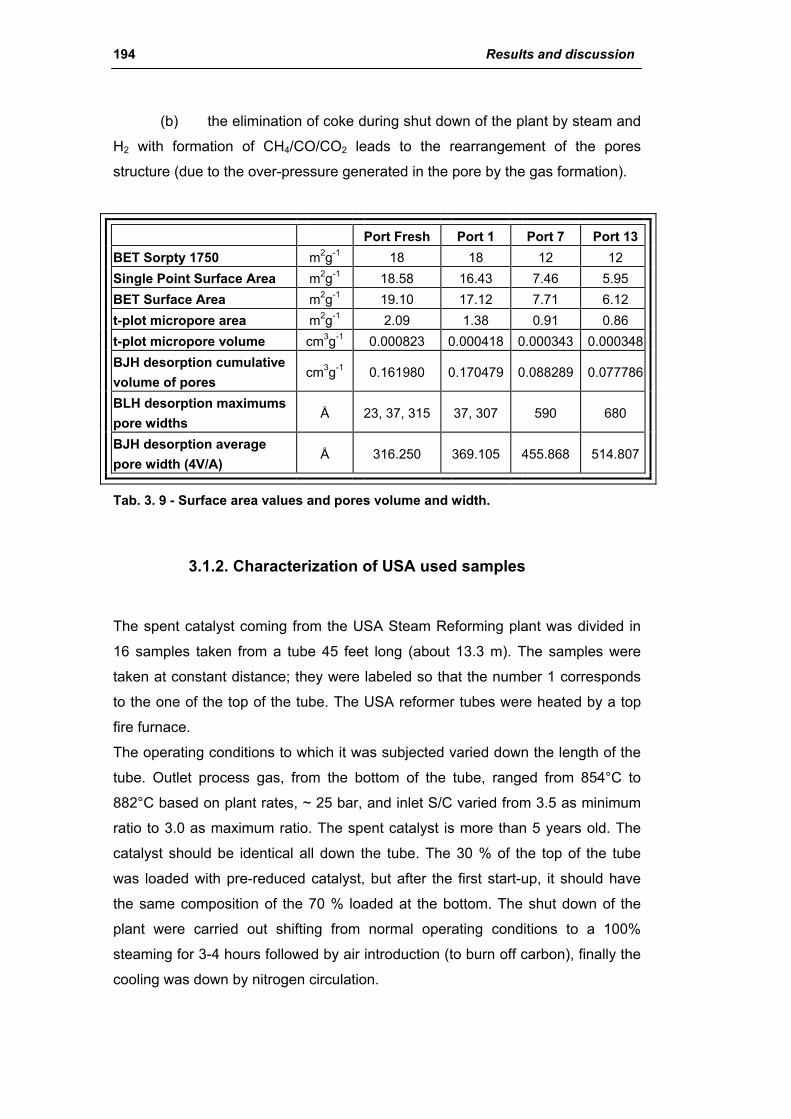
194 Results and discussion
(b) the elimination of coke during shut down of the plant by steam and
H2 with formation of CH4/CO/CO2 leads to the rearrangement of the pores
structure (due to the over-pressure generated in the pore by the gas formation).
Port Fresh Port 1 Port 7 Port 13 BET Sorpty 1750 m2g-1 18 18 12 12 Single Point Surface Area m2g-1 18.58 16.43 7.46 5.95 BET Surface Area m2g-1 19.10 17.12 7.71 6.12 t-plot micropore area m2g-1 2.09 1.38 0.91 0.86 t-plot micropore volume cm3g-1 0.000823 0.000418 0.000343 0.000348 BJH desorption cumulative volume of pores
cm3g-1 0.161980 0.170479 0.088289 0.077786
BLH desorption maximums pore widths
Å 23, 37, 315 37, 307 590 680
BJH desorption average pore width (4V/A)
Å 316.250 369.105 455.868 514.807
Tab. 3. 9 - Surface area values and pores volume and width.
3.1.2. Characterization of USA used samples
The spent catalyst coming from the USA Steam Reforming plant was divided in
16 samples taken from a tube 45 feet long (about 13.3 m). The samples were
taken at constant distance; they were labeled so that the number 1 corresponds
to the one of the top of the tube. The USA reformer tubes were heated by a top
fire furnace.
The operating conditions to which it was subjected varied down the length of the
tube. Outlet process gas, from the bottom of the tube, ranged from 854°C to
882°C based on plant rates, ~ 25 bar, and inlet S/C varied from 3.5 as minimum
ratio to 3.0 as maximum ratio. The spent catalyst is more than 5 years old. The
catalyst should be identical all down the tube. The 30 % of the top of the tube
was loaded with pre-reduced catalyst, but after the first start-up, it should have
the same composition of the 70 % loaded at the bottom. The shut down of the
plant were carried out shifting from normal operating conditions to a 100%
steaming for 3-4 hours followed by air introduction (to burn off carbon), finally the
cooling was down by nitrogen circulation.
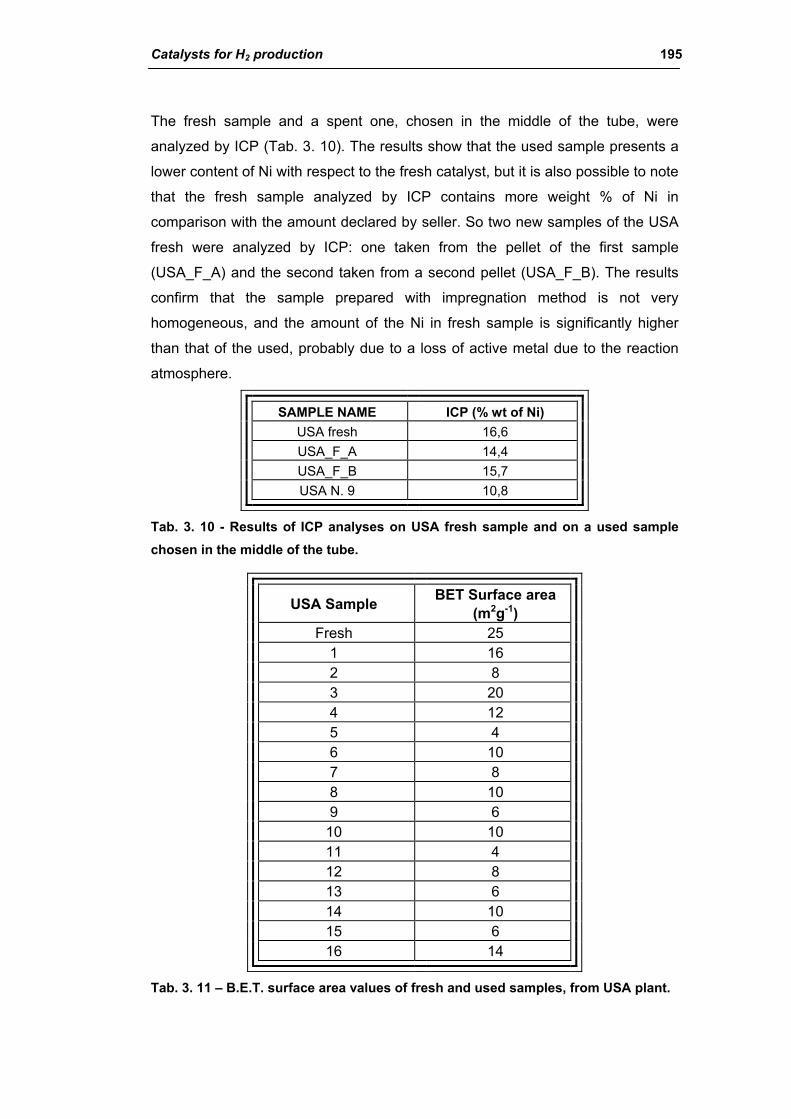
Catalysts for H2 production 195
The fresh sample and a spent one, chosen in the middle of the tube, were
analyzed by ICP (Tab. 3. 10). The results show that the used sample presents a
lower content of Ni with respect to the fresh catalyst, but it is also possible to note
that the fresh sample analyzed by ICP contains more weight % of Ni in
comparison with the amount declared by seller. So two new samples of the USA
fresh were analyzed by ICP: one taken from the pellet of the first sample
(USA_F_A) and the second taken from a second pellet (USA_F_B). The results
confirm that the sample prepared with impregnation method is not very
homogeneous, and the amount of the Ni in fresh sample is significantly higher
than that of the used, probably due to a loss of active metal due to the reaction
atmosphere.
SAMPLE NAME ICP (% wt of Ni) USA fresh 16,6 USA_F_A 14,4 USA_F_B 15,7 USA N. 9 10,8
Tab. 3. 10 - Results of ICP analyses on USA fresh sample and on a used sample chosen in the middle of the tube.
USA Sample BET Surface area (m2g-1)
Fresh 25 1 16 2 8 3 20 4 12 5 4 6 10 7 8 8 10 9 6
10 10 11 4 12 8 13 6 14 10 15 6 16 14
Tab. 3. 11 – B.E.T. surface area values of fresh and used samples, from USA plant.
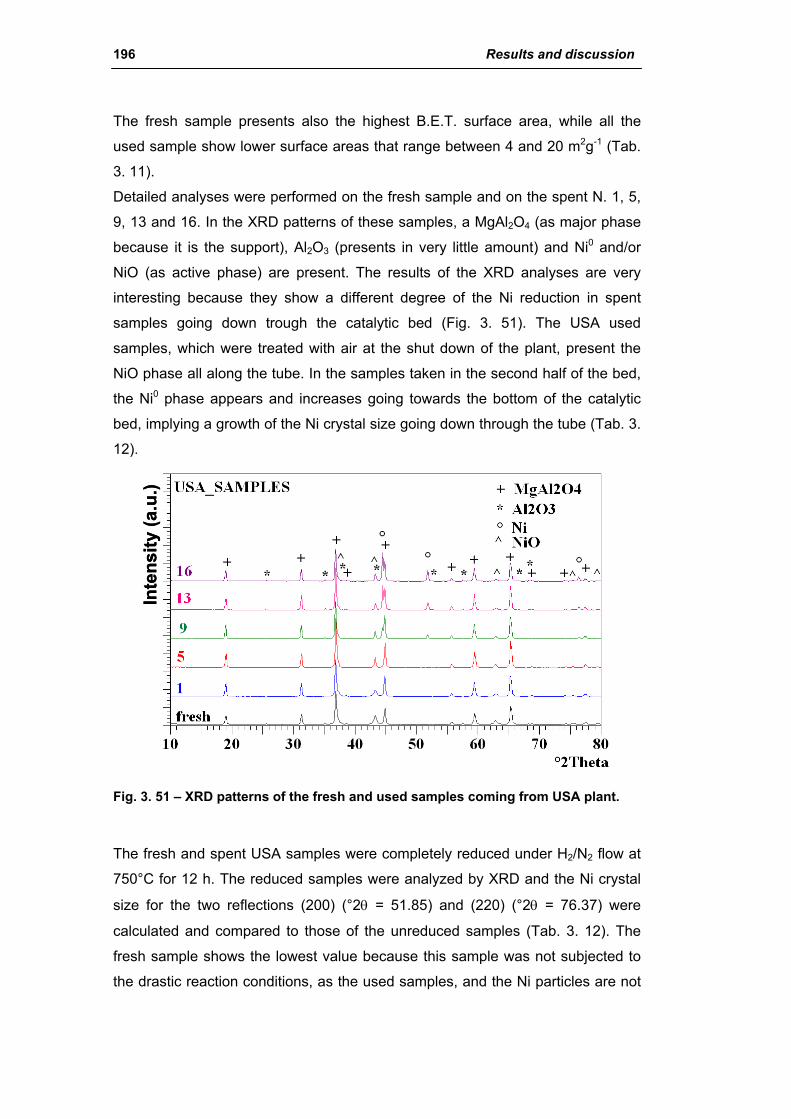
196 Results and discussion
The fresh sample presents also the highest B.E.T. surface area, while all the
used sample show lower surface areas that range between 4 and 20 m2g-1 (Tab.
3. 11).
Detailed analyses were performed on the fresh sample and on the spent N. 1, 5,
9, 13 and 16. In the XRD patterns of these samples, a MgAl2O4 (as major phase
because it is the support), Al2O3 (presents in very little amount) and Ni0 and/or
NiO (as active phase) are present. The results of the XRD analyses are very
interesting because they show a different degree of the Ni reduction in spent
samples going down trough the catalytic bed (Fig. 3. 51). The USA used
samples, which were treated with air at the shut down of the plant, present the
NiO phase all along the tube. In the samples taken in the second half of the bed,
the Ni0 phase appears and increases going towards the bottom of the catalytic
bed, implying a growth of the Ni crystal size going down through the tube (Tab. 3.
12).
Inte
nsity
(a.u
.)In
tens
ity (a
.u.)
Fig. 3. 51 – XRD patterns of the fresh and used samples coming from USA plant.
The fresh and spent USA samples were completely reduced under H2/N2 flow at
750°C for 12 h. The reduced samples were analyzed by XRD and the Ni crystal
size for the two reflections (200) (°2θ = 51.85) and (220) (°2θ = 76.37) were
calculated and compared to those of the unreduced samples (Tab. 3. 12). The
fresh sample shows the lowest value because this sample was not subjected to
the drastic reaction conditions, as the used samples, and the Ni particles are not

Catalysts for H2 production 197
sintherized. Going down through the catalytic bed the Ni crystal size increases,
also in the case of the reduced catalysts.
Not Reduced Samples Reduced Samples SAMPLES D (nm)
°2θ = 51.85 D (nm)
°2θ = 76.37 D (nm)
°2θ = 51.85 D (nm)
°2θ = 76.37 USA_Fresh - - 16 ± 2 19 ± 2
USA_1 - - 18 ± 2 24 ± 2 USA_5 - - 30 ± 3 24 ± 2 USA_9 45 ± 3 37 ± 3 39 ± 3 32 ± 3
USA_13 49 ± 3 34 ± 3 38 ± 3 31 ± 3 USA_16 54± 3 39 ± 3 48 ± 3 34 ± 3
Tab. 3. 12 - Ni crystal size of the USA samples calculated for two reflections.
Since the USA samples are partially oxidised, they have been completely
oxidised at 900°C for 12 h. The NiO crystal size has been estimated from the
XRD patterns. Comparing the crystal size values obtained for the just used and
one subjected to oxidation (Fig. 3. 52), the fresh and the USA_1 samples show
similar and low crystal size before and after calcination. Starting from the sample
USA_5, the dimensions of Ni (as NiO) are about doubled with respect to the fresh
sample, and the maximum of NiO crystal size is reached by the USA_9.
NiO crystal size USA samples
0
10
20
30
40
50
60
Fresh 1 5 9 13 16
D (nm
)
USA USA OX
Fig. 3. 52 - Comparison between the NiO crystal size of the USA samples before and after calcination.
NiO Crystal size
D (nm)
D (nm) After
calcination USA_Fresh 25 23
USA_1 21 24 USA_5 44 43 USA_9 50 56 USA_13 41 50 USA_16 45 44

198 Results and discussion
Three used USA samples taken from the beginning (USA-1), the end (USA-16)
and from the middle of the catalytic tube (USA-9), were also subjected to
porosimetry analyses. It was found that the USA-1 is very similar to the fresh
sample, apart from a slight decrease of the surface area value. The USA-9 and
16 samples present a significant decrease of the surface area (especially the
sample unloaded from the middle of the tube) and particularly the samples show
a decrease of the large mesopores and a shift of the maximum of pore volume
distribution at higher value, while the macro-porousness remains constant,
analogously to the Portugal samples.
The decrease of the mesopores can be explained by the blockage of the pores
due to the increase of the dimensions of the Ni particles. In fact, the sample N. 1
presents Ni crystal size not much higher than that of the fresh sample, and the
porosity is very similar to that of the fresh sample. On the opposite, the USA- 9
and 16 samples present bigger Ni crystal with respect to the fresh and the N. 1
samples and their sites are similar to the mesoporous sites. As for Portugal
samples can be hypothesized that the Nickel crystal occlude the pores.
Fresh USA 1 USA 9 USA 16
Single Point Surface Area
m2g-1 18.58 13.19 3.35 5.49
BET Surface Area m2g-1 19.10 13.58 3.65 5.72
t-plot micropore area m2g-1 2.09 1.11 0.00 0.38
t-plot micropore volume cm3g-1 0.000823 0.000413 0.000000 0.000103
BJH desorption comulative volume of
pores cm3g-1 0.161980 0.160910 0.053539 0.076358
BJH desorption maximums pore widths
Å 23, 37,
315 21, 36,
326 36, 740-
1000 19, 36, 480-
1190
BJH desorption average pore width
(4V/A) Å 316 401 562 527
Tab. 3. 13 - Surface area values and pores volume and width of USA 1 and 16 samples.
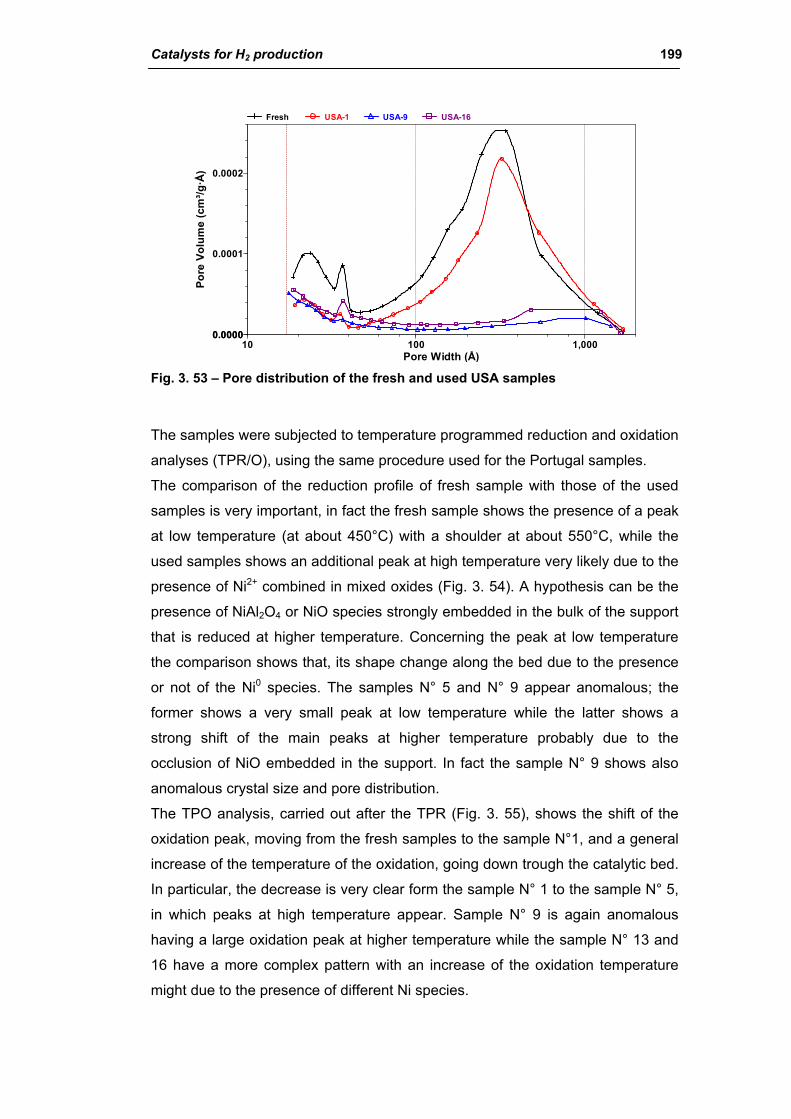
Catalysts for H2 production 199
Pore Width (Å)10 100 1,000
Pore
Vol
ume
(cm
³/g·Å
)
0.00000.0000
0.0001
0.0002
Fresh USA-1 USA-9 USA-16
Fig. 3. 53 – Pore distribution of the fresh and used USA samples
The samples were subjected to temperature programmed reduction and oxidation
analyses (TPR/O), using the same procedure used for the Portugal samples.
The comparison of the reduction profile of fresh sample with those of the used
samples is very important, in fact the fresh sample shows the presence of a peak
at low temperature (at about 450°C) with a shoulder at about 550°C, while the
used samples shows an additional peak at high temperature very likely due to the
presence of Ni2+ combined in mixed oxides (Fig. 3. 54). A hypothesis can be the
presence of NiAl2O4 or NiO species strongly embedded in the bulk of the support
that is reduced at higher temperature. Concerning the peak at low temperature
the comparison shows that, its shape change along the bed due to the presence
or not of the Ni0 species. The samples N° 5 and N° 9 appear anomalous; the
former shows a very small peak at low temperature while the latter shows a
strong shift of the main peaks at higher temperature probably due to the
occlusion of NiO embedded in the support. In fact the sample N° 9 shows also
anomalous crystal size and pore distribution.
The TPO analysis, carried out after the TPR (Fig. 3. 55), shows the shift of the
oxidation peak, moving from the fresh samples to the sample N°1, and a general
increase of the temperature of the oxidation, going down trough the catalytic bed.
In particular, the decrease is very clear form the sample N° 1 to the sample N° 5,
in which peaks at high temperature appear. Sample N° 9 is again anomalous
having a large oxidation peak at higher temperature while the sample N° 13 and
16 have a more complex pattern with an increase of the oxidation temperature
might due to the presence of different Ni species.
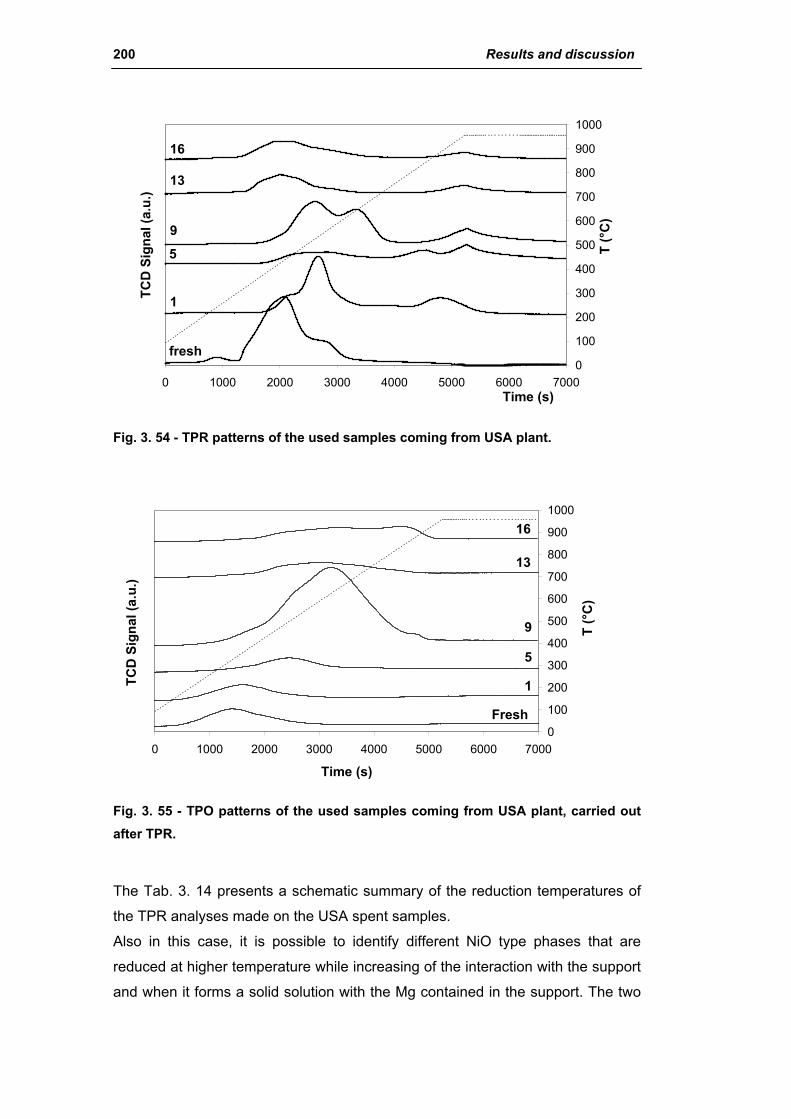
200 Results and discussion
0 1000 2000 3000 4000 5000 6000 7000Time (s)
TCD
Sig
nal (
a.u.
)
0
100
200
300
400
500
600
700
800
900
1000
T (°
C)
fresh
1
5
13
16
9
Fig. 3. 54 - TPR patterns of the used samples coming from USA plant.
0 1000 2000 3000 4000 5000 6000 7000
Time (s)
TCD
Sig
nal (
a.u.
)
0
100
200
300
400
500
600
700
800
900
1000
T (°
C)
Fresh
1
5
9
16
13
Fig. 3. 55 - TPO patterns of the used samples coming from USA plant, carried out after TPR.
The Tab. 3. 14 presents a schematic summary of the reduction temperatures of
the TPR analyses made on the USA spent samples.
Also in this case, it is possible to identify different NiO type phases that are
reduced at higher temperature while increasing of the interaction with the support
and when it forms a solid solution with the Mg contained in the support. The two
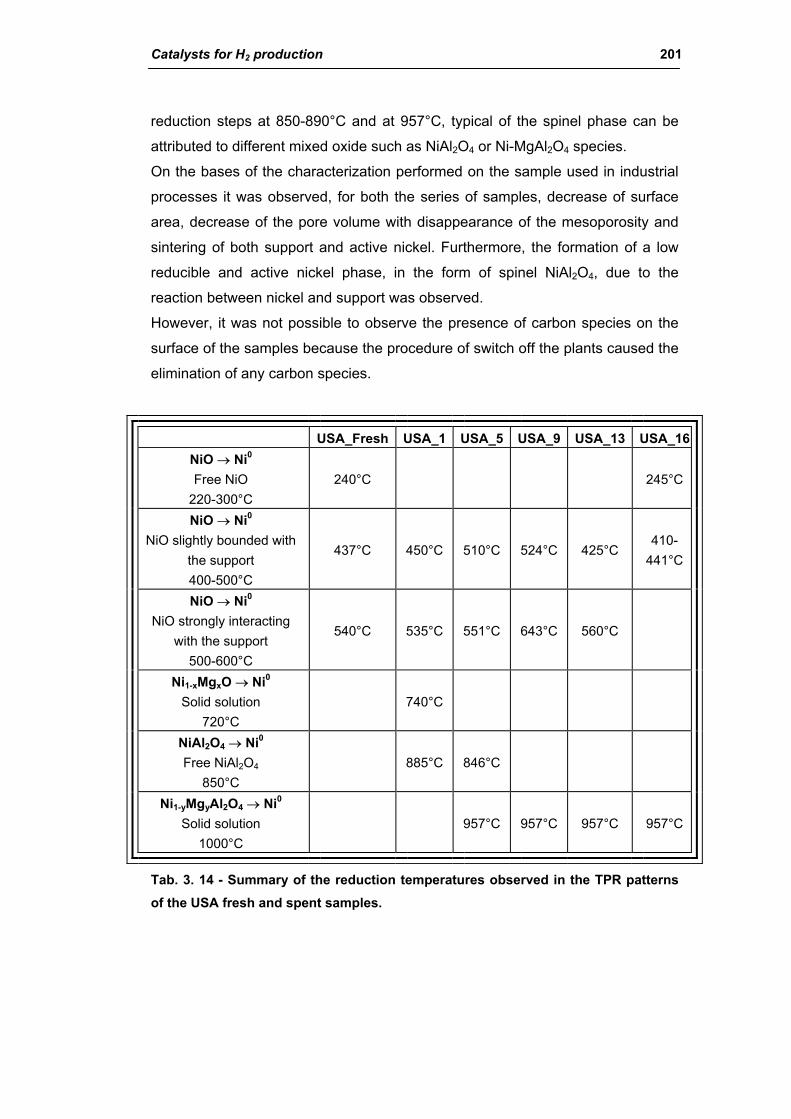
Catalysts for H2 production 201
reduction steps at 850-890°C and at 957°C, typical of the spinel phase can be
attributed to different mixed oxide such as NiAl2O4 or Ni-MgAl2O4 species.
On the bases of the characterization performed on the sample used in industrial
processes it was observed, for both the series of samples, decrease of surface
area, decrease of the pore volume with disappearance of the mesoporosity and
sintering of both support and active nickel. Furthermore, the formation of a low
reducible and active nickel phase, in the form of spinel NiAl2O4, due to the
reaction between nickel and support was observed.
However, it was not possible to observe the presence of carbon species on the
surface of the samples because the procedure of switch off the plants caused the
elimination of any carbon species.
USA_Fresh USA_1 USA_5 USA_9 USA_13 USA_16NiO → Ni0 Free NiO
220-300°C 240°C 245°C
NiO → Ni0 NiO slightly bounded with
the support 400-500°C
437°C 450°C 510°C 524°C 425°C 410-
441°C
NiO → Ni0 NiO strongly interacting
with the support 500-600°C
540°C 535°C 551°C 643°C 560°C
Ni1-xMgxO → Ni0 Solid solution
720°C 740°C
NiAl2O4 → Ni0 Free NiAl2O4
850°C 885°C 846°C
Ni1-yMgyAl2O4 → Ni0 Solid solution
1000°C 957°C 957°C 957°C 957°C
Tab. 3. 14 - Summary of the reduction temperatures observed in the TPR patterns of the USA fresh and spent samples.
202 Results and discussion
3.1.3. Activity of industrial spent samples
The fresh (13 % Ni/MgAl2O4) and some used samples have been tested in the
laboratory steam reforming plant to study the effect on the activity of the
deactivation, observed along the catalytic tube.
For the catalytic tests, three used samples coming from the Portugal plant were
chosen: Port-1 from the top, Port-7 from middle and Port-13 from bottom of the
catalytic tube. Similarly, two USA used samples were selected: USA-1 from top
and USA-16 from bottom of the tube.
The catalytic tests were carried out loading 10 ml of pellets of 14-20 mesh that
occupy 10 cm of catalytic bed. The tests were carried out using the following
reaction conditions:
• P = 10 bar
• S/C = 1.7 & 2.5
• CT = 1 s
• Tout = 870 & 950°C
In all the reaction conditions and for all the samples, the activity trend observed is
quite stable during all the duration of the tests (8 h).
The activity of the fresh sample will be presented completely to give an
exhaustive description of the behavior in different conditions, while for the used
samples, only the comparison of the results will be shown.
Using the fresh sample, the methane conversion (Tab. 3. 15) is lower than that of
the thermodynamic prediction (Fig. 3. 56). However, it can be seen that,
increasing the S/C ratio and the temperature, the performances of the samples is
enhanced, as expected by the thermodynamic prediction. Furthermore, the CO
selectivity decrease with the increase of water content in the feed due to the
enhanced water gas shift reaction promoted by this reactant, while the increase
of the temperature leads to an opposite effect. In fact it is well-known that the
WGS reaction is favored at low temperature and the contribution of this reaction
to the H2 formation is lower at higher temperature where the reverse reaction is
favored. The excess of water and the temperature affect the H2/CO ratio, that is,
in all the reaction conditions, higher than 3 (as expected only by the SR reaction).
Increasing the S/C ratio from 1.7 to 2.5, whatever the temperature is, the
obtained H2/CO ratio increases due to the promotion of the WGS reaction.
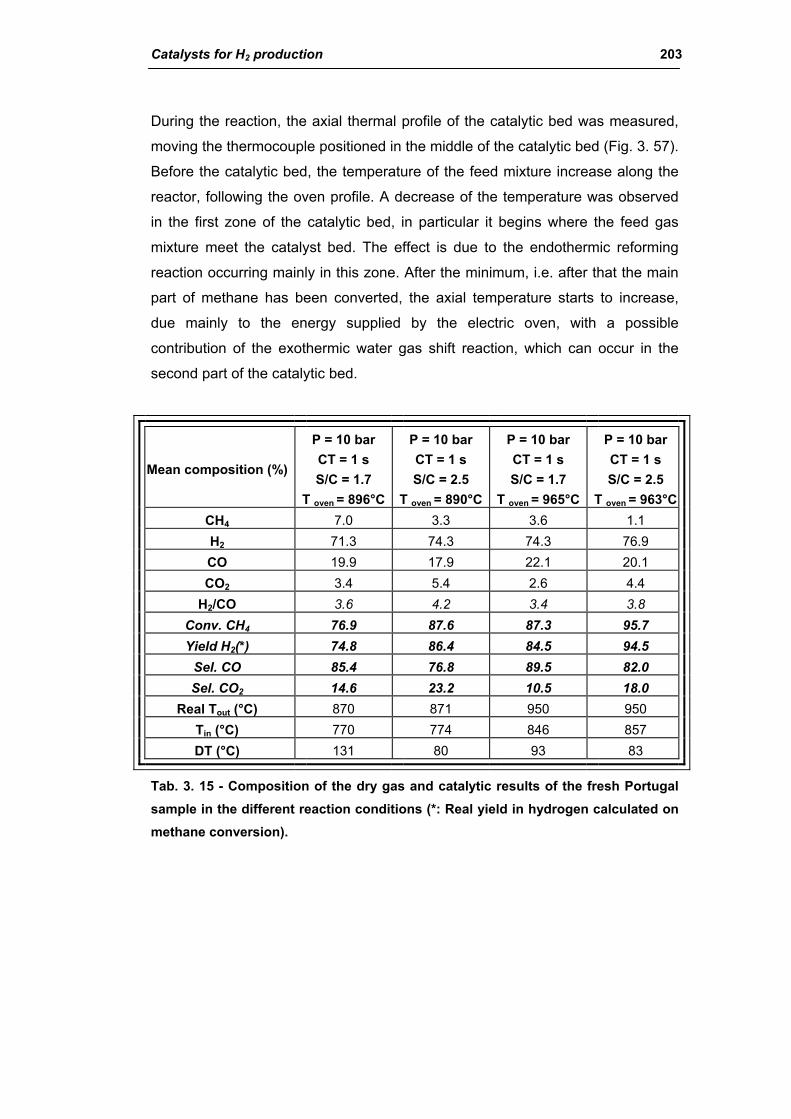
Catalysts for H2 production 203
During the reaction, the axial thermal profile of the catalytic bed was measured,
moving the thermocouple positioned in the middle of the catalytic bed (Fig. 3. 57).
Before the catalytic bed, the temperature of the feed mixture increase along the
reactor, following the oven profile. A decrease of the temperature was observed
in the first zone of the catalytic bed, in particular it begins where the feed gas
mixture meet the catalyst bed. The effect is due to the endothermic reforming
reaction occurring mainly in this zone. After the minimum, i.e. after that the main
part of methane has been converted, the axial temperature starts to increase,
due mainly to the energy supplied by the electric oven, with a possible
contribution of the exothermic water gas shift reaction, which can occur in the
second part of the catalytic bed.
Mean composition (%)
P = 10 bar CT = 1 s S/C = 1.7
T oven = 896°C
P = 10 bar CT = 1 s S/C = 2.5
T oven = 890°C
P = 10 bar CT = 1 s S/C = 1.7
T oven = 965°C
P = 10 bar CT = 1 s S/C = 2.5
T oven = 963°CCH4 7.0 3.3 3.6 1.1 H2 71.3 74.3 74.3 76.9 CO 19.9 17.9 22.1 20.1 CO2 3.4 5.4 2.6 4.4
H2/CO 3.6 4.2 3.4 3.8 Conv. CH4 76.9 87.6 87.3 95.7 Yield H2(*) 74.8 86.4 84.5 94.5
Sel. CO 85.4 76.8 89.5 82.0 Sel. CO2 14.6 23.2 10.5 18.0
Real Tout (°C) 870 871 950 950 Tin (°C) 770 774 846 857 DT (°C) 131 80 93 83
Tab. 3. 15 - Composition of the dry gas and catalytic results of the fresh Portugal sample in the different reaction conditions (*: Real yield in hydrogen calculated on methane conversion).
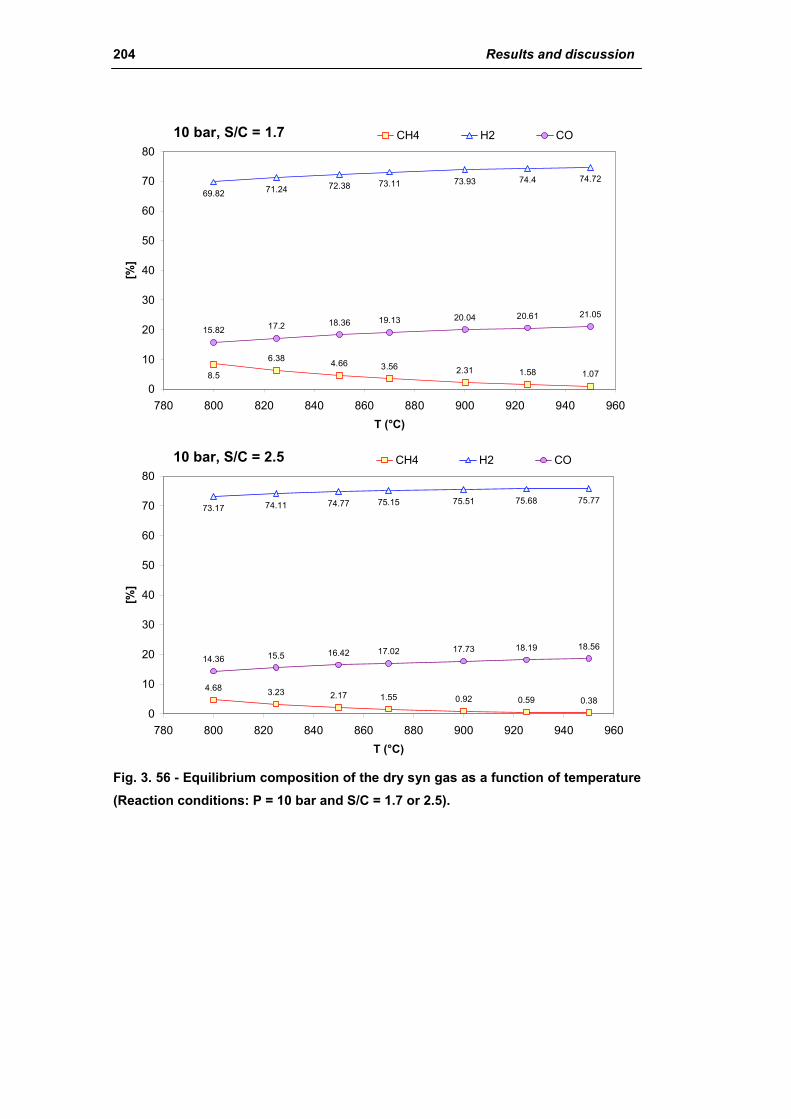
204 Results and discussion
10 bar, S/C = 1.7
6.38 4.66 3.56 2.31 1.58 1.07
69.82 71.24 72.38 73.93 74.4 74.72
15.82 17.2 18.36 19.13 20.04 20.61 21.05
8.5
73.11
0
10
20
30
40
50
60
70
80
780 800 820 840 860 880 900 920 940 960T (°C)
[%]
CH4 H2 CO
10 bar, S/C = 2.5
3.23 2.17 1.55 0.92 0.59 0.38
73.17 74.11 74.77 75.51 75.68 75.77
14.36 15.5 16.42 17.02 17.73 18.19 18.56
4.68
75.15
0
10
20
30
40
50
60
70
80
780 800 820 840 860 880 900 920 940 960T (°C)
[%]
CH4 H2 CO
Fig. 3. 56 - Equilibrium composition of the dry syn gas as a function of temperature (Reaction conditions: P = 10 bar and S/C = 1.7 or 2.5).
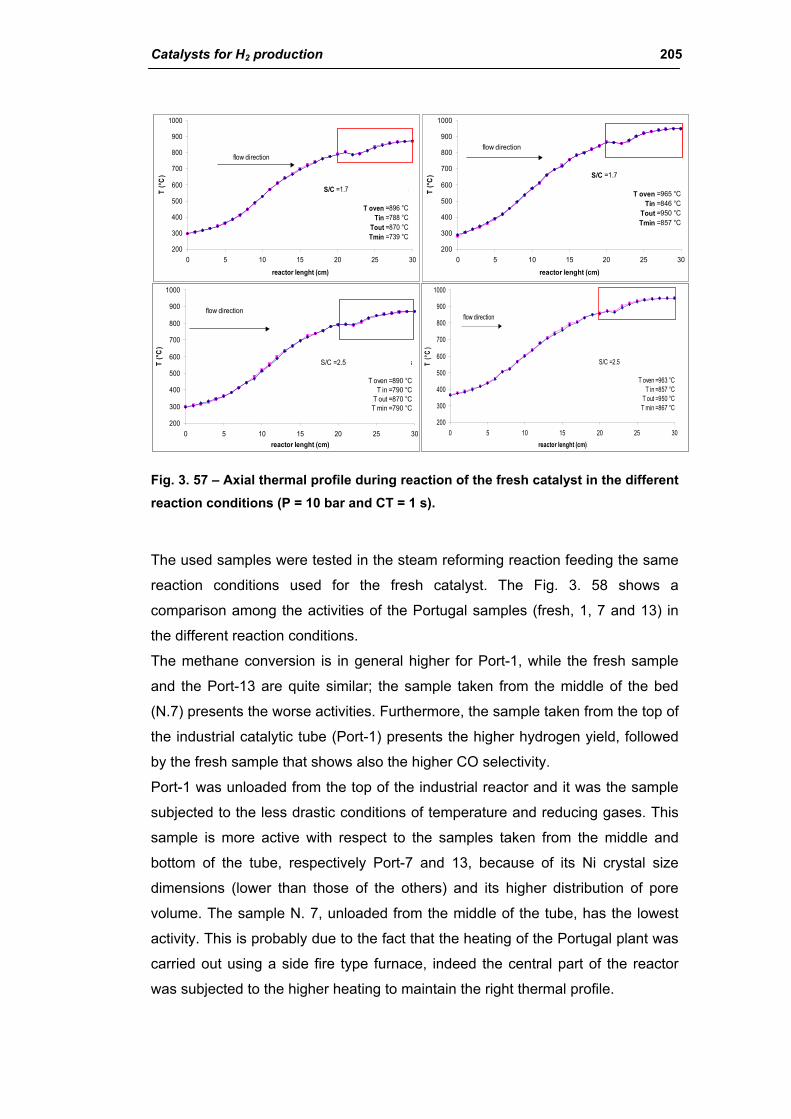
Catalysts for H2 production 205
R 67-7H (PORT FRESH)
200
300
400
500
600
700
800
900
1000
0 5 10 15 20 25 30
reactor lenght (cm)
T (°C
)
S/C =1.7 P =10 atm CT = 4s
T oven =896 °CTin =788 °C
Tout =870 °CTmin =739 °C
flow direction
R 67-7H (PORT FRESH)
200
300
400
500
600
700
800
900
1000
0 5 10 15 20 25 30
reactor lenght (cm)
T (°C
) S/C =1.7 P =10 atm CT = 4s
T oven =965 °CTin =846 °C
Tout =950 °CTmin =857 °C
flow direction
R 67-7H 8PORT FRESH)
200
300
400
500
600
700
800
900
1000
0 5 10 15 20 25 30reactor lenght (cm)
T (°C
)
S/C =2.5 P =10 atm CT = 4s
T oven =890 °CT in =790 °C
T out =870 °CT min =790 °C
flow direction
R 67-7H (PORT FRESH)
200
300
400
500
600
700
800
900
1000
0 5 10 15 20 25 30reactor lenght (cm)
T (°C
)
S/C =2.5 P =10 atm CT = 4s
T oven =963 °CT in =857 °C
T out =950 °CT min =867 °C
flow direction
R 67-7H (PORT FRESH)
200
300
400
500
600
700
800
900
1000
0 5 10 15 20 25 30
reactor lenght (cm)
T (°C
)
S/C =1.7 P =10 atm CT = 4s
T oven =896 °CTin =788 °C
Tout =870 °CTmin =739 °C
flow direction
R 67-7H (PORT FRESH)
200
300
400
500
600
700
800
900
1000
0 5 10 15 20 25 30
reactor lenght (cm)
T (°C
) S/C =1.7 P =10 atm CT = 4s
T oven =965 °CTin =846 °C
Tout =950 °CTmin =857 °C
flow direction
R 67-7H 8PORT FRESH)
200
300
400
500
600
700
800
900
1000
0 5 10 15 20 25 30reactor lenght (cm)
T (°C
)
S/C =2.5 P =10 atm CT = 4s
T oven =890 °CT in =790 °C
T out =870 °CT min =790 °C
flow direction
R 67-7H (PORT FRESH)
200
300
400
500
600
700
800
900
1000
0 5 10 15 20 25 30reactor lenght (cm)
T (°C
)
S/C =2.5 P =10 atm CT = 4s
T oven =963 °CT in =857 °C
T out =950 °CT min =867 °C
flow direction
Fig. 3. 57 – Axial thermal profile during reaction of the fresh catalyst in the different reaction conditions (P = 10 bar and CT = 1 s).
The used samples were tested in the steam reforming reaction feeding the same
reaction conditions used for the fresh catalyst. The Fig. 3. 58 shows a
comparison among the activities of the Portugal samples (fresh, 1, 7 and 13) in
the different reaction conditions.
The methane conversion is in general higher for Port-1, while the fresh sample
and the Port-13 are quite similar; the sample taken from the middle of the bed
(N.7) presents the worse activities. Furthermore, the sample taken from the top of
the industrial catalytic tube (Port-1) presents the higher hydrogen yield, followed
by the fresh sample that shows also the higher CO selectivity.
Port-1 was unloaded from the top of the industrial reactor and it was the sample
subjected to the less drastic conditions of temperature and reducing gases. This
sample is more active with respect to the samples taken from the middle and
bottom of the tube, respectively Port-7 and 13, because of its Ni crystal size
dimensions (lower than those of the others) and its higher distribution of pore
volume. The sample N. 7, unloaded from the middle of the tube, has the lowest
activity. This is probably due to the fact that the heating of the Portugal plant was
carried out using a side fire type furnace, indeed the central part of the reactor
was subjected to the higher heating to maintain the right thermal profile.
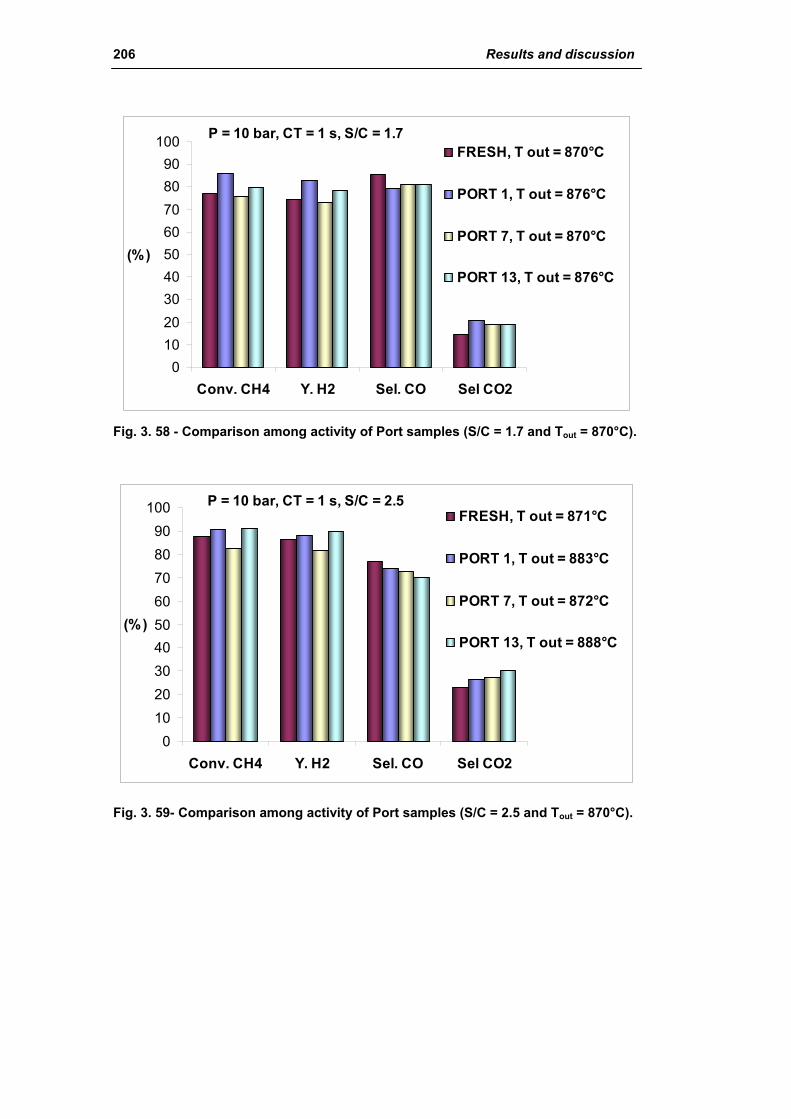
206 Results and discussion
P = 10 bar, CT = 1 s, S/C = 1.7
0102030405060708090
100
Conv. CH4 Y. H2 Sel. CO Sel CO2
(%)
FRESH, T out = 870°C
PORT 1, T out = 876°C
PORT 7, T out = 870°C
PORT 13, T out = 876°C
Fig. 3. 58 - Comparison among activity of Port samples (S/C = 1.7 and Tout = 870°C).
P = 10 bar, CT = 1 s, S/C = 2.5
0102030405060708090
100
Conv. CH4 Y. H2 Sel. CO Sel CO2
(%)
FRESH, T out = 871°C
PORT 1, T out = 883°C
PORT 7, T out = 872°C
PORT 13, T out = 888°C
Fig. 3. 59- Comparison among activity of Port samples (S/C = 2.5 and Tout = 870°C).

Catalysts for H2 production 207
P = 10 bar, CT = 1s, S/C = 1.7
0102030405060708090
100
Conv. CH4 Y. H2 Sel. CO Sel CO2
(%)
FRESH, T out = 950°C
PORT 1, T out = 951°C
PORT 7, T out = 952°C
PORT 13, T out = 950°C
Fig. 3. 60 - Comparison among activity of Port samples (S/C = 1.7 and Tout = 950°C).
P = 10 bar, CT = 1s, S/C = 2.5
0102030405060708090
100
Conv. CH4 Y. H2 Sel. CO Sel CO2
(%)
FRESH, T out = 950°C
PORT 1, T out = 958°C
PORT 7, T out = 950°C
PORT 13, T out = 956°C
Fig. 3. 61 - Comparison among activity of Port samples (S/C = 2.5 and Tout = 950°C).
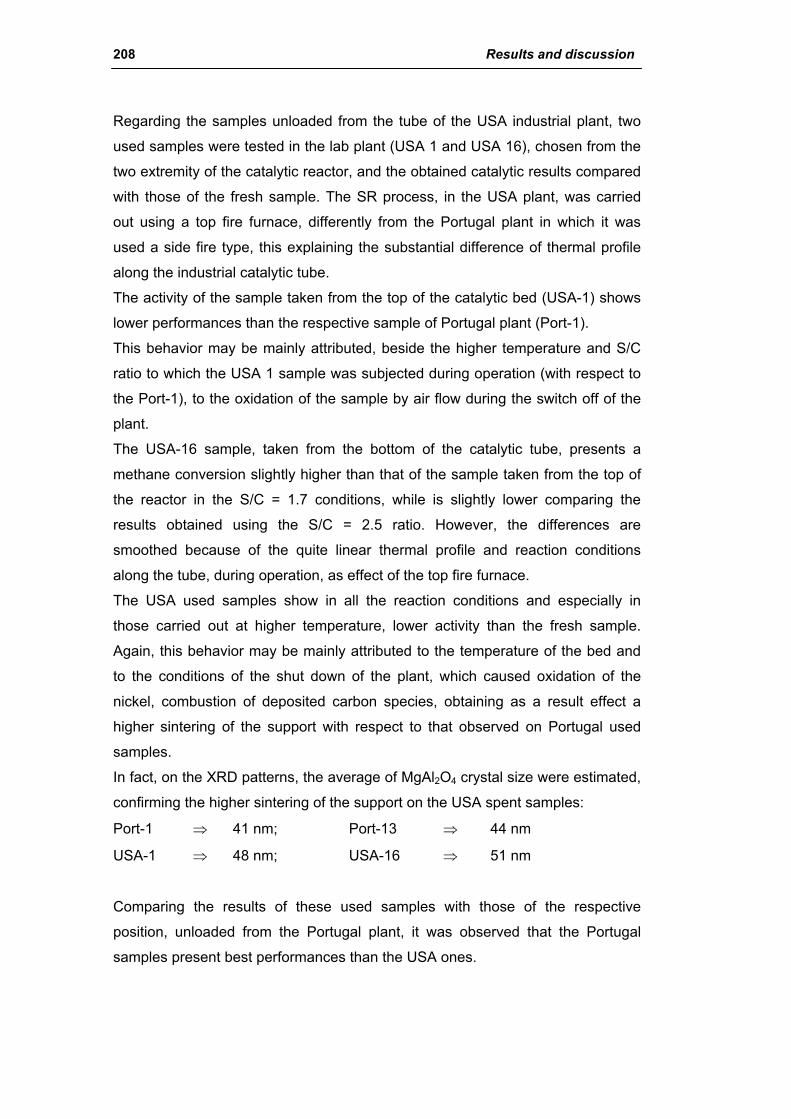
208 Results and discussion
Regarding the samples unloaded from the tube of the USA industrial plant, two
used samples were tested in the lab plant (USA 1 and USA 16), chosen from the
two extremity of the catalytic reactor, and the obtained catalytic results compared
with those of the fresh sample. The SR process, in the USA plant, was carried
out using a top fire furnace, differently from the Portugal plant in which it was
used a side fire type, this explaining the substantial difference of thermal profile
along the industrial catalytic tube.
The activity of the sample taken from the top of the catalytic bed (USA-1) shows
lower performances than the respective sample of Portugal plant (Port-1).
This behavior may be mainly attributed, beside the higher temperature and S/C
ratio to which the USA 1 sample was subjected during operation (with respect to
the Port-1), to the oxidation of the sample by air flow during the switch off of the
plant.
The USA-16 sample, taken from the bottom of the catalytic tube, presents a
methane conversion slightly higher than that of the sample taken from the top of
the reactor in the S/C = 1.7 conditions, while is slightly lower comparing the
results obtained using the S/C = 2.5 ratio. However, the differences are
smoothed because of the quite linear thermal profile and reaction conditions
along the tube, during operation, as effect of the top fire furnace.
The USA used samples show in all the reaction conditions and especially in
those carried out at higher temperature, lower activity than the fresh sample.
Again, this behavior may be mainly attributed to the temperature of the bed and
to the conditions of the shut down of the plant, which caused oxidation of the
nickel, combustion of deposited carbon species, obtaining as a result effect a
higher sintering of the support with respect to that observed on Portugal used
samples.
In fact, on the XRD patterns, the average of MgAl2O4 crystal size were estimated,
confirming the higher sintering of the support on the USA spent samples:
Port-1 ⇒ 41 nm; Port-13 ⇒ 44 nm
USA-1 ⇒ 48 nm; USA-16 ⇒ 51 nm
Comparing the results of these used samples with those of the respective
position, unloaded from the Portugal plant, it was observed that the Portugal
samples present best performances than the USA ones.
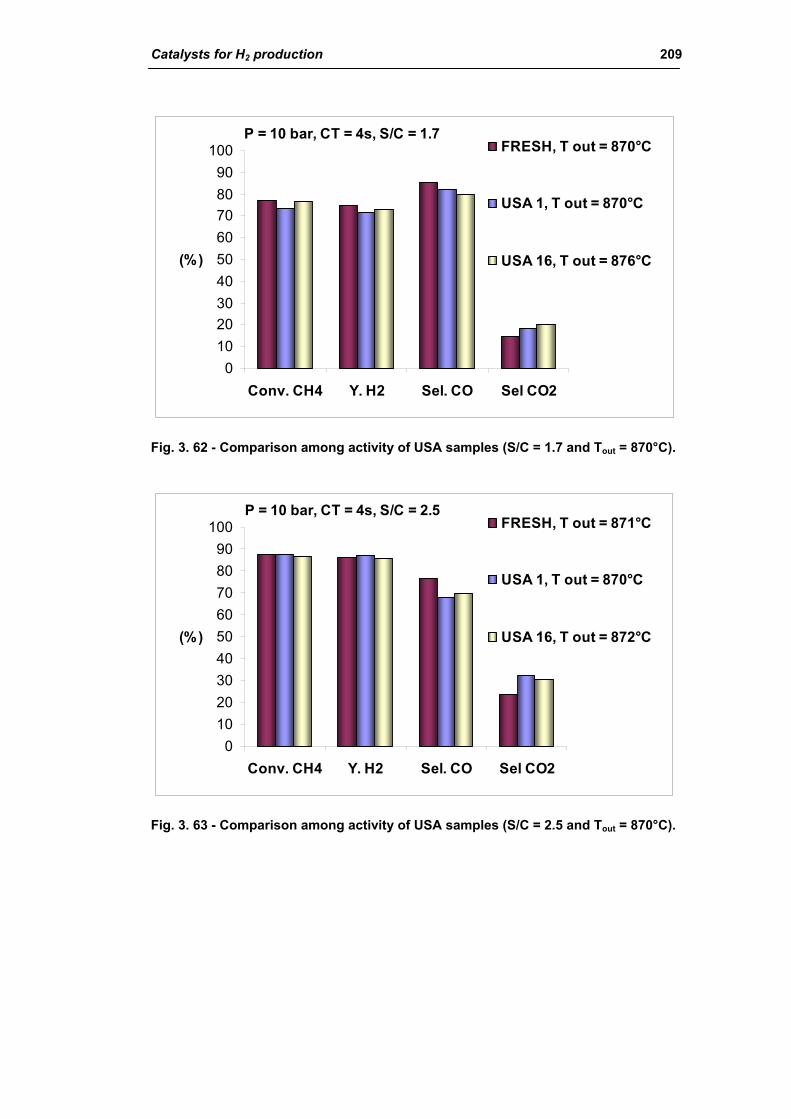
Catalysts for H2 production 209
P = 10 bar, CT = 4s, S/C = 1.7
0102030405060708090
100
Conv. CH4 Y. H2 Sel. CO Sel CO2
(%)
FRESH, T out = 870°C
USA 1, T out = 870°C
USA 16, T out = 876°C
Fig. 3. 62 - Comparison among activity of USA samples (S/C = 1.7 and Tout = 870°C).
P = 10 bar, CT = 4s, S/C = 2.5
0102030405060708090
100
Conv. CH4 Y. H2 Sel. CO Sel CO2
(%)
FRESH, T out = 871°C
USA 1, T out = 870°C
USA 16, T out = 872°C
Fig. 3. 63 - Comparison among activity of USA samples (S/C = 2.5 and Tout = 870°C).
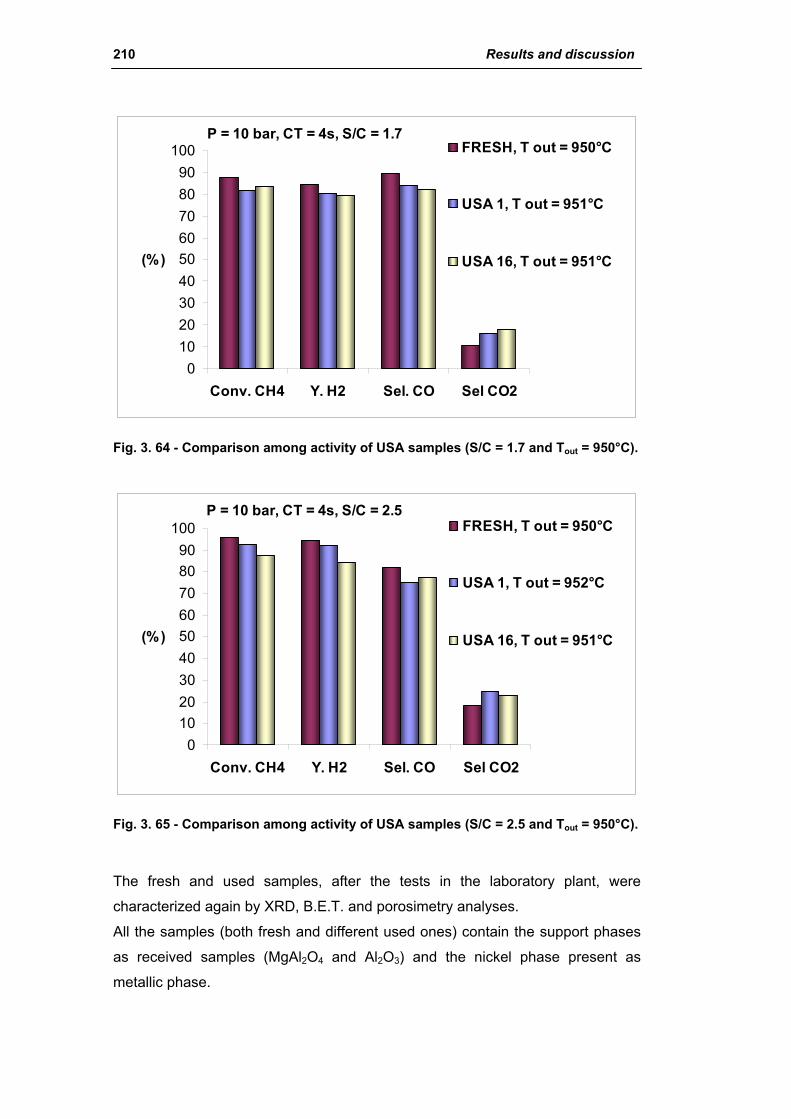
210 Results and discussion
P = 10 bar, CT = 4s, S/C = 1.7
0102030405060708090
100
Conv. CH4 Y. H2 Sel. CO Sel CO2
(%)
FRESH, T out = 950°C
USA 1, T out = 951°C
USA 16, T out = 951°C
Fig. 3. 64 - Comparison among activity of USA samples (S/C = 1.7 and Tout = 950°C).
P = 10 bar, CT = 4s, S/C = 2.5
0102030405060708090
100
Conv. CH4 Y. H2 Sel. CO Sel CO2
(%)
FRESH, T out = 950°C
USA 1, T out = 952°C
USA 16, T out = 951°C
Fig. 3. 65 - Comparison among activity of USA samples (S/C = 2.5 and Tout = 950°C).
The fresh and used samples, after the tests in the laboratory plant, were
characterized again by XRD, B.E.T. and porosimetry analyses.
All the samples (both fresh and different used ones) contain the support phases
as received samples (MgAl2O4 and Al2O3) and the nickel phase present as
metallic phase.
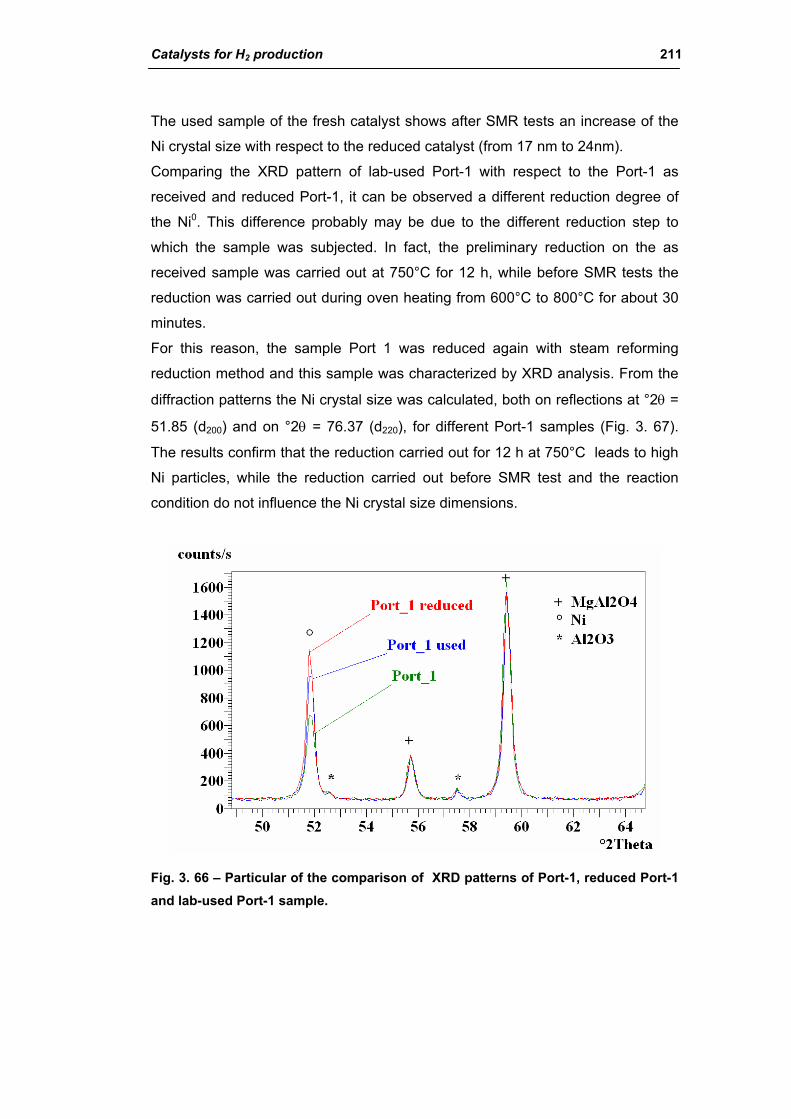
Catalysts for H2 production 211
The used sample of the fresh catalyst shows after SMR tests an increase of the
Ni crystal size with respect to the reduced catalyst (from 17 nm to 24nm).
Comparing the XRD pattern of lab-used Port-1 with respect to the Port-1 as
received and reduced Port-1, it can be observed a different reduction degree of
the Ni0. This difference probably may be due to the different reduction step to
which the sample was subjected. In fact, the preliminary reduction on the as
received sample was carried out at 750°C for 12 h, while before SMR tests the
reduction was carried out during oven heating from 600°C to 800°C for about 30
minutes.
For this reason, the sample Port 1 was reduced again with steam reforming
reduction method and this sample was characterized by XRD analysis. From the
diffraction patterns the Ni crystal size was calculated, both on reflections at °2θ =
51.85 (d200) and on °2θ = 76.37 (d220), for different Port-1 samples (Fig. 3. 67).
The results confirm that the reduction carried out for 12 h at 750°C leads to high
Ni particles, while the reduction carried out before SMR test and the reaction
condition do not influence the Ni crystal size dimensions.
Fig. 3. 66 – Particular of the comparison of XRD patterns of Port-1, reduced Port-1 and lab-used Port-1 sample.
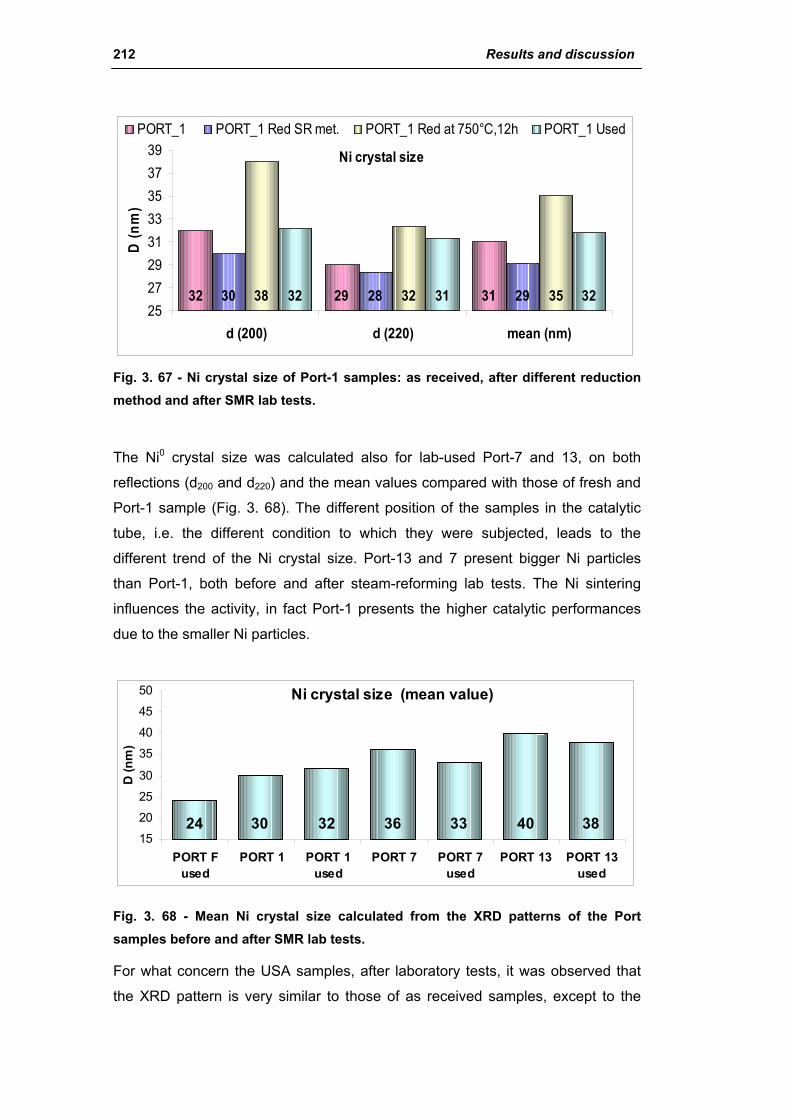
212 Results and discussion
Ni crystal size
32 3130 2938 32 3532 31 3229 282527293133353739
d (200) d (220) mean (nm)
D (n
m)
PORT_1 PORT_1 Red SR met. PORT_1 Red at 750°C,12h PORT_1 Used
Fig. 3. 67 - Ni crystal size of Port-1 samples: as received, after different reduction method and after SMR lab tests.
The Ni0 crystal size was calculated also for lab-used Port-7 and 13, on both
reflections (d200 and d220) and the mean values compared with those of fresh and
Port-1 sample (Fig. 3. 68). The different position of the samples in the catalytic
tube, i.e. the different condition to which they were subjected, leads to the
different trend of the Ni crystal size. Port-13 and 7 present bigger Ni particles
than Port-1, both before and after steam-reforming lab tests. The Ni sintering
influences the activity, in fact Port-1 presents the higher catalytic performances
due to the smaller Ni particles.
Ni crystal size (mean value)
24 30 32 36 33 40 3815
20
25
30
35
40
45
50
PORT Fused
PORT 1 PORT 1used
PORT 7 PORT 7used
PORT 13 PORT 13used
D (n
m)
Fig. 3. 68 - Mean Ni crystal size calculated from the XRD patterns of the Port samples before and after SMR lab tests.
For what concern the USA samples, after laboratory tests, it was observed that
the XRD pattern is very similar to those of as received samples, except to the
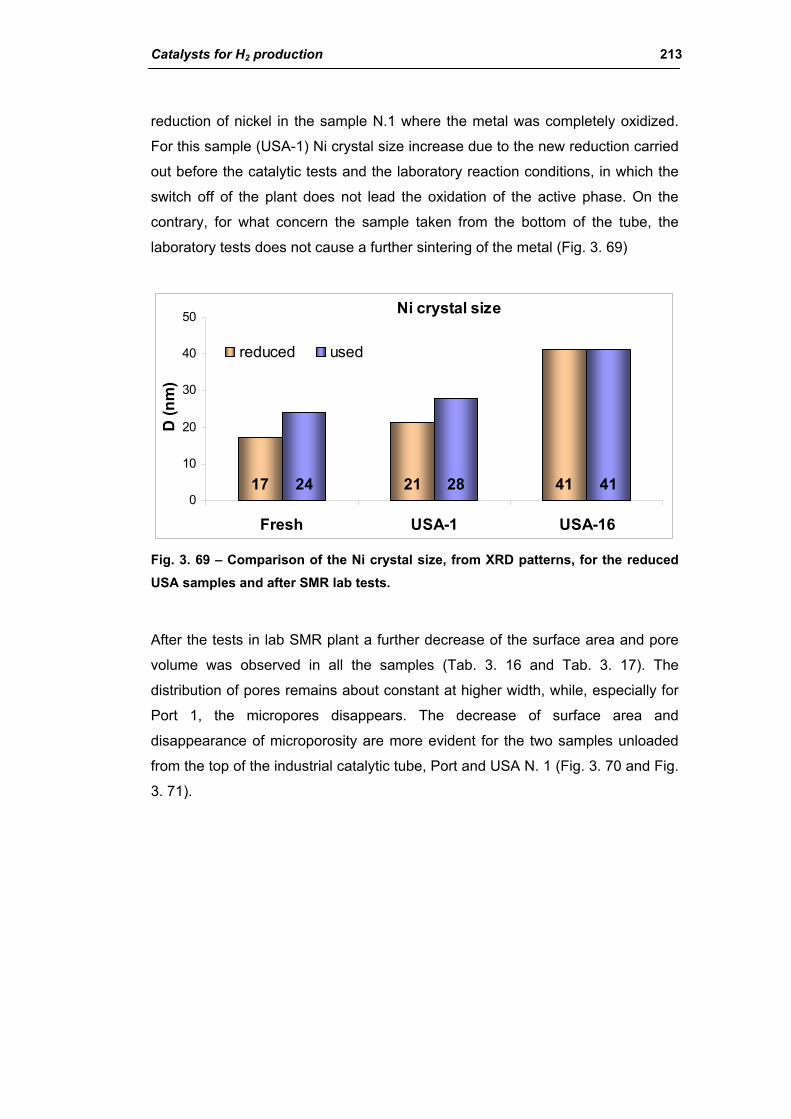
Catalysts for H2 production 213
reduction of nickel in the sample N.1 where the metal was completely oxidized.
For this sample (USA-1) Ni crystal size increase due to the new reduction carried
out before the catalytic tests and the laboratory reaction conditions, in which the
switch off of the plant does not lead the oxidation of the active phase. On the
contrary, for what concern the sample taken from the bottom of the tube, the
laboratory tests does not cause a further sintering of the metal (Fig. 3. 69)
Ni crystal size
17 21 4124 28 410
10
20
30
40
50
Fresh USA-1 USA-16
D (n
m)
reduced used
Fig. 3. 69 – Comparison of the Ni crystal size, from XRD patterns, for the reduced USA samples and after SMR lab tests.
After the tests in lab SMR plant a further decrease of the surface area and pore
volume was observed in all the samples (Tab. 3. 16 and Tab. 3. 17). The
distribution of pores remains about constant at higher width, while, especially for
Port 1, the micropores disappears. The decrease of surface area and
disappearance of microporosity are more evident for the two samples unloaded
from the top of the industrial catalytic tube, Port and USA N. 1 (Fig. 3. 70 and Fig.
3. 71).

214 Results and discussion
Fresh used
Port 1 used
Port 7 used
Port 13 used
Single Point Surface Area m2g-1 9.70 13.15 7.79 5.55 BET Surface Area m2g-1 9.98 13.76 8.01 5.71
t-plot micropore area m2g-1 1.46 1.01 1.18 0.83 t-plot micropore volume cm3g-1 0.000596 0.000266 0.000477 0.000334
BJH desorption cumulative volume of pores
cm3g-1 0.079673 0.156883 0.106209 0.047945
BLH desorption maximums pore widths
Å 22, 390 311 22, 555 570
BJH desorption average pore width (4V/A)
Å 308 402 502 346
Tab. 3. 16 - Surface area values and pores volume and width of the Portugal samples after lab tests.
Fresh used
USA-1 used
USA-16 used
Single Point Surface Area m2g-1 9.70 11.42 4.69
BET Surface Area m2g-1 9.98 11.78 4.88
t-plot micropore area m2g-1 1.46 1.49 0.37
t-plot micropore volume cm3g-1 0.000596 0.000576 0.000110
BJH desorption cumulative volume of pores
cm3g-1 0.079673 0.173532 0.035599
BLH desorption maximums pore widths
Å 22, 390 327 20, 38, 500-1000
BJH desorption average pore width (4V/A)
Å 308 488.960 303.517
Tab. 3. 17 - Surface area values and pores volume and width of the Portugal samples after lab tests.
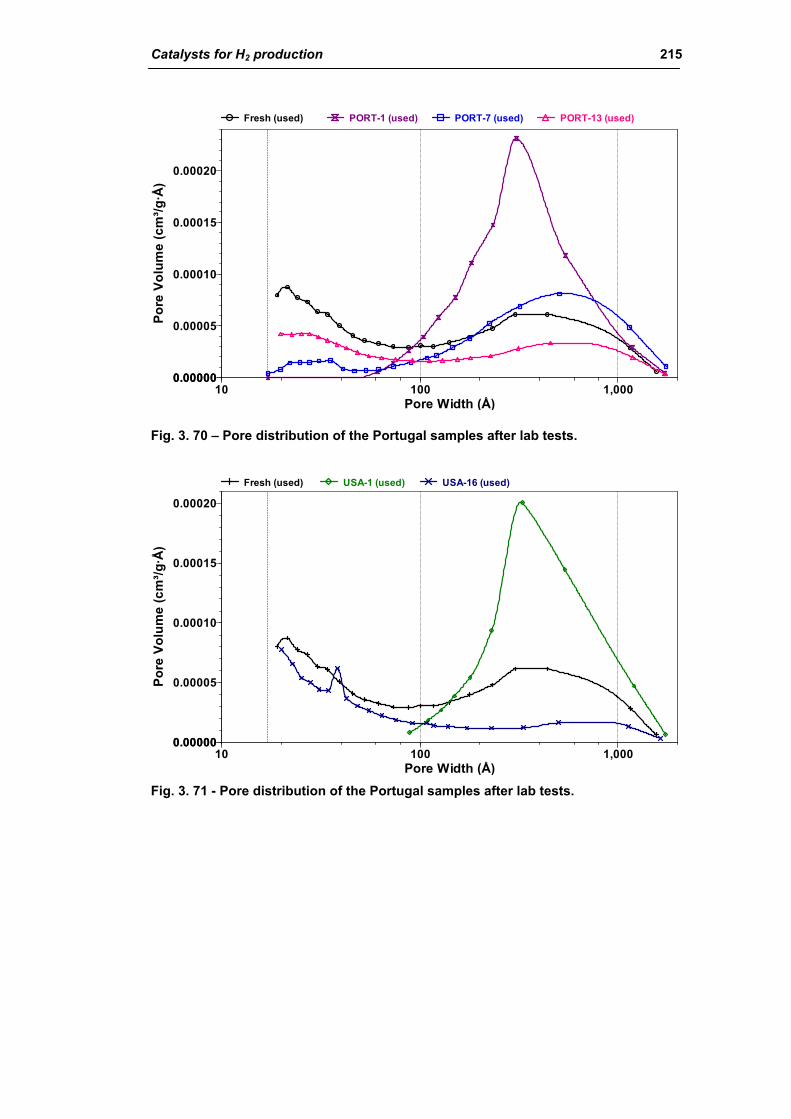
Catalysts for H2 production 215
Pore Width (Å)10 100 1,000
Pore
Vol
ume
(cm
³/g·Å
)
0.000000.00000
0.00005
0.00010
0.00015
0.00020
Fresh (used) PORT-1 (used) PORT-7 (used) PORT-13 (used)
Fig. 3. 70 – Pore distribution of the Portugal samples after lab tests.
Pore Width (Å)10 100 1,000
Pore
Vol
ume
(cm
³/g·Å
)
0.000000.00000
0.00005
0.00010
0.00015
0.00020
Fresh (used) USA-1 (used) USA-16 (used)
Fig. 3. 71 - Pore distribution of the Portugal samples after lab tests.
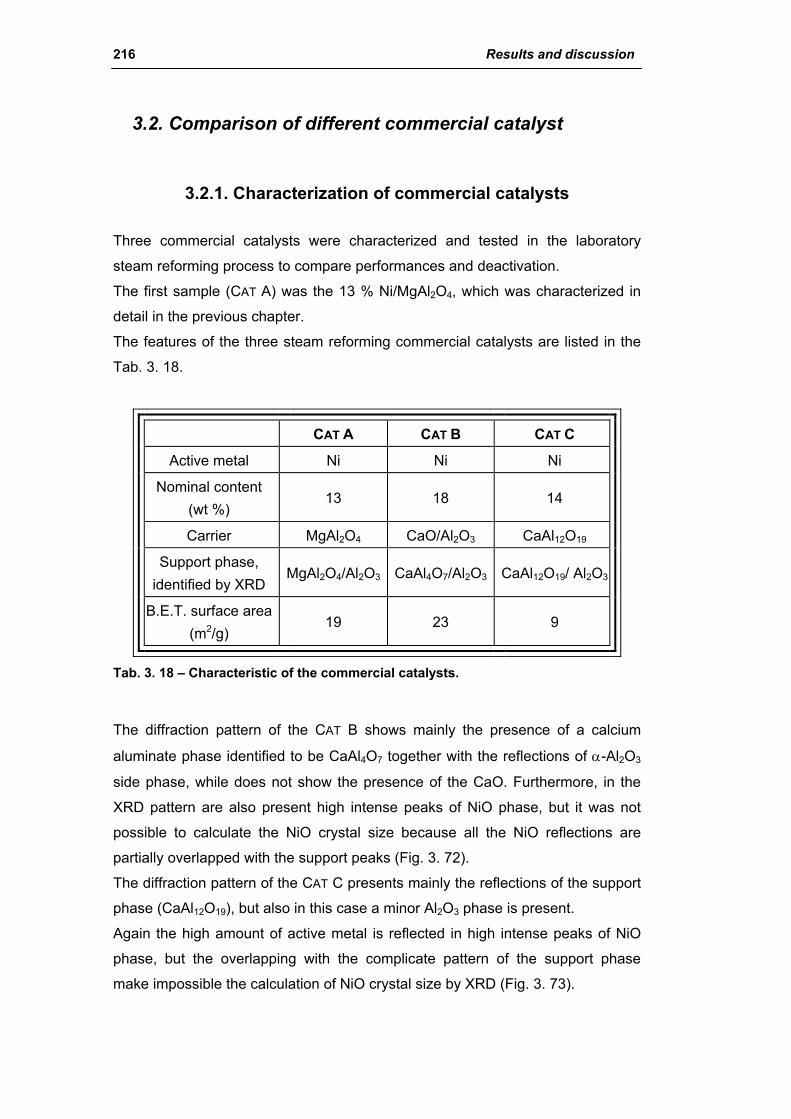
216 Results and discussion
3.2. Comparison of different commercial catalyst
3.2.1. Characterization of commercial catalysts
Three commercial catalysts were characterized and tested in the laboratory
steam reforming process to compare performances and deactivation.
The first sample (CAT A) was the 13 % Ni/MgAl2O4, which was characterized in
detail in the previous chapter.
The features of the three steam reforming commercial catalysts are listed in the
Tab. 3. 18.
CAT A CAT B CAT C
Active metal Ni Ni Ni
Nominal content (wt %)
13 18 14
Carrier MgAl2O4 CaO/Al2O3 CaAl12O19
Support phase, identified by XRD
MgAl2O4/Al2O3 CaAl4O7/Al2O3 CaAl12O19/ Al2O3
B.E.T. surface area (m2/g)
19 23 9
Tab. 3. 18 – Characteristic of the commercial catalysts.
The diffraction pattern of the CAT B shows mainly the presence of a calcium
aluminate phase identified to be CaAl4O7 together with the reflections of α-Al2O3
side phase, while does not show the presence of the CaO. Furthermore, in the
XRD pattern are also present high intense peaks of NiO phase, but it was not
possible to calculate the NiO crystal size because all the NiO reflections are
partially overlapped with the support peaks (Fig. 3. 72).
The diffraction pattern of the CAT C presents mainly the reflections of the support
phase (CaAl12O19), but also in this case a minor Al2O3 phase is present.
Again the high amount of active metal is reflected in high intense peaks of NiO
phase, but the overlapping with the complicate pattern of the support phase
make impossible the calculation of NiO crystal size by XRD (Fig. 3. 73).

Catalysts for H2 production 217
Fig. 3. 72 - XRD pattern of the sample CAT B (18 wt % Ni/CaAl4O7).
Fig. 3. 73 - XRD pattern of the CAT C sample (14 wt % Ni/CaAl12O19).
The TPR/O analyses were carried out on the three samples in order to identify
the better procedure of activation of the commercial catalysts before the
evaluation of the activity.
The CAT A showed three reduction steps occurring at 238, 440 and 538°C. The
main reduction occurs at 440°C and is related to NiO slightly bounded with the

218 Results and discussion
support; the reduction at lower temperature is related to free NiO, while that at
538°C NiO strongly interacting with the support (Fig. 3. 74).
TPR of CAT A
0
5000
10000
15000
20000
25000
30000
35000
40000
0 200 400 600 800T (°C)
Sign
al (m
V/g)
238°C
440°C
538°C
Fig. 3. 74 – TPR of CAT A.
Also for what concern the CAT B, the reduction of NiO to Ni0 occurs in three
steps, even if with respect to Cat A occurs at higher temperatures (Fig. 3. 75):
- at 450°C the reduction is assigned to NiO weakly interacting with the support;
- at 630°C the reduction is assigned to NiO strongly interacting with the support;
- at 755°C the reduction can be due to Ni partially soluted in the support in Ni/Al
oxide amorphous phase or inside the CaAl4O7 structure. The reduction at high
temperature cannot be attributed to crystalline NiAl2O4, because from the XRD
pattern there is no evidence of the presence of this phase.
TPR of CAT B
0
5000
10000
15000
20000
25000
30000
35000
40000
100 300 500 700 900T (°C)
Sign
al (m
V/g)
450°C
630°C
755°C
Fig. 3. 75 – TPR of CAT B.

Catalysts for H2 production 219
The TPR pattern of CAT C shows mainly the reduction step of the NiO to Ni0 at
440°C (i.e. NiO slightly bounded with the support). It is also present a shoulder at
higher temperature (at about 550°C) probably due to some NiO strongly
interacting with the support (Fig. 3. 76). The reduction profile of this sample is
similar to that of the Cat A, although the different support compositions.
TPR of CAT C
0
10000
20000
30000
40000
50000
60000
70000
80000
90000
100 300 500 700 900T (°C)
Sign
al (m
V/g)
440°C
550°C
Fig. 3. 76 – TPR of CAT C.
Industrial catalysts were analyzed by porosimetry analysis (Tab. 3. 19 and Fig. 3.
77). The results on CAT B sample show that it is bimodal and its pores distribution
is prevalently mesoporous, quite similar to the CAT A, even if the maximum width
is lower: about 118 Ǻ against 315 Ǻ of the CAT A.
Very different porosity was observed for CAT C catalyst, which presents the
lowest surface area and a predominant porosity at 20-40 Ǻ. This sample shows
much lower volume of pores with respect to the other commercial samples.
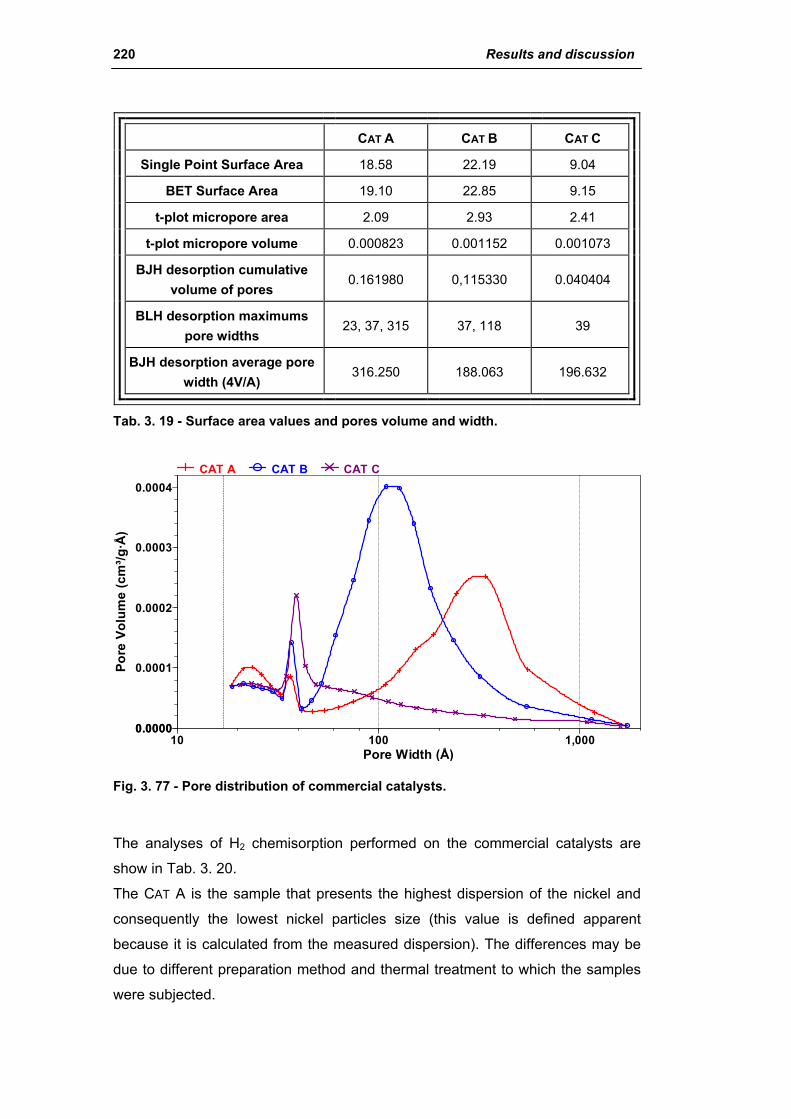
220 Results and discussion
CAT A CAT B CAT C
Single Point Surface Area 18.58 22.19 9.04
BET Surface Area 19.10 22.85 9.15
t-plot micropore area 2.09 2.93 2.41
t-plot micropore volume 0.000823 0.001152 0.001073
BJH desorption cumulative volume of pores
0.161980 0,115330 0.040404
BLH desorption maximums pore widths
23, 37, 315 37, 118 39
BJH desorption average pore width (4V/A)
316.250 188.063 196.632
Tab. 3. 19 - Surface area values and pores volume and width.
Pore Width (Å)10 100 1,000
Pore
Vol
ume
(cm
³/g·Å
)
0.00000.0000
0.0001
0.0002
0.0003
0.0004CAT A CAT B CAT C
Fig. 3. 77 - Pore distribution of commercial catalysts.
The analyses of H2 chemisorption performed on the commercial catalysts are
show in Tab. 3. 20.
The CAT A is the sample that presents the highest dispersion of the nickel and
consequently the lowest nickel particles size (this value is defined apparent
because it is calculated from the measured dispersion). The differences may be
due to different preparation method and thermal treatment to which the samples
were subjected.

Catalysts for H2 production 221
Ni Ni Dispersion MSAm Apparent crystallite size
wt % % m2/g metal nm
CAT A 13 4.8 32.0 21
CAT B 18 1.50 9.8 69
CAT C 14 0.66 4.4 154
Tab. 3. 20 - Results of the H2 chemisorption analyses on fresh commercial catalyst (MSAm = metallic surface area).
3.2.2. Effect of the operative parameter on the steam reforming reaction carried out in the laboratory plant
The SMR catalytic tests were performed on the three different commercial
catalysts using the following reaction conditions:
- P, Different pressure (10, 15 and 20 bar);
- S/C Different molar ratio between the reactant (1.7 or 2.5 mol/mol)
- T Different temperatures (Tout = 870 or 930°C)
- CT Different residence time (4, 2, 1 and 0.8 s)
- Vcat Different volume of catalyst (6, 10 or 12 ml)
The obtained results are shown only for the CAT A, in order to study the effect of
the condition parameters on the reaction in the laboratory scale plant.
To study the effect of the pressure and of the S/C ratio, CAT A (13 % Ni/MgAl2O4)
has been tested in the SMR plant loading 10 ml of pellets, dimension of 14-20
mesh, that occupy in height 10 cm of catalytic bed. The tests were carried out
using at P = 10, 15 and 20 bar, S/C = 1.7 & 2.5, CT = 1 s and Tout = 870 &
930°C.
To increase the pressure, the flows of feed gases (CH4 and H2O) were increased
to maintain the same reaction conditions. This leads to an increase of the heat
required by the reaction. To maintain the same outlet temperature, the oven
temperature was increased. As expected by thermodynamic prediction (Fig. 3.
78), the conversion decreases increasing the pressure (Fig. 3. 79), whatever the
other reaction parameters were. The pressure enhances the steam reforming
reaction but does not influence the water gas shift reaction.
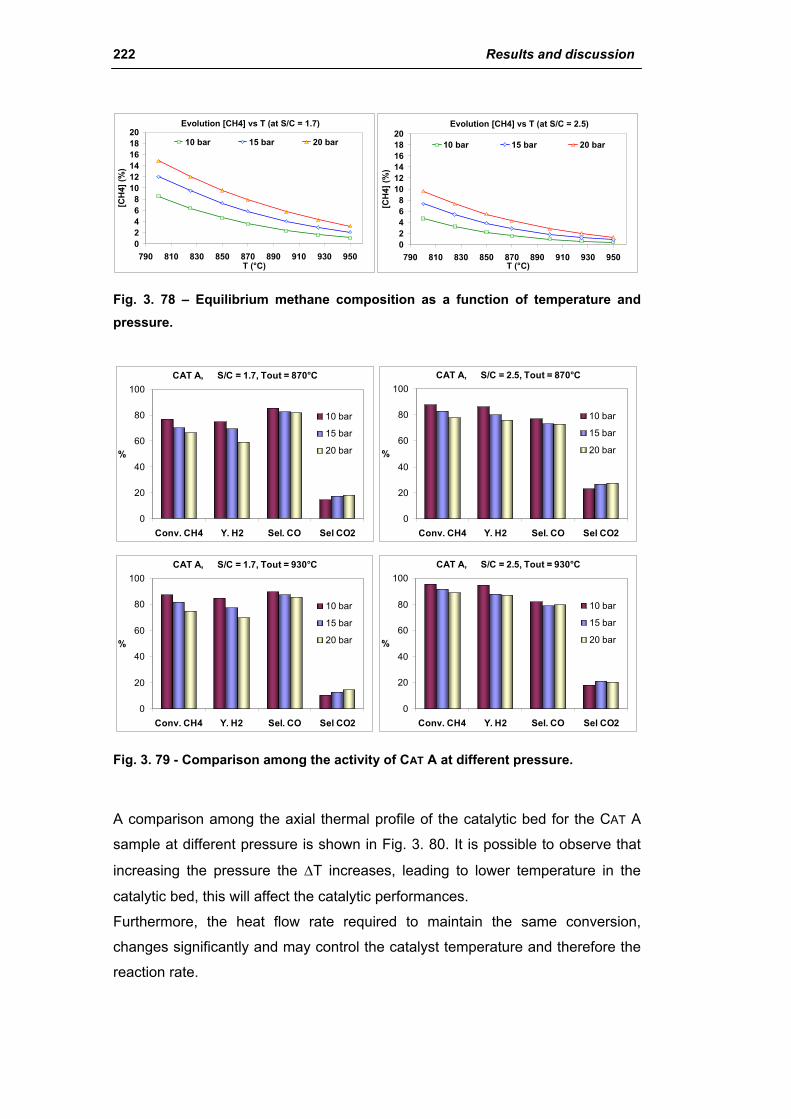
222 Results and discussion
Evolution [CH4] vs T (at S/C = 1.7)
02468
101214161820
790 810 830 850 870 890 910 930 950T (°C)
[CH
4] (%
)
10 bar 15 bar 20 bar
Evolution [CH4] vs T (at S/C = 2.5)
02468
101214161820
790 810 830 850 870 890 910 930 950T (°C)
[CH
4] (%
)
10 bar 15 bar 20 bar
Fig. 3. 78 – Equilibrium methane composition as a function of temperature and pressure.
CAT A, S/C = 1.7, Tout = 870°C
0
20
40
60
80
100
Conv. CH4 Y. H2 Sel. CO Sel CO2
%
10 bar
15 bar
20 bar
CAT A, S/C = 2.5, Tout = 870°C
0
20
40
60
80
100
Conv. CH4 Y. H2 Sel. CO Sel CO2
%
10 bar
15 bar
20 bar
CAT A, S/C = 1.7, Tout = 930°C
0
20
40
60
80
100
Conv. CH4 Y. H2 Sel. CO Sel CO2
%
10 bar
15 bar
20 bar
CAT A, S/C = 2.5, Tout = 930°C
0
20
40
60
80
100
Conv. CH4 Y. H2 Sel. CO Sel CO2
%
10 bar
15 bar
20 bar
Fig. 3. 79 - Comparison among the activity of CAT A at different pressure.
A comparison among the axial thermal profile of the catalytic bed for the CAT A
sample at different pressure is shown in Fig. 3. 80. It is possible to observe that
increasing the pressure the ∆T increases, leading to lower temperature in the
catalytic bed, this will affect the catalytic performances.
Furthermore, the heat flow rate required to maintain the same conversion,
changes significantly and may control the catalyst temperature and therefore the
reaction rate.
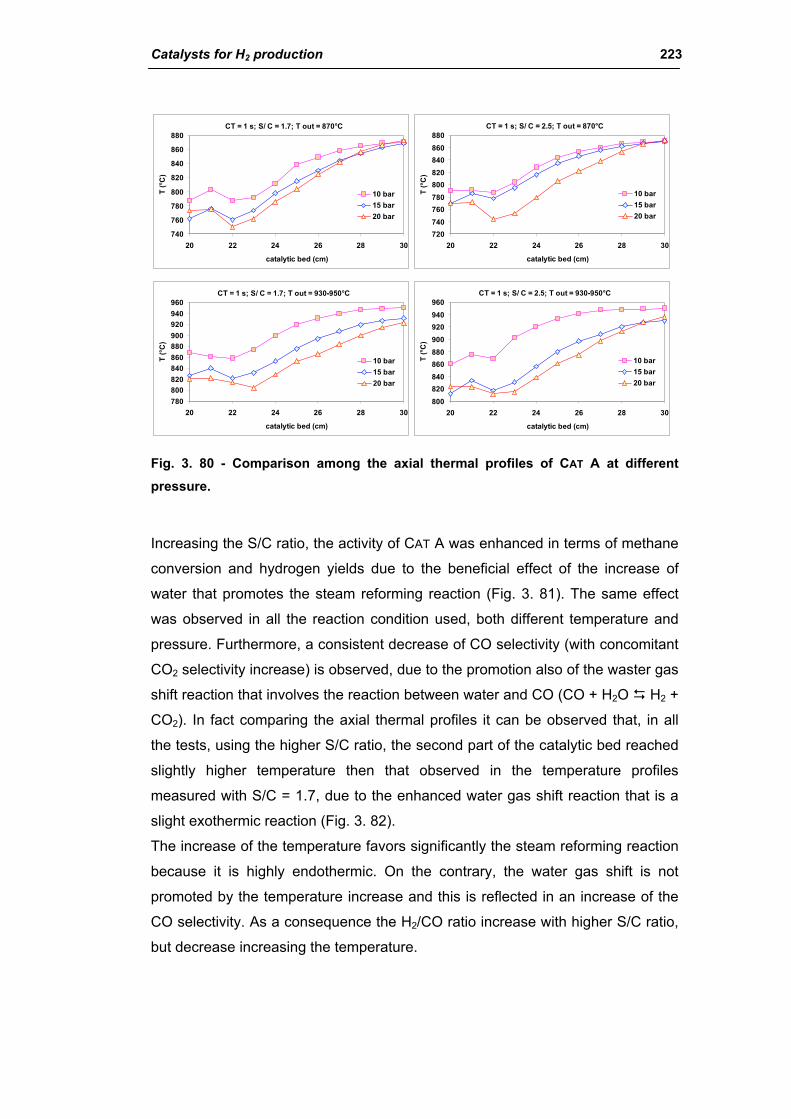
Catalysts for H2 production 223
CT = 1 s; S/ C = 1.7; T out = 870°C
740
760
780
800
820
840
860
880
20 22 24 26 28 30
catalytic bed (cm)
T (°C
)
10 bar15 bar20 bar
CT = 1 s; S/ C = 2.5; T out = 870°C
720740760780800820840860880
20 22 24 26 28 30
catalytic bed (cm)
T (°
C)
10 bar15 bar20 bar
CT = 1 s; S/ C = 1.7; T out = 930-950°C
780800820840860880900920940960
20 22 24 26 28 30
catalytic bed (cm)
T (°
C)
10 bar15 bar20 bar
CT = 1 s; S/ C = 2.5; T out = 930-950°C
800820840860880900920940960
20 22 24 26 28 30
catalytic bed (cm)T
(°C)
10 bar15 bar20 bar
Fig. 3. 80 - Comparison among the axial thermal profiles of CAT A at different pressure.
Increasing the S/C ratio, the activity of CAT A was enhanced in terms of methane
conversion and hydrogen yields due to the beneficial effect of the increase of
water that promotes the steam reforming reaction (Fig. 3. 81). The same effect
was observed in all the reaction condition used, both different temperature and
pressure. Furthermore, a consistent decrease of CO selectivity (with concomitant
CO2 selectivity increase) is observed, due to the promotion also of the waster gas
shift reaction that involves the reaction between water and CO (CO + H2O H2 +
CO2). In fact comparing the axial thermal profiles it can be observed that, in all
the tests, using the higher S/C ratio, the second part of the catalytic bed reached
slightly higher temperature then that observed in the temperature profiles
measured with S/C = 1.7, due to the enhanced water gas shift reaction that is a
slight exothermic reaction (Fig. 3. 82).
The increase of the temperature favors significantly the steam reforming reaction
because it is highly endothermic. On the contrary, the water gas shift is not
promoted by the temperature increase and this is reflected in an increase of the
CO selectivity. As a consequence the H2/CO ratio increase with higher S/C ratio,
but decrease increasing the temperature.
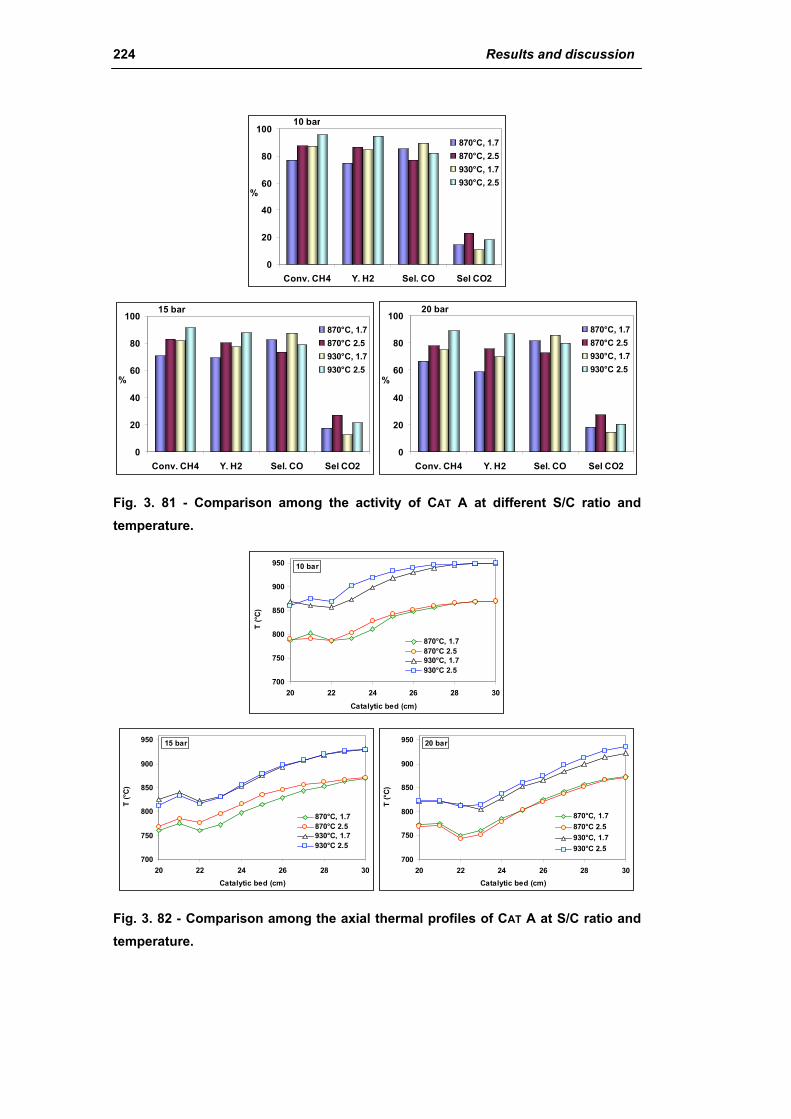
224 Results and discussion
0
20
40
60
80
100
Conv. CH4 Y. H2 Sel. CO Sel CO2
%
870°C, 1.7870°C, 2.5930°C, 1.7930°C, 2.5
10 bar
0
20
40
60
80
100
Conv. CH4 Y. H2 Sel. CO Sel CO2
%
870°C, 1.7870°C 2.5930°C, 1.7930°C 2.5
15 bar
0
20
40
60
80
100
Conv. CH4 Y. H2 Sel. CO Sel CO2
%
870°C, 1.7870°C 2.5930°C, 1.7930°C 2.5
20 bar
Fig. 3. 81 - Comparison among the activity of CAT A at different S/C ratio and temperature.
700
750
800
850
900
950
20 22 24 26 28 30
Catalytic bed (cm)
T (°C
)
870°C, 1.7870°C 2.5930°C, 1.7930°C 2.5
10 bar
700
750
800
850
900
950
20 22 24 26 28 30Catalytic bed (cm)
T (°C
)
870°C, 1.7870°C 2.5930°C, 1.7930°C 2.5
15 bar
700
750
800
850
900
950
20 22 24 26 28 30Catalytic bed (cm)
T (°C
)
870°C, 1.7870°C 2.5930°C, 1.7930°C 2.5
20 bar
Fig. 3. 82 - Comparison among the axial thermal profiles of CAT A at S/C ratio and temperature.
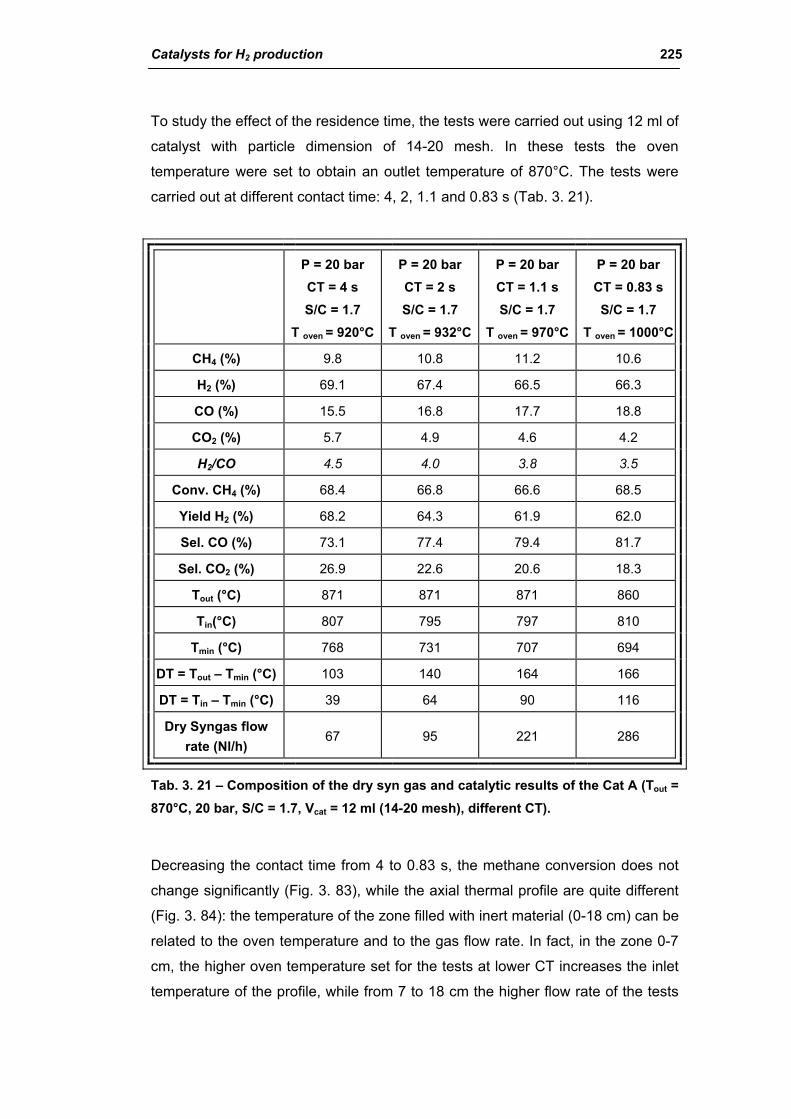
Catalysts for H2 production 225
To study the effect of the residence time, the tests were carried out using 12 ml of
catalyst with particle dimension of 14-20 mesh. In these tests the oven
temperature were set to obtain an outlet temperature of 870°C. The tests were
carried out at different contact time: 4, 2, 1.1 and 0.83 s (Tab. 3. 21).
P = 20 bar CT = 4 s S/C = 1.7
T oven = 920°C
P = 20 bar CT = 2 s S/C = 1.7
T oven = 932°C
P = 20 bar CT = 1.1 s S/C = 1.7
T oven = 970°C
P = 20 bar CT = 0.83 s S/C = 1.7
T oven = 1000°C
CH4 (%) 9.8 10.8 11.2 10.6
H2 (%) 69.1 67.4 66.5 66.3
CO (%) 15.5 16.8 17.7 18.8
CO2 (%) 5.7 4.9 4.6 4.2
H2/CO 4.5 4.0 3.8 3.5
Conv. CH4 (%) 68.4 66.8 66.6 68.5
Yield H2 (%) 68.2 64.3 61.9 62.0
Sel. CO (%) 73.1 77.4 79.4 81.7
Sel. CO2 (%) 26.9 22.6 20.6 18.3
Tout (°C) 871 871 871 860
Tin(°C) 807 795 797 810
Tmin (°C) 768 731 707 694
DT = Tout – Tmin (°C) 103 140 164 166
DT = Tin – Tmin (°C) 39 64 90 116
Dry Syngas flow rate (Nl/h)
67 95 221 286
Tab. 3. 21 – Composition of the dry syn gas and catalytic results of the Cat A (Tout = 870°C, 20 bar, S/C = 1.7, Vcat = 12 ml (14-20 mesh), different CT).
Decreasing the contact time from 4 to 0.83 s, the methane conversion does not
change significantly (Fig. 3. 83), while the axial thermal profile are quite different
(Fig. 3. 84): the temperature of the zone filled with inert material (0-18 cm) can be
related to the oven temperature and to the gas flow rate. In fact, in the zone 0-7
cm, the higher oven temperature set for the tests at lower CT increases the inlet
temperature of the profile, while from 7 to 18 cm the higher flow rate of the tests
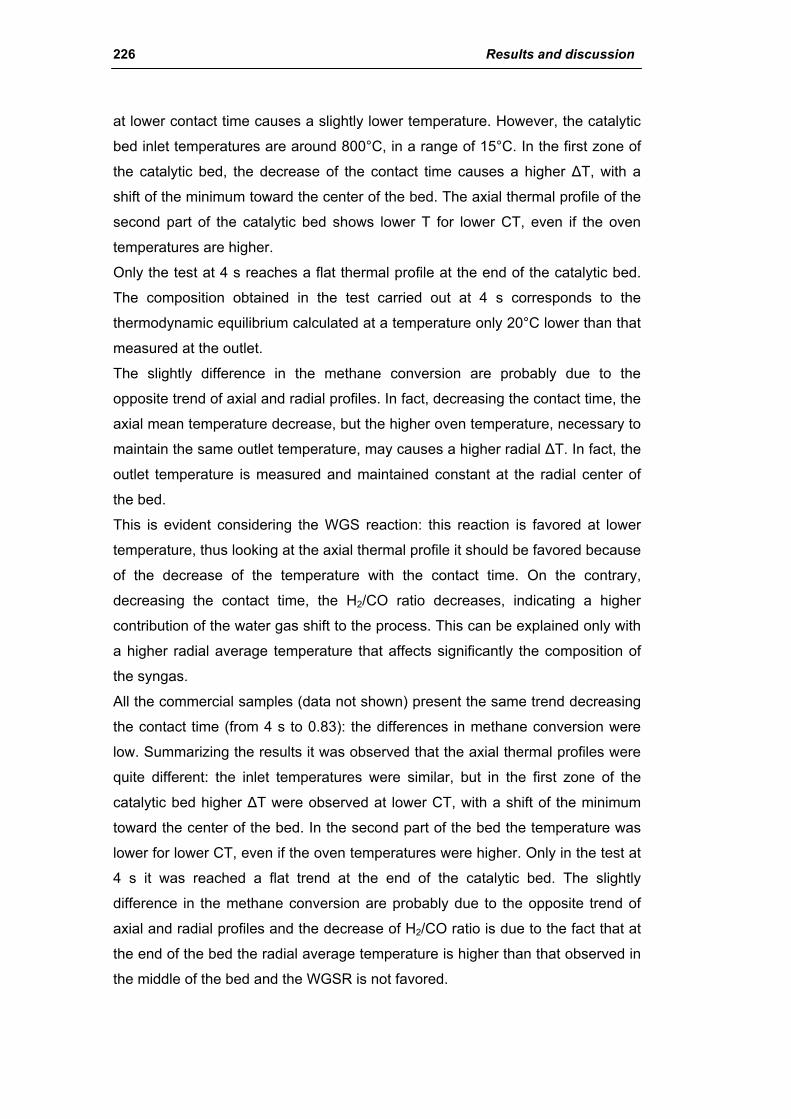
226 Results and discussion
at lower contact time causes a slightly lower temperature. However, the catalytic
bed inlet temperatures are around 800°C, in a range of 15°C. In the first zone of
the catalytic bed, the decrease of the contact time causes a higher ∆T, with a
shift of the minimum toward the center of the bed. The axial thermal profile of the
second part of the catalytic bed shows lower T for lower CT, even if the oven
temperatures are higher.
Only the test at 4 s reaches a flat thermal profile at the end of the catalytic bed.
The composition obtained in the test carried out at 4 s corresponds to the
thermodynamic equilibrium calculated at a temperature only 20°C lower than that
measured at the outlet.
The slightly difference in the methane conversion are probably due to the
opposite trend of axial and radial profiles. In fact, decreasing the contact time, the
axial mean temperature decrease, but the higher oven temperature, necessary to
maintain the same outlet temperature, may causes a higher radial ∆T. In fact, the
outlet temperature is measured and maintained constant at the radial center of
the bed.
This is evident considering the WGS reaction: this reaction is favored at lower
temperature, thus looking at the axial thermal profile it should be favored because
of the decrease of the temperature with the contact time. On the contrary,
decreasing the contact time, the H2/CO ratio decreases, indicating a higher
contribution of the water gas shift to the process. This can be explained only with
a higher radial average temperature that affects significantly the composition of
the syngas.
All the commercial samples (data not shown) present the same trend decreasing
the contact time (from 4 s to 0.83): the differences in methane conversion were
low. Summarizing the results it was observed that the axial thermal profiles were
quite different: the inlet temperatures were similar, but in the first zone of the
catalytic bed higher ∆T were observed at lower CT, with a shift of the minimum
toward the center of the bed. In the second part of the bed the temperature was
lower for lower CT, even if the oven temperatures were higher. Only in the test at
4 s it was reached a flat trend at the end of the catalytic bed. The slightly
difference in the methane conversion are probably due to the opposite trend of
axial and radial profiles and the decrease of H2/CO ratio is due to the fact that at
the end of the bed the radial average temperature is higher than that observed in
the middle of the bed and the WGSR is not favored.
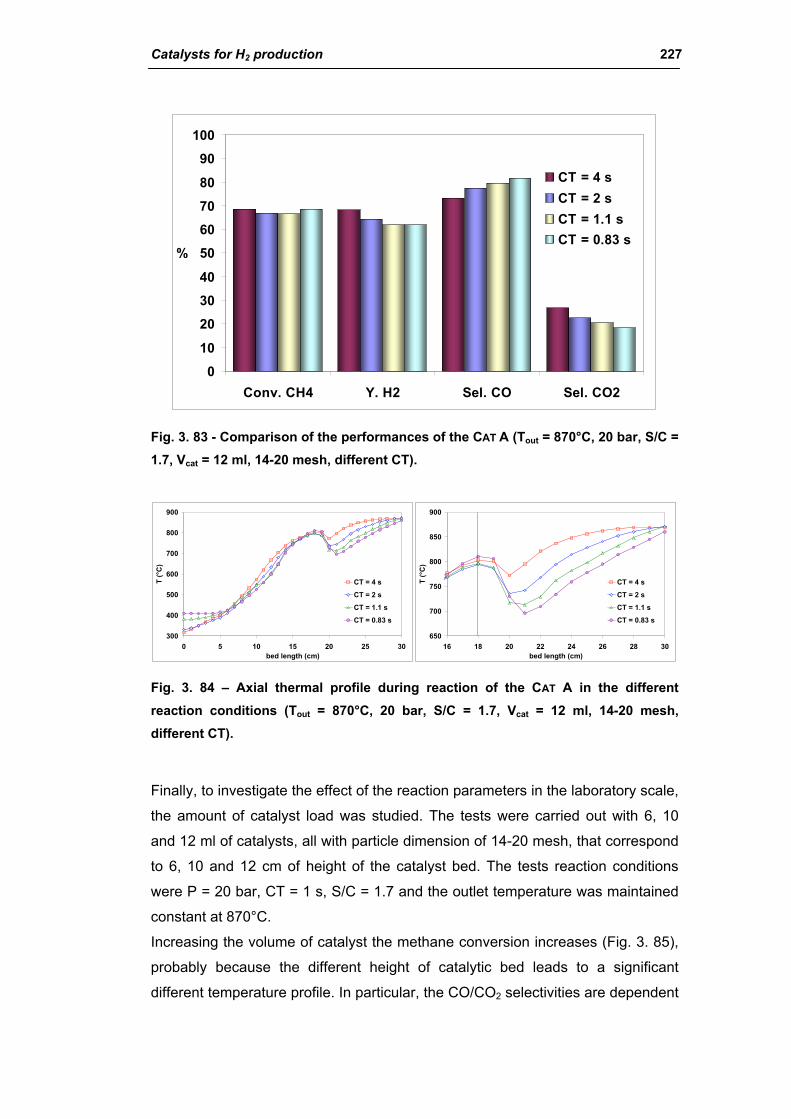
Catalysts for H2 production 227
0
10
20
30
40
50
60
70
80
90
100
Conv. CH4 Y. H2 Sel. CO Sel. CO2
%
CT = 4 sCT = 2 sCT = 1.1 sCT = 0.83 s
Fig. 3. 83 - Comparison of the performances of the CAT A (Tout = 870°C, 20 bar, S/C = 1.7, Vcat = 12 ml, 14-20 mesh, different CT).
300
400
500
600
700
800
900
0 5 10 15 20 25 30bed length (cm)
T (°
C)
CT = 4 s
CT = 2 s
CT = 1.1 s
CT = 0.83 s
650
700
750
800
850
900
16 18 20 22 24 26 28 30bed length (cm)
T (°
C)
CT = 4 s
CT = 2 s
CT = 1.1 s
CT = 0.83 s
Fig. 3. 84 – Axial thermal profile during reaction of the CAT A in the different reaction conditions (Tout = 870°C, 20 bar, S/C = 1.7, Vcat = 12 ml, 14-20 mesh, different CT).
Finally, to investigate the effect of the reaction parameters in the laboratory scale,
the amount of catalyst load was studied. The tests were carried out with 6, 10
and 12 ml of catalysts, all with particle dimension of 14-20 mesh, that correspond
to 6, 10 and 12 cm of height of the catalyst bed. The tests reaction conditions
were P = 20 bar, CT = 1 s, S/C = 1.7 and the outlet temperature was maintained
constant at 870°C.
Increasing the volume of catalyst the methane conversion increases (Fig. 3. 85),
probably because the different height of catalytic bed leads to a significant
different temperature profile. In particular, the CO/CO2 selectivities are dependent
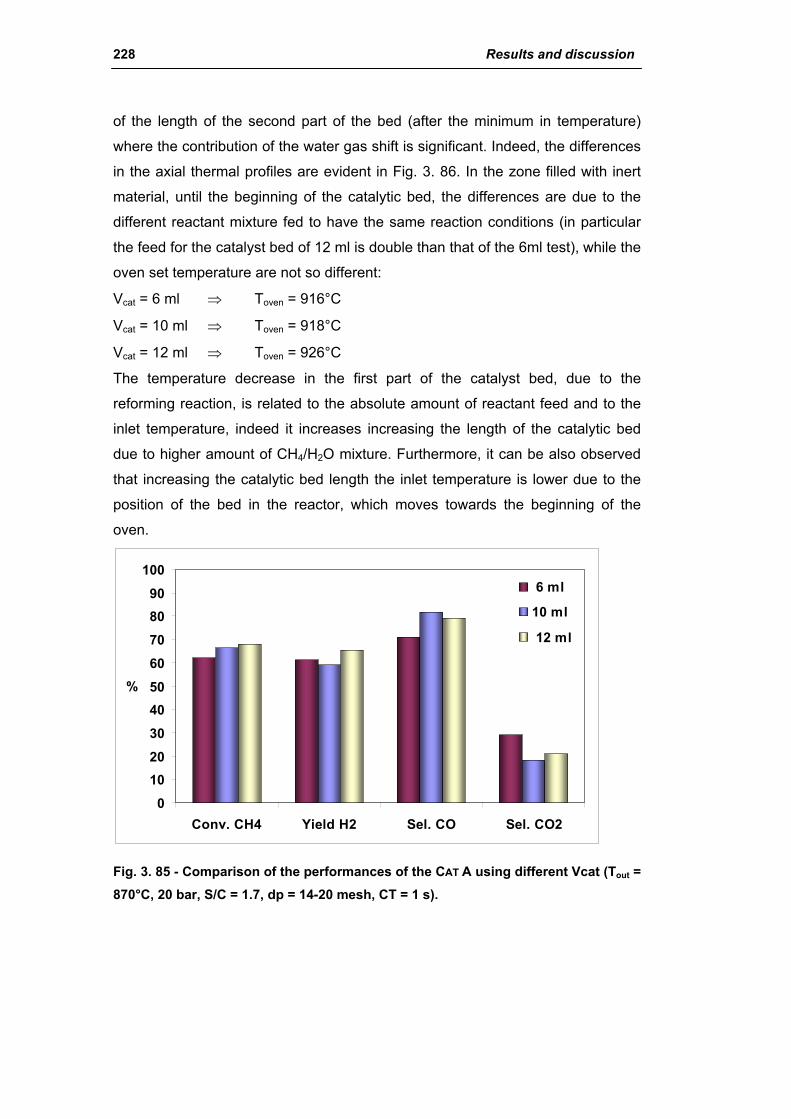
228 Results and discussion
of the length of the second part of the bed (after the minimum in temperature)
where the contribution of the water gas shift is significant. Indeed, the differences
in the axial thermal profiles are evident in Fig. 3. 86. In the zone filled with inert
material, until the beginning of the catalytic bed, the differences are due to the
different reactant mixture fed to have the same reaction conditions (in particular
the feed for the catalyst bed of 12 ml is double than that of the 6ml test), while the
oven set temperature are not so different:
Vcat = 6 ml ⇒ Toven = 916°C
Vcat = 10 ml ⇒ Toven = 918°C
Vcat = 12 ml ⇒ Toven = 926°C
The temperature decrease in the first part of the catalyst bed, due to the
reforming reaction, is related to the absolute amount of reactant feed and to the
inlet temperature, indeed it increases increasing the length of the catalytic bed
due to higher amount of CH4/H2O mixture. Furthermore, it can be also observed
that increasing the catalytic bed length the inlet temperature is lower due to the
position of the bed in the reactor, which moves towards the beginning of the
oven.
0
1020
30
4050
60
70
8090
100
Conv. CH4 Yield H2 Sel. CO Sel. CO2
%
6 ml
10 ml
12 ml
Fig. 3. 85 - Comparison of the performances of the CAT A using different Vcat (Tout = 870°C, 20 bar, S/C = 1.7, dp = 14-20 mesh, CT = 1 s).

Catalysts for H2 production 229
200
300
400
500
600
700
800
900
0 5 10 15 20 25 30Bed length (cm)
T (°
C)
6 ml
10 ml
12 ml650
700
750
800
850
900
16 18 20 22 24 26 28 30Bed length (cm)
T (°
C)
6 ml
10 ml
12 ml
Fig. 3. 86 - Comparison of the axial thermal profiles of the CAT A using different Vcat (Tout = 870°C, 20 bar, S/C = 1.7, dp = 14-20 mesh, CT = 1 s).
3.2.3. Activity of commercial catalysts
The three commercial catalysts CAT A (13 % Ni/MgAl2O4) CAT B (18 % Ni /
CaAl4O7) and CAT C (14 % Ni/CaAl12O19) were tested and compared in the
different reaction conditions.
The reaction conditions that were maintained constant in all the tests were:
- the pressure P = 20 bar
- the S/C ratio S/C = 1.7 mol/mol
- the catalyst volume Vcat = 12 ml
- the pellets dimension dp = 14-20 mesh
For all the samples, the tests, carried out loading 12 ml of samples, correspond to
a different weight for each sample, due to their different density:
CAT A 12 ml = 12.9 g
CAT B 12 ml = 12.6 g
CAT C 12 ml = 10.3 g
The 14-20 mesh pellets (1.410-0.841 mm) of the commercial samples were
obtained by crashing the pre-formed tablets in smaller ones.
The varied reaction parameters were:
- contact time CT = 4, 2, 1.1 and 0.83 s,
- oven temperature Toven = 950 and 800°C.
The contact times were varied (4, 2, 1.1 and 0.83 s) at a constant outlet
temperature (870°C) to compare the catalyst performances of the samples with
the goal to discriminate among them. The differences in the methane conversion
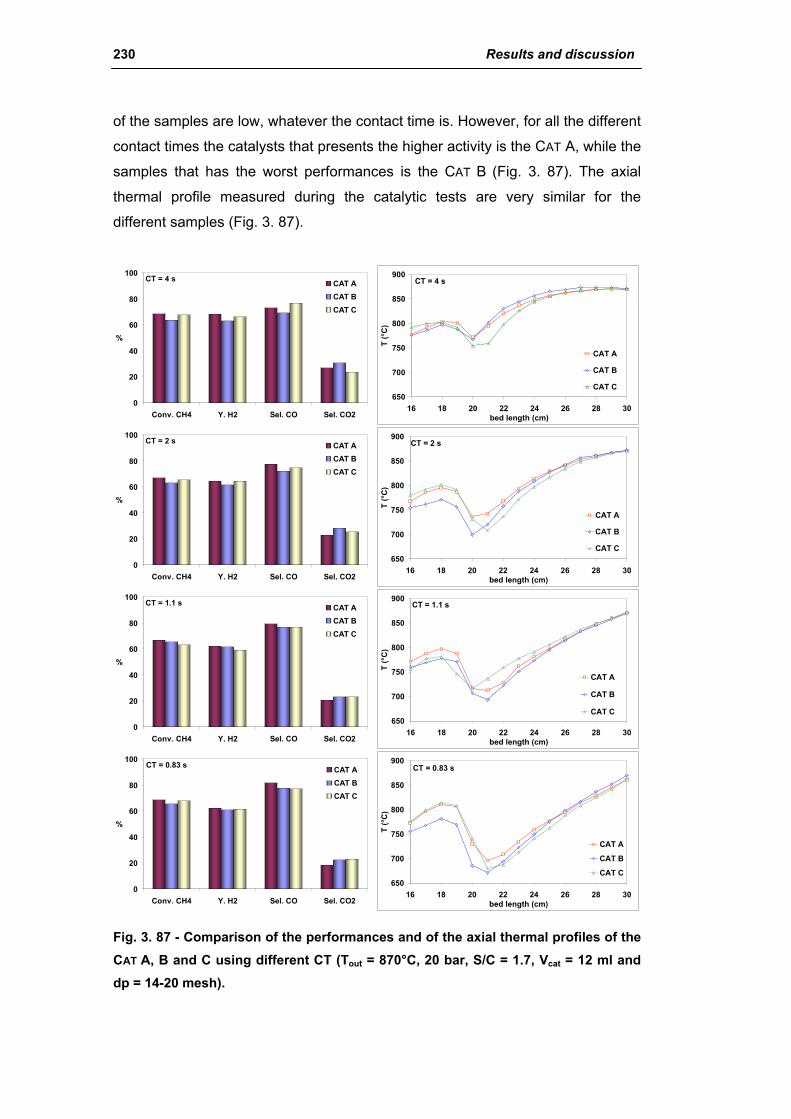
230 Results and discussion
of the samples are low, whatever the contact time is. However, for all the different
contact times the catalysts that presents the higher activity is the CAT A, while the
samples that has the worst performances is the CAT B (Fig. 3. 87). The axial
thermal profile measured during the catalytic tests are very similar for the
different samples (Fig. 3. 87).
0
20
40
60
80
100
Conv. CH4 Y. H2 Sel. CO Sel. CO2
%
CAT ACAT BCAT C
CT = 4 s
650
700
750
800
850
900
16 18 20 22 24 26 28 30bed length (cm)
T (°
C)
CAT A
CAT B
CAT C
CT = 4 s
0
20
40
60
80
100
Conv. CH4 Y. H2 Sel. CO Sel. CO2
%
CAT ACAT BCAT C
CT = 2 s
650
700
750
800
850
900
16 18 20 22 24 26 28 30bed length (cm)
T (°
C)
CAT A
CAT B
CAT C
CT = 2 s
0
20
40
60
80
100
Conv. CH4 Y. H2 Sel. CO Sel. CO2
%
CAT ACAT BCAT C
CT = 1.1 s
650
700
750
800
850
900
16 18 20 22 24 26 28 30bed length (cm)
T (°
C)
CAT A
CAT B
CAT C
CT = 1.1 s
0
20
40
60
80
100
Conv. CH4 Y. H2 Sel. CO Sel. CO2
%
CAT ACAT BCAT C
CT = 0.83 s
650
700
750
800
850
900
16 18 20 22 24 26 28 30bed length (cm)
T (°
C)
CAT A
CAT B
CAT C
CT = 0.83 s
Fig. 3. 87 - Comparison of the performances and of the axial thermal profiles of the CAT A, B and C using different CT (Tout = 870°C, 20 bar, S/C = 1.7, Vcat = 12 ml and dp = 14-20 mesh).
Catalysts for H2 production 231
The tests carried out at constant oven temperature were performed to compare
the catalytic performances of the samples at the same power consumption, to
verify the behavior in this condition, and to verify if differences among the
catalysts can be evidenced. The tests were carried out at 4, 2 and 1.1 s.
In all the tests the differences among the samples are lower than in the tests
carried out maintaining constant the outlet temperature at 870°C (Fig. 3. 88). The
test that presents higher differences is the one carried out at 1.1 s.
In these tests, maintaining constant the oven temperature, the sample that
present the higher performances is the CAT C (14 % Ni/CaAl12O19), even if the
difference from the activity of CAT A are very small. Also in these tests, the CAT B
(18 % Ni/CaAl4O7) reaches the worst activity.
For what concern the axial thermal profiles, the difference observed among the
samples are very low.
In particular, in the first part of the catalytic bed, before the minimum of
temperature, some differences are evident in the inlet temperature.
The CAT C presents slightly higher inlet temperature, followed by the CAT A and
CAT B. The ∆T (differences between the inlet and minimum temperatures) are
about the same for all the catalysts, confirming the very similar activity that
involve similar heat require. The higher inlet temperature corresponds to the
higher activity. On the contrary, in the second part of the catalytic bed, after the
minimum, the axial profiles are very similar each other due to the same heat
supplied to the reaction.
Indeed, the slightly higher activity of CAT C than the other commercial catalysts,
in particular than CAT A (the best catalyst of constant outlet temperature) may be
related to the slightly higher temperature profile of all the catalytic bed reached
during operation.

232 Results and discussion
0102030405060708090
100
Conv. CH4 Yield H2 Sel. CO Sel. CO2
%
CAT ACAT BCAT C
CT = 4 s
650
700
750
800
850
900
950
16 18 20 22 24 26 28 30bed length (cm)
T (°
C)
CAT A
CAT B
CAT C
CT = 4 s
0102030405060708090
100
Conv. CH4 Yield H2 Sel. CO Sel. CO2
%
CAT ACAT BCAT C
CT = 2 s
650
700
750
800
850
900
16 18 20 22 24 26 28 30bed length (cm)
T (°
C)
CAT A
CAT B
CAT C
CT = 2 s
0102030405060708090
100
Conv. CH4 Yield H2 Sel. CO Sel. CO2
%
CAT ACAT BCAT C
CT = 1.1 s
650
700
750
800
850
900
950
16 18 20 22 24 26 28 30bed length (cm)
T (°
C)
CAT A
CAT B
CAT C
CT = 1.1 s
Fig. 3. 88 - Comparison of the performances and of the axial thermal profiles of the CAT A, B and C using different CT (Toven = 950°C, 20 bar, S/C = 1.7, Vcat = 12 ml and dp = 14-20 mesh).
Finally the commercial catalysts were compared in tests at low temperature that
were carried out with constant Toven (800°C) to compare the catalytic
performances of the different samples far from the thermodynamic equilibrium.
These tests were carried out to try to emphasize the difference among the
catalysts. These tests were carried out at contact time of 4 and 2 s.
The activities at this temperature were low, in accordance with expectation.
The differences between the two different contact times were low (like in the case
of the tests at higher temperature). This may be due to the small differences of
the outlet temperatures, which means higher oven temperature for the low CT
tests.
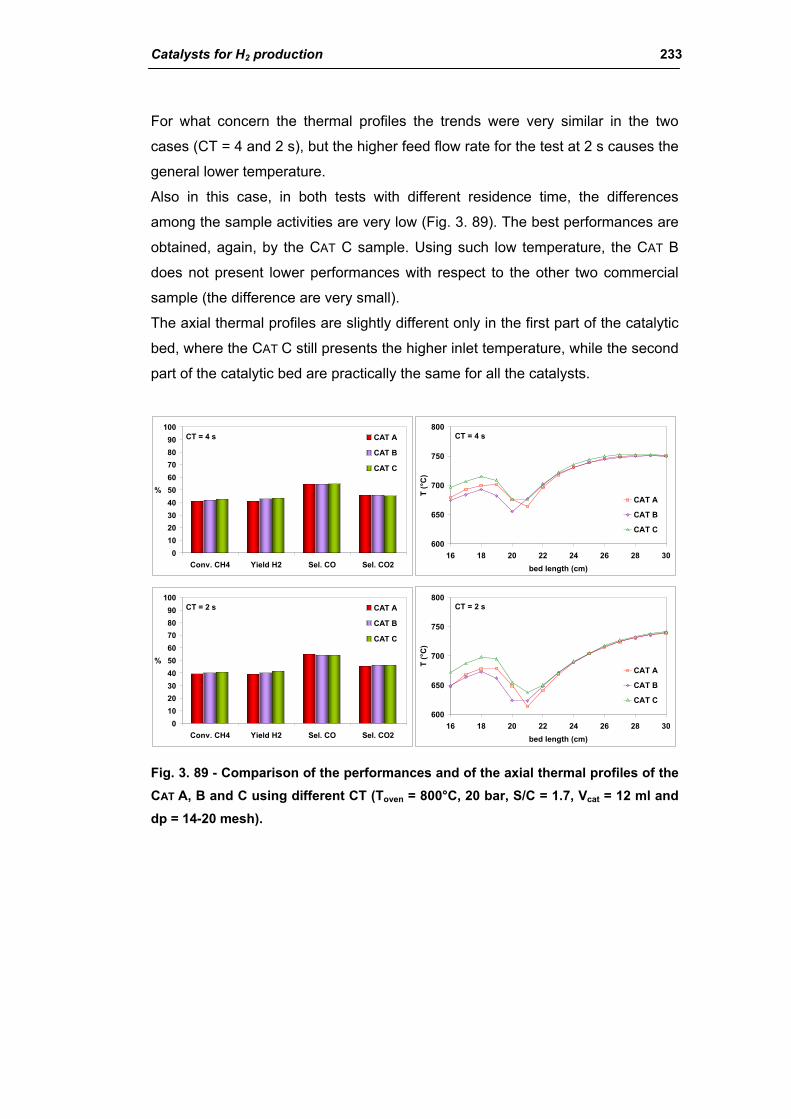
Catalysts for H2 production 233
For what concern the thermal profiles the trends were very similar in the two
cases (CT = 4 and 2 s), but the higher feed flow rate for the test at 2 s causes the
general lower temperature.
Also in this case, in both tests with different residence time, the differences
among the sample activities are very low (Fig. 3. 89). The best performances are
obtained, again, by the CAT C sample. Using such low temperature, the CAT B
does not present lower performances with respect to the other two commercial
sample (the difference are very small).
The axial thermal profiles are slightly different only in the first part of the catalytic
bed, where the CAT C still presents the higher inlet temperature, while the second
part of the catalytic bed are practically the same for all the catalysts.
0102030405060708090
100
Conv. CH4 Yield H2 Sel. CO Sel. CO2
%
CAT A
CAT B
CAT C
CT = 4 s
600
650
700
750
800
16 18 20 22 24 26 28 30bed length (cm)
T (°
C)
CAT A
CAT B
CAT C
CT = 4 s
0102030405060708090
100
Conv. CH4 Yield H2 Sel. CO Sel. CO2
%
CAT A
CAT B
CAT C
CT = 2 s
600
650
700
750
800
16 18 20 22 24 26 28 30bed length (cm)
T (°
C)
CAT A
CAT B
CAT C
CT = 2 s
Fig. 3. 89 - Comparison of the performances and of the axial thermal profiles of the CAT A, B and C using different CT (Toven = 800°C, 20 bar, S/C = 1.7, Vcat = 12 ml and dp = 14-20 mesh).
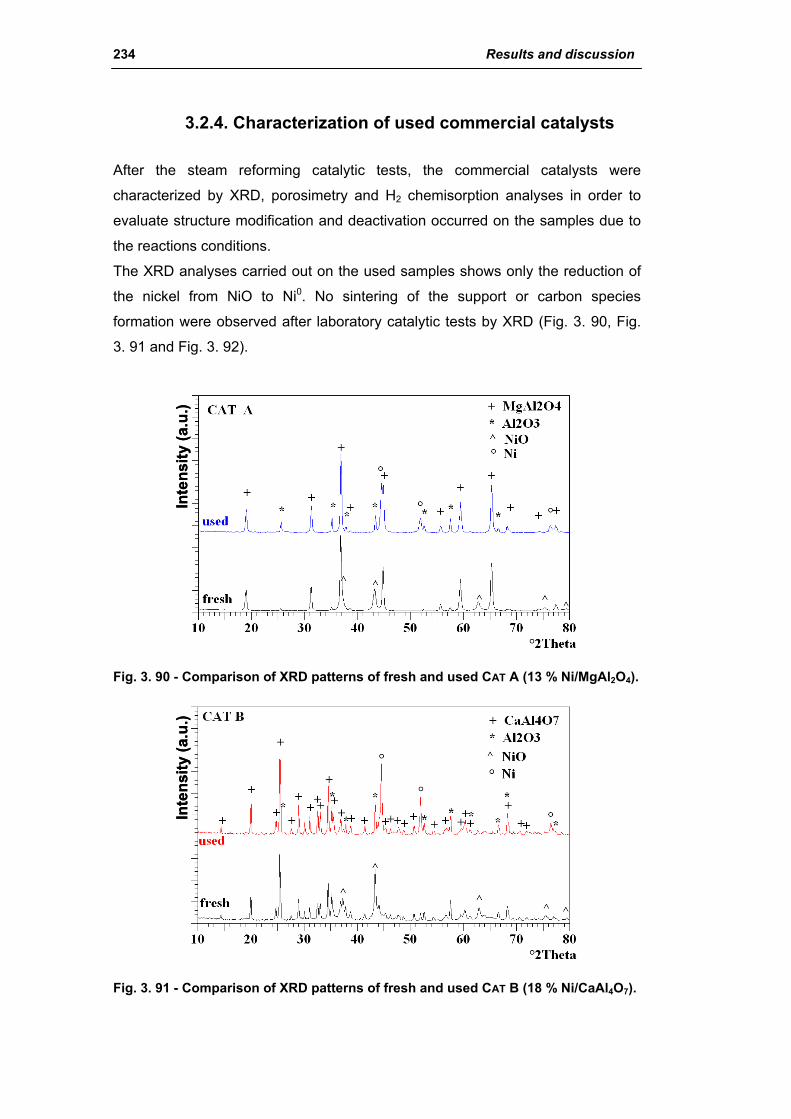
234 Results and discussion
3.2.4. Characterization of used commercial catalysts
After the steam reforming catalytic tests, the commercial catalysts were
characterized by XRD, porosimetry and H2 chemisorption analyses in order to
evaluate structure modification and deactivation occurred on the samples due to
the reactions conditions.
The XRD analyses carried out on the used samples shows only the reduction of
the nickel from NiO to Ni0. No sintering of the support or carbon species
formation were observed after laboratory catalytic tests by XRD (Fig. 3. 90, Fig.
3. 91 and Fig. 3. 92).
Inte
nsity
(a.u
.)In
tens
ity (a
.u.)
Fig. 3. 90 - Comparison of XRD patterns of fresh and used CAT A (13 % Ni/MgAl2O4).
Inte
nsity
(a.u
.)In
tens
ity (a
.u.)
Fig. 3. 91 - Comparison of XRD patterns of fresh and used CAT B (18 % Ni/CaAl4O7).
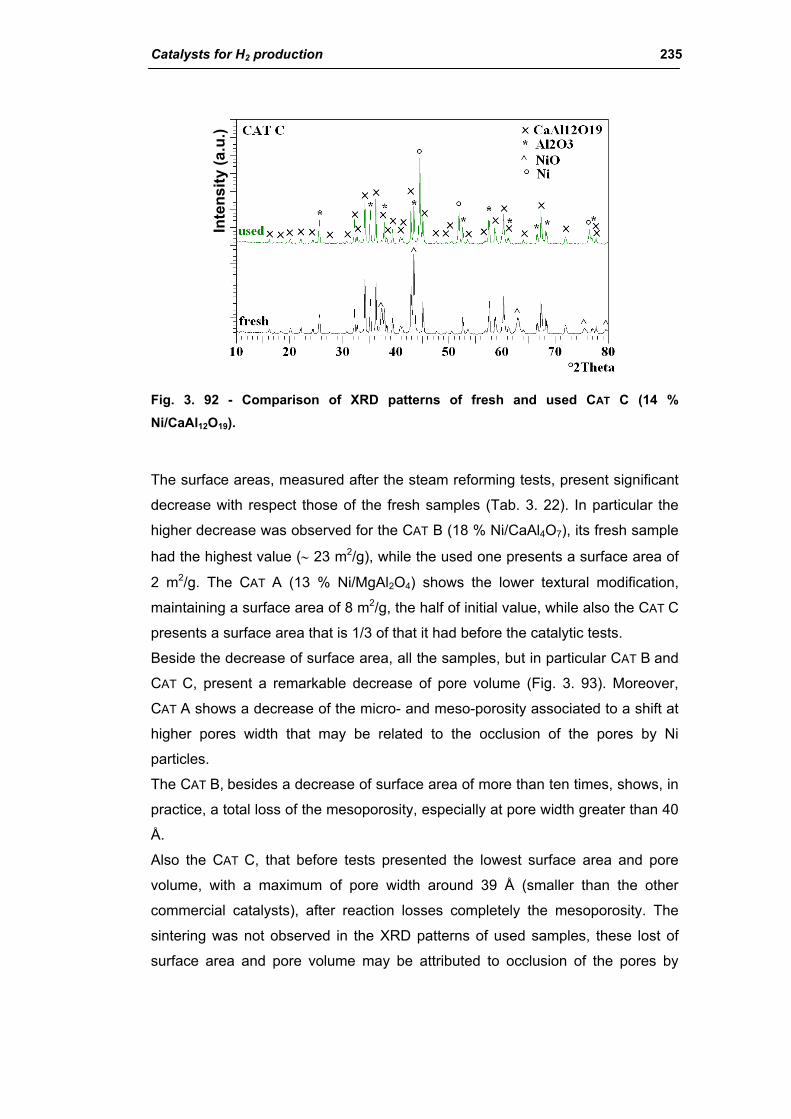
Catalysts for H2 production 235
Inte
nsity
(a.u
.)
Fig. 3. 92 - Comparison of XRD patterns of fresh and used CAT C (14 % Ni/CaAl12O19).
The surface areas, measured after the steam reforming tests, present significant
decrease with respect those of the fresh samples (Tab. 3. 22). In particular the
higher decrease was observed for the CAT B (18 % Ni/CaAl4O7), its fresh sample
had the highest value (∼ 23 m2/g), while the used one presents a surface area of
2 m2/g. The CAT A (13 % Ni/MgAl2O4) shows the lower textural modification,
maintaining a surface area of 8 m2/g, the half of initial value, while also the CAT C
presents a surface area that is 1/3 of that it had before the catalytic tests.
Beside the decrease of surface area, all the samples, but in particular CAT B and
CAT C, present a remarkable decrease of pore volume (Fig. 3. 93). Moreover,
CAT A shows a decrease of the micro- and meso-porosity associated to a shift at
higher pores width that may be related to the occlusion of the pores by Ni
particles.
The CAT B, besides a decrease of surface area of more than ten times, shows, in
practice, a total loss of the mesoporosity, especially at pore width greater than 40
Å.
Also the CAT C, that before tests presented the lowest surface area and pore
volume, with a maximum of pore width around 39 Å (smaller than the other
commercial catalysts), after reaction losses completely the mesoporosity. The
sintering was not observed in the XRD patterns of used samples, these lost of
surface area and pore volume may be attributed to occlusion of the pores by
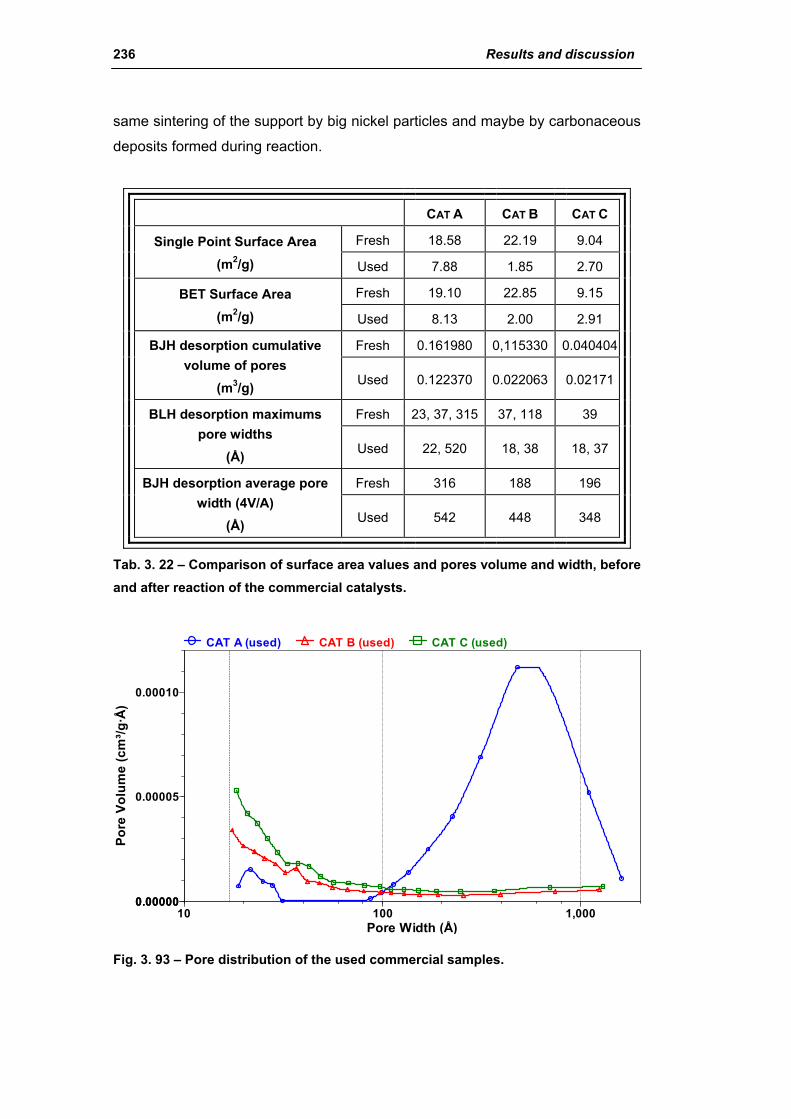
236 Results and discussion
same sintering of the support by big nickel particles and maybe by carbonaceous
deposits formed during reaction.
CAT A CAT B CAT C
Fresh 18.58 22.19 9.04 Single Point Surface Area (m2/g) Used 7.88 1.85 2.70
Fresh 19.10 22.85 9.15 BET Surface Area (m2/g) Used 8.13 2.00 2.91
Fresh 0.161980 0,115330 0.040404 BJH desorption cumulative volume of pores
(m3/g) Used 0.122370 0.022063 0.02171
Fresh 23, 37, 315 37, 118 39 BLH desorption maximums pore widths
(Å) Used 22, 520 18, 38 18, 37
Fresh 316 188 196 BJH desorption average pore width (4V/A)
(Å) Used 542 448 348
Tab. 3. 22 – Comparison of surface area values and pores volume and width, before and after reaction of the commercial catalysts.
Pore Width (Å)10 100 1,000
Pore
Vol
ume
(cm
³/g·Å
)
0.000000.00000
0.00005
0.00010
CAT A (used) CAT B (used) CAT C (used)
Fig. 3. 93 – Pore distribution of the used commercial samples.
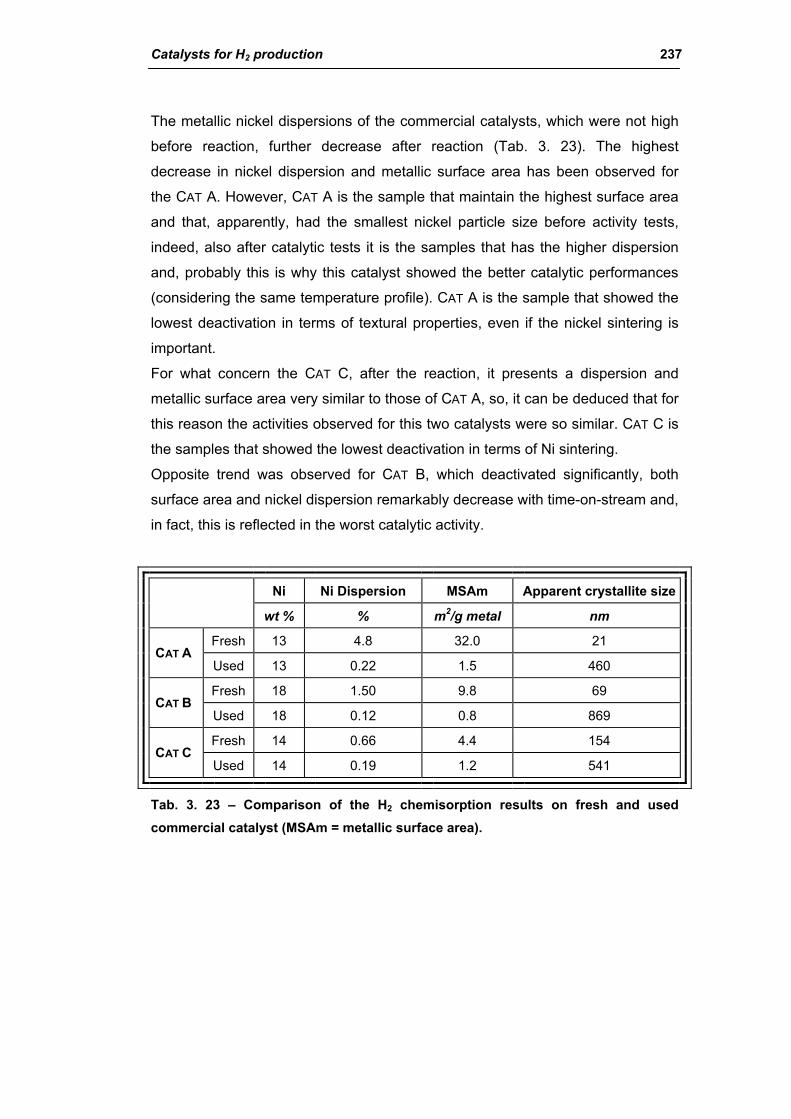
Catalysts for H2 production 237
The metallic nickel dispersions of the commercial catalysts, which were not high
before reaction, further decrease after reaction (Tab. 3. 23). The highest
decrease in nickel dispersion and metallic surface area has been observed for
the CAT A. However, CAT A is the sample that maintain the highest surface area
and that, apparently, had the smallest nickel particle size before activity tests,
indeed, also after catalytic tests it is the samples that has the higher dispersion
and, probably this is why this catalyst showed the better catalytic performances
(considering the same temperature profile). CAT A is the sample that showed the
lowest deactivation in terms of textural properties, even if the nickel sintering is
important.
For what concern the CAT C, after the reaction, it presents a dispersion and
metallic surface area very similar to those of CAT A, so, it can be deduced that for
this reason the activities observed for this two catalysts were so similar. CAT C is
the samples that showed the lowest deactivation in terms of Ni sintering.
Opposite trend was observed for CAT B, which deactivated significantly, both
surface area and nickel dispersion remarkably decrease with time-on-stream and,
in fact, this is reflected in the worst catalytic activity.
Ni Ni Dispersion MSAm Apparent crystallite size wt % % m2/g metal nm
Fresh 13 4.8 32.0 21 CAT A
Used 13 0.22 1.5 460
Fresh 18 1.50 9.8 69 CAT B
Used 18 0.12 0.8 869
Fresh 14 0.66 4.4 154 CAT C
Used 14 0.19 1.2 541
Tab. 3. 23 – Comparison of the H2 chemisorption results on fresh and used commercial catalyst (MSAm = metallic surface area).

238 Results and discussion
3.3. Catalyst obtained from hydrotalcite (HT) type precursor
The catalyst obtained from hydrotalcite type precursor, after the study carried out
for the partial oxidation of methane reaction, chosen to be tested in the steam
reforming process is Rh0.15Ni8Mg60Al31.85.
The XRD pattern of the hydrotalcite type precursor shows the typical reflections
of this kind of compounds containing silicates as interlayer anions (Fig. 3. 94).
After calcination at 900°C for 12 h, the sample presents mainly the reflections of
the forsterite type phase (Mg2SiO4) and minor phases such as MgO, in which Ni
and Rh are soluted, and a spinel defective phase (Fig. 3. 95).
For what concern the textural properties of the catalyst obtained from hydrotalcite
precursor, it maintain high surface area (93.5 m2/g) also after calcination at
900°C for 12 h. The sample presents good pore volume and a monomodal
distribution of the pore width around 100 Å (Tab. 3. 24 and Fig. 3. 96).
Fig. 3. 94 – XRD pattern of the hydrotalcite type precursor of the catalyst ex-HT Rh0.15Ni8Mg60Al31.85.

Catalysts for H2 production 239
Fig. 3. 95 - XRD pattern of the catalyst ex-HT Rh0.15Ni8Mg60Al31.85, calcined at 900°C for 12 h.
EX-HT SILICATE Rh0.15Ni8Mg60Al31.85
Single Point Surface Area m2g-1 91.50
BET Surface Area m2g-1 93.54
t-plot micropore area m2g-1 12.11
t-plot micropore volume cm3g-1 0.005109
BJH desorption cumulative volume of pores cm3g-1 0.413405
BJH desorption maximums pore widths Å 100
BJH desorption average pore width (4V/A) Å 131
Tab. 3. 24 –Surface area values and pores volume and width of the catalyst ex-HT Rh0.15Ni8Mg60Al31.85, calcined at 900°C for 12 h.
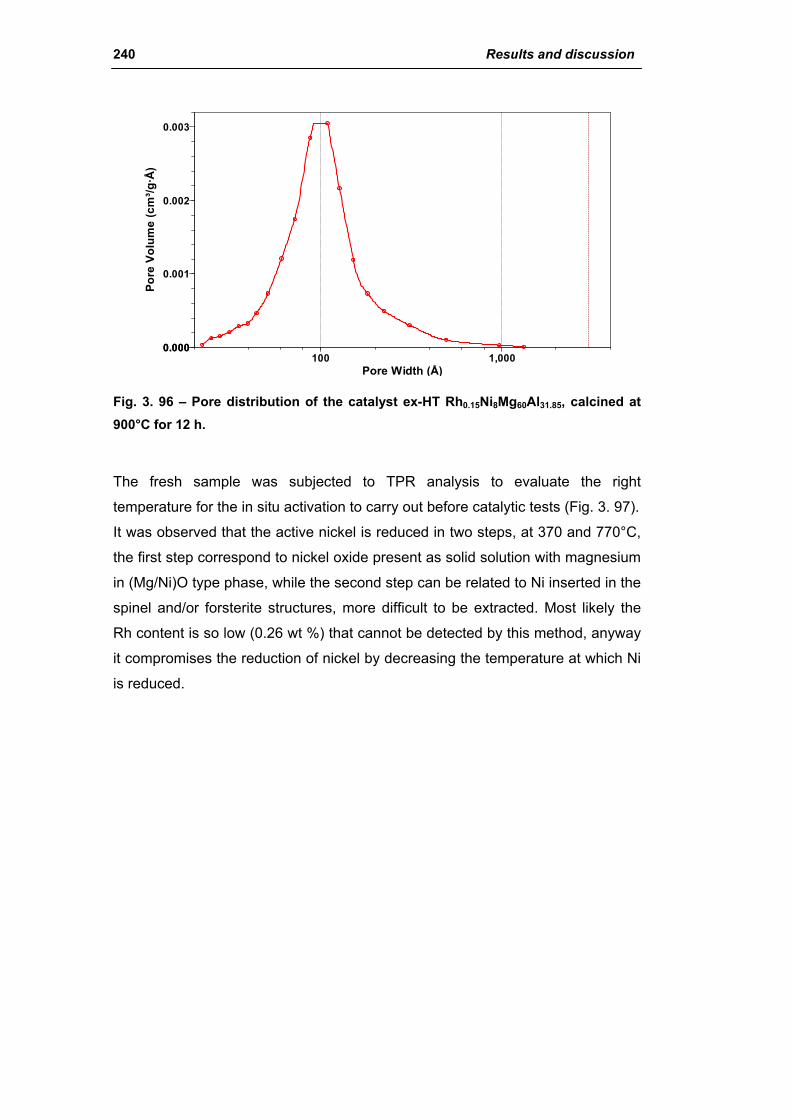
240 Results and discussion
Pore Width (Å)100 1,000
Pore
Vol
ume
(cm
³/g·Å
)
0.0000.000
0.001
0.002
0.003
Fig. 3. 96 – Pore distribution of the catalyst ex-HT Rh0.15Ni8Mg60Al31.85, calcined at 900°C for 12 h.
The fresh sample was subjected to TPR analysis to evaluate the right
temperature for the in situ activation to carry out before catalytic tests (Fig. 3. 97).
It was observed that the active nickel is reduced in two steps, at 370 and 770°C,
the first step correspond to nickel oxide present as solid solution with magnesium
in (Mg/Ni)O type phase, while the second step can be related to Ni inserted in the
spinel and/or forsterite structures, more difficult to be extracted. Most likely the
Rh content is so low (0.26 wt %) that cannot be detected by this method, anyway
it compromises the reduction of nickel by decreasing the temperature at which Ni
is reduced.

Catalysts for H2 production 241
0
5000
10000
15000
20000
25000
30000
0 200 400 600 800T (°C)
TCD
Sig
nal (
mV/
g)770°C
370°C
Fig. 3. 97 – Temperature programmed analysis carried out on the catalyst ex-HT Rh0.15Ni8Mg60Al31.85, calcined at 900°C for 12 h.
This sample contains 7.95 wt % of Ni and 0.26 wt % of Rh (calculated on the
base of the formulation). By H2 chemisorption analysis, the metal dispersion was
calculated (4.75 %) and it is associated with a relative high metallic surface area.
Indeed it was calculated that it approximately corresponds to metal particle
relatively small (21 nm), good starting point for a steam reforming catalyst.
EX-HT SILICATE Rh0.15Ni8Mg60Al31.85
Ni wt % 7.95
Rh wt % 0.26
Metal Dispersion % 4.75
MSAm m2/g metal 31.3
Apparent crystallite size nm 21
Tab. 3. 25 –H2 chemisorption results on catalyst ex-HT Rh0.15Ni8Mg60Al31.85, calcined at 900°C for 12 h (MSAm = metallic surface area).
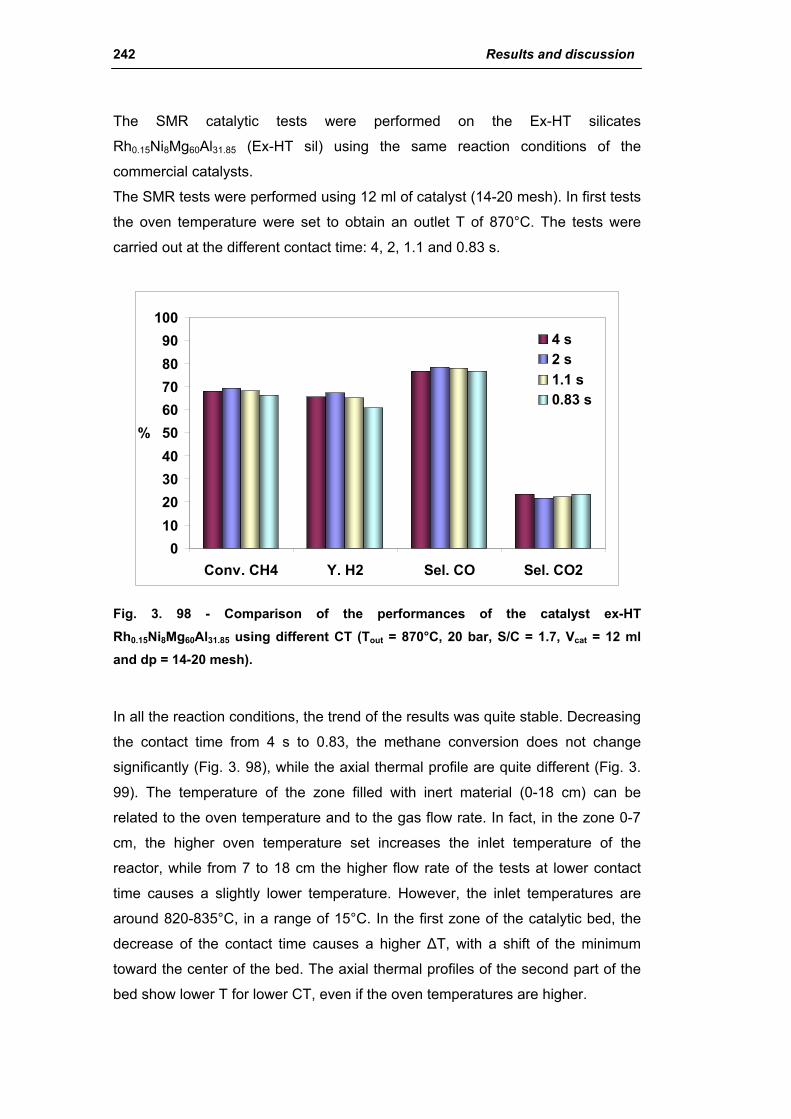
242 Results and discussion
The SMR catalytic tests were performed on the Ex-HT silicates
Rh0.15Ni8Mg60Al31.85 (Ex-HT sil) using the same reaction conditions of the
commercial catalysts.
The SMR tests were performed using 12 ml of catalyst (14-20 mesh). In first tests
the oven temperature were set to obtain an outlet T of 870°C. The tests were
carried out at the different contact time: 4, 2, 1.1 and 0.83 s.
0102030405060708090
100
Conv. CH4 Y. H2 Sel. CO Sel. CO2
%
4 s2 s1.1 s0.83 s
Fig. 3. 98 - Comparison of the performances of the catalyst ex-HT Rh0.15Ni8Mg60Al31.85 using different CT (Tout = 870°C, 20 bar, S/C = 1.7, Vcat = 12 ml and dp = 14-20 mesh).
In all the reaction conditions, the trend of the results was quite stable. Decreasing
the contact time from 4 s to 0.83, the methane conversion does not change
significantly (Fig. 3. 98), while the axial thermal profile are quite different (Fig. 3.
99). The temperature of the zone filled with inert material (0-18 cm) can be
related to the oven temperature and to the gas flow rate. In fact, in the zone 0-7
cm, the higher oven temperature set increases the inlet temperature of the
reactor, while from 7 to 18 cm the higher flow rate of the tests at lower contact
time causes a slightly lower temperature. However, the inlet temperatures are
around 820-835°C, in a range of 15°C. In the first zone of the catalytic bed, the
decrease of the contact time causes a higher ∆T, with a shift of the minimum
toward the center of the bed. The axial thermal profiles of the second part of the
bed show lower T for lower CT, even if the oven temperatures are higher.
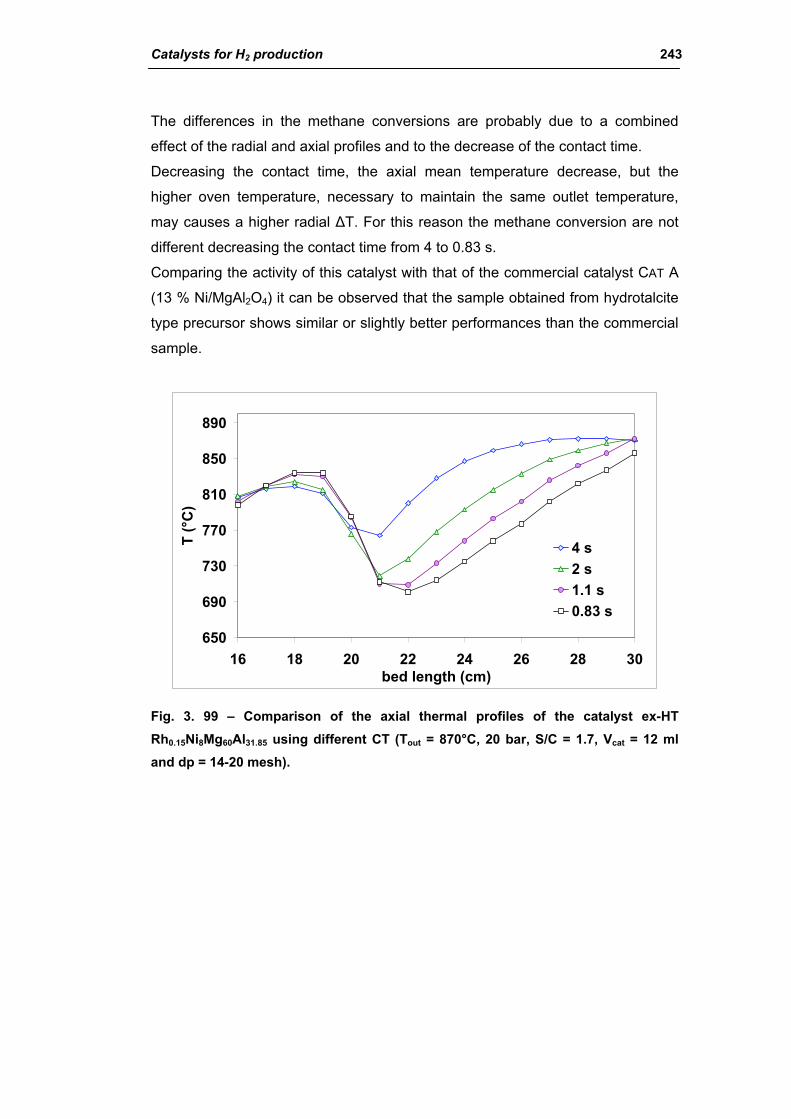
Catalysts for H2 production 243
The differences in the methane conversions are probably due to a combined
effect of the radial and axial profiles and to the decrease of the contact time.
Decreasing the contact time, the axial mean temperature decrease, but the
higher oven temperature, necessary to maintain the same outlet temperature,
may causes a higher radial ∆T. For this reason the methane conversion are not
different decreasing the contact time from 4 to 0.83 s.
Comparing the activity of this catalyst with that of the commercial catalyst CAT A
(13 % Ni/MgAl2O4) it can be observed that the sample obtained from hydrotalcite
type precursor shows similar or slightly better performances than the commercial
sample.
650
690
730
770
810
850
890
16 18 20 22 24 26 28 30bed length (cm)
T (°
C)
4 s2 s1.1 s0.83 s
Fig. 3. 99 – Comparison of the axial thermal profiles of the catalyst ex-HT Rh0.15Ni8Mg60Al31.85 using different CT (Tout = 870°C, 20 bar, S/C = 1.7, Vcat = 12 ml and dp = 14-20 mesh).
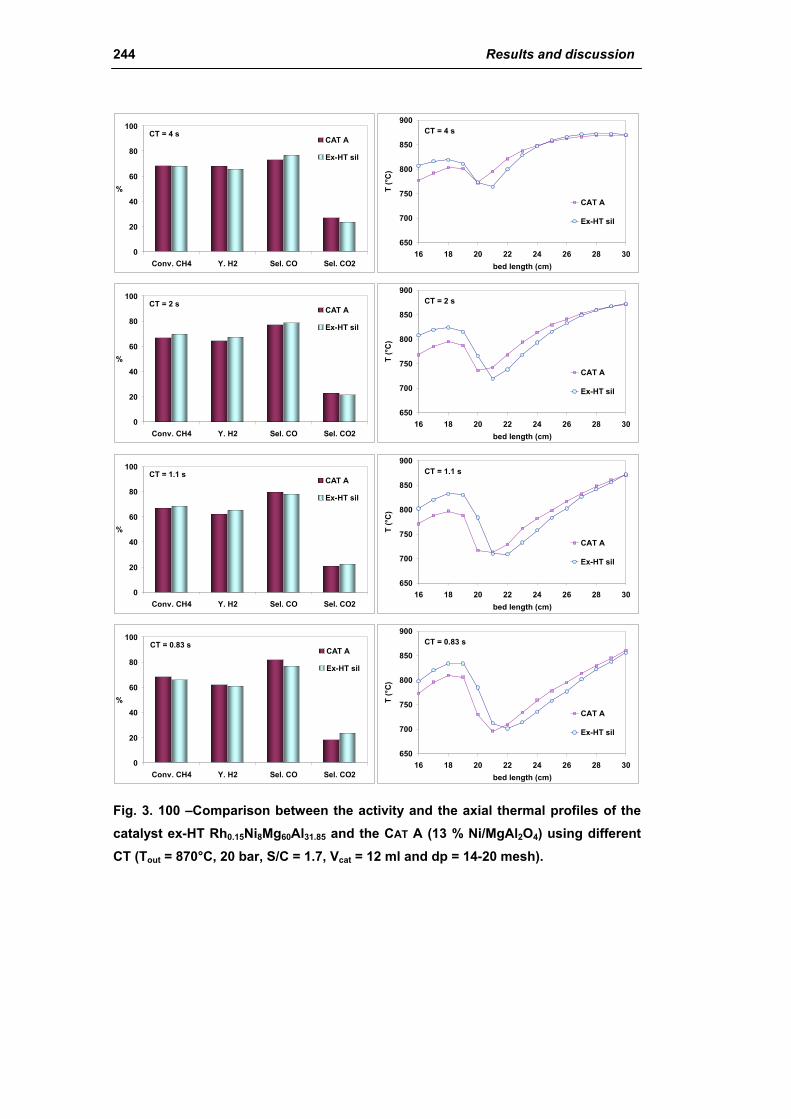
244 Results and discussion
0
20
40
60
80
100
Conv. CH4 Y. H2 Sel. CO Sel. CO2
%
CAT A
Ex-HT sil
CT = 4 s
650
700
750
800
850
900
16 18 20 22 24 26 28 30bed length (cm)
T (°
C)
CAT A
Ex-HT sil
CT = 4 s
0
20
40
60
80
100
Conv. CH4 Y. H2 Sel. CO Sel. CO2
%
CAT A
Ex-HT sil
CT = 2 s
650
700
750
800
850
900
16 18 20 22 24 26 28 30bed length (cm)
T (°
C)
CAT A
Ex-HT sil
CT = 2 s
0
20
40
60
80
100
Conv. CH4 Y. H2 Sel. CO Sel. CO2
%
CAT A
Ex-HT sil
CT = 1.1 s
650
700
750
800
850
900
16 18 20 22 24 26 28 30bed length (cm)
T (°
C)
CAT A
Ex-HT sil
CT = 1.1 s
0
20
40
60
80
100
Conv. CH4 Y. H2 Sel. CO Sel. CO2
%
CAT A
Ex-HT sil
CT = 0.83 s
650
700
750
800
850
900
16 18 20 22 24 26 28 30bed length (cm)
T (°
C)
CAT A
Ex-HT sil
CT = 0.83 s
Fig. 3. 100 –Comparison between the activity and the axial thermal profiles of the catalyst ex-HT Rh0.15Ni8Mg60Al31.85 and the CAT A (13 % Ni/MgAl2O4) using different CT (Tout = 870°C, 20 bar, S/C = 1.7, Vcat = 12 ml and dp = 14-20 mesh).
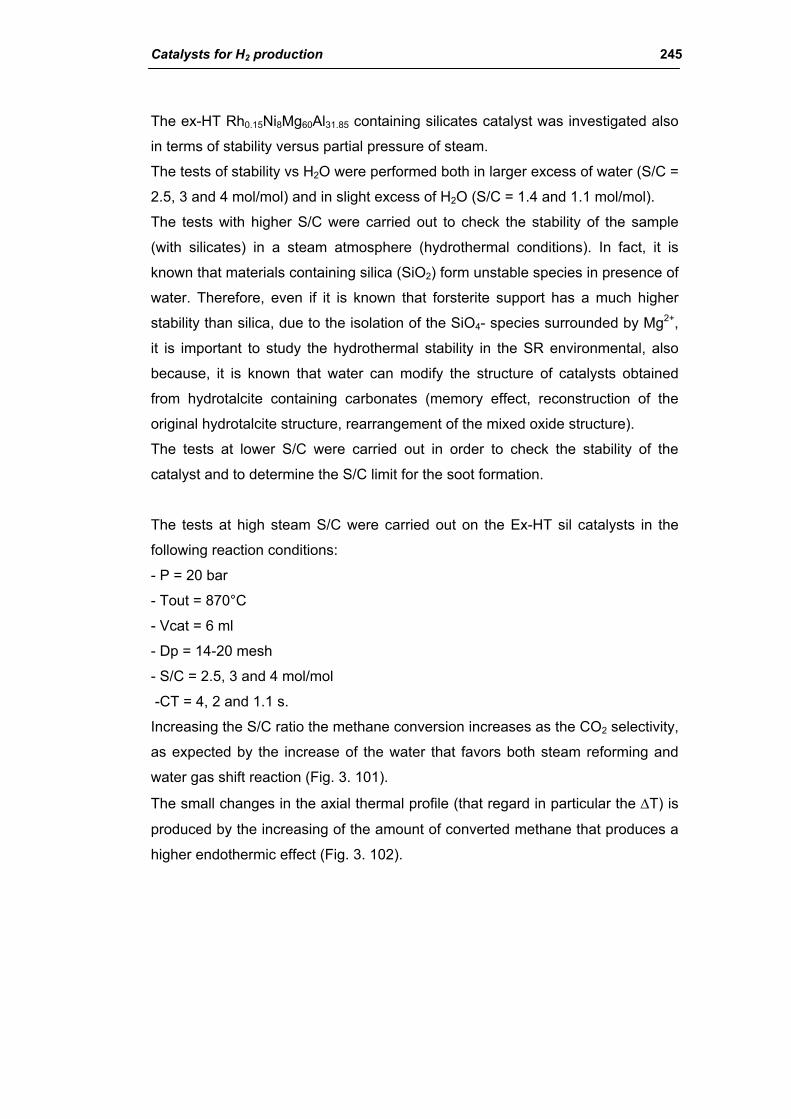
Catalysts for H2 production 245
The ex-HT Rh0.15Ni8Mg60Al31.85 containing silicates catalyst was investigated also
in terms of stability versus partial pressure of steam.
The tests of stability vs H2O were performed both in larger excess of water (S/C =
2.5, 3 and 4 mol/mol) and in slight excess of H2O (S/C = 1.4 and 1.1 mol/mol).
The tests with higher S/C were carried out to check the stability of the sample
(with silicates) in a steam atmosphere (hydrothermal conditions). In fact, it is
known that materials containing silica (SiO2) form unstable species in presence of
water. Therefore, even if it is known that forsterite support has a much higher
stability than silica, due to the isolation of the SiO4- species surrounded by Mg2+,
it is important to study the hydrothermal stability in the SR environmental, also
because, it is known that water can modify the structure of catalysts obtained
from hydrotalcite containing carbonates (memory effect, reconstruction of the
original hydrotalcite structure, rearrangement of the mixed oxide structure).
The tests at lower S/C were carried out in order to check the stability of the
catalyst and to determine the S/C limit for the soot formation.
The tests at high steam S/C were carried out on the Ex-HT sil catalysts in the
following reaction conditions:
- P = 20 bar
- Tout = 870°C
- Vcat = 6 ml
- Dp = 14-20 mesh
- S/C = 2.5, 3 and 4 mol/mol
-CT = 4, 2 and 1.1 s.
Increasing the S/C ratio the methane conversion increases as the CO2 selectivity,
as expected by the increase of the water that favors both steam reforming and
water gas shift reaction (Fig. 3. 101).
The small changes in the axial thermal profile (that regard in particular the ∆T) is
produced by the increasing of the amount of converted methane that produces a
higher endothermic effect (Fig. 3. 102).

246 Results and discussion
0
10
20
30
40
50
60
70
80
90
100
Conv. CH4 Yield H2 Sel. CO Sel. CO2
%
S/C = 2.5S/C = 3S/C = 4
Fig. 3. 101 – Comparison among the activities of ex-HT Rh0.15Ni8Mg60Al31.85 tested at different S/C (P = 20 bar, Tout = 870°C, CT = 4 s, Vcat = 6ml, Dp = 14-20 mesh).
850
855
860
865
870
875
880
885
890
22 24 26 28 30bed length (cm)
T (°
C)
S/C = 2.5
S/C = 3
S/C = 4
Fig. 3. 102 - Comparison among the axial thermal profiles of ex-HT Rh0.15Ni8Mg60Al31.85 tested at different S/C (P = 20 bar, Tout = 870°C, CT = 4 s, Vcat = 6ml, Dp = 14-20 mesh).
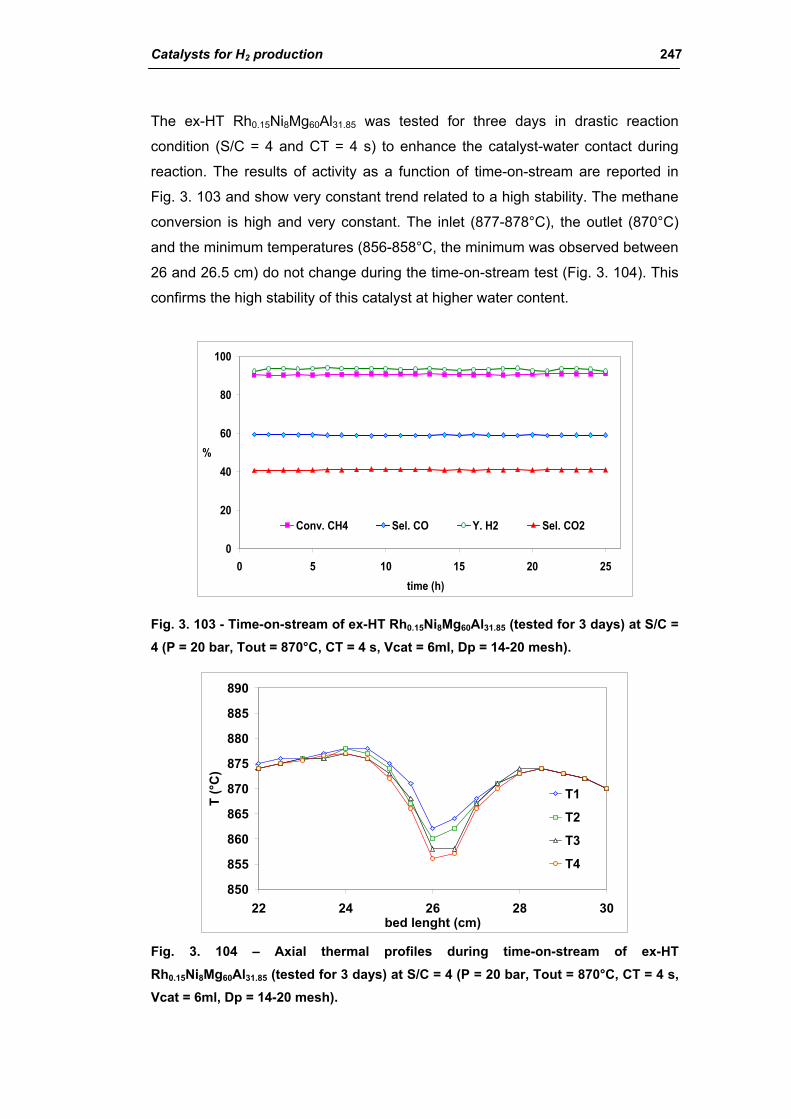
Catalysts for H2 production 247
The ex-HT Rh0.15Ni8Mg60Al31.85 was tested for three days in drastic reaction
condition (S/C = 4 and CT = 4 s) to enhance the catalyst-water contact during
reaction. The results of activity as a function of time-on-stream are reported in
Fig. 3. 103 and show very constant trend related to a high stability. The methane
conversion is high and very constant. The inlet (877-878°C), the outlet (870°C)
and the minimum temperatures (856-858°C, the minimum was observed between
26 and 26.5 cm) do not change during the time-on-stream test (Fig. 3. 104). This
confirms the high stability of this catalyst at higher water content.
0
20
40
60
80
100
0 5 10 15 20 25time (h)
%
Conv. CH4 Sel. CO Y. H2 Sel. CO2
Fig. 3. 103 - Time-on-stream of ex-HT Rh0.15Ni8Mg60Al31.85 (tested for 3 days) at S/C = 4 (P = 20 bar, Tout = 870°C, CT = 4 s, Vcat = 6ml, Dp = 14-20 mesh).
850
855
860
865
870
875
880
885
890
22 24 26 28 30bed lenght (cm)
T (°
C)
T1
T2
T3
T4
Fig. 3. 104 – Axial thermal profiles during time-on-stream of ex-HT Rh0.15Ni8Mg60Al31.85 (tested for 3 days) at S/C = 4 (P = 20 bar, Tout = 870°C, CT = 4 s, Vcat = 6ml, Dp = 14-20 mesh).
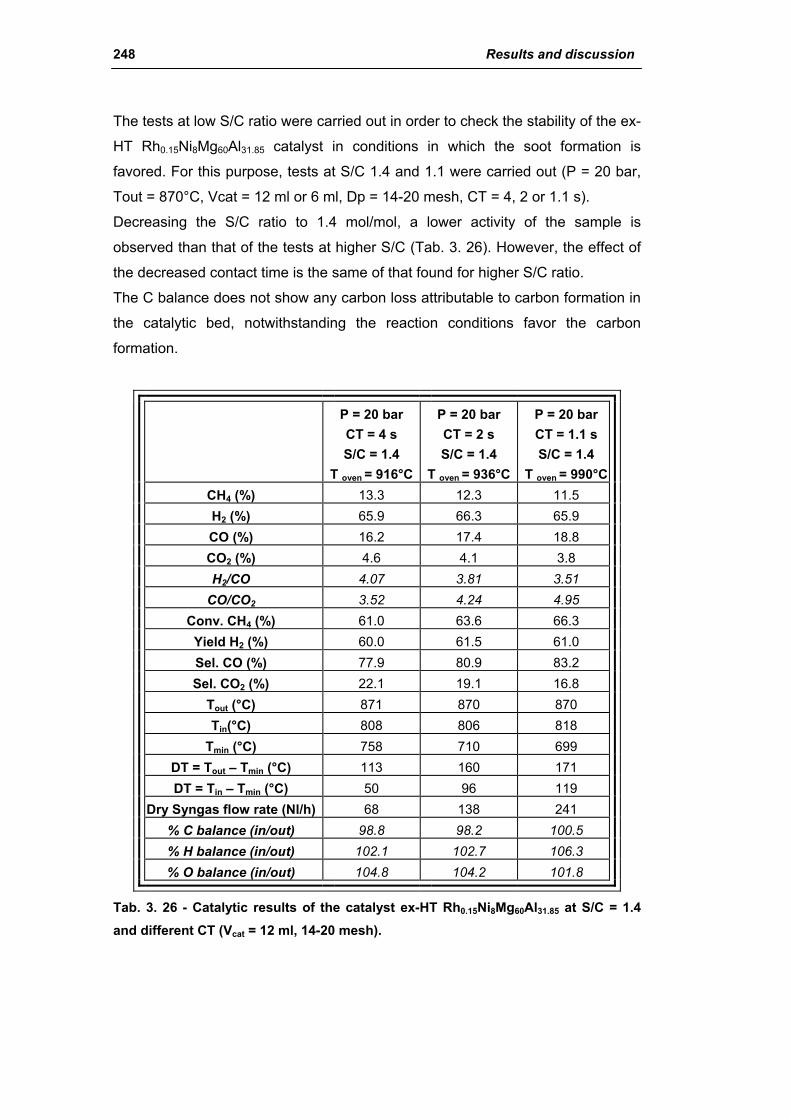
248 Results and discussion
The tests at low S/C ratio were carried out in order to check the stability of the ex-
HT Rh0.15Ni8Mg60Al31.85 catalyst in conditions in which the soot formation is
favored. For this purpose, tests at S/C 1.4 and 1.1 were carried out (P = 20 bar,
Tout = 870°C, Vcat = 12 ml or 6 ml, Dp = 14-20 mesh, CT = 4, 2 or 1.1 s).
Decreasing the S/C ratio to 1.4 mol/mol, a lower activity of the sample is
observed than that of the tests at higher S/C (Tab. 3. 26). However, the effect of
the decreased contact time is the same of that found for higher S/C ratio.
The C balance does not show any carbon loss attributable to carbon formation in
the catalytic bed, notwithstanding the reaction conditions favor the carbon
formation.
P = 20 bar CT = 4 s S/C = 1.4
T oven = 916°C
P = 20 bar CT = 2 s S/C = 1.4
T oven = 936°C
P = 20 bar CT = 1.1 s S/C = 1.4
T oven = 990°C CH4 (%) 13.3 12.3 11.5 H2 (%) 65.9 66.3 65.9 CO (%) 16.2 17.4 18.8 CO2 (%) 4.6 4.1 3.8 H2/CO 4.07 3.81 3.51
CO/CO2 3.52 4.24 4.95 Conv. CH4 (%) 61.0 63.6 66.3 Yield H2 (%) 60.0 61.5 61.0 Sel. CO (%) 77.9 80.9 83.2 Sel. CO2 (%) 22.1 19.1 16.8
Tout (°C) 871 870 870 Tin(°C) 808 806 818
Tmin (°C) 758 710 699 DT = Tout – Tmin (°C) 113 160 171 DT = Tin – Tmin (°C) 50 96 119
Dry Syngas flow rate (Nl/h) 68 138 241 % C balance (in/out) 98.8 98.2 100.5 % H balance (in/out) 102.1 102.7 106.3 % O balance (in/out) 104.8 104.2 101.8
Tab. 3. 26 - Catalytic results of the catalyst ex-HT Rh0.15Ni8Mg60Al31.85 at S/C = 1.4 and different CT (Vcat = 12 ml, 14-20 mesh).
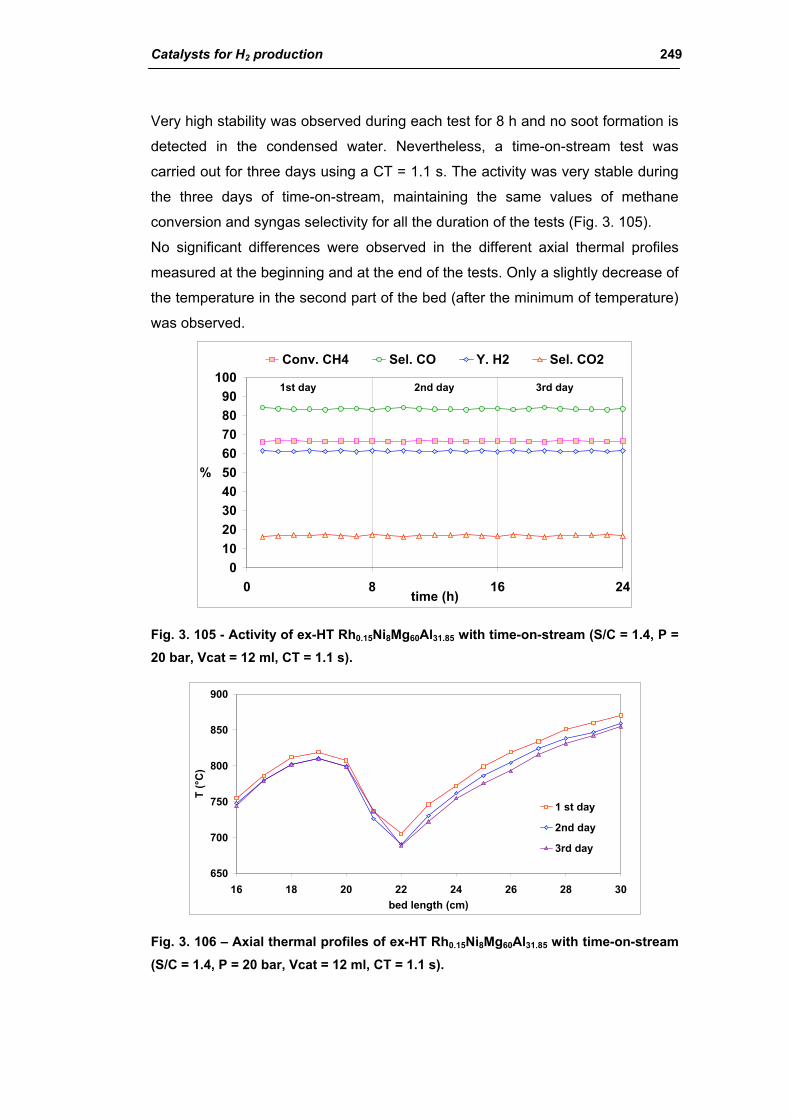
Catalysts for H2 production 249
Very high stability was observed during each test for 8 h and no soot formation is
detected in the condensed water. Nevertheless, a time-on-stream test was
carried out for three days using a CT = 1.1 s. The activity was very stable during
the three days of time-on-stream, maintaining the same values of methane
conversion and syngas selectivity for all the duration of the tests (Fig. 3. 105).
No significant differences were observed in the different axial thermal profiles
measured at the beginning and at the end of the tests. Only a slightly decrease of
the temperature in the second part of the bed (after the minimum of temperature)
was observed.
0102030405060708090
100
0 8 16 24time (h)
%
Conv. CH4 Sel. CO Y. H2 Sel. CO2
1st day 2nd day 3rd day
Fig. 3. 105 - Activity of ex-HT Rh0.15Ni8Mg60Al31.85 with time-on-stream (S/C = 1.4, P = 20 bar, Vcat = 12 ml, CT = 1.1 s).
650
700
750
800
850
900
16 18 20 22 24 26 28 30bed length (cm)
T (°
C)
1 st day
2nd day
3rd day
Fig. 3. 106 – Axial thermal profiles of ex-HT Rh0.15Ni8Mg60Al31.85 with time-on-stream (S/C = 1.4, P = 20 bar, Vcat = 12 ml, CT = 1.1 s).
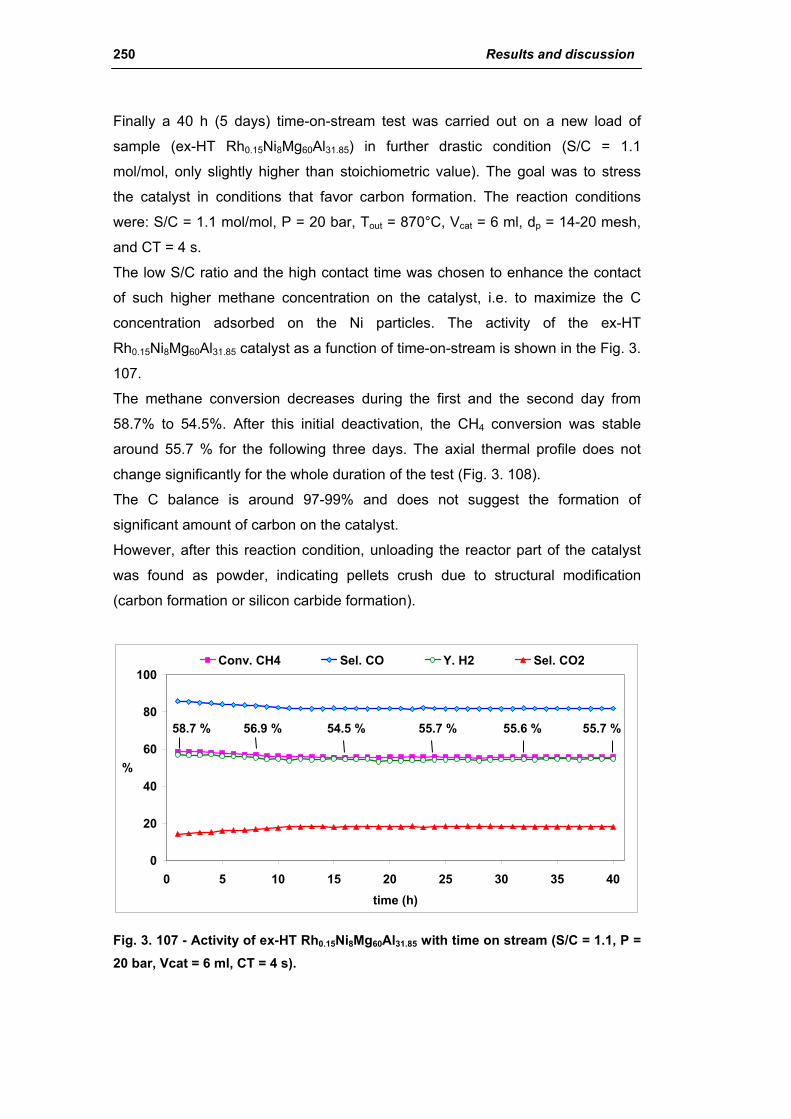
250 Results and discussion
Finally a 40 h (5 days) time-on-stream test was carried out on a new load of
sample (ex-HT Rh0.15Ni8Mg60Al31.85) in further drastic condition (S/C = 1.1
mol/mol, only slightly higher than stoichiometric value). The goal was to stress
the catalyst in conditions that favor carbon formation. The reaction conditions
were: S/C = 1.1 mol/mol, P = 20 bar, Tout = 870°C, Vcat = 6 ml, dp = 14-20 mesh,
and CT = 4 s.
The low S/C ratio and the high contact time was chosen to enhance the contact
of such higher methane concentration on the catalyst, i.e. to maximize the C
concentration adsorbed on the Ni particles. The activity of the ex-HT
Rh0.15Ni8Mg60Al31.85 catalyst as a function of time-on-stream is shown in the Fig. 3.
107.
The methane conversion decreases during the first and the second day from
58.7% to 54.5%. After this initial deactivation, the CH4 conversion was stable
around 55.7 % for the following three days. The axial thermal profile does not
change significantly for the whole duration of the test (Fig. 3. 108).
The C balance is around 97-99% and does not suggest the formation of
significant amount of carbon on the catalyst.
However, after this reaction condition, unloading the reactor part of the catalyst
was found as powder, indicating pellets crush due to structural modification
(carbon formation or silicon carbide formation).
0
20
40
60
80
100
0 5 10 15 20 25 30 35 40time (h)
%
Conv. CH4 Sel. CO Y. H2 Sel. CO2
58.7 % 54.5 % 55.6 %56.9 % 55.7 %55.7 %
Fig. 3. 107 - Activity of ex-HT Rh0.15Ni8Mg60Al31.85 with time on stream (S/C = 1.1, P = 20 bar, Vcat = 6 ml, CT = 4 s).

Catalysts for H2 production 251
820
840
860
880
22 23 24 25 26 27 28 29 30bed lenght (cm)
T (°
C)
1st day2nd day3rd day4th day 5th day
Fig. 3. 108 – Axial thermal profiles of ex-HT Rh0.15Ni8Mg60Al31.85 with time on stream (S/C = 1.1, P = 20 bar, Vcat = 6 ml, CT = 4 s).
Inte
nsity
(a.u
.)In
tens
ity (a
.u.)
Fig. 3. 109 – Comparison of the XRD patterns of the fresh and used ex-HT Rh0.15Ni8Mg60Al31.85 tested at different S/C ratio.
The XRD patterns of the ex-HT Rh0.15Ni8Mg60Al31.85 tested at different S/C ratio
are reported in the Fig. 3. 109. With respect to the fresh sample the SMR used
catalyst shows the disappearance of the MgO phase and the formation of a well
defined spinel phase (MgAl2O4) that was present only as defective phase in the
fresh sample (the reflection at 45 and 65°2θ are present, while the other are not
present). In addition, metallic Ni phase is present in the used samples. This
structural change does not occur after the catalytic partial oxidation of methane.
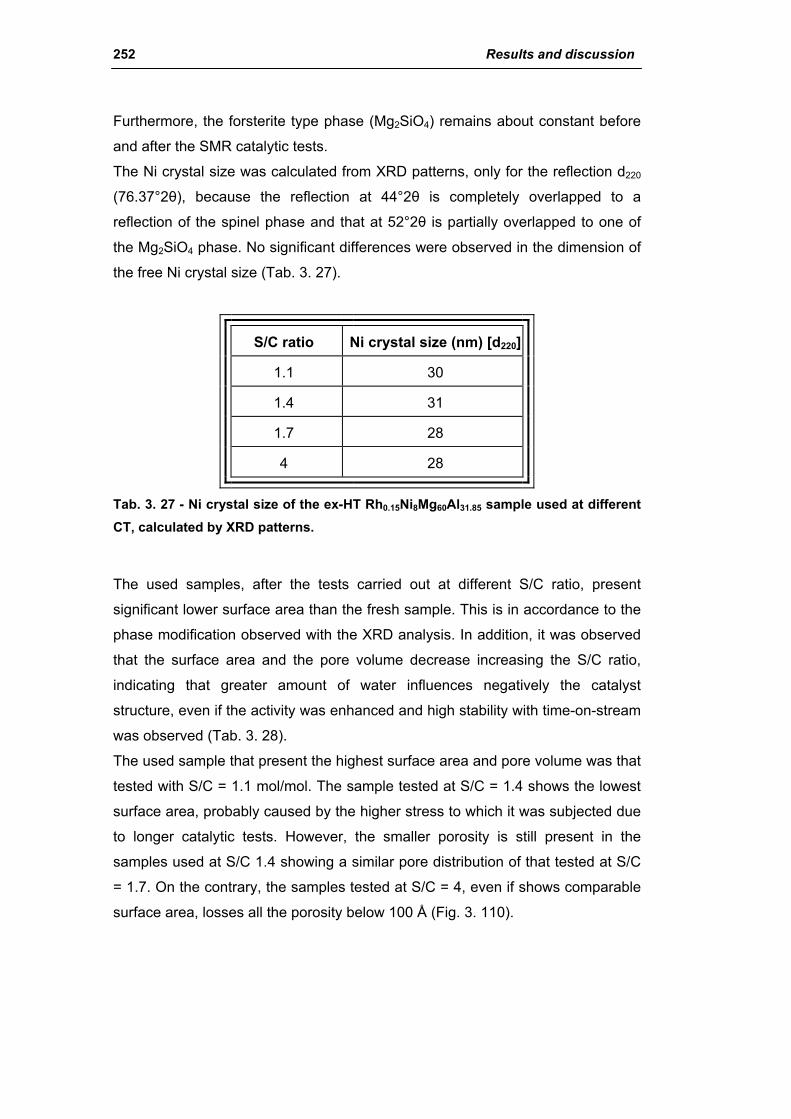
252 Results and discussion
Furthermore, the forsterite type phase (Mg2SiO4) remains about constant before
and after the SMR catalytic tests.
The Ni crystal size was calculated from XRD patterns, only for the reflection d220
(76.37°2θ), because the reflection at 44°2θ is completely overlapped to a
reflection of the spinel phase and that at 52°2θ is partially overlapped to one of
the Mg2SiO4 phase. No significant differences were observed in the dimension of
the free Ni crystal size (Tab. 3. 27).
S/C ratio Ni crystal size (nm) [d220]
1.1 30
1.4 31
1.7 28
4 28
Tab. 3. 27 - Ni crystal size of the ex-HT Rh0.15Ni8Mg60Al31.85 sample used at different CT, calculated by XRD patterns.
The used samples, after the tests carried out at different S/C ratio, present
significant lower surface area than the fresh sample. This is in accordance to the
phase modification observed with the XRD analysis. In addition, it was observed
that the surface area and the pore volume decrease increasing the S/C ratio,
indicating that greater amount of water influences negatively the catalyst
structure, even if the activity was enhanced and high stability with time-on-stream
was observed (Tab. 3. 28).
The used sample that present the highest surface area and pore volume was that
tested with S/C = 1.1 mol/mol. The sample tested at S/C = 1.4 shows the lowest
surface area, probably caused by the higher stress to which it was subjected due
to longer catalytic tests. However, the smaller porosity is still present in the
samples used at S/C 1.4 showing a similar pore distribution of that tested at S/C
= 1.7. On the contrary, the samples tested at S/C = 4, even if shows comparable
surface area, losses all the porosity below 100 Å (Fig. 3. 110).
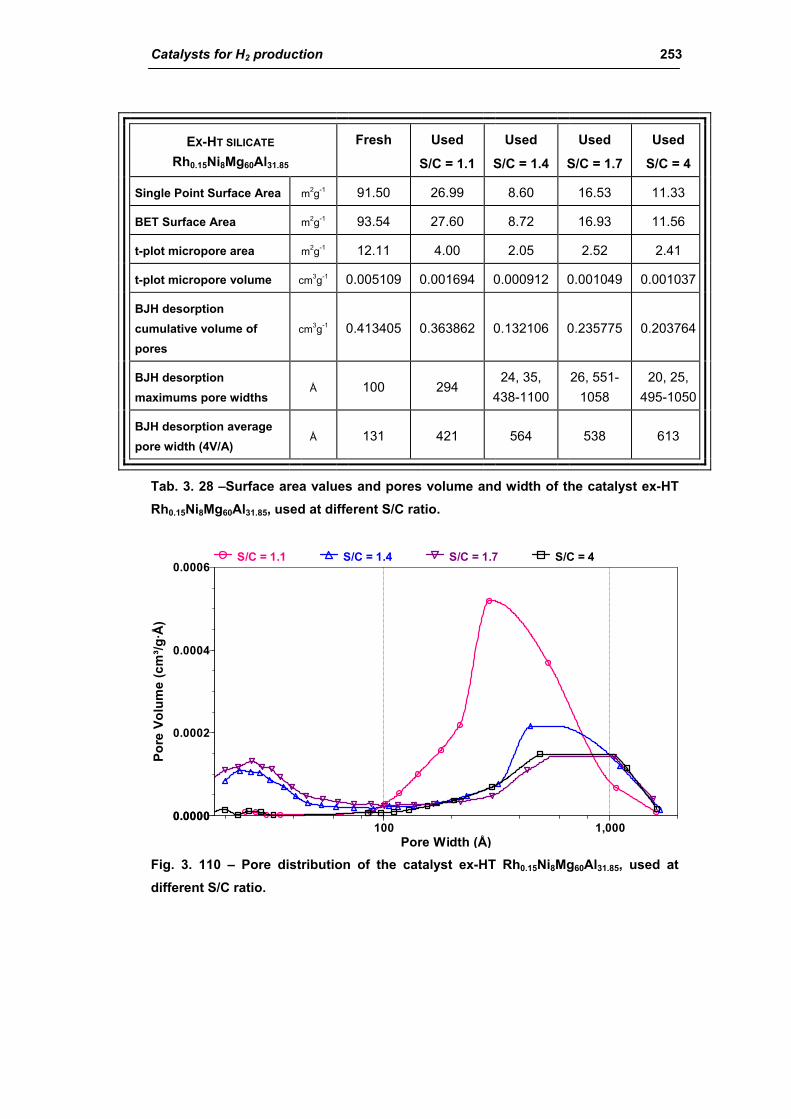
Catalysts for H2 production 253
EX-HT SILICATE Rh0.15Ni8Mg60Al31.85
Fresh
Used
S/C = 1.1
Used
S/C = 1.4
Used
S/C = 1.7
Used
S/C = 4
Single Point Surface Area m2g-1 91.50 26.99 8.60 16.53 11.33
BET Surface Area m2g-1 93.54 27.60 8.72 16.93 11.56
t-plot micropore area m2g-1 12.11 4.00 2.05 2.52 2.41
t-plot micropore volume cm3g-1 0.005109 0.001694 0.000912 0.001049 0.001037
BJH desorption cumulative volume of pores
cm3g-1 0.413405 0.363862 0.132106 0.235775 0.203764
BJH desorption maximums pore widths
Å 100 294 24, 35,
438-1100 26, 551-
1058 20, 25,
495-1050
BJH desorption average pore width (4V/A)
Å 131 421 564 538 613
Tab. 3. 28 –Surface area values and pores volume and width of the catalyst ex-HT Rh0.15Ni8Mg60Al31.85, used at different S/C ratio.
Pore Width (Å)100 1,000
Pore
Vol
ume
(cm
³/g·Å
)
0.00000.0000
0.0002
0.0004
0.0006S/C = 1.1 S/C = 1.4 S/C = 1.7 S/C = 4
Fig. 3. 110 – Pore distribution of the catalyst ex-HT Rh0.15Ni8Mg60Al31.85, used at different S/C ratio.

254 Results and discussion
TPO/quadrupole mass spectroscopy analyses were carried out on the used ex-
HT Rh0.15Ni8Mg60Al31.85 samples (S/C = 1.1, 1.4 and 4 mol/mol), in order to
evaluate the type and the relative amount of carbon species deposited on the
surface of the catalysts (Fig. 3. 111).
The samples tested at S/C = 4 and 1.4 show about the same amount of CO2
formed at the same temperature (310-330°C, 420-415°C and 600-610°C). The
similarity of the two results indicates that the carbon formed on the catalyst tested
in the two reaction conditions is the same. This may indicate that some carbon is
formed or adsorbed/desorbed anyway on the sample.
For what concern the sample used at very low S/C ratio (i.e. 1.1) the amount of
CO2 formed during TPO is higher than that formed for the previous samples,
indicating that in this reaction condition the formation of carbon was strongly
enhanced. In particular atomic carbon (Cα) oxidized at 340°C produces a CO2
peak similar to the previous samples, while it was observed a peak of CO2 ten
times larger than that observed in other tests that may be due to oxidation of
polymeric, amorphous films or filaments (Cβ or C CV) of carbonaceous species (T
= 490°C)118, 119, 120, 121, 122, 123.
This catalyst has shown interesting activity and stability and will be compared
with the commercial catalyst.
0.0E+00
1.0E-08
2.0E-08
3.0E-08
4.0E-08
5.0E-08
6.0E-08
7.0E-08
0 1000 2000 3000 4000 5000 6000 7000Time (s)
CO
2 fo
rmat
ion
01002003004005006007008009001000
T (°
C)
S/C = 1.4S/C = 4S/C = 1.1T [°C]
Fig. 3. 111 - Comparison of the CO2 formation observed during TPO analysis of the ex-HT Rh0.15Ni8Mg60Al31.85 samples tested at different S/C (1.1, 1.4 and 4).
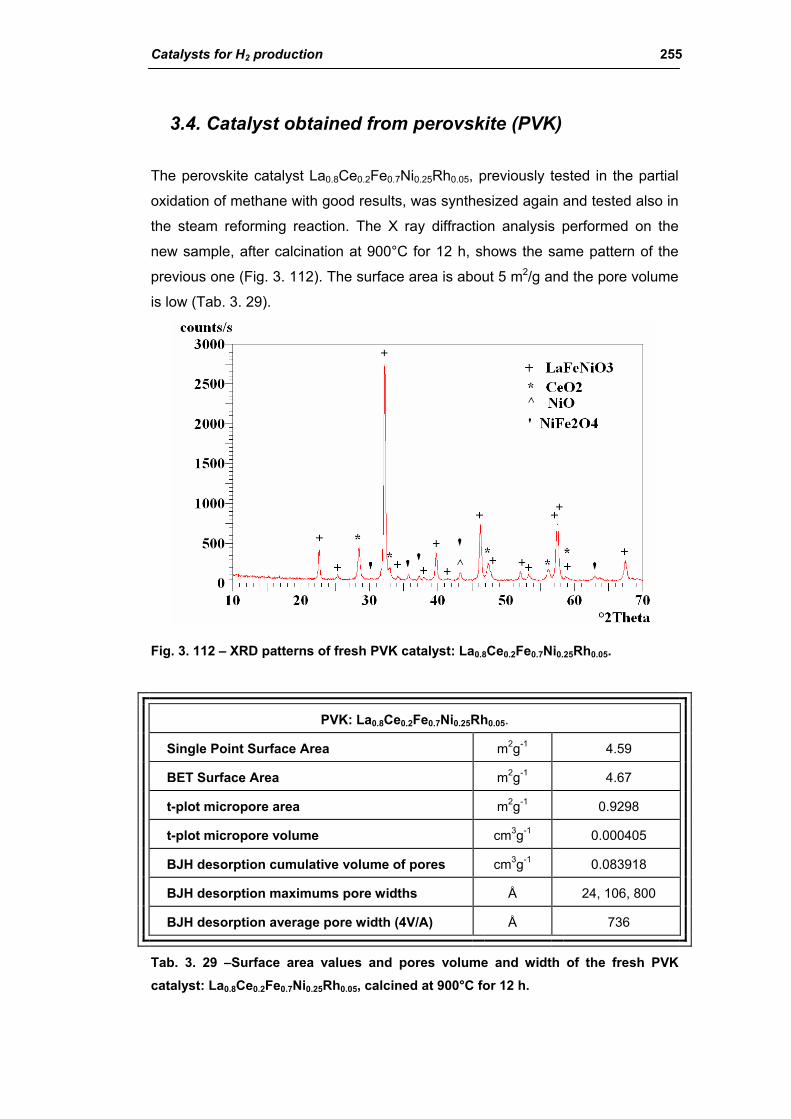
Catalysts for H2 production 255
3.4. Catalyst obtained from perovskite (PVK)
The perovskite catalyst La0.8Ce0.2Fe0.7Ni0.25Rh0.05, previously tested in the partial
oxidation of methane with good results, was synthesized again and tested also in
the steam reforming reaction. The X ray diffraction analysis performed on the
new sample, after calcination at 900°C for 12 h, shows the same pattern of the
previous one (Fig. 3. 112). The surface area is about 5 m2/g and the pore volume
is low (Tab. 3. 29).
Fig. 3. 112 – XRD patterns of fresh PVK catalyst: La0.8Ce0.2Fe0.7Ni0.25Rh0.05.
PVK: La0.8Ce0.2Fe0.7Ni0.25Rh0.05.
Single Point Surface Area m2g-1 4.59
BET Surface Area m2g-1 4.67
t-plot micropore area m2g-1 0.9298
t-plot micropore volume cm3g-1 0.000405
BJH desorption cumulative volume of pores cm3g-1 0.083918
BJH desorption maximums pore widths Å 24, 106, 800
BJH desorption average pore width (4V/A) Å 736
Tab. 3. 29 –Surface area values and pores volume and width of the fresh PVK catalyst: La0.8Ce0.2Fe0.7Ni0.25Rh0.05, calcined at 900°C for 12 h.
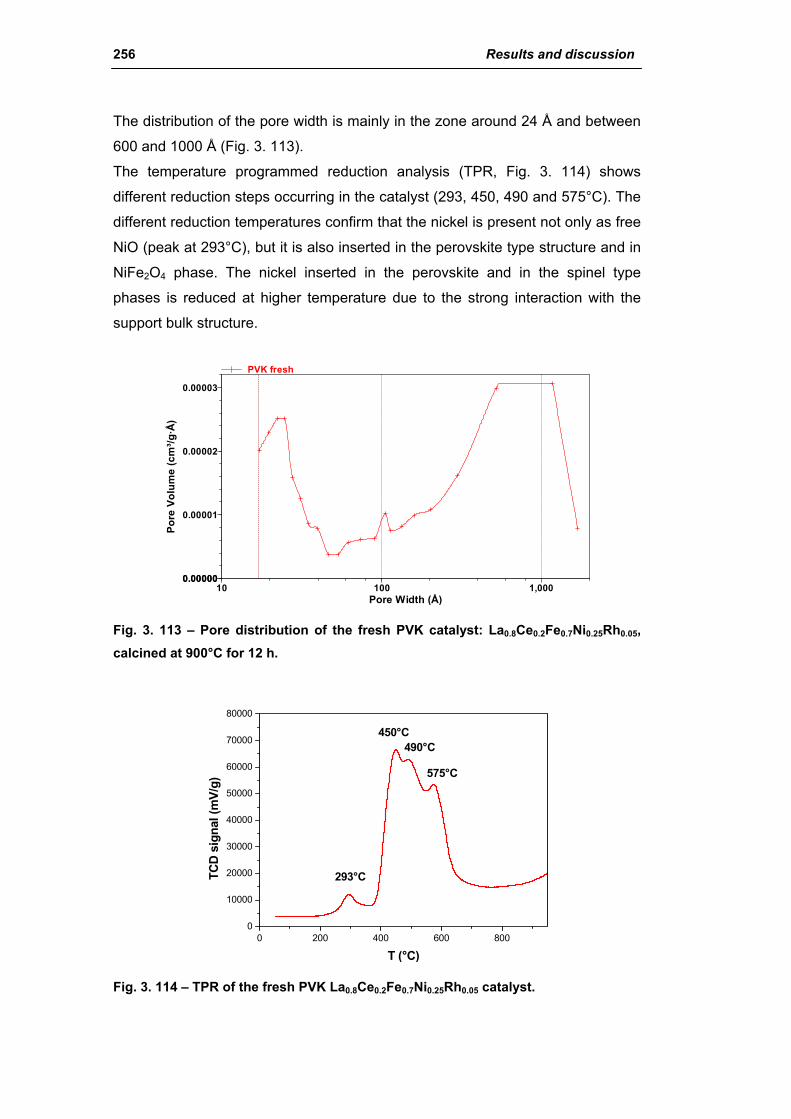
256 Results and discussion
The distribution of the pore width is mainly in the zone around 24 Å and between
600 and 1000 Å (Fig. 3. 113).
The temperature programmed reduction analysis (TPR, Fig. 3. 114) shows
different reduction steps occurring in the catalyst (293, 450, 490 and 575°C). The
different reduction temperatures confirm that the nickel is present not only as free
NiO (peak at 293°C), but it is also inserted in the perovskite type structure and in
NiFe2O4 phase. The nickel inserted in the perovskite and in the spinel type
phases is reduced at higher temperature due to the strong interaction with the
support bulk structure.
Pore Width (Å)10 100 1,000
Pore
Vol
ume
(cm
³/g·Å
)
0.000000.00000
0.00001
0.00002
0.00003
PVK fresh
Fig. 3. 113 – Pore distribution of the fresh PVK catalyst: La0.8Ce0.2Fe0.7Ni0.25Rh0.05, calcined at 900°C for 12 h.
0 200 400 600 8000
10000
20000
30000
40000
50000
60000
70000
80000
450°C
575°C
490°C
293°CTCD
sig
nal (
mV/
g)
T (°C)
Fig. 3. 114 – TPR of the fresh PVK La0.8Ce0.2Fe0.7Ni0.25Rh0.05 catalyst.
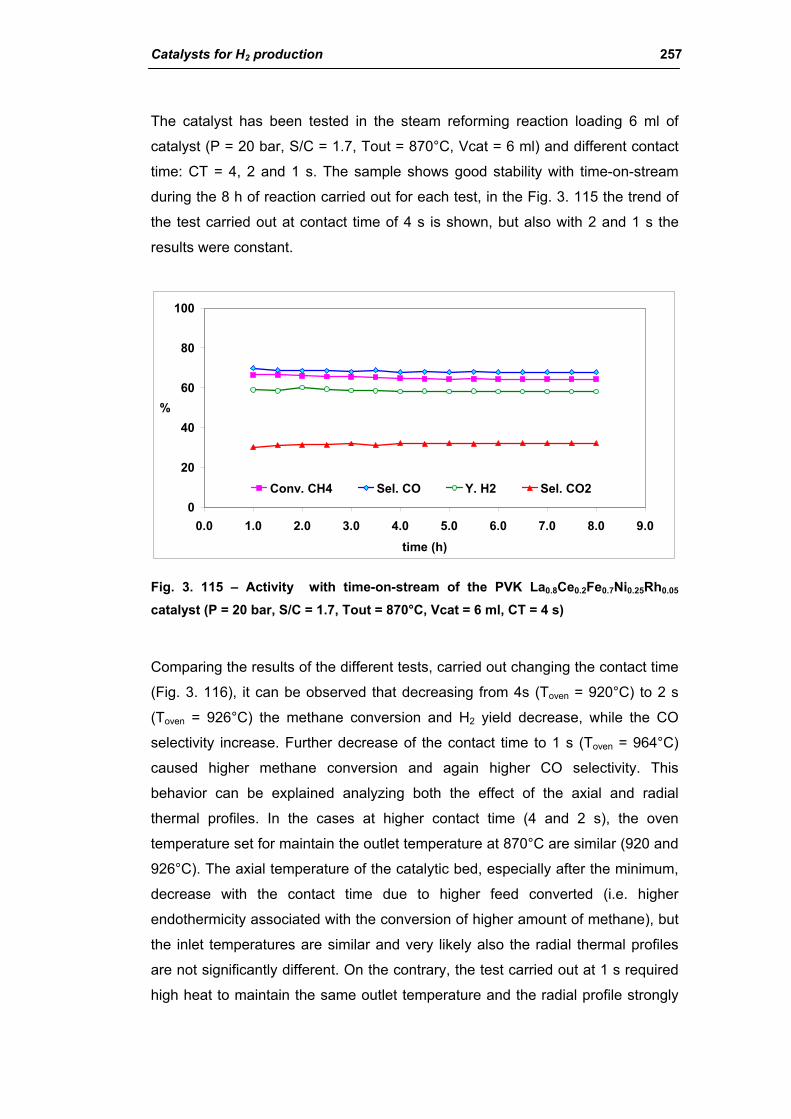
Catalysts for H2 production 257
The catalyst has been tested in the steam reforming reaction loading 6 ml of
catalyst (P = 20 bar, S/C = 1.7, Tout = 870°C, Vcat = 6 ml) and different contact
time: CT = 4, 2 and 1 s. The sample shows good stability with time-on-stream
during the 8 h of reaction carried out for each test, in the Fig. 3. 115 the trend of
the test carried out at contact time of 4 s is shown, but also with 2 and 1 s the
results were constant.
0
20
40
60
80
100
0.0 1.0 2.0 3.0 4.0 5.0 6.0 7.0 8.0 9.0time (h)
%
Conv. CH4 Sel. CO Y. H2 Sel. CO2
Fig. 3. 115 – Activity with time-on-stream of the PVK La0.8Ce0.2Fe0.7Ni0.25Rh0.05 catalyst (P = 20 bar, S/C = 1.7, Tout = 870°C, Vcat = 6 ml, CT = 4 s)
Comparing the results of the different tests, carried out changing the contact time
(Fig. 3. 116), it can be observed that decreasing from 4s (Toven = 920°C) to 2 s
(Toven = 926°C) the methane conversion and H2 yield decrease, while the CO
selectivity increase. Further decrease of the contact time to 1 s (Toven = 964°C)
caused higher methane conversion and again higher CO selectivity. This
behavior can be explained analyzing both the effect of the axial and radial
thermal profiles. In the cases at higher contact time (4 and 2 s), the oven
temperature set for maintain the outlet temperature at 870°C are similar (920 and
926°C). The axial temperature of the catalytic bed, especially after the minimum,
decrease with the contact time due to higher feed converted (i.e. higher
endothermicity associated with the conversion of higher amount of methane), but
the inlet temperatures are similar and very likely also the radial thermal profiles
are not significantly different. On the contrary, the test carried out at 1 s required
high heat to maintain the same outlet temperature and the radial profile strongly
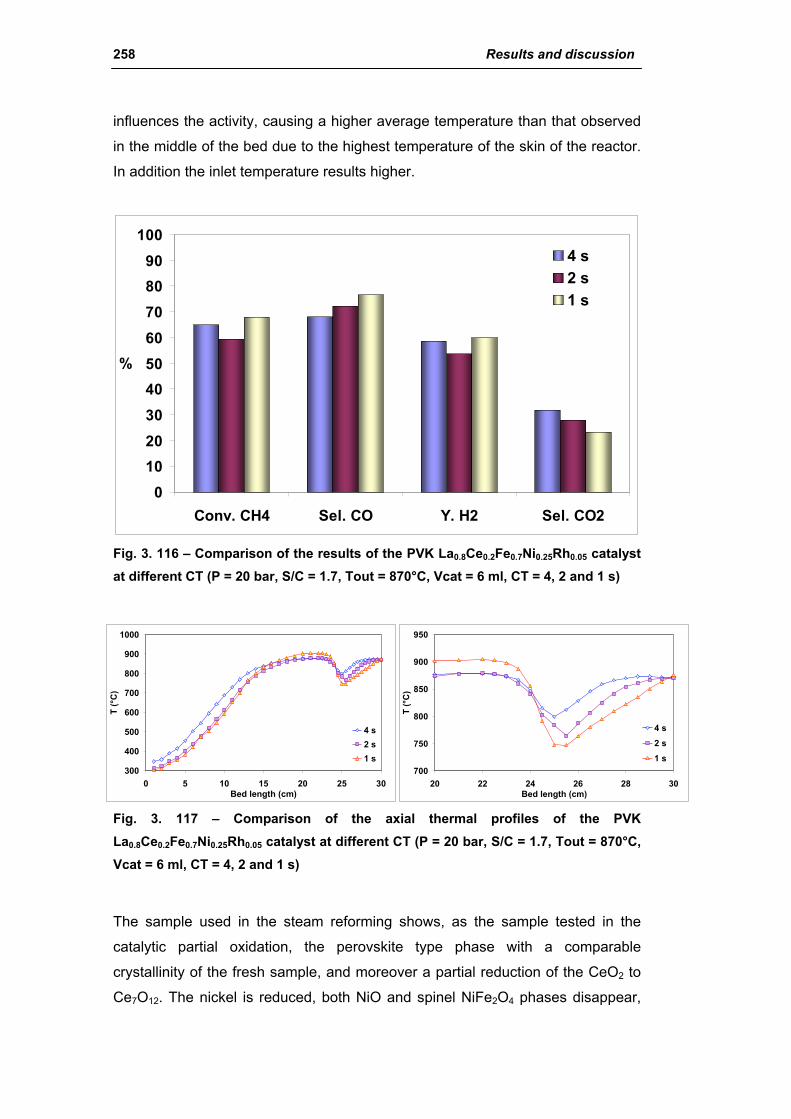
258 Results and discussion
influences the activity, causing a higher average temperature than that observed
in the middle of the bed due to the highest temperature of the skin of the reactor.
In addition the inlet temperature results higher.
0102030405060708090
100
Conv. CH4 Sel. CO Y. H2 Sel. CO2
%
4 s2 s1 s
Fig. 3. 116 – Comparison of the results of the PVK La0.8Ce0.2Fe0.7Ni0.25Rh0.05 catalyst at different CT (P = 20 bar, S/C = 1.7, Tout = 870°C, Vcat = 6 ml, CT = 4, 2 and 1 s)
300
400
500
600
700
800
900
1000
0 5 10 15 20 25 30Bed length (cm)
T (°
C)
4 s2 s1 s
700
750
800
850
900
950
20 22 24 26 28 30Bed length (cm)
T (°
C)
4 s2 s1 s
Fig. 3. 117 – Comparison of the axial thermal profiles of the PVK La0.8Ce0.2Fe0.7Ni0.25Rh0.05 catalyst at different CT (P = 20 bar, S/C = 1.7, Tout = 870°C, Vcat = 6 ml, CT = 4, 2 and 1 s)
The sample used in the steam reforming shows, as the sample tested in the
catalytic partial oxidation, the perovskite type phase with a comparable
crystallinity of the fresh sample, and moreover a partial reduction of the CeO2 to
Ce7O12. The nickel is reduced, both NiO and spinel NiFe2O4 phases disappear,
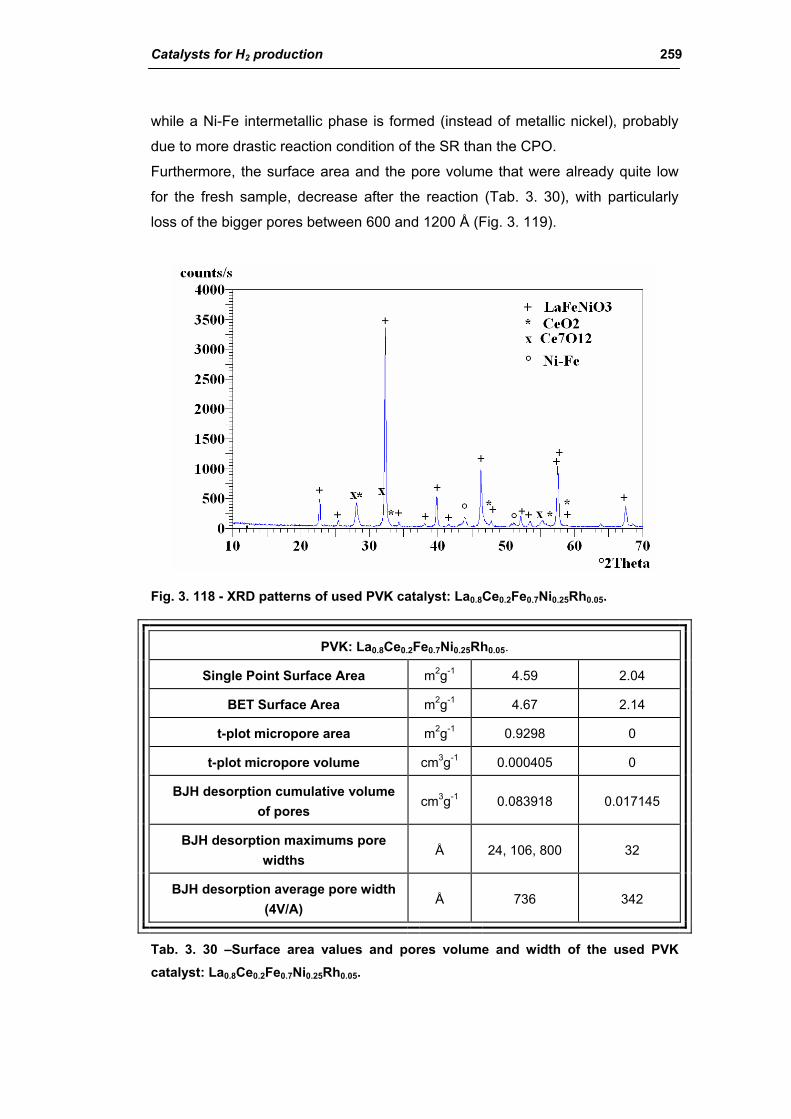
Catalysts for H2 production 259
while a Ni-Fe intermetallic phase is formed (instead of metallic nickel), probably
due to more drastic reaction condition of the SR than the CPO.
Furthermore, the surface area and the pore volume that were already quite low
for the fresh sample, decrease after the reaction (Tab. 3. 30), with particularly
loss of the bigger pores between 600 and 1200 Å (Fig. 3. 119).
Fig. 3. 118 - XRD patterns of used PVK catalyst: La0.8Ce0.2Fe0.7Ni0.25Rh0.05.
PVK: La0.8Ce0.2Fe0.7Ni0.25Rh0.05.
Single Point Surface Area m2g-1 4.59 2.04
BET Surface Area m2g-1 4.67 2.14
t-plot micropore area m2g-1 0.9298 0
t-plot micropore volume cm3g-1 0.000405 0
BJH desorption cumulative volume of pores
cm3g-1 0.083918 0.017145
BJH desorption maximums pore widths
Å 24, 106, 800 32
BJH desorption average pore width (4V/A)
Å 736 342
Tab. 3. 30 –Surface area values and pores volume and width of the used PVK catalyst: La0.8Ce0.2Fe0.7Ni0.25Rh0.05.
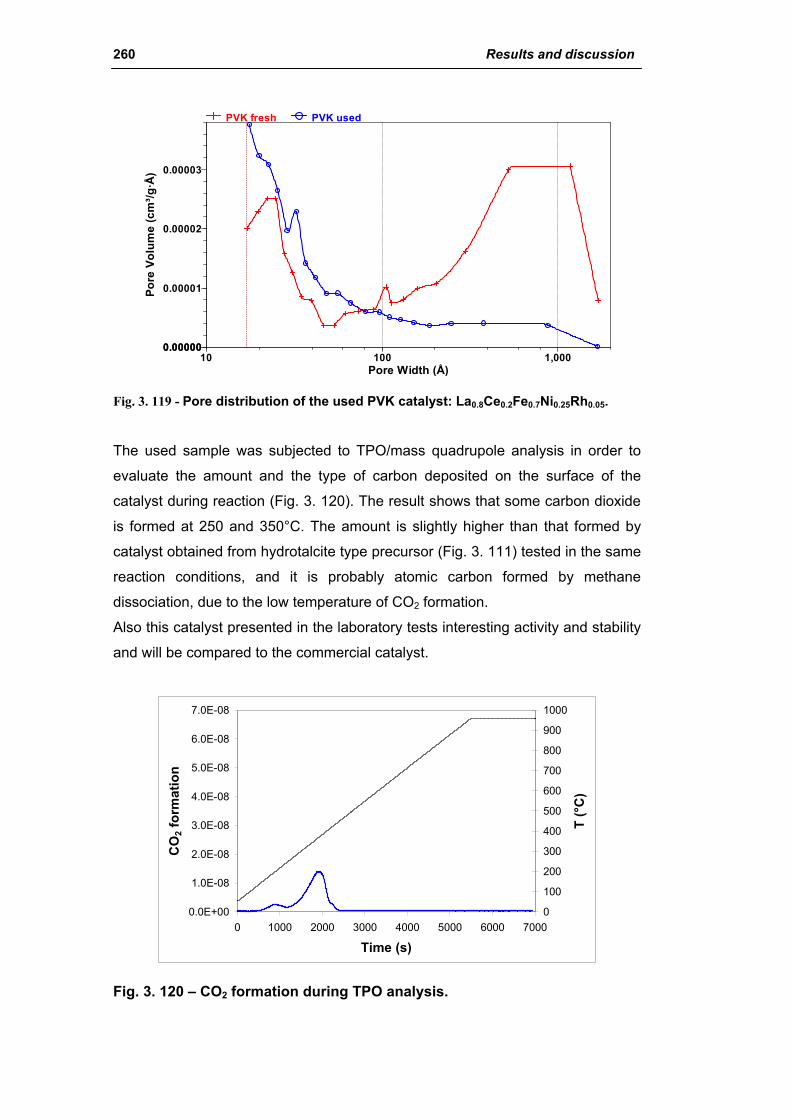
260 Results and discussion
Pore Width (Å)10 100 1,000
Pore
Vol
ume
(cm
³/g·Å
)
0.000000.00000
0.00001
0.00002
0.00003
PVK fresh PVK used
Fig. 3. 119 - Pore distribution of the used PVK catalyst: La0.8Ce0.2Fe0.7Ni0.25Rh0.05.
The used sample was subjected to TPO/mass quadrupole analysis in order to
evaluate the amount and the type of carbon deposited on the surface of the
catalyst during reaction (Fig. 3. 120). The result shows that some carbon dioxide
is formed at 250 and 350°C. The amount is slightly higher than that formed by
catalyst obtained from hydrotalcite type precursor (Fig. 3. 111) tested in the same
reaction conditions, and it is probably atomic carbon formed by methane
dissociation, due to the low temperature of CO2 formation.
Also this catalyst presented in the laboratory tests interesting activity and stability
and will be compared to the commercial catalyst.
0.0E+00
1.0E-08
2.0E-08
3.0E-08
4.0E-08
5.0E-08
6.0E-08
7.0E-08
0 1000 2000 3000 4000 5000 6000 7000
Time (s)
CO
2 for
mat
ion
0
100
200
300
400
500
600
700
800
900
1000
T (°
C)
Fig. 3. 120 – CO2 formation during TPO analysis.
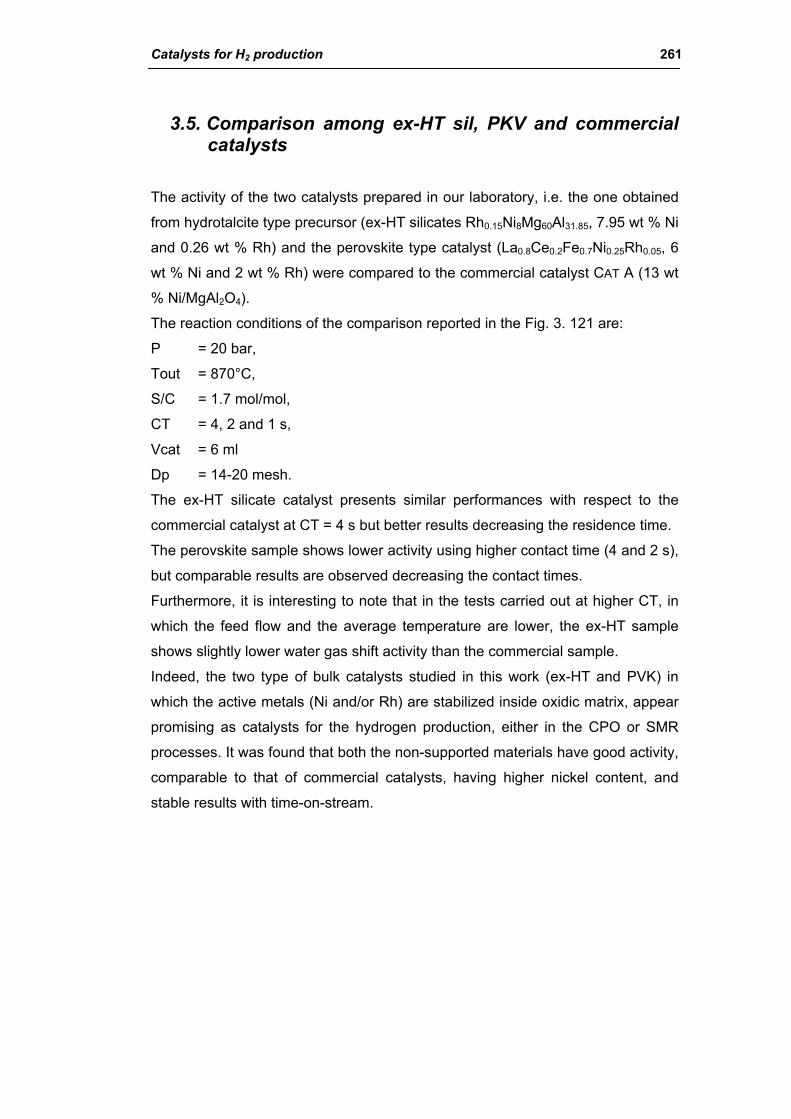
Catalysts for H2 production 261
3.5. Comparison among ex-HT sil, PKV and commercial catalysts
The activity of the two catalysts prepared in our laboratory, i.e. the one obtained
from hydrotalcite type precursor (ex-HT silicates Rh0.15Ni8Mg60Al31.85, 7.95 wt % Ni
and 0.26 wt % Rh) and the perovskite type catalyst (La0.8Ce0.2Fe0.7Ni0.25Rh0.05, 6
wt % Ni and 2 wt % Rh) were compared to the commercial catalyst CAT A (13 wt
% Ni/MgAl2O4).
The reaction conditions of the comparison reported in the Fig. 3. 121 are:
P = 20 bar,
Tout = 870°C,
S/C = 1.7 mol/mol,
CT = 4, 2 and 1 s,
Vcat = 6 ml
Dp = 14-20 mesh.
The ex-HT silicate catalyst presents similar performances with respect to the
commercial catalyst at CT = 4 s but better results decreasing the residence time.
The perovskite sample shows lower activity using higher contact time (4 and 2 s),
but comparable results are observed decreasing the contact times.
Furthermore, it is interesting to note that in the tests carried out at higher CT, in
which the feed flow and the average temperature are lower, the ex-HT sample
shows slightly lower water gas shift activity than the commercial sample.
Indeed, the two type of bulk catalysts studied in this work (ex-HT and PVK) in
which the active metals (Ni and/or Rh) are stabilized inside oxidic matrix, appear
promising as catalysts for the hydrogen production, either in the CPO or SMR
processes. It was found that both the non-supported materials have good activity,
comparable to that of commercial catalysts, having higher nickel content, and
stable results with time-on-stream.
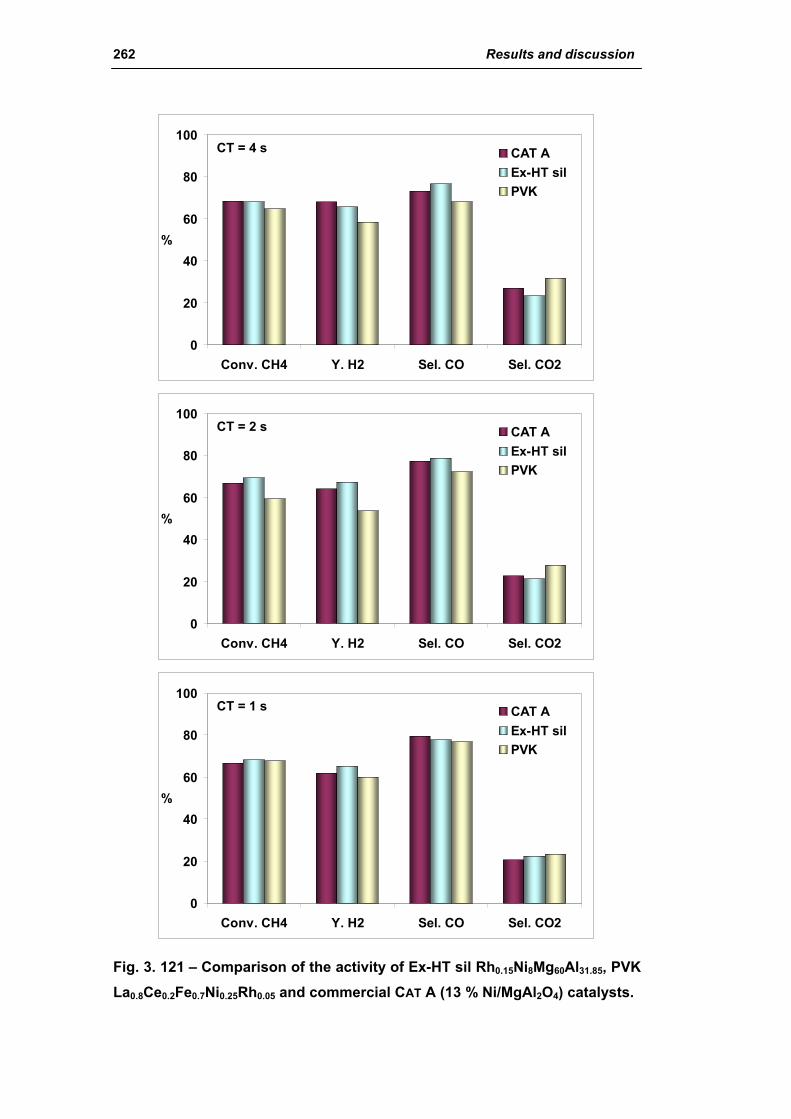
262 Results and discussion
0
20
40
60
80
100
Conv. CH4 Y. H2 Sel. CO Sel. CO2
%
CAT AEx-HT silPVK
CT = 4 s
0
20
40
60
80
100
Conv. CH4 Y. H2 Sel. CO Sel. CO2
%
CAT AEx-HT silPVK
CT = 2 s
0
20
40
60
80
100
Conv. CH4 Y. H2 Sel. CO Sel. CO2
%
CAT AEx-HT silPVK
CT = 1 s
Fig. 3. 121 – Comparison of the activity of Ex-HT sil Rh0.15Ni8Mg60Al31.85, PVK La0.8Ce0.2Fe0.7Ni0.25Rh0.05 and commercial CAT A (13 % Ni/MgAl2O4) catalysts.
Catalysts for H2 production 263
3.6. Structured catalysts: support with high thermal conductivity
Due to severe reaction conditions of the steam reforming, such as high
temperature, pressure and hydrogen content, industrial plants register problems
linked to materials: tube resistance to high temperatures, catalyst deactivation
and diffusion limitation through the catalyst. In particular, the temperature in the
tube may range from 600°C to 950°C because high heat fluxes are necessary,
due to the high endothermicity of the reaction. In these conditions, the
temperature difference between the external- and inner-tube wall can be higher
than 60°C for a thickness of 15 mm: due to this strong stress, the tube may crack
during operation. The catalyst deactivation increases this problem, since higher
temperatures are required to achieve the same results. Reaction rate is strongly
affected by the heat transfer of the ceramic pellets, and the residence time is
necessarily high (2-4 s).
To avoid all these problems, a catalyst support having high thermal conductivity
could be used. This kind of support can increase the heat transfer radially and
along the bed, thus making it possible to operate at lower residence times, while
smoothing the thermal profile both inside the reactor tube and at the interface
between the tube wall and catalyst.
Silicon carbide (SiC) and metallic foam (FeCrAlY) supported catalysts were
prepared and tested in order to study differently shaped supported catalysts
(pellets and foams) characterized by high thermal conductivity, such as ceramic
carbide, metal gauze and alloy.
3.6.1. Ni/SiC catalysts
Silicon carbide exhibits a high thermal conductivity and mechanical strength, a
low specific weight, and chemical stability: these features make it a promising
candidate as a catalyst support in place of the traditional insulator supports
(Al2O3, MgAl2O4) either in several highly endothermic or exothermic reactions or
in aggressive reaction media124, 125. Indeed, silicon carbide has been chosen as a
support for steam methane reforming (SMR) because its good conductive
properties that may improve the temperature profile. In fact it can decrease the
high ∆T caused by the high endothermicity of the reaction and, at the same time,

264 Results and discussion
increase the heat transfer from external furnace, reactor wall and catalyst
particles.
10 wt % Ni was deposited on the SiC support by incipient wetness impregnation.
The sample was calcined at different temperatures (500, 700 and 900°C) in order
to study both the chemical-physical properties and the interaction between the
support and active phases. The sample calcined at 700°C was tested in a SMR
laboratory plant under different operative conditions, in order to evaluate the
activity and stability with time-on-stream.
The catalysts (10 wt % Ni/SiC) were prepared by incipient wetness impregnation
using Ni(NO3)2 as nickel precursor and pellets of SiC (0.84 - 1.41 mm) as support
by grinding cylinder on 8-14 mesh sieves. The SiC cylinders (type β-SiC) were
produced by SICAT France. Three samples were prepared and calcined at 500
and 700°C for 2 h, and at 900°C for 12 h.
The samples of Ni/SiC catalyst calcined at three different temperatures (500, 700
and 900°C) showed only SiC and NiO phases (Fig. 3. 122). It can be observed
that the sample calcined at 900°C showed an amorphous band between 20-
30°2θ, attributable to SiO2 formation during the thermal treatment at that high
temperature. Furthermore, the XRD and the BET results showed that the
calcination temperature does not affect significantly the NiO crystal size (20-30
nm) nor the surface area values of the support (18-22 m2/g), which did not show
any significant change even after impregnation and thermal treatment.
After reduction at 800°C for 2 h, the sample calcined at 900°C showed the
presence of metallic Ni together with a Ni2Si phase; while the samples calcined at
lower temperatures (500 and 700°C) showed the Ni2Si phase only (Fig. 3. 123).
The presence of this phase may be due to the direct reaction between metallic Ni
(formed at 500°C) and SiC, a reaction that is thermally activated over 600°C,
while Ni2Si is stable up to 950°C126, 127, 128.

Catalysts for H2 production 265
Inte
nsity
(a.u
.)In
tens
ity (a
.u.)
Fig. 3. 122 – XRD patterns of SiC support and of 10 % Ni /SiC calcined at 500°C, 700°C and 900°C.
Inte
nsity
(a.u
.)In
tens
ity (a
.u.)
Fig. 3. 123 – XRD patterns of reduced samples (previously calcined at 500°C, 700°C, and 900°C).
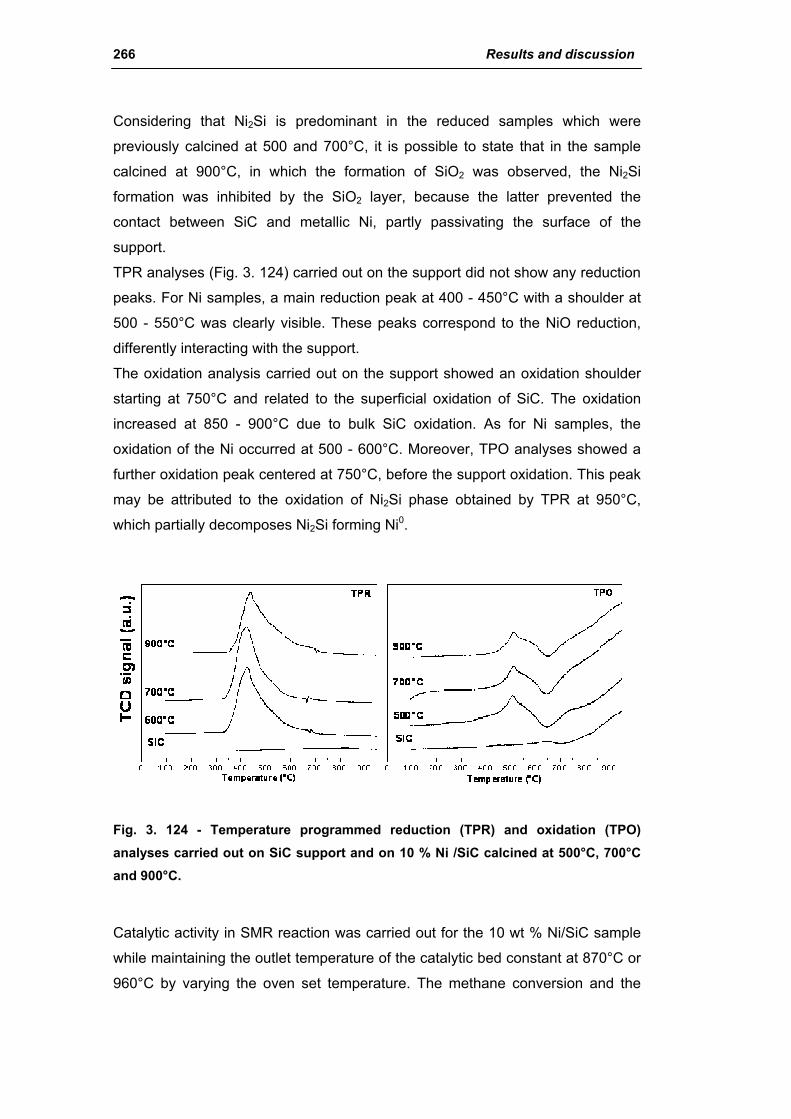
266 Results and discussion
Considering that Ni2Si is predominant in the reduced samples which were
previously calcined at 500 and 700°C, it is possible to state that in the sample
calcined at 900°C, in which the formation of SiO2 was observed, the Ni2Si
formation was inhibited by the SiO2 layer, because the latter prevented the
contact between SiC and metallic Ni, partly passivating the surface of the
support.
TPR analyses (Fig. 3. 124) carried out on the support did not show any reduction
peaks. For Ni samples, a main reduction peak at 400 - 450°C with a shoulder at
500 - 550°C was clearly visible. These peaks correspond to the NiO reduction,
differently interacting with the support.
The oxidation analysis carried out on the support showed an oxidation shoulder
starting at 750°C and related to the superficial oxidation of SiC. The oxidation
increased at 850 - 900°C due to bulk SiC oxidation. As for Ni samples, the
oxidation of the Ni occurred at 500 - 600°C. Moreover, TPO analyses showed a
further oxidation peak centered at 750°C, before the support oxidation. This peak
may be attributed to the oxidation of Ni2Si phase obtained by TPR at 950°C,
which partially decomposes Ni2Si forming Ni0.
Fig. 3. 124 - Temperature programmed reduction (TPR) and oxidation (TPO) analyses carried out on SiC support and on 10 % Ni /SiC calcined at 500°C, 700°C and 900°C.
Catalytic activity in SMR reaction was carried out for the 10 wt % Ni/SiC sample
while maintaining the outlet temperature of the catalytic bed constant at 870°C or
960°C by varying the oven set temperature. The methane conversion and the
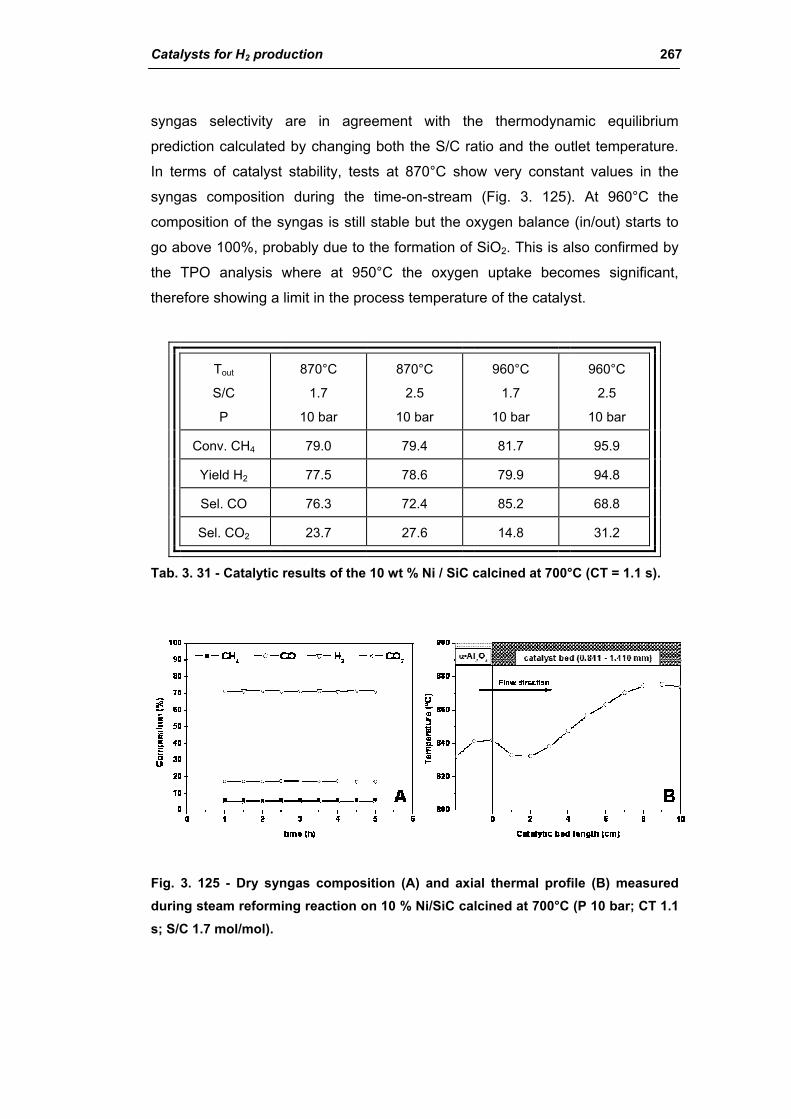
Catalysts for H2 production 267
syngas selectivity are in agreement with the thermodynamic equilibrium
prediction calculated by changing both the S/C ratio and the outlet temperature.
In terms of catalyst stability, tests at 870°C show very constant values in the
syngas composition during the time-on-stream (Fig. 3. 125). At 960°C the
composition of the syngas is still stable but the oxygen balance (in/out) starts to
go above 100%, probably due to the formation of SiO2. This is also confirmed by
the TPO analysis where at 950°C the oxygen uptake becomes significant,
therefore showing a limit in the process temperature of the catalyst.
Tout
S/C
P
870°C
1.7
10 bar
870°C
2.5
10 bar
960°C
1.7
10 bar
960°C
2.5
10 bar
Conv. CH4 79.0 79.4 81.7 95.9
Yield H2 77.5 78.6 79.9 94.8
Sel. CO 76.3 72.4 85.2 68.8
Sel. CO2 23.7 27.6 14.8 31.2
Tab. 3. 31 - Catalytic results of the 10 wt % Ni / SiC calcined at 700°C (CT = 1.1 s).
Fig. 3. 125 - Dry syngas composition (A) and axial thermal profile (B) measured during steam reforming reaction on 10 % Ni/SiC calcined at 700°C (P 10 bar; CT 1.1 s; S/C 1.7 mol/mol).
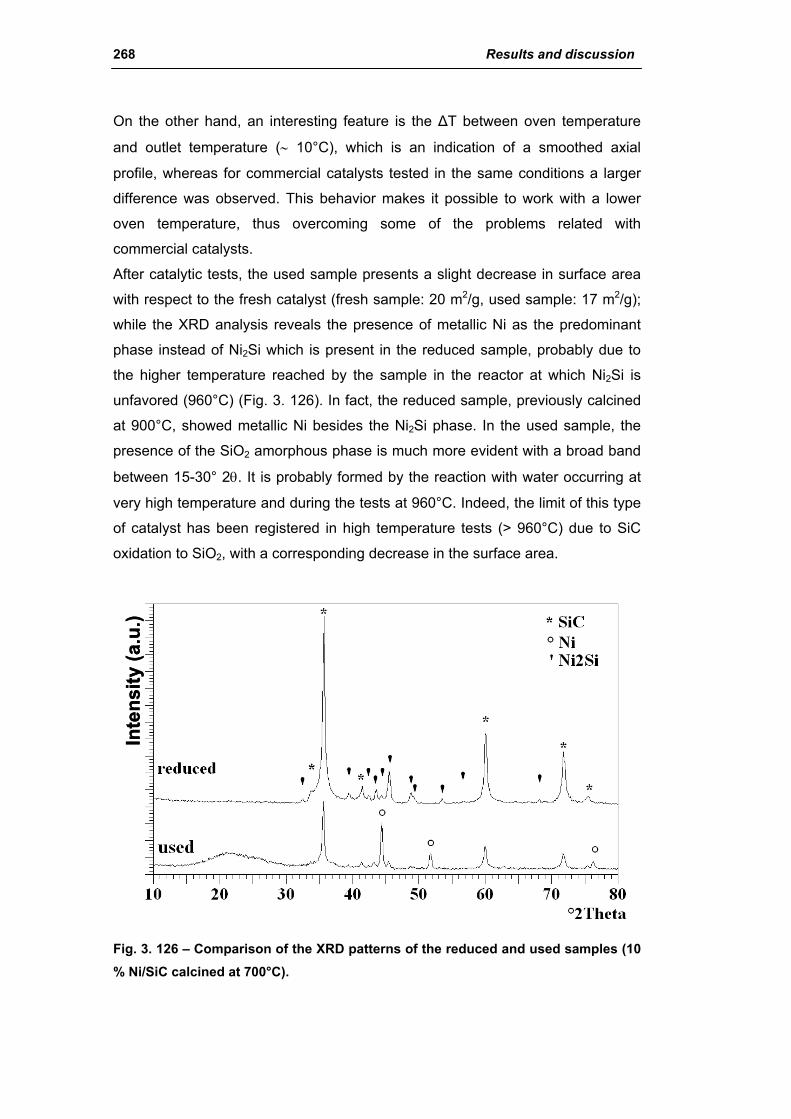
268 Results and discussion
On the other hand, an interesting feature is the ∆T between oven temperature
and outlet temperature (∼ 10°C), which is an indication of a smoothed axial
profile, whereas for commercial catalysts tested in the same conditions a larger
difference was observed. This behavior makes it possible to work with a lower
oven temperature, thus overcoming some of the problems related with
commercial catalysts.
After catalytic tests, the used sample presents a slight decrease in surface area
with respect to the fresh catalyst (fresh sample: 20 m2/g, used sample: 17 m2/g);
while the XRD analysis reveals the presence of metallic Ni as the predominant
phase instead of Ni2Si which is present in the reduced sample, probably due to
the higher temperature reached by the sample in the reactor at which Ni2Si is
unfavored (960°C) (Fig. 3. 126). In fact, the reduced sample, previously calcined
at 900°C, showed metallic Ni besides the Ni2Si phase. In the used sample, the
presence of the SiO2 amorphous phase is much more evident with a broad band
between 15-30° 2θ. It is probably formed by the reaction with water occurring at
very high temperature and during the tests at 960°C. Indeed, the limit of this type
of catalyst has been registered in high temperature tests (> 960°C) due to SiC
oxidation to SiO2, with a corresponding decrease in the surface area.
Inte
nsity
(a.u
.)In
tens
ity (a
.u.)
Fig. 3. 126 – Comparison of the XRD patterns of the reduced and used samples (10 % Ni/SiC calcined at 700°C).
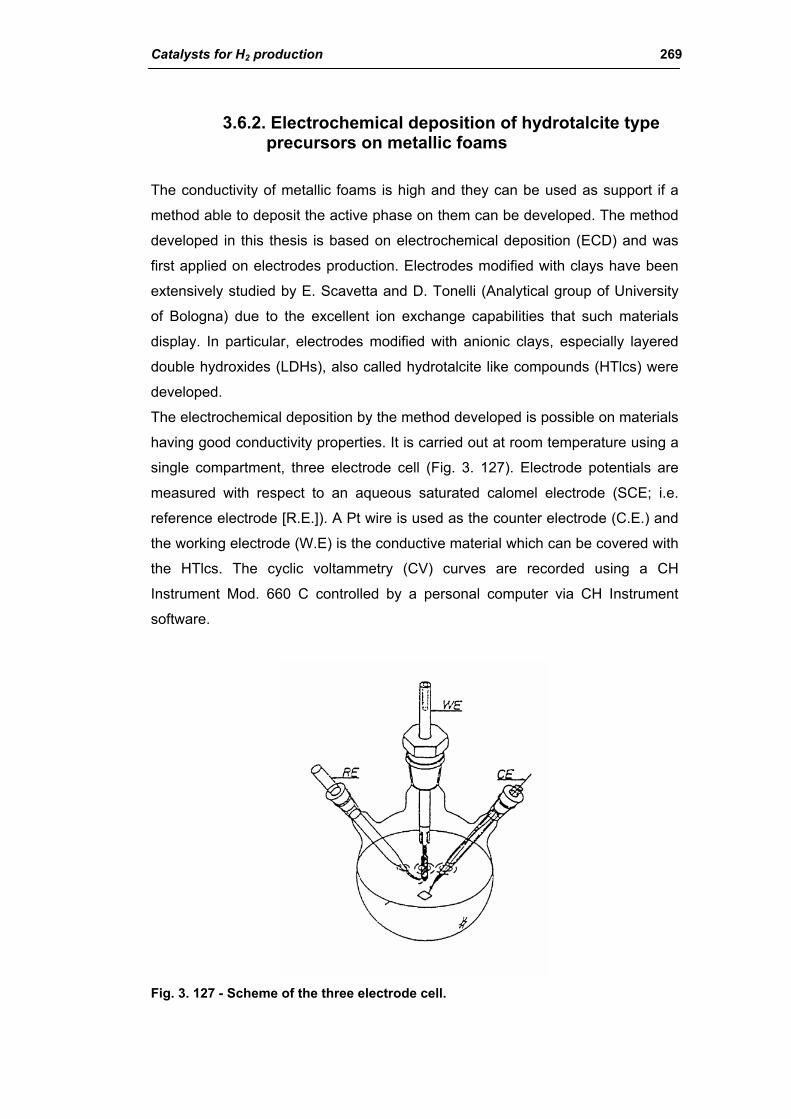
Catalysts for H2 production 269
3.6.2. Electrochemical deposition of hydrotalcite type precursors on metallic foams
The conductivity of metallic foams is high and they can be used as support if a
method able to deposit the active phase on them can be developed. The method
developed in this thesis is based on electrochemical deposition (ECD) and was
first applied on electrodes production. Electrodes modified with clays have been
extensively studied by E. Scavetta and D. Tonelli (Analytical group of University
of Bologna) due to the excellent ion exchange capabilities that such materials
display. In particular, electrodes modified with anionic clays, especially layered
double hydroxides (LDHs), also called hydrotalcite like compounds (HTlcs) were
developed.
The electrochemical deposition by the method developed is possible on materials
having good conductivity properties. It is carried out at room temperature using a
single compartment, three electrode cell (Fig. 3. 127). Electrode potentials are
measured with respect to an aqueous saturated calomel electrode (SCE; i.e.
reference electrode [R.E.]). A Pt wire is used as the counter electrode (C.E.) and
the working electrode (W.E) is the conductive material which can be covered with
the HTlcs. The cyclic voltammetry (CV) curves are recorded using a CH
Instrument Mod. 660 C controlled by a personal computer via CH Instrument
software.
Fig. 3. 127 - Scheme of the three electrode cell.
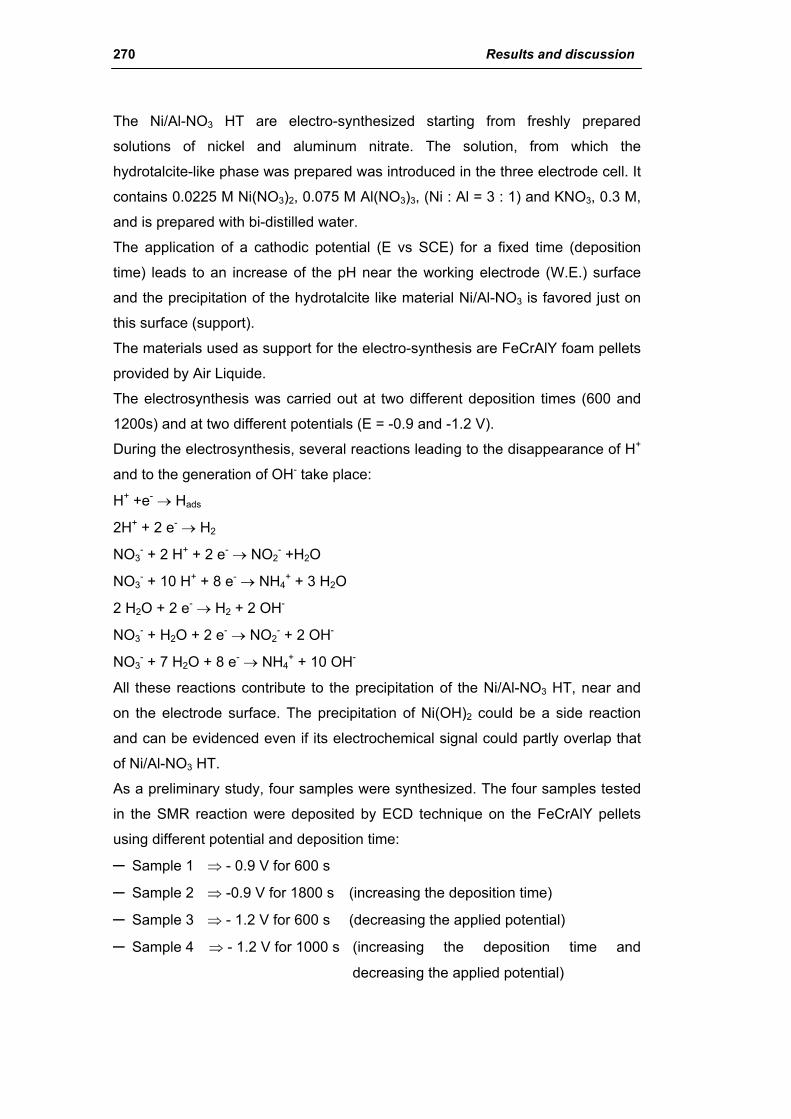
270 Results and discussion
The Ni/Al-NO3 HT are electro-synthesized starting from freshly prepared
solutions of nickel and aluminum nitrate. The solution, from which the
hydrotalcite-like phase was prepared was introduced in the three electrode cell. It
contains 0.0225 M Ni(NO3)2, 0.075 M Al(NO3)3, (Ni : Al = 3 : 1) and KNO3, 0.3 M,
and is prepared with bi-distilled water.
The application of a cathodic potential (E vs SCE) for a fixed time (deposition
time) leads to an increase of the pH near the working electrode (W.E.) surface
and the precipitation of the hydrotalcite like material Ni/Al-NO3 is favored just on
this surface (support).
The materials used as support for the electro-synthesis are FeCrAlY foam pellets
provided by Air Liquide.
The electrosynthesis was carried out at two different deposition times (600 and
1200s) and at two different potentials (E = -0.9 and -1.2 V).
During the electrosynthesis, several reactions leading to the disappearance of H+
and to the generation of OH- take place:
H+ +e- → Hads
2H+ + 2 e- → H2
NO3- + 2 H+ + 2 e- → NO2
- +H2O
NO3- + 10 H+ + 8 e- → NH4
+ + 3 H2O
2 H2O + 2 e- → H2 + 2 OH-
NO3- + H2O + 2 e- → NO2
- + 2 OH-
NO3- + 7 H2O + 8 e- → NH4
+ + 10 OH-
All these reactions contribute to the precipitation of the Ni/Al-NO3 HT, near and
on the electrode surface. The precipitation of Ni(OH)2 could be a side reaction
and can be evidenced even if its electrochemical signal could partly overlap that
of Ni/Al-NO3 HT.
As a preliminary study, four samples were synthesized. The four samples tested
in the SMR reaction were deposited by ECD technique on the FeCrAlY pellets
using different potential and deposition time:
─ Sample 1 ⇒ - 0.9 V for 600 s
─ Sample 2 ⇒ -0.9 V for 1800 s (increasing the deposition time)
─ Sample 3 ⇒ - 1.2 V for 600 s (decreasing the applied potential)
─ Sample 4 ⇒ - 1.2 V for 1000 s (increasing the deposition time and
decreasing the applied potential)

Catalysts for H2 production 271
The deposition was carried out on six pellets for loading the SMR reactor for 6 cm
in height to compare with the commercial catalysts.
The steam reforming tests were carried out with the reaction conditions of P = 20
bar, CT = 4 s, S/C = 1.7, Toven = 900°C.
After electrochemical deposition and drying, the pellets were calcined at 900°C
for 12 h, loaded in the SMR reactor and reduced in situ at 900°C for 2 h with a
H2/N2 equimolar flow. It was assumed that, after calcination, the phases present
on the support are NiO and NiAl2O4. As previously seen, the spinel phase is
reduced at very high temperature, indeed the reduction temperature was set at
900°C.
In Fig. 3. 128 the daily trend of the activity of Sample 1 is represented. The
activity was not good and it continuously decreased from the beginning of the test
to the stop of the reaction after 6.5 h. The low value and the significant decrease
of the activity, that is an evidence of very poor stability of the catalyst, can be
attributable to the low thickness of the layer of active phase deposited on the
monolithic metallic pellets. The axial thermal profile measured during reaction
was not stable, different profiles of the catalytic bed were observed after 2 h and
after 5 h of reaction (Fig. 3. 129), reflecting the instability of the activity.
SAMPLE 1: 600 s and - 0.9 V
0
20
40
60
80
100
0.0 1.0 2.0 3.0 4.0 5.0 6.0 7.0time (h)
%
Conv. CH4 Sel. CO Y. H2 Sel. CO2
Sel. CO = 56.9 %
Sel. CO = 46.6 %
Sel. CO2 = 53.4 %
Sel. CO2 = 43.1 %Conv. CH4 = 33.4 %
Conv. CH4 = 22.9 %
Yield H2 = 21.3 %Yield H2 = 29.9 %
Fig. 3. 128 - Activity of Sample 1 (6 pellets) during 1 day of SMR tests (P = 20 bar, CT = 4 s, S/C = 1.7, Toven = 900°C).

272 Results and discussion
800810820830840850860870880890900
20 22 24 26 28 30bed lenght (cm)
T (°
C)
Fig. 3. 129 - Axial thermal profile of the catalytic bed recorded during SMR reaction on the Sample 1 (T1 after 2 h of reaction and T2 after 6 h).
The effect of increasing the thickness and the stability of the layer of the
hydrotalcite precursor deposited on the support was studied either by tripling the
deposition time (from 600 s to 1800 s, Sample 2) or by changing the applied
potential values from -0.9 to -1.2 V and maintaining a deposition time of 600 s
(Sample 3).
The results obtained from Sample 2 (- 0.9 V for 1800s) are reported in Fig. 3.
130. In this case, the activity and the stability with time-on-stream are higher than
those of the Sample 1 and, even if are still lower than those of commercial
samples, it is evident that increasing the deposition time of three times leads to a
significant improvement of the performances and in particular of the stability of
the conversion and selectivity values. This behavior may be related to the
improvement occurred in the deposited HT layer, probably it was obtained a more
homogeneous and thick layer.
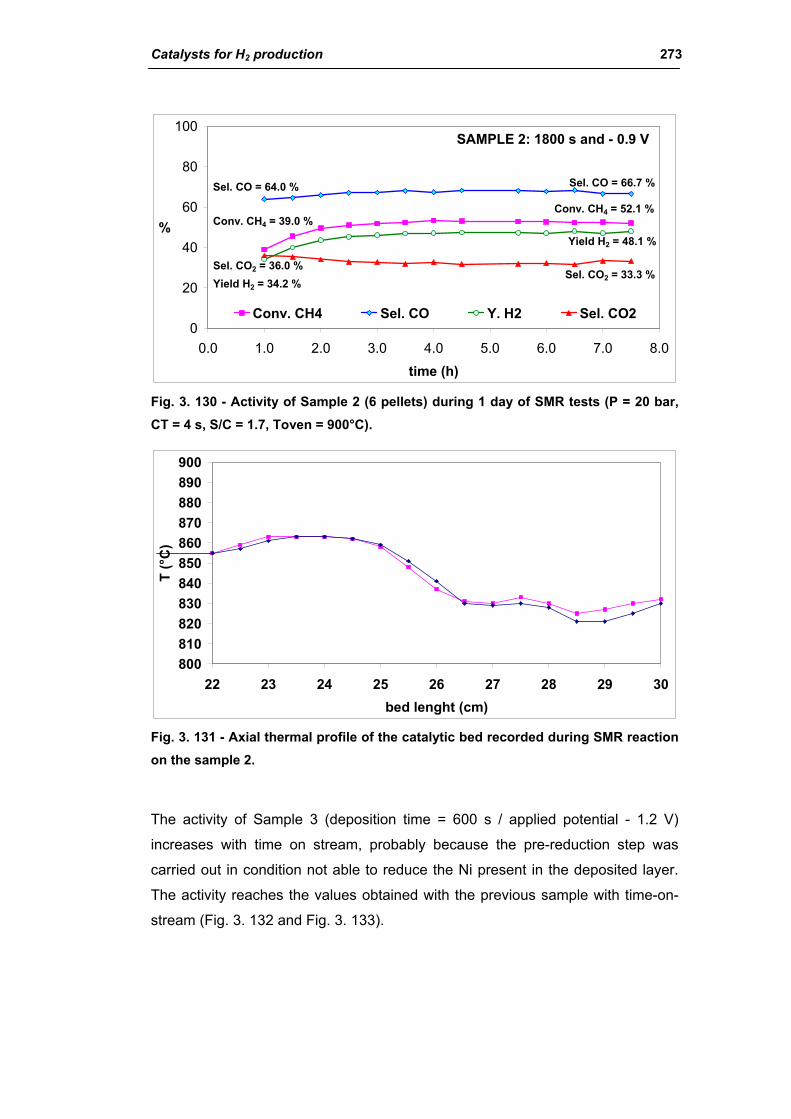
Catalysts for H2 production 273
SAMPLE 2: 1800 s and - 0.9 V
0
20
40
60
80
100
0.0 1.0 2.0 3.0 4.0 5.0 6.0 7.0 8.0time (h)
%
Conv. CH4 Sel. CO Y. H2 Sel. CO2
Sel. CO = 64.0 % Sel. CO = 66.7 %
Sel. CO2 = 33.3 %Sel. CO2 = 36.0 %
Conv. CH4 = 39.0 %Conv. CH4 = 52.1 %
Yield H2 = 48.1 %
Yield H2 = 34.2 %
Fig. 3. 130 - Activity of Sample 2 (6 pellets) during 1 day of SMR tests (P = 20 bar, CT = 4 s, S/C = 1.7, Toven = 900°C).
800810820830840850860870880890900
22 23 24 25 26 27 28 29 30bed lenght (cm)
T (°
C)
Fig. 3. 131 - Axial thermal profile of the catalytic bed recorded during SMR reaction on the sample 2.
The activity of Sample 3 (deposition time = 600 s / applied potential - 1.2 V)
increases with time on stream, probably because the pre-reduction step was
carried out in condition not able to reduce the Ni present in the deposited layer.
The activity reaches the values obtained with the previous sample with time-on-
stream (Fig. 3. 132 and Fig. 3. 133).
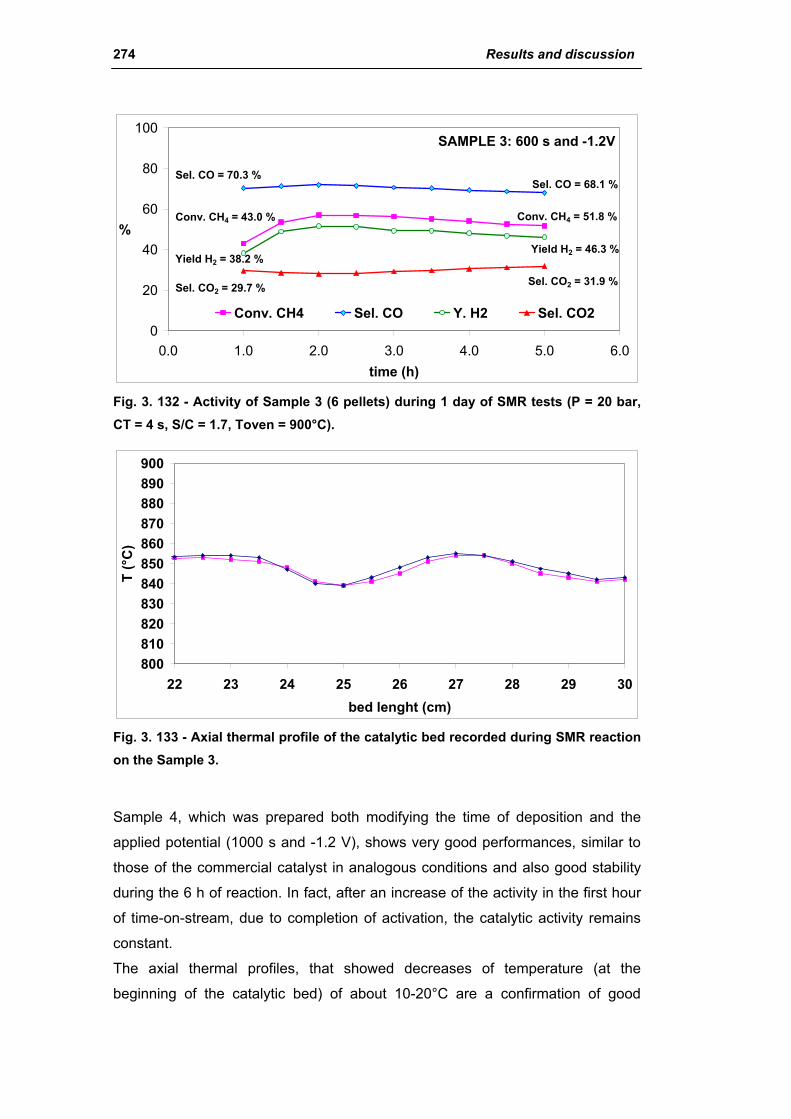
274 Results and discussion
SAMPLE 3: 600 s and -1.2V
0
20
40
60
80
100
0.0 1.0 2.0 3.0 4.0 5.0 6.0time (h)
%
Conv. CH4 Sel. CO Y. H2 Sel. CO2
Sel. CO = 70.3 %Sel. CO = 68.1 %
Sel. CO2 = 31.9 %Sel. CO2 = 29.7 %
Conv. CH4 = 43.0 % Conv. CH4 = 51.8 %
Yield H2 = 46.3 %Yield H2 = 38.2 %
Fig. 3. 132 - Activity of Sample 3 (6 pellets) during 1 day of SMR tests (P = 20 bar, CT = 4 s, S/C = 1.7, Toven = 900°C).
800810820830840850860870880890900
22 23 24 25 26 27 28 29 30bed lenght (cm)
T (°
C)
Fig. 3. 133 - Axial thermal profile of the catalytic bed recorded during SMR reaction on the Sample 3.
Sample 4, which was prepared both modifying the time of deposition and the
applied potential (1000 s and -1.2 V), shows very good performances, similar to
those of the commercial catalyst in analogous conditions and also good stability
during the 6 h of reaction. In fact, after an increase of the activity in the first hour
of time-on-stream, due to completion of activation, the catalytic activity remains
constant.
The axial thermal profiles, that showed decreases of temperature (at the
beginning of the catalytic bed) of about 10-20°C are a confirmation of good
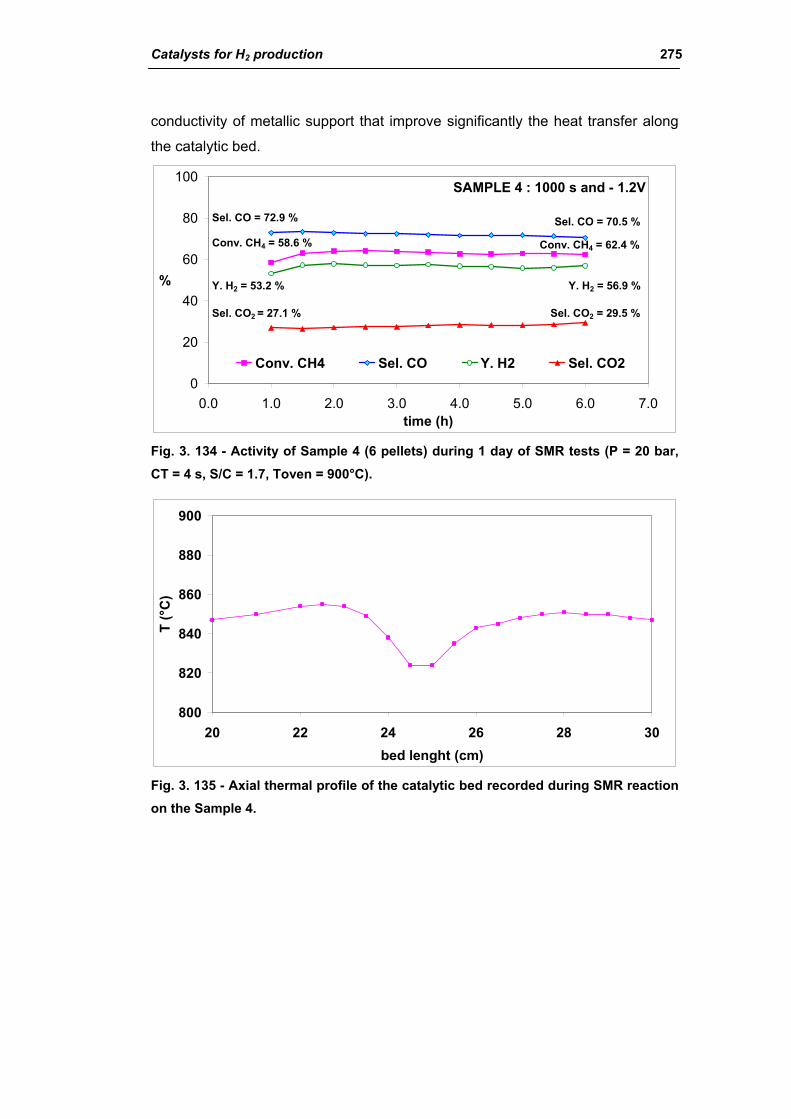
Catalysts for H2 production 275
conductivity of metallic support that improve significantly the heat transfer along
the catalytic bed.
SAMPLE 4 : 1000 s and - 1.2V
0
20
40
60
80
100
0.0 1.0 2.0 3.0 4.0 5.0 6.0 7.0time (h)
%
Conv. CH4 Sel. CO Y. H2 Sel. CO2
Sel. CO = 72.9 %
Conv. CH4 = 58.6 %
Y. H2 = 53.2 %
Sel. CO2 = 27.1 %
Sel. CO = 70.5 %
Conv. CH4 = 62.4 %
Y. H2 = 56.9 %
Sel. CO2 = 29.5 %
Fig. 3. 134 - Activity of Sample 4 (6 pellets) during 1 day of SMR tests (P = 20 bar, CT = 4 s, S/C = 1.7, Toven = 900°C).
800
820
840
860
880
900
20 22 24 26 28 30bed lenght (cm)
T (°
C)
Fig. 3. 135 - Axial thermal profile of the catalytic bed recorded during SMR reaction on the Sample 4.
276 Conclusions
CONCLUSIONS
The study of this thesis was focused on the development of new catalysts for the
hydrogen production through two different processes, a new one, the catalytic
partial oxidation (CPO), and an enhanced well-established process, the steam
methane reforming (SMR). Two types of new catalytic materials were examined:
■ Bulk catalysts, i.e. non-supported materials, in which the active metals (Ni
and/or Rh) are stabilized inside oxidic matrix, obtained from perovskite type
compounds (PVK) and from hydrotalcite type precursors (HT);
■ Structured catalysts, i.e. catalysts supported on materials having high
thermal conductivity (SiC and metallic foams).
The catalyst investigation on the partial oxidation process (CPO) follows a
previous work carried out in the laboratory of Department of Industrial Chemistry
and Materials of the University of Bologna.
A series of catalysts based on perovskite (PVK) catalysts were carefully studied
to determine the best sample formulation in order to enhance the activity, the
stability and the reducibility of this type of oxidic structures. The importance of
these structures is that they can found important application in O2- active
membrane and therefore can be important to couple good catalyst properties to
form layer active membrane.
Firstly, the effect of the insertion of rhodium and its optimal amount in a LaFeNiO3
perovskite was investigated. The rhodium resulted as a very important element
for improving the catalysts activity, especially in reaction conditions that are
desirable for an industrial process, probably due to the improved redox properties
of the couple Rh/Ni with respect to Ni alone. Furthermore, it is well-known that
noble metals are coke-resistant and can give a further beneficial effect, also in
this way, to the catalyst performance and life.
Afterwards, the effect of the insertion of low amounts cerium cation was
investigated due its redox properties and oxygen storage capacity. It was found
Catalysts for H2 production 277
that the cerium stabilize the perovskite structure during reaction, even if there is a
limit in the quantity that can be inserted in the PVK with beneficial effects. In
addition the catalytic performances were slightly improved in presence of low
amount of cerium, thus confirming double beneficial effect given by this metal.
Then, the optimal amount of Ni inserted in the structure was studied in order to
have the highest activity without excess of this metal. Indeed, an optimal
formulation was identified (La0.8Ce0.2Fe0.7Ni0.25Rh0.05O3), and on this sample the
effect of the calcination temperature, on the stability of the structure and on the
activity was investigated founding that a higher temperature (1100°C instead of
900°C) causes the formation of slightly more crystalline phases, but does not
improve the activity nor the structure stability.
A second series of samples was based on hydrotalcite type precursors,
containing silicate as interlayer anion, the role of the single active metal (Rh and
Ni) was investigated and their synergic effect was observed in samples
containing low active phase. It was found that the nickel gives a beneficial
contribution to the activity especially at lower temperatures and diluted feeds,
while the rhodium presents enhanced performances using more concentrated
feed and higher temperature. The sample containing both the active metals, but
½ amounts, presents always improved activity and stability, probably due to a
synergic effect established between Rh and Ni. Alloy formation with the high
activity cannot be excluded.
Moreover, the bulk matrix composition was studied in order to evaluate the effect
of the M2+/M3+ ratio. In systems like Ni/Mg/Al and Rh/Mg/Al, two ratios were
examined (65/35 or 80/20). The results show that the 80/20 ratio produces higher
catalytic performances because of the active metal is highly distributed in the
phases (MgO) where it gives high reducibility and increased stability during
reaction conditions.
Furthermore the role of the hydrotalcite type precursors as catalyst matrix or
support was investigated studying three different samples, containing the same
amount (wt %) of Ni and Rh, but prepared with different methodologies: an ex-HT
bulk sample, an impregnated catalyst, using a support obtained from a Ht
precursor and a bulk ex-HT catalyst supported on α-Al2O3. It was determined the
following scale of activity: supported bulk catalyst > bulk catalyst > impregnated
catalyst. The better performances of the bulk catalyst supported on α-Al2O3 may
278 Conclusions
be attributed to the higher availability and smaller dimensions of the metal
particles on the surface, obtained from a more concentrate bulk layer on the
alumina support, with respect to the bulk catalyst. The impregnated catalyst
showed the lowest activity due to weak interaction between metal particles and
support obtained using this technique than that obtained with a bulk catalyst in
which the metal are inserted in the structure and strongly connected with the
matrix.
In the second part of the work, regarding the steam methane reforming, due to
the advanced development of the industrial process, the study was initially
focused on the investigation of commercial catalysts, examining the deactivation
in industrial conditions, the role of the operating conditions (P, T, CT, S/C, Vcat
and Dp) and the activity of different type of catalysts.
The industrial spent samples, unloaded from different vertical section of catalytic
tubes coming from two steam reforming plants showed increased deactivation
phenomena going down through the tube. In particular, lower surface area, loss
of pores, bigger nickel crystal size and lower activity were observed. Moreover,
the presence of low active NiAl2O4 was confirmed. Nevertheless, carbonaceous
species cannot be individuated, due to switching off conditions of the plant
carried out with air or steam, that caused the elimination of possible carbon/coke
deposits on the surface.
Subsequently, the effect of the operation parameters in the steam reforming
laboratory plant were examined on a commercial catalyst constituted of 13 wt %
Ni/MgAl2O4. It was found that the reaction is close to the equilibrium and follows
its changes with the reaction parameters, thus:
• An increase of pressure (P, from 10 to 15 and 20 bar) is unfavorable for
the steam reforming reaction, while does not interfere with the water gas
shift contribution.
• An increase of the feed molar ratio (S/C = H2O/CH4, from 1.7 to 2.5
mol/mol) leads to a improvement of both steam reforming and water gas
shift reactions, with an increase of the H2/CO obtained ratio.
• An increase of the temperature profile (tests carried out maintaining
constant the outlet temperature at 870 and 930°C) strongly favors the
steam reforming reaction that is highly endothermic.
Furthermore, it is important to note that:
Catalysts for H2 production 279
• A decrease of the contact time (CT = 4, 2, 1.1 and 0.83 s) leads to a
decrease of the activity. However, the observation was influenced by the
radial profile (not measured) because the tests were carried out at
constant Tout, thus the oven set temperature were increased and there
was a contrary effect of axial/radial profiles. The real average temperature
of the catalytic bed increases due to higher heat supplied that improve the
activity at low CT.
• An increase of catalyst bed volume leads to an improvement of activity,
due to an increases of the surface through which the heat flux can be
delivered giving flat trend of temperature at the end of the bed.
Three different commercial catalysts (13 wt % Ni/MgAl2O4, 18 wt % Ni su
CaAl4O7, 14 wt % Ni su CaAl12O19) were characterized, tested in the steam
reforming process and compared. It was shown that in operative conditions,
similar to those used in industrial condition and not, the performances of the three
samples are very similar, probably due to high nickel content, over dimensioned
with respect to the reaction needs. However, the catalyst 13 wt % Ni/MgAl2O4,
seem to be the best, due to lower modification occurring during reaction (higher
surface area, lower nickel particle dimensions and indeed lower sintering). In
addition, also the 14 wt % Ni su CaAl12O19 catalyst may be a good choice for
industrial plant.
The bulk catalysts (PVK and HT) investigated in the catalytic partial oxidation of
methane, an ex-HT silicates Rh0.15Ni8Mg60Al31.85 and PVK
La0.8Ce0.2Fe0.7Ni0.25Rh0.05O3, were prepared and tested in the steam reforming
reaction giving very good results in terms of activity (comparable to that of
commercial catalysts) and of stability with time-on-stream. In particular the ex-HT
sample tested either at high S/C (2.5, 3 and 4 mol/mol) or low S/C (1.7, 1.4 and
1.1 mol/mol) showed constant results and low structure modification, especially
low metal sintering. The carbon species deposited on the surface of the ex-HT
silicates were observed and there are not significant differences among the used
samples until S/C = 1.4 mol/mol. Only the sample used with S/C = 1.1 mol/mol
showed an increase of amount of carbonaceous deposits.
Moreover, innovative materials for structured catalysts, SiC and metallic foam as
supports, were analyzed because their high thermal conductivity, in order to try to
overcome problems linked to heat transfer.
280 Conclusions
The samples obtained by impregnation of Ni on SiC pellets showed interesting
characterization due reaction between nickel and support (with the formation
during reduction of a Ni2Si intermetallic phase) that may be avoided calcining the
support at 900°C, because at this temperature a silica layer is formed and
isolates the Ni from the SiC support. However, a limitation is observed at high
temperature (> 960°C) due to formation of large amount of silica. This may be
avoided protecting the support by a oxidic layer (maybe alumina) from the contact
with oxidizing species.
Finally, a new method based on electrochemical deposition (ECD) was
developed to prepare innovative catalysts. ECD was used to deposits hydrotalcite
precursors on FeCrAlY metallic foams pellets. This was a preliminary study, in
which the time of deposition and the applied potential were investigated in order
to cover, with an uniform active layer of HT precursors, the metallic foam. In the
steam reforming reaction, good activity was reached. Each of the four samples,
prepared by decreasing the potential and increasing the deposition time,
increases the activity and the stability of the samples, and the last one (1000 s
and -1.2 V) shows the best performances comparable with those of the
commercial catalysts. This method, still not optimized, is very promising for
industrial catalyst production, due to very simple preparation procedure.
Catalysts for H2 production 281
REFERENCES
[1] M. Wietschel, U. Hasenauer, A. de Groot, Energy Policy,34 (2006) 1284
[2] J. R. Rostrup-Nielsen, Catal. Rev., 46 (2004) 247
[3] C. W. Forsberg, Int. J. Hydrogen Energy, 32 (2007) 431
[4] B.D. Solomon, A. Banerjee, Energy Policy,34 (2006) 781
[5] B.van Ruijven, D. P. van Vuuren, B. de Vries, Int. J. Hydrogen Energy,
Article in press available on line (2007)
[6] A. Hellman, K. Honkala, I.N. Remediakis, Á. Logadóttir, A. Carlsson, S.
Dahl, C.H. Christensen and J.K. Nørskov, Surf. Sci., 600 (2006) 4264
[7] M. V. Twigg, “Catalyst Handbook”, 2nd ed., Wolf Publishing Ltd (1989)
[8] Z. Yang, W. Guo, J. Lin, D. Liao, Chin. J. Catal.,27 (2006) 378
[9] C. Liang, Z. Wei, Q. Xin, C. Lin, Appl. Cat. A, 208 (2001) 193
[10] S. M. Yunusov, E. S. Kalyuzhnaya, B. L. Moroz, A. S. Ivanova, T. V.
Reshetenko, L. B. Avdeeva, V. A. Likholobov, V. B. Shur, J. Molec.
Catal. A, 219 (2004) 149
[11] P. Seetharamulu, V. Siva Kumar, A. H. Padmasri, B. David Raju, K. S.
Rama Rao, J. Molec Catal. A, 263 (2006) 253
[12] Q. Xu, J. Lin, J. Li, X. Fu, Z. Yang, W. Guo, D. Liao, J. Molec. Catal. A,
259 (2006) 218
[13] Z. Kirova-Yordanova, Energy, 29 (2004) 2373
[14] D. R. Parisi, M. A. Laborde, Chem. Eng. J., 104 (2004) 35
[15] X. Liu, G.Q. Lu, Z.Yan, J. Beltramini, Ind. Eng. Chem. Res., 42 (2003)
6518
[16] M. Stöcker, Microporous and Mesoporous Materials, 29 (1999) 3
282 References
[17] F. J. Keil, Microporous and Mesoporous Materials, 29 (1999) 49
[18] T. V. Choudary, D. W. Goodman, J. Molec. Catal. A, 163 (2000) 9
[19] S. Lee, A. Sardesai, Topics in Catalysis, 32 (2005) 197
[20] Y. Guo, W. Meyer-Zaika, M. Muhler, S. Vukojevic, M. Epple, Eur. J.
Inorg. Chem., (2006) 4774
[21] Nakamura, T. Fujitani, T. Uchijima, J. Nakamura, Surf. Sci., 400 (1998)
387
[22] M. Saito, K. Murata, Catal. Surveys from Asia, 8 (2004) 285
[23] G. A. Mills, Fuel, 73 (1994) 1243
[24] T. A. Semelsberger, R. L. Borup, H. L. Greene, J. Power Sources, 156
(2006) 497
[25] G. R. Moradi, S. Nosrati, F. Yaripor, Catal. Comm., 8 (2007) 598
[26] J. Fei, X. Tang, Z. Huo, H. Lou, X. Zheng, Catal. Comm., 7 (2006) 827
[27] K. Sun, W. Lu, F. Qiu, S. Liu, X. Xu, Appl. Cat. A, 252 (2003) 243
[28] V.U.S. Rao, G.J. Stiegel, G.J. Cinquegrane, R.D. Srivastava, Fuel
Processing Technology, 30 (1992) 83
[29] J. van de Loosdrecht, Ph.D. thesis, Utrecht University, The Netherlands
(1995).
[30] S. Morselli, Ph.D. thesis, Scuola Normale superiore di Pisa, Italy (2001)
[31] M. E. Dry, The Fischer-Tropsch Process-Commercial aspects, Elsevier
Science Publishers, (1990), 183
[32] H. Schulz, App. Catal. A, 186 (1999) 3
[33] C. H. Bartholomew, Stud, Surf. Sci and Catal., “New Trends in CO
Activation”, 64, Chp. 5, 158
[34] R. L. Espinoza, A. P. Steynberg, P. Jager, A. C. Voslao, App. Catal. A,
186 (1999) 13
[35] C. Song, Catal. Today, 77 (2002) 17
[36] M. Krumpelt, T. R. Krause, J. D. Carter, J. P. Kopasz, S. Ahmed, Catal.
Today, 77 (2002) 3
Catalysts for H2 production 283
[37] P. Ferreira-Aparicio, M. J. Benito, J. L. Sanz, Catalysis Reviews, 47
(2005) 491
[38] J. R. Rustrup-Nielsen, Catal. Today, 63 (2000) 159
[39] J. N. Armor, Appl. Cat. A, 176 (1999) 159
[40] J. N. Armor, Catalysis letters, 101 (2005) 131
[41] M. A. Peña, J. P. Gómez, J. L. G. Fierro, Appl. Cat. A, 144 (1996) 7
[42] J. R. Rustrup-Nielsen, Stud. Surf. Sci. Catal. “Natural gas conversion
VII”, 147 (2004) 121
[43] A. E. Lutz, R. W. Bradshaw, J. O. Keller, D. E. Witmer, Int. J. Hydrogen
Energy, 28 (2003) 159
[44] K. Jarosch, T. El Solh, H. I. de Lasa, Chem. Eng. Sci., 57 (2002) 3439
[45] J. Wei, E. Iglesia, J. Catal., 224 (2004) 370
[46] J. Wei, E. Iglesia, J. Catal., 225 (2004) 116
[47] D. Chen, E. Bjorgum, R. Lodeng, K. O. Christensen, A. Holmen, Stud.
Surf. Sci. Catal. - “Natural gas conversion VII”, 147 (2004) 139
[48] Y. Matsumura, T. Nakamori, Appl. Catal. A,. 258 (2004) 107
[49] Alstrup, B. S. Clausen, C. Olsen, R.H.H. Smits, J.R. Rustrup-Nielsen,
Stud. Surf. Sci. Catal. - “Natural gas conversion V”, 119 (1998) 5
[50] K. Takehira, T. Shishido, M. Kondo, J. Catal., 207 (2002) 307
[51] A. I. Tsyganok, T. Tsunoda, S. Hamakawa, K. Suzuki, K. Takehira, T.
Hayakawa, J. Catal., 213 (2003) 191
[52] K. Takehira, T. Shishido, D. Shouro, K. Murakami, M. Honda, T.
Kawabata, K. Takaki, App. Catal. A, 279 (2005) 41
[53] T. Ohi, T. Miyata, D. Li, T. Shishido, T. Kawabata, T. Sano, K. Takehira,
Appl. Catal. A, 308 (2006) 194
[54] A. Fonseca, E. M. Assaf, J. Power Sources, 142 (2005) 154
[55] M. Sturzenegger, L. D'Souza, R. P. W. J. Struis, S. Stucki, Fuel, 85
(2006) 1599
284 References
[56] H. Provendier, C. Petit, C. Estournès, S. Libs, A. Kiennemann, Appl.
Catal. A, 180 (2000) 163
[57] E. L. Foletto, R. W. Alves, S. L. Jahn, J. Power Sources, 161 (2006) 531
[58] N. Keghouche, S. Chettibi, F. Latrèche, M.M. Bettahar, J. Belloni, J.L.
Marignier, Radiation Physics and Chemistry, 74 (2005) 185
[59] O. Yamazaki, K. Tomishige, K. Fujimoto, Appl. Catal. A, 136 (1996) 49
[60] K. Tomishige, Y. Chen, O. Yamazaki, Y. Himeno, Y. Koganezawa and K.
Fujimoto, Stud. Surf. Sci. Catal. - “Natural gas conversion V”, 119 (1998)
861
[61] N. P. Siswana, D. L. Trimm, N. W. Cant, Stud. Surf. Sci. Catal. - “Natural
gas conversion V”, 119 (1998) 789
[62] W. Dong, H. Roh, K. Jun, S. Park, Y. Oh, Appl. Catal. A, 226 (2002) 63
[63] Y. Oh, H. Roh, K. Jun, Y. Baek, Intern. J. Hydrogen Energy, 28 (2003)
1387
[64] H. Roh, K. Jun, S. Park, Appl. Catal. A, 251 (2003) 275
[65] Q. Zhang, Y. Li, B. Xu, Catal. Tod., 98 (2004) 601
[66] T. Borowiecki, A. Denis, W. Gac, R. Dziembaj, Z. Piwowarska, M.
Drozdek, Appl. Catal. A, 274 (2004) 259
[67] R. Takahashi, S. Sato, T. Sodesawa, M. Yoshida, S. Tomiyama, Appl.
Catal. A, 273 (2004) 211
[68] K. Urasaki, Y. Sekine, S. Kawabe, E. Kikuchi, M. Matsukata, App. Catal.
A, 286 (2005) 23
[69] J. S. B. Wang, Y. L. Tai, W. P. Dow, T. J. Huang; Appl. Catal. A, 218
(2001) 69
[70] J. B: Wang, L. E. Kuo, T. J. Huang, Appl. Cata. A, 249 (2003) 93
[71] J. B: Wang, S.Z. Hsiao, T. J. Huang, Appl. Cata. A, 246 (2003) 197
[72] A. L. Sauvet, J. T. S. Irvine, Solid State Ionics, 167 (2004) 1
[73] Y. Wang, Y.H. Chin, R.T. Rozmiarek, B.R. Johnson, Y. Gao, J. Watson,
A.Y.L. Tonkovich, D.P. Vander Wiel, Catal. Tod., 98 (2004) 575
Catalysts for H2 production 285
[74] A. Ishihara, E. W. Qian, I. N. Finahari, I. P. Sutrisna, T. Kabe, Fuel, 84
(2005) 1462-1468
[75] R. Craciun, W. Daniell, H. Knözinger, App. Catal. A, 230 (2002) 153
[76] J.R. Rostrup-Nielsen, Catal.Tod., 37 (1997) 225
[77] C. H. Bartholomew, Appl. Catal. A, 212 (2001) 17
[78] C. H. Bartholomew, Catal. Rev. – Sci. Eng., 24 (1982) 67
[79] J. N. Armor, D. J. Martenak, Appl. Catal. A, 206 (2001) 231
[80] D. L. Trimm, Catal. Tod., 37 (1997) 233
[81] J. R. Rostrup-Nielsen, Stud. Surf. Sci. Catal. - “Natural gas conversion
II”, 81 (1994) 25
[82] J. R. Rostrup-Nielsen, J. Catal., 85 (1984) 31
[83] J. Sehested, J. A. P: Gelten, I.N. Remediakis, H. Bengaard, J. K.
Norskov, J. Catal. 223 (2004) 432
[84] J. Sehested, A. Carlson, T. V. W. Janssens, P. L Hansen, A. K. Datye, J.
Catal. 197 (2001) 200
[85] C. T Campbell, S. C Parker, D. E. Starr, Science, 298 (2002) 811
[86] J. Sehested, J. Catal., 217 (2003) 417
[87] Y. H. Hu, E. Ruckenstein, Adv. Catal., 48 (2004) 297
[88] V. R. Choudhary, A. M. Rajput, B. Prabhakar, Catal. Lett., 15 (1992) 363
[89] V. R. Choudhary, A. M. Rajput, B. Prabhakar, J. Catal., 139 (1993) 326
[90] V. R. Choudhary, A. M. Rajput, V. H. Rane, Catal. Lett., 16 (1992) 269
[91] V. R. Choudhary, A. M. Rajput, V. H. Rane, J. Phys. Chem., 96 (1992)
8686
[92] V. R. Choudhary, S. D. Sansare, A. S Mamman, Appl. Catal. A, 90
(1992) L1
[93] Y.H. Hu, E. Ruckenstein, Ind. Eng. Chem. Res., 37 (1998) 2333
[94] F. Basile, G. Fornasari, F. Trifiro, A. Vaccari, Catal. Tod., 64 (2001) 21
[95] G. R. Gavalas, C. Phichitcul, G. E. Voecks, J. Catal., 88 (1984) 54
286 References
[96] D. A. Hickman, L. D. Schmidt, J. Catal., 138 (1992) 267
[97] M. Reyniers, C. R. H. de Smet, P. G. Menon, G. B. Marin, Cattech., 6
(2002) 140
[98] A. P. E. York, T. Xiao, M. L. H. Green, Topics in Catalysis, 22 (2003) 345
[99] K. Takehira, Catalysis Surveys from Japan, 6 (2002) 19
[100] H. Provendier, C. Petit, C. Estournes, S. Libs and A. Kiennemann, Appl.
Catal. A, 180 (1999) 163.
[101] F. Basile, P. Del Gallo, G. Fornasari, D. Gary, A. Vaccari, EP 1419814
(2004) [JP 2004167485; US 20040127351]
[102] F. Trifiro`, A. Vaccari, in: J.L. Atwood, J.E.D. Davies, D.D. MacNicol, F.
Vögtle (Eds.), Comprehensive Supramolecular Chemistry, Pergamon
Press, Oxford, 7 (1996), Chapter 8, 251.
[103] F. Basile, L. Basini, M. D’Amore, G. Fornasari, A. Guarinoni, D.
Matteuzzi, G. Del Piero, F. Trifiro`, A. Vaccari, J. Catal., 173 (1998) 247
[104] F. Basile, G. Fornasari, E. Poluzzi, A. Vaccari, Appl. Clay Sci., 13 (1998)
329
[105] F. Basile, G. Fornasari, V. Rosetti, F. Trifirò, A. Vaccari, Catal. Tod., 91-92 (2004) 293
[106] S. Albertazzi, P. Arpentinier, F. Basile, G. Fornasari, D. Gary, A. Vaccari,
WO 03099436 (2003) [EP 1511566 (2005)]
[107] P. Arpentinier, F. Basile, P. Del Gallo, G. Fornasari, D. Gary, V. Rosetti,
A. Vaccari, Catal. Tod., 99 (2005) 99
[108] P. Arpentinier, F. Basile, P. del Gallo, G. Fornasari, D. Gary, V. Rosetti and A. Vaccari, Catal. Tod., 117 (2006) 462
[109] Basile, Basini, D’Amore, Fornasari, Guarinoni, Matteuzzi, Del Piero,
Trifirò and Vaccari, J. Catal., 173 (1998) 247
[110] Villa, Cristiani, Groppi, Lietti, Forzatti, Corsaro and Rossini, J. Molec.
Catal.A, 204-205 (2003) 637
[111] Hou, Yokota, Tanaka and Yashima, Appl.Catal. A, 253 (2003) 381
Catalysts for H2 production 287
[112] Villacampa, Royo, Romeo, Montpya, Del Angel and Monzon, Appl. Cata.
A, 252 (2003) 363
[113] Hyun-Seong Roh, Ki-Won Jun and sang-Eon Park, App. Catal. A, 251
(2003) 275
[114] Vos, Poels and Bliek, J. Catal., 198 (2001) 77
[115] Teixeira and Giudici, Chem. Eng. Sci., 54 (1999) 3609
[116] Dewaele and Froment, J. Catal., 184 (1999) 499
[117] C. Li and Y. Chen, Thermochem. Acta, 256 (1995) 457
[118] H.M. Swaan, V.C.H. Kroll, G.A. Martin, C. Mirodatos, Catal. Tod. 21
(1994) 571
[119] M.A. Goula, A. A. Lemonidou, A.M. Efstathiou, J. of Catal. 161 (1996)
626
[120] A. Shamsi, C.D. Johnson, Catal. Tod., 84 (2003) 17
[121] C.H. Bartolomew, Catal. Rev. – Sci. Eng., 24 (1982) 67
[122] W.K. Jozwiak, M. Nowosielska, J. Rynkowski, Appl.Catal. A: Gen. 280
(2005) 233
[123] M. Wisniewski, A. Boreave, P. Gelin, Catal. Comm. 6 (2005) 596
[124] P. Leroi, B. Madani, C. Pham-Huu, M. J. Ledoux, S. Savin-Poncet, J. L.
Bousquet, Catal. Today, 91-92 (2004) 53-58
[125] W-Z. Sun, G-Q. Jin, X-Y. Guo, Catal. Comm., 6 (2005) 135-139
[126] R. Roccaforte, F.la Via, V. Ranieri, P. Musumeci, L. Calcagno, G. G.
Condorelli, Appl. Phys A., 77 (2003) 727-833
[127] K.W. Richter, K. Chandrasekaran, H. Ipser, Intermetallics, 12 (2004)
545-554
[128] Y. Du, J. C. Schuster, Metall. Mater. Trans. A, 30A (1999) 2409-2418

Catalysts for H2 production
AKNOWLEDGEMENTS
I would like to thank AIR LIQUIDE for the financial support and a special
thank to DANIEL GARY and PASCAL DEL GALLO, for their personal
contribution to the work carried inside this collaboration.
I would like to thank PROF. VACCARI, who gives me the opportunity of doing
this PhD and his esteem, PROF. FORNASARI for his moral support,
availability and for his patient assistance in every occasion. Then, I would
like to thank DOTT. BASILE, who supervises my work and me, during these
years.
Furthermore, I want to thank all the people working in the Department of
Industrial Chemistry and Materials.
Finally, a heartfelt thankyou to everyone helps me in my work, especially
the students (FEDERICO, GIUSEPPE, ROBERTA, LEONARDO, ALESSANDRO,
ROCCO, MICHELE, RINALDO and IRENE) and PATRICIA and SIMONE.