categorical data analysis: when life fits in little boxes annmaria demars, phd
TRANSCRIPT

Categorical Data Analysis: When life fits in little boxes
AnnMaria DeMars, PhD.

What are we going to do today?
• Basic statistics • Logistic regression
An actual example
Are you going to die soon?

Our data
Kaiser Permanente Study of the Oldest Old, 1971-1979 and 1980-1988: [California]
DEPENDENT VARIABLE:Dthflag = 1 if Died during study period 0 if alive at end of study period

Our data
PREDICTOR VARIABLES:
Gendernursehome = 0 if lived at home continuously
1 = admitted to nursing home at any time
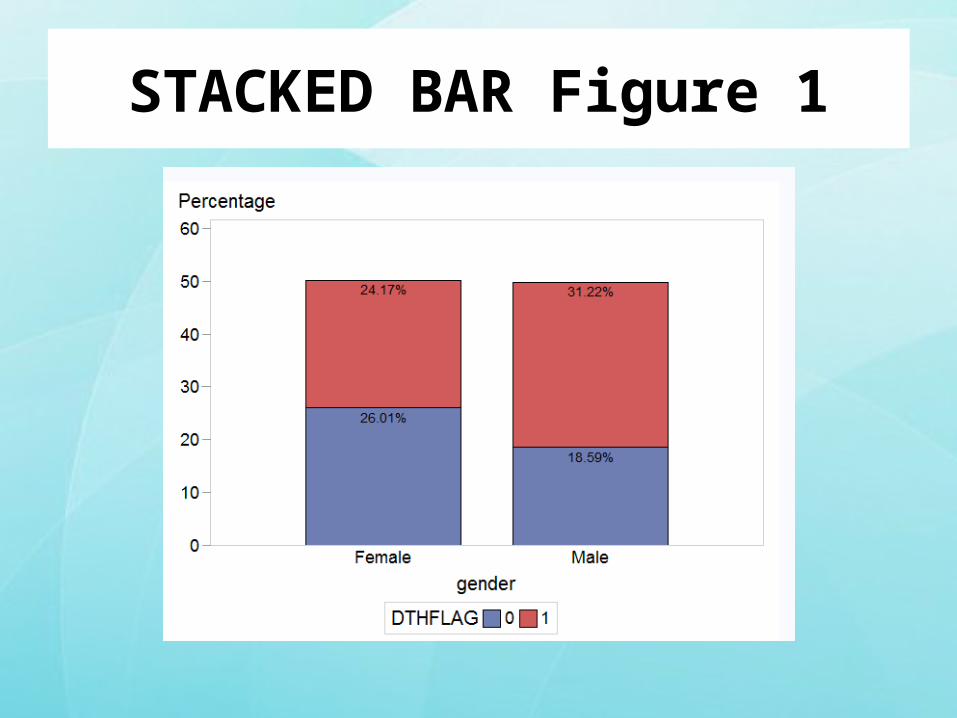
STACKED BAR Figure 1

STACKED BAR Figure 2

Compare the effects

…How to get one:STACKED BAR CHART
TASKS > GRAPHS

Stacked Bar Chart with SAS Enterprise
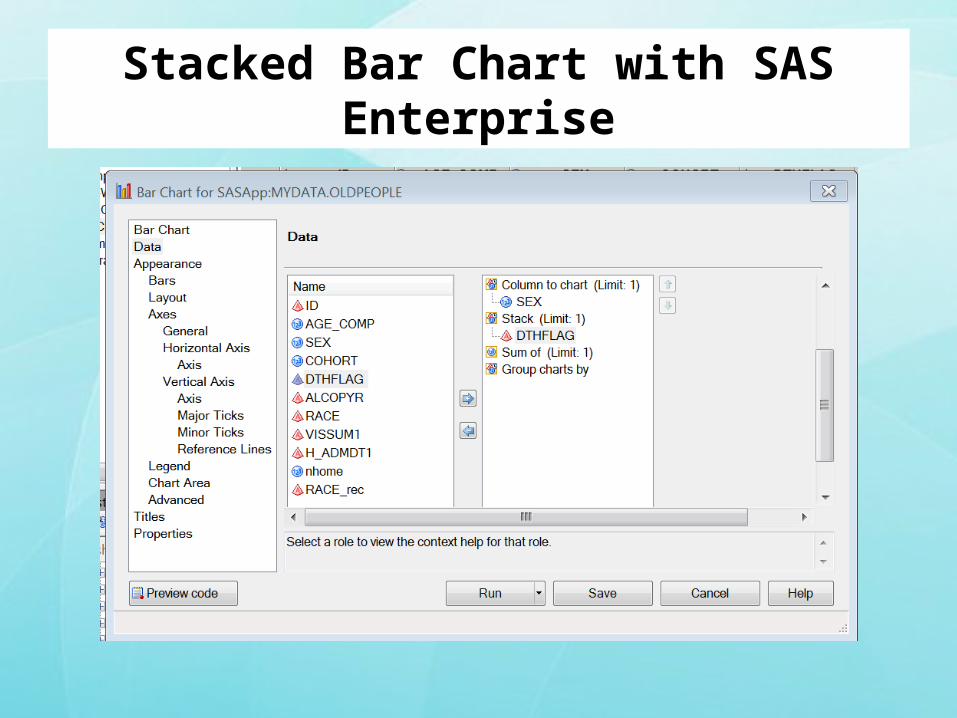
Stacked Bar Chart with SAS Enterprise

Stacked Bar Chart with SAS Enterprise

The Syntax
PROC GCHART DATA=mydata.oldpeople;
VBAR gender / SUBGROUP=dthflag TYPE= PCT INSIDE=PCT ;

Now a Brief Look at Logistic Regression

Our data
PREDICTOR VARIABLES:
Nursehome = lived in nursing home during studyAge_comp = age when study beganERvisits = number visits to ER during studyGender

Odds ratio
Value of 1.0 means :
The odds are the same for the two groups, e.g., women are just as likely to die as men


Receiver Operator Charactistics
• SENSITIVITY - the percentage of true positives, the people we predicted would die who did
• SPECIFICITY - or true negatives, the number of people we said would NOT die, who did not
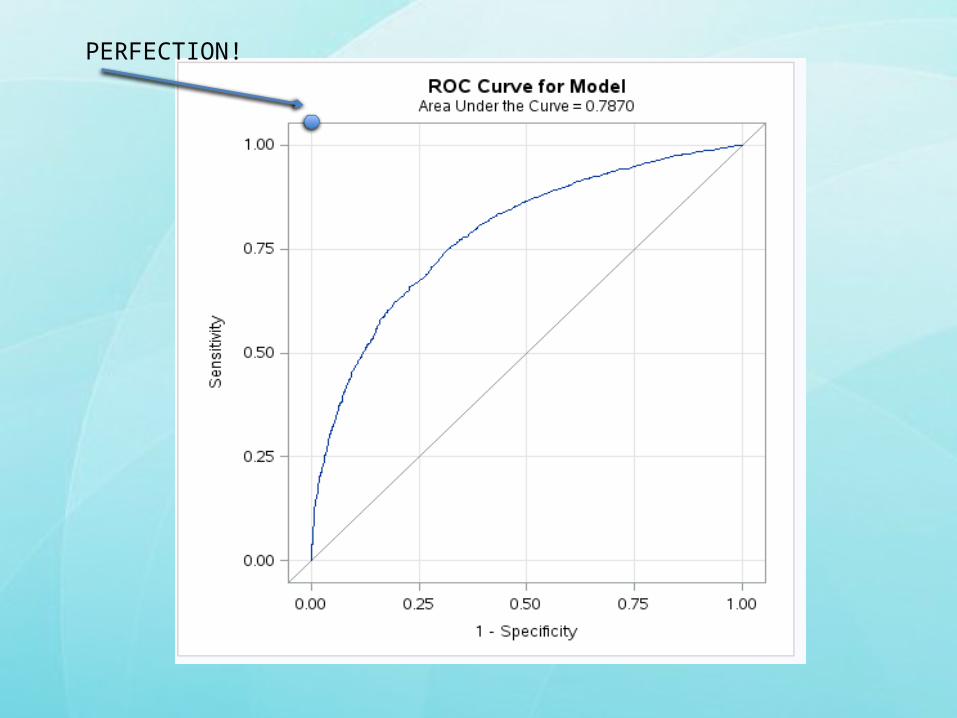
PERFECTION!

TASKS > REGRESSION > LOGISTIC

The Process:

