cathodoluminescence (cl) behaviour and crystal chemistry - rruff
TRANSCRIPT
Cathodoluminescence (CL) behaviour andcrystal chemistry of apatite from rare-metal deposits
U. KEMPE* AND J. GOTZE
TU Bergakademie Freiberg, Institute of Mineralogy, Brennhausgasse 14, D-09596 Freiberg, Germany
ABSTRACT
Apatite samples from rare-metal mineralization were investigated by a combination of cathodolumi-nescence (CL) microscopy and spectroscopy, microchemical analysis and trace element analysis.Internal structures revealed by CL can be related to variations in the crystal chemistry and maysometimes reflect changes in the composition of the mineralizing fluids.
Apatite from mineralization related to alkaline rocks and carbonatites (Type 1) typically exhibitsrelatively homogeneous blue and lilac/violet CL colours due to activation by trace quantities of rareearth element ions (Ce3+, Eu2+, Sm3+, Dy3+ and Nd3+). These results correlate with determined traceelement abundances, which show strong light rare earth element (LREE) enrichment for this type ofapatite. However, a simple quantitative correlation between emission intensities of REE3+/2+ andanalysed element concentrations was not found.
Apatite from P-rich altered granites, greisens, pegmatites and veins from Sn-W deposits (Type 2)shows strong Mn2+-activated yellow-greenish CL, partially with distinct oscillatory zoning. Variationsin the intensity of the Mn2+-activated CL emission can be related either to varying Mn/Fe ratios(quenching of Mn activated CL by Fe) or to self-quenching effects in zones with high Mn contents(>2.0 wt.%). The REE distribution patterns of apatite reflect the specific geological position of eachsample and may serve as a "tracer" for the REE behaviour within the ore system. Although the REEcontents are sometimes as high as several hundred parts per million, the spectral CL measurements donot exhibit typical REE emission lines because of dominance of the Mn emission. In these samples,REE-activated luminescence is only detectable by time-resolved laser-induced luminescence spectro-scopy.
Both types of apatite (Type 1 in the core and Type 2 in the rim) were found in single crystals fromthe Be deposit Ermakovka (Transbaikalia). This finding proves the existence of two stages ofmineralization within this deposit.
KEYWORDS: apatite, rare-metal deposits, cathodoluminescence, trace-elements, rare earth elements.
Introduction
APATITE (general formula Ca5[(PO4)3(OH,F,Cl)])
is an important accessory mineral in various types
of igneous, sedimentary and metamorphic rocks.
Due to chemical substitutions within the apatite
lattice, the Ca2+ sites can be occupied by a
number of cations, including but not limited to
Sr2+, Mn2+, Fe2+, rare earth elements (REE2+/3+),
Y3+ and Na+. The site preference of Mn2+, Sr2+
and REE3+ to either the ninefold Ca(1) or
sevenfold Ca(2) sites in the apatite structure
remains a point of controversy (e.g. Morozov et
al., 1970; Marfunin, 1979; Hughes et al., 1991a,b;
Gaft et al., 1998). Ions such as Cl� and OH� can
substitute for F� in the apatite structure and P5+
can be partly replaced by Si4+, As5+, S6+ and C4+
(Elliot, 1994). Because of differences in the
valence of the substituting ions, a coupled
substitution is sometimes required to maintain
charge balance, e.g. 2Ca2+ $ Na+ + REE3+ or
Ca2+ + P5+ $ REE3+ + Si4+ (Rønsbo, 1989; Finch
and Fletcher, 1992; Elliot, 1994; Coulson and
Chambers, 1996; Rae et al., 1996). Another
# 2002 The Mineralogical Society
* E-mail: [email protected]: 10.1180/0026461026610019
Mineralogical Magazine, February 2002, Vol. 66(1), pp. 151–172
mechanism for charge balancing, sometimes
causing deviations from stoichiometric composi-
tion, is a substitution in the form of 3Ca2+ $2REE3+ + & (where & is a site vacancy, cf.
Elliot, 1994).
It was previously observed that incorporation of
trace elements in accessory apatite depends on the
petrology and specifics of the host rocks (e.g.
Zhang et al., 1985; Fleischer and Altschuler,
1986; Boudreau and Kruger, 1990). Thus,
geochemical features of apatite can be used as
an important tool for mineralogical and geological
interpretation (cf. Landa et al., 1983; Fleischer
and Altschuler, 1986; Wenzel and Ramseyer,
1992; Pan and Fleet, 1996; Rae et al., 1996;
Whitney and Olmsted, 1998; Irber, 1999; Perseil
et al., 2000; Seifert et al., 2000).
Imaging of internal structures and alteration
features in natural apatite by cathodo-
luminescence (CL) microscopy provides essential
information on rock formation and mineralization
processes, particularly fluid evolution (Knutson et
al.. 1985; Finch, 1992; Wenzel and Ramseyer,
1992; Coulson and Chambers, 1996; Rae et al.,
1996; Perseil et al., 2000). Apatites from different
parent rocks or mineral parageneses were found to
exhibit various CL and photoluminescence (PL)
emissions. For example, apatite from granitic
rocks and pegmatites typically exhibits yellowish
to orange CL and PL, whereas apatite from
carbonatites and other alkaline rocks tends to
show blue, violet or lilac CL and PL (e.g. Portnov
and Gorobets, 1969; Marfunin, 1979; Mariano,
1988). The characterization of luminescence
colour alone, however, is of qualitative nature
only and does not necessarily permit identification
of all ions responsible for the luminescence
colour. Spatially-resolved cathodoluminescence
spectroscopy provides useful information about
emission centres and their intra-crystal distribu-
tion (e.g. Rakovan and Reeder, 1996). In
particular, Mn2+ and REE ions serve as effective
activators in apatite. Investigations on synthetic
and naturally occurring apatite have revealed
characteristic emission bands (Mn2+, Eu2+, Ce3+)
or sets of emission peaks (REE3+ but not Ce3+)
that can be related to specific activator ions (e.g.
Portnov and Gorobets, 1969; Kuznecov and
Tarashchan, 1975; Marfunin, 1979; Roeder et
al., 1987; Mariano, 1988; Blanc et al., 1995;
Rakovan and Reeder, 1996; Mitchell et al., 1997;
Blanc et al., 2000). Data concerning peak
identification are summarized in Gotze et al.
(2001). On the other hand, as shown for synthetic
samples and As-rich natural apatite, the incor-
poration of Fe2+ or As5+ into the apatite structure
can result in significant quenching of the
luminescence intensity (Filippelli and Delaney,
1993; Perseil et al., 2000).
Apatite is a common constituent in mineral
assemblages from several types of ore deposits. In
the present study, two types of occurrences are
examined and discussed in detail: (1) apatite from
mineralization in relation to alkaline rock
sequences including carbonatites; and (2) apatite
from P-rich altered granites, greisens, pegmatites
and veins from Sn-W deposits. The purpose of the
study is to reveal variations in chemical
composition and related CL behaviour of apatite
from these two settings. The verification of the
prevailing CL activation and quenching mechan-
isms in the mineral was possible due to
contrasting crystal chemistry of the samples
investigated. Consequences for genetic interpreta-
tions based on CL investigations are discussed
briefly in conclusion.
Geological setting, materials and methods
The sample locations are reported in Table 1. One
sample from Kovdor (Kola Peninsula, Russia) and
two samples from Mushugai Khudug (Gobi
desert, Mongolia) represent apatite from carbona-
tite complexes. Apatite from larvikite from an
open pit at Svensken (Norway) is included in our
study representing the occurrence in alkaline
rocks. Samples from Sn-W deposits derive from
Ehrenfriedersdorf (Central Erzgebirge, Germany),
Sadisdorf (Eastern Erzgebirge, Germany) and
Vysoky Kamen (Slavkovsky les, Czech
Republic; cf. Jachovsky, 1994; Rene, 1998).
The Kovdor massif consists of a sequence of
ultrabasic-alkaline-carbonatite rocks (Kharlamov
et al., 1981). The sample investigated derives
from the main magnetite-apatite ore body (Landa
et al., 1983). At Mushugai, the alkaline rocks are
in general acidic. Mushugai apatite was sampled
from a small magnetite-apatite ore body but near
the contact with the surrounding syenite. The
mineral occurs as idiomorphic crystals intergrown
with phlogopite. More details of the mineralogy
and geology of the Mushugai massif are presented
in Baskina et al. (1978), Vasil’eva et al. (1978),
Ontoev et al. (1979) and Rundqvist et al. (1995).
An apatite sample with distinct colour zonation
(core – yellowish-green, rim – bluish green) was
collected from a Be orebody in Ermakovka
(Transbaikalia, Russia). Be-F orebodies are
152
U.KEMPE AND J.G'TZE
developed as zones of metasomatic alteration
within Upper Proterozoic schist, limestone and
dolomite near their contact with Jurassic subalka-
line granites (Novikova et al., 1994; Lykhin et al.,
2001). The apatite was sampled from an altered
dolomite near the largest ore body of the deposit,
where it occurs in association with dolomite,
phlogopite and fluorite.
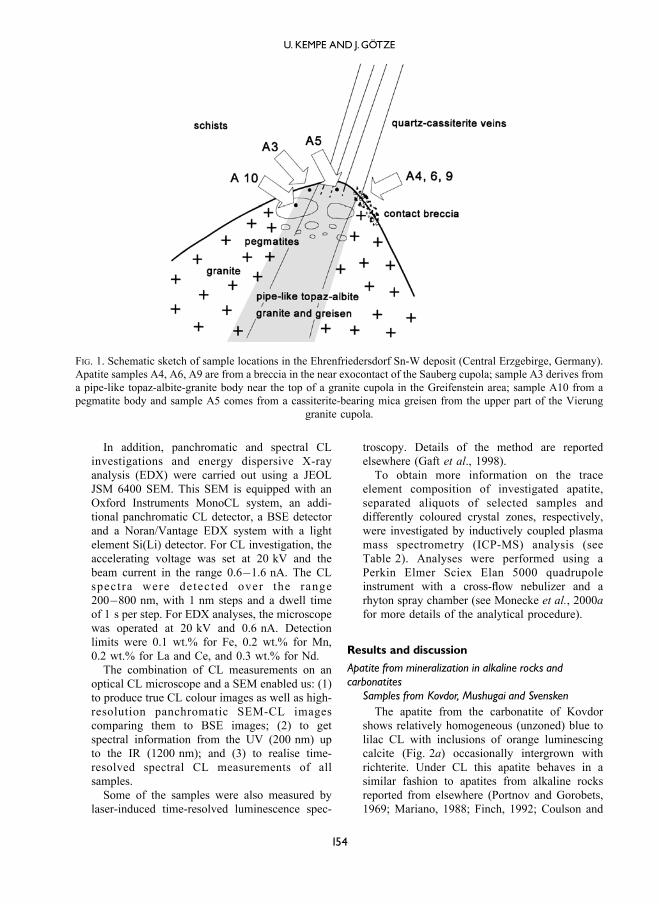
Three samples (A4, A6 and A9) are from a
breccia in the near exocontact of the Sauberg
cupola of the Ehrenfriedersdorf Sn-W deposit
(Central Erzgebirge, Germany). The breccia
contains angular granite, apatite and schist
fragments cemented by vein quartz (Fig. 1).
Another sample derives from a pipe-like topaz-
albite-granite body near the top of the granite
cupola of the Greifenstein area (A3) and an
additional one (A5) from cassiterite-bearing mica
greisen from the upper part of the Vierung granite
cupola. The geology and mineralogy of the
Ehrenfriedersdorf deposit is described by Hosel
(1994) and Seltmann et al. (1995).
Carbon-coated polished thin-sections of all
samples were investigated by a combination of
polarizing microscopy and CL microscopy and
spectroscopy. The CL examinations were initi-
ally performed on a ‘hot cathode’ CL micro-
scope at 14 kV and with a current density of
~10 mA/mm2. Luminescence images were
captured ‘on-line’ during CL operations by
means of an adapted digital video-camera
(KAPPA 961-1138 CF 20 DXC with cooling
stage). The CL spectra were obtained using an
EG&G digital triple-grating spectrograph with a
liquid nitrogen-cooled, Si-based charge-coupled
device (CCD) detector (Rieser et al., 1994). The
CCD camera was attached to the CL microscope
by a silica-glass fibre guide. The CL spectra
were measured in the range 380 to 1200 nm
using standardized conditions (wavelength cali-
bration by a Hg lamp). To prevent any
falsification of the CL spectra due to electron
bombardment, all spectra were taken on non-
irradiated sample spots.
TABLE 1. Apatite samples from different rare-metal deposits selected for the present study.
Sample Lithology/location Characteristic
KOV carbonatite complex white-green columnar crystalKovdor, Kola Peninsula
MH 114 alkali complex, borehole 1 yellowish-green short-prismaticMushugai khudug, Mongolia crystals
SVEN larvikite, dark green prismatic crystalSvensken, Norway
YM apatite ore Be-F metasomatite fragments of zonar colouredErmakovka, Transbaikalia crystals; core: yellowish-green;
rim: bluish-greenA3 greisen in albite granite dark green crystal fragments
Vierung, Ehrenfriedersdorf, GermanyA4 apatite breccia in metasomatized granite light blue crystal fragments
Zypressenbaumer Gangzug,Ehrenfriedersdorf, Germany
A5 Greifenstein granite, ‘Topasloch’ short-prismatic purple crystalsEhrenfriedersdorf, Germany
A6 apatite breccia Prinzler vein, 6th level, partly zoned crystals and frag-Ehrenfriedersdorf, Germany ments; core: bluish, rim: white
A8 quartz vein, pinge, fragments of green crystalsSadisdorf, Germany
A9 apatite breccia dark bluish-green columnarPrinzler West, 2. Gezeugstrecke, crystalEhrenfriedersdorf, Germany
A10 apatite in K-feldspar-pegmatite dark green crystals5th level, Ehrenfriedersdorf,Germany
VY101 altered topaz-bearing granite, open crystal intergrown with quartzpit, Vysoky Kamen, Czech Republic and muscovite
CLBEHAVIOUR ANDCRYSTALCHEMISTRYOFAPATITE
153
In addition, panchromatic and spectral CL
investigations and energy dispersive X-ray
analysis (EDX) were carried out using a JEOL
JSM 6400 SEM. This SEM is equipped with an
Oxford Instruments MonoCL system, an addi-
tional panchromatic CL detector, a BSE detector
and a Noran/Vantage EDX system with a light
element Si(Li) detector. For CL investigation, the
accelerating voltage was set at 20 kV and the
beam current in the range 0.6�1.6 nA. The CL
spectra were detected over the range
200�800 nm, with 1 nm steps and a dwell time
of 1 s per step. For EDX analyses, the microscope
was operated at 20 kV and 0.6 nA. Detection
limits were 0.1 wt.% for Fe, 0.2 wt.% for Mn,
0.2 wt.% for La and Ce, and 0.3 wt.% for Nd.
The combination of CL measurements on an
optical CL microscope and a SEM enabled us: (1)
to produce true CL colour images as well as high-
resolution panchromatic SEM-CL images
comparing them to BSE images; (2) to get
spectral information from the UV (200 nm) up
to the IR (1200 nm); and (3) to realise time-
resolved spectral CL measurements of all
samples.
Some of the samples were also measured by
laser-induced time-resolved luminescence spec-
troscopy. Details of the method are reported
elsewhere (Gaft et al., 1998).
To obtain more information on the trace
element composition of investigated apatite,
separated aliquots of selected samples and
differently coloured crystal zones, respectively,
were investigated by inductively coupled plasma
mass spectrometry (ICP-MS) analysis (see
Table 2). Analyses were performed using a
Perkin Elmer Sciex Elan 5000 quadrupole
instrument with a cross-flow nebulizer and a
rhyton spray chamber (see Monecke et al., 2000a
for more details of the analytical procedure).
Results and discussion
Apatite frommineralization in alkaline rocks andcarbonatites
Samples from Kovdor, Mushugai and SvenskenThe apatite from the carbonatite of Kovdor
shows relatively homogeneous (unzoned) blue to
lilac CL with inclusions of orange luminescing
calcite (Fig. 2a) occasionally intergrown with
richterite. Under CL this apatite behaves in a
similar fashion to apatites from alkaline rocks
reported from elsewhere (Portnov and Gorobets,
1969; Mariano, 1988; Finch, 1992; Coulson and
FIG. 1. Schematic sketch of sample locations in the Ehrenfriedersdorf Sn-W deposit (Central Erzgebirge, Germany).
Apatite samples A4, A6, A9 are from a breccia in the near exocontact of the Sauberg cupola; sample A3 derives from
a pipe-like topaz-albite-granite body near the top of a granite cupola in the Greifenstein area; sample A10 from a
pegmatite body and sample A5 comes from a cassiterite-bearing mica greisen from the upper part of the Vierung
granite cupola.
154
U.KEMPE AND J.G'TZE
Chambers, 1996; Rae et al., 1996). Further
examples of apatite grains from Mushugai and
Svensken (Fig. 2b,c) demonstrate that blue to
lilac CL is a general feature of apatite from
alkaline rocks. The Svensken apatite reveals
primary growth zoning not visible under conven-
tional optical microscopy.
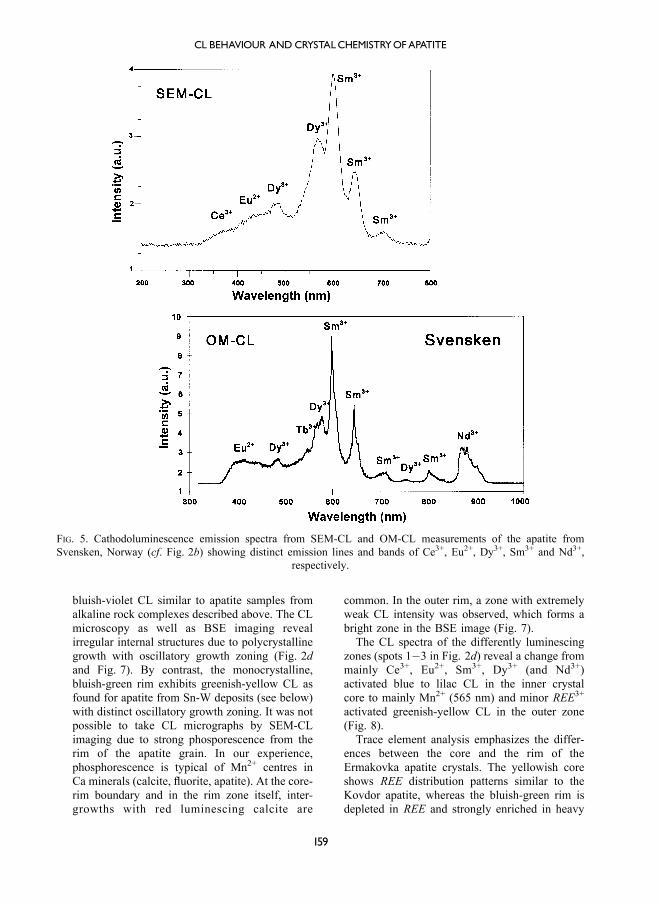
The CL emission spectra of the apatite samples
from Kovdor, Mushugai and Svensken are
dominated by REE-activated luminescence
(Figs 3�5). Blue CL is related to Eu2+ emission
(around 410�430 nm, cf. Mariano, 1988). The
lilac tint is caused by CL activation due to Ce3+
(in the near UV around 360 nm) and Sm3+ centres
luminescing in the orange to red at 600 and
645 nm (note that the spectra are not corrected for
detector response so that emission in the range
from 300 to 450 nm appears to be suppressed).
Additional lines are assigned to Dy3+ (480 and
570 nm) and Nd3+ (in the IR at 870 to 900 nm).
The Svensken and Mushugai samples show a
pronounced Nd3+ emission. However, this feature
does not contribute to the visible CL.
In general, CL behaviour of investigated apatite
is in accordance with the trace element character-
istics of the samples. As a rule, a strong
enrichment of the light REE (LREE) including
Ce, Nd, Sm and Eu, acting as emission centres in
CL, can be found in apatite from alkaline
magmatic complexes (see Table 2 and Fig. 6 as
well as Landa et al., 1983 for Kovdor apatite; cf.
Vasil’eva et al., 1978 and Kovalenko et al., 1982
for Mushugai apatite). High La, Ce and Nd
concentrations of up to several wt.%, were
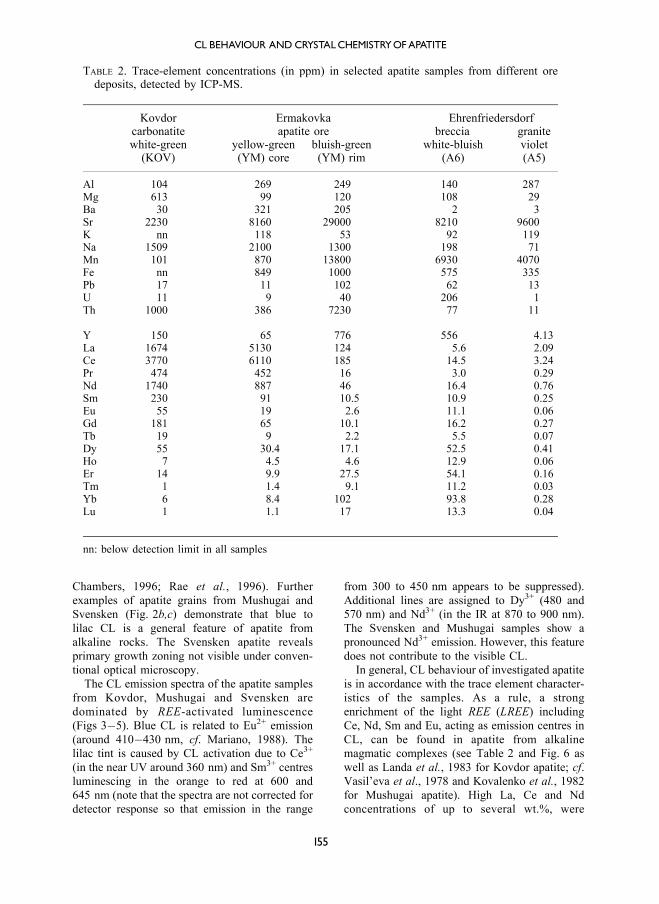
TABLE 2. Trace-element concentrations (in ppm) in selected apatite samples from different oredeposits, detected by ICP-MS.
Kovdor Ermakovka Ehrenfriedersdorfcarbonatite apatite ore breccia granitewhite-green yellow-green bluish-green white-bluish violet
(KOV) (YM) core (YM) rim (A6) (A5)
Al 104 269 249 140 287Mg 613 99 120 108 29Ba 30 321 205 2 3Sr 2230 8160 29000 8210 9600K nn 118 53 92 119Na 1509 2100 1300 198 71Mn 101 870 13800 6930 4070Fe nn 849 1000 575 335Pb 17 11 102 62 13U 11 9 40 206 1Th 1000 386 7230 77 11
Y 150 65 776 556 4.13La 1674 5130 124 5.6 2.09Ce 3770 6110 185 14.5 3.24Pr 474 452 16 3.0 0.29Nd 1740 887 46 16.4 0.76Sm 230 91 10.5 10.9 0.25Eu 55 19 2.6 11.1 0.06Gd 181 65 10.1 16.2 0.27Tb 19 9 2.2 5.5 0.07Dy 55 30.4 17.1 52.5 0.41Ho 7 4.5 4.6 12.9 0.06Er 14 9.9 27.5 54.1 0.16Tm 1 1.4 9.1 11.2 0.03Yb 6 8.4 102 93.8 0.28Lu 1 1.1 17 13.3 0.04
nn: below detection limit in all samples
CLBEHAVIOUR ANDCRYSTALCHEMISTRYOFAPATITE
155
156
U.KEMPE AND J.G'TZE
detected in the samples from Kovdor, Svensken
and Mushugai by microanalysis. This is in
accordance with findings for other locations
(Vasil’eva et al., 1978; Rønsbo, 1989; Rae et
al., 1996). Relatively high Na contents found in
LREE-rich apatite from Kovdor, Mushugai,
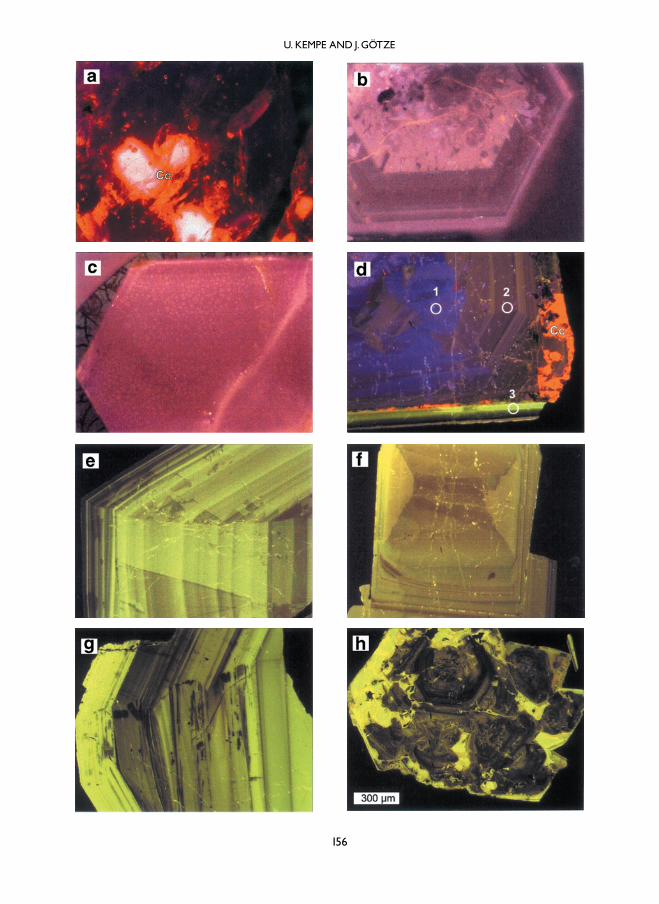
FIG. 2 (opposite page). Cathodoluminescence micrographs of apatite samples investigated. (a) Blue-violet
luminescing apatite grain from a carbonatite of Kovdor (Kola Peninsula) with orange luminescing inclusions of
calcite (Cc); (b) violet luminescing apatite grain with oscillatory zoned rim from larvikite of Svensken (Norway); the
CL emission is mainly activated by REE3+ (cf. Fig. 5); (c) apatite crystal from the alkali complex of Mushugai
(Mongolia) showing REE-activated violet CL (cf. CL emission spectrum in Fig. 4); (d) apatite grain from
Ermakovka (Transbaikalia); the different growth zones are visible due to sharply contrasting CL activation by
REE2+/3+ in the core and Mn2+ in the rim, respectively; the rim of the crystal is intergrown with orange luminescing
calcite (Cc); the analytical points 1�3 shown in the figure correspond to the spectra in Fig. 8; (e) distinctly zoned
apatite grain (A4) from apatite breccia at the granite contact, Ehrenfriedersdorf; the CL emission is activated by
Mn2+ (cf. Fig. 9); (f) apatite from Greifenstein granite, Ehrenfriedersdorf showing both oscillatory and sector zoning
(A5); (g) apatite grain (A6) with distinct oscillatory zoning from apatite breccia, Prinzler (Ehrenfriedersdorf);
(h) polycrystalline apatite with secondary alteration (A8) from the Sadisdorf tin mine (Germany).
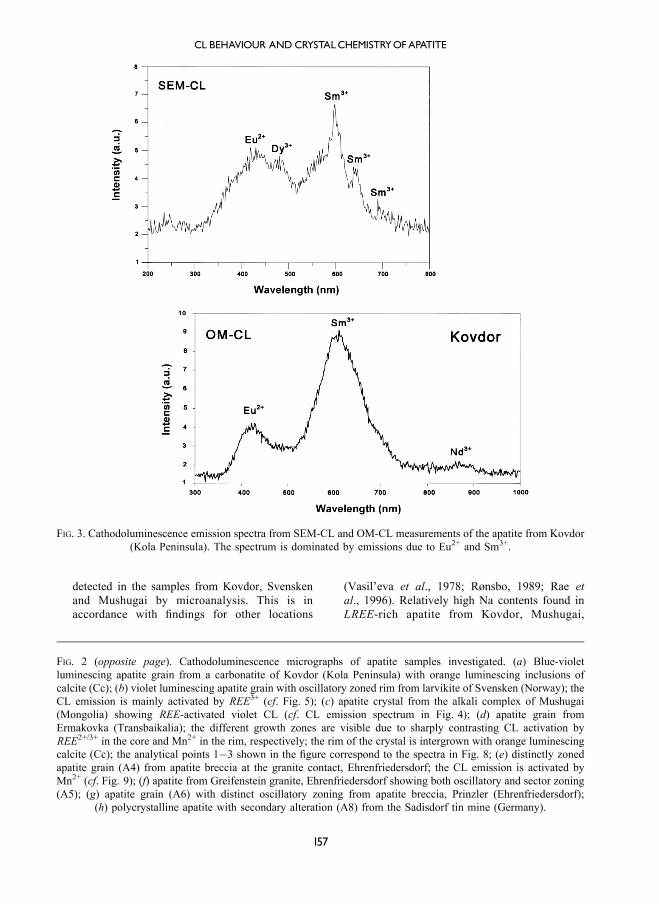
FIG. 3. Cathodoluminescence emission spectra from SEM-CL and OM-CL measurements of the apatite from Kovdor
(Kola Peninsula). The spectrum is dominated by emissions due to Eu2+ and Sm3+.
CLBEHAVIOUR ANDCRYSTALCHEMISTRYOFAPATITE
157
Svensken and Ermakovka by ICP-MS (Table 2)
and EDX (up to 1.0 wt.% Na2O) indicate that Na
compensation is one important mechanism for
charge balancing according to the scheme 2Ca2+
$ Na+ + REE3+ (Rønsbo, 1989). Strong
enrichment of LREE, particularly of La and Ce,
is in accordance with the REE distribution
patterns of the host rocks (cf. Kempe and
Dandar, 1995). At the same time, the Mn
content in apatite is relatively low and ranges
from 10 to several 100 ppm (Table 2; Vasil’eva et
al., 1978). These values are within the minimum
concentration level of Mn detectable as Mn2+ by
CL spectroscopy in Mn-doped synthetic apatite
(Filippelli and Delaney, 1993). Another typical
characteristic of the apatite from alkaline rocks is
a high to very high Sr content (up to several wt.%;
Landa et al., 1983; Rae et al., 1996). This is
confirmed by our observations (0.7 up to 3.6 wt.%
SrO detected by EDX, cf. also ICP-MS data in
Table 2). Moreover, we found that fluorite from
such an environment is also strongly enriched in
Sr (e.g. Kempe et al., 1999). In accordance with
other authors, we can find no correlation between
the Sr content and the CL properties of the apatite.
Ermakovka apatiteThe core and the rim of the Ermakovka apatite
crystals exhibit quite different CL behaviour. The
yellowish-green coloured core exhibits blue to
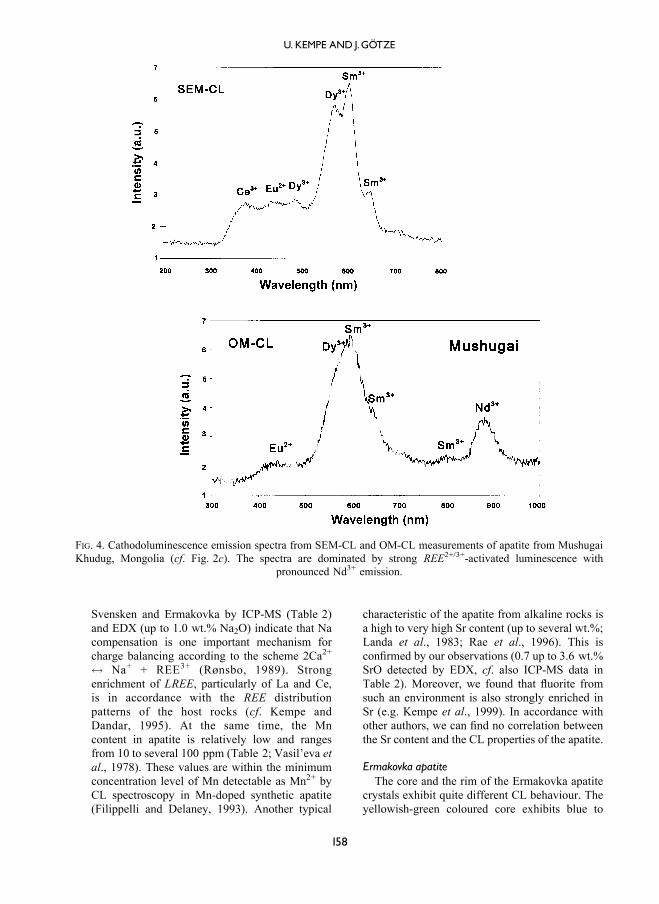
FIG. 4. Cathodoluminescence emission spectra from SEM-CL and OM-CL measurements of apatite from Mushugai
Khudug, Mongolia (cf. Fig. 2c). The spectra are dominated by strong REE2+/3+-activated luminescence with
pronounced Nd3+ emission.
158
U.KEMPE AND J.G'TZE
bluish-violet CL similar to apatite samples from
alkaline rock complexes described above. The CL
microscopy as well as BSE imaging reveal
irregular internal structures due to polycrystalline
growth with oscillatory growth zoning (Fig. 2d
and Fig. 7). By contrast, the monocrystalline,
bluish-green rim exhibits greenish-yellow CL as
found for apatite from Sn-W deposits (see below)
with distinct oscillatory growth zoning. It was not
possible to take CL micrographs by SEM-CL
imaging due to strong phosporescence from the
rim of the apatite grain. In our experience,
phosphorescence is typical of Mn2+ centres in
Ca minerals (calcite, fluorite, apatite). At the core-
rim boundary and in the rim zone itself, inter-
growths with red luminescing calcite are
common. In the outer rim, a zone with extremely
weak CL intensity was observed, which forms a
bright zone in the BSE image (Fig. 7).
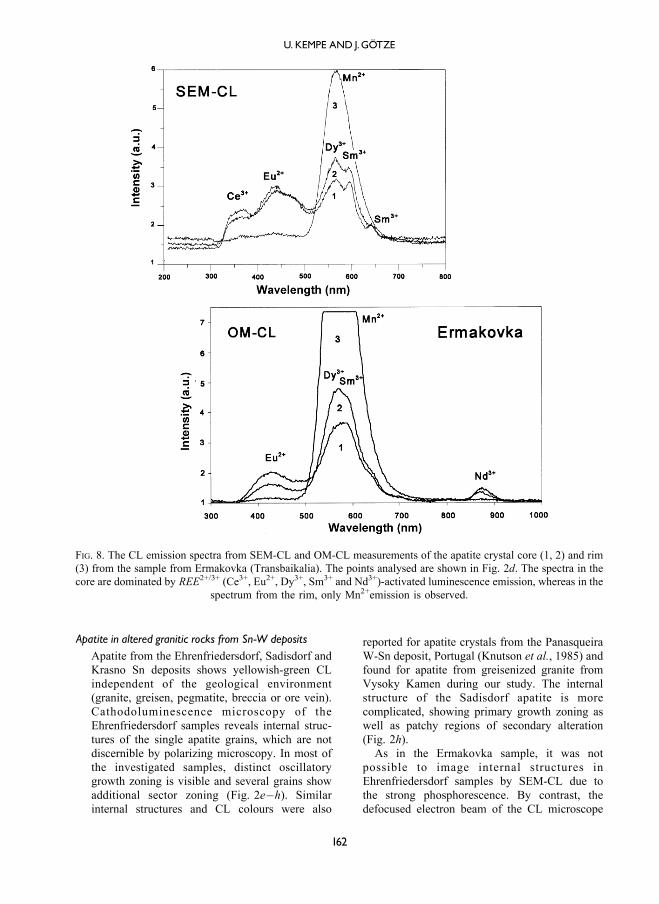
The CL spectra of the differently luminescing
zones (spots 1�3 in Fig. 2d) reveal a change from
mainly Ce3+, Eu2+, Sm3+, Dy3+ (and Nd3+)
activated blue to lilac CL in the inner crystal
core to mainly Mn2+ (565 nm) and minor REE3+
activated greenish-yellow CL in the outer zone
(Fig. 8).
Trace element analysis emphasizes the differ-
ences between the core and the rim of the
Ermakovka apatite crystals. The yellowish core
shows REE distribution patterns similar to the
Kovdor apatite, whereas the bluish-green rim is
depleted in REE and strongly enriched in heavy
FIG. 5. Cathodoluminescence emission spectra from SEM-CL and OM-CL measurements of the apatite from
Svensken, Norway (cf. Fig. 2b) showing distinct emission lines and bands of Ce3+, Eu2+, Dy3+, Sm3+ and Nd3+,
respectively.
CLBEHAVIOUR ANDCRYSTALCHEMISTRYOFAPATITE
159

REE (HREE) as well as in Y (Fig. 6 and Table 2).
The Y/Ho ratio of the rim (169) clearly exceeds
the values of the CHARAC box defined by Bau
(1996) and the values for the core (14) and the
Kovdor apatite (21), which are even below the
chondritic value of 28. However, both parts of the
crystal are enriched in Sr, the rim (2.9 wt.% Sr)
even more than the core (0.8 wt.%). Moreover, as
in the case of Kovdor apatite, Ermakovka apatite
is rich in Th (Th 0.04 wt.% in the core and
0.7 wt.% in the rim, with Th>>U).
Variations in luminescence intensitiesMore detailed microchemical investigation of
the core and the rim of the Ermakovka apatite
crystals reveals that oscillatory growth zoning
Sam
ple
/cho
nd
rite
apatite
10
10
10
10
10
10
10
Kovdor
Ermakovkacore
Ermakovkarim
-1
0
1
2
3
4
5
fluorite
1
2
10
10
10
10
10-1
2
3
4
0
La Ce Pr Nd Sm Eu Gd Tb Dy Ho Er Tm Yb Lu
La Ce Pr Nd Sm Eu Gd Tb Dy Ho Er Tm Yb Lu
Sam
ple
/cho
nd
rite
101
FIG. 6. Chondrite-normalized REE distribution patterns of apatite from Kovdor (Kola Peninsula) and differently
coloured rim and core zones of the apatite from Ermakovka (Transbaikalia). The REE distribution patterns (1) of
fluorite from a pegmatite in the alkaline granite and (2) of fluorite from the first Ermakovka Be-F ore body (inset) are
shown for comparison. Data for fluorite from Kempe and Plotze (unpublished).
160
U.KEMPE AND J.G'TZE

visible in CL and BSE images may be related to
variations in crystal chemistry. The Sr content is
more or less constant in the core (0.65�0.75 wt.%
Sr) and in the rim (2.6�2.9 wt.% Sr). Within the
core, the contrast in CL and BSE correlates well
with the REE content: bright luminescing zones
(darker in BSE) are depleted in La and Ce, but
enriched in Nd compared to darker luminescing
zones (bright in BSE). The Mn was below the
detection limit of the EDX. The variations in CL
intensities may be explained by relative Eu and
Sm enrichment in the Nd-rich zones with related
enhanced luminescence intensities. Otherwise,
luminescence quenching due to higher concentra-
tions of non-luminescent La centres in the La- and
Ce-rich zones may also lead to decreasing integral
CL intensities.
The Mn is strongly enriched in the rim
(0.3�0.6 wt.% Mn). Accordingly, the rim shows
strong Mn2+ emission. However, the highest Mn
content (1.8 wt.% Mn) was found in the weak
luminescing zone. It may be possible to relate the
high average Mn content (1.4 wt.%) found by
ICP-MS for the whole rim area to this zone.
Another characteristic feature of this zone is the
very high Th content (>0.39 wt.%). This fact may
explain low luminescence efficiency in the Mn-
rich zone possibly related to strong lattice damage
or to charge conversion due to high radioactive
irradiation dosages.
Comparison of CL emission spectra of the
apatites from Ermakovka (cores) and Kovdor
reveals that both spectra are dominated by Sm3+,
Dy3+ and Eu2+ but the sample from Kovdor shows
only very slight Ce3+- and Nd3+-activated CL
emission in contrast to the core of the Ermakovka
sample. This is remarkable insofar as the REE
distribution patterns and the concentrations of Ce
and Nd in the two apatite samples are very close
to each other. Accordingly, the occurrence or
absence and the relative intensity of a specific
REE emission peak in the CL spectrum of apatite
cannot be used for quantitative estimations of the
relative abundance of these REE. Results recently
published by Barbarand and Pagel (2001) suggest
that there is no simple correlation between
contents of the individual REE and the emission
intensities of the related centres. Mitchell et al.
(1997) found that the CL spectra of natural apatite
result from a subtle interplay of at least three
factors: the relative concentration of the indivi-
dual REE, its relative efficiency in activating
luminescence and the presence or absence of
elements that may act as sensitizers or quenchers.
Furthermore, differences in CL behaviour can
also be caused by the crystallographic orientation
of apatite in thin sections (Murray and Oreskes,
1997; Barbarand and Pagel, 2001) and by charge
conversion due to radioactive irradiation. In the
case of the apatite samples from Ermakovka and
Kovdor, the different contents of Mn, which
probably act as a sensitizer of REE-activated CL
emission (Portnov and Gorobets, 1969; Marfunin,
1979), yield a possible explanation for the
variability in luminescence behaviour.
FIG. 7. Comparison of BSE (top) and CL (bottom)
micrographs of an apatite crystal from Ermakovka
(Transbaikalia). Within the core, the contrast in CL
and BSE correlates well with the REE content: bright
bluish luminescing zones (darker in BSE) are depleted
in La and Ce, but enriched in Nd compared to darker
luminescing zones (bright in BSE). The rim shows
strong yellow Mn2+ emission according to strong Mn
enrichment (0.3�0.6 wt.% Mn). Oscillatory zoning is
only visible by CL. Very high Th content (>0.39 wt.%
Th) causes low luminescence efficiency in the outer part
of the Mn-rich zone possibly related to strong lattice
damage or to charge conversion due to high radioactive
irradiation dosages.
CLBEHAVIOUR ANDCRYSTALCHEMISTRYOFAPATITE
161
Apatite in altered granitic rocks from Sn-W depositsApatite from the Ehrenfriedersdorf, Sadisdorf and
Krasno Sn deposits shows yellowish-green CL
independent of the geological environment
(granite, greisen, pegmatite, breccia or ore vein).
Cathodoluminescence microscopy of the
Ehrenfriedersdorf samples reveals internal struc-
tures of the single apatite grains, which are not
discernible by polarizing microscopy. In most of
the investigated samples, distinct oscillatory
growth zoning is visible and several grains show
additional sector zoning (Fig. 2e�h). Similar
internal structures and CL colours were also
reported for apatite crystals from the Panasqueira
W-Sn deposit, Portugal (Knutson et al., 1985) and
found for apatite from greisenized granite from
Vysoky Kamen during our study. The internal
structure of the Sadisdorf apatite is more
complicated, showing primary growth zoning as
well as patchy regions of secondary alteration
(Fig. 2h).
As in the Ermakovka sample, it was not
possible to image internal structures in
Ehrenfriedersdorf samples by SEM-CL due to
the strong phosphorescence. By contrast, the
defocused electron beam of the CL microscope
FIG. 8. The CL emission spectra from SEM-CL and OM-CL measurements of the apatite crystal core (1, 2) and rim
(3) from the sample from Ermakovka (Transbaikalia). The points analysed are shown in Fig. 2d. The spectra in the
core are dominated by REE2+/3+ (Ce3+, Eu2+, Dy3+, Sm3+ and Nd3+)-activated luminescence emission, whereas in the
spectrum from the rim, only Mn2+emission is observed.
162
U.KEMPE AND J.G'TZE
produces excellent CL micrographs of the Mn2+-
activated apatite luminescence.
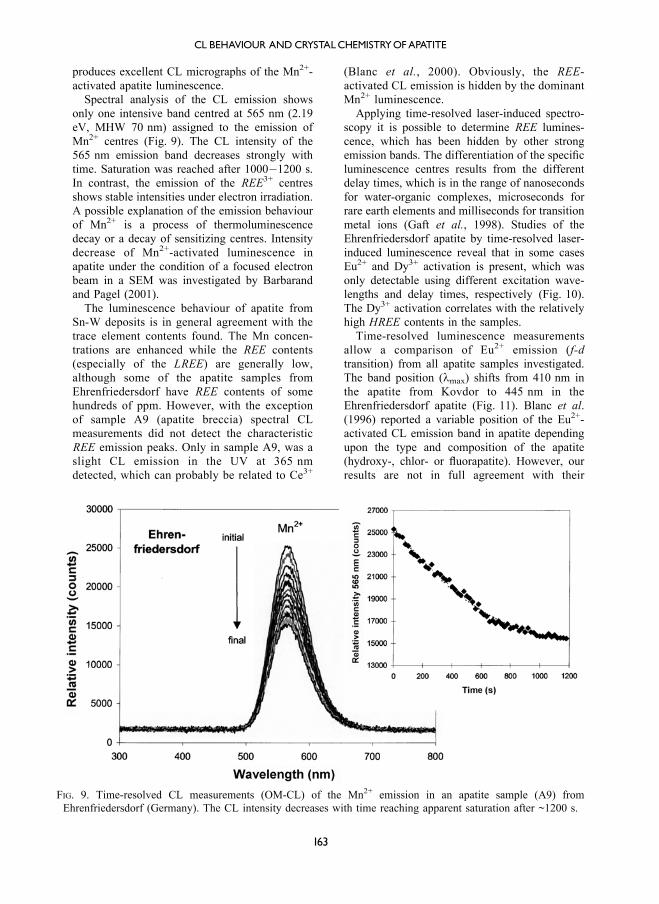
Spectral analysis of the CL emission shows
only one intensive band centred at 565 nm (2.19
eV, MHW 70 nm) assigned to the emission of
Mn2+ centres (Fig. 9). The CL intensity of the
565 nm emission band decreases strongly with
time. Saturation was reached after 1000�1200 s.
In contrast, the emission of the REE3+ centres
shows stable intensities under electron irradiation.
A possible explanation of the emission behaviour
of Mn2+ is a process of thermoluminescence
decay or a decay of sensitizing centres. Intensity
decrease of Mn2+-activated luminescence in
apatite under the condition of a focused electron
beam in a SEM was investigated by Barbarand
and Pagel (2001).
The luminescence behaviour of apatite from
Sn-W deposits is in general agreement with the
trace element contents found. The Mn concen-
trations are enhanced while the REE contents
(especially of the LREE) are generally low,
although some of the apatite samples from
Ehrenfriedersdorf have REE contents of some
hundreds of ppm. However, with the exception
of sample A9 (apatite breccia) spectral CL
measurements did not detect the characteristic
REE emission peaks. Only in sample A9, was a
slight CL emission in the UV at 365 nm
detected, which can probably be related to Ce3+
(Blanc et al., 2000). Obviously, the REE-
activated CL emission is hidden by the dominant
Mn2+ luminescence.
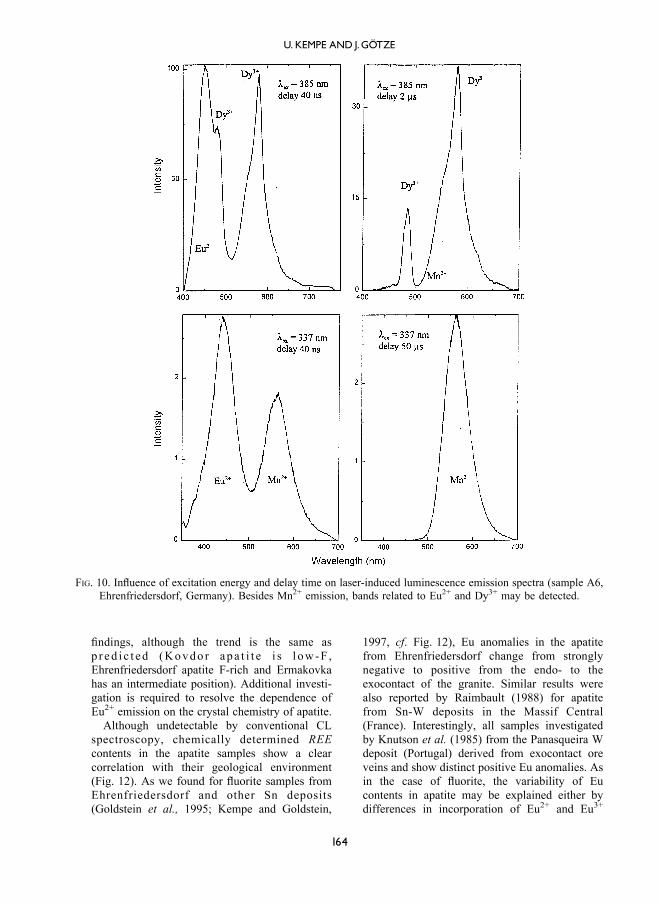
Applying time-resolved laser-induced spectro-
scopy it is possible to determine REE lumines-
cence, which has been hidden by other strong
emission bands. The differentiation of the specific
luminescence centres results from the different
delay times, which is in the range of nanoseconds
for water-organic complexes, microseconds for
rare earth elements and milliseconds for transition
metal ions (Gaft et al., 1998). Studies of the
Ehrenfriedersdorf apatite by time-resolved laser-
induced luminescence reveal that in some cases
Eu2+ and Dy3+ activation is present, which was
only detectable using different excitation wave-
lengths and delay times, respectively (Fig. 10).
The Dy3+ activation correlates with the relatively
high HREE contents in the samples.
Time-resolved luminescence measurements
allow a comparison of Eu2+ emission (f-d
transition) from all apatite samples investigated.
The band position (lmax) shifts from 410 nm in
the apatite from Kovdor to 445 nm in the
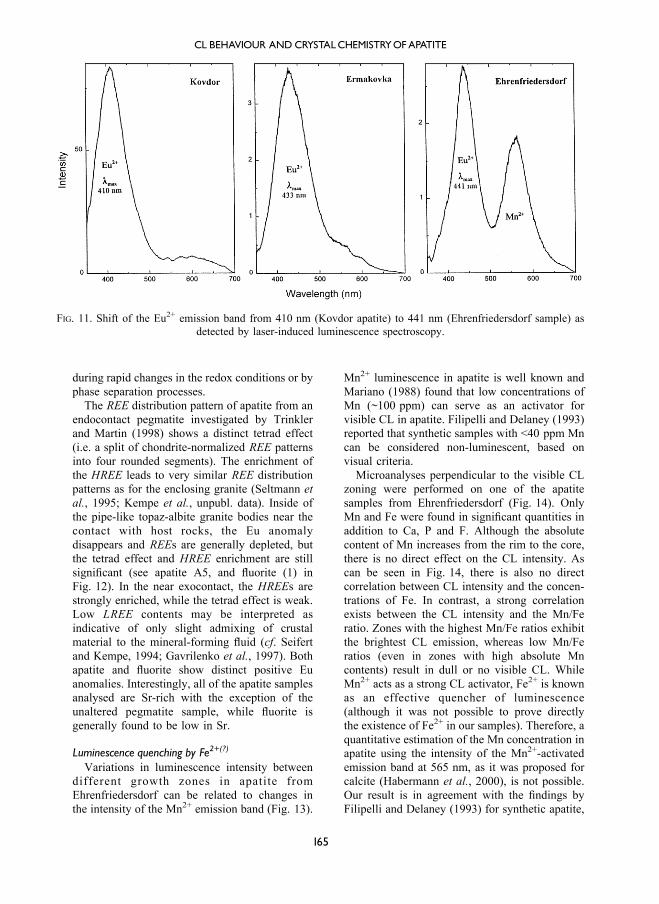
Ehrenfriedersdorf apatite (Fig. 11). Blanc et al.
(1996) reported a variable position of the Eu2+-
activated CL emission band in apatite depending
upon the type and composition of the apatite
(hydroxy-, chlor- or fluorapatite). However, our
results are not in full agreement with their
FIG. 9. Time-resolved CL measurements (OM-CL) of the Mn2+ emission in an apatite sample (A9) from
Ehrenfriedersdorf (Germany). The CL intensity decreases with time reaching apparent saturation after ~1200 s.
CLBEHAVIOUR ANDCRYSTALCHEMISTRYOFAPATITE
163
findings, although the trend is the same as
p r ed i c t ed (Kovdo r apa t i t e i s l ow-F ,
Ehrenfriedersdorf apatite F-rich and Ermakovka
has an intermediate position). Additional investi-
gation is required to resolve the dependence of
Eu2+ emission on the crystal chemistry of apatite.
Although undetectable by conventional CL
spectroscopy, chemically determined REE
contents in the apatite samples show a clear
correlation with their geological environment
(Fig. 12). As we found for fluorite samples from
Ehrenfriedersdorf and other Sn deposits
(Goldstein et al., 1995; Kempe and Goldstein,
1997, cf. Fig. 12), Eu anomalies in the apatite
from Ehrenfriedersdorf change from strongly
negative to positive from the endo- to the
exocontact of the granite. Similar results were
also reported by Raimbault (1988) for apatite
from Sn-W deposits in the Massif Central
(France). Interestingly, all samples investigated
by Knutson et al. (1985) from the Panasqueira W
deposit (Portugal) derived from exocontact ore
veins and show distinct positive Eu anomalies. As
in the case of fluorite, the variability of Eu
contents in apatite may be explained either by
differences in incorporation of Eu2+ and Eu3+
FIG. 10. Influence of excitation energy and delay time on laser-induced luminescence emission spectra (sample A6,
Ehrenfriedersdorf, Germany). Besides Mn2+ emission, bands related to Eu2+ and Dy3+ may be detected.
164
U.KEMPE AND J.G'TZE
during rapid changes in the redox conditions or by
phase separation processes.
The REE distribution pattern of apatite from an
endocontact pegmatite investigated by Trinkler
and Martin (1998) shows a distinct tetrad effect
(i.e. a split of chondrite-normalized REE patterns
into four rounded segments). The enrichment of
the HREE leads to very similar REE distribution
patterns as for the enclosing granite (Seltmann et
al., 1995; Kempe et al., unpubl. data). Inside of
the pipe-like topaz-albite granite bodies near the
contact with host rocks, the Eu anomaly
disappears and REEs are generally depleted, but
the tetrad effect and HREE enrichment are still
significant (see apatite A5, and fluorite (1) in
Fig. 12). In the near exocontact, the HREEs are
strongly enriched, while the tetrad effect is weak.
Low LREE contents may be interpreted as
indicative of only slight admixing of crustal
material to the mineral-forming fluid (cf. Seifert
and Kempe, 1994; Gavrilenko et al., 1997). Both
apatite and fluorite show distinct positive Eu
anomalies. Interestingly, all of the apatite samples
analysed are Sr-rich with the exception of the
unaltered pegmatite sample, while fluorite is
generally found to be low in Sr.
Luminescence quenching by Fe2+(?)
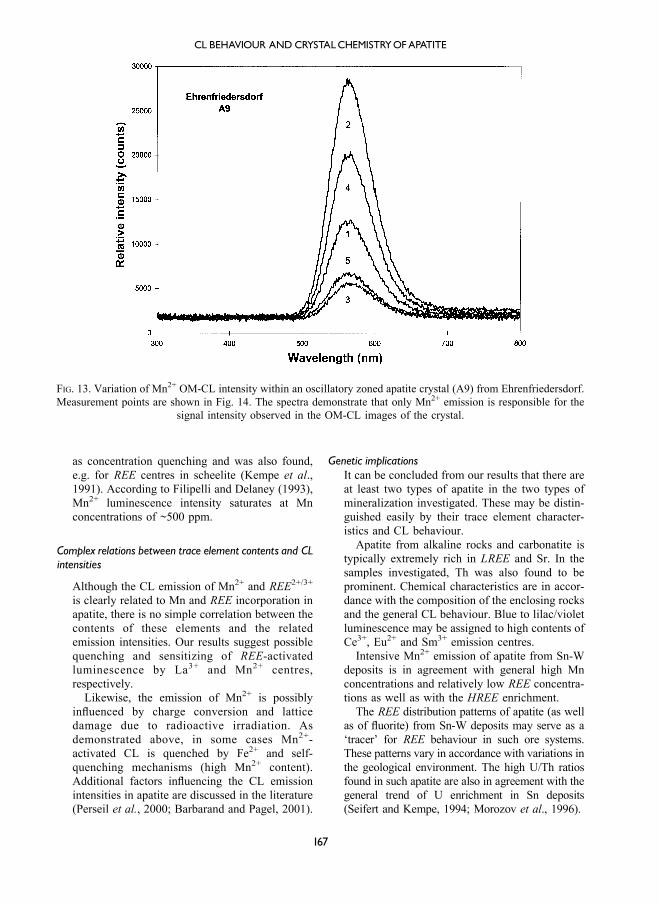
Variations in luminescence intensity between
different growth zones in apatite from
Ehrenfriedersdorf can be related to changes in
the intensity of the Mn2+ emission band (Fig. 13).
Mn2+ luminescence in apatite is well known and
Mariano (1988) found that low concentrations of
Mn (~100 ppm) can serve as an activator for
visible CL in apatite. Filipelli and Delaney (1993)
reported that synthetic samples with <40 ppm Mn
can be considered non-luminescent, based on
visual criteria.
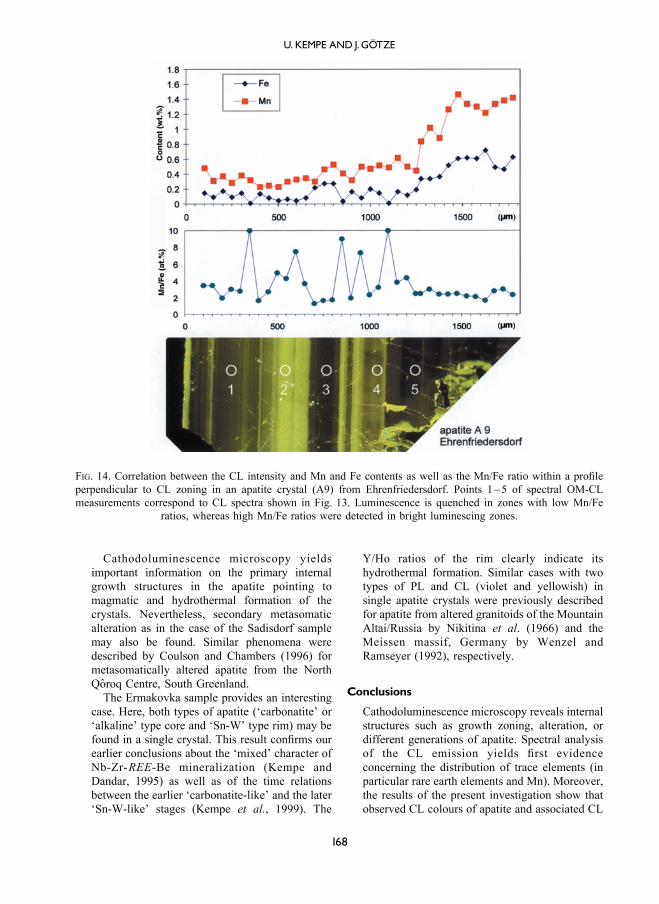
Microanalyses perpendicular to the visible CL
zoning were performed on one of the apatite
samples from Ehrenfriedersdorf (Fig. 14). Only
Mn and Fe were found in significant quantities in
addition to Ca, P and F. Although the absolute
content of Mn increases from the rim to the core,
there is no direct effect on the CL intensity. As
can be seen in Fig. 14, there is also no direct
correlation between CL intensity and the concen-
trations of Fe. In contrast, a strong correlation
exists between the CL intensity and the Mn/Fe
ratio. Zones with the highest Mn/Fe ratios exhibit
the brightest CL emission, whereas low Mn/Fe
ratios (even in zones with high absolute Mn
contents) result in dull or no visible CL. While
Mn2+ acts as a strong CL activator, Fe2+ is known
as an effective quencher of luminescence
(although it was not possible to prove directly
the existence of Fe2+ in our samples). Therefore, a
quantitative estimation of the Mn concentration in
apatite using the intensity of the Mn2+-activated
emission band at 565 nm, as it was proposed for
calcite (Habermann et al., 2000), is not possible.
Our result is in agreement with the findings by
Filipelli and Delaney (1993) for synthetic apatite,
FIG. 11. Shift of the Eu2+ emission band from 410 nm (Kovdor apatite) to 441 nm (Ehrenfriedersdorf sample) as
detected by laser-induced luminescence spectroscopy.
CLBEHAVIOUR ANDCRYSTALCHEMISTRYOFAPATITE
165

although the concentrations of Mn and Fe in our
samples are much higher (0.2�0.8 wt.% instead
of concentrations <0.2 wt.% for Mn and
<0.8 wt.% for Fe)
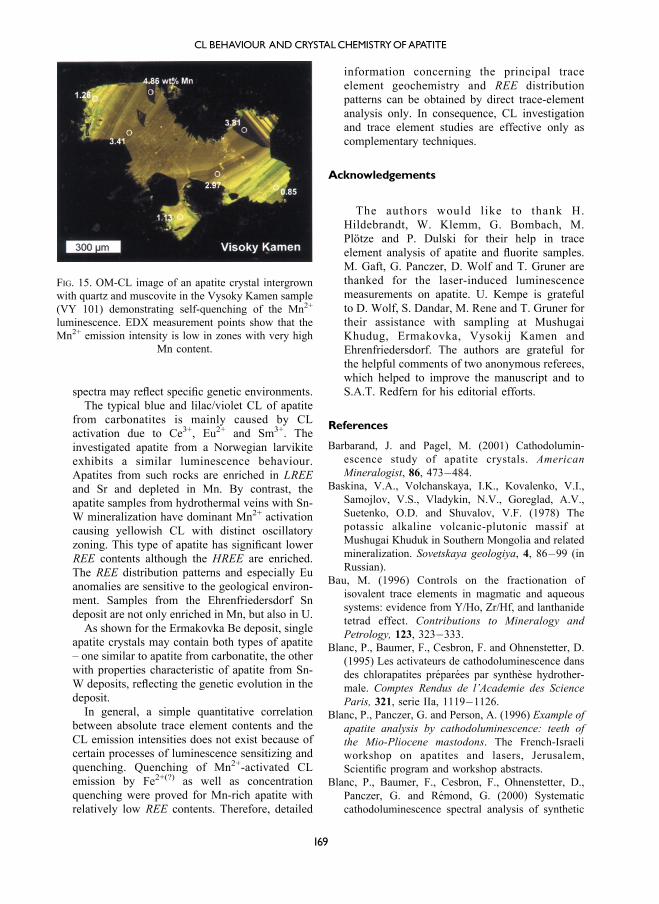
Concentration quenching of Mn2+ luminescenceThe apatite from the Vysoky Kamen granite
demonstrates another case of luminescence
quenching. The only element detected here by
EDX analysis besides Ca, P and F was Mn. There
is a clear correlation of the luminescence intensity
with the Mn content (Fig. 15). All zones with Mn
concentrations >>2.0 wt.% show dull lumines-
cence, while zones with 1.0�2.0 wt.% Mn
luminesce brightly. The effect of luminescence
quenching with increasing concentration is known
Sam
ple
/cho
nd
rite
10
10
10
10
10
10
10
apatite
La Ce Pr Nd Sm Eu Gd Tb Dy Ho Er Tm Yb Lu
pegmatite
breccia
pegmatite
(altered)
topaz-quartz body
-1
1
2
3
5
0
4
La Ce Pr Nd Sm EuGd Tb Dy Ho Er Tm Yb
10
10
10
10
10
10
fluorite
-1
0
1
2
3
4
1
2
Sam
ple
/cho
nd
rite
Lu
3
4
FIG. 12. Chondrite-normalized REE distribution patterns of apatite from Ehrenfriedersdorf from different geological
environments (pegmatite, topaz-albite granite, apatite-bearing contact breccia). The REE content, degree and sign of
the Eu anomaly and intensity of the tetrad effect vary in accordance with the sampling site. The REE distribution
patterns of pale rose fluorite from (1) a greisen veinlet and a succession of green to purple fluorite (2,3,4) from a
quartz-cassiterite vein in the exocontact of the Ehrenfriedersdorf granite (inset) are shown for comparison. Data for
apatite from pegmatite according to Trinkler and Martin (1998); data for fluorite from Monecke et al. (2000b).
166
U.KEMPE AND J.G'TZE
as concentration quenching and was also found,
e.g. for REE centres in scheelite (Kempe et al.,
1991). According to Filipelli and Delaney (1993),
Mn2+ luminescence intensity saturates at Mn
concentrations of ~500 ppm.
Complex relations between trace element contents and CLintensities
Although the CL emission of Mn2+ and REE2+/3+
is clearly related to Mn and REE incorporation in
apatite, there is no simple correlation between the
contents of these elements and the related
emission intensities. Our results suggest possible
quenching and sensitizing of REE-activated
luminescence by La3+ and Mn2+ centres,
respectively.
Likewise, the emission of Mn2+ is possibly
influenced by charge conversion and lattice
damage due to radioactive irradiation. As
demonstrated above, in some cases Mn2+-
activated CL is quenched by Fe2+ and self-
quenching mechanisms (high Mn2+ content).
Additional factors influencing the CL emission
intensities in apatite are discussed in the literature
(Perseil et al., 2000; Barbarand and Pagel, 2001).
Genetic implicationsIt can be concluded from our results that there are
at least two types of apatite in the two types of
mineralization investigated. These may be distin-
guished easily by their trace element character-
istics and CL behaviour.
Apatite from alkaline rocks and carbonatite is
typically extremely rich in LREE and Sr. In the
samples investigated, Th was also found to be
prominent. Chemical characteristics are in accor-
dance with the composition of the enclosing rocks
and the general CL behaviour. Blue to lilac/violet
luminescence may be assigned to high contents of
Ce3+, Eu2+ and Sm3+ emission centres.
Intensive Mn2+ emission of apatite from Sn-W
deposits is in agreement with general high Mn
concentrations and relatively low REE concentra-
tions as well as with the HREE enrichment.
The REE distribution patterns of apatite (as well
as of fluorite) from Sn-W deposits may serve as a
‘tracer’ for REE behaviour in such ore systems.
These patterns vary in accordance with variations in
the geological environment. The high U/Th ratios
found in such apatite are also in agreement with the
general trend of U enrichment in Sn deposits
(Seifert and Kempe, 1994; Morozov et al., 1996).
FIG. 13. Variation of Mn2+ OM-CL intensity within an oscillatory zoned apatite crystal (A9) from Ehrenfriedersdorf.
Measurement points are shown in Fig. 14. The spectra demonstrate that only Mn2+ emission is responsible for the
signal intensity observed in the OM-CL images of the crystal.
CLBEHAVIOUR ANDCRYSTALCHEMISTRYOFAPATITE
167
Cathodoluminescence microscopy yields
important information on the primary internal
growth structures in the apatite pointing to
magmatic and hydrothermal formation of the
crystals. Nevertheless, secondary metasomatic
alteration as in the case of the Sadisdorf sample
may also be found. Similar phenomena were
described by Coulson and Chambers (1996) for
metasomatically altered apatite from the North
Qoroq Centre, South Greenland.
The Ermakovka sample provides an interesting
case. Here, both types of apatite (‘carbonatite’ or
‘alkaline’ type core and ‘Sn-W’ type rim) may be
found in a single crystal. This result confirms our
earlier conclusions about the ‘mixed’ character of
Nb-Zr-REE-Be mineralization (Kempe and
Dandar, 1995) as well as of the time relations
between the earlier ‘carbonatite-like’ and the later
‘Sn-W-like’ stages (Kempe et al., 1999). The
Y/Ho ratios of the rim clearly indicate its
hydrothermal formation. Similar cases with two
types of PL and CL (violet and yellowish) in
single apatite crystals were previously described
for apatite from altered granitoids of the Mountain
Altai/Russia by Nikitina et al. (1966) and the
Meissen massif, Germany by Wenzel and
Ramseyer (1992), respectively.
Conclusions
Cathodoluminescence microscopy reveals internal
structures such as growth zoning, alteration, or
different generations of apatite. Spectral analysis
of the CL emission yields first evidence
concerning the distribution of trace elements (in
particular rare earth elements and Mn). Moreover,
the results of the present investigation show that
observed CL colours of apatite and associated CL
FIG. 14. Correlation between the CL intensity and Mn and Fe contents as well as the Mn/Fe ratio within a profile
perpendicular to CL zoning in an apatite crystal (A9) from Ehrenfriedersdorf. Points 1�5 of spectral OM-CL
measurements correspond to CL spectra shown in Fig. 13. Luminescence is quenched in zones with low Mn/Fe
ratios, whereas high Mn/Fe ratios were detected in bright luminescing zones.
168
U.KEMPE AND J.G'TZE
spectra may reflect specific genetic environments.
The typical blue and lilac/violet CL of apatite
from carbonatites is mainly caused by CL
activation due to Ce3+, Eu2+ and Sm3+. The
investigated apatite from a Norwegian larvikite
exhibits a similar luminescence behaviour.
Apatites from such rocks are enriched in LREE
and Sr and depleted in Mn. By contrast, the
apatite samples from hydrothermal veins with Sn-
W mineralization have dominant Mn2+ activation
causing yellowish CL with distinct oscillatory
zoning. This type of apatite has significant lower
REE contents although the HREE are enriched.
The REE distribution patterns and especially Eu
anomalies are sensitive to the geological environ-
ment. Samples from the Ehrenfriedersdorf Sn
deposit are not only enriched in Mn, but also in U.
As shown for the Ermakovka Be deposit, single
apatite crystals may contain both types of apatite
– one similar to apatite from carbonatite, the other
with properties characteristic of apatite from Sn-
W deposits, reflecting the genetic evolution in the
deposit.
In general, a simple quantitative correlation
between absolute trace element contents and the
CL emission intensities does not exist because of
certain processes of luminescence sensitizing and
quenching. Quenching of Mn2+-activated CL
emission by Fe2+(?) as well as concentration
quenching were proved for Mn-rich apatite with
relatively low REE contents. Therefore, detailed
information concerning the principal trace
element geochemistry and REE distribution
patterns can be obtained by direct trace-element
analysis only. In consequence, CL investigation
and trace element studies are effective only as
complementary techniques.
Acknowledgements
The authors would like to thank H.
Hildebrandt, W. Klemm, G. Bombach, M.
Plotze and P. Dulski for their help in trace
element analysis of apatite and fluorite samples.
M. Gaft, G. Panczer, D. Wolf and T. Gruner are
thanked for the laser-induced luminescence
measurements on apatite. U. Kempe is grateful
to D. Wolf, S. Dandar, M. Rene and T. Gruner for
their assistance with sampling at Mushugai
Khudug, Ermakovka, Vysokij Kamen and
Ehrenfriedersdorf. The authors are grateful for
the helpful comments of two anonymous referees,
which helped to improve the manuscript and to
S.A.T. Redfern for his editorial efforts.
References
Barbarand, J. and Pagel, M. (2001) Cathodolumin-
escence study of apatite crystals. American
Mineralogist, 86, 473�484.
Baskina, V.A., Volchanskaya, I.K., Kovalenko, V.I.,
Samojlov, V.S., Vladykin, N.V., Goreglad, A.V.,
Suetenko, O.D. and Shuvalov, V.F. (1978) The
potassic alkaline volcanic-plutonic massif at
Mushugai Khuduk in Southern Mongolia and related
mineralization. Sovetskaya geologiya, 4, 86�99 (in
Russian).
Bau, M. (1996) Controls on the fractionation of
isovalent trace elements in magmatic and aqueous
systems: evidence from Y/Ho, Zr/Hf, and lanthanide
tetrad effect. Contributions to Mineralogy and
Petrology, 123, 323�333.
Blanc, P., Baumer, F., Cesbron, F. and Ohnenstetter, D.
(1995) Les activateurs de cathodoluminescence dans
des chlorapatites preparees par synthese hydrother-
male. Comptes Rendus de l’Academie des Science
Paris, 321, serie IIa, 1119�1126.
Blanc, P., Panczer, G. and Person, A. (1996) Example of
apatite analysis by cathodoluminescence: teeth of
the Mio-Pliocene mastodons. The French-Israeli
workshop on apatites and lasers, Jerusalem,
Scientific program and workshop abstracts.
Blanc, P., Baumer, F., Cesbron, F., Ohnenstetter, D.,
Panczer, G. and Remond, G. (2000) Systematic
cathodoluminescence spectral analysis of synthetic
FIG. 15. OM-CL image of an apatite crystal intergrown
with quartz and muscovite in the Vysoky Kamen sample
(VY 101) demonstrating self-quenching of the Mn2+
luminescence. EDX measurement points show that the
Mn2+ emission intensity is low in zones with very high
Mn content.
CLBEHAVIOUR ANDCRYSTALCHEMISTRYOFAPATITE
169
doped minerals: anhydrite, apatite, calcite, fluorite,
schee l i t e and z i rcon . Pp . 127�160 in :
Cathodoluminescence in Geosciences (M. Pagel, V.
Barbin, P. Blanc and D. Ohnenstetter, editors).
Springer Verlag, Berlin, Heidelberg, New York.
Boudreau, A.E. and Kruger, F.J. (1990) Variation in the
composition of apatite through the Merensky cyclic
unit in the Western Bushveld Complex. Economic
Geology, 85, 737�745.
Coulson, I.M. and Chambers, A.D. (1996) Patterns of
zonation in rare-earth-bearing minerals in nepheline
syenites of the North Qoroq Center, South
Greenland. Canadian Mineralogist, 34, 1163�1178.
Elliot, J.C. (1994) Structure and Chemistry of the
Apatites and other Calcium Orthophosphates.
Elsevier, Amsterdam, London, New York, Tokyo.
Filippelli, G.M. and Delaney, M.L. (1993) The effects of
manganese(II) and iron(II) on the cathodo-
luminescence signal in synthetic apatite. Journal of
Sedimentary Petrology, 63, 167�173.
Finch, A.A. (1992) Cathodoluminescence microscopy in
the characterisation of rocks and ceramics.
Proceedings of the Royal Microscopy Society, 27,
179�184.
Finch, A.A. and Fletcher, J.G. (1992) Vitusite � an
apatite derivative structure. Mineralogical Magazine,
56, 235�239.
Fleischer, M. and Altschuler, Z.S. (1986) The
lanthanides and yttrium in minerals of the apatite
group � an analysis of the available data. Neues
Jahrbuch fur Mineralogie Monatshefte, 1986(10),
467�480.
Gaft, M., Reisfeld, R., Panczer, G., Blank, P. and
Boulon, G. (1998) Laser-induced time-resolved
luminescence of minerals. Spetrochimica Acta Part
A, 54, 2163�2175.
Gavrilenko, V., Morozov, M., Kempe, U., Smolenskiy,
V. and Wolf, D. (1997) Unusual REE distribution
patterns in fluorites from Sn-W deposits of the
quartz-cassiterite and quartz-wolframite type.
Journal of the Czech Geological Society, 42, 36
(abstract).
Goldstein, S., Kempe, U. and Klemm, W. (1995) REE in
fluorite from tin deposits in the Erzgebirge region:
Implications for the origin of Eu-anomalies in Li-F
granites. European Journal of Mineralogy, 7, Beiheft
1, 85 (abstract).
Gotze, J., Heimann, R.B., Hildebrandt, H. and Gburek,
U. (2001) Microstructural investigation into calcium
phosphate biomaterials by spatially resolved
cathodoluminescence. Materialwissenschaft und
Werkstofftechnik, 31, 1�7.
Habermann, D., Neuser, R.D. and Richter, D.K. (2000)
Quantitative high resolution spectral analysis of
Mn2+ in sedimentary calcite. Pp. 331�358 in:
Cathodoluminescence in Geosciences (M. Pagel, V.
Barbin, P. Blanc and D. Ohnenstetter, editors).
Springer Verlag, Berlin, Heidelberg, New York.
Hosel, G. (1994) Das Zinnerz-Lagerstattengebiet
Ehrenfriedersdorf /Erzgebirge . Sachsisches
Landesamt fur Umwelt und Geologie, Radebeul
und Sachsisches Oberbergamt, Freiberg, Germany.
Hughes, J.M., Cameron, M. and Crowley, K.D. (1991a)
Ordering of divalent cations in the apatite structure:
crystal structure refinements of natural Mn- and Sr-
bearing apatite. American Mineralogist, 76,
1857�1862.
Hughes, J.M., Cameron, M. and Mariano, A.M. (1991b)
Rare-earth-element ordering and structural variations
in natural rare-earth-bearing apatite. American
Mineralogist, 76, 1165�1173.
Irber, W. (1999) The lanthanide tetrad effect and its
correlation with K/Rb, Eu/Eu*, Sr/Eu, Y/Ho and Zr/
Hf of evolving peraluminous granite suites.
Geochimica et Cosmochimica Acta, 63, 489�508.
Jachovsky, T. (1994) Inner structure of tin-tungsten
bearing cupolas near Krasno (Slavkovsky Les Mts.).
Pp. 137�141 in: Metallogeny of Collisional Orogens
(R. Seltmann, H. Kampf and P. Moller, editors).
Czech Geological Survey, Prague.
Kempe, U. and Dandar, S. (1995) Nb-Zr-REE miner-
alization: a possible source of HREE. Pp. 463�466
in: Mineral Deposits: from their Origin to their
Environmental impacts (J. Pasava, T. Kribek and K.
Zak, editors). Balkema, Rotterdam, The Netherlands.
Kempe, U. and Goldstein, S. (1997) Eu anomalies,
tetrad effect and HREE enrichment in fluorites from
Sn deposits: evidence for two sources mixing and
phase separation. Journal of the Czech Geological
Society, 42, 37 (abstract).
Kempe, U., Trinkler, M. and Wolf, D. (1991) Yttrium
und die Seltenerdfotolumineszenz naturlicher
Scheelite. Chemie der Erde, 51, 275�289.
Kempe, U., Gotze, J., Dandar, S. and Habermann, D.
(1999) Magmatic and metasomatic processes during
formation of the Nb-Zr-REE deposits Khaldzan
Buregte and Tsakhir (Mongolian Altai): Indications
from a combined CL-SEM study. Mineralogical
Magazine, 63, 165�177.
Kharlamov, Yu.S., Kudryavtseva, G.P., Garanin, V.K.,
Korenova, N.G., Moskalyuk, A.A., Sandomirskaya,
S.M. and Shugurova, N.A. (1981) Origin of
carbonatites of the Kovdor deposit. International
Geology Review, 23, 865�880.
Knutson, C., Peacor, D.R. and Kelly, W.C. (1985)
Luminescence, color and fission track zoning in
apatite crystals of the Panasqueira tin-tungsten
deposit , Beira-Baixa, Portugal. American
Mineralogist, 70, 829�837.
Kovalenko, V.I., Antipin, V.S., Vladykin, N.V.,
Smirnova, E.V. and Balashov, Yu.A. (1982) REE
distribution coefficients for apatite and REE
170
U.KEMPE AND J.G'TZE

behaviour in magmatic environement. Geokhimiya,
2, 230�243 (in Russian).
Kuznecov, G.V. and Tarashchan, A.N. (1975) Emission
centres in natural apatite. Konstituciya i svojstva
mineralov, 9, 120�124 (in Russian).
Landa, E.A., Krasnova, N.I., Tarnovskaya, A.N. and
Shergina, Yu.P. (1983) Distribution of rare earths
and yttrium in apatite from ultrabasic and carbonatite
intrusions and the origin of apatite mineralization.
Geochemistry International, 20, 77�87.
Lykhin, D.A., Kosticyn, Yu.A.; Kovalenko, V.I.,
Yarmolyuk, V.V., Sal’nikova, E.B., Kotov, A.B.,
Kovach, V.P. and Ripp, G.S. (2001) Ore-forming
magmatism of the Ermakovka Be deposit in Western
Transbaikalia: age, source of magma and relation to
mineralisation. Geologiya rudnykh mestorozhdenii,
43, 52�70 (in Russian).
Marfunin, A.S. (1979) Spectroscopy, Luminescence and
Radiation Centers in Minerals. Springer-Verlag,
Berlin.
Mariano, A.N. (1988) Some further geological applica-
tions of cathodoluminescence. Pp. 94�123 in:
Cathodoluminescence of Geological Materials (D.J.
Marshall, editor). Unwin Hyman, Boston, USA.
Mitchell, R.H., Xiong, J., Mariano, A.N. and Fleet, M.E.
(1997) Rare-earth-element-activated cathodo-
luminescence in apatite. Canadian Mineralogist,
35, 979�998.
Monecke, T., Bombach, G., Klemm, W., Kempe, U.,
Gotze, J. and Wolf, D. (2000a) Determination of
trace elements in the quartz reference material UNS-
SpS and in natural quartz samples by ICP-MS.
Geostandards Newsletter, 24, 73�81.
Monecke, T., Monecke, J., Monch, W. and Kempe, U.
(2000b) Mathematical analysis of rare earth element
patterns of fluorites from the Ehrenfriedersdorf tin
deposit, Germany: evidence for a hydrothermal
mixing process of lanthanides from two different
sources. Mineralogy and Petrology, 70, 235�256.
Morozov, A.M., Morozova, L.G., Trefimov, A.K. and
Feofilov, P.P. (1970) Spectral and luminescent
characteristics of fluoroapatite single crystals acti-
vated by rare earth ions. Optika i Spektroskopia, 29,
590�596 (in Russian).
Morozov, M., Trinkler, M., Plotze, M. and Kempe, U.
(1996) Spectroscopic studies on fluorite from Li-F
and alkaline granitic systems in Central Kazakhstan.
Pp. 359�369 in: Granite-related Ore Deposits of
Central Kazakhstan and Adjacent Areas (V. Shatov,
R. Seltmann, A. Kremenetsky, B. Lehmann, V.
Popov, and P. Ermolov, editors). Glagol Publishing
House, St. Petersburg, Russia.
Murray, J.R. and Oreskes, N. (1997) Uses and
limitations of cathodoluminescence in the study of
apatite paragenesis. Economic Geology, 92,
368�376.
Nikitina, E.I., Sotnikov, V.I. and Shcherbakova, M.Y.
(1966) Luminescing apatites from granites and
greisens of the Mountain Altai . Zapiski
Vsesoyuznogo Mineralogicheskogo Obshchestva,
95, 589�593 (in Russian).
Novikova, M.I., Shpanov, E.P. and Kupriyanova, I.I.
(1994) Petrography of the Ermakovskoe beryllium
ore deposit, Western Transbaikal region. Petrology,
2, 98�109.
Ontoev, D.O., Luvsandanzan, B. and Gundsambuu, Ts.
(1979) Geology and primary mineralisation of the
Mushugai F-REE deposit (Mongolia). Geologiya
Rudnykh Mestorozhdenij, 3, 27�42 (in Russian).
Pan, Y. and Fleet, M.E. (1996) Rare earth element
mobility during prograde granulite facies meta-
morphism: significance of fluorine. Contributions to
Mineralogy and Petrology, 123, 251�262.
Perseil, E.-A., Blanc, P. and Ohnenstetter, D. (2000) As-
bearing fluorapatite in manganiferous deposits from
St. Marcel-Praborna, Val D’Aosta, Italy. Canadian
Mineralogist, 38, 101�117.
Portnov, A.M. and Gorobets, B.S. (1969) Luminescence
of apatite from different rock types. Doklady
Akademia Nauk SSSR, 184, 110�115 (in Russian).
Rae, D.A., Coulson, I.M. and Chambers, A.D. (1996)
Metasomatism in the North Qoroq centre, South
Greenland: apatite chemistry and rare-earth element
transport. Mineralogical Magazine, 60, 207�220.
Raimbault, L. (1988) The recording of fluid phases
through REE contents in hydrothermal minerals. A
case study: apatites from the Meymac tungsten
district (French Massif Central). Pp. 151�159 in:
Mineral Deposits within the European Community
(J. Boissonnas and P. Omenetto, editors). Springer,
Berlin, Heidelberg.
Rakovan, J. and Reeder, R. (1996) Intracrystalline rare
earth element distributions in apatite: Surface
structural influences on incorporation during growth.
Geochimica et Cosmochimica Acta, 60, 4435�4445.
Rene, M. (1998) Development of topaz-bearing granites
of the Krundum massif (Karlovy Vary pluton). Acta
Universitatis Carolinae, 42, 103�109.
Rieser, U., Krbetschek, M.R. and Stolz, W. (1994)
CCD-camera based high sensitivity TL/OSL-spec-
trometer. Radiation Measurement, 23, 523�528.
Roeder, P.L., MacArthur, D., Ma, X.-P., Palmer, G.R.
and Mariano, A.N. (1987) Cathodoluminescence and
microprobe study of rare-earth elements in apatite.
American Mineralogist, 72, 801�811.
Rønsbo, J.G. (1989) Coupled substitution involving
REEs and Na and Si in alkaline rocks from the
Ilimaussaq intrusion, South Greenland and the
petrological implications. American Mineralogist,
74, 896�901.
Rundqvist, I.K., Baskina, V.A. and Ontoev, D.O. (1995)
Mushugay-Khuduk REE-Fe-F deposit in Southern
CLBEHAVIOUR ANDCRYSTALCHEMISTRYOFAPATITE
171
Mongolia. Global Tectonics and Metallogeny, 5,
41�51.
Seifert, Th. and Kempe, U. (1994) Sn-W-Lagerstatten
und spatvariszische Magmatite des Erzgebirges.
European Journal of Mineralogy, 6, Beiheft 2,
125�172.
Seifert, W., Kampf, H. and Wasternack, J. (2000)
Compositional variations in apatite, phlogopite and
other accessory minerals of the ultramafic Delitzsch
complex, Germany: implications for cooling history
of carbonatites. Lithos, 53, 81�100.
Seltmann, R., Schneider, Th. and Lehmann, B. (1995)
The rare-metal granite-pegmatite system of
Ehrenfriedersdorf/Erzgebirge: Fractionation and
magmatic-hydrothermal transition processes. Pp.
521�524 in: Mineral Deposits: from their Origin
to their Environmental Impacts (J. Paava, B. Køibek
and K. Zak, editors). Balkema, Rotterdam, The
Netherlands.
Trinkler, M. and Martin, M. (1998) Zur Mineralogie und
Genese des "Stockscheiders" von Ehrenfriedersdorf.
Zeitschrift fur geologische Wissenschaften, 26,
293�314.
Vasil’eva, Z.V., Volchanskaya, I.K., Ontoev, D.O.,
Borisovskij, S.E., and Yakovlevskaya, T.Ya. (1978)
On REE-rich zoned apatite from Southern Mongolia.
Izvestiya AN SSSR, ser. geol., 2, 143�148 (in
Russian).
Wenzel, T. and Ramseyer, K. (1992) Mineralogical and
mineral-chemical changes in a fractionation-domi-
nated diorite-monzodiorite-monzonite sequence: evi-
dence from cathodoluminescence. European Journal
of Mineralogy, 4, 1391�1399.
Whitney, P.R. and Olmsted, J.F. (1998) Rare earth
element metasomatism in hydrothermal systems:
The Willsboro-Lewis wollastonite ores, New York,
USA. Geochimica et Cosmochimica Acta, 62,
2965�2977.
Zhang, S,, Wang, L. and Yang, W. (1985) Use of REE
analysis in apatite to distinguish petrological and
mineralogical series of granitic rocks. Geochimica,
1, 45�57.
[Manuscript received 18 May 2001:
revised 20 November 2001]
172
U.KEMPE AND J.G'TZE