what is the pulsed cathodoluminescence?
TRANSCRIPT

2
What is the Pulsed Cathodoluminescence
Vladimir Solomonov and Alfiya Spirina The Institute of Electrophysics of Ural Branch of the Russian Academy of Sciences
Russia
1 Introduction
A cathodoluminescence phenomenon was revealed in the 19th century The first explanation of this phenomenon was given by Julius Pluumlcker in 1858 and two decades later by Sir William Crookes (1879) A cathodoluminescence intensity is defined by the concentration of electrons (holes) ndash ne(h) generated by electrons injected into substance Generally this concentration is described by the kinetic equation
( ) 2
( ) ( )e h
e h e h
dnG An Bn
dt 0 e
e i
E jG
ed (1)
Here A and B are the coefficients of electrons (holes) recombination processes which obey to
linear and quadratic laws Coefficient A is a generalized characteristic of the processes
which relate to formation and dissociation of electron and hole centres These processes are
accompanied with the capture or the release of free electron (hole) The luminescence
intensity of these centres is proportional to concentration Ie(h)~Ane(h) Coefficient B is
defined by the annihilation of free electron-hole pairs which resulted in origination of
interband excitonic and intracentre kinds of luminescence with intensity of I~Bn2e(h) Thus
the coefficients A and B are the characteristics of certain substance Usually for pure crystals
(undoped) the coefficient A has an order of 105-106 s-1 whereas it is of 108 s-1 in case of
crystals doped with donor (acceptor) ions The value of coefficient B amounts to 10-10 cm3s-1
for the interband transition in large-band-gap semiconductors [Bogdankevich et al 1975
Galkin 1981] Coefficient G is the generation rate of electron-hole pairs inside a sample that
is irradiated by primary electrons The energy and current density of these electrons are
determined as follows
0 0 ee
iE eU j
S (2)
In Eqs (1) and (2) U0 e ie S de are an accelerating potential electron charge a current of accelerated electrons an irradiated area of sample and an electron penetration depth
respectively An average ionization energy i in Eq (1) can be approximately estimated as
i3Eg where Eg is a band-gap energy
The current of accelerated electrons (ie) being injected into the sample can be determined with the help of equivalent circuit that is shown in Fig 1
wwwintechopencom
Cathodoluminescence
32
Fig 1 The equivalent circuit of electron current
Here electron accelerator is represented as a source of accelerating potential U0 with internal
resistance R0=U0i0=const The sample with irradiated surface 20S r forms a capacitor
with C=2r00 Here 0 is the dielectric constant and is the permittivity of environment (eg air) Resistor Rt is introduced as a shunt for capacitor C and it provides the discharge of the sample surface For this circuit at Rt=const and initial condition ie(0)=io the electron current is described by the equation
00
0
( ) 1 exp expe et c c
U t ti t i
R R (3)
where c=CR0Rt(R0+Rt) is a typical charge time of capacity C
For example in the cathodoluminescent microscope [Ramseyer et al 1989 Petrov 1996] the shunting of capacity C is provided by the emission of secondary electrons over the irradiated sample surface This emission results in setting the finite value of shunting resistance Rt Dynamic balance between the primary electrons which are injected into the
sample and the secondary electrons which leave the sample is equilibrated at tgtgtc After that time the current of injected electrons ie tends to achieve the value defined as ie=U0(R0+Rt) and the constant generation rate of electron-hole pairs G is equilibrated These conditions are realized for the narrow energy range of the primary electrons 1ltEelt12 keV
resulted in a small depth of electron penetration de=01-15 m Thus the lower energy of the primary electrons is limited by the work function of the secondary electrons through the sample surface The upper one is limited by the energy loss of secondary electrons which appeared on the large depth inside the sample under diffusion to the sample surface
The solution of Eq (1) using G=const reveals that under irradiation by electron beam the concentration of electron-hole pairs inside the sample volume which is determined by the beam cross-section and penetration depth of electrons is saturated rapidly with time according to the following equation
( )2
exp( ) 1 12 2
exp( ) 1 4
ti ie h i i
i i
tn G G
t A BG A
(4)
Here i is an ionization time of substance =1+Ai =1-Ai where Ailt1 From the Eq (4) it can be seen that the concentration of electron-hole pairs increases with increasing the
wwwintechopencom
What is the Pulsed Cathodoluminescence
33
coefficient G Therefore in order to achieve a high brightness of luminescence the electron
beam is focused on the sample surface in the spot with a diameter of 1-50 m and current
density je in the range from 10-2 to 10 Acm2 The coefficient G amounts to 1023-1026 cm-3s-1
and the range of typical time i has an order of 10-6-10-9 s
Since the 1980-s the electron beams with the energy increased to 20-70 keV and density of electron current of je=01-10 Acm2 are applied These electrons are able to penetrate into the
sample on a depth of 3-30 m [Chukichev et al 1990 Yang et al 1992] The secondary electrons originated on such a depth inside the sample dissipate their own energy while moved to the outer surface and canrsquot emit outside In this case the dynamic balance is provided by the flow of the surplus charge via thin metal film previously deposited on the sample surface being irradiated and served as a ground Now the shunt Rt is determined by the contact electroconductivity of the irradiated area with the metal film At these
parameters of electron beam the coefficient G the ionization time i and the charging time of
capacity c have values of the same order those were mentioned above However at increased energy of electrons the luminescence intensity increases due to the deeper penetration of electrons and as a result the larger excited volume of substance
To decrease the thermal load on the irradiated surface at the electron energy of 20-70 keV the pulsed electron beam with the pulse duration of 1-10 ms [Chukichev et al 1990] or modulated electron beam with the modulation frequency of 100-300 Hz [Yang et al 1992] are applied The luminescence excited by such electron beams is usually called the pulsed cathodoluminescence (PCL) [Chukichev et al 1990] However this PCL is the steady-state
one since the pulse duration of injected electrons is much greater than i and c yet
PCL [Solomonov et al 2003] to be talked about in the present chapter is excited at the conditions when the dynamic balance between the injected and left electrons is absent ie at
Rtinfin The Eq (3) shows in this case that the current of injected electrons damps
exponentially with characteristic time constant as
( ) exp( )e eoi t i t 0 00
0 0
2
e
UR C
j r (5)
This time increases with energy of injected electrons Its value is about 35 ns at E0=200 keV
je0=100 Acm2 r0=1 mm and =1 according to Eq (5) Therefore the PCL excitation should be
carried out by the electron beam with duration te of the same order as The electrons with
energy of 100-200 keV penetrate into dielectric solids on the depth of 100-150 m Due to the
large penetration depth the coefficient G reaches the value of 1026-1027 cm-3s-1 which is similar to that realized at maximum excitation conditions of the steady-state cathodoluminescence
When te the concentration of electron-hole pairs comes to ne(h)05ne(h)max according to Eq
(4) Here ne(h)max is a maximal value of the concentration at teinfin It means that PCL brightness is higher than that of steady-state cathodoluminescence excited at the maximal conditions
PCL spectrum gives the information about the composition and crystal structure of the sample bulk rather than interface layer Interface layers are usually characterized with presence of many absorbed molecules and defect of crystal structure and their properties are not inherent to the bulk of materials In PCL the interface layers with a thickness up to 20
m donrsquot have a significant influence on the PCL spectrum quality [Ramseyer et al 1990]
wwwintechopencom
Cathodoluminescence
34
It should be emphasized that despite of short time of electron beam impact PCL persistence occurs and its kinetics is ascribed by complicated laws This is associated with that the primary source of luminescence excitation is the electron-hole pairs Their concentration according to Eq (1) over the time of electron beam impact (G=0) is given by
0( )
0
exp( )
1 exp( )eh
e heh
B nA Atn
B At A B n
(6)
Here neh0 is the concentration of electron-hole pairs introduced by the electron beam The luminescence intensity of the electron and hole centres changes the same law The intensity of interband luminescence falls proportionally to n2eh These kinds of luminescence reach their maxima at the time moment when the excitation is over The intensity of intracentre luminescence changes more difficulty The first maximum is also reached at the same time
moment but further behaviour depends on the life time of radiative level (r) In the paper [Solomonov et al 1996 2003] it has been shown that there is the second maximum of the
intensity in the long persistence at r( 2 -1)A After this maximum the intensity falls
according to the exponential law with the characteristic time constant r Moreover the
second maximum can be more intensive than the first one If the rlt( 2 -1)A the second
maximum doesnrsquot appear and an exponential decay of luminescence occurs but with characteristic time constant that is proportional to 1(2A) It is worthy to note that in case of using nanosecond exciting electron beams the integral intensity of persistent luminescence is usually similar or even higher than that during excitation
2 Apparatus for the PCL registration
The generation of high-current nanosecond electron beam with the energy higher than 100
keV became possible after creation of electron accelerators by GA Mesyats in the 1970-s
These accelerators are founded on the explosive electron emission [Mesyats 1974] The
electrons having this energy extend at great distance (more than 10 cm) in air The
samples excited in air can be used in the form of pieces powders and solution The
irradiation in air furthers also to the partial compensation of injected charge into sample
by the stream of positive air ions created by the electron beam The large penetration
depth of these electrons into sample simplifies the sample preparation for analysis
considerably namely there is no need to undergo the sample to grinding and polishing
procedures Moreover irradiated surface doesnrsquot require metallization This is very
important for the analysis of the finished product in particular jewels It should be also
noted that the problem of sample warming which is typical for the steady-state
cathodoluminescence is solved due to the introduction of the small energy density ( 3
Jcm3)
The investigation of PCL in the different mediums has shown that the portable nanosecond
accelerators of RADAN [Mesyats et al 1992] are most applicable for its excitation These
accelerators include the sealed vacuum electron tube The biological shielding from X-ray
emission is provided by the design of analytic chamber which is connected with the output
of the accelerator The analysed samples are placed into the chamber The pulsed type of the
luminescence allows using the different methods of its registration
wwwintechopencom
What is the Pulsed Cathodoluminescence
35
As a first the traditional method of the registration with the help of optical monochromator photoelectronic multiplier and oscillograph is applied [Vaysburd etal 1982 Solomonov et al 1996] The intensity kinetics of separated luminescence band is measured by this method This is necessary for the identification of its nature The application of the scanning
monochromator allows registering the intensity distribution by wavelengths I (t) However two PCL features have to be kept in mind The first feature is that the PCL is characterised by the certain degree of instability of the registered parameters because of the pulsed regime Therefore the spectrum measurement has to be performed in the averaging mode The second feature is caused by the different kinetics of PCL bands with the various nature and spectrum registered by such an approach strongly depends on time
As a second the time-integral intensity of the luminescent bands can be measured
2
1
( ) ( )
t
t
I I t dt (7)
Here I (t) is the current intensity t1 is the beginning of registration and t2 is the ending of registration This intensity is registered with the help of multichannel semiconductor photodetectors based on diode matrix and charge-coupled device [Solomonov et al 2003] In this case optical spectrograph is applied instead of the scanning monochromator and the wide spectral range for one frame is measured This method can be used for the PCL research when intracentre luminescence is dominant Also the kinetic information about all registered spectrum can be obtained by means of changing of the integration limits t1 and t2
Fig 2 demonstrates the scheme of experimental setup for the receiving of PCL spectra The setup consists of the luminescence excitation block (1) multichannel photodetector (2) and computer (3)
Fig 2 Scheme of experimental setup
wwwintechopencom
Cathodoluminescence
36
The excitation block (1) represents a combination of RADAN-220 pulsed electron accelerator and analytical chamber The operating principle of the accelerator is based on the explosive emission of electrons from the cold cathode of accelerating tube The RADAN-220 generates electron beam with the duration of 2 ns The voltage that can be applied to the accelerating tube ranges from 150 to 220 keV The commercially available IMA3-150E tube is placed in the analytic chamber The generated electron beam is extracted to air through the beryllium foil and directed vertically downwards The luminescence stream is transferred to the multichannel photodetector (2) by means of the silica multifiber Computer (3) is the control system of the experimental setup ldquoSpecadrdquo software makes possible to realize various modes of the photodetector It provides the calibration registration reviewing processing and archiving of obtained spectra The commercially available pulsed cathodoluminescent spectrograph ldquoCLAVIrdquo [Michailov et al 2001] was created on basis of this experimental setup
3 The application of the pulsed cathodoluminescence for the luminescent analysis of Nd
3+Y3Al5O12 and Nd
3+Y2O3
In the last year the intensive investigations in the field of the optical ceramics creation based on the metal refractory oxide doped with rare-earth ions particularly Nd3+Y3Al5O12 и Nd3+Y2O3 are carried out [Ikesue et al 1995 Lu et al 2001 Bagaev et al 2009] The advantages of the laser ceramics against single crystals include the possibility of creating multilayer elements with sizes greater than those of single crystals larger concentration of active ions and lower manufacturing cost The fitness of crystals or ceramics for active laser elements is determined usually by the photoluminescent methods in infrared region by means of lifetime measurement of upper laser Nd ion level 4F32 [Hoskins et al 1963 Lupei et al 1995] For this aim the method is effective however it doesnrsquot display couses of the lifetime decrease of the laser level This is necessary to know to correct the conditions the conditions of crystal and ceramics synthesis of synthesis of crystalls and ceramics Below the investigation of the PCL spectra is given The possibility of realization of qualitative and quantitative luminescent analyses of Nd3+Y3Al5O12 Nd3+Y2O3 laser materials is developed
31 The luminescence of Nd3+
Y3Al5O12
The emission lines of neodymium ions in Nd3+Y3Al5O12 in visible range correspond to the
transitions from 4f25d1 2F252 level which has three Stark components 0=37775 cm-1
1=37864 cm-1 2=38153 cm-1 to the levels of 4f3 configuration of neodymium ion
[Kolomiycev et al 1984] The wavelengths of observed luminescent lines and their
identification for Nd3+Y3Al5O12 single crystal are presented in Table 1 in the first and the
second columns respectively The numbers of Stark sublevels in according to nomenclature
[Koningstein et al 1964] at increasing their energy starting with zero are pointed next to
symbol of electron level in brackets then emission band wavelengths presented in
[Kolomiycev et al 1982] are shown in brackets
A conspicuous difference appears in PCL spectra of neodymium ions in yttrium aluminates
in case of different crystal structure The spectrum of orthorhombic Nd3+YAlO3 single
crystal together with the spectrum of cubic Nd3+Y3Al5O12 are presented in Fig 3 as an
illustration of this difference
wwwintechopencom
What is the Pulsed Cathodoluminescence
37
Nd3+Y3Al5O12 Nd3+YAlO3
nm
Identification of optical trasfer
nm Identification of optical trasfer
3899 2F252 (2)2H92 (0) (3900) 3946 2F252 (0)4F52 (2) (3946)3992 2F252 (0)2H92 (2) (3975) 3981 2F252 (0)2H92 (3) (3983) 4016 2F252 (0)2H92 (4) (4014)
4225 2D52 (2)4I92 (1) (4230) 4269 2F252 (2)4F92 (3) (4273) 4299 2F252 (1)4F92 (0) (4302) 4299 2F252 (1)4F92 (0) (4299) 4356 2F252 (0)4F92 (2) (4351) 4352 2F252 (1)4F92 (1) (4348) 4390 2D52 (0)4I92 (4) (4388) 4407 2P12 (0) 4I92 (3) (4412) 4504 2F252 (2)2H112 (3) (4505) 4504 2F252 (2)2H112 (3) (4504) 4554 2F252 (0)2H112 (1) (4559) 4560 2F252 (1)2H112 (3) (4560)4588 2F252 (0)2H112 (3) (4583)
4610 2F252 (0)2H112 (4) (4614)
4793 2F252 (1)4G52 (1) (4790) 4807 2F252 (1)4G52 (2) (4805) 4875 2F252 (0)2G72 (0) (4871) 4878 2F252 (0)2G72 (2) (4881)4944 4G112 (2)4I92 (4) (4942)
5252 2F252 (0)4G72 (0) (5249) 5254 2F252 (1)4G72 (1) (5254) 5278 2F252 (1)4G72 (2) (5278) 5380 2F252 (1)4G92 (2) (5383) 5406 2F252 (0)2K132+2G92 (2) (5410) 5395 2F252 (0)4G92 (0) (5393) 5416 2F252 (2)2K132 (2) (5420) 5457 2F252 (2)2K132 (4) (5457) 5475 2F252 (2)2K132 (5) (5475) 5491 2F252 (0)2K132+2G92 (7) (5494) 5492 2F252 (0)2K132 (0) (5490) 5545 2F252 (0)2K132 (3) (5542) 5563 2F252 (0)2K132 (4) (5562) 5574 2F252 (0)2K132+2G92 (10)(5570)
5629 2K152 (3)4I132 (0) (5626) 5636 2K132 (4)4I112(1) (5635)
5764 Superposition2G72 (23)4I92 (02) (5763)
5854 2F252 (2)4G92 (4) (5852) 5874 2F252 (0)4G92 (0) (5868)
5962 Superposition2F252 (0)4G112 (01) (5962)
6006 2F252 (0)4G112 (3) (6001)
6021 2F252(2)4G112+2K152+2D32(6)(6018) 6104 2F252(0)4G112+2K152+2D32(4)(6102) 6121 2F252(1)4G112+2K152+2D32(6)(6118) 6154 2F252(2)4G112+2K152+2D32(13)(6147) 6201 2F252 (0)2K152 (2) (6208) 6201 2F252(0)4G112+2K152+2D32(9)(6198) 6221 2F252(1)4G112+2K152+2D32(11)(6214) 6254 2F252(1)4G112+2K152+2D32(13)(6252) 6383 2H112 (1)4I92 (2) (6377) 6395 2H112 (0)4I92 (2) (6391) 6462 2H112 (3)4I92 (3) (6454) 6524 2H112 (3)4I92 (4) (6526) 6609 2G72 (3)4I112 (4) (6608) 6653 2G72 (0)4I112 (3) (6653) 6686 2G72 (0)4I112 (4) (6679)
Table 1 PCL lines and their identification for Nd3+Y3Al5O12 and Nd3+YAlO3 single crystals
wwwintechopencom
Cathodoluminescence
38
Fig 3 The PCL spectra of Nd3+Y3Al5O12 (1) and Nd3+YAlO3 (2) single crystals
The wavelengths of fundamental neodymium luminescent lines and their identification for Nd3+YAlO3 single crystal are presented in Table 1 in the third and the fourth columns respectively [Osipov et al 2011]
The Fig 3 and Table 1 show that the principal change is manifested in the considerable
increase of the luminescent band numbers in the yttrium monoaluminate spectrum This takes
place due to activation of d-f transitions between the different Stark sublevels and the
appearance of f-f transitions These changes arise from the distortion of crystalline field
symmetry in positions of individual neodymium ions that leads to the modifications of the
oscillator strength and optical transition probability Thus the distortion of crystalline field
symmetry appears in the spectrum as the change in intensity and numbers of emission bands
The differences in the spectra can be used for the determination of the second phase content in Nd3+Y3Al5O12 [Osipov et al 2011] The luminescence lightsum in the spectrum region
from 1 to 2 (2
1
( )S I d
) can be presented by the additive function depended from the
dominant phase content Cg (cubic Nd3+Y3Al5O12) and the second phase Cim=1-Cg
(1 )g gS C C (8)
where and are the coefficients of proportionality They are determined by the integration range and excitation conditions To eliminate the influence of the intensity instability it is necessary to use the ratio of lightsums (S1S2) as the analytical parameter calculated for two ranges of the spectrum The lightsums in the ranges 350-500 nm (S1) and 501-650 nm (S2) to obtain the functional relation between the Cg and the luminescence intensity of neodymium ions have been chosen In that case in accordance with Eq (8) the content of cubic phase into Nd3+Y3Al5O12 is defined the following equation
wwwintechopencom
What is the Pulsed Cathodoluminescence
39
1
1 22
12 2 1 2
2( ) ( )
g
SS
CS
S
(9)
In Fig 4 the correlation between the Cg and S1S2 calculated for the samples with known content of cubic phase is shown
Fig 4 The correlation between the Cg and S1S2
This dependence (Fig 4) is approximated by the following equation with the r2gt099
1
2
1
2
1071 0084
0069g
SS
CS
S
(10)
Moreover the obtained data validity was checked out by the analysis of samples with electron and optical microscopes
32 The luminescence of Y2O3 Nd3+
Y2O3
The wide band of intrinsic radiation in visible range is a visiting luminescent card of pure yttria Earlier the other authors observed this band at different excitation type [Conor 1964 Kuznetsov et al 1978 Bordun et al 1995] Even at cryogenic temperature of the samples the unresolved band was registered
We investigated commercially available yttria powders with a particle sizes of 1-3 m and 5-
10 m All the powders have a cubic lattice of the -Y2O3 From these commercial powders nanopowders with the average particle size of 10-12 nm were prepared by the laser
evaporation method Particles were crystallized in the metastable monoclinic phase -Y2O3
After annealing they transformed to the -Y2O3
wwwintechopencom
Cathodoluminescence
40
The spectrum of the powder with particle size of 1-3 m has a broad asymetric band peaked at 437 nm and long ndash wavelength wing shows local maxima (Fig 5 curve 1)
Fig 5 PCL spectra of commercial yttria powders with particle size 1-3 m (1) 5-10 m (2) and nanopowders with the average particle size of 10-12 nm (3)
In the spectrum of the powder with the particle size of 5-10 m almost all local maxima are transformed into narrow bands (Fig 5 curve 2) They are grouped into four series 435 ndash 510 nm (the blue series) 515 ndash 640 nm (the orange series) 645 ndash 700 nm (the red series) and 785 ndash 840 nm (the infrared series) The PCL spectra of nanopowders irrespective of the crystal
phase (either the -Y2O3 or the -Y2O3 phase) and of the initial coarse powder have a similar structures (Fig 3 curve 3) The broad band with the maximum at 485 nm dominates in these spectra The peak range of this band exhibits local maxima of the blue series Also the lines of orange series at 573 583 612 nm become apparent The red series is weak while the infrared series is hardly seen
The range of the band series observed in the spectra of pulsed cathodoluminescence corresponds to the range of intrinsic radiation of yttria which is identified as the radiation of associated donor-acceptor pairs Y3+ - O2- [Bordun 2002]
Since the luminescence wavelengths of narrow bands of commercial powders nanopowders coincide we can assume that these materials contain intrinsic luminescence centers of the same type
The series of PCL bands of yttria resemble the radiation of free YO radicals which is observed for example in laser plume of yttria-containing target [Osipov et al 2005] This radical has been fairly well studied [Pearse et al 1949] The Table 2 shows the wavelengths of the bands observed in PCL spectra and their identification In the second column of this table the wavelengths of the strongest bands are in boldface
wwwintechopencom
What is the Pulsed Cathodoluminescence
41
Intrinsic luminescence center
VrsquoVrsquorsquo nm
Blue band series the electronic transition B2X2
00 4538
22 4586
33 4611
01 4706
23 4752
02 4887
Orange band series the electronic transition A2X2
20+(Tg+Ag)=380 5428
10 5516
10+(Tg+Ag)=380 5635
00 5729
33 5836
01 6000
34 6122
02 6293
Red band series the electronic transition A2X2
03-(Tg+Ag)=162 6553
03 6624
03+(Tg+Ag)=162 6696
03+Tg=469 6838
Infrared band series the electronic transition A2X2
05+(Tg+Ag)=380 7608
06 7850
8011
8184
Table 2 Parameters of the PCL lines in the yttria spectrum
Based on these data we constructed the energy scheme of the intrinsic luminescence center (Fig 6) Qualitatively this scheme coincides with that of the YO free radicals In this scheme the configuration curves were calculated in the harmonic oscilator approximation as
216 20
0
210 ( )i
i i i
c mE E r
h
(11)
where i =X A and B denotes the electronic states X2 A2 and B2 E0i I and i are the minimal energy the equilibrium distance and the wavenumber of the vibration mode of ith electronic state respectively m0 is the mass of the oxygen atom c and h are the light speed
and Planckrsquos constant The energy E and wavenumbers i are expressed in (11) in reciprocal
centimetres the amplitudes of the (r-i) vibrations are given in nanometres
wwwintechopencom
Cathodoluminescence
42
Fig 6 Energy scheme of the intrinsic luminescence center
For the configuration curves of the X2 A2 and B2 states (Fig 6) E0i=0 17510 and 22090
cm-1 and i=786 675 and 675 cm-1 respectively With these parameters up to the measurement error the wavelengths of pulsed cathodoluminescence coincide with the wavelengths of the optical transitions shown in Table 2 The Franck ndash Condon principle for
molecular transitions is most precisely implemented at A=X+10870910-3 nm and
B=X+1235110-3 nm and X can be estimated as half of elementary cube edge X=01385 nm For electronic ndash vibration transitions for which one of the vibration quantum numbers V is large this principle is implemented only if these transitions involve the most strong phonons [Schaak et al 1970] Table 2 Under these parameters the configuration curves of
the electronic states A2 and B2 intersect at the point with E=25256 cm-1
The qualitative coincidence of the emission bands and the energy structure of intrinsic luminescence centres observed by us and YO free radicals allow us to conclude that intrinsic luminescence centres in yttria contain bound YO radicals [Osipov et al 2008] Consider the possibility of formation of such intrinsic luminescence centre It is known [Schaak et al 1970] that the cubic yttria has unit cell composed of 16 formula units Y2O3 Twenty four cations occupy positions with C2 symmetry and eight cations occupy the positions with C3i symmetry (Fig 7) Every cation is surrounded by six oxygen ions which are positioned on the corners of deformed cube with the edge size of 02702 nm at that two corners is unoccupied Thus in one-third of the cubes (YO6) two oxygen vacancies are located at the cube corners along the face diagonal while in the remaining cubes they are located along the body diagonal (Fig 7)
For such packing a structure presented in Fig 8 can be formed at the outer cube face that contains two oxygen vacancies and that is located at the crystal boundary In essence this structure is the YO radical bound to the crystal lattice by the yttriun ion On such surfaces
the fraction of faces with two oxygen vacancies is 1316=118 and the average distance
wwwintechopencom
What is the Pulsed Cathodoluminescence
43
between them is about 5 nm All of this leads to the dependence of the luminescence spectrum of such bound radicals on the particle size of yttria mainly via their shape
Fig 7 The unit cell of yttria The yttrium positions with C3i and C2 symmetry designated by red and pink balls respectively The oxygen and the vacant positions designated by blue and grey balls The vacant positions are associated by green dot line
Fig 8 The structure of intrinsic luminescence centre
The considered above intrinsic luminescence centre also presents in Nd3+Y2O3 However the presence of neodymium results in decrease of the intrinsic band intensity and distortion of its profile We studied the monoclinic and cubic Nd3+Y2O3 nanopowders The nanopowders
were prepared using a mixture of micropowder -Y2O3 phase and 1 mol Nd2O3 powder After evaporation of this mixture by CO2 laser Nd3+Y2O3 nanoparticles were crystallized into monoclinic phase To transfer nanopowders into cubic phase annealing in air was
carried out above 900C [Kotov et al 2002]
wwwintechopencom
Cathodoluminescence
44
The PCL spectra of all Nd3+Y2O3 samples contain emission lines of neodymium ions which have not been previously observed in photoluminescence Namely neodymium doped nanopowders exhibit a strong band peaking at 825 nm (Fig 9)
Fig 9 The PCL spectra of monoclinic (1) and cubic (2) Nd3+Y2O3 nanopowders
Its components correspond well to the 4F524I92 (825 811 834 nm) and 2H924I92 (818 nm) optical transitions between Nd3+ Starkrsquos sublevels with the energies in Y2O3 cubic lattice [Chang 1966] These components are resolved only in cubic samples (Fig 9) Therefore the splitting of Starkrsquos components allows us to conclude about the presence of the dominant phase into Nd3+Y2O3
To check this assumption the additional investigations were made In Fig 10 the PCL spectra of pressed nanopowders (compacts) are presented The compacts were annealed at
530 750 950 1100 and 1300C The X-ray analysis for this samples showed that the
unannealed compact and annealed compact at 530C have monoclinic phase all remaining compacts are cubic samples It is shown that the splitting of neodymium band at region of 800-840 nm only takes place in cubic samples and one component appears at 825 nm in monoclinic samples
In addition to the band in the region of 800-840 nm two emission bands of neodymium ions
arise in the Nd3+Y2O3 These are a weak band at 720 nm due to 4F924I92 transition and stronger band at 750 nm with the components due to the transitions between the Stark
sublevels 4F724I92 and 4S32 4I92
The intensity weaking of intrinsic band into Nd3+Y2O3 is associated with the quantitative decrease of this centres since the part of yttrium ions are replaced by the neodymium ions The distortion of the intrinsic band is determined by the neodymium absorption of it The most absorption is observed in region at 560-613 nm [Osipov et al 2009]
wwwintechopencom
What is the Pulsed Cathodoluminescence
45
In addition to the present bands into Nd3+Y2O3 the appearance of four well-resolved components in the range of 610-660 nm can be seen The specta of this band for compacts
annealed at 950 and 1300C are presented in Fig 11 The band contains the following four narrow lines at 6206 6306 6453 6556 nm which we identify using Raman spectra as
luminescence of oxygen molecular ion 2O [Solomonov et al 2011]
Fig 10 The PCL spectra of unannealed compact (1) and compacts annealed at 530C (2)
750C (3) 950C (4) 1100C (5) 1300C (6)
wwwintechopencom
Cathodoluminescence
46
The bands with the frequencies of 1615 and 1702 cm-1 correspond to vibrations of the molecular ion in the ground state while the frequencies at 966 and 993 cm-1 correspond to the excited state for the two sites of the oxygen molecular ion in the yttria lattice
Fig 12 demonstrates two sites of defects 2O taking into account the occurrence of two types
of natural vacancies about we talked earlier
Fig 11 The PCL of oxygen molecular ions
Fig 12 Two sites of oxygen molecular ions defects in lattice of cubic Y2O3
Fig 13 presents two potentional curves and formation of luminescence bands The lowest
excited state A2u of the oxygen molecular ion can be stabilized
The observed luminescence band results of the transition from the vibration level Vrsquo=0 of
the excited electronic state A2u to one vibration level Vrsquorsquo=3 of the ground state X2g The
wwwintechopencom
What is the Pulsed Cathodoluminescence
47
bands at 6306 and 6556 nm are formed due to the transition to the vibration level of the groun state with the participation of lattice phonons For the first curve the phonon energy is 255 cm while for the second curve it is 244 cm-1 These phonons are observed in the Raman spectrum The excited electronic state of the molecular ion is spaced from the ground state by 20660-21580 cm-1 [Solomonov et al 2011]
Fig 13 Configuration curves for two sites of oxygen molecular ions
On the basis of the qualitative luminescent analysis of Nd3+Y2O3 the determination of neodymium concentration by means of the calibration curve construction is possible
because of intensity of neodymium lines is proportional to it concentration INd(i)=aiCNd (for example 750 or 825 nm) However we canrsquot use this equation because PCL spectrum is characterized by the instability Therefore we also chose lightsums ratio as analytic parameter in regions of 730-840 nm and 350-840 nm The first region of Nd3+Y2O3 spectrum involves only neodymium bands but the second one includes in addition the intrinsic band which is distorted by the neodymium absorption and can be ascribed as follows
wwwintechopencom
Cathodoluminescence
48
0
1 exp( )( ) i Nd
YO i ii Nd
k C lI I
k C (12)
Here I0i l ki are the intensity of i ndash intrinsic band without absorption the thickness of samples coefficient of absorption of i ndash band respectively Hence relation of lightsums ratio (S(350-840)S(730-840)) with CNd has to include the equation (12) Really this relation is decribed by the following equation
2
1 exp( )(350 840)
(730 840)Nd
Nd
B CSA D
S C
(13)
Fig 14 demonstrates the calibration curve (r2gt099) for the determination of neodymium concentration in region of 011 ndash 107 at
Fig 14 The calibration curve for the determination of neodymium concentration in region of 011 ndash 107 at
4 Conclusion
Thus the possibility of realization of rapid nondestructive qualitative and quantitative luminescent analyses of laser materials in particular Nd3+Y3Al5O12 Nd3+Y2O3 with the help of pulsed cathodoluminescence was shown
5 References
Bagaev S Osipov V Ivanov M Solomonov V Platonov V Orlov A Rasuleva A amp Vatnik S (2009)Fabrication and characteristics of neodymium ndash activated yttrium oxide optical ceramics Optical Materials Vol31 pp 740-743 ISSN 0925-3467
wwwintechopencom
What is the Pulsed Cathodoluminescence
49
Bogdankevich O Darznik S amp Eliseev P (1975) Semiconductor lasers Nauka Moscow Russia
Bordun O Bordun I amp Novosad S (1995) Luminescence centres into Y2O3 Journal of applied spectroscopy Vol62 No6 pp 91-95 ISSN 0021-9037
Bordun O (2002) Influence of oxygen vacancies on the luminescence spectra of thin Y2O3 films Journal of applied spectroscopy Vol69 No3 pp 371-374 ISSN 0021-9037
Chang N (1966) Energy levels and crystal ndash field splittings of Nd3+ in yttrium oxide J Chem Phys Vol44 pp 4044-4050 ISSN 0021-9606
Chukichev M Sabri D Sokolov V amp Surcova T (1990) Cathodoluminescence of solid solution Zn1-xMnxSe Optics and Spectroscopy Vol68 pp 2000-2021 ISSN 0030-4034
Connor O (1964) A theory of thermoluminescence of fluorite (CaF2Y) Radiative recombination from highly associated electron ndash hole pairs Appl Phys Lett Vol4 No1 pp 126-129 ISSN 0003-6951
Galkin G (1981) The interband processes of the recombination into semiconductors at high excitation level Proceedings of the PN Lebedev Physical Institute (Trudi FIAN) Vol128 pp 3-64
Hoskins H amp Soffer B (1963) Stimulated emission from Y2O3Nd3+ Appl Phys Lett Vol4 pp 22-23 ISSN 0003-6951
Ikesue A Kinoshita T Kamata K amp Yoshida K (1995) Fabrication and optical properties of high-performance polycrystalline NdYAG ceramics for solid-state lasers J Amer Ceram Soc Vol78 pp 1033-1040 ISSN 1551-2916
Kolomiycev A Meylman M Volodina I Chukichev M Smagin A amp Bagdasarov H (1982) Luminescence of neodymium ndash activated yttrium ndash aluminum garnet crystals in ultra-violet and visible ranges at high energy excitation Deposition in VINITI No 5995-82 pp 1-15
Kolomiycev A Meylman M Volodina I Chukichev M Smagin A amp Bagdasarov H (1984) Luminescence of neodymium ndash activated yttrium ndash aluminum garnet crystals in ultra-violet and visible ranges at high energy excitation Optics and Spectroscopy Vol56 pp 365-367 ISSN 0030-4034
Koningstein J amp Geusic J (1964)Energy levels and crystal ndash field calculations of neodymium in yttrium aluminum garnet Phys Rev Vol136 No 3A pp 711-716 ISSN 1893-1912
Kotov Yu Osipov V Ivanov M Samatov O Platonov V Azarkevich E Murzakayev A amp Medvedev A (2002) Properties of oxide nanopowders prepared by target evaporation with a pulse ndash periodic CO2 laser Technical Physics Vol47 No11 pp 1420-1426 ISSN 1063-7842
Kuznetsov A Abramov V Rooze N amp Savikhina T (1978) Autolocalized excitons into Y2O3 JETP Letters Vol28 No10 pp 602-605 ISSN 0021-3640
Lu J Murai T Takaichi K Ueda K Yagi H Yanagitani T amp Kaminskii A (2001) Nd3+Y2O3 ceramic laser Jpn J Appl Phys Vol40 pp 1277-1279 ISSN 0021-4922
Lupei V Lupei A Tiseanu C Georgescu S Stoicescu C amp Nanau P (1995) High ndash resolution optical spectroscopy of YAG Nd A test for structural and distribution models Phys Rev B Vol51 No1 pp 8-17 ISSN 0003-6951
Mesyats G (1974) Generating of highpower nanosecond pulses The Soviet radio Moscow Russia
wwwintechopencom
Cathodoluminescence
50
Mesyats G Shpak V Yalandin M amp Shunailov S (1992) Compact RADAN electron accelerators for testing new radiation technologies and sterilization Radiat Phys Chem Vol46 pp 489-492 ISSN 0969-806X
Michailov S Osipov V amp Solomonov V (2001) Pulsed cathodoluminescent analyzer of materials Pribory i tekhnika eksperimenta No3 pp 164-165 ISSN 0032-8162
Osipov V Solomonov V Platonov V Snigireva O Ivanov V amp Lisenkov V (2005) Laser plume spectroscopy 2 Graphite yttrium ndash stabilized and zirconium oxide targets Quantum Electron Vol35 No7 pp 633-637 ISSN 0368-7147
Osipov V Rasuleva A amp Solomonov V (2008) Luminescence of pure yttria Optics and Spectroscopy Vol105 No4 pp 524-530 ISSN 0030-400X
Osipov V Solomonov V Spirina A Ivanov M amp Orlov A (2009) Luminescence of yttrium oxide doped with neodymium Optics and Spectroscopy Vol106 No1 pp 78-83 ISSN 0030-400X
Osipov V Solomonov V amp Spirina A (2011) Luminescent investigation of neodymium doped yttrium aluminates J of Optical Technology Vol78 No6 pp 81-87 ISSN 0030-4042
Pearse R amp Gaydon A (1949) The identification of molecular spectra Inostrannaya Literatura Moscow Russia
Petrov V (1996) Cathodoluminescent microscopy Physics - Uspekhi Vol39 pp 807-818 ISSN 0042-1294
Ramseyer K Fisher J Matter A Eberhardt P amp Geiss J (1989) A cathodoluminescence microscope for low intensity luminescence Journal of Sedimentary Research Vol59 pp 619-622 ISSN 0022-4472
Ramseyer K amp Millis J (1990) Factors influencing short-lived blue cathodoluminescence in
- quartz Journal of Sedimentary Research Vol59 pp 619-622 ISSN 0003-004X Schaak G amp Koningstein J (1970) Phonon and electronic raman spectra of cubic rare-earth
oxides and isomorphous ittrium oxide J Opt Soc Amer Vol60 No8 pp 1110-1115 ISSN 1551-2916
Solomonov V amp Michailov S (2003) Pulsed cathodoluminescence and its application for the analysis of condensed substances UB RAS ISBN 5-7691-1357-X Yekaterinburg Russia
Solomonv V (2003) Kinetics of pulsed cathodoluminescence Optics and Spectroscopy Vol95 pp 248-254 ISSN 0030-4034
Solomonv V Michailov S amp Deykun A (1996) About the mecanism of excitation and the structure of the pulsed cathodoluminescence bands of Cr3+ Mn2+ impurity ions into minerals Optics and Spectroscopy Vol80 pp 447-458 ISSN 0030-4034
Vaysburd D Semin B Tavanov E Matlis S Balichev I amp Gering G (1982) Highenergy electronics of solid Nauka Novosibirsk Russia
Yang B Luff B amp Townsend F (1992) Chatodoluminescence of natural zircons J Phys Condens Matter Vol4 pp 5617-5624 ISSN 0953-8984
wwwintechopencom
CathodoluminescenceEdited by Dr Naoki Yamamoto
ISBN 978-953-51-0362-2Hard cover 324 pagesPublisher InTechPublished online 28 March 2012Published in print edition March 2012
InTech EuropeUniversity Campus STeP Ri Slavka Krautzeka 83A 51000 Rijeka Croatia Phone +385 (51) 770 447 Fax +385 (51) 686 166wwwintechopencom
InTech ChinaUnit 405 Office Block Hotel Equatorial Shanghai No65 Yan An Road (West) Shanghai 200040 China
Phone +86-21-62489820 Fax +86-21-62489821
Cathodoluminescence (CL) is a non-destructive technique to characterize optical and electronic properties ofnanostructures in many kinds of materials Major subject is to investigate basic parameters in semiconductorsimpurities in oxides and phase determination of minerals CL gives information on carrier concentrationdiffusion length and life time of minority carriers in semiconductors and impurity concentration and phasecomposition in composite materials This book involves 13 chapters to present the basics in the CL techniqueand applications to particles thin films and nanostructures in semiconductors oxides and minerals Thechapters covered in this book include recent development of CL technique and applications to wide range ofmaterials used in modern material science
How to referenceIn order to correctly reference this scholarly work feel free to copy and paste the following
Vladimir Solomonov and Alfiya Spirina (2012) What is the Pulsed CathodoluminescenceCathodoluminescence Dr Naoki Yamamoto (Ed) ISBN 978-953-51-0362-2 InTech Available fromhttpwwwintechopencombookscathodoluminescencewhat-is-the-pulsed-cathodoluminescence-
copy 2012 The Author(s) Licensee IntechOpen This is an open access articledistributed under the terms of the Creative Commons Attribution 30License which permits unrestricted use distribution and reproduction inany medium provided the original work is properly cited

Cathodoluminescence
32
Fig 1 The equivalent circuit of electron current
Here electron accelerator is represented as a source of accelerating potential U0 with internal
resistance R0=U0i0=const The sample with irradiated surface 20S r forms a capacitor
with C=2r00 Here 0 is the dielectric constant and is the permittivity of environment (eg air) Resistor Rt is introduced as a shunt for capacitor C and it provides the discharge of the sample surface For this circuit at Rt=const and initial condition ie(0)=io the electron current is described by the equation
00
0
( ) 1 exp expe et c c
U t ti t i
R R (3)
where c=CR0Rt(R0+Rt) is a typical charge time of capacity C
For example in the cathodoluminescent microscope [Ramseyer et al 1989 Petrov 1996] the shunting of capacity C is provided by the emission of secondary electrons over the irradiated sample surface This emission results in setting the finite value of shunting resistance Rt Dynamic balance between the primary electrons which are injected into the
sample and the secondary electrons which leave the sample is equilibrated at tgtgtc After that time the current of injected electrons ie tends to achieve the value defined as ie=U0(R0+Rt) and the constant generation rate of electron-hole pairs G is equilibrated These conditions are realized for the narrow energy range of the primary electrons 1ltEelt12 keV
resulted in a small depth of electron penetration de=01-15 m Thus the lower energy of the primary electrons is limited by the work function of the secondary electrons through the sample surface The upper one is limited by the energy loss of secondary electrons which appeared on the large depth inside the sample under diffusion to the sample surface
The solution of Eq (1) using G=const reveals that under irradiation by electron beam the concentration of electron-hole pairs inside the sample volume which is determined by the beam cross-section and penetration depth of electrons is saturated rapidly with time according to the following equation
( )2
exp( ) 1 12 2
exp( ) 1 4
ti ie h i i
i i
tn G G
t A BG A
(4)
Here i is an ionization time of substance =1+Ai =1-Ai where Ailt1 From the Eq (4) it can be seen that the concentration of electron-hole pairs increases with increasing the
wwwintechopencom
What is the Pulsed Cathodoluminescence
33
coefficient G Therefore in order to achieve a high brightness of luminescence the electron
beam is focused on the sample surface in the spot with a diameter of 1-50 m and current
density je in the range from 10-2 to 10 Acm2 The coefficient G amounts to 1023-1026 cm-3s-1
and the range of typical time i has an order of 10-6-10-9 s
Since the 1980-s the electron beams with the energy increased to 20-70 keV and density of electron current of je=01-10 Acm2 are applied These electrons are able to penetrate into the
sample on a depth of 3-30 m [Chukichev et al 1990 Yang et al 1992] The secondary electrons originated on such a depth inside the sample dissipate their own energy while moved to the outer surface and canrsquot emit outside In this case the dynamic balance is provided by the flow of the surplus charge via thin metal film previously deposited on the sample surface being irradiated and served as a ground Now the shunt Rt is determined by the contact electroconductivity of the irradiated area with the metal film At these
parameters of electron beam the coefficient G the ionization time i and the charging time of
capacity c have values of the same order those were mentioned above However at increased energy of electrons the luminescence intensity increases due to the deeper penetration of electrons and as a result the larger excited volume of substance
To decrease the thermal load on the irradiated surface at the electron energy of 20-70 keV the pulsed electron beam with the pulse duration of 1-10 ms [Chukichev et al 1990] or modulated electron beam with the modulation frequency of 100-300 Hz [Yang et al 1992] are applied The luminescence excited by such electron beams is usually called the pulsed cathodoluminescence (PCL) [Chukichev et al 1990] However this PCL is the steady-state
one since the pulse duration of injected electrons is much greater than i and c yet
PCL [Solomonov et al 2003] to be talked about in the present chapter is excited at the conditions when the dynamic balance between the injected and left electrons is absent ie at
Rtinfin The Eq (3) shows in this case that the current of injected electrons damps
exponentially with characteristic time constant as
( ) exp( )e eoi t i t 0 00
0 0
2
e
UR C
j r (5)
This time increases with energy of injected electrons Its value is about 35 ns at E0=200 keV
je0=100 Acm2 r0=1 mm and =1 according to Eq (5) Therefore the PCL excitation should be
carried out by the electron beam with duration te of the same order as The electrons with
energy of 100-200 keV penetrate into dielectric solids on the depth of 100-150 m Due to the
large penetration depth the coefficient G reaches the value of 1026-1027 cm-3s-1 which is similar to that realized at maximum excitation conditions of the steady-state cathodoluminescence
When te the concentration of electron-hole pairs comes to ne(h)05ne(h)max according to Eq
(4) Here ne(h)max is a maximal value of the concentration at teinfin It means that PCL brightness is higher than that of steady-state cathodoluminescence excited at the maximal conditions
PCL spectrum gives the information about the composition and crystal structure of the sample bulk rather than interface layer Interface layers are usually characterized with presence of many absorbed molecules and defect of crystal structure and their properties are not inherent to the bulk of materials In PCL the interface layers with a thickness up to 20
m donrsquot have a significant influence on the PCL spectrum quality [Ramseyer et al 1990]
wwwintechopencom
Cathodoluminescence
34
It should be emphasized that despite of short time of electron beam impact PCL persistence occurs and its kinetics is ascribed by complicated laws This is associated with that the primary source of luminescence excitation is the electron-hole pairs Their concentration according to Eq (1) over the time of electron beam impact (G=0) is given by
0( )
0
exp( )
1 exp( )eh
e heh
B nA Atn
B At A B n
(6)
Here neh0 is the concentration of electron-hole pairs introduced by the electron beam The luminescence intensity of the electron and hole centres changes the same law The intensity of interband luminescence falls proportionally to n2eh These kinds of luminescence reach their maxima at the time moment when the excitation is over The intensity of intracentre luminescence changes more difficulty The first maximum is also reached at the same time
moment but further behaviour depends on the life time of radiative level (r) In the paper [Solomonov et al 1996 2003] it has been shown that there is the second maximum of the
intensity in the long persistence at r( 2 -1)A After this maximum the intensity falls
according to the exponential law with the characteristic time constant r Moreover the
second maximum can be more intensive than the first one If the rlt( 2 -1)A the second
maximum doesnrsquot appear and an exponential decay of luminescence occurs but with characteristic time constant that is proportional to 1(2A) It is worthy to note that in case of using nanosecond exciting electron beams the integral intensity of persistent luminescence is usually similar or even higher than that during excitation
2 Apparatus for the PCL registration
The generation of high-current nanosecond electron beam with the energy higher than 100
keV became possible after creation of electron accelerators by GA Mesyats in the 1970-s
These accelerators are founded on the explosive electron emission [Mesyats 1974] The
electrons having this energy extend at great distance (more than 10 cm) in air The
samples excited in air can be used in the form of pieces powders and solution The
irradiation in air furthers also to the partial compensation of injected charge into sample
by the stream of positive air ions created by the electron beam The large penetration
depth of these electrons into sample simplifies the sample preparation for analysis
considerably namely there is no need to undergo the sample to grinding and polishing
procedures Moreover irradiated surface doesnrsquot require metallization This is very
important for the analysis of the finished product in particular jewels It should be also
noted that the problem of sample warming which is typical for the steady-state
cathodoluminescence is solved due to the introduction of the small energy density ( 3
Jcm3)
The investigation of PCL in the different mediums has shown that the portable nanosecond
accelerators of RADAN [Mesyats et al 1992] are most applicable for its excitation These
accelerators include the sealed vacuum electron tube The biological shielding from X-ray
emission is provided by the design of analytic chamber which is connected with the output
of the accelerator The analysed samples are placed into the chamber The pulsed type of the
luminescence allows using the different methods of its registration
wwwintechopencom
What is the Pulsed Cathodoluminescence
35
As a first the traditional method of the registration with the help of optical monochromator photoelectronic multiplier and oscillograph is applied [Vaysburd etal 1982 Solomonov et al 1996] The intensity kinetics of separated luminescence band is measured by this method This is necessary for the identification of its nature The application of the scanning
monochromator allows registering the intensity distribution by wavelengths I (t) However two PCL features have to be kept in mind The first feature is that the PCL is characterised by the certain degree of instability of the registered parameters because of the pulsed regime Therefore the spectrum measurement has to be performed in the averaging mode The second feature is caused by the different kinetics of PCL bands with the various nature and spectrum registered by such an approach strongly depends on time
As a second the time-integral intensity of the luminescent bands can be measured
2
1
( ) ( )
t
t
I I t dt (7)
Here I (t) is the current intensity t1 is the beginning of registration and t2 is the ending of registration This intensity is registered with the help of multichannel semiconductor photodetectors based on diode matrix and charge-coupled device [Solomonov et al 2003] In this case optical spectrograph is applied instead of the scanning monochromator and the wide spectral range for one frame is measured This method can be used for the PCL research when intracentre luminescence is dominant Also the kinetic information about all registered spectrum can be obtained by means of changing of the integration limits t1 and t2
Fig 2 demonstrates the scheme of experimental setup for the receiving of PCL spectra The setup consists of the luminescence excitation block (1) multichannel photodetector (2) and computer (3)
Fig 2 Scheme of experimental setup
wwwintechopencom
Cathodoluminescence
36
The excitation block (1) represents a combination of RADAN-220 pulsed electron accelerator and analytical chamber The operating principle of the accelerator is based on the explosive emission of electrons from the cold cathode of accelerating tube The RADAN-220 generates electron beam with the duration of 2 ns The voltage that can be applied to the accelerating tube ranges from 150 to 220 keV The commercially available IMA3-150E tube is placed in the analytic chamber The generated electron beam is extracted to air through the beryllium foil and directed vertically downwards The luminescence stream is transferred to the multichannel photodetector (2) by means of the silica multifiber Computer (3) is the control system of the experimental setup ldquoSpecadrdquo software makes possible to realize various modes of the photodetector It provides the calibration registration reviewing processing and archiving of obtained spectra The commercially available pulsed cathodoluminescent spectrograph ldquoCLAVIrdquo [Michailov et al 2001] was created on basis of this experimental setup
3 The application of the pulsed cathodoluminescence for the luminescent analysis of Nd
3+Y3Al5O12 and Nd
3+Y2O3
In the last year the intensive investigations in the field of the optical ceramics creation based on the metal refractory oxide doped with rare-earth ions particularly Nd3+Y3Al5O12 и Nd3+Y2O3 are carried out [Ikesue et al 1995 Lu et al 2001 Bagaev et al 2009] The advantages of the laser ceramics against single crystals include the possibility of creating multilayer elements with sizes greater than those of single crystals larger concentration of active ions and lower manufacturing cost The fitness of crystals or ceramics for active laser elements is determined usually by the photoluminescent methods in infrared region by means of lifetime measurement of upper laser Nd ion level 4F32 [Hoskins et al 1963 Lupei et al 1995] For this aim the method is effective however it doesnrsquot display couses of the lifetime decrease of the laser level This is necessary to know to correct the conditions the conditions of crystal and ceramics synthesis of synthesis of crystalls and ceramics Below the investigation of the PCL spectra is given The possibility of realization of qualitative and quantitative luminescent analyses of Nd3+Y3Al5O12 Nd3+Y2O3 laser materials is developed
31 The luminescence of Nd3+
Y3Al5O12
The emission lines of neodymium ions in Nd3+Y3Al5O12 in visible range correspond to the
transitions from 4f25d1 2F252 level which has three Stark components 0=37775 cm-1
1=37864 cm-1 2=38153 cm-1 to the levels of 4f3 configuration of neodymium ion
[Kolomiycev et al 1984] The wavelengths of observed luminescent lines and their
identification for Nd3+Y3Al5O12 single crystal are presented in Table 1 in the first and the
second columns respectively The numbers of Stark sublevels in according to nomenclature
[Koningstein et al 1964] at increasing their energy starting with zero are pointed next to
symbol of electron level in brackets then emission band wavelengths presented in
[Kolomiycev et al 1982] are shown in brackets
A conspicuous difference appears in PCL spectra of neodymium ions in yttrium aluminates
in case of different crystal structure The spectrum of orthorhombic Nd3+YAlO3 single
crystal together with the spectrum of cubic Nd3+Y3Al5O12 are presented in Fig 3 as an
illustration of this difference
wwwintechopencom
What is the Pulsed Cathodoluminescence
37
Nd3+Y3Al5O12 Nd3+YAlO3
nm
Identification of optical trasfer
nm Identification of optical trasfer
3899 2F252 (2)2H92 (0) (3900) 3946 2F252 (0)4F52 (2) (3946)3992 2F252 (0)2H92 (2) (3975) 3981 2F252 (0)2H92 (3) (3983) 4016 2F252 (0)2H92 (4) (4014)
4225 2D52 (2)4I92 (1) (4230) 4269 2F252 (2)4F92 (3) (4273) 4299 2F252 (1)4F92 (0) (4302) 4299 2F252 (1)4F92 (0) (4299) 4356 2F252 (0)4F92 (2) (4351) 4352 2F252 (1)4F92 (1) (4348) 4390 2D52 (0)4I92 (4) (4388) 4407 2P12 (0) 4I92 (3) (4412) 4504 2F252 (2)2H112 (3) (4505) 4504 2F252 (2)2H112 (3) (4504) 4554 2F252 (0)2H112 (1) (4559) 4560 2F252 (1)2H112 (3) (4560)4588 2F252 (0)2H112 (3) (4583)
4610 2F252 (0)2H112 (4) (4614)
4793 2F252 (1)4G52 (1) (4790) 4807 2F252 (1)4G52 (2) (4805) 4875 2F252 (0)2G72 (0) (4871) 4878 2F252 (0)2G72 (2) (4881)4944 4G112 (2)4I92 (4) (4942)
5252 2F252 (0)4G72 (0) (5249) 5254 2F252 (1)4G72 (1) (5254) 5278 2F252 (1)4G72 (2) (5278) 5380 2F252 (1)4G92 (2) (5383) 5406 2F252 (0)2K132+2G92 (2) (5410) 5395 2F252 (0)4G92 (0) (5393) 5416 2F252 (2)2K132 (2) (5420) 5457 2F252 (2)2K132 (4) (5457) 5475 2F252 (2)2K132 (5) (5475) 5491 2F252 (0)2K132+2G92 (7) (5494) 5492 2F252 (0)2K132 (0) (5490) 5545 2F252 (0)2K132 (3) (5542) 5563 2F252 (0)2K132 (4) (5562) 5574 2F252 (0)2K132+2G92 (10)(5570)
5629 2K152 (3)4I132 (0) (5626) 5636 2K132 (4)4I112(1) (5635)
5764 Superposition2G72 (23)4I92 (02) (5763)
5854 2F252 (2)4G92 (4) (5852) 5874 2F252 (0)4G92 (0) (5868)
5962 Superposition2F252 (0)4G112 (01) (5962)
6006 2F252 (0)4G112 (3) (6001)
6021 2F252(2)4G112+2K152+2D32(6)(6018) 6104 2F252(0)4G112+2K152+2D32(4)(6102) 6121 2F252(1)4G112+2K152+2D32(6)(6118) 6154 2F252(2)4G112+2K152+2D32(13)(6147) 6201 2F252 (0)2K152 (2) (6208) 6201 2F252(0)4G112+2K152+2D32(9)(6198) 6221 2F252(1)4G112+2K152+2D32(11)(6214) 6254 2F252(1)4G112+2K152+2D32(13)(6252) 6383 2H112 (1)4I92 (2) (6377) 6395 2H112 (0)4I92 (2) (6391) 6462 2H112 (3)4I92 (3) (6454) 6524 2H112 (3)4I92 (4) (6526) 6609 2G72 (3)4I112 (4) (6608) 6653 2G72 (0)4I112 (3) (6653) 6686 2G72 (0)4I112 (4) (6679)
Table 1 PCL lines and their identification for Nd3+Y3Al5O12 and Nd3+YAlO3 single crystals
wwwintechopencom
Cathodoluminescence
38
Fig 3 The PCL spectra of Nd3+Y3Al5O12 (1) and Nd3+YAlO3 (2) single crystals
The wavelengths of fundamental neodymium luminescent lines and their identification for Nd3+YAlO3 single crystal are presented in Table 1 in the third and the fourth columns respectively [Osipov et al 2011]
The Fig 3 and Table 1 show that the principal change is manifested in the considerable
increase of the luminescent band numbers in the yttrium monoaluminate spectrum This takes
place due to activation of d-f transitions between the different Stark sublevels and the
appearance of f-f transitions These changes arise from the distortion of crystalline field
symmetry in positions of individual neodymium ions that leads to the modifications of the
oscillator strength and optical transition probability Thus the distortion of crystalline field
symmetry appears in the spectrum as the change in intensity and numbers of emission bands
The differences in the spectra can be used for the determination of the second phase content in Nd3+Y3Al5O12 [Osipov et al 2011] The luminescence lightsum in the spectrum region
from 1 to 2 (2
1
( )S I d
) can be presented by the additive function depended from the
dominant phase content Cg (cubic Nd3+Y3Al5O12) and the second phase Cim=1-Cg
(1 )g gS C C (8)
where and are the coefficients of proportionality They are determined by the integration range and excitation conditions To eliminate the influence of the intensity instability it is necessary to use the ratio of lightsums (S1S2) as the analytical parameter calculated for two ranges of the spectrum The lightsums in the ranges 350-500 nm (S1) and 501-650 nm (S2) to obtain the functional relation between the Cg and the luminescence intensity of neodymium ions have been chosen In that case in accordance with Eq (8) the content of cubic phase into Nd3+Y3Al5O12 is defined the following equation
wwwintechopencom
What is the Pulsed Cathodoluminescence
39
1
1 22
12 2 1 2
2( ) ( )
g
SS
CS
S
(9)
In Fig 4 the correlation between the Cg and S1S2 calculated for the samples with known content of cubic phase is shown
Fig 4 The correlation between the Cg and S1S2
This dependence (Fig 4) is approximated by the following equation with the r2gt099
1
2
1
2
1071 0084
0069g
SS
CS
S
(10)
Moreover the obtained data validity was checked out by the analysis of samples with electron and optical microscopes
32 The luminescence of Y2O3 Nd3+
Y2O3
The wide band of intrinsic radiation in visible range is a visiting luminescent card of pure yttria Earlier the other authors observed this band at different excitation type [Conor 1964 Kuznetsov et al 1978 Bordun et al 1995] Even at cryogenic temperature of the samples the unresolved band was registered
We investigated commercially available yttria powders with a particle sizes of 1-3 m and 5-
10 m All the powders have a cubic lattice of the -Y2O3 From these commercial powders nanopowders with the average particle size of 10-12 nm were prepared by the laser
evaporation method Particles were crystallized in the metastable monoclinic phase -Y2O3
After annealing they transformed to the -Y2O3
wwwintechopencom
Cathodoluminescence
40
The spectrum of the powder with particle size of 1-3 m has a broad asymetric band peaked at 437 nm and long ndash wavelength wing shows local maxima (Fig 5 curve 1)
Fig 5 PCL spectra of commercial yttria powders with particle size 1-3 m (1) 5-10 m (2) and nanopowders with the average particle size of 10-12 nm (3)
In the spectrum of the powder with the particle size of 5-10 m almost all local maxima are transformed into narrow bands (Fig 5 curve 2) They are grouped into four series 435 ndash 510 nm (the blue series) 515 ndash 640 nm (the orange series) 645 ndash 700 nm (the red series) and 785 ndash 840 nm (the infrared series) The PCL spectra of nanopowders irrespective of the crystal
phase (either the -Y2O3 or the -Y2O3 phase) and of the initial coarse powder have a similar structures (Fig 3 curve 3) The broad band with the maximum at 485 nm dominates in these spectra The peak range of this band exhibits local maxima of the blue series Also the lines of orange series at 573 583 612 nm become apparent The red series is weak while the infrared series is hardly seen
The range of the band series observed in the spectra of pulsed cathodoluminescence corresponds to the range of intrinsic radiation of yttria which is identified as the radiation of associated donor-acceptor pairs Y3+ - O2- [Bordun 2002]
Since the luminescence wavelengths of narrow bands of commercial powders nanopowders coincide we can assume that these materials contain intrinsic luminescence centers of the same type
The series of PCL bands of yttria resemble the radiation of free YO radicals which is observed for example in laser plume of yttria-containing target [Osipov et al 2005] This radical has been fairly well studied [Pearse et al 1949] The Table 2 shows the wavelengths of the bands observed in PCL spectra and their identification In the second column of this table the wavelengths of the strongest bands are in boldface
wwwintechopencom
What is the Pulsed Cathodoluminescence
41
Intrinsic luminescence center
VrsquoVrsquorsquo nm
Blue band series the electronic transition B2X2
00 4538
22 4586
33 4611
01 4706
23 4752
02 4887
Orange band series the electronic transition A2X2
20+(Tg+Ag)=380 5428
10 5516
10+(Tg+Ag)=380 5635
00 5729
33 5836
01 6000
34 6122
02 6293
Red band series the electronic transition A2X2
03-(Tg+Ag)=162 6553
03 6624
03+(Tg+Ag)=162 6696
03+Tg=469 6838
Infrared band series the electronic transition A2X2
05+(Tg+Ag)=380 7608
06 7850
8011
8184
Table 2 Parameters of the PCL lines in the yttria spectrum
Based on these data we constructed the energy scheme of the intrinsic luminescence center (Fig 6) Qualitatively this scheme coincides with that of the YO free radicals In this scheme the configuration curves were calculated in the harmonic oscilator approximation as
216 20
0
210 ( )i
i i i
c mE E r
h
(11)
where i =X A and B denotes the electronic states X2 A2 and B2 E0i I and i are the minimal energy the equilibrium distance and the wavenumber of the vibration mode of ith electronic state respectively m0 is the mass of the oxygen atom c and h are the light speed
and Planckrsquos constant The energy E and wavenumbers i are expressed in (11) in reciprocal
centimetres the amplitudes of the (r-i) vibrations are given in nanometres
wwwintechopencom
Cathodoluminescence
42
Fig 6 Energy scheme of the intrinsic luminescence center
For the configuration curves of the X2 A2 and B2 states (Fig 6) E0i=0 17510 and 22090
cm-1 and i=786 675 and 675 cm-1 respectively With these parameters up to the measurement error the wavelengths of pulsed cathodoluminescence coincide with the wavelengths of the optical transitions shown in Table 2 The Franck ndash Condon principle for
molecular transitions is most precisely implemented at A=X+10870910-3 nm and
B=X+1235110-3 nm and X can be estimated as half of elementary cube edge X=01385 nm For electronic ndash vibration transitions for which one of the vibration quantum numbers V is large this principle is implemented only if these transitions involve the most strong phonons [Schaak et al 1970] Table 2 Under these parameters the configuration curves of
the electronic states A2 and B2 intersect at the point with E=25256 cm-1
The qualitative coincidence of the emission bands and the energy structure of intrinsic luminescence centres observed by us and YO free radicals allow us to conclude that intrinsic luminescence centres in yttria contain bound YO radicals [Osipov et al 2008] Consider the possibility of formation of such intrinsic luminescence centre It is known [Schaak et al 1970] that the cubic yttria has unit cell composed of 16 formula units Y2O3 Twenty four cations occupy positions with C2 symmetry and eight cations occupy the positions with C3i symmetry (Fig 7) Every cation is surrounded by six oxygen ions which are positioned on the corners of deformed cube with the edge size of 02702 nm at that two corners is unoccupied Thus in one-third of the cubes (YO6) two oxygen vacancies are located at the cube corners along the face diagonal while in the remaining cubes they are located along the body diagonal (Fig 7)
For such packing a structure presented in Fig 8 can be formed at the outer cube face that contains two oxygen vacancies and that is located at the crystal boundary In essence this structure is the YO radical bound to the crystal lattice by the yttriun ion On such surfaces
the fraction of faces with two oxygen vacancies is 1316=118 and the average distance
wwwintechopencom
What is the Pulsed Cathodoluminescence
43
between them is about 5 nm All of this leads to the dependence of the luminescence spectrum of such bound radicals on the particle size of yttria mainly via their shape
Fig 7 The unit cell of yttria The yttrium positions with C3i and C2 symmetry designated by red and pink balls respectively The oxygen and the vacant positions designated by blue and grey balls The vacant positions are associated by green dot line
Fig 8 The structure of intrinsic luminescence centre
The considered above intrinsic luminescence centre also presents in Nd3+Y2O3 However the presence of neodymium results in decrease of the intrinsic band intensity and distortion of its profile We studied the monoclinic and cubic Nd3+Y2O3 nanopowders The nanopowders
were prepared using a mixture of micropowder -Y2O3 phase and 1 mol Nd2O3 powder After evaporation of this mixture by CO2 laser Nd3+Y2O3 nanoparticles were crystallized into monoclinic phase To transfer nanopowders into cubic phase annealing in air was
carried out above 900C [Kotov et al 2002]
wwwintechopencom
Cathodoluminescence
44
The PCL spectra of all Nd3+Y2O3 samples contain emission lines of neodymium ions which have not been previously observed in photoluminescence Namely neodymium doped nanopowders exhibit a strong band peaking at 825 nm (Fig 9)
Fig 9 The PCL spectra of monoclinic (1) and cubic (2) Nd3+Y2O3 nanopowders
Its components correspond well to the 4F524I92 (825 811 834 nm) and 2H924I92 (818 nm) optical transitions between Nd3+ Starkrsquos sublevels with the energies in Y2O3 cubic lattice [Chang 1966] These components are resolved only in cubic samples (Fig 9) Therefore the splitting of Starkrsquos components allows us to conclude about the presence of the dominant phase into Nd3+Y2O3
To check this assumption the additional investigations were made In Fig 10 the PCL spectra of pressed nanopowders (compacts) are presented The compacts were annealed at
530 750 950 1100 and 1300C The X-ray analysis for this samples showed that the
unannealed compact and annealed compact at 530C have monoclinic phase all remaining compacts are cubic samples It is shown that the splitting of neodymium band at region of 800-840 nm only takes place in cubic samples and one component appears at 825 nm in monoclinic samples
In addition to the band in the region of 800-840 nm two emission bands of neodymium ions
arise in the Nd3+Y2O3 These are a weak band at 720 nm due to 4F924I92 transition and stronger band at 750 nm with the components due to the transitions between the Stark
sublevels 4F724I92 and 4S32 4I92
The intensity weaking of intrinsic band into Nd3+Y2O3 is associated with the quantitative decrease of this centres since the part of yttrium ions are replaced by the neodymium ions The distortion of the intrinsic band is determined by the neodymium absorption of it The most absorption is observed in region at 560-613 nm [Osipov et al 2009]
wwwintechopencom
What is the Pulsed Cathodoluminescence
45
In addition to the present bands into Nd3+Y2O3 the appearance of four well-resolved components in the range of 610-660 nm can be seen The specta of this band for compacts
annealed at 950 and 1300C are presented in Fig 11 The band contains the following four narrow lines at 6206 6306 6453 6556 nm which we identify using Raman spectra as
luminescence of oxygen molecular ion 2O [Solomonov et al 2011]
Fig 10 The PCL spectra of unannealed compact (1) and compacts annealed at 530C (2)
750C (3) 950C (4) 1100C (5) 1300C (6)
wwwintechopencom
Cathodoluminescence
46
The bands with the frequencies of 1615 and 1702 cm-1 correspond to vibrations of the molecular ion in the ground state while the frequencies at 966 and 993 cm-1 correspond to the excited state for the two sites of the oxygen molecular ion in the yttria lattice
Fig 12 demonstrates two sites of defects 2O taking into account the occurrence of two types
of natural vacancies about we talked earlier
Fig 11 The PCL of oxygen molecular ions
Fig 12 Two sites of oxygen molecular ions defects in lattice of cubic Y2O3
Fig 13 presents two potentional curves and formation of luminescence bands The lowest
excited state A2u of the oxygen molecular ion can be stabilized
The observed luminescence band results of the transition from the vibration level Vrsquo=0 of
the excited electronic state A2u to one vibration level Vrsquorsquo=3 of the ground state X2g The
wwwintechopencom
What is the Pulsed Cathodoluminescence
47
bands at 6306 and 6556 nm are formed due to the transition to the vibration level of the groun state with the participation of lattice phonons For the first curve the phonon energy is 255 cm while for the second curve it is 244 cm-1 These phonons are observed in the Raman spectrum The excited electronic state of the molecular ion is spaced from the ground state by 20660-21580 cm-1 [Solomonov et al 2011]
Fig 13 Configuration curves for two sites of oxygen molecular ions
On the basis of the qualitative luminescent analysis of Nd3+Y2O3 the determination of neodymium concentration by means of the calibration curve construction is possible
because of intensity of neodymium lines is proportional to it concentration INd(i)=aiCNd (for example 750 or 825 nm) However we canrsquot use this equation because PCL spectrum is characterized by the instability Therefore we also chose lightsums ratio as analytic parameter in regions of 730-840 nm and 350-840 nm The first region of Nd3+Y2O3 spectrum involves only neodymium bands but the second one includes in addition the intrinsic band which is distorted by the neodymium absorption and can be ascribed as follows
wwwintechopencom
Cathodoluminescence
48
0
1 exp( )( ) i Nd
YO i ii Nd
k C lI I
k C (12)
Here I0i l ki are the intensity of i ndash intrinsic band without absorption the thickness of samples coefficient of absorption of i ndash band respectively Hence relation of lightsums ratio (S(350-840)S(730-840)) with CNd has to include the equation (12) Really this relation is decribed by the following equation
2
1 exp( )(350 840)
(730 840)Nd
Nd
B CSA D
S C
(13)
Fig 14 demonstrates the calibration curve (r2gt099) for the determination of neodymium concentration in region of 011 ndash 107 at
Fig 14 The calibration curve for the determination of neodymium concentration in region of 011 ndash 107 at
4 Conclusion
Thus the possibility of realization of rapid nondestructive qualitative and quantitative luminescent analyses of laser materials in particular Nd3+Y3Al5O12 Nd3+Y2O3 with the help of pulsed cathodoluminescence was shown
5 References
Bagaev S Osipov V Ivanov M Solomonov V Platonov V Orlov A Rasuleva A amp Vatnik S (2009)Fabrication and characteristics of neodymium ndash activated yttrium oxide optical ceramics Optical Materials Vol31 pp 740-743 ISSN 0925-3467
wwwintechopencom
What is the Pulsed Cathodoluminescence
49
Bogdankevich O Darznik S amp Eliseev P (1975) Semiconductor lasers Nauka Moscow Russia
Bordun O Bordun I amp Novosad S (1995) Luminescence centres into Y2O3 Journal of applied spectroscopy Vol62 No6 pp 91-95 ISSN 0021-9037
Bordun O (2002) Influence of oxygen vacancies on the luminescence spectra of thin Y2O3 films Journal of applied spectroscopy Vol69 No3 pp 371-374 ISSN 0021-9037
Chang N (1966) Energy levels and crystal ndash field splittings of Nd3+ in yttrium oxide J Chem Phys Vol44 pp 4044-4050 ISSN 0021-9606
Chukichev M Sabri D Sokolov V amp Surcova T (1990) Cathodoluminescence of solid solution Zn1-xMnxSe Optics and Spectroscopy Vol68 pp 2000-2021 ISSN 0030-4034
Connor O (1964) A theory of thermoluminescence of fluorite (CaF2Y) Radiative recombination from highly associated electron ndash hole pairs Appl Phys Lett Vol4 No1 pp 126-129 ISSN 0003-6951
Galkin G (1981) The interband processes of the recombination into semiconductors at high excitation level Proceedings of the PN Lebedev Physical Institute (Trudi FIAN) Vol128 pp 3-64
Hoskins H amp Soffer B (1963) Stimulated emission from Y2O3Nd3+ Appl Phys Lett Vol4 pp 22-23 ISSN 0003-6951
Ikesue A Kinoshita T Kamata K amp Yoshida K (1995) Fabrication and optical properties of high-performance polycrystalline NdYAG ceramics for solid-state lasers J Amer Ceram Soc Vol78 pp 1033-1040 ISSN 1551-2916
Kolomiycev A Meylman M Volodina I Chukichev M Smagin A amp Bagdasarov H (1982) Luminescence of neodymium ndash activated yttrium ndash aluminum garnet crystals in ultra-violet and visible ranges at high energy excitation Deposition in VINITI No 5995-82 pp 1-15
Kolomiycev A Meylman M Volodina I Chukichev M Smagin A amp Bagdasarov H (1984) Luminescence of neodymium ndash activated yttrium ndash aluminum garnet crystals in ultra-violet and visible ranges at high energy excitation Optics and Spectroscopy Vol56 pp 365-367 ISSN 0030-4034
Koningstein J amp Geusic J (1964)Energy levels and crystal ndash field calculations of neodymium in yttrium aluminum garnet Phys Rev Vol136 No 3A pp 711-716 ISSN 1893-1912
Kotov Yu Osipov V Ivanov M Samatov O Platonov V Azarkevich E Murzakayev A amp Medvedev A (2002) Properties of oxide nanopowders prepared by target evaporation with a pulse ndash periodic CO2 laser Technical Physics Vol47 No11 pp 1420-1426 ISSN 1063-7842
Kuznetsov A Abramov V Rooze N amp Savikhina T (1978) Autolocalized excitons into Y2O3 JETP Letters Vol28 No10 pp 602-605 ISSN 0021-3640
Lu J Murai T Takaichi K Ueda K Yagi H Yanagitani T amp Kaminskii A (2001) Nd3+Y2O3 ceramic laser Jpn J Appl Phys Vol40 pp 1277-1279 ISSN 0021-4922
Lupei V Lupei A Tiseanu C Georgescu S Stoicescu C amp Nanau P (1995) High ndash resolution optical spectroscopy of YAG Nd A test for structural and distribution models Phys Rev B Vol51 No1 pp 8-17 ISSN 0003-6951
Mesyats G (1974) Generating of highpower nanosecond pulses The Soviet radio Moscow Russia
wwwintechopencom
Cathodoluminescence
50
Mesyats G Shpak V Yalandin M amp Shunailov S (1992) Compact RADAN electron accelerators for testing new radiation technologies and sterilization Radiat Phys Chem Vol46 pp 489-492 ISSN 0969-806X
Michailov S Osipov V amp Solomonov V (2001) Pulsed cathodoluminescent analyzer of materials Pribory i tekhnika eksperimenta No3 pp 164-165 ISSN 0032-8162
Osipov V Solomonov V Platonov V Snigireva O Ivanov V amp Lisenkov V (2005) Laser plume spectroscopy 2 Graphite yttrium ndash stabilized and zirconium oxide targets Quantum Electron Vol35 No7 pp 633-637 ISSN 0368-7147
Osipov V Rasuleva A amp Solomonov V (2008) Luminescence of pure yttria Optics and Spectroscopy Vol105 No4 pp 524-530 ISSN 0030-400X
Osipov V Solomonov V Spirina A Ivanov M amp Orlov A (2009) Luminescence of yttrium oxide doped with neodymium Optics and Spectroscopy Vol106 No1 pp 78-83 ISSN 0030-400X
Osipov V Solomonov V amp Spirina A (2011) Luminescent investigation of neodymium doped yttrium aluminates J of Optical Technology Vol78 No6 pp 81-87 ISSN 0030-4042
Pearse R amp Gaydon A (1949) The identification of molecular spectra Inostrannaya Literatura Moscow Russia
Petrov V (1996) Cathodoluminescent microscopy Physics - Uspekhi Vol39 pp 807-818 ISSN 0042-1294
Ramseyer K Fisher J Matter A Eberhardt P amp Geiss J (1989) A cathodoluminescence microscope for low intensity luminescence Journal of Sedimentary Research Vol59 pp 619-622 ISSN 0022-4472
Ramseyer K amp Millis J (1990) Factors influencing short-lived blue cathodoluminescence in
- quartz Journal of Sedimentary Research Vol59 pp 619-622 ISSN 0003-004X Schaak G amp Koningstein J (1970) Phonon and electronic raman spectra of cubic rare-earth
oxides and isomorphous ittrium oxide J Opt Soc Amer Vol60 No8 pp 1110-1115 ISSN 1551-2916
Solomonov V amp Michailov S (2003) Pulsed cathodoluminescence and its application for the analysis of condensed substances UB RAS ISBN 5-7691-1357-X Yekaterinburg Russia
Solomonv V (2003) Kinetics of pulsed cathodoluminescence Optics and Spectroscopy Vol95 pp 248-254 ISSN 0030-4034
Solomonv V Michailov S amp Deykun A (1996) About the mecanism of excitation and the structure of the pulsed cathodoluminescence bands of Cr3+ Mn2+ impurity ions into minerals Optics and Spectroscopy Vol80 pp 447-458 ISSN 0030-4034
Vaysburd D Semin B Tavanov E Matlis S Balichev I amp Gering G (1982) Highenergy electronics of solid Nauka Novosibirsk Russia
Yang B Luff B amp Townsend F (1992) Chatodoluminescence of natural zircons J Phys Condens Matter Vol4 pp 5617-5624 ISSN 0953-8984
wwwintechopencom
CathodoluminescenceEdited by Dr Naoki Yamamoto
ISBN 978-953-51-0362-2Hard cover 324 pagesPublisher InTechPublished online 28 March 2012Published in print edition March 2012
InTech EuropeUniversity Campus STeP Ri Slavka Krautzeka 83A 51000 Rijeka Croatia Phone +385 (51) 770 447 Fax +385 (51) 686 166wwwintechopencom
InTech ChinaUnit 405 Office Block Hotel Equatorial Shanghai No65 Yan An Road (West) Shanghai 200040 China
Phone +86-21-62489820 Fax +86-21-62489821
Cathodoluminescence (CL) is a non-destructive technique to characterize optical and electronic properties ofnanostructures in many kinds of materials Major subject is to investigate basic parameters in semiconductorsimpurities in oxides and phase determination of minerals CL gives information on carrier concentrationdiffusion length and life time of minority carriers in semiconductors and impurity concentration and phasecomposition in composite materials This book involves 13 chapters to present the basics in the CL techniqueand applications to particles thin films and nanostructures in semiconductors oxides and minerals Thechapters covered in this book include recent development of CL technique and applications to wide range ofmaterials used in modern material science
How to referenceIn order to correctly reference this scholarly work feel free to copy and paste the following
Vladimir Solomonov and Alfiya Spirina (2012) What is the Pulsed CathodoluminescenceCathodoluminescence Dr Naoki Yamamoto (Ed) ISBN 978-953-51-0362-2 InTech Available fromhttpwwwintechopencombookscathodoluminescencewhat-is-the-pulsed-cathodoluminescence-
copy 2012 The Author(s) Licensee IntechOpen This is an open access articledistributed under the terms of the Creative Commons Attribution 30License which permits unrestricted use distribution and reproduction inany medium provided the original work is properly cited

What is the Pulsed Cathodoluminescence
33
coefficient G Therefore in order to achieve a high brightness of luminescence the electron
beam is focused on the sample surface in the spot with a diameter of 1-50 m and current
density je in the range from 10-2 to 10 Acm2 The coefficient G amounts to 1023-1026 cm-3s-1
and the range of typical time i has an order of 10-6-10-9 s
Since the 1980-s the electron beams with the energy increased to 20-70 keV and density of electron current of je=01-10 Acm2 are applied These electrons are able to penetrate into the
sample on a depth of 3-30 m [Chukichev et al 1990 Yang et al 1992] The secondary electrons originated on such a depth inside the sample dissipate their own energy while moved to the outer surface and canrsquot emit outside In this case the dynamic balance is provided by the flow of the surplus charge via thin metal film previously deposited on the sample surface being irradiated and served as a ground Now the shunt Rt is determined by the contact electroconductivity of the irradiated area with the metal film At these
parameters of electron beam the coefficient G the ionization time i and the charging time of
capacity c have values of the same order those were mentioned above However at increased energy of electrons the luminescence intensity increases due to the deeper penetration of electrons and as a result the larger excited volume of substance
To decrease the thermal load on the irradiated surface at the electron energy of 20-70 keV the pulsed electron beam with the pulse duration of 1-10 ms [Chukichev et al 1990] or modulated electron beam with the modulation frequency of 100-300 Hz [Yang et al 1992] are applied The luminescence excited by such electron beams is usually called the pulsed cathodoluminescence (PCL) [Chukichev et al 1990] However this PCL is the steady-state
one since the pulse duration of injected electrons is much greater than i and c yet
PCL [Solomonov et al 2003] to be talked about in the present chapter is excited at the conditions when the dynamic balance between the injected and left electrons is absent ie at
Rtinfin The Eq (3) shows in this case that the current of injected electrons damps
exponentially with characteristic time constant as
( ) exp( )e eoi t i t 0 00
0 0
2
e
UR C
j r (5)
This time increases with energy of injected electrons Its value is about 35 ns at E0=200 keV
je0=100 Acm2 r0=1 mm and =1 according to Eq (5) Therefore the PCL excitation should be
carried out by the electron beam with duration te of the same order as The electrons with
energy of 100-200 keV penetrate into dielectric solids on the depth of 100-150 m Due to the
large penetration depth the coefficient G reaches the value of 1026-1027 cm-3s-1 which is similar to that realized at maximum excitation conditions of the steady-state cathodoluminescence
When te the concentration of electron-hole pairs comes to ne(h)05ne(h)max according to Eq
(4) Here ne(h)max is a maximal value of the concentration at teinfin It means that PCL brightness is higher than that of steady-state cathodoluminescence excited at the maximal conditions
PCL spectrum gives the information about the composition and crystal structure of the sample bulk rather than interface layer Interface layers are usually characterized with presence of many absorbed molecules and defect of crystal structure and their properties are not inherent to the bulk of materials In PCL the interface layers with a thickness up to 20
m donrsquot have a significant influence on the PCL spectrum quality [Ramseyer et al 1990]
wwwintechopencom
Cathodoluminescence
34
It should be emphasized that despite of short time of electron beam impact PCL persistence occurs and its kinetics is ascribed by complicated laws This is associated with that the primary source of luminescence excitation is the electron-hole pairs Their concentration according to Eq (1) over the time of electron beam impact (G=0) is given by
0( )
0
exp( )
1 exp( )eh
e heh
B nA Atn
B At A B n
(6)
Here neh0 is the concentration of electron-hole pairs introduced by the electron beam The luminescence intensity of the electron and hole centres changes the same law The intensity of interband luminescence falls proportionally to n2eh These kinds of luminescence reach their maxima at the time moment when the excitation is over The intensity of intracentre luminescence changes more difficulty The first maximum is also reached at the same time
moment but further behaviour depends on the life time of radiative level (r) In the paper [Solomonov et al 1996 2003] it has been shown that there is the second maximum of the
intensity in the long persistence at r( 2 -1)A After this maximum the intensity falls
according to the exponential law with the characteristic time constant r Moreover the
second maximum can be more intensive than the first one If the rlt( 2 -1)A the second
maximum doesnrsquot appear and an exponential decay of luminescence occurs but with characteristic time constant that is proportional to 1(2A) It is worthy to note that in case of using nanosecond exciting electron beams the integral intensity of persistent luminescence is usually similar or even higher than that during excitation
2 Apparatus for the PCL registration
The generation of high-current nanosecond electron beam with the energy higher than 100
keV became possible after creation of electron accelerators by GA Mesyats in the 1970-s
These accelerators are founded on the explosive electron emission [Mesyats 1974] The
electrons having this energy extend at great distance (more than 10 cm) in air The
samples excited in air can be used in the form of pieces powders and solution The
irradiation in air furthers also to the partial compensation of injected charge into sample
by the stream of positive air ions created by the electron beam The large penetration
depth of these electrons into sample simplifies the sample preparation for analysis
considerably namely there is no need to undergo the sample to grinding and polishing
procedures Moreover irradiated surface doesnrsquot require metallization This is very
important for the analysis of the finished product in particular jewels It should be also
noted that the problem of sample warming which is typical for the steady-state
cathodoluminescence is solved due to the introduction of the small energy density ( 3
Jcm3)
The investigation of PCL in the different mediums has shown that the portable nanosecond
accelerators of RADAN [Mesyats et al 1992] are most applicable for its excitation These
accelerators include the sealed vacuum electron tube The biological shielding from X-ray
emission is provided by the design of analytic chamber which is connected with the output
of the accelerator The analysed samples are placed into the chamber The pulsed type of the
luminescence allows using the different methods of its registration
wwwintechopencom
What is the Pulsed Cathodoluminescence
35
As a first the traditional method of the registration with the help of optical monochromator photoelectronic multiplier and oscillograph is applied [Vaysburd etal 1982 Solomonov et al 1996] The intensity kinetics of separated luminescence band is measured by this method This is necessary for the identification of its nature The application of the scanning
monochromator allows registering the intensity distribution by wavelengths I (t) However two PCL features have to be kept in mind The first feature is that the PCL is characterised by the certain degree of instability of the registered parameters because of the pulsed regime Therefore the spectrum measurement has to be performed in the averaging mode The second feature is caused by the different kinetics of PCL bands with the various nature and spectrum registered by such an approach strongly depends on time
As a second the time-integral intensity of the luminescent bands can be measured
2
1
( ) ( )
t
t
I I t dt (7)
Here I (t) is the current intensity t1 is the beginning of registration and t2 is the ending of registration This intensity is registered with the help of multichannel semiconductor photodetectors based on diode matrix and charge-coupled device [Solomonov et al 2003] In this case optical spectrograph is applied instead of the scanning monochromator and the wide spectral range for one frame is measured This method can be used for the PCL research when intracentre luminescence is dominant Also the kinetic information about all registered spectrum can be obtained by means of changing of the integration limits t1 and t2
Fig 2 demonstrates the scheme of experimental setup for the receiving of PCL spectra The setup consists of the luminescence excitation block (1) multichannel photodetector (2) and computer (3)
Fig 2 Scheme of experimental setup
wwwintechopencom
Cathodoluminescence
36
The excitation block (1) represents a combination of RADAN-220 pulsed electron accelerator and analytical chamber The operating principle of the accelerator is based on the explosive emission of electrons from the cold cathode of accelerating tube The RADAN-220 generates electron beam with the duration of 2 ns The voltage that can be applied to the accelerating tube ranges from 150 to 220 keV The commercially available IMA3-150E tube is placed in the analytic chamber The generated electron beam is extracted to air through the beryllium foil and directed vertically downwards The luminescence stream is transferred to the multichannel photodetector (2) by means of the silica multifiber Computer (3) is the control system of the experimental setup ldquoSpecadrdquo software makes possible to realize various modes of the photodetector It provides the calibration registration reviewing processing and archiving of obtained spectra The commercially available pulsed cathodoluminescent spectrograph ldquoCLAVIrdquo [Michailov et al 2001] was created on basis of this experimental setup
3 The application of the pulsed cathodoluminescence for the luminescent analysis of Nd
3+Y3Al5O12 and Nd
3+Y2O3
In the last year the intensive investigations in the field of the optical ceramics creation based on the metal refractory oxide doped with rare-earth ions particularly Nd3+Y3Al5O12 и Nd3+Y2O3 are carried out [Ikesue et al 1995 Lu et al 2001 Bagaev et al 2009] The advantages of the laser ceramics against single crystals include the possibility of creating multilayer elements with sizes greater than those of single crystals larger concentration of active ions and lower manufacturing cost The fitness of crystals or ceramics for active laser elements is determined usually by the photoluminescent methods in infrared region by means of lifetime measurement of upper laser Nd ion level 4F32 [Hoskins et al 1963 Lupei et al 1995] For this aim the method is effective however it doesnrsquot display couses of the lifetime decrease of the laser level This is necessary to know to correct the conditions the conditions of crystal and ceramics synthesis of synthesis of crystalls and ceramics Below the investigation of the PCL spectra is given The possibility of realization of qualitative and quantitative luminescent analyses of Nd3+Y3Al5O12 Nd3+Y2O3 laser materials is developed
31 The luminescence of Nd3+
Y3Al5O12
The emission lines of neodymium ions in Nd3+Y3Al5O12 in visible range correspond to the
transitions from 4f25d1 2F252 level which has three Stark components 0=37775 cm-1
1=37864 cm-1 2=38153 cm-1 to the levels of 4f3 configuration of neodymium ion
[Kolomiycev et al 1984] The wavelengths of observed luminescent lines and their
identification for Nd3+Y3Al5O12 single crystal are presented in Table 1 in the first and the
second columns respectively The numbers of Stark sublevels in according to nomenclature
[Koningstein et al 1964] at increasing their energy starting with zero are pointed next to
symbol of electron level in brackets then emission band wavelengths presented in
[Kolomiycev et al 1982] are shown in brackets
A conspicuous difference appears in PCL spectra of neodymium ions in yttrium aluminates
in case of different crystal structure The spectrum of orthorhombic Nd3+YAlO3 single
crystal together with the spectrum of cubic Nd3+Y3Al5O12 are presented in Fig 3 as an
illustration of this difference
wwwintechopencom
What is the Pulsed Cathodoluminescence
37
Nd3+Y3Al5O12 Nd3+YAlO3
nm
Identification of optical trasfer
nm Identification of optical trasfer
3899 2F252 (2)2H92 (0) (3900) 3946 2F252 (0)4F52 (2) (3946)3992 2F252 (0)2H92 (2) (3975) 3981 2F252 (0)2H92 (3) (3983) 4016 2F252 (0)2H92 (4) (4014)
4225 2D52 (2)4I92 (1) (4230) 4269 2F252 (2)4F92 (3) (4273) 4299 2F252 (1)4F92 (0) (4302) 4299 2F252 (1)4F92 (0) (4299) 4356 2F252 (0)4F92 (2) (4351) 4352 2F252 (1)4F92 (1) (4348) 4390 2D52 (0)4I92 (4) (4388) 4407 2P12 (0) 4I92 (3) (4412) 4504 2F252 (2)2H112 (3) (4505) 4504 2F252 (2)2H112 (3) (4504) 4554 2F252 (0)2H112 (1) (4559) 4560 2F252 (1)2H112 (3) (4560)4588 2F252 (0)2H112 (3) (4583)
4610 2F252 (0)2H112 (4) (4614)
4793 2F252 (1)4G52 (1) (4790) 4807 2F252 (1)4G52 (2) (4805) 4875 2F252 (0)2G72 (0) (4871) 4878 2F252 (0)2G72 (2) (4881)4944 4G112 (2)4I92 (4) (4942)
5252 2F252 (0)4G72 (0) (5249) 5254 2F252 (1)4G72 (1) (5254) 5278 2F252 (1)4G72 (2) (5278) 5380 2F252 (1)4G92 (2) (5383) 5406 2F252 (0)2K132+2G92 (2) (5410) 5395 2F252 (0)4G92 (0) (5393) 5416 2F252 (2)2K132 (2) (5420) 5457 2F252 (2)2K132 (4) (5457) 5475 2F252 (2)2K132 (5) (5475) 5491 2F252 (0)2K132+2G92 (7) (5494) 5492 2F252 (0)2K132 (0) (5490) 5545 2F252 (0)2K132 (3) (5542) 5563 2F252 (0)2K132 (4) (5562) 5574 2F252 (0)2K132+2G92 (10)(5570)
5629 2K152 (3)4I132 (0) (5626) 5636 2K132 (4)4I112(1) (5635)
5764 Superposition2G72 (23)4I92 (02) (5763)
5854 2F252 (2)4G92 (4) (5852) 5874 2F252 (0)4G92 (0) (5868)
5962 Superposition2F252 (0)4G112 (01) (5962)
6006 2F252 (0)4G112 (3) (6001)
6021 2F252(2)4G112+2K152+2D32(6)(6018) 6104 2F252(0)4G112+2K152+2D32(4)(6102) 6121 2F252(1)4G112+2K152+2D32(6)(6118) 6154 2F252(2)4G112+2K152+2D32(13)(6147) 6201 2F252 (0)2K152 (2) (6208) 6201 2F252(0)4G112+2K152+2D32(9)(6198) 6221 2F252(1)4G112+2K152+2D32(11)(6214) 6254 2F252(1)4G112+2K152+2D32(13)(6252) 6383 2H112 (1)4I92 (2) (6377) 6395 2H112 (0)4I92 (2) (6391) 6462 2H112 (3)4I92 (3) (6454) 6524 2H112 (3)4I92 (4) (6526) 6609 2G72 (3)4I112 (4) (6608) 6653 2G72 (0)4I112 (3) (6653) 6686 2G72 (0)4I112 (4) (6679)
Table 1 PCL lines and their identification for Nd3+Y3Al5O12 and Nd3+YAlO3 single crystals
wwwintechopencom
Cathodoluminescence
38
Fig 3 The PCL spectra of Nd3+Y3Al5O12 (1) and Nd3+YAlO3 (2) single crystals
The wavelengths of fundamental neodymium luminescent lines and their identification for Nd3+YAlO3 single crystal are presented in Table 1 in the third and the fourth columns respectively [Osipov et al 2011]
The Fig 3 and Table 1 show that the principal change is manifested in the considerable
increase of the luminescent band numbers in the yttrium monoaluminate spectrum This takes
place due to activation of d-f transitions between the different Stark sublevels and the
appearance of f-f transitions These changes arise from the distortion of crystalline field
symmetry in positions of individual neodymium ions that leads to the modifications of the
oscillator strength and optical transition probability Thus the distortion of crystalline field
symmetry appears in the spectrum as the change in intensity and numbers of emission bands
The differences in the spectra can be used for the determination of the second phase content in Nd3+Y3Al5O12 [Osipov et al 2011] The luminescence lightsum in the spectrum region
from 1 to 2 (2
1
( )S I d
) can be presented by the additive function depended from the
dominant phase content Cg (cubic Nd3+Y3Al5O12) and the second phase Cim=1-Cg
(1 )g gS C C (8)
where and are the coefficients of proportionality They are determined by the integration range and excitation conditions To eliminate the influence of the intensity instability it is necessary to use the ratio of lightsums (S1S2) as the analytical parameter calculated for two ranges of the spectrum The lightsums in the ranges 350-500 nm (S1) and 501-650 nm (S2) to obtain the functional relation between the Cg and the luminescence intensity of neodymium ions have been chosen In that case in accordance with Eq (8) the content of cubic phase into Nd3+Y3Al5O12 is defined the following equation
wwwintechopencom
What is the Pulsed Cathodoluminescence
39
1
1 22
12 2 1 2
2( ) ( )
g
SS
CS
S
(9)
In Fig 4 the correlation between the Cg and S1S2 calculated for the samples with known content of cubic phase is shown
Fig 4 The correlation between the Cg and S1S2
This dependence (Fig 4) is approximated by the following equation with the r2gt099
1
2
1
2
1071 0084
0069g
SS
CS
S
(10)
Moreover the obtained data validity was checked out by the analysis of samples with electron and optical microscopes
32 The luminescence of Y2O3 Nd3+
Y2O3
The wide band of intrinsic radiation in visible range is a visiting luminescent card of pure yttria Earlier the other authors observed this band at different excitation type [Conor 1964 Kuznetsov et al 1978 Bordun et al 1995] Even at cryogenic temperature of the samples the unresolved band was registered
We investigated commercially available yttria powders with a particle sizes of 1-3 m and 5-
10 m All the powders have a cubic lattice of the -Y2O3 From these commercial powders nanopowders with the average particle size of 10-12 nm were prepared by the laser
evaporation method Particles were crystallized in the metastable monoclinic phase -Y2O3
After annealing they transformed to the -Y2O3
wwwintechopencom
Cathodoluminescence
40
The spectrum of the powder with particle size of 1-3 m has a broad asymetric band peaked at 437 nm and long ndash wavelength wing shows local maxima (Fig 5 curve 1)
Fig 5 PCL spectra of commercial yttria powders with particle size 1-3 m (1) 5-10 m (2) and nanopowders with the average particle size of 10-12 nm (3)
In the spectrum of the powder with the particle size of 5-10 m almost all local maxima are transformed into narrow bands (Fig 5 curve 2) They are grouped into four series 435 ndash 510 nm (the blue series) 515 ndash 640 nm (the orange series) 645 ndash 700 nm (the red series) and 785 ndash 840 nm (the infrared series) The PCL spectra of nanopowders irrespective of the crystal
phase (either the -Y2O3 or the -Y2O3 phase) and of the initial coarse powder have a similar structures (Fig 3 curve 3) The broad band with the maximum at 485 nm dominates in these spectra The peak range of this band exhibits local maxima of the blue series Also the lines of orange series at 573 583 612 nm become apparent The red series is weak while the infrared series is hardly seen
The range of the band series observed in the spectra of pulsed cathodoluminescence corresponds to the range of intrinsic radiation of yttria which is identified as the radiation of associated donor-acceptor pairs Y3+ - O2- [Bordun 2002]
Since the luminescence wavelengths of narrow bands of commercial powders nanopowders coincide we can assume that these materials contain intrinsic luminescence centers of the same type
The series of PCL bands of yttria resemble the radiation of free YO radicals which is observed for example in laser plume of yttria-containing target [Osipov et al 2005] This radical has been fairly well studied [Pearse et al 1949] The Table 2 shows the wavelengths of the bands observed in PCL spectra and their identification In the second column of this table the wavelengths of the strongest bands are in boldface
wwwintechopencom
What is the Pulsed Cathodoluminescence
41
Intrinsic luminescence center
VrsquoVrsquorsquo nm
Blue band series the electronic transition B2X2
00 4538
22 4586
33 4611
01 4706
23 4752
02 4887
Orange band series the electronic transition A2X2
20+(Tg+Ag)=380 5428
10 5516
10+(Tg+Ag)=380 5635
00 5729
33 5836
01 6000
34 6122
02 6293
Red band series the electronic transition A2X2
03-(Tg+Ag)=162 6553
03 6624
03+(Tg+Ag)=162 6696
03+Tg=469 6838
Infrared band series the electronic transition A2X2
05+(Tg+Ag)=380 7608
06 7850
8011
8184
Table 2 Parameters of the PCL lines in the yttria spectrum
Based on these data we constructed the energy scheme of the intrinsic luminescence center (Fig 6) Qualitatively this scheme coincides with that of the YO free radicals In this scheme the configuration curves were calculated in the harmonic oscilator approximation as
216 20
0
210 ( )i
i i i
c mE E r
h
(11)
where i =X A and B denotes the electronic states X2 A2 and B2 E0i I and i are the minimal energy the equilibrium distance and the wavenumber of the vibration mode of ith electronic state respectively m0 is the mass of the oxygen atom c and h are the light speed
and Planckrsquos constant The energy E and wavenumbers i are expressed in (11) in reciprocal
centimetres the amplitudes of the (r-i) vibrations are given in nanometres
wwwintechopencom
Cathodoluminescence
42
Fig 6 Energy scheme of the intrinsic luminescence center
For the configuration curves of the X2 A2 and B2 states (Fig 6) E0i=0 17510 and 22090
cm-1 and i=786 675 and 675 cm-1 respectively With these parameters up to the measurement error the wavelengths of pulsed cathodoluminescence coincide with the wavelengths of the optical transitions shown in Table 2 The Franck ndash Condon principle for
molecular transitions is most precisely implemented at A=X+10870910-3 nm and
B=X+1235110-3 nm and X can be estimated as half of elementary cube edge X=01385 nm For electronic ndash vibration transitions for which one of the vibration quantum numbers V is large this principle is implemented only if these transitions involve the most strong phonons [Schaak et al 1970] Table 2 Under these parameters the configuration curves of
the electronic states A2 and B2 intersect at the point with E=25256 cm-1
The qualitative coincidence of the emission bands and the energy structure of intrinsic luminescence centres observed by us and YO free radicals allow us to conclude that intrinsic luminescence centres in yttria contain bound YO radicals [Osipov et al 2008] Consider the possibility of formation of such intrinsic luminescence centre It is known [Schaak et al 1970] that the cubic yttria has unit cell composed of 16 formula units Y2O3 Twenty four cations occupy positions with C2 symmetry and eight cations occupy the positions with C3i symmetry (Fig 7) Every cation is surrounded by six oxygen ions which are positioned on the corners of deformed cube with the edge size of 02702 nm at that two corners is unoccupied Thus in one-third of the cubes (YO6) two oxygen vacancies are located at the cube corners along the face diagonal while in the remaining cubes they are located along the body diagonal (Fig 7)
For such packing a structure presented in Fig 8 can be formed at the outer cube face that contains two oxygen vacancies and that is located at the crystal boundary In essence this structure is the YO radical bound to the crystal lattice by the yttriun ion On such surfaces
the fraction of faces with two oxygen vacancies is 1316=118 and the average distance
wwwintechopencom
What is the Pulsed Cathodoluminescence
43
between them is about 5 nm All of this leads to the dependence of the luminescence spectrum of such bound radicals on the particle size of yttria mainly via their shape
Fig 7 The unit cell of yttria The yttrium positions with C3i and C2 symmetry designated by red and pink balls respectively The oxygen and the vacant positions designated by blue and grey balls The vacant positions are associated by green dot line
Fig 8 The structure of intrinsic luminescence centre
The considered above intrinsic luminescence centre also presents in Nd3+Y2O3 However the presence of neodymium results in decrease of the intrinsic band intensity and distortion of its profile We studied the monoclinic and cubic Nd3+Y2O3 nanopowders The nanopowders
were prepared using a mixture of micropowder -Y2O3 phase and 1 mol Nd2O3 powder After evaporation of this mixture by CO2 laser Nd3+Y2O3 nanoparticles were crystallized into monoclinic phase To transfer nanopowders into cubic phase annealing in air was
carried out above 900C [Kotov et al 2002]
wwwintechopencom
Cathodoluminescence
44
The PCL spectra of all Nd3+Y2O3 samples contain emission lines of neodymium ions which have not been previously observed in photoluminescence Namely neodymium doped nanopowders exhibit a strong band peaking at 825 nm (Fig 9)
Fig 9 The PCL spectra of monoclinic (1) and cubic (2) Nd3+Y2O3 nanopowders
Its components correspond well to the 4F524I92 (825 811 834 nm) and 2H924I92 (818 nm) optical transitions between Nd3+ Starkrsquos sublevels with the energies in Y2O3 cubic lattice [Chang 1966] These components are resolved only in cubic samples (Fig 9) Therefore the splitting of Starkrsquos components allows us to conclude about the presence of the dominant phase into Nd3+Y2O3
To check this assumption the additional investigations were made In Fig 10 the PCL spectra of pressed nanopowders (compacts) are presented The compacts were annealed at
530 750 950 1100 and 1300C The X-ray analysis for this samples showed that the
unannealed compact and annealed compact at 530C have monoclinic phase all remaining compacts are cubic samples It is shown that the splitting of neodymium band at region of 800-840 nm only takes place in cubic samples and one component appears at 825 nm in monoclinic samples
In addition to the band in the region of 800-840 nm two emission bands of neodymium ions
arise in the Nd3+Y2O3 These are a weak band at 720 nm due to 4F924I92 transition and stronger band at 750 nm with the components due to the transitions between the Stark
sublevels 4F724I92 and 4S32 4I92
The intensity weaking of intrinsic band into Nd3+Y2O3 is associated with the quantitative decrease of this centres since the part of yttrium ions are replaced by the neodymium ions The distortion of the intrinsic band is determined by the neodymium absorption of it The most absorption is observed in region at 560-613 nm [Osipov et al 2009]
wwwintechopencom
What is the Pulsed Cathodoluminescence
45
In addition to the present bands into Nd3+Y2O3 the appearance of four well-resolved components in the range of 610-660 nm can be seen The specta of this band for compacts
annealed at 950 and 1300C are presented in Fig 11 The band contains the following four narrow lines at 6206 6306 6453 6556 nm which we identify using Raman spectra as
luminescence of oxygen molecular ion 2O [Solomonov et al 2011]
Fig 10 The PCL spectra of unannealed compact (1) and compacts annealed at 530C (2)
750C (3) 950C (4) 1100C (5) 1300C (6)
wwwintechopencom
Cathodoluminescence
46
The bands with the frequencies of 1615 and 1702 cm-1 correspond to vibrations of the molecular ion in the ground state while the frequencies at 966 and 993 cm-1 correspond to the excited state for the two sites of the oxygen molecular ion in the yttria lattice
Fig 12 demonstrates two sites of defects 2O taking into account the occurrence of two types
of natural vacancies about we talked earlier
Fig 11 The PCL of oxygen molecular ions
Fig 12 Two sites of oxygen molecular ions defects in lattice of cubic Y2O3
Fig 13 presents two potentional curves and formation of luminescence bands The lowest
excited state A2u of the oxygen molecular ion can be stabilized
The observed luminescence band results of the transition from the vibration level Vrsquo=0 of
the excited electronic state A2u to one vibration level Vrsquorsquo=3 of the ground state X2g The
wwwintechopencom
What is the Pulsed Cathodoluminescence
47
bands at 6306 and 6556 nm are formed due to the transition to the vibration level of the groun state with the participation of lattice phonons For the first curve the phonon energy is 255 cm while for the second curve it is 244 cm-1 These phonons are observed in the Raman spectrum The excited electronic state of the molecular ion is spaced from the ground state by 20660-21580 cm-1 [Solomonov et al 2011]
Fig 13 Configuration curves for two sites of oxygen molecular ions
On the basis of the qualitative luminescent analysis of Nd3+Y2O3 the determination of neodymium concentration by means of the calibration curve construction is possible
because of intensity of neodymium lines is proportional to it concentration INd(i)=aiCNd (for example 750 or 825 nm) However we canrsquot use this equation because PCL spectrum is characterized by the instability Therefore we also chose lightsums ratio as analytic parameter in regions of 730-840 nm and 350-840 nm The first region of Nd3+Y2O3 spectrum involves only neodymium bands but the second one includes in addition the intrinsic band which is distorted by the neodymium absorption and can be ascribed as follows
wwwintechopencom
Cathodoluminescence
48
0
1 exp( )( ) i Nd
YO i ii Nd
k C lI I
k C (12)
Here I0i l ki are the intensity of i ndash intrinsic band without absorption the thickness of samples coefficient of absorption of i ndash band respectively Hence relation of lightsums ratio (S(350-840)S(730-840)) with CNd has to include the equation (12) Really this relation is decribed by the following equation
2
1 exp( )(350 840)
(730 840)Nd
Nd
B CSA D
S C
(13)
Fig 14 demonstrates the calibration curve (r2gt099) for the determination of neodymium concentration in region of 011 ndash 107 at
Fig 14 The calibration curve for the determination of neodymium concentration in region of 011 ndash 107 at
4 Conclusion
Thus the possibility of realization of rapid nondestructive qualitative and quantitative luminescent analyses of laser materials in particular Nd3+Y3Al5O12 Nd3+Y2O3 with the help of pulsed cathodoluminescence was shown
5 References
Bagaev S Osipov V Ivanov M Solomonov V Platonov V Orlov A Rasuleva A amp Vatnik S (2009)Fabrication and characteristics of neodymium ndash activated yttrium oxide optical ceramics Optical Materials Vol31 pp 740-743 ISSN 0925-3467
wwwintechopencom
What is the Pulsed Cathodoluminescence
49
Bogdankevich O Darznik S amp Eliseev P (1975) Semiconductor lasers Nauka Moscow Russia
Bordun O Bordun I amp Novosad S (1995) Luminescence centres into Y2O3 Journal of applied spectroscopy Vol62 No6 pp 91-95 ISSN 0021-9037
Bordun O (2002) Influence of oxygen vacancies on the luminescence spectra of thin Y2O3 films Journal of applied spectroscopy Vol69 No3 pp 371-374 ISSN 0021-9037
Chang N (1966) Energy levels and crystal ndash field splittings of Nd3+ in yttrium oxide J Chem Phys Vol44 pp 4044-4050 ISSN 0021-9606
Chukichev M Sabri D Sokolov V amp Surcova T (1990) Cathodoluminescence of solid solution Zn1-xMnxSe Optics and Spectroscopy Vol68 pp 2000-2021 ISSN 0030-4034
Connor O (1964) A theory of thermoluminescence of fluorite (CaF2Y) Radiative recombination from highly associated electron ndash hole pairs Appl Phys Lett Vol4 No1 pp 126-129 ISSN 0003-6951
Galkin G (1981) The interband processes of the recombination into semiconductors at high excitation level Proceedings of the PN Lebedev Physical Institute (Trudi FIAN) Vol128 pp 3-64
Hoskins H amp Soffer B (1963) Stimulated emission from Y2O3Nd3+ Appl Phys Lett Vol4 pp 22-23 ISSN 0003-6951
Ikesue A Kinoshita T Kamata K amp Yoshida K (1995) Fabrication and optical properties of high-performance polycrystalline NdYAG ceramics for solid-state lasers J Amer Ceram Soc Vol78 pp 1033-1040 ISSN 1551-2916
Kolomiycev A Meylman M Volodina I Chukichev M Smagin A amp Bagdasarov H (1982) Luminescence of neodymium ndash activated yttrium ndash aluminum garnet crystals in ultra-violet and visible ranges at high energy excitation Deposition in VINITI No 5995-82 pp 1-15
Kolomiycev A Meylman M Volodina I Chukichev M Smagin A amp Bagdasarov H (1984) Luminescence of neodymium ndash activated yttrium ndash aluminum garnet crystals in ultra-violet and visible ranges at high energy excitation Optics and Spectroscopy Vol56 pp 365-367 ISSN 0030-4034
Koningstein J amp Geusic J (1964)Energy levels and crystal ndash field calculations of neodymium in yttrium aluminum garnet Phys Rev Vol136 No 3A pp 711-716 ISSN 1893-1912
Kotov Yu Osipov V Ivanov M Samatov O Platonov V Azarkevich E Murzakayev A amp Medvedev A (2002) Properties of oxide nanopowders prepared by target evaporation with a pulse ndash periodic CO2 laser Technical Physics Vol47 No11 pp 1420-1426 ISSN 1063-7842
Kuznetsov A Abramov V Rooze N amp Savikhina T (1978) Autolocalized excitons into Y2O3 JETP Letters Vol28 No10 pp 602-605 ISSN 0021-3640
Lu J Murai T Takaichi K Ueda K Yagi H Yanagitani T amp Kaminskii A (2001) Nd3+Y2O3 ceramic laser Jpn J Appl Phys Vol40 pp 1277-1279 ISSN 0021-4922
Lupei V Lupei A Tiseanu C Georgescu S Stoicescu C amp Nanau P (1995) High ndash resolution optical spectroscopy of YAG Nd A test for structural and distribution models Phys Rev B Vol51 No1 pp 8-17 ISSN 0003-6951
Mesyats G (1974) Generating of highpower nanosecond pulses The Soviet radio Moscow Russia
wwwintechopencom
Cathodoluminescence
50
Mesyats G Shpak V Yalandin M amp Shunailov S (1992) Compact RADAN electron accelerators for testing new radiation technologies and sterilization Radiat Phys Chem Vol46 pp 489-492 ISSN 0969-806X
Michailov S Osipov V amp Solomonov V (2001) Pulsed cathodoluminescent analyzer of materials Pribory i tekhnika eksperimenta No3 pp 164-165 ISSN 0032-8162
Osipov V Solomonov V Platonov V Snigireva O Ivanov V amp Lisenkov V (2005) Laser plume spectroscopy 2 Graphite yttrium ndash stabilized and zirconium oxide targets Quantum Electron Vol35 No7 pp 633-637 ISSN 0368-7147
Osipov V Rasuleva A amp Solomonov V (2008) Luminescence of pure yttria Optics and Spectroscopy Vol105 No4 pp 524-530 ISSN 0030-400X
Osipov V Solomonov V Spirina A Ivanov M amp Orlov A (2009) Luminescence of yttrium oxide doped with neodymium Optics and Spectroscopy Vol106 No1 pp 78-83 ISSN 0030-400X
Osipov V Solomonov V amp Spirina A (2011) Luminescent investigation of neodymium doped yttrium aluminates J of Optical Technology Vol78 No6 pp 81-87 ISSN 0030-4042
Pearse R amp Gaydon A (1949) The identification of molecular spectra Inostrannaya Literatura Moscow Russia
Petrov V (1996) Cathodoluminescent microscopy Physics - Uspekhi Vol39 pp 807-818 ISSN 0042-1294
Ramseyer K Fisher J Matter A Eberhardt P amp Geiss J (1989) A cathodoluminescence microscope for low intensity luminescence Journal of Sedimentary Research Vol59 pp 619-622 ISSN 0022-4472
Ramseyer K amp Millis J (1990) Factors influencing short-lived blue cathodoluminescence in
- quartz Journal of Sedimentary Research Vol59 pp 619-622 ISSN 0003-004X Schaak G amp Koningstein J (1970) Phonon and electronic raman spectra of cubic rare-earth
oxides and isomorphous ittrium oxide J Opt Soc Amer Vol60 No8 pp 1110-1115 ISSN 1551-2916
Solomonov V amp Michailov S (2003) Pulsed cathodoluminescence and its application for the analysis of condensed substances UB RAS ISBN 5-7691-1357-X Yekaterinburg Russia
Solomonv V (2003) Kinetics of pulsed cathodoluminescence Optics and Spectroscopy Vol95 pp 248-254 ISSN 0030-4034
Solomonv V Michailov S amp Deykun A (1996) About the mecanism of excitation and the structure of the pulsed cathodoluminescence bands of Cr3+ Mn2+ impurity ions into minerals Optics and Spectroscopy Vol80 pp 447-458 ISSN 0030-4034
Vaysburd D Semin B Tavanov E Matlis S Balichev I amp Gering G (1982) Highenergy electronics of solid Nauka Novosibirsk Russia
Yang B Luff B amp Townsend F (1992) Chatodoluminescence of natural zircons J Phys Condens Matter Vol4 pp 5617-5624 ISSN 0953-8984
wwwintechopencom
CathodoluminescenceEdited by Dr Naoki Yamamoto
ISBN 978-953-51-0362-2Hard cover 324 pagesPublisher InTechPublished online 28 March 2012Published in print edition March 2012
InTech EuropeUniversity Campus STeP Ri Slavka Krautzeka 83A 51000 Rijeka Croatia Phone +385 (51) 770 447 Fax +385 (51) 686 166wwwintechopencom
InTech ChinaUnit 405 Office Block Hotel Equatorial Shanghai No65 Yan An Road (West) Shanghai 200040 China
Phone +86-21-62489820 Fax +86-21-62489821
Cathodoluminescence (CL) is a non-destructive technique to characterize optical and electronic properties ofnanostructures in many kinds of materials Major subject is to investigate basic parameters in semiconductorsimpurities in oxides and phase determination of minerals CL gives information on carrier concentrationdiffusion length and life time of minority carriers in semiconductors and impurity concentration and phasecomposition in composite materials This book involves 13 chapters to present the basics in the CL techniqueand applications to particles thin films and nanostructures in semiconductors oxides and minerals Thechapters covered in this book include recent development of CL technique and applications to wide range ofmaterials used in modern material science
How to referenceIn order to correctly reference this scholarly work feel free to copy and paste the following
Vladimir Solomonov and Alfiya Spirina (2012) What is the Pulsed CathodoluminescenceCathodoluminescence Dr Naoki Yamamoto (Ed) ISBN 978-953-51-0362-2 InTech Available fromhttpwwwintechopencombookscathodoluminescencewhat-is-the-pulsed-cathodoluminescence-
copy 2012 The Author(s) Licensee IntechOpen This is an open access articledistributed under the terms of the Creative Commons Attribution 30License which permits unrestricted use distribution and reproduction inany medium provided the original work is properly cited
Cathodoluminescence
34
It should be emphasized that despite of short time of electron beam impact PCL persistence occurs and its kinetics is ascribed by complicated laws This is associated with that the primary source of luminescence excitation is the electron-hole pairs Their concentration according to Eq (1) over the time of electron beam impact (G=0) is given by
0( )
0
exp( )
1 exp( )eh
e heh
B nA Atn
B At A B n
(6)
Here neh0 is the concentration of electron-hole pairs introduced by the electron beam The luminescence intensity of the electron and hole centres changes the same law The intensity of interband luminescence falls proportionally to n2eh These kinds of luminescence reach their maxima at the time moment when the excitation is over The intensity of intracentre luminescence changes more difficulty The first maximum is also reached at the same time
moment but further behaviour depends on the life time of radiative level (r) In the paper [Solomonov et al 1996 2003] it has been shown that there is the second maximum of the
intensity in the long persistence at r( 2 -1)A After this maximum the intensity falls
according to the exponential law with the characteristic time constant r Moreover the
second maximum can be more intensive than the first one If the rlt( 2 -1)A the second
maximum doesnrsquot appear and an exponential decay of luminescence occurs but with characteristic time constant that is proportional to 1(2A) It is worthy to note that in case of using nanosecond exciting electron beams the integral intensity of persistent luminescence is usually similar or even higher than that during excitation
2 Apparatus for the PCL registration
The generation of high-current nanosecond electron beam with the energy higher than 100
keV became possible after creation of electron accelerators by GA Mesyats in the 1970-s
These accelerators are founded on the explosive electron emission [Mesyats 1974] The
electrons having this energy extend at great distance (more than 10 cm) in air The
samples excited in air can be used in the form of pieces powders and solution The
irradiation in air furthers also to the partial compensation of injected charge into sample
by the stream of positive air ions created by the electron beam The large penetration
depth of these electrons into sample simplifies the sample preparation for analysis
considerably namely there is no need to undergo the sample to grinding and polishing
procedures Moreover irradiated surface doesnrsquot require metallization This is very
important for the analysis of the finished product in particular jewels It should be also
noted that the problem of sample warming which is typical for the steady-state
cathodoluminescence is solved due to the introduction of the small energy density ( 3
Jcm3)
The investigation of PCL in the different mediums has shown that the portable nanosecond
accelerators of RADAN [Mesyats et al 1992] are most applicable for its excitation These
accelerators include the sealed vacuum electron tube The biological shielding from X-ray
emission is provided by the design of analytic chamber which is connected with the output
of the accelerator The analysed samples are placed into the chamber The pulsed type of the
luminescence allows using the different methods of its registration
wwwintechopencom
What is the Pulsed Cathodoluminescence
35
As a first the traditional method of the registration with the help of optical monochromator photoelectronic multiplier and oscillograph is applied [Vaysburd etal 1982 Solomonov et al 1996] The intensity kinetics of separated luminescence band is measured by this method This is necessary for the identification of its nature The application of the scanning
monochromator allows registering the intensity distribution by wavelengths I (t) However two PCL features have to be kept in mind The first feature is that the PCL is characterised by the certain degree of instability of the registered parameters because of the pulsed regime Therefore the spectrum measurement has to be performed in the averaging mode The second feature is caused by the different kinetics of PCL bands with the various nature and spectrum registered by such an approach strongly depends on time
As a second the time-integral intensity of the luminescent bands can be measured
2
1
( ) ( )
t
t
I I t dt (7)
Here I (t) is the current intensity t1 is the beginning of registration and t2 is the ending of registration This intensity is registered with the help of multichannel semiconductor photodetectors based on diode matrix and charge-coupled device [Solomonov et al 2003] In this case optical spectrograph is applied instead of the scanning monochromator and the wide spectral range for one frame is measured This method can be used for the PCL research when intracentre luminescence is dominant Also the kinetic information about all registered spectrum can be obtained by means of changing of the integration limits t1 and t2
Fig 2 demonstrates the scheme of experimental setup for the receiving of PCL spectra The setup consists of the luminescence excitation block (1) multichannel photodetector (2) and computer (3)
Fig 2 Scheme of experimental setup
wwwintechopencom
Cathodoluminescence
36
The excitation block (1) represents a combination of RADAN-220 pulsed electron accelerator and analytical chamber The operating principle of the accelerator is based on the explosive emission of electrons from the cold cathode of accelerating tube The RADAN-220 generates electron beam with the duration of 2 ns The voltage that can be applied to the accelerating tube ranges from 150 to 220 keV The commercially available IMA3-150E tube is placed in the analytic chamber The generated electron beam is extracted to air through the beryllium foil and directed vertically downwards The luminescence stream is transferred to the multichannel photodetector (2) by means of the silica multifiber Computer (3) is the control system of the experimental setup ldquoSpecadrdquo software makes possible to realize various modes of the photodetector It provides the calibration registration reviewing processing and archiving of obtained spectra The commercially available pulsed cathodoluminescent spectrograph ldquoCLAVIrdquo [Michailov et al 2001] was created on basis of this experimental setup
3 The application of the pulsed cathodoluminescence for the luminescent analysis of Nd
3+Y3Al5O12 and Nd
3+Y2O3
In the last year the intensive investigations in the field of the optical ceramics creation based on the metal refractory oxide doped with rare-earth ions particularly Nd3+Y3Al5O12 и Nd3+Y2O3 are carried out [Ikesue et al 1995 Lu et al 2001 Bagaev et al 2009] The advantages of the laser ceramics against single crystals include the possibility of creating multilayer elements with sizes greater than those of single crystals larger concentration of active ions and lower manufacturing cost The fitness of crystals or ceramics for active laser elements is determined usually by the photoluminescent methods in infrared region by means of lifetime measurement of upper laser Nd ion level 4F32 [Hoskins et al 1963 Lupei et al 1995] For this aim the method is effective however it doesnrsquot display couses of the lifetime decrease of the laser level This is necessary to know to correct the conditions the conditions of crystal and ceramics synthesis of synthesis of crystalls and ceramics Below the investigation of the PCL spectra is given The possibility of realization of qualitative and quantitative luminescent analyses of Nd3+Y3Al5O12 Nd3+Y2O3 laser materials is developed
31 The luminescence of Nd3+
Y3Al5O12
The emission lines of neodymium ions in Nd3+Y3Al5O12 in visible range correspond to the
transitions from 4f25d1 2F252 level which has three Stark components 0=37775 cm-1
1=37864 cm-1 2=38153 cm-1 to the levels of 4f3 configuration of neodymium ion
[Kolomiycev et al 1984] The wavelengths of observed luminescent lines and their
identification for Nd3+Y3Al5O12 single crystal are presented in Table 1 in the first and the
second columns respectively The numbers of Stark sublevels in according to nomenclature
[Koningstein et al 1964] at increasing their energy starting with zero are pointed next to
symbol of electron level in brackets then emission band wavelengths presented in
[Kolomiycev et al 1982] are shown in brackets
A conspicuous difference appears in PCL spectra of neodymium ions in yttrium aluminates
in case of different crystal structure The spectrum of orthorhombic Nd3+YAlO3 single
crystal together with the spectrum of cubic Nd3+Y3Al5O12 are presented in Fig 3 as an
illustration of this difference
wwwintechopencom
What is the Pulsed Cathodoluminescence
37
Nd3+Y3Al5O12 Nd3+YAlO3
nm
Identification of optical trasfer
nm Identification of optical trasfer
3899 2F252 (2)2H92 (0) (3900) 3946 2F252 (0)4F52 (2) (3946)3992 2F252 (0)2H92 (2) (3975) 3981 2F252 (0)2H92 (3) (3983) 4016 2F252 (0)2H92 (4) (4014)
4225 2D52 (2)4I92 (1) (4230) 4269 2F252 (2)4F92 (3) (4273) 4299 2F252 (1)4F92 (0) (4302) 4299 2F252 (1)4F92 (0) (4299) 4356 2F252 (0)4F92 (2) (4351) 4352 2F252 (1)4F92 (1) (4348) 4390 2D52 (0)4I92 (4) (4388) 4407 2P12 (0) 4I92 (3) (4412) 4504 2F252 (2)2H112 (3) (4505) 4504 2F252 (2)2H112 (3) (4504) 4554 2F252 (0)2H112 (1) (4559) 4560 2F252 (1)2H112 (3) (4560)4588 2F252 (0)2H112 (3) (4583)
4610 2F252 (0)2H112 (4) (4614)
4793 2F252 (1)4G52 (1) (4790) 4807 2F252 (1)4G52 (2) (4805) 4875 2F252 (0)2G72 (0) (4871) 4878 2F252 (0)2G72 (2) (4881)4944 4G112 (2)4I92 (4) (4942)
5252 2F252 (0)4G72 (0) (5249) 5254 2F252 (1)4G72 (1) (5254) 5278 2F252 (1)4G72 (2) (5278) 5380 2F252 (1)4G92 (2) (5383) 5406 2F252 (0)2K132+2G92 (2) (5410) 5395 2F252 (0)4G92 (0) (5393) 5416 2F252 (2)2K132 (2) (5420) 5457 2F252 (2)2K132 (4) (5457) 5475 2F252 (2)2K132 (5) (5475) 5491 2F252 (0)2K132+2G92 (7) (5494) 5492 2F252 (0)2K132 (0) (5490) 5545 2F252 (0)2K132 (3) (5542) 5563 2F252 (0)2K132 (4) (5562) 5574 2F252 (0)2K132+2G92 (10)(5570)
5629 2K152 (3)4I132 (0) (5626) 5636 2K132 (4)4I112(1) (5635)
5764 Superposition2G72 (23)4I92 (02) (5763)
5854 2F252 (2)4G92 (4) (5852) 5874 2F252 (0)4G92 (0) (5868)
5962 Superposition2F252 (0)4G112 (01) (5962)
6006 2F252 (0)4G112 (3) (6001)
6021 2F252(2)4G112+2K152+2D32(6)(6018) 6104 2F252(0)4G112+2K152+2D32(4)(6102) 6121 2F252(1)4G112+2K152+2D32(6)(6118) 6154 2F252(2)4G112+2K152+2D32(13)(6147) 6201 2F252 (0)2K152 (2) (6208) 6201 2F252(0)4G112+2K152+2D32(9)(6198) 6221 2F252(1)4G112+2K152+2D32(11)(6214) 6254 2F252(1)4G112+2K152+2D32(13)(6252) 6383 2H112 (1)4I92 (2) (6377) 6395 2H112 (0)4I92 (2) (6391) 6462 2H112 (3)4I92 (3) (6454) 6524 2H112 (3)4I92 (4) (6526) 6609 2G72 (3)4I112 (4) (6608) 6653 2G72 (0)4I112 (3) (6653) 6686 2G72 (0)4I112 (4) (6679)
Table 1 PCL lines and their identification for Nd3+Y3Al5O12 and Nd3+YAlO3 single crystals
wwwintechopencom
Cathodoluminescence
38
Fig 3 The PCL spectra of Nd3+Y3Al5O12 (1) and Nd3+YAlO3 (2) single crystals
The wavelengths of fundamental neodymium luminescent lines and their identification for Nd3+YAlO3 single crystal are presented in Table 1 in the third and the fourth columns respectively [Osipov et al 2011]
The Fig 3 and Table 1 show that the principal change is manifested in the considerable
increase of the luminescent band numbers in the yttrium monoaluminate spectrum This takes
place due to activation of d-f transitions between the different Stark sublevels and the
appearance of f-f transitions These changes arise from the distortion of crystalline field
symmetry in positions of individual neodymium ions that leads to the modifications of the
oscillator strength and optical transition probability Thus the distortion of crystalline field
symmetry appears in the spectrum as the change in intensity and numbers of emission bands
The differences in the spectra can be used for the determination of the second phase content in Nd3+Y3Al5O12 [Osipov et al 2011] The luminescence lightsum in the spectrum region
from 1 to 2 (2
1
( )S I d
) can be presented by the additive function depended from the
dominant phase content Cg (cubic Nd3+Y3Al5O12) and the second phase Cim=1-Cg
(1 )g gS C C (8)
where and are the coefficients of proportionality They are determined by the integration range and excitation conditions To eliminate the influence of the intensity instability it is necessary to use the ratio of lightsums (S1S2) as the analytical parameter calculated for two ranges of the spectrum The lightsums in the ranges 350-500 nm (S1) and 501-650 nm (S2) to obtain the functional relation between the Cg and the luminescence intensity of neodymium ions have been chosen In that case in accordance with Eq (8) the content of cubic phase into Nd3+Y3Al5O12 is defined the following equation
wwwintechopencom
What is the Pulsed Cathodoluminescence
39
1
1 22
12 2 1 2
2( ) ( )
g
SS
CS
S
(9)
In Fig 4 the correlation between the Cg and S1S2 calculated for the samples with known content of cubic phase is shown
Fig 4 The correlation between the Cg and S1S2
This dependence (Fig 4) is approximated by the following equation with the r2gt099
1
2
1
2
1071 0084
0069g
SS
CS
S
(10)
Moreover the obtained data validity was checked out by the analysis of samples with electron and optical microscopes
32 The luminescence of Y2O3 Nd3+
Y2O3
The wide band of intrinsic radiation in visible range is a visiting luminescent card of pure yttria Earlier the other authors observed this band at different excitation type [Conor 1964 Kuznetsov et al 1978 Bordun et al 1995] Even at cryogenic temperature of the samples the unresolved band was registered
We investigated commercially available yttria powders with a particle sizes of 1-3 m and 5-
10 m All the powders have a cubic lattice of the -Y2O3 From these commercial powders nanopowders with the average particle size of 10-12 nm were prepared by the laser
evaporation method Particles were crystallized in the metastable monoclinic phase -Y2O3
After annealing they transformed to the -Y2O3
wwwintechopencom
Cathodoluminescence
40
The spectrum of the powder with particle size of 1-3 m has a broad asymetric band peaked at 437 nm and long ndash wavelength wing shows local maxima (Fig 5 curve 1)
Fig 5 PCL spectra of commercial yttria powders with particle size 1-3 m (1) 5-10 m (2) and nanopowders with the average particle size of 10-12 nm (3)
In the spectrum of the powder with the particle size of 5-10 m almost all local maxima are transformed into narrow bands (Fig 5 curve 2) They are grouped into four series 435 ndash 510 nm (the blue series) 515 ndash 640 nm (the orange series) 645 ndash 700 nm (the red series) and 785 ndash 840 nm (the infrared series) The PCL spectra of nanopowders irrespective of the crystal
phase (either the -Y2O3 or the -Y2O3 phase) and of the initial coarse powder have a similar structures (Fig 3 curve 3) The broad band with the maximum at 485 nm dominates in these spectra The peak range of this band exhibits local maxima of the blue series Also the lines of orange series at 573 583 612 nm become apparent The red series is weak while the infrared series is hardly seen
The range of the band series observed in the spectra of pulsed cathodoluminescence corresponds to the range of intrinsic radiation of yttria which is identified as the radiation of associated donor-acceptor pairs Y3+ - O2- [Bordun 2002]
Since the luminescence wavelengths of narrow bands of commercial powders nanopowders coincide we can assume that these materials contain intrinsic luminescence centers of the same type
The series of PCL bands of yttria resemble the radiation of free YO radicals which is observed for example in laser plume of yttria-containing target [Osipov et al 2005] This radical has been fairly well studied [Pearse et al 1949] The Table 2 shows the wavelengths of the bands observed in PCL spectra and their identification In the second column of this table the wavelengths of the strongest bands are in boldface
wwwintechopencom
What is the Pulsed Cathodoluminescence
41
Intrinsic luminescence center
VrsquoVrsquorsquo nm
Blue band series the electronic transition B2X2
00 4538
22 4586
33 4611
01 4706
23 4752
02 4887
Orange band series the electronic transition A2X2
20+(Tg+Ag)=380 5428
10 5516
10+(Tg+Ag)=380 5635
00 5729
33 5836
01 6000
34 6122
02 6293
Red band series the electronic transition A2X2
03-(Tg+Ag)=162 6553
03 6624
03+(Tg+Ag)=162 6696
03+Tg=469 6838
Infrared band series the electronic transition A2X2
05+(Tg+Ag)=380 7608
06 7850
8011
8184
Table 2 Parameters of the PCL lines in the yttria spectrum
Based on these data we constructed the energy scheme of the intrinsic luminescence center (Fig 6) Qualitatively this scheme coincides with that of the YO free radicals In this scheme the configuration curves were calculated in the harmonic oscilator approximation as
216 20
0
210 ( )i
i i i
c mE E r
h
(11)
where i =X A and B denotes the electronic states X2 A2 and B2 E0i I and i are the minimal energy the equilibrium distance and the wavenumber of the vibration mode of ith electronic state respectively m0 is the mass of the oxygen atom c and h are the light speed
and Planckrsquos constant The energy E and wavenumbers i are expressed in (11) in reciprocal
centimetres the amplitudes of the (r-i) vibrations are given in nanometres
wwwintechopencom
Cathodoluminescence
42
Fig 6 Energy scheme of the intrinsic luminescence center
For the configuration curves of the X2 A2 and B2 states (Fig 6) E0i=0 17510 and 22090
cm-1 and i=786 675 and 675 cm-1 respectively With these parameters up to the measurement error the wavelengths of pulsed cathodoluminescence coincide with the wavelengths of the optical transitions shown in Table 2 The Franck ndash Condon principle for
molecular transitions is most precisely implemented at A=X+10870910-3 nm and
B=X+1235110-3 nm and X can be estimated as half of elementary cube edge X=01385 nm For electronic ndash vibration transitions for which one of the vibration quantum numbers V is large this principle is implemented only if these transitions involve the most strong phonons [Schaak et al 1970] Table 2 Under these parameters the configuration curves of
the electronic states A2 and B2 intersect at the point with E=25256 cm-1
The qualitative coincidence of the emission bands and the energy structure of intrinsic luminescence centres observed by us and YO free radicals allow us to conclude that intrinsic luminescence centres in yttria contain bound YO radicals [Osipov et al 2008] Consider the possibility of formation of such intrinsic luminescence centre It is known [Schaak et al 1970] that the cubic yttria has unit cell composed of 16 formula units Y2O3 Twenty four cations occupy positions with C2 symmetry and eight cations occupy the positions with C3i symmetry (Fig 7) Every cation is surrounded by six oxygen ions which are positioned on the corners of deformed cube with the edge size of 02702 nm at that two corners is unoccupied Thus in one-third of the cubes (YO6) two oxygen vacancies are located at the cube corners along the face diagonal while in the remaining cubes they are located along the body diagonal (Fig 7)
For such packing a structure presented in Fig 8 can be formed at the outer cube face that contains two oxygen vacancies and that is located at the crystal boundary In essence this structure is the YO radical bound to the crystal lattice by the yttriun ion On such surfaces
the fraction of faces with two oxygen vacancies is 1316=118 and the average distance
wwwintechopencom
What is the Pulsed Cathodoluminescence
43
between them is about 5 nm All of this leads to the dependence of the luminescence spectrum of such bound radicals on the particle size of yttria mainly via their shape
Fig 7 The unit cell of yttria The yttrium positions with C3i and C2 symmetry designated by red and pink balls respectively The oxygen and the vacant positions designated by blue and grey balls The vacant positions are associated by green dot line
Fig 8 The structure of intrinsic luminescence centre
The considered above intrinsic luminescence centre also presents in Nd3+Y2O3 However the presence of neodymium results in decrease of the intrinsic band intensity and distortion of its profile We studied the monoclinic and cubic Nd3+Y2O3 nanopowders The nanopowders
were prepared using a mixture of micropowder -Y2O3 phase and 1 mol Nd2O3 powder After evaporation of this mixture by CO2 laser Nd3+Y2O3 nanoparticles were crystallized into monoclinic phase To transfer nanopowders into cubic phase annealing in air was
carried out above 900C [Kotov et al 2002]
wwwintechopencom
Cathodoluminescence
44
The PCL spectra of all Nd3+Y2O3 samples contain emission lines of neodymium ions which have not been previously observed in photoluminescence Namely neodymium doped nanopowders exhibit a strong band peaking at 825 nm (Fig 9)
Fig 9 The PCL spectra of monoclinic (1) and cubic (2) Nd3+Y2O3 nanopowders
Its components correspond well to the 4F524I92 (825 811 834 nm) and 2H924I92 (818 nm) optical transitions between Nd3+ Starkrsquos sublevels with the energies in Y2O3 cubic lattice [Chang 1966] These components are resolved only in cubic samples (Fig 9) Therefore the splitting of Starkrsquos components allows us to conclude about the presence of the dominant phase into Nd3+Y2O3
To check this assumption the additional investigations were made In Fig 10 the PCL spectra of pressed nanopowders (compacts) are presented The compacts were annealed at
530 750 950 1100 and 1300C The X-ray analysis for this samples showed that the
unannealed compact and annealed compact at 530C have monoclinic phase all remaining compacts are cubic samples It is shown that the splitting of neodymium band at region of 800-840 nm only takes place in cubic samples and one component appears at 825 nm in monoclinic samples
In addition to the band in the region of 800-840 nm two emission bands of neodymium ions
arise in the Nd3+Y2O3 These are a weak band at 720 nm due to 4F924I92 transition and stronger band at 750 nm with the components due to the transitions between the Stark
sublevels 4F724I92 and 4S32 4I92
The intensity weaking of intrinsic band into Nd3+Y2O3 is associated with the quantitative decrease of this centres since the part of yttrium ions are replaced by the neodymium ions The distortion of the intrinsic band is determined by the neodymium absorption of it The most absorption is observed in region at 560-613 nm [Osipov et al 2009]
wwwintechopencom
What is the Pulsed Cathodoluminescence
45
In addition to the present bands into Nd3+Y2O3 the appearance of four well-resolved components in the range of 610-660 nm can be seen The specta of this band for compacts
annealed at 950 and 1300C are presented in Fig 11 The band contains the following four narrow lines at 6206 6306 6453 6556 nm which we identify using Raman spectra as
luminescence of oxygen molecular ion 2O [Solomonov et al 2011]
Fig 10 The PCL spectra of unannealed compact (1) and compacts annealed at 530C (2)
750C (3) 950C (4) 1100C (5) 1300C (6)
wwwintechopencom
Cathodoluminescence
46
The bands with the frequencies of 1615 and 1702 cm-1 correspond to vibrations of the molecular ion in the ground state while the frequencies at 966 and 993 cm-1 correspond to the excited state for the two sites of the oxygen molecular ion in the yttria lattice
Fig 12 demonstrates two sites of defects 2O taking into account the occurrence of two types
of natural vacancies about we talked earlier
Fig 11 The PCL of oxygen molecular ions
Fig 12 Two sites of oxygen molecular ions defects in lattice of cubic Y2O3
Fig 13 presents two potentional curves and formation of luminescence bands The lowest
excited state A2u of the oxygen molecular ion can be stabilized
The observed luminescence band results of the transition from the vibration level Vrsquo=0 of
the excited electronic state A2u to one vibration level Vrsquorsquo=3 of the ground state X2g The
wwwintechopencom
What is the Pulsed Cathodoluminescence
47
bands at 6306 and 6556 nm are formed due to the transition to the vibration level of the groun state with the participation of lattice phonons For the first curve the phonon energy is 255 cm while for the second curve it is 244 cm-1 These phonons are observed in the Raman spectrum The excited electronic state of the molecular ion is spaced from the ground state by 20660-21580 cm-1 [Solomonov et al 2011]
Fig 13 Configuration curves for two sites of oxygen molecular ions
On the basis of the qualitative luminescent analysis of Nd3+Y2O3 the determination of neodymium concentration by means of the calibration curve construction is possible
because of intensity of neodymium lines is proportional to it concentration INd(i)=aiCNd (for example 750 or 825 nm) However we canrsquot use this equation because PCL spectrum is characterized by the instability Therefore we also chose lightsums ratio as analytic parameter in regions of 730-840 nm and 350-840 nm The first region of Nd3+Y2O3 spectrum involves only neodymium bands but the second one includes in addition the intrinsic band which is distorted by the neodymium absorption and can be ascribed as follows
wwwintechopencom
Cathodoluminescence
48
0
1 exp( )( ) i Nd
YO i ii Nd
k C lI I
k C (12)
Here I0i l ki are the intensity of i ndash intrinsic band without absorption the thickness of samples coefficient of absorption of i ndash band respectively Hence relation of lightsums ratio (S(350-840)S(730-840)) with CNd has to include the equation (12) Really this relation is decribed by the following equation
2
1 exp( )(350 840)
(730 840)Nd
Nd
B CSA D
S C
(13)
Fig 14 demonstrates the calibration curve (r2gt099) for the determination of neodymium concentration in region of 011 ndash 107 at
Fig 14 The calibration curve for the determination of neodymium concentration in region of 011 ndash 107 at
4 Conclusion
Thus the possibility of realization of rapid nondestructive qualitative and quantitative luminescent analyses of laser materials in particular Nd3+Y3Al5O12 Nd3+Y2O3 with the help of pulsed cathodoluminescence was shown
5 References
Bagaev S Osipov V Ivanov M Solomonov V Platonov V Orlov A Rasuleva A amp Vatnik S (2009)Fabrication and characteristics of neodymium ndash activated yttrium oxide optical ceramics Optical Materials Vol31 pp 740-743 ISSN 0925-3467
wwwintechopencom
What is the Pulsed Cathodoluminescence
49
Bogdankevich O Darznik S amp Eliseev P (1975) Semiconductor lasers Nauka Moscow Russia
Bordun O Bordun I amp Novosad S (1995) Luminescence centres into Y2O3 Journal of applied spectroscopy Vol62 No6 pp 91-95 ISSN 0021-9037
Bordun O (2002) Influence of oxygen vacancies on the luminescence spectra of thin Y2O3 films Journal of applied spectroscopy Vol69 No3 pp 371-374 ISSN 0021-9037
Chang N (1966) Energy levels and crystal ndash field splittings of Nd3+ in yttrium oxide J Chem Phys Vol44 pp 4044-4050 ISSN 0021-9606
Chukichev M Sabri D Sokolov V amp Surcova T (1990) Cathodoluminescence of solid solution Zn1-xMnxSe Optics and Spectroscopy Vol68 pp 2000-2021 ISSN 0030-4034
Connor O (1964) A theory of thermoluminescence of fluorite (CaF2Y) Radiative recombination from highly associated electron ndash hole pairs Appl Phys Lett Vol4 No1 pp 126-129 ISSN 0003-6951
Galkin G (1981) The interband processes of the recombination into semiconductors at high excitation level Proceedings of the PN Lebedev Physical Institute (Trudi FIAN) Vol128 pp 3-64
Hoskins H amp Soffer B (1963) Stimulated emission from Y2O3Nd3+ Appl Phys Lett Vol4 pp 22-23 ISSN 0003-6951
Ikesue A Kinoshita T Kamata K amp Yoshida K (1995) Fabrication and optical properties of high-performance polycrystalline NdYAG ceramics for solid-state lasers J Amer Ceram Soc Vol78 pp 1033-1040 ISSN 1551-2916
Kolomiycev A Meylman M Volodina I Chukichev M Smagin A amp Bagdasarov H (1982) Luminescence of neodymium ndash activated yttrium ndash aluminum garnet crystals in ultra-violet and visible ranges at high energy excitation Deposition in VINITI No 5995-82 pp 1-15
Kolomiycev A Meylman M Volodina I Chukichev M Smagin A amp Bagdasarov H (1984) Luminescence of neodymium ndash activated yttrium ndash aluminum garnet crystals in ultra-violet and visible ranges at high energy excitation Optics and Spectroscopy Vol56 pp 365-367 ISSN 0030-4034
Koningstein J amp Geusic J (1964)Energy levels and crystal ndash field calculations of neodymium in yttrium aluminum garnet Phys Rev Vol136 No 3A pp 711-716 ISSN 1893-1912
Kotov Yu Osipov V Ivanov M Samatov O Platonov V Azarkevich E Murzakayev A amp Medvedev A (2002) Properties of oxide nanopowders prepared by target evaporation with a pulse ndash periodic CO2 laser Technical Physics Vol47 No11 pp 1420-1426 ISSN 1063-7842
Kuznetsov A Abramov V Rooze N amp Savikhina T (1978) Autolocalized excitons into Y2O3 JETP Letters Vol28 No10 pp 602-605 ISSN 0021-3640
Lu J Murai T Takaichi K Ueda K Yagi H Yanagitani T amp Kaminskii A (2001) Nd3+Y2O3 ceramic laser Jpn J Appl Phys Vol40 pp 1277-1279 ISSN 0021-4922
Lupei V Lupei A Tiseanu C Georgescu S Stoicescu C amp Nanau P (1995) High ndash resolution optical spectroscopy of YAG Nd A test for structural and distribution models Phys Rev B Vol51 No1 pp 8-17 ISSN 0003-6951
Mesyats G (1974) Generating of highpower nanosecond pulses The Soviet radio Moscow Russia
wwwintechopencom
Cathodoluminescence
50
Mesyats G Shpak V Yalandin M amp Shunailov S (1992) Compact RADAN electron accelerators for testing new radiation technologies and sterilization Radiat Phys Chem Vol46 pp 489-492 ISSN 0969-806X
Michailov S Osipov V amp Solomonov V (2001) Pulsed cathodoluminescent analyzer of materials Pribory i tekhnika eksperimenta No3 pp 164-165 ISSN 0032-8162
Osipov V Solomonov V Platonov V Snigireva O Ivanov V amp Lisenkov V (2005) Laser plume spectroscopy 2 Graphite yttrium ndash stabilized and zirconium oxide targets Quantum Electron Vol35 No7 pp 633-637 ISSN 0368-7147
Osipov V Rasuleva A amp Solomonov V (2008) Luminescence of pure yttria Optics and Spectroscopy Vol105 No4 pp 524-530 ISSN 0030-400X
Osipov V Solomonov V Spirina A Ivanov M amp Orlov A (2009) Luminescence of yttrium oxide doped with neodymium Optics and Spectroscopy Vol106 No1 pp 78-83 ISSN 0030-400X
Osipov V Solomonov V amp Spirina A (2011) Luminescent investigation of neodymium doped yttrium aluminates J of Optical Technology Vol78 No6 pp 81-87 ISSN 0030-4042
Pearse R amp Gaydon A (1949) The identification of molecular spectra Inostrannaya Literatura Moscow Russia
Petrov V (1996) Cathodoluminescent microscopy Physics - Uspekhi Vol39 pp 807-818 ISSN 0042-1294
Ramseyer K Fisher J Matter A Eberhardt P amp Geiss J (1989) A cathodoluminescence microscope for low intensity luminescence Journal of Sedimentary Research Vol59 pp 619-622 ISSN 0022-4472
Ramseyer K amp Millis J (1990) Factors influencing short-lived blue cathodoluminescence in
- quartz Journal of Sedimentary Research Vol59 pp 619-622 ISSN 0003-004X Schaak G amp Koningstein J (1970) Phonon and electronic raman spectra of cubic rare-earth
oxides and isomorphous ittrium oxide J Opt Soc Amer Vol60 No8 pp 1110-1115 ISSN 1551-2916
Solomonov V amp Michailov S (2003) Pulsed cathodoluminescence and its application for the analysis of condensed substances UB RAS ISBN 5-7691-1357-X Yekaterinburg Russia
Solomonv V (2003) Kinetics of pulsed cathodoluminescence Optics and Spectroscopy Vol95 pp 248-254 ISSN 0030-4034
Solomonv V Michailov S amp Deykun A (1996) About the mecanism of excitation and the structure of the pulsed cathodoluminescence bands of Cr3+ Mn2+ impurity ions into minerals Optics and Spectroscopy Vol80 pp 447-458 ISSN 0030-4034
Vaysburd D Semin B Tavanov E Matlis S Balichev I amp Gering G (1982) Highenergy electronics of solid Nauka Novosibirsk Russia
Yang B Luff B amp Townsend F (1992) Chatodoluminescence of natural zircons J Phys Condens Matter Vol4 pp 5617-5624 ISSN 0953-8984
wwwintechopencom
CathodoluminescenceEdited by Dr Naoki Yamamoto
ISBN 978-953-51-0362-2Hard cover 324 pagesPublisher InTechPublished online 28 March 2012Published in print edition March 2012
InTech EuropeUniversity Campus STeP Ri Slavka Krautzeka 83A 51000 Rijeka Croatia Phone +385 (51) 770 447 Fax +385 (51) 686 166wwwintechopencom
InTech ChinaUnit 405 Office Block Hotel Equatorial Shanghai No65 Yan An Road (West) Shanghai 200040 China
Phone +86-21-62489820 Fax +86-21-62489821
Cathodoluminescence (CL) is a non-destructive technique to characterize optical and electronic properties ofnanostructures in many kinds of materials Major subject is to investigate basic parameters in semiconductorsimpurities in oxides and phase determination of minerals CL gives information on carrier concentrationdiffusion length and life time of minority carriers in semiconductors and impurity concentration and phasecomposition in composite materials This book involves 13 chapters to present the basics in the CL techniqueand applications to particles thin films and nanostructures in semiconductors oxides and minerals Thechapters covered in this book include recent development of CL technique and applications to wide range ofmaterials used in modern material science
How to referenceIn order to correctly reference this scholarly work feel free to copy and paste the following
Vladimir Solomonov and Alfiya Spirina (2012) What is the Pulsed CathodoluminescenceCathodoluminescence Dr Naoki Yamamoto (Ed) ISBN 978-953-51-0362-2 InTech Available fromhttpwwwintechopencombookscathodoluminescencewhat-is-the-pulsed-cathodoluminescence-
copy 2012 The Author(s) Licensee IntechOpen This is an open access articledistributed under the terms of the Creative Commons Attribution 30License which permits unrestricted use distribution and reproduction inany medium provided the original work is properly cited
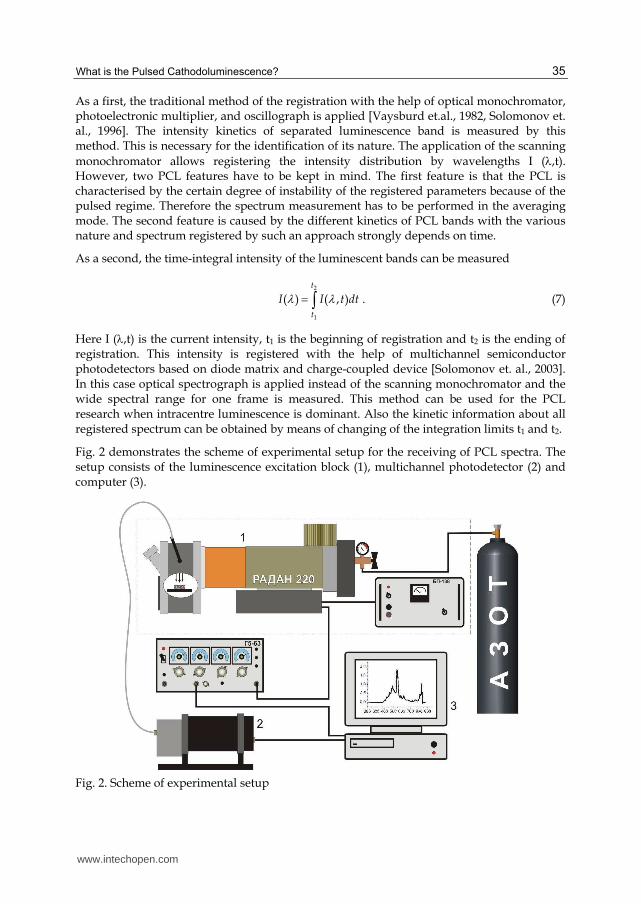
What is the Pulsed Cathodoluminescence
35
As a first the traditional method of the registration with the help of optical monochromator photoelectronic multiplier and oscillograph is applied [Vaysburd etal 1982 Solomonov et al 1996] The intensity kinetics of separated luminescence band is measured by this method This is necessary for the identification of its nature The application of the scanning
monochromator allows registering the intensity distribution by wavelengths I (t) However two PCL features have to be kept in mind The first feature is that the PCL is characterised by the certain degree of instability of the registered parameters because of the pulsed regime Therefore the spectrum measurement has to be performed in the averaging mode The second feature is caused by the different kinetics of PCL bands with the various nature and spectrum registered by such an approach strongly depends on time
As a second the time-integral intensity of the luminescent bands can be measured
2
1
( ) ( )
t
t
I I t dt (7)
Here I (t) is the current intensity t1 is the beginning of registration and t2 is the ending of registration This intensity is registered with the help of multichannel semiconductor photodetectors based on diode matrix and charge-coupled device [Solomonov et al 2003] In this case optical spectrograph is applied instead of the scanning monochromator and the wide spectral range for one frame is measured This method can be used for the PCL research when intracentre luminescence is dominant Also the kinetic information about all registered spectrum can be obtained by means of changing of the integration limits t1 and t2
Fig 2 demonstrates the scheme of experimental setup for the receiving of PCL spectra The setup consists of the luminescence excitation block (1) multichannel photodetector (2) and computer (3)
Fig 2 Scheme of experimental setup
wwwintechopencom
Cathodoluminescence
36
The excitation block (1) represents a combination of RADAN-220 pulsed electron accelerator and analytical chamber The operating principle of the accelerator is based on the explosive emission of electrons from the cold cathode of accelerating tube The RADAN-220 generates electron beam with the duration of 2 ns The voltage that can be applied to the accelerating tube ranges from 150 to 220 keV The commercially available IMA3-150E tube is placed in the analytic chamber The generated electron beam is extracted to air through the beryllium foil and directed vertically downwards The luminescence stream is transferred to the multichannel photodetector (2) by means of the silica multifiber Computer (3) is the control system of the experimental setup ldquoSpecadrdquo software makes possible to realize various modes of the photodetector It provides the calibration registration reviewing processing and archiving of obtained spectra The commercially available pulsed cathodoluminescent spectrograph ldquoCLAVIrdquo [Michailov et al 2001] was created on basis of this experimental setup
3 The application of the pulsed cathodoluminescence for the luminescent analysis of Nd
3+Y3Al5O12 and Nd
3+Y2O3
In the last year the intensive investigations in the field of the optical ceramics creation based on the metal refractory oxide doped with rare-earth ions particularly Nd3+Y3Al5O12 и Nd3+Y2O3 are carried out [Ikesue et al 1995 Lu et al 2001 Bagaev et al 2009] The advantages of the laser ceramics against single crystals include the possibility of creating multilayer elements with sizes greater than those of single crystals larger concentration of active ions and lower manufacturing cost The fitness of crystals or ceramics for active laser elements is determined usually by the photoluminescent methods in infrared region by means of lifetime measurement of upper laser Nd ion level 4F32 [Hoskins et al 1963 Lupei et al 1995] For this aim the method is effective however it doesnrsquot display couses of the lifetime decrease of the laser level This is necessary to know to correct the conditions the conditions of crystal and ceramics synthesis of synthesis of crystalls and ceramics Below the investigation of the PCL spectra is given The possibility of realization of qualitative and quantitative luminescent analyses of Nd3+Y3Al5O12 Nd3+Y2O3 laser materials is developed
31 The luminescence of Nd3+
Y3Al5O12
The emission lines of neodymium ions in Nd3+Y3Al5O12 in visible range correspond to the
transitions from 4f25d1 2F252 level which has three Stark components 0=37775 cm-1
1=37864 cm-1 2=38153 cm-1 to the levels of 4f3 configuration of neodymium ion
[Kolomiycev et al 1984] The wavelengths of observed luminescent lines and their
identification for Nd3+Y3Al5O12 single crystal are presented in Table 1 in the first and the
second columns respectively The numbers of Stark sublevels in according to nomenclature
[Koningstein et al 1964] at increasing their energy starting with zero are pointed next to
symbol of electron level in brackets then emission band wavelengths presented in
[Kolomiycev et al 1982] are shown in brackets
A conspicuous difference appears in PCL spectra of neodymium ions in yttrium aluminates
in case of different crystal structure The spectrum of orthorhombic Nd3+YAlO3 single
crystal together with the spectrum of cubic Nd3+Y3Al5O12 are presented in Fig 3 as an
illustration of this difference
wwwintechopencom
What is the Pulsed Cathodoluminescence
37
Nd3+Y3Al5O12 Nd3+YAlO3
nm
Identification of optical trasfer
nm Identification of optical trasfer
3899 2F252 (2)2H92 (0) (3900) 3946 2F252 (0)4F52 (2) (3946)3992 2F252 (0)2H92 (2) (3975) 3981 2F252 (0)2H92 (3) (3983) 4016 2F252 (0)2H92 (4) (4014)
4225 2D52 (2)4I92 (1) (4230) 4269 2F252 (2)4F92 (3) (4273) 4299 2F252 (1)4F92 (0) (4302) 4299 2F252 (1)4F92 (0) (4299) 4356 2F252 (0)4F92 (2) (4351) 4352 2F252 (1)4F92 (1) (4348) 4390 2D52 (0)4I92 (4) (4388) 4407 2P12 (0) 4I92 (3) (4412) 4504 2F252 (2)2H112 (3) (4505) 4504 2F252 (2)2H112 (3) (4504) 4554 2F252 (0)2H112 (1) (4559) 4560 2F252 (1)2H112 (3) (4560)4588 2F252 (0)2H112 (3) (4583)
4610 2F252 (0)2H112 (4) (4614)
4793 2F252 (1)4G52 (1) (4790) 4807 2F252 (1)4G52 (2) (4805) 4875 2F252 (0)2G72 (0) (4871) 4878 2F252 (0)2G72 (2) (4881)4944 4G112 (2)4I92 (4) (4942)
5252 2F252 (0)4G72 (0) (5249) 5254 2F252 (1)4G72 (1) (5254) 5278 2F252 (1)4G72 (2) (5278) 5380 2F252 (1)4G92 (2) (5383) 5406 2F252 (0)2K132+2G92 (2) (5410) 5395 2F252 (0)4G92 (0) (5393) 5416 2F252 (2)2K132 (2) (5420) 5457 2F252 (2)2K132 (4) (5457) 5475 2F252 (2)2K132 (5) (5475) 5491 2F252 (0)2K132+2G92 (7) (5494) 5492 2F252 (0)2K132 (0) (5490) 5545 2F252 (0)2K132 (3) (5542) 5563 2F252 (0)2K132 (4) (5562) 5574 2F252 (0)2K132+2G92 (10)(5570)
5629 2K152 (3)4I132 (0) (5626) 5636 2K132 (4)4I112(1) (5635)
5764 Superposition2G72 (23)4I92 (02) (5763)
5854 2F252 (2)4G92 (4) (5852) 5874 2F252 (0)4G92 (0) (5868)
5962 Superposition2F252 (0)4G112 (01) (5962)
6006 2F252 (0)4G112 (3) (6001)
6021 2F252(2)4G112+2K152+2D32(6)(6018) 6104 2F252(0)4G112+2K152+2D32(4)(6102) 6121 2F252(1)4G112+2K152+2D32(6)(6118) 6154 2F252(2)4G112+2K152+2D32(13)(6147) 6201 2F252 (0)2K152 (2) (6208) 6201 2F252(0)4G112+2K152+2D32(9)(6198) 6221 2F252(1)4G112+2K152+2D32(11)(6214) 6254 2F252(1)4G112+2K152+2D32(13)(6252) 6383 2H112 (1)4I92 (2) (6377) 6395 2H112 (0)4I92 (2) (6391) 6462 2H112 (3)4I92 (3) (6454) 6524 2H112 (3)4I92 (4) (6526) 6609 2G72 (3)4I112 (4) (6608) 6653 2G72 (0)4I112 (3) (6653) 6686 2G72 (0)4I112 (4) (6679)
Table 1 PCL lines and their identification for Nd3+Y3Al5O12 and Nd3+YAlO3 single crystals
wwwintechopencom
Cathodoluminescence
38
Fig 3 The PCL spectra of Nd3+Y3Al5O12 (1) and Nd3+YAlO3 (2) single crystals
The wavelengths of fundamental neodymium luminescent lines and their identification for Nd3+YAlO3 single crystal are presented in Table 1 in the third and the fourth columns respectively [Osipov et al 2011]
The Fig 3 and Table 1 show that the principal change is manifested in the considerable
increase of the luminescent band numbers in the yttrium monoaluminate spectrum This takes
place due to activation of d-f transitions between the different Stark sublevels and the
appearance of f-f transitions These changes arise from the distortion of crystalline field
symmetry in positions of individual neodymium ions that leads to the modifications of the
oscillator strength and optical transition probability Thus the distortion of crystalline field
symmetry appears in the spectrum as the change in intensity and numbers of emission bands
The differences in the spectra can be used for the determination of the second phase content in Nd3+Y3Al5O12 [Osipov et al 2011] The luminescence lightsum in the spectrum region
from 1 to 2 (2
1
( )S I d
) can be presented by the additive function depended from the
dominant phase content Cg (cubic Nd3+Y3Al5O12) and the second phase Cim=1-Cg
(1 )g gS C C (8)
where and are the coefficients of proportionality They are determined by the integration range and excitation conditions To eliminate the influence of the intensity instability it is necessary to use the ratio of lightsums (S1S2) as the analytical parameter calculated for two ranges of the spectrum The lightsums in the ranges 350-500 nm (S1) and 501-650 nm (S2) to obtain the functional relation between the Cg and the luminescence intensity of neodymium ions have been chosen In that case in accordance with Eq (8) the content of cubic phase into Nd3+Y3Al5O12 is defined the following equation
wwwintechopencom
What is the Pulsed Cathodoluminescence
39
1
1 22
12 2 1 2
2( ) ( )
g
SS
CS
S
(9)
In Fig 4 the correlation between the Cg and S1S2 calculated for the samples with known content of cubic phase is shown
Fig 4 The correlation between the Cg and S1S2
This dependence (Fig 4) is approximated by the following equation with the r2gt099
1
2
1
2
1071 0084
0069g
SS
CS
S
(10)
Moreover the obtained data validity was checked out by the analysis of samples with electron and optical microscopes
32 The luminescence of Y2O3 Nd3+
Y2O3
The wide band of intrinsic radiation in visible range is a visiting luminescent card of pure yttria Earlier the other authors observed this band at different excitation type [Conor 1964 Kuznetsov et al 1978 Bordun et al 1995] Even at cryogenic temperature of the samples the unresolved band was registered
We investigated commercially available yttria powders with a particle sizes of 1-3 m and 5-
10 m All the powders have a cubic lattice of the -Y2O3 From these commercial powders nanopowders with the average particle size of 10-12 nm were prepared by the laser
evaporation method Particles were crystallized in the metastable monoclinic phase -Y2O3
After annealing they transformed to the -Y2O3
wwwintechopencom
Cathodoluminescence
40
The spectrum of the powder with particle size of 1-3 m has a broad asymetric band peaked at 437 nm and long ndash wavelength wing shows local maxima (Fig 5 curve 1)
Fig 5 PCL spectra of commercial yttria powders with particle size 1-3 m (1) 5-10 m (2) and nanopowders with the average particle size of 10-12 nm (3)
In the spectrum of the powder with the particle size of 5-10 m almost all local maxima are transformed into narrow bands (Fig 5 curve 2) They are grouped into four series 435 ndash 510 nm (the blue series) 515 ndash 640 nm (the orange series) 645 ndash 700 nm (the red series) and 785 ndash 840 nm (the infrared series) The PCL spectra of nanopowders irrespective of the crystal
phase (either the -Y2O3 or the -Y2O3 phase) and of the initial coarse powder have a similar structures (Fig 3 curve 3) The broad band with the maximum at 485 nm dominates in these spectra The peak range of this band exhibits local maxima of the blue series Also the lines of orange series at 573 583 612 nm become apparent The red series is weak while the infrared series is hardly seen
The range of the band series observed in the spectra of pulsed cathodoluminescence corresponds to the range of intrinsic radiation of yttria which is identified as the radiation of associated donor-acceptor pairs Y3+ - O2- [Bordun 2002]
Since the luminescence wavelengths of narrow bands of commercial powders nanopowders coincide we can assume that these materials contain intrinsic luminescence centers of the same type
The series of PCL bands of yttria resemble the radiation of free YO radicals which is observed for example in laser plume of yttria-containing target [Osipov et al 2005] This radical has been fairly well studied [Pearse et al 1949] The Table 2 shows the wavelengths of the bands observed in PCL spectra and their identification In the second column of this table the wavelengths of the strongest bands are in boldface
wwwintechopencom
What is the Pulsed Cathodoluminescence
41
Intrinsic luminescence center
VrsquoVrsquorsquo nm
Blue band series the electronic transition B2X2
00 4538
22 4586
33 4611
01 4706
23 4752
02 4887
Orange band series the electronic transition A2X2
20+(Tg+Ag)=380 5428
10 5516
10+(Tg+Ag)=380 5635
00 5729
33 5836
01 6000
34 6122
02 6293
Red band series the electronic transition A2X2
03-(Tg+Ag)=162 6553
03 6624
03+(Tg+Ag)=162 6696
03+Tg=469 6838
Infrared band series the electronic transition A2X2
05+(Tg+Ag)=380 7608
06 7850
8011
8184
Table 2 Parameters of the PCL lines in the yttria spectrum
Based on these data we constructed the energy scheme of the intrinsic luminescence center (Fig 6) Qualitatively this scheme coincides with that of the YO free radicals In this scheme the configuration curves were calculated in the harmonic oscilator approximation as
216 20
0
210 ( )i
i i i
c mE E r
h
(11)
where i =X A and B denotes the electronic states X2 A2 and B2 E0i I and i are the minimal energy the equilibrium distance and the wavenumber of the vibration mode of ith electronic state respectively m0 is the mass of the oxygen atom c and h are the light speed
and Planckrsquos constant The energy E and wavenumbers i are expressed in (11) in reciprocal
centimetres the amplitudes of the (r-i) vibrations are given in nanometres
wwwintechopencom
Cathodoluminescence
42
Fig 6 Energy scheme of the intrinsic luminescence center
For the configuration curves of the X2 A2 and B2 states (Fig 6) E0i=0 17510 and 22090
cm-1 and i=786 675 and 675 cm-1 respectively With these parameters up to the measurement error the wavelengths of pulsed cathodoluminescence coincide with the wavelengths of the optical transitions shown in Table 2 The Franck ndash Condon principle for
molecular transitions is most precisely implemented at A=X+10870910-3 nm and
B=X+1235110-3 nm and X can be estimated as half of elementary cube edge X=01385 nm For electronic ndash vibration transitions for which one of the vibration quantum numbers V is large this principle is implemented only if these transitions involve the most strong phonons [Schaak et al 1970] Table 2 Under these parameters the configuration curves of
the electronic states A2 and B2 intersect at the point with E=25256 cm-1
The qualitative coincidence of the emission bands and the energy structure of intrinsic luminescence centres observed by us and YO free radicals allow us to conclude that intrinsic luminescence centres in yttria contain bound YO radicals [Osipov et al 2008] Consider the possibility of formation of such intrinsic luminescence centre It is known [Schaak et al 1970] that the cubic yttria has unit cell composed of 16 formula units Y2O3 Twenty four cations occupy positions with C2 symmetry and eight cations occupy the positions with C3i symmetry (Fig 7) Every cation is surrounded by six oxygen ions which are positioned on the corners of deformed cube with the edge size of 02702 nm at that two corners is unoccupied Thus in one-third of the cubes (YO6) two oxygen vacancies are located at the cube corners along the face diagonal while in the remaining cubes they are located along the body diagonal (Fig 7)
For such packing a structure presented in Fig 8 can be formed at the outer cube face that contains two oxygen vacancies and that is located at the crystal boundary In essence this structure is the YO radical bound to the crystal lattice by the yttriun ion On such surfaces
the fraction of faces with two oxygen vacancies is 1316=118 and the average distance
wwwintechopencom
What is the Pulsed Cathodoluminescence
43
between them is about 5 nm All of this leads to the dependence of the luminescence spectrum of such bound radicals on the particle size of yttria mainly via their shape
Fig 7 The unit cell of yttria The yttrium positions with C3i and C2 symmetry designated by red and pink balls respectively The oxygen and the vacant positions designated by blue and grey balls The vacant positions are associated by green dot line
Fig 8 The structure of intrinsic luminescence centre
The considered above intrinsic luminescence centre also presents in Nd3+Y2O3 However the presence of neodymium results in decrease of the intrinsic band intensity and distortion of its profile We studied the monoclinic and cubic Nd3+Y2O3 nanopowders The nanopowders
were prepared using a mixture of micropowder -Y2O3 phase and 1 mol Nd2O3 powder After evaporation of this mixture by CO2 laser Nd3+Y2O3 nanoparticles were crystallized into monoclinic phase To transfer nanopowders into cubic phase annealing in air was
carried out above 900C [Kotov et al 2002]
wwwintechopencom
Cathodoluminescence
44
The PCL spectra of all Nd3+Y2O3 samples contain emission lines of neodymium ions which have not been previously observed in photoluminescence Namely neodymium doped nanopowders exhibit a strong band peaking at 825 nm (Fig 9)
Fig 9 The PCL spectra of monoclinic (1) and cubic (2) Nd3+Y2O3 nanopowders
Its components correspond well to the 4F524I92 (825 811 834 nm) and 2H924I92 (818 nm) optical transitions between Nd3+ Starkrsquos sublevels with the energies in Y2O3 cubic lattice [Chang 1966] These components are resolved only in cubic samples (Fig 9) Therefore the splitting of Starkrsquos components allows us to conclude about the presence of the dominant phase into Nd3+Y2O3
To check this assumption the additional investigations were made In Fig 10 the PCL spectra of pressed nanopowders (compacts) are presented The compacts were annealed at
530 750 950 1100 and 1300C The X-ray analysis for this samples showed that the
unannealed compact and annealed compact at 530C have monoclinic phase all remaining compacts are cubic samples It is shown that the splitting of neodymium band at region of 800-840 nm only takes place in cubic samples and one component appears at 825 nm in monoclinic samples
In addition to the band in the region of 800-840 nm two emission bands of neodymium ions
arise in the Nd3+Y2O3 These are a weak band at 720 nm due to 4F924I92 transition and stronger band at 750 nm with the components due to the transitions between the Stark
sublevels 4F724I92 and 4S32 4I92
The intensity weaking of intrinsic band into Nd3+Y2O3 is associated with the quantitative decrease of this centres since the part of yttrium ions are replaced by the neodymium ions The distortion of the intrinsic band is determined by the neodymium absorption of it The most absorption is observed in region at 560-613 nm [Osipov et al 2009]
wwwintechopencom
What is the Pulsed Cathodoluminescence
45
In addition to the present bands into Nd3+Y2O3 the appearance of four well-resolved components in the range of 610-660 nm can be seen The specta of this band for compacts
annealed at 950 and 1300C are presented in Fig 11 The band contains the following four narrow lines at 6206 6306 6453 6556 nm which we identify using Raman spectra as
luminescence of oxygen molecular ion 2O [Solomonov et al 2011]
Fig 10 The PCL spectra of unannealed compact (1) and compacts annealed at 530C (2)
750C (3) 950C (4) 1100C (5) 1300C (6)
wwwintechopencom
Cathodoluminescence
46
The bands with the frequencies of 1615 and 1702 cm-1 correspond to vibrations of the molecular ion in the ground state while the frequencies at 966 and 993 cm-1 correspond to the excited state for the two sites of the oxygen molecular ion in the yttria lattice
Fig 12 demonstrates two sites of defects 2O taking into account the occurrence of two types
of natural vacancies about we talked earlier
Fig 11 The PCL of oxygen molecular ions
Fig 12 Two sites of oxygen molecular ions defects in lattice of cubic Y2O3
Fig 13 presents two potentional curves and formation of luminescence bands The lowest
excited state A2u of the oxygen molecular ion can be stabilized
The observed luminescence band results of the transition from the vibration level Vrsquo=0 of
the excited electronic state A2u to one vibration level Vrsquorsquo=3 of the ground state X2g The
wwwintechopencom
What is the Pulsed Cathodoluminescence
47
bands at 6306 and 6556 nm are formed due to the transition to the vibration level of the groun state with the participation of lattice phonons For the first curve the phonon energy is 255 cm while for the second curve it is 244 cm-1 These phonons are observed in the Raman spectrum The excited electronic state of the molecular ion is spaced from the ground state by 20660-21580 cm-1 [Solomonov et al 2011]
Fig 13 Configuration curves for two sites of oxygen molecular ions
On the basis of the qualitative luminescent analysis of Nd3+Y2O3 the determination of neodymium concentration by means of the calibration curve construction is possible
because of intensity of neodymium lines is proportional to it concentration INd(i)=aiCNd (for example 750 or 825 nm) However we canrsquot use this equation because PCL spectrum is characterized by the instability Therefore we also chose lightsums ratio as analytic parameter in regions of 730-840 nm and 350-840 nm The first region of Nd3+Y2O3 spectrum involves only neodymium bands but the second one includes in addition the intrinsic band which is distorted by the neodymium absorption and can be ascribed as follows
wwwintechopencom
Cathodoluminescence
48
0
1 exp( )( ) i Nd
YO i ii Nd
k C lI I
k C (12)
Here I0i l ki are the intensity of i ndash intrinsic band without absorption the thickness of samples coefficient of absorption of i ndash band respectively Hence relation of lightsums ratio (S(350-840)S(730-840)) with CNd has to include the equation (12) Really this relation is decribed by the following equation
2
1 exp( )(350 840)
(730 840)Nd
Nd
B CSA D
S C
(13)
Fig 14 demonstrates the calibration curve (r2gt099) for the determination of neodymium concentration in region of 011 ndash 107 at
Fig 14 The calibration curve for the determination of neodymium concentration in region of 011 ndash 107 at
4 Conclusion
Thus the possibility of realization of rapid nondestructive qualitative and quantitative luminescent analyses of laser materials in particular Nd3+Y3Al5O12 Nd3+Y2O3 with the help of pulsed cathodoluminescence was shown
5 References
Bagaev S Osipov V Ivanov M Solomonov V Platonov V Orlov A Rasuleva A amp Vatnik S (2009)Fabrication and characteristics of neodymium ndash activated yttrium oxide optical ceramics Optical Materials Vol31 pp 740-743 ISSN 0925-3467
wwwintechopencom
What is the Pulsed Cathodoluminescence
49
Bogdankevich O Darznik S amp Eliseev P (1975) Semiconductor lasers Nauka Moscow Russia
Bordun O Bordun I amp Novosad S (1995) Luminescence centres into Y2O3 Journal of applied spectroscopy Vol62 No6 pp 91-95 ISSN 0021-9037
Bordun O (2002) Influence of oxygen vacancies on the luminescence spectra of thin Y2O3 films Journal of applied spectroscopy Vol69 No3 pp 371-374 ISSN 0021-9037
Chang N (1966) Energy levels and crystal ndash field splittings of Nd3+ in yttrium oxide J Chem Phys Vol44 pp 4044-4050 ISSN 0021-9606
Chukichev M Sabri D Sokolov V amp Surcova T (1990) Cathodoluminescence of solid solution Zn1-xMnxSe Optics and Spectroscopy Vol68 pp 2000-2021 ISSN 0030-4034
Connor O (1964) A theory of thermoluminescence of fluorite (CaF2Y) Radiative recombination from highly associated electron ndash hole pairs Appl Phys Lett Vol4 No1 pp 126-129 ISSN 0003-6951
Galkin G (1981) The interband processes of the recombination into semiconductors at high excitation level Proceedings of the PN Lebedev Physical Institute (Trudi FIAN) Vol128 pp 3-64
Hoskins H amp Soffer B (1963) Stimulated emission from Y2O3Nd3+ Appl Phys Lett Vol4 pp 22-23 ISSN 0003-6951
Ikesue A Kinoshita T Kamata K amp Yoshida K (1995) Fabrication and optical properties of high-performance polycrystalline NdYAG ceramics for solid-state lasers J Amer Ceram Soc Vol78 pp 1033-1040 ISSN 1551-2916
Kolomiycev A Meylman M Volodina I Chukichev M Smagin A amp Bagdasarov H (1982) Luminescence of neodymium ndash activated yttrium ndash aluminum garnet crystals in ultra-violet and visible ranges at high energy excitation Deposition in VINITI No 5995-82 pp 1-15
Kolomiycev A Meylman M Volodina I Chukichev M Smagin A amp Bagdasarov H (1984) Luminescence of neodymium ndash activated yttrium ndash aluminum garnet crystals in ultra-violet and visible ranges at high energy excitation Optics and Spectroscopy Vol56 pp 365-367 ISSN 0030-4034
Koningstein J amp Geusic J (1964)Energy levels and crystal ndash field calculations of neodymium in yttrium aluminum garnet Phys Rev Vol136 No 3A pp 711-716 ISSN 1893-1912
Kotov Yu Osipov V Ivanov M Samatov O Platonov V Azarkevich E Murzakayev A amp Medvedev A (2002) Properties of oxide nanopowders prepared by target evaporation with a pulse ndash periodic CO2 laser Technical Physics Vol47 No11 pp 1420-1426 ISSN 1063-7842
Kuznetsov A Abramov V Rooze N amp Savikhina T (1978) Autolocalized excitons into Y2O3 JETP Letters Vol28 No10 pp 602-605 ISSN 0021-3640
Lu J Murai T Takaichi K Ueda K Yagi H Yanagitani T amp Kaminskii A (2001) Nd3+Y2O3 ceramic laser Jpn J Appl Phys Vol40 pp 1277-1279 ISSN 0021-4922
Lupei V Lupei A Tiseanu C Georgescu S Stoicescu C amp Nanau P (1995) High ndash resolution optical spectroscopy of YAG Nd A test for structural and distribution models Phys Rev B Vol51 No1 pp 8-17 ISSN 0003-6951
Mesyats G (1974) Generating of highpower nanosecond pulses The Soviet radio Moscow Russia
wwwintechopencom
Cathodoluminescence
50
Mesyats G Shpak V Yalandin M amp Shunailov S (1992) Compact RADAN electron accelerators for testing new radiation technologies and sterilization Radiat Phys Chem Vol46 pp 489-492 ISSN 0969-806X
Michailov S Osipov V amp Solomonov V (2001) Pulsed cathodoluminescent analyzer of materials Pribory i tekhnika eksperimenta No3 pp 164-165 ISSN 0032-8162
Osipov V Solomonov V Platonov V Snigireva O Ivanov V amp Lisenkov V (2005) Laser plume spectroscopy 2 Graphite yttrium ndash stabilized and zirconium oxide targets Quantum Electron Vol35 No7 pp 633-637 ISSN 0368-7147
Osipov V Rasuleva A amp Solomonov V (2008) Luminescence of pure yttria Optics and Spectroscopy Vol105 No4 pp 524-530 ISSN 0030-400X
Osipov V Solomonov V Spirina A Ivanov M amp Orlov A (2009) Luminescence of yttrium oxide doped with neodymium Optics and Spectroscopy Vol106 No1 pp 78-83 ISSN 0030-400X
Osipov V Solomonov V amp Spirina A (2011) Luminescent investigation of neodymium doped yttrium aluminates J of Optical Technology Vol78 No6 pp 81-87 ISSN 0030-4042
Pearse R amp Gaydon A (1949) The identification of molecular spectra Inostrannaya Literatura Moscow Russia
Petrov V (1996) Cathodoluminescent microscopy Physics - Uspekhi Vol39 pp 807-818 ISSN 0042-1294
Ramseyer K Fisher J Matter A Eberhardt P amp Geiss J (1989) A cathodoluminescence microscope for low intensity luminescence Journal of Sedimentary Research Vol59 pp 619-622 ISSN 0022-4472
Ramseyer K amp Millis J (1990) Factors influencing short-lived blue cathodoluminescence in
- quartz Journal of Sedimentary Research Vol59 pp 619-622 ISSN 0003-004X Schaak G amp Koningstein J (1970) Phonon and electronic raman spectra of cubic rare-earth
oxides and isomorphous ittrium oxide J Opt Soc Amer Vol60 No8 pp 1110-1115 ISSN 1551-2916
Solomonov V amp Michailov S (2003) Pulsed cathodoluminescence and its application for the analysis of condensed substances UB RAS ISBN 5-7691-1357-X Yekaterinburg Russia
Solomonv V (2003) Kinetics of pulsed cathodoluminescence Optics and Spectroscopy Vol95 pp 248-254 ISSN 0030-4034
Solomonv V Michailov S amp Deykun A (1996) About the mecanism of excitation and the structure of the pulsed cathodoluminescence bands of Cr3+ Mn2+ impurity ions into minerals Optics and Spectroscopy Vol80 pp 447-458 ISSN 0030-4034
Vaysburd D Semin B Tavanov E Matlis S Balichev I amp Gering G (1982) Highenergy electronics of solid Nauka Novosibirsk Russia
Yang B Luff B amp Townsend F (1992) Chatodoluminescence of natural zircons J Phys Condens Matter Vol4 pp 5617-5624 ISSN 0953-8984
wwwintechopencom
CathodoluminescenceEdited by Dr Naoki Yamamoto
ISBN 978-953-51-0362-2Hard cover 324 pagesPublisher InTechPublished online 28 March 2012Published in print edition March 2012
InTech EuropeUniversity Campus STeP Ri Slavka Krautzeka 83A 51000 Rijeka Croatia Phone +385 (51) 770 447 Fax +385 (51) 686 166wwwintechopencom
InTech ChinaUnit 405 Office Block Hotel Equatorial Shanghai No65 Yan An Road (West) Shanghai 200040 China
Phone +86-21-62489820 Fax +86-21-62489821
Cathodoluminescence (CL) is a non-destructive technique to characterize optical and electronic properties ofnanostructures in many kinds of materials Major subject is to investigate basic parameters in semiconductorsimpurities in oxides and phase determination of minerals CL gives information on carrier concentrationdiffusion length and life time of minority carriers in semiconductors and impurity concentration and phasecomposition in composite materials This book involves 13 chapters to present the basics in the CL techniqueand applications to particles thin films and nanostructures in semiconductors oxides and minerals Thechapters covered in this book include recent development of CL technique and applications to wide range ofmaterials used in modern material science
How to referenceIn order to correctly reference this scholarly work feel free to copy and paste the following
Vladimir Solomonov and Alfiya Spirina (2012) What is the Pulsed CathodoluminescenceCathodoluminescence Dr Naoki Yamamoto (Ed) ISBN 978-953-51-0362-2 InTech Available fromhttpwwwintechopencombookscathodoluminescencewhat-is-the-pulsed-cathodoluminescence-
copy 2012 The Author(s) Licensee IntechOpen This is an open access articledistributed under the terms of the Creative Commons Attribution 30License which permits unrestricted use distribution and reproduction inany medium provided the original work is properly cited
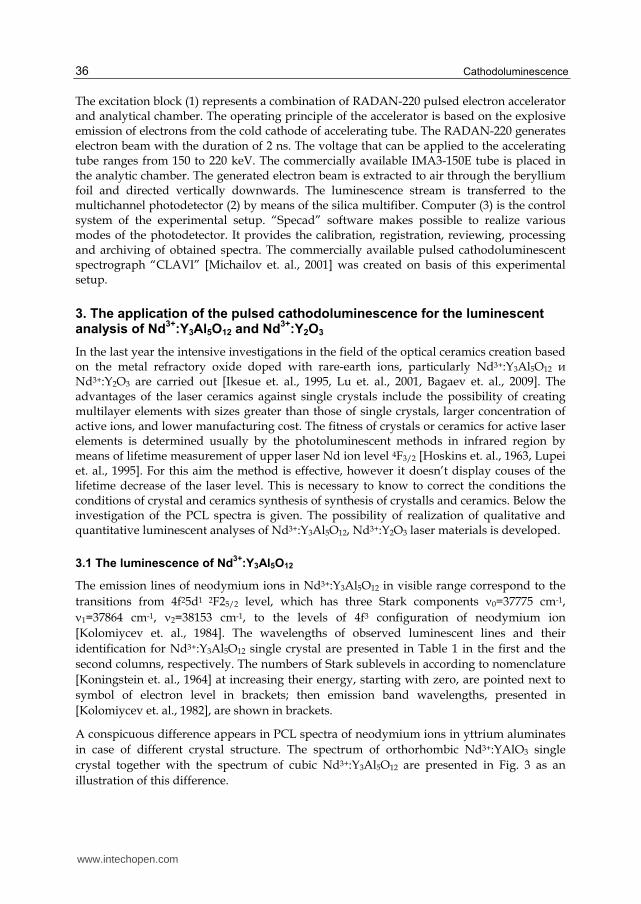
Cathodoluminescence
36
The excitation block (1) represents a combination of RADAN-220 pulsed electron accelerator and analytical chamber The operating principle of the accelerator is based on the explosive emission of electrons from the cold cathode of accelerating tube The RADAN-220 generates electron beam with the duration of 2 ns The voltage that can be applied to the accelerating tube ranges from 150 to 220 keV The commercially available IMA3-150E tube is placed in the analytic chamber The generated electron beam is extracted to air through the beryllium foil and directed vertically downwards The luminescence stream is transferred to the multichannel photodetector (2) by means of the silica multifiber Computer (3) is the control system of the experimental setup ldquoSpecadrdquo software makes possible to realize various modes of the photodetector It provides the calibration registration reviewing processing and archiving of obtained spectra The commercially available pulsed cathodoluminescent spectrograph ldquoCLAVIrdquo [Michailov et al 2001] was created on basis of this experimental setup
3 The application of the pulsed cathodoluminescence for the luminescent analysis of Nd
3+Y3Al5O12 and Nd
3+Y2O3
In the last year the intensive investigations in the field of the optical ceramics creation based on the metal refractory oxide doped with rare-earth ions particularly Nd3+Y3Al5O12 и Nd3+Y2O3 are carried out [Ikesue et al 1995 Lu et al 2001 Bagaev et al 2009] The advantages of the laser ceramics against single crystals include the possibility of creating multilayer elements with sizes greater than those of single crystals larger concentration of active ions and lower manufacturing cost The fitness of crystals or ceramics for active laser elements is determined usually by the photoluminescent methods in infrared region by means of lifetime measurement of upper laser Nd ion level 4F32 [Hoskins et al 1963 Lupei et al 1995] For this aim the method is effective however it doesnrsquot display couses of the lifetime decrease of the laser level This is necessary to know to correct the conditions the conditions of crystal and ceramics synthesis of synthesis of crystalls and ceramics Below the investigation of the PCL spectra is given The possibility of realization of qualitative and quantitative luminescent analyses of Nd3+Y3Al5O12 Nd3+Y2O3 laser materials is developed
31 The luminescence of Nd3+
Y3Al5O12
The emission lines of neodymium ions in Nd3+Y3Al5O12 in visible range correspond to the
transitions from 4f25d1 2F252 level which has three Stark components 0=37775 cm-1
1=37864 cm-1 2=38153 cm-1 to the levels of 4f3 configuration of neodymium ion
[Kolomiycev et al 1984] The wavelengths of observed luminescent lines and their
identification for Nd3+Y3Al5O12 single crystal are presented in Table 1 in the first and the
second columns respectively The numbers of Stark sublevels in according to nomenclature
[Koningstein et al 1964] at increasing their energy starting with zero are pointed next to
symbol of electron level in brackets then emission band wavelengths presented in
[Kolomiycev et al 1982] are shown in brackets
A conspicuous difference appears in PCL spectra of neodymium ions in yttrium aluminates
in case of different crystal structure The spectrum of orthorhombic Nd3+YAlO3 single
crystal together with the spectrum of cubic Nd3+Y3Al5O12 are presented in Fig 3 as an
illustration of this difference
wwwintechopencom
What is the Pulsed Cathodoluminescence
37
Nd3+Y3Al5O12 Nd3+YAlO3
nm
Identification of optical trasfer
nm Identification of optical trasfer
3899 2F252 (2)2H92 (0) (3900) 3946 2F252 (0)4F52 (2) (3946)3992 2F252 (0)2H92 (2) (3975) 3981 2F252 (0)2H92 (3) (3983) 4016 2F252 (0)2H92 (4) (4014)
4225 2D52 (2)4I92 (1) (4230) 4269 2F252 (2)4F92 (3) (4273) 4299 2F252 (1)4F92 (0) (4302) 4299 2F252 (1)4F92 (0) (4299) 4356 2F252 (0)4F92 (2) (4351) 4352 2F252 (1)4F92 (1) (4348) 4390 2D52 (0)4I92 (4) (4388) 4407 2P12 (0) 4I92 (3) (4412) 4504 2F252 (2)2H112 (3) (4505) 4504 2F252 (2)2H112 (3) (4504) 4554 2F252 (0)2H112 (1) (4559) 4560 2F252 (1)2H112 (3) (4560)4588 2F252 (0)2H112 (3) (4583)
4610 2F252 (0)2H112 (4) (4614)
4793 2F252 (1)4G52 (1) (4790) 4807 2F252 (1)4G52 (2) (4805) 4875 2F252 (0)2G72 (0) (4871) 4878 2F252 (0)2G72 (2) (4881)4944 4G112 (2)4I92 (4) (4942)
5252 2F252 (0)4G72 (0) (5249) 5254 2F252 (1)4G72 (1) (5254) 5278 2F252 (1)4G72 (2) (5278) 5380 2F252 (1)4G92 (2) (5383) 5406 2F252 (0)2K132+2G92 (2) (5410) 5395 2F252 (0)4G92 (0) (5393) 5416 2F252 (2)2K132 (2) (5420) 5457 2F252 (2)2K132 (4) (5457) 5475 2F252 (2)2K132 (5) (5475) 5491 2F252 (0)2K132+2G92 (7) (5494) 5492 2F252 (0)2K132 (0) (5490) 5545 2F252 (0)2K132 (3) (5542) 5563 2F252 (0)2K132 (4) (5562) 5574 2F252 (0)2K132+2G92 (10)(5570)
5629 2K152 (3)4I132 (0) (5626) 5636 2K132 (4)4I112(1) (5635)
5764 Superposition2G72 (23)4I92 (02) (5763)
5854 2F252 (2)4G92 (4) (5852) 5874 2F252 (0)4G92 (0) (5868)
5962 Superposition2F252 (0)4G112 (01) (5962)
6006 2F252 (0)4G112 (3) (6001)
6021 2F252(2)4G112+2K152+2D32(6)(6018) 6104 2F252(0)4G112+2K152+2D32(4)(6102) 6121 2F252(1)4G112+2K152+2D32(6)(6118) 6154 2F252(2)4G112+2K152+2D32(13)(6147) 6201 2F252 (0)2K152 (2) (6208) 6201 2F252(0)4G112+2K152+2D32(9)(6198) 6221 2F252(1)4G112+2K152+2D32(11)(6214) 6254 2F252(1)4G112+2K152+2D32(13)(6252) 6383 2H112 (1)4I92 (2) (6377) 6395 2H112 (0)4I92 (2) (6391) 6462 2H112 (3)4I92 (3) (6454) 6524 2H112 (3)4I92 (4) (6526) 6609 2G72 (3)4I112 (4) (6608) 6653 2G72 (0)4I112 (3) (6653) 6686 2G72 (0)4I112 (4) (6679)
Table 1 PCL lines and their identification for Nd3+Y3Al5O12 and Nd3+YAlO3 single crystals
wwwintechopencom
Cathodoluminescence
38
Fig 3 The PCL spectra of Nd3+Y3Al5O12 (1) and Nd3+YAlO3 (2) single crystals
The wavelengths of fundamental neodymium luminescent lines and their identification for Nd3+YAlO3 single crystal are presented in Table 1 in the third and the fourth columns respectively [Osipov et al 2011]
The Fig 3 and Table 1 show that the principal change is manifested in the considerable
increase of the luminescent band numbers in the yttrium monoaluminate spectrum This takes
place due to activation of d-f transitions between the different Stark sublevels and the
appearance of f-f transitions These changes arise from the distortion of crystalline field
symmetry in positions of individual neodymium ions that leads to the modifications of the
oscillator strength and optical transition probability Thus the distortion of crystalline field
symmetry appears in the spectrum as the change in intensity and numbers of emission bands
The differences in the spectra can be used for the determination of the second phase content in Nd3+Y3Al5O12 [Osipov et al 2011] The luminescence lightsum in the spectrum region
from 1 to 2 (2
1
( )S I d
) can be presented by the additive function depended from the
dominant phase content Cg (cubic Nd3+Y3Al5O12) and the second phase Cim=1-Cg
(1 )g gS C C (8)
where and are the coefficients of proportionality They are determined by the integration range and excitation conditions To eliminate the influence of the intensity instability it is necessary to use the ratio of lightsums (S1S2) as the analytical parameter calculated for two ranges of the spectrum The lightsums in the ranges 350-500 nm (S1) and 501-650 nm (S2) to obtain the functional relation between the Cg and the luminescence intensity of neodymium ions have been chosen In that case in accordance with Eq (8) the content of cubic phase into Nd3+Y3Al5O12 is defined the following equation
wwwintechopencom
What is the Pulsed Cathodoluminescence
39
1
1 22
12 2 1 2
2( ) ( )
g
SS
CS
S
(9)
In Fig 4 the correlation between the Cg and S1S2 calculated for the samples with known content of cubic phase is shown
Fig 4 The correlation between the Cg and S1S2
This dependence (Fig 4) is approximated by the following equation with the r2gt099
1
2
1
2
1071 0084
0069g
SS
CS
S
(10)
Moreover the obtained data validity was checked out by the analysis of samples with electron and optical microscopes
32 The luminescence of Y2O3 Nd3+
Y2O3
The wide band of intrinsic radiation in visible range is a visiting luminescent card of pure yttria Earlier the other authors observed this band at different excitation type [Conor 1964 Kuznetsov et al 1978 Bordun et al 1995] Even at cryogenic temperature of the samples the unresolved band was registered
We investigated commercially available yttria powders with a particle sizes of 1-3 m and 5-
10 m All the powders have a cubic lattice of the -Y2O3 From these commercial powders nanopowders with the average particle size of 10-12 nm were prepared by the laser
evaporation method Particles were crystallized in the metastable monoclinic phase -Y2O3
After annealing they transformed to the -Y2O3
wwwintechopencom
Cathodoluminescence
40
The spectrum of the powder with particle size of 1-3 m has a broad asymetric band peaked at 437 nm and long ndash wavelength wing shows local maxima (Fig 5 curve 1)
Fig 5 PCL spectra of commercial yttria powders with particle size 1-3 m (1) 5-10 m (2) and nanopowders with the average particle size of 10-12 nm (3)
In the spectrum of the powder with the particle size of 5-10 m almost all local maxima are transformed into narrow bands (Fig 5 curve 2) They are grouped into four series 435 ndash 510 nm (the blue series) 515 ndash 640 nm (the orange series) 645 ndash 700 nm (the red series) and 785 ndash 840 nm (the infrared series) The PCL spectra of nanopowders irrespective of the crystal
phase (either the -Y2O3 or the -Y2O3 phase) and of the initial coarse powder have a similar structures (Fig 3 curve 3) The broad band with the maximum at 485 nm dominates in these spectra The peak range of this band exhibits local maxima of the blue series Also the lines of orange series at 573 583 612 nm become apparent The red series is weak while the infrared series is hardly seen
The range of the band series observed in the spectra of pulsed cathodoluminescence corresponds to the range of intrinsic radiation of yttria which is identified as the radiation of associated donor-acceptor pairs Y3+ - O2- [Bordun 2002]
Since the luminescence wavelengths of narrow bands of commercial powders nanopowders coincide we can assume that these materials contain intrinsic luminescence centers of the same type
The series of PCL bands of yttria resemble the radiation of free YO radicals which is observed for example in laser plume of yttria-containing target [Osipov et al 2005] This radical has been fairly well studied [Pearse et al 1949] The Table 2 shows the wavelengths of the bands observed in PCL spectra and their identification In the second column of this table the wavelengths of the strongest bands are in boldface
wwwintechopencom
What is the Pulsed Cathodoluminescence
41
Intrinsic luminescence center
VrsquoVrsquorsquo nm
Blue band series the electronic transition B2X2
00 4538
22 4586
33 4611
01 4706
23 4752
02 4887
Orange band series the electronic transition A2X2
20+(Tg+Ag)=380 5428
10 5516
10+(Tg+Ag)=380 5635
00 5729
33 5836
01 6000
34 6122
02 6293
Red band series the electronic transition A2X2
03-(Tg+Ag)=162 6553
03 6624
03+(Tg+Ag)=162 6696
03+Tg=469 6838
Infrared band series the electronic transition A2X2
05+(Tg+Ag)=380 7608
06 7850
8011
8184
Table 2 Parameters of the PCL lines in the yttria spectrum
Based on these data we constructed the energy scheme of the intrinsic luminescence center (Fig 6) Qualitatively this scheme coincides with that of the YO free radicals In this scheme the configuration curves were calculated in the harmonic oscilator approximation as
216 20
0
210 ( )i
i i i
c mE E r
h
(11)
where i =X A and B denotes the electronic states X2 A2 and B2 E0i I and i are the minimal energy the equilibrium distance and the wavenumber of the vibration mode of ith electronic state respectively m0 is the mass of the oxygen atom c and h are the light speed
and Planckrsquos constant The energy E and wavenumbers i are expressed in (11) in reciprocal
centimetres the amplitudes of the (r-i) vibrations are given in nanometres
wwwintechopencom
Cathodoluminescence
42
Fig 6 Energy scheme of the intrinsic luminescence center
For the configuration curves of the X2 A2 and B2 states (Fig 6) E0i=0 17510 and 22090
cm-1 and i=786 675 and 675 cm-1 respectively With these parameters up to the measurement error the wavelengths of pulsed cathodoluminescence coincide with the wavelengths of the optical transitions shown in Table 2 The Franck ndash Condon principle for
molecular transitions is most precisely implemented at A=X+10870910-3 nm and
B=X+1235110-3 nm and X can be estimated as half of elementary cube edge X=01385 nm For electronic ndash vibration transitions for which one of the vibration quantum numbers V is large this principle is implemented only if these transitions involve the most strong phonons [Schaak et al 1970] Table 2 Under these parameters the configuration curves of
the electronic states A2 and B2 intersect at the point with E=25256 cm-1
The qualitative coincidence of the emission bands and the energy structure of intrinsic luminescence centres observed by us and YO free radicals allow us to conclude that intrinsic luminescence centres in yttria contain bound YO radicals [Osipov et al 2008] Consider the possibility of formation of such intrinsic luminescence centre It is known [Schaak et al 1970] that the cubic yttria has unit cell composed of 16 formula units Y2O3 Twenty four cations occupy positions with C2 symmetry and eight cations occupy the positions with C3i symmetry (Fig 7) Every cation is surrounded by six oxygen ions which are positioned on the corners of deformed cube with the edge size of 02702 nm at that two corners is unoccupied Thus in one-third of the cubes (YO6) two oxygen vacancies are located at the cube corners along the face diagonal while in the remaining cubes they are located along the body diagonal (Fig 7)
For such packing a structure presented in Fig 8 can be formed at the outer cube face that contains two oxygen vacancies and that is located at the crystal boundary In essence this structure is the YO radical bound to the crystal lattice by the yttriun ion On such surfaces
the fraction of faces with two oxygen vacancies is 1316=118 and the average distance
wwwintechopencom
What is the Pulsed Cathodoluminescence
43
between them is about 5 nm All of this leads to the dependence of the luminescence spectrum of such bound radicals on the particle size of yttria mainly via their shape
Fig 7 The unit cell of yttria The yttrium positions with C3i and C2 symmetry designated by red and pink balls respectively The oxygen and the vacant positions designated by blue and grey balls The vacant positions are associated by green dot line
Fig 8 The structure of intrinsic luminescence centre
The considered above intrinsic luminescence centre also presents in Nd3+Y2O3 However the presence of neodymium results in decrease of the intrinsic band intensity and distortion of its profile We studied the monoclinic and cubic Nd3+Y2O3 nanopowders The nanopowders
were prepared using a mixture of micropowder -Y2O3 phase and 1 mol Nd2O3 powder After evaporation of this mixture by CO2 laser Nd3+Y2O3 nanoparticles were crystallized into monoclinic phase To transfer nanopowders into cubic phase annealing in air was
carried out above 900C [Kotov et al 2002]
wwwintechopencom
Cathodoluminescence
44
The PCL spectra of all Nd3+Y2O3 samples contain emission lines of neodymium ions which have not been previously observed in photoluminescence Namely neodymium doped nanopowders exhibit a strong band peaking at 825 nm (Fig 9)
Fig 9 The PCL spectra of monoclinic (1) and cubic (2) Nd3+Y2O3 nanopowders
Its components correspond well to the 4F524I92 (825 811 834 nm) and 2H924I92 (818 nm) optical transitions between Nd3+ Starkrsquos sublevels with the energies in Y2O3 cubic lattice [Chang 1966] These components are resolved only in cubic samples (Fig 9) Therefore the splitting of Starkrsquos components allows us to conclude about the presence of the dominant phase into Nd3+Y2O3
To check this assumption the additional investigations were made In Fig 10 the PCL spectra of pressed nanopowders (compacts) are presented The compacts were annealed at
530 750 950 1100 and 1300C The X-ray analysis for this samples showed that the
unannealed compact and annealed compact at 530C have monoclinic phase all remaining compacts are cubic samples It is shown that the splitting of neodymium band at region of 800-840 nm only takes place in cubic samples and one component appears at 825 nm in monoclinic samples
In addition to the band in the region of 800-840 nm two emission bands of neodymium ions
arise in the Nd3+Y2O3 These are a weak band at 720 nm due to 4F924I92 transition and stronger band at 750 nm with the components due to the transitions between the Stark
sublevels 4F724I92 and 4S32 4I92
The intensity weaking of intrinsic band into Nd3+Y2O3 is associated with the quantitative decrease of this centres since the part of yttrium ions are replaced by the neodymium ions The distortion of the intrinsic band is determined by the neodymium absorption of it The most absorption is observed in region at 560-613 nm [Osipov et al 2009]
wwwintechopencom
What is the Pulsed Cathodoluminescence
45
In addition to the present bands into Nd3+Y2O3 the appearance of four well-resolved components in the range of 610-660 nm can be seen The specta of this band for compacts
annealed at 950 and 1300C are presented in Fig 11 The band contains the following four narrow lines at 6206 6306 6453 6556 nm which we identify using Raman spectra as
luminescence of oxygen molecular ion 2O [Solomonov et al 2011]
Fig 10 The PCL spectra of unannealed compact (1) and compacts annealed at 530C (2)
750C (3) 950C (4) 1100C (5) 1300C (6)
wwwintechopencom
Cathodoluminescence
46
The bands with the frequencies of 1615 and 1702 cm-1 correspond to vibrations of the molecular ion in the ground state while the frequencies at 966 and 993 cm-1 correspond to the excited state for the two sites of the oxygen molecular ion in the yttria lattice
Fig 12 demonstrates two sites of defects 2O taking into account the occurrence of two types
of natural vacancies about we talked earlier
Fig 11 The PCL of oxygen molecular ions
Fig 12 Two sites of oxygen molecular ions defects in lattice of cubic Y2O3
Fig 13 presents two potentional curves and formation of luminescence bands The lowest
excited state A2u of the oxygen molecular ion can be stabilized
The observed luminescence band results of the transition from the vibration level Vrsquo=0 of
the excited electronic state A2u to one vibration level Vrsquorsquo=3 of the ground state X2g The
wwwintechopencom
What is the Pulsed Cathodoluminescence
47
bands at 6306 and 6556 nm are formed due to the transition to the vibration level of the groun state with the participation of lattice phonons For the first curve the phonon energy is 255 cm while for the second curve it is 244 cm-1 These phonons are observed in the Raman spectrum The excited electronic state of the molecular ion is spaced from the ground state by 20660-21580 cm-1 [Solomonov et al 2011]
Fig 13 Configuration curves for two sites of oxygen molecular ions
On the basis of the qualitative luminescent analysis of Nd3+Y2O3 the determination of neodymium concentration by means of the calibration curve construction is possible
because of intensity of neodymium lines is proportional to it concentration INd(i)=aiCNd (for example 750 or 825 nm) However we canrsquot use this equation because PCL spectrum is characterized by the instability Therefore we also chose lightsums ratio as analytic parameter in regions of 730-840 nm and 350-840 nm The first region of Nd3+Y2O3 spectrum involves only neodymium bands but the second one includes in addition the intrinsic band which is distorted by the neodymium absorption and can be ascribed as follows
wwwintechopencom
Cathodoluminescence
48
0
1 exp( )( ) i Nd
YO i ii Nd
k C lI I
k C (12)
Here I0i l ki are the intensity of i ndash intrinsic band without absorption the thickness of samples coefficient of absorption of i ndash band respectively Hence relation of lightsums ratio (S(350-840)S(730-840)) with CNd has to include the equation (12) Really this relation is decribed by the following equation
2
1 exp( )(350 840)
(730 840)Nd
Nd
B CSA D
S C
(13)
Fig 14 demonstrates the calibration curve (r2gt099) for the determination of neodymium concentration in region of 011 ndash 107 at
Fig 14 The calibration curve for the determination of neodymium concentration in region of 011 ndash 107 at
4 Conclusion
Thus the possibility of realization of rapid nondestructive qualitative and quantitative luminescent analyses of laser materials in particular Nd3+Y3Al5O12 Nd3+Y2O3 with the help of pulsed cathodoluminescence was shown
5 References
Bagaev S Osipov V Ivanov M Solomonov V Platonov V Orlov A Rasuleva A amp Vatnik S (2009)Fabrication and characteristics of neodymium ndash activated yttrium oxide optical ceramics Optical Materials Vol31 pp 740-743 ISSN 0925-3467
wwwintechopencom
What is the Pulsed Cathodoluminescence
49
Bogdankevich O Darznik S amp Eliseev P (1975) Semiconductor lasers Nauka Moscow Russia
Bordun O Bordun I amp Novosad S (1995) Luminescence centres into Y2O3 Journal of applied spectroscopy Vol62 No6 pp 91-95 ISSN 0021-9037
Bordun O (2002) Influence of oxygen vacancies on the luminescence spectra of thin Y2O3 films Journal of applied spectroscopy Vol69 No3 pp 371-374 ISSN 0021-9037
Chang N (1966) Energy levels and crystal ndash field splittings of Nd3+ in yttrium oxide J Chem Phys Vol44 pp 4044-4050 ISSN 0021-9606
Chukichev M Sabri D Sokolov V amp Surcova T (1990) Cathodoluminescence of solid solution Zn1-xMnxSe Optics and Spectroscopy Vol68 pp 2000-2021 ISSN 0030-4034
Connor O (1964) A theory of thermoluminescence of fluorite (CaF2Y) Radiative recombination from highly associated electron ndash hole pairs Appl Phys Lett Vol4 No1 pp 126-129 ISSN 0003-6951
Galkin G (1981) The interband processes of the recombination into semiconductors at high excitation level Proceedings of the PN Lebedev Physical Institute (Trudi FIAN) Vol128 pp 3-64
Hoskins H amp Soffer B (1963) Stimulated emission from Y2O3Nd3+ Appl Phys Lett Vol4 pp 22-23 ISSN 0003-6951
Ikesue A Kinoshita T Kamata K amp Yoshida K (1995) Fabrication and optical properties of high-performance polycrystalline NdYAG ceramics for solid-state lasers J Amer Ceram Soc Vol78 pp 1033-1040 ISSN 1551-2916
Kolomiycev A Meylman M Volodina I Chukichev M Smagin A amp Bagdasarov H (1982) Luminescence of neodymium ndash activated yttrium ndash aluminum garnet crystals in ultra-violet and visible ranges at high energy excitation Deposition in VINITI No 5995-82 pp 1-15
Kolomiycev A Meylman M Volodina I Chukichev M Smagin A amp Bagdasarov H (1984) Luminescence of neodymium ndash activated yttrium ndash aluminum garnet crystals in ultra-violet and visible ranges at high energy excitation Optics and Spectroscopy Vol56 pp 365-367 ISSN 0030-4034
Koningstein J amp Geusic J (1964)Energy levels and crystal ndash field calculations of neodymium in yttrium aluminum garnet Phys Rev Vol136 No 3A pp 711-716 ISSN 1893-1912
Kotov Yu Osipov V Ivanov M Samatov O Platonov V Azarkevich E Murzakayev A amp Medvedev A (2002) Properties of oxide nanopowders prepared by target evaporation with a pulse ndash periodic CO2 laser Technical Physics Vol47 No11 pp 1420-1426 ISSN 1063-7842
Kuznetsov A Abramov V Rooze N amp Savikhina T (1978) Autolocalized excitons into Y2O3 JETP Letters Vol28 No10 pp 602-605 ISSN 0021-3640
Lu J Murai T Takaichi K Ueda K Yagi H Yanagitani T amp Kaminskii A (2001) Nd3+Y2O3 ceramic laser Jpn J Appl Phys Vol40 pp 1277-1279 ISSN 0021-4922
Lupei V Lupei A Tiseanu C Georgescu S Stoicescu C amp Nanau P (1995) High ndash resolution optical spectroscopy of YAG Nd A test for structural and distribution models Phys Rev B Vol51 No1 pp 8-17 ISSN 0003-6951
Mesyats G (1974) Generating of highpower nanosecond pulses The Soviet radio Moscow Russia
wwwintechopencom
Cathodoluminescence
50
Mesyats G Shpak V Yalandin M amp Shunailov S (1992) Compact RADAN electron accelerators for testing new radiation technologies and sterilization Radiat Phys Chem Vol46 pp 489-492 ISSN 0969-806X
Michailov S Osipov V amp Solomonov V (2001) Pulsed cathodoluminescent analyzer of materials Pribory i tekhnika eksperimenta No3 pp 164-165 ISSN 0032-8162
Osipov V Solomonov V Platonov V Snigireva O Ivanov V amp Lisenkov V (2005) Laser plume spectroscopy 2 Graphite yttrium ndash stabilized and zirconium oxide targets Quantum Electron Vol35 No7 pp 633-637 ISSN 0368-7147
Osipov V Rasuleva A amp Solomonov V (2008) Luminescence of pure yttria Optics and Spectroscopy Vol105 No4 pp 524-530 ISSN 0030-400X
Osipov V Solomonov V Spirina A Ivanov M amp Orlov A (2009) Luminescence of yttrium oxide doped with neodymium Optics and Spectroscopy Vol106 No1 pp 78-83 ISSN 0030-400X
Osipov V Solomonov V amp Spirina A (2011) Luminescent investigation of neodymium doped yttrium aluminates J of Optical Technology Vol78 No6 pp 81-87 ISSN 0030-4042
Pearse R amp Gaydon A (1949) The identification of molecular spectra Inostrannaya Literatura Moscow Russia
Petrov V (1996) Cathodoluminescent microscopy Physics - Uspekhi Vol39 pp 807-818 ISSN 0042-1294
Ramseyer K Fisher J Matter A Eberhardt P amp Geiss J (1989) A cathodoluminescence microscope for low intensity luminescence Journal of Sedimentary Research Vol59 pp 619-622 ISSN 0022-4472
Ramseyer K amp Millis J (1990) Factors influencing short-lived blue cathodoluminescence in
- quartz Journal of Sedimentary Research Vol59 pp 619-622 ISSN 0003-004X Schaak G amp Koningstein J (1970) Phonon and electronic raman spectra of cubic rare-earth
oxides and isomorphous ittrium oxide J Opt Soc Amer Vol60 No8 pp 1110-1115 ISSN 1551-2916
Solomonov V amp Michailov S (2003) Pulsed cathodoluminescence and its application for the analysis of condensed substances UB RAS ISBN 5-7691-1357-X Yekaterinburg Russia
Solomonv V (2003) Kinetics of pulsed cathodoluminescence Optics and Spectroscopy Vol95 pp 248-254 ISSN 0030-4034
Solomonv V Michailov S amp Deykun A (1996) About the mecanism of excitation and the structure of the pulsed cathodoluminescence bands of Cr3+ Mn2+ impurity ions into minerals Optics and Spectroscopy Vol80 pp 447-458 ISSN 0030-4034
Vaysburd D Semin B Tavanov E Matlis S Balichev I amp Gering G (1982) Highenergy electronics of solid Nauka Novosibirsk Russia
Yang B Luff B amp Townsend F (1992) Chatodoluminescence of natural zircons J Phys Condens Matter Vol4 pp 5617-5624 ISSN 0953-8984
wwwintechopencom
CathodoluminescenceEdited by Dr Naoki Yamamoto
ISBN 978-953-51-0362-2Hard cover 324 pagesPublisher InTechPublished online 28 March 2012Published in print edition March 2012
InTech EuropeUniversity Campus STeP Ri Slavka Krautzeka 83A 51000 Rijeka Croatia Phone +385 (51) 770 447 Fax +385 (51) 686 166wwwintechopencom
InTech ChinaUnit 405 Office Block Hotel Equatorial Shanghai No65 Yan An Road (West) Shanghai 200040 China
Phone +86-21-62489820 Fax +86-21-62489821
Cathodoluminescence (CL) is a non-destructive technique to characterize optical and electronic properties ofnanostructures in many kinds of materials Major subject is to investigate basic parameters in semiconductorsimpurities in oxides and phase determination of minerals CL gives information on carrier concentrationdiffusion length and life time of minority carriers in semiconductors and impurity concentration and phasecomposition in composite materials This book involves 13 chapters to present the basics in the CL techniqueand applications to particles thin films and nanostructures in semiconductors oxides and minerals Thechapters covered in this book include recent development of CL technique and applications to wide range ofmaterials used in modern material science
How to referenceIn order to correctly reference this scholarly work feel free to copy and paste the following
Vladimir Solomonov and Alfiya Spirina (2012) What is the Pulsed CathodoluminescenceCathodoluminescence Dr Naoki Yamamoto (Ed) ISBN 978-953-51-0362-2 InTech Available fromhttpwwwintechopencombookscathodoluminescencewhat-is-the-pulsed-cathodoluminescence-
copy 2012 The Author(s) Licensee IntechOpen This is an open access articledistributed under the terms of the Creative Commons Attribution 30License which permits unrestricted use distribution and reproduction inany medium provided the original work is properly cited
What is the Pulsed Cathodoluminescence
37
Nd3+Y3Al5O12 Nd3+YAlO3
nm
Identification of optical trasfer
nm Identification of optical trasfer
3899 2F252 (2)2H92 (0) (3900) 3946 2F252 (0)4F52 (2) (3946)3992 2F252 (0)2H92 (2) (3975) 3981 2F252 (0)2H92 (3) (3983) 4016 2F252 (0)2H92 (4) (4014)
4225 2D52 (2)4I92 (1) (4230) 4269 2F252 (2)4F92 (3) (4273) 4299 2F252 (1)4F92 (0) (4302) 4299 2F252 (1)4F92 (0) (4299) 4356 2F252 (0)4F92 (2) (4351) 4352 2F252 (1)4F92 (1) (4348) 4390 2D52 (0)4I92 (4) (4388) 4407 2P12 (0) 4I92 (3) (4412) 4504 2F252 (2)2H112 (3) (4505) 4504 2F252 (2)2H112 (3) (4504) 4554 2F252 (0)2H112 (1) (4559) 4560 2F252 (1)2H112 (3) (4560)4588 2F252 (0)2H112 (3) (4583)
4610 2F252 (0)2H112 (4) (4614)
4793 2F252 (1)4G52 (1) (4790) 4807 2F252 (1)4G52 (2) (4805) 4875 2F252 (0)2G72 (0) (4871) 4878 2F252 (0)2G72 (2) (4881)4944 4G112 (2)4I92 (4) (4942)
5252 2F252 (0)4G72 (0) (5249) 5254 2F252 (1)4G72 (1) (5254) 5278 2F252 (1)4G72 (2) (5278) 5380 2F252 (1)4G92 (2) (5383) 5406 2F252 (0)2K132+2G92 (2) (5410) 5395 2F252 (0)4G92 (0) (5393) 5416 2F252 (2)2K132 (2) (5420) 5457 2F252 (2)2K132 (4) (5457) 5475 2F252 (2)2K132 (5) (5475) 5491 2F252 (0)2K132+2G92 (7) (5494) 5492 2F252 (0)2K132 (0) (5490) 5545 2F252 (0)2K132 (3) (5542) 5563 2F252 (0)2K132 (4) (5562) 5574 2F252 (0)2K132+2G92 (10)(5570)
5629 2K152 (3)4I132 (0) (5626) 5636 2K132 (4)4I112(1) (5635)
5764 Superposition2G72 (23)4I92 (02) (5763)
5854 2F252 (2)4G92 (4) (5852) 5874 2F252 (0)4G92 (0) (5868)
5962 Superposition2F252 (0)4G112 (01) (5962)
6006 2F252 (0)4G112 (3) (6001)
6021 2F252(2)4G112+2K152+2D32(6)(6018) 6104 2F252(0)4G112+2K152+2D32(4)(6102) 6121 2F252(1)4G112+2K152+2D32(6)(6118) 6154 2F252(2)4G112+2K152+2D32(13)(6147) 6201 2F252 (0)2K152 (2) (6208) 6201 2F252(0)4G112+2K152+2D32(9)(6198) 6221 2F252(1)4G112+2K152+2D32(11)(6214) 6254 2F252(1)4G112+2K152+2D32(13)(6252) 6383 2H112 (1)4I92 (2) (6377) 6395 2H112 (0)4I92 (2) (6391) 6462 2H112 (3)4I92 (3) (6454) 6524 2H112 (3)4I92 (4) (6526) 6609 2G72 (3)4I112 (4) (6608) 6653 2G72 (0)4I112 (3) (6653) 6686 2G72 (0)4I112 (4) (6679)
Table 1 PCL lines and their identification for Nd3+Y3Al5O12 and Nd3+YAlO3 single crystals
wwwintechopencom
Cathodoluminescence
38
Fig 3 The PCL spectra of Nd3+Y3Al5O12 (1) and Nd3+YAlO3 (2) single crystals
The wavelengths of fundamental neodymium luminescent lines and their identification for Nd3+YAlO3 single crystal are presented in Table 1 in the third and the fourth columns respectively [Osipov et al 2011]
The Fig 3 and Table 1 show that the principal change is manifested in the considerable
increase of the luminescent band numbers in the yttrium monoaluminate spectrum This takes
place due to activation of d-f transitions between the different Stark sublevels and the
appearance of f-f transitions These changes arise from the distortion of crystalline field
symmetry in positions of individual neodymium ions that leads to the modifications of the
oscillator strength and optical transition probability Thus the distortion of crystalline field
symmetry appears in the spectrum as the change in intensity and numbers of emission bands
The differences in the spectra can be used for the determination of the second phase content in Nd3+Y3Al5O12 [Osipov et al 2011] The luminescence lightsum in the spectrum region
from 1 to 2 (2
1
( )S I d
) can be presented by the additive function depended from the
dominant phase content Cg (cubic Nd3+Y3Al5O12) and the second phase Cim=1-Cg
(1 )g gS C C (8)
where and are the coefficients of proportionality They are determined by the integration range and excitation conditions To eliminate the influence of the intensity instability it is necessary to use the ratio of lightsums (S1S2) as the analytical parameter calculated for two ranges of the spectrum The lightsums in the ranges 350-500 nm (S1) and 501-650 nm (S2) to obtain the functional relation between the Cg and the luminescence intensity of neodymium ions have been chosen In that case in accordance with Eq (8) the content of cubic phase into Nd3+Y3Al5O12 is defined the following equation
wwwintechopencom
What is the Pulsed Cathodoluminescence
39
1
1 22
12 2 1 2
2( ) ( )
g
SS
CS
S
(9)
In Fig 4 the correlation between the Cg and S1S2 calculated for the samples with known content of cubic phase is shown
Fig 4 The correlation between the Cg and S1S2
This dependence (Fig 4) is approximated by the following equation with the r2gt099
1
2
1
2
1071 0084
0069g
SS
CS
S
(10)
Moreover the obtained data validity was checked out by the analysis of samples with electron and optical microscopes
32 The luminescence of Y2O3 Nd3+
Y2O3
The wide band of intrinsic radiation in visible range is a visiting luminescent card of pure yttria Earlier the other authors observed this band at different excitation type [Conor 1964 Kuznetsov et al 1978 Bordun et al 1995] Even at cryogenic temperature of the samples the unresolved band was registered
We investigated commercially available yttria powders with a particle sizes of 1-3 m and 5-
10 m All the powders have a cubic lattice of the -Y2O3 From these commercial powders nanopowders with the average particle size of 10-12 nm were prepared by the laser
evaporation method Particles were crystallized in the metastable monoclinic phase -Y2O3
After annealing they transformed to the -Y2O3
wwwintechopencom
Cathodoluminescence
40
The spectrum of the powder with particle size of 1-3 m has a broad asymetric band peaked at 437 nm and long ndash wavelength wing shows local maxima (Fig 5 curve 1)
Fig 5 PCL spectra of commercial yttria powders with particle size 1-3 m (1) 5-10 m (2) and nanopowders with the average particle size of 10-12 nm (3)
In the spectrum of the powder with the particle size of 5-10 m almost all local maxima are transformed into narrow bands (Fig 5 curve 2) They are grouped into four series 435 ndash 510 nm (the blue series) 515 ndash 640 nm (the orange series) 645 ndash 700 nm (the red series) and 785 ndash 840 nm (the infrared series) The PCL spectra of nanopowders irrespective of the crystal
phase (either the -Y2O3 or the -Y2O3 phase) and of the initial coarse powder have a similar structures (Fig 3 curve 3) The broad band with the maximum at 485 nm dominates in these spectra The peak range of this band exhibits local maxima of the blue series Also the lines of orange series at 573 583 612 nm become apparent The red series is weak while the infrared series is hardly seen
The range of the band series observed in the spectra of pulsed cathodoluminescence corresponds to the range of intrinsic radiation of yttria which is identified as the radiation of associated donor-acceptor pairs Y3+ - O2- [Bordun 2002]
Since the luminescence wavelengths of narrow bands of commercial powders nanopowders coincide we can assume that these materials contain intrinsic luminescence centers of the same type
The series of PCL bands of yttria resemble the radiation of free YO radicals which is observed for example in laser plume of yttria-containing target [Osipov et al 2005] This radical has been fairly well studied [Pearse et al 1949] The Table 2 shows the wavelengths of the bands observed in PCL spectra and their identification In the second column of this table the wavelengths of the strongest bands are in boldface
wwwintechopencom
What is the Pulsed Cathodoluminescence
41
Intrinsic luminescence center
VrsquoVrsquorsquo nm
Blue band series the electronic transition B2X2
00 4538
22 4586
33 4611
01 4706
23 4752
02 4887
Orange band series the electronic transition A2X2
20+(Tg+Ag)=380 5428
10 5516
10+(Tg+Ag)=380 5635
00 5729
33 5836
01 6000
34 6122
02 6293
Red band series the electronic transition A2X2
03-(Tg+Ag)=162 6553
03 6624
03+(Tg+Ag)=162 6696
03+Tg=469 6838
Infrared band series the electronic transition A2X2
05+(Tg+Ag)=380 7608
06 7850
8011
8184
Table 2 Parameters of the PCL lines in the yttria spectrum
Based on these data we constructed the energy scheme of the intrinsic luminescence center (Fig 6) Qualitatively this scheme coincides with that of the YO free radicals In this scheme the configuration curves were calculated in the harmonic oscilator approximation as
216 20
0
210 ( )i
i i i
c mE E r
h
(11)
where i =X A and B denotes the electronic states X2 A2 and B2 E0i I and i are the minimal energy the equilibrium distance and the wavenumber of the vibration mode of ith electronic state respectively m0 is the mass of the oxygen atom c and h are the light speed
and Planckrsquos constant The energy E and wavenumbers i are expressed in (11) in reciprocal
centimetres the amplitudes of the (r-i) vibrations are given in nanometres
wwwintechopencom
Cathodoluminescence
42
Fig 6 Energy scheme of the intrinsic luminescence center
For the configuration curves of the X2 A2 and B2 states (Fig 6) E0i=0 17510 and 22090
cm-1 and i=786 675 and 675 cm-1 respectively With these parameters up to the measurement error the wavelengths of pulsed cathodoluminescence coincide with the wavelengths of the optical transitions shown in Table 2 The Franck ndash Condon principle for
molecular transitions is most precisely implemented at A=X+10870910-3 nm and
B=X+1235110-3 nm and X can be estimated as half of elementary cube edge X=01385 nm For electronic ndash vibration transitions for which one of the vibration quantum numbers V is large this principle is implemented only if these transitions involve the most strong phonons [Schaak et al 1970] Table 2 Under these parameters the configuration curves of
the electronic states A2 and B2 intersect at the point with E=25256 cm-1
The qualitative coincidence of the emission bands and the energy structure of intrinsic luminescence centres observed by us and YO free radicals allow us to conclude that intrinsic luminescence centres in yttria contain bound YO radicals [Osipov et al 2008] Consider the possibility of formation of such intrinsic luminescence centre It is known [Schaak et al 1970] that the cubic yttria has unit cell composed of 16 formula units Y2O3 Twenty four cations occupy positions with C2 symmetry and eight cations occupy the positions with C3i symmetry (Fig 7) Every cation is surrounded by six oxygen ions which are positioned on the corners of deformed cube with the edge size of 02702 nm at that two corners is unoccupied Thus in one-third of the cubes (YO6) two oxygen vacancies are located at the cube corners along the face diagonal while in the remaining cubes they are located along the body diagonal (Fig 7)
For such packing a structure presented in Fig 8 can be formed at the outer cube face that contains two oxygen vacancies and that is located at the crystal boundary In essence this structure is the YO radical bound to the crystal lattice by the yttriun ion On such surfaces
the fraction of faces with two oxygen vacancies is 1316=118 and the average distance
wwwintechopencom
What is the Pulsed Cathodoluminescence
43
between them is about 5 nm All of this leads to the dependence of the luminescence spectrum of such bound radicals on the particle size of yttria mainly via their shape
Fig 7 The unit cell of yttria The yttrium positions with C3i and C2 symmetry designated by red and pink balls respectively The oxygen and the vacant positions designated by blue and grey balls The vacant positions are associated by green dot line
Fig 8 The structure of intrinsic luminescence centre
The considered above intrinsic luminescence centre also presents in Nd3+Y2O3 However the presence of neodymium results in decrease of the intrinsic band intensity and distortion of its profile We studied the monoclinic and cubic Nd3+Y2O3 nanopowders The nanopowders
were prepared using a mixture of micropowder -Y2O3 phase and 1 mol Nd2O3 powder After evaporation of this mixture by CO2 laser Nd3+Y2O3 nanoparticles were crystallized into monoclinic phase To transfer nanopowders into cubic phase annealing in air was
carried out above 900C [Kotov et al 2002]
wwwintechopencom
Cathodoluminescence
44
The PCL spectra of all Nd3+Y2O3 samples contain emission lines of neodymium ions which have not been previously observed in photoluminescence Namely neodymium doped nanopowders exhibit a strong band peaking at 825 nm (Fig 9)
Fig 9 The PCL spectra of monoclinic (1) and cubic (2) Nd3+Y2O3 nanopowders
Its components correspond well to the 4F524I92 (825 811 834 nm) and 2H924I92 (818 nm) optical transitions between Nd3+ Starkrsquos sublevels with the energies in Y2O3 cubic lattice [Chang 1966] These components are resolved only in cubic samples (Fig 9) Therefore the splitting of Starkrsquos components allows us to conclude about the presence of the dominant phase into Nd3+Y2O3
To check this assumption the additional investigations were made In Fig 10 the PCL spectra of pressed nanopowders (compacts) are presented The compacts were annealed at
530 750 950 1100 and 1300C The X-ray analysis for this samples showed that the
unannealed compact and annealed compact at 530C have monoclinic phase all remaining compacts are cubic samples It is shown that the splitting of neodymium band at region of 800-840 nm only takes place in cubic samples and one component appears at 825 nm in monoclinic samples
In addition to the band in the region of 800-840 nm two emission bands of neodymium ions
arise in the Nd3+Y2O3 These are a weak band at 720 nm due to 4F924I92 transition and stronger band at 750 nm with the components due to the transitions between the Stark
sublevels 4F724I92 and 4S32 4I92
The intensity weaking of intrinsic band into Nd3+Y2O3 is associated with the quantitative decrease of this centres since the part of yttrium ions are replaced by the neodymium ions The distortion of the intrinsic band is determined by the neodymium absorption of it The most absorption is observed in region at 560-613 nm [Osipov et al 2009]
wwwintechopencom
What is the Pulsed Cathodoluminescence
45
In addition to the present bands into Nd3+Y2O3 the appearance of four well-resolved components in the range of 610-660 nm can be seen The specta of this band for compacts
annealed at 950 and 1300C are presented in Fig 11 The band contains the following four narrow lines at 6206 6306 6453 6556 nm which we identify using Raman spectra as
luminescence of oxygen molecular ion 2O [Solomonov et al 2011]
Fig 10 The PCL spectra of unannealed compact (1) and compacts annealed at 530C (2)
750C (3) 950C (4) 1100C (5) 1300C (6)
wwwintechopencom
Cathodoluminescence
46
The bands with the frequencies of 1615 and 1702 cm-1 correspond to vibrations of the molecular ion in the ground state while the frequencies at 966 and 993 cm-1 correspond to the excited state for the two sites of the oxygen molecular ion in the yttria lattice
Fig 12 demonstrates two sites of defects 2O taking into account the occurrence of two types
of natural vacancies about we talked earlier
Fig 11 The PCL of oxygen molecular ions
Fig 12 Two sites of oxygen molecular ions defects in lattice of cubic Y2O3
Fig 13 presents two potentional curves and formation of luminescence bands The lowest
excited state A2u of the oxygen molecular ion can be stabilized
The observed luminescence band results of the transition from the vibration level Vrsquo=0 of
the excited electronic state A2u to one vibration level Vrsquorsquo=3 of the ground state X2g The
wwwintechopencom
What is the Pulsed Cathodoluminescence
47
bands at 6306 and 6556 nm are formed due to the transition to the vibration level of the groun state with the participation of lattice phonons For the first curve the phonon energy is 255 cm while for the second curve it is 244 cm-1 These phonons are observed in the Raman spectrum The excited electronic state of the molecular ion is spaced from the ground state by 20660-21580 cm-1 [Solomonov et al 2011]
Fig 13 Configuration curves for two sites of oxygen molecular ions
On the basis of the qualitative luminescent analysis of Nd3+Y2O3 the determination of neodymium concentration by means of the calibration curve construction is possible
because of intensity of neodymium lines is proportional to it concentration INd(i)=aiCNd (for example 750 or 825 nm) However we canrsquot use this equation because PCL spectrum is characterized by the instability Therefore we also chose lightsums ratio as analytic parameter in regions of 730-840 nm and 350-840 nm The first region of Nd3+Y2O3 spectrum involves only neodymium bands but the second one includes in addition the intrinsic band which is distorted by the neodymium absorption and can be ascribed as follows
wwwintechopencom
Cathodoluminescence
48
0
1 exp( )( ) i Nd
YO i ii Nd
k C lI I
k C (12)
Here I0i l ki are the intensity of i ndash intrinsic band without absorption the thickness of samples coefficient of absorption of i ndash band respectively Hence relation of lightsums ratio (S(350-840)S(730-840)) with CNd has to include the equation (12) Really this relation is decribed by the following equation
2
1 exp( )(350 840)
(730 840)Nd
Nd
B CSA D
S C
(13)
Fig 14 demonstrates the calibration curve (r2gt099) for the determination of neodymium concentration in region of 011 ndash 107 at
Fig 14 The calibration curve for the determination of neodymium concentration in region of 011 ndash 107 at
4 Conclusion
Thus the possibility of realization of rapid nondestructive qualitative and quantitative luminescent analyses of laser materials in particular Nd3+Y3Al5O12 Nd3+Y2O3 with the help of pulsed cathodoluminescence was shown
5 References
Bagaev S Osipov V Ivanov M Solomonov V Platonov V Orlov A Rasuleva A amp Vatnik S (2009)Fabrication and characteristics of neodymium ndash activated yttrium oxide optical ceramics Optical Materials Vol31 pp 740-743 ISSN 0925-3467
wwwintechopencom
What is the Pulsed Cathodoluminescence
49
Bogdankevich O Darznik S amp Eliseev P (1975) Semiconductor lasers Nauka Moscow Russia
Bordun O Bordun I amp Novosad S (1995) Luminescence centres into Y2O3 Journal of applied spectroscopy Vol62 No6 pp 91-95 ISSN 0021-9037
Bordun O (2002) Influence of oxygen vacancies on the luminescence spectra of thin Y2O3 films Journal of applied spectroscopy Vol69 No3 pp 371-374 ISSN 0021-9037
Chang N (1966) Energy levels and crystal ndash field splittings of Nd3+ in yttrium oxide J Chem Phys Vol44 pp 4044-4050 ISSN 0021-9606
Chukichev M Sabri D Sokolov V amp Surcova T (1990) Cathodoluminescence of solid solution Zn1-xMnxSe Optics and Spectroscopy Vol68 pp 2000-2021 ISSN 0030-4034
Connor O (1964) A theory of thermoluminescence of fluorite (CaF2Y) Radiative recombination from highly associated electron ndash hole pairs Appl Phys Lett Vol4 No1 pp 126-129 ISSN 0003-6951
Galkin G (1981) The interband processes of the recombination into semiconductors at high excitation level Proceedings of the PN Lebedev Physical Institute (Trudi FIAN) Vol128 pp 3-64
Hoskins H amp Soffer B (1963) Stimulated emission from Y2O3Nd3+ Appl Phys Lett Vol4 pp 22-23 ISSN 0003-6951
Ikesue A Kinoshita T Kamata K amp Yoshida K (1995) Fabrication and optical properties of high-performance polycrystalline NdYAG ceramics for solid-state lasers J Amer Ceram Soc Vol78 pp 1033-1040 ISSN 1551-2916
Kolomiycev A Meylman M Volodina I Chukichev M Smagin A amp Bagdasarov H (1982) Luminescence of neodymium ndash activated yttrium ndash aluminum garnet crystals in ultra-violet and visible ranges at high energy excitation Deposition in VINITI No 5995-82 pp 1-15
Kolomiycev A Meylman M Volodina I Chukichev M Smagin A amp Bagdasarov H (1984) Luminescence of neodymium ndash activated yttrium ndash aluminum garnet crystals in ultra-violet and visible ranges at high energy excitation Optics and Spectroscopy Vol56 pp 365-367 ISSN 0030-4034
Koningstein J amp Geusic J (1964)Energy levels and crystal ndash field calculations of neodymium in yttrium aluminum garnet Phys Rev Vol136 No 3A pp 711-716 ISSN 1893-1912
Kotov Yu Osipov V Ivanov M Samatov O Platonov V Azarkevich E Murzakayev A amp Medvedev A (2002) Properties of oxide nanopowders prepared by target evaporation with a pulse ndash periodic CO2 laser Technical Physics Vol47 No11 pp 1420-1426 ISSN 1063-7842
Kuznetsov A Abramov V Rooze N amp Savikhina T (1978) Autolocalized excitons into Y2O3 JETP Letters Vol28 No10 pp 602-605 ISSN 0021-3640
Lu J Murai T Takaichi K Ueda K Yagi H Yanagitani T amp Kaminskii A (2001) Nd3+Y2O3 ceramic laser Jpn J Appl Phys Vol40 pp 1277-1279 ISSN 0021-4922
Lupei V Lupei A Tiseanu C Georgescu S Stoicescu C amp Nanau P (1995) High ndash resolution optical spectroscopy of YAG Nd A test for structural and distribution models Phys Rev B Vol51 No1 pp 8-17 ISSN 0003-6951
Mesyats G (1974) Generating of highpower nanosecond pulses The Soviet radio Moscow Russia
wwwintechopencom
Cathodoluminescence
50
Mesyats G Shpak V Yalandin M amp Shunailov S (1992) Compact RADAN electron accelerators for testing new radiation technologies and sterilization Radiat Phys Chem Vol46 pp 489-492 ISSN 0969-806X
Michailov S Osipov V amp Solomonov V (2001) Pulsed cathodoluminescent analyzer of materials Pribory i tekhnika eksperimenta No3 pp 164-165 ISSN 0032-8162
Osipov V Solomonov V Platonov V Snigireva O Ivanov V amp Lisenkov V (2005) Laser plume spectroscopy 2 Graphite yttrium ndash stabilized and zirconium oxide targets Quantum Electron Vol35 No7 pp 633-637 ISSN 0368-7147
Osipov V Rasuleva A amp Solomonov V (2008) Luminescence of pure yttria Optics and Spectroscopy Vol105 No4 pp 524-530 ISSN 0030-400X
Osipov V Solomonov V Spirina A Ivanov M amp Orlov A (2009) Luminescence of yttrium oxide doped with neodymium Optics and Spectroscopy Vol106 No1 pp 78-83 ISSN 0030-400X
Osipov V Solomonov V amp Spirina A (2011) Luminescent investigation of neodymium doped yttrium aluminates J of Optical Technology Vol78 No6 pp 81-87 ISSN 0030-4042
Pearse R amp Gaydon A (1949) The identification of molecular spectra Inostrannaya Literatura Moscow Russia
Petrov V (1996) Cathodoluminescent microscopy Physics - Uspekhi Vol39 pp 807-818 ISSN 0042-1294
Ramseyer K Fisher J Matter A Eberhardt P amp Geiss J (1989) A cathodoluminescence microscope for low intensity luminescence Journal of Sedimentary Research Vol59 pp 619-622 ISSN 0022-4472
Ramseyer K amp Millis J (1990) Factors influencing short-lived blue cathodoluminescence in
- quartz Journal of Sedimentary Research Vol59 pp 619-622 ISSN 0003-004X Schaak G amp Koningstein J (1970) Phonon and electronic raman spectra of cubic rare-earth
oxides and isomorphous ittrium oxide J Opt Soc Amer Vol60 No8 pp 1110-1115 ISSN 1551-2916
Solomonov V amp Michailov S (2003) Pulsed cathodoluminescence and its application for the analysis of condensed substances UB RAS ISBN 5-7691-1357-X Yekaterinburg Russia
Solomonv V (2003) Kinetics of pulsed cathodoluminescence Optics and Spectroscopy Vol95 pp 248-254 ISSN 0030-4034
Solomonv V Michailov S amp Deykun A (1996) About the mecanism of excitation and the structure of the pulsed cathodoluminescence bands of Cr3+ Mn2+ impurity ions into minerals Optics and Spectroscopy Vol80 pp 447-458 ISSN 0030-4034
Vaysburd D Semin B Tavanov E Matlis S Balichev I amp Gering G (1982) Highenergy electronics of solid Nauka Novosibirsk Russia
Yang B Luff B amp Townsend F (1992) Chatodoluminescence of natural zircons J Phys Condens Matter Vol4 pp 5617-5624 ISSN 0953-8984
wwwintechopencom
CathodoluminescenceEdited by Dr Naoki Yamamoto
ISBN 978-953-51-0362-2Hard cover 324 pagesPublisher InTechPublished online 28 March 2012Published in print edition March 2012
InTech EuropeUniversity Campus STeP Ri Slavka Krautzeka 83A 51000 Rijeka Croatia Phone +385 (51) 770 447 Fax +385 (51) 686 166wwwintechopencom
InTech ChinaUnit 405 Office Block Hotel Equatorial Shanghai No65 Yan An Road (West) Shanghai 200040 China
Phone +86-21-62489820 Fax +86-21-62489821
Cathodoluminescence (CL) is a non-destructive technique to characterize optical and electronic properties ofnanostructures in many kinds of materials Major subject is to investigate basic parameters in semiconductorsimpurities in oxides and phase determination of minerals CL gives information on carrier concentrationdiffusion length and life time of minority carriers in semiconductors and impurity concentration and phasecomposition in composite materials This book involves 13 chapters to present the basics in the CL techniqueand applications to particles thin films and nanostructures in semiconductors oxides and minerals Thechapters covered in this book include recent development of CL technique and applications to wide range ofmaterials used in modern material science
How to referenceIn order to correctly reference this scholarly work feel free to copy and paste the following
Vladimir Solomonov and Alfiya Spirina (2012) What is the Pulsed CathodoluminescenceCathodoluminescence Dr Naoki Yamamoto (Ed) ISBN 978-953-51-0362-2 InTech Available fromhttpwwwintechopencombookscathodoluminescencewhat-is-the-pulsed-cathodoluminescence-
copy 2012 The Author(s) Licensee IntechOpen This is an open access articledistributed under the terms of the Creative Commons Attribution 30License which permits unrestricted use distribution and reproduction inany medium provided the original work is properly cited
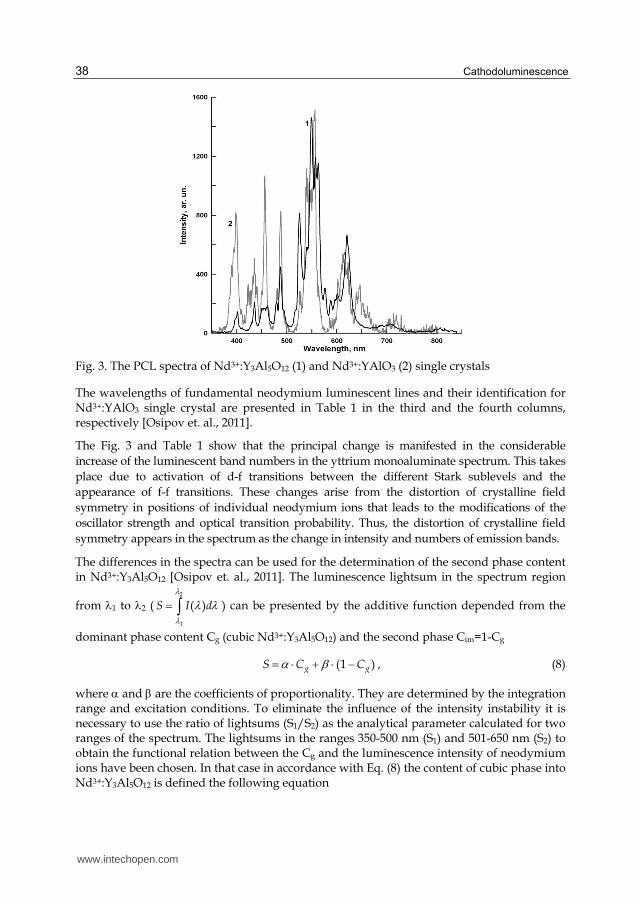
Cathodoluminescence
38
Fig 3 The PCL spectra of Nd3+Y3Al5O12 (1) and Nd3+YAlO3 (2) single crystals
The wavelengths of fundamental neodymium luminescent lines and their identification for Nd3+YAlO3 single crystal are presented in Table 1 in the third and the fourth columns respectively [Osipov et al 2011]
The Fig 3 and Table 1 show that the principal change is manifested in the considerable
increase of the luminescent band numbers in the yttrium monoaluminate spectrum This takes
place due to activation of d-f transitions between the different Stark sublevels and the
appearance of f-f transitions These changes arise from the distortion of crystalline field
symmetry in positions of individual neodymium ions that leads to the modifications of the
oscillator strength and optical transition probability Thus the distortion of crystalline field
symmetry appears in the spectrum as the change in intensity and numbers of emission bands
The differences in the spectra can be used for the determination of the second phase content in Nd3+Y3Al5O12 [Osipov et al 2011] The luminescence lightsum in the spectrum region
from 1 to 2 (2
1
( )S I d
) can be presented by the additive function depended from the
dominant phase content Cg (cubic Nd3+Y3Al5O12) and the second phase Cim=1-Cg
(1 )g gS C C (8)
where and are the coefficients of proportionality They are determined by the integration range and excitation conditions To eliminate the influence of the intensity instability it is necessary to use the ratio of lightsums (S1S2) as the analytical parameter calculated for two ranges of the spectrum The lightsums in the ranges 350-500 nm (S1) and 501-650 nm (S2) to obtain the functional relation between the Cg and the luminescence intensity of neodymium ions have been chosen In that case in accordance with Eq (8) the content of cubic phase into Nd3+Y3Al5O12 is defined the following equation
wwwintechopencom
What is the Pulsed Cathodoluminescence
39
1
1 22
12 2 1 2
2( ) ( )
g
SS
CS
S
(9)
In Fig 4 the correlation between the Cg and S1S2 calculated for the samples with known content of cubic phase is shown
Fig 4 The correlation between the Cg and S1S2
This dependence (Fig 4) is approximated by the following equation with the r2gt099
1
2
1
2
1071 0084
0069g
SS
CS
S
(10)
Moreover the obtained data validity was checked out by the analysis of samples with electron and optical microscopes
32 The luminescence of Y2O3 Nd3+
Y2O3
The wide band of intrinsic radiation in visible range is a visiting luminescent card of pure yttria Earlier the other authors observed this band at different excitation type [Conor 1964 Kuznetsov et al 1978 Bordun et al 1995] Even at cryogenic temperature of the samples the unresolved band was registered
We investigated commercially available yttria powders with a particle sizes of 1-3 m and 5-
10 m All the powders have a cubic lattice of the -Y2O3 From these commercial powders nanopowders with the average particle size of 10-12 nm were prepared by the laser
evaporation method Particles were crystallized in the metastable monoclinic phase -Y2O3
After annealing they transformed to the -Y2O3
wwwintechopencom
Cathodoluminescence
40
The spectrum of the powder with particle size of 1-3 m has a broad asymetric band peaked at 437 nm and long ndash wavelength wing shows local maxima (Fig 5 curve 1)
Fig 5 PCL spectra of commercial yttria powders with particle size 1-3 m (1) 5-10 m (2) and nanopowders with the average particle size of 10-12 nm (3)
In the spectrum of the powder with the particle size of 5-10 m almost all local maxima are transformed into narrow bands (Fig 5 curve 2) They are grouped into four series 435 ndash 510 nm (the blue series) 515 ndash 640 nm (the orange series) 645 ndash 700 nm (the red series) and 785 ndash 840 nm (the infrared series) The PCL spectra of nanopowders irrespective of the crystal
phase (either the -Y2O3 or the -Y2O3 phase) and of the initial coarse powder have a similar structures (Fig 3 curve 3) The broad band with the maximum at 485 nm dominates in these spectra The peak range of this band exhibits local maxima of the blue series Also the lines of orange series at 573 583 612 nm become apparent The red series is weak while the infrared series is hardly seen
The range of the band series observed in the spectra of pulsed cathodoluminescence corresponds to the range of intrinsic radiation of yttria which is identified as the radiation of associated donor-acceptor pairs Y3+ - O2- [Bordun 2002]
Since the luminescence wavelengths of narrow bands of commercial powders nanopowders coincide we can assume that these materials contain intrinsic luminescence centers of the same type
The series of PCL bands of yttria resemble the radiation of free YO radicals which is observed for example in laser plume of yttria-containing target [Osipov et al 2005] This radical has been fairly well studied [Pearse et al 1949] The Table 2 shows the wavelengths of the bands observed in PCL spectra and their identification In the second column of this table the wavelengths of the strongest bands are in boldface
wwwintechopencom
What is the Pulsed Cathodoluminescence
41
Intrinsic luminescence center
VrsquoVrsquorsquo nm
Blue band series the electronic transition B2X2
00 4538
22 4586
33 4611
01 4706
23 4752
02 4887
Orange band series the electronic transition A2X2
20+(Tg+Ag)=380 5428
10 5516
10+(Tg+Ag)=380 5635
00 5729
33 5836
01 6000
34 6122
02 6293
Red band series the electronic transition A2X2
03-(Tg+Ag)=162 6553
03 6624
03+(Tg+Ag)=162 6696
03+Tg=469 6838
Infrared band series the electronic transition A2X2
05+(Tg+Ag)=380 7608
06 7850
8011
8184
Table 2 Parameters of the PCL lines in the yttria spectrum
Based on these data we constructed the energy scheme of the intrinsic luminescence center (Fig 6) Qualitatively this scheme coincides with that of the YO free radicals In this scheme the configuration curves were calculated in the harmonic oscilator approximation as
216 20
0
210 ( )i
i i i
c mE E r
h
(11)
where i =X A and B denotes the electronic states X2 A2 and B2 E0i I and i are the minimal energy the equilibrium distance and the wavenumber of the vibration mode of ith electronic state respectively m0 is the mass of the oxygen atom c and h are the light speed
and Planckrsquos constant The energy E and wavenumbers i are expressed in (11) in reciprocal
centimetres the amplitudes of the (r-i) vibrations are given in nanometres
wwwintechopencom
Cathodoluminescence
42
Fig 6 Energy scheme of the intrinsic luminescence center
For the configuration curves of the X2 A2 and B2 states (Fig 6) E0i=0 17510 and 22090
cm-1 and i=786 675 and 675 cm-1 respectively With these parameters up to the measurement error the wavelengths of pulsed cathodoluminescence coincide with the wavelengths of the optical transitions shown in Table 2 The Franck ndash Condon principle for
molecular transitions is most precisely implemented at A=X+10870910-3 nm and
B=X+1235110-3 nm and X can be estimated as half of elementary cube edge X=01385 nm For electronic ndash vibration transitions for which one of the vibration quantum numbers V is large this principle is implemented only if these transitions involve the most strong phonons [Schaak et al 1970] Table 2 Under these parameters the configuration curves of
the electronic states A2 and B2 intersect at the point with E=25256 cm-1
The qualitative coincidence of the emission bands and the energy structure of intrinsic luminescence centres observed by us and YO free radicals allow us to conclude that intrinsic luminescence centres in yttria contain bound YO radicals [Osipov et al 2008] Consider the possibility of formation of such intrinsic luminescence centre It is known [Schaak et al 1970] that the cubic yttria has unit cell composed of 16 formula units Y2O3 Twenty four cations occupy positions with C2 symmetry and eight cations occupy the positions with C3i symmetry (Fig 7) Every cation is surrounded by six oxygen ions which are positioned on the corners of deformed cube with the edge size of 02702 nm at that two corners is unoccupied Thus in one-third of the cubes (YO6) two oxygen vacancies are located at the cube corners along the face diagonal while in the remaining cubes they are located along the body diagonal (Fig 7)
For such packing a structure presented in Fig 8 can be formed at the outer cube face that contains two oxygen vacancies and that is located at the crystal boundary In essence this structure is the YO radical bound to the crystal lattice by the yttriun ion On such surfaces
the fraction of faces with two oxygen vacancies is 1316=118 and the average distance
wwwintechopencom
What is the Pulsed Cathodoluminescence
43
between them is about 5 nm All of this leads to the dependence of the luminescence spectrum of such bound radicals on the particle size of yttria mainly via their shape
Fig 7 The unit cell of yttria The yttrium positions with C3i and C2 symmetry designated by red and pink balls respectively The oxygen and the vacant positions designated by blue and grey balls The vacant positions are associated by green dot line
Fig 8 The structure of intrinsic luminescence centre
The considered above intrinsic luminescence centre also presents in Nd3+Y2O3 However the presence of neodymium results in decrease of the intrinsic band intensity and distortion of its profile We studied the monoclinic and cubic Nd3+Y2O3 nanopowders The nanopowders
were prepared using a mixture of micropowder -Y2O3 phase and 1 mol Nd2O3 powder After evaporation of this mixture by CO2 laser Nd3+Y2O3 nanoparticles were crystallized into monoclinic phase To transfer nanopowders into cubic phase annealing in air was
carried out above 900C [Kotov et al 2002]
wwwintechopencom
Cathodoluminescence
44
The PCL spectra of all Nd3+Y2O3 samples contain emission lines of neodymium ions which have not been previously observed in photoluminescence Namely neodymium doped nanopowders exhibit a strong band peaking at 825 nm (Fig 9)
Fig 9 The PCL spectra of monoclinic (1) and cubic (2) Nd3+Y2O3 nanopowders
Its components correspond well to the 4F524I92 (825 811 834 nm) and 2H924I92 (818 nm) optical transitions between Nd3+ Starkrsquos sublevels with the energies in Y2O3 cubic lattice [Chang 1966] These components are resolved only in cubic samples (Fig 9) Therefore the splitting of Starkrsquos components allows us to conclude about the presence of the dominant phase into Nd3+Y2O3
To check this assumption the additional investigations were made In Fig 10 the PCL spectra of pressed nanopowders (compacts) are presented The compacts were annealed at
530 750 950 1100 and 1300C The X-ray analysis for this samples showed that the
unannealed compact and annealed compact at 530C have monoclinic phase all remaining compacts are cubic samples It is shown that the splitting of neodymium band at region of 800-840 nm only takes place in cubic samples and one component appears at 825 nm in monoclinic samples
In addition to the band in the region of 800-840 nm two emission bands of neodymium ions
arise in the Nd3+Y2O3 These are a weak band at 720 nm due to 4F924I92 transition and stronger band at 750 nm with the components due to the transitions between the Stark
sublevels 4F724I92 and 4S32 4I92
The intensity weaking of intrinsic band into Nd3+Y2O3 is associated with the quantitative decrease of this centres since the part of yttrium ions are replaced by the neodymium ions The distortion of the intrinsic band is determined by the neodymium absorption of it The most absorption is observed in region at 560-613 nm [Osipov et al 2009]
wwwintechopencom
What is the Pulsed Cathodoluminescence
45
In addition to the present bands into Nd3+Y2O3 the appearance of four well-resolved components in the range of 610-660 nm can be seen The specta of this band for compacts
annealed at 950 and 1300C are presented in Fig 11 The band contains the following four narrow lines at 6206 6306 6453 6556 nm which we identify using Raman spectra as
luminescence of oxygen molecular ion 2O [Solomonov et al 2011]
Fig 10 The PCL spectra of unannealed compact (1) and compacts annealed at 530C (2)
750C (3) 950C (4) 1100C (5) 1300C (6)
wwwintechopencom
Cathodoluminescence
46
The bands with the frequencies of 1615 and 1702 cm-1 correspond to vibrations of the molecular ion in the ground state while the frequencies at 966 and 993 cm-1 correspond to the excited state for the two sites of the oxygen molecular ion in the yttria lattice
Fig 12 demonstrates two sites of defects 2O taking into account the occurrence of two types
of natural vacancies about we talked earlier
Fig 11 The PCL of oxygen molecular ions
Fig 12 Two sites of oxygen molecular ions defects in lattice of cubic Y2O3
Fig 13 presents two potentional curves and formation of luminescence bands The lowest
excited state A2u of the oxygen molecular ion can be stabilized
The observed luminescence band results of the transition from the vibration level Vrsquo=0 of
the excited electronic state A2u to one vibration level Vrsquorsquo=3 of the ground state X2g The
wwwintechopencom
What is the Pulsed Cathodoluminescence
47
bands at 6306 and 6556 nm are formed due to the transition to the vibration level of the groun state with the participation of lattice phonons For the first curve the phonon energy is 255 cm while for the second curve it is 244 cm-1 These phonons are observed in the Raman spectrum The excited electronic state of the molecular ion is spaced from the ground state by 20660-21580 cm-1 [Solomonov et al 2011]
Fig 13 Configuration curves for two sites of oxygen molecular ions
On the basis of the qualitative luminescent analysis of Nd3+Y2O3 the determination of neodymium concentration by means of the calibration curve construction is possible
because of intensity of neodymium lines is proportional to it concentration INd(i)=aiCNd (for example 750 or 825 nm) However we canrsquot use this equation because PCL spectrum is characterized by the instability Therefore we also chose lightsums ratio as analytic parameter in regions of 730-840 nm and 350-840 nm The first region of Nd3+Y2O3 spectrum involves only neodymium bands but the second one includes in addition the intrinsic band which is distorted by the neodymium absorption and can be ascribed as follows
wwwintechopencom
Cathodoluminescence
48
0
1 exp( )( ) i Nd
YO i ii Nd
k C lI I
k C (12)
Here I0i l ki are the intensity of i ndash intrinsic band without absorption the thickness of samples coefficient of absorption of i ndash band respectively Hence relation of lightsums ratio (S(350-840)S(730-840)) with CNd has to include the equation (12) Really this relation is decribed by the following equation
2
1 exp( )(350 840)
(730 840)Nd
Nd
B CSA D
S C
(13)
Fig 14 demonstrates the calibration curve (r2gt099) for the determination of neodymium concentration in region of 011 ndash 107 at
Fig 14 The calibration curve for the determination of neodymium concentration in region of 011 ndash 107 at
4 Conclusion
Thus the possibility of realization of rapid nondestructive qualitative and quantitative luminescent analyses of laser materials in particular Nd3+Y3Al5O12 Nd3+Y2O3 with the help of pulsed cathodoluminescence was shown
5 References
Bagaev S Osipov V Ivanov M Solomonov V Platonov V Orlov A Rasuleva A amp Vatnik S (2009)Fabrication and characteristics of neodymium ndash activated yttrium oxide optical ceramics Optical Materials Vol31 pp 740-743 ISSN 0925-3467
wwwintechopencom
What is the Pulsed Cathodoluminescence
49
Bogdankevich O Darznik S amp Eliseev P (1975) Semiconductor lasers Nauka Moscow Russia
Bordun O Bordun I amp Novosad S (1995) Luminescence centres into Y2O3 Journal of applied spectroscopy Vol62 No6 pp 91-95 ISSN 0021-9037
Bordun O (2002) Influence of oxygen vacancies on the luminescence spectra of thin Y2O3 films Journal of applied spectroscopy Vol69 No3 pp 371-374 ISSN 0021-9037
Chang N (1966) Energy levels and crystal ndash field splittings of Nd3+ in yttrium oxide J Chem Phys Vol44 pp 4044-4050 ISSN 0021-9606
Chukichev M Sabri D Sokolov V amp Surcova T (1990) Cathodoluminescence of solid solution Zn1-xMnxSe Optics and Spectroscopy Vol68 pp 2000-2021 ISSN 0030-4034
Connor O (1964) A theory of thermoluminescence of fluorite (CaF2Y) Radiative recombination from highly associated electron ndash hole pairs Appl Phys Lett Vol4 No1 pp 126-129 ISSN 0003-6951
Galkin G (1981) The interband processes of the recombination into semiconductors at high excitation level Proceedings of the PN Lebedev Physical Institute (Trudi FIAN) Vol128 pp 3-64
Hoskins H amp Soffer B (1963) Stimulated emission from Y2O3Nd3+ Appl Phys Lett Vol4 pp 22-23 ISSN 0003-6951
Ikesue A Kinoshita T Kamata K amp Yoshida K (1995) Fabrication and optical properties of high-performance polycrystalline NdYAG ceramics for solid-state lasers J Amer Ceram Soc Vol78 pp 1033-1040 ISSN 1551-2916
Kolomiycev A Meylman M Volodina I Chukichev M Smagin A amp Bagdasarov H (1982) Luminescence of neodymium ndash activated yttrium ndash aluminum garnet crystals in ultra-violet and visible ranges at high energy excitation Deposition in VINITI No 5995-82 pp 1-15
Kolomiycev A Meylman M Volodina I Chukichev M Smagin A amp Bagdasarov H (1984) Luminescence of neodymium ndash activated yttrium ndash aluminum garnet crystals in ultra-violet and visible ranges at high energy excitation Optics and Spectroscopy Vol56 pp 365-367 ISSN 0030-4034
Koningstein J amp Geusic J (1964)Energy levels and crystal ndash field calculations of neodymium in yttrium aluminum garnet Phys Rev Vol136 No 3A pp 711-716 ISSN 1893-1912
Kotov Yu Osipov V Ivanov M Samatov O Platonov V Azarkevich E Murzakayev A amp Medvedev A (2002) Properties of oxide nanopowders prepared by target evaporation with a pulse ndash periodic CO2 laser Technical Physics Vol47 No11 pp 1420-1426 ISSN 1063-7842
Kuznetsov A Abramov V Rooze N amp Savikhina T (1978) Autolocalized excitons into Y2O3 JETP Letters Vol28 No10 pp 602-605 ISSN 0021-3640
Lu J Murai T Takaichi K Ueda K Yagi H Yanagitani T amp Kaminskii A (2001) Nd3+Y2O3 ceramic laser Jpn J Appl Phys Vol40 pp 1277-1279 ISSN 0021-4922
Lupei V Lupei A Tiseanu C Georgescu S Stoicescu C amp Nanau P (1995) High ndash resolution optical spectroscopy of YAG Nd A test for structural and distribution models Phys Rev B Vol51 No1 pp 8-17 ISSN 0003-6951
Mesyats G (1974) Generating of highpower nanosecond pulses The Soviet radio Moscow Russia
wwwintechopencom
Cathodoluminescence
50
Mesyats G Shpak V Yalandin M amp Shunailov S (1992) Compact RADAN electron accelerators for testing new radiation technologies and sterilization Radiat Phys Chem Vol46 pp 489-492 ISSN 0969-806X
Michailov S Osipov V amp Solomonov V (2001) Pulsed cathodoluminescent analyzer of materials Pribory i tekhnika eksperimenta No3 pp 164-165 ISSN 0032-8162
Osipov V Solomonov V Platonov V Snigireva O Ivanov V amp Lisenkov V (2005) Laser plume spectroscopy 2 Graphite yttrium ndash stabilized and zirconium oxide targets Quantum Electron Vol35 No7 pp 633-637 ISSN 0368-7147
Osipov V Rasuleva A amp Solomonov V (2008) Luminescence of pure yttria Optics and Spectroscopy Vol105 No4 pp 524-530 ISSN 0030-400X
Osipov V Solomonov V Spirina A Ivanov M amp Orlov A (2009) Luminescence of yttrium oxide doped with neodymium Optics and Spectroscopy Vol106 No1 pp 78-83 ISSN 0030-400X
Osipov V Solomonov V amp Spirina A (2011) Luminescent investigation of neodymium doped yttrium aluminates J of Optical Technology Vol78 No6 pp 81-87 ISSN 0030-4042
Pearse R amp Gaydon A (1949) The identification of molecular spectra Inostrannaya Literatura Moscow Russia
Petrov V (1996) Cathodoluminescent microscopy Physics - Uspekhi Vol39 pp 807-818 ISSN 0042-1294
Ramseyer K Fisher J Matter A Eberhardt P amp Geiss J (1989) A cathodoluminescence microscope for low intensity luminescence Journal of Sedimentary Research Vol59 pp 619-622 ISSN 0022-4472
Ramseyer K amp Millis J (1990) Factors influencing short-lived blue cathodoluminescence in
- quartz Journal of Sedimentary Research Vol59 pp 619-622 ISSN 0003-004X Schaak G amp Koningstein J (1970) Phonon and electronic raman spectra of cubic rare-earth
oxides and isomorphous ittrium oxide J Opt Soc Amer Vol60 No8 pp 1110-1115 ISSN 1551-2916
Solomonov V amp Michailov S (2003) Pulsed cathodoluminescence and its application for the analysis of condensed substances UB RAS ISBN 5-7691-1357-X Yekaterinburg Russia
Solomonv V (2003) Kinetics of pulsed cathodoluminescence Optics and Spectroscopy Vol95 pp 248-254 ISSN 0030-4034
Solomonv V Michailov S amp Deykun A (1996) About the mecanism of excitation and the structure of the pulsed cathodoluminescence bands of Cr3+ Mn2+ impurity ions into minerals Optics and Spectroscopy Vol80 pp 447-458 ISSN 0030-4034
Vaysburd D Semin B Tavanov E Matlis S Balichev I amp Gering G (1982) Highenergy electronics of solid Nauka Novosibirsk Russia
Yang B Luff B amp Townsend F (1992) Chatodoluminescence of natural zircons J Phys Condens Matter Vol4 pp 5617-5624 ISSN 0953-8984
wwwintechopencom
CathodoluminescenceEdited by Dr Naoki Yamamoto
ISBN 978-953-51-0362-2Hard cover 324 pagesPublisher InTechPublished online 28 March 2012Published in print edition March 2012
InTech EuropeUniversity Campus STeP Ri Slavka Krautzeka 83A 51000 Rijeka Croatia Phone +385 (51) 770 447 Fax +385 (51) 686 166wwwintechopencom
InTech ChinaUnit 405 Office Block Hotel Equatorial Shanghai No65 Yan An Road (West) Shanghai 200040 China
Phone +86-21-62489820 Fax +86-21-62489821
Cathodoluminescence (CL) is a non-destructive technique to characterize optical and electronic properties ofnanostructures in many kinds of materials Major subject is to investigate basic parameters in semiconductorsimpurities in oxides and phase determination of minerals CL gives information on carrier concentrationdiffusion length and life time of minority carriers in semiconductors and impurity concentration and phasecomposition in composite materials This book involves 13 chapters to present the basics in the CL techniqueand applications to particles thin films and nanostructures in semiconductors oxides and minerals Thechapters covered in this book include recent development of CL technique and applications to wide range ofmaterials used in modern material science
How to referenceIn order to correctly reference this scholarly work feel free to copy and paste the following
Vladimir Solomonov and Alfiya Spirina (2012) What is the Pulsed CathodoluminescenceCathodoluminescence Dr Naoki Yamamoto (Ed) ISBN 978-953-51-0362-2 InTech Available fromhttpwwwintechopencombookscathodoluminescencewhat-is-the-pulsed-cathodoluminescence-
copy 2012 The Author(s) Licensee IntechOpen This is an open access articledistributed under the terms of the Creative Commons Attribution 30License which permits unrestricted use distribution and reproduction inany medium provided the original work is properly cited

What is the Pulsed Cathodoluminescence
39
1
1 22
12 2 1 2
2( ) ( )
g
SS
CS
S
(9)
In Fig 4 the correlation between the Cg and S1S2 calculated for the samples with known content of cubic phase is shown
Fig 4 The correlation between the Cg and S1S2
This dependence (Fig 4) is approximated by the following equation with the r2gt099
1
2
1
2
1071 0084
0069g
SS
CS
S
(10)
Moreover the obtained data validity was checked out by the analysis of samples with electron and optical microscopes
32 The luminescence of Y2O3 Nd3+
Y2O3
The wide band of intrinsic radiation in visible range is a visiting luminescent card of pure yttria Earlier the other authors observed this band at different excitation type [Conor 1964 Kuznetsov et al 1978 Bordun et al 1995] Even at cryogenic temperature of the samples the unresolved band was registered
We investigated commercially available yttria powders with a particle sizes of 1-3 m and 5-
10 m All the powders have a cubic lattice of the -Y2O3 From these commercial powders nanopowders with the average particle size of 10-12 nm were prepared by the laser
evaporation method Particles were crystallized in the metastable monoclinic phase -Y2O3
After annealing they transformed to the -Y2O3
wwwintechopencom
Cathodoluminescence
40
The spectrum of the powder with particle size of 1-3 m has a broad asymetric band peaked at 437 nm and long ndash wavelength wing shows local maxima (Fig 5 curve 1)
Fig 5 PCL spectra of commercial yttria powders with particle size 1-3 m (1) 5-10 m (2) and nanopowders with the average particle size of 10-12 nm (3)
In the spectrum of the powder with the particle size of 5-10 m almost all local maxima are transformed into narrow bands (Fig 5 curve 2) They are grouped into four series 435 ndash 510 nm (the blue series) 515 ndash 640 nm (the orange series) 645 ndash 700 nm (the red series) and 785 ndash 840 nm (the infrared series) The PCL spectra of nanopowders irrespective of the crystal
phase (either the -Y2O3 or the -Y2O3 phase) and of the initial coarse powder have a similar structures (Fig 3 curve 3) The broad band with the maximum at 485 nm dominates in these spectra The peak range of this band exhibits local maxima of the blue series Also the lines of orange series at 573 583 612 nm become apparent The red series is weak while the infrared series is hardly seen
The range of the band series observed in the spectra of pulsed cathodoluminescence corresponds to the range of intrinsic radiation of yttria which is identified as the radiation of associated donor-acceptor pairs Y3+ - O2- [Bordun 2002]
Since the luminescence wavelengths of narrow bands of commercial powders nanopowders coincide we can assume that these materials contain intrinsic luminescence centers of the same type
The series of PCL bands of yttria resemble the radiation of free YO radicals which is observed for example in laser plume of yttria-containing target [Osipov et al 2005] This radical has been fairly well studied [Pearse et al 1949] The Table 2 shows the wavelengths of the bands observed in PCL spectra and their identification In the second column of this table the wavelengths of the strongest bands are in boldface
wwwintechopencom
What is the Pulsed Cathodoluminescence
41
Intrinsic luminescence center
VrsquoVrsquorsquo nm
Blue band series the electronic transition B2X2
00 4538
22 4586
33 4611
01 4706
23 4752
02 4887
Orange band series the electronic transition A2X2
20+(Tg+Ag)=380 5428
10 5516
10+(Tg+Ag)=380 5635
00 5729
33 5836
01 6000
34 6122
02 6293
Red band series the electronic transition A2X2
03-(Tg+Ag)=162 6553
03 6624
03+(Tg+Ag)=162 6696
03+Tg=469 6838
Infrared band series the electronic transition A2X2
05+(Tg+Ag)=380 7608
06 7850
8011
8184
Table 2 Parameters of the PCL lines in the yttria spectrum
Based on these data we constructed the energy scheme of the intrinsic luminescence center (Fig 6) Qualitatively this scheme coincides with that of the YO free radicals In this scheme the configuration curves were calculated in the harmonic oscilator approximation as
216 20
0
210 ( )i
i i i
c mE E r
h
(11)
where i =X A and B denotes the electronic states X2 A2 and B2 E0i I and i are the minimal energy the equilibrium distance and the wavenumber of the vibration mode of ith electronic state respectively m0 is the mass of the oxygen atom c and h are the light speed
and Planckrsquos constant The energy E and wavenumbers i are expressed in (11) in reciprocal
centimetres the amplitudes of the (r-i) vibrations are given in nanometres
wwwintechopencom
Cathodoluminescence
42
Fig 6 Energy scheme of the intrinsic luminescence center
For the configuration curves of the X2 A2 and B2 states (Fig 6) E0i=0 17510 and 22090
cm-1 and i=786 675 and 675 cm-1 respectively With these parameters up to the measurement error the wavelengths of pulsed cathodoluminescence coincide with the wavelengths of the optical transitions shown in Table 2 The Franck ndash Condon principle for
molecular transitions is most precisely implemented at A=X+10870910-3 nm and
B=X+1235110-3 nm and X can be estimated as half of elementary cube edge X=01385 nm For electronic ndash vibration transitions for which one of the vibration quantum numbers V is large this principle is implemented only if these transitions involve the most strong phonons [Schaak et al 1970] Table 2 Under these parameters the configuration curves of
the electronic states A2 and B2 intersect at the point with E=25256 cm-1
The qualitative coincidence of the emission bands and the energy structure of intrinsic luminescence centres observed by us and YO free radicals allow us to conclude that intrinsic luminescence centres in yttria contain bound YO radicals [Osipov et al 2008] Consider the possibility of formation of such intrinsic luminescence centre It is known [Schaak et al 1970] that the cubic yttria has unit cell composed of 16 formula units Y2O3 Twenty four cations occupy positions with C2 symmetry and eight cations occupy the positions with C3i symmetry (Fig 7) Every cation is surrounded by six oxygen ions which are positioned on the corners of deformed cube with the edge size of 02702 nm at that two corners is unoccupied Thus in one-third of the cubes (YO6) two oxygen vacancies are located at the cube corners along the face diagonal while in the remaining cubes they are located along the body diagonal (Fig 7)
For such packing a structure presented in Fig 8 can be formed at the outer cube face that contains two oxygen vacancies and that is located at the crystal boundary In essence this structure is the YO radical bound to the crystal lattice by the yttriun ion On such surfaces
the fraction of faces with two oxygen vacancies is 1316=118 and the average distance
wwwintechopencom
What is the Pulsed Cathodoluminescence
43
between them is about 5 nm All of this leads to the dependence of the luminescence spectrum of such bound radicals on the particle size of yttria mainly via their shape
Fig 7 The unit cell of yttria The yttrium positions with C3i and C2 symmetry designated by red and pink balls respectively The oxygen and the vacant positions designated by blue and grey balls The vacant positions are associated by green dot line
Fig 8 The structure of intrinsic luminescence centre
The considered above intrinsic luminescence centre also presents in Nd3+Y2O3 However the presence of neodymium results in decrease of the intrinsic band intensity and distortion of its profile We studied the monoclinic and cubic Nd3+Y2O3 nanopowders The nanopowders
were prepared using a mixture of micropowder -Y2O3 phase and 1 mol Nd2O3 powder After evaporation of this mixture by CO2 laser Nd3+Y2O3 nanoparticles were crystallized into monoclinic phase To transfer nanopowders into cubic phase annealing in air was
carried out above 900C [Kotov et al 2002]
wwwintechopencom
Cathodoluminescence
44
The PCL spectra of all Nd3+Y2O3 samples contain emission lines of neodymium ions which have not been previously observed in photoluminescence Namely neodymium doped nanopowders exhibit a strong band peaking at 825 nm (Fig 9)
Fig 9 The PCL spectra of monoclinic (1) and cubic (2) Nd3+Y2O3 nanopowders
Its components correspond well to the 4F524I92 (825 811 834 nm) and 2H924I92 (818 nm) optical transitions between Nd3+ Starkrsquos sublevels with the energies in Y2O3 cubic lattice [Chang 1966] These components are resolved only in cubic samples (Fig 9) Therefore the splitting of Starkrsquos components allows us to conclude about the presence of the dominant phase into Nd3+Y2O3
To check this assumption the additional investigations were made In Fig 10 the PCL spectra of pressed nanopowders (compacts) are presented The compacts were annealed at
530 750 950 1100 and 1300C The X-ray analysis for this samples showed that the
unannealed compact and annealed compact at 530C have monoclinic phase all remaining compacts are cubic samples It is shown that the splitting of neodymium band at region of 800-840 nm only takes place in cubic samples and one component appears at 825 nm in monoclinic samples
In addition to the band in the region of 800-840 nm two emission bands of neodymium ions
arise in the Nd3+Y2O3 These are a weak band at 720 nm due to 4F924I92 transition and stronger band at 750 nm with the components due to the transitions between the Stark
sublevels 4F724I92 and 4S32 4I92
The intensity weaking of intrinsic band into Nd3+Y2O3 is associated with the quantitative decrease of this centres since the part of yttrium ions are replaced by the neodymium ions The distortion of the intrinsic band is determined by the neodymium absorption of it The most absorption is observed in region at 560-613 nm [Osipov et al 2009]
wwwintechopencom
What is the Pulsed Cathodoluminescence
45
In addition to the present bands into Nd3+Y2O3 the appearance of four well-resolved components in the range of 610-660 nm can be seen The specta of this band for compacts
annealed at 950 and 1300C are presented in Fig 11 The band contains the following four narrow lines at 6206 6306 6453 6556 nm which we identify using Raman spectra as
luminescence of oxygen molecular ion 2O [Solomonov et al 2011]
Fig 10 The PCL spectra of unannealed compact (1) and compacts annealed at 530C (2)
750C (3) 950C (4) 1100C (5) 1300C (6)
wwwintechopencom
Cathodoluminescence
46
The bands with the frequencies of 1615 and 1702 cm-1 correspond to vibrations of the molecular ion in the ground state while the frequencies at 966 and 993 cm-1 correspond to the excited state for the two sites of the oxygen molecular ion in the yttria lattice
Fig 12 demonstrates two sites of defects 2O taking into account the occurrence of two types
of natural vacancies about we talked earlier
Fig 11 The PCL of oxygen molecular ions
Fig 12 Two sites of oxygen molecular ions defects in lattice of cubic Y2O3
Fig 13 presents two potentional curves and formation of luminescence bands The lowest
excited state A2u of the oxygen molecular ion can be stabilized
The observed luminescence band results of the transition from the vibration level Vrsquo=0 of
the excited electronic state A2u to one vibration level Vrsquorsquo=3 of the ground state X2g The
wwwintechopencom
What is the Pulsed Cathodoluminescence
47
bands at 6306 and 6556 nm are formed due to the transition to the vibration level of the groun state with the participation of lattice phonons For the first curve the phonon energy is 255 cm while for the second curve it is 244 cm-1 These phonons are observed in the Raman spectrum The excited electronic state of the molecular ion is spaced from the ground state by 20660-21580 cm-1 [Solomonov et al 2011]
Fig 13 Configuration curves for two sites of oxygen molecular ions
On the basis of the qualitative luminescent analysis of Nd3+Y2O3 the determination of neodymium concentration by means of the calibration curve construction is possible
because of intensity of neodymium lines is proportional to it concentration INd(i)=aiCNd (for example 750 or 825 nm) However we canrsquot use this equation because PCL spectrum is characterized by the instability Therefore we also chose lightsums ratio as analytic parameter in regions of 730-840 nm and 350-840 nm The first region of Nd3+Y2O3 spectrum involves only neodymium bands but the second one includes in addition the intrinsic band which is distorted by the neodymium absorption and can be ascribed as follows
wwwintechopencom
Cathodoluminescence
48
0
1 exp( )( ) i Nd
YO i ii Nd
k C lI I
k C (12)
Here I0i l ki are the intensity of i ndash intrinsic band without absorption the thickness of samples coefficient of absorption of i ndash band respectively Hence relation of lightsums ratio (S(350-840)S(730-840)) with CNd has to include the equation (12) Really this relation is decribed by the following equation
2
1 exp( )(350 840)
(730 840)Nd
Nd
B CSA D
S C
(13)
Fig 14 demonstrates the calibration curve (r2gt099) for the determination of neodymium concentration in region of 011 ndash 107 at
Fig 14 The calibration curve for the determination of neodymium concentration in region of 011 ndash 107 at
4 Conclusion
Thus the possibility of realization of rapid nondestructive qualitative and quantitative luminescent analyses of laser materials in particular Nd3+Y3Al5O12 Nd3+Y2O3 with the help of pulsed cathodoluminescence was shown
5 References
Bagaev S Osipov V Ivanov M Solomonov V Platonov V Orlov A Rasuleva A amp Vatnik S (2009)Fabrication and characteristics of neodymium ndash activated yttrium oxide optical ceramics Optical Materials Vol31 pp 740-743 ISSN 0925-3467
wwwintechopencom
What is the Pulsed Cathodoluminescence
49
Bogdankevich O Darznik S amp Eliseev P (1975) Semiconductor lasers Nauka Moscow Russia
Bordun O Bordun I amp Novosad S (1995) Luminescence centres into Y2O3 Journal of applied spectroscopy Vol62 No6 pp 91-95 ISSN 0021-9037
Bordun O (2002) Influence of oxygen vacancies on the luminescence spectra of thin Y2O3 films Journal of applied spectroscopy Vol69 No3 pp 371-374 ISSN 0021-9037
Chang N (1966) Energy levels and crystal ndash field splittings of Nd3+ in yttrium oxide J Chem Phys Vol44 pp 4044-4050 ISSN 0021-9606
Chukichev M Sabri D Sokolov V amp Surcova T (1990) Cathodoluminescence of solid solution Zn1-xMnxSe Optics and Spectroscopy Vol68 pp 2000-2021 ISSN 0030-4034
Connor O (1964) A theory of thermoluminescence of fluorite (CaF2Y) Radiative recombination from highly associated electron ndash hole pairs Appl Phys Lett Vol4 No1 pp 126-129 ISSN 0003-6951
Galkin G (1981) The interband processes of the recombination into semiconductors at high excitation level Proceedings of the PN Lebedev Physical Institute (Trudi FIAN) Vol128 pp 3-64
Hoskins H amp Soffer B (1963) Stimulated emission from Y2O3Nd3+ Appl Phys Lett Vol4 pp 22-23 ISSN 0003-6951
Ikesue A Kinoshita T Kamata K amp Yoshida K (1995) Fabrication and optical properties of high-performance polycrystalline NdYAG ceramics for solid-state lasers J Amer Ceram Soc Vol78 pp 1033-1040 ISSN 1551-2916
Kolomiycev A Meylman M Volodina I Chukichev M Smagin A amp Bagdasarov H (1982) Luminescence of neodymium ndash activated yttrium ndash aluminum garnet crystals in ultra-violet and visible ranges at high energy excitation Deposition in VINITI No 5995-82 pp 1-15
Kolomiycev A Meylman M Volodina I Chukichev M Smagin A amp Bagdasarov H (1984) Luminescence of neodymium ndash activated yttrium ndash aluminum garnet crystals in ultra-violet and visible ranges at high energy excitation Optics and Spectroscopy Vol56 pp 365-367 ISSN 0030-4034
Koningstein J amp Geusic J (1964)Energy levels and crystal ndash field calculations of neodymium in yttrium aluminum garnet Phys Rev Vol136 No 3A pp 711-716 ISSN 1893-1912
Kotov Yu Osipov V Ivanov M Samatov O Platonov V Azarkevich E Murzakayev A amp Medvedev A (2002) Properties of oxide nanopowders prepared by target evaporation with a pulse ndash periodic CO2 laser Technical Physics Vol47 No11 pp 1420-1426 ISSN 1063-7842
Kuznetsov A Abramov V Rooze N amp Savikhina T (1978) Autolocalized excitons into Y2O3 JETP Letters Vol28 No10 pp 602-605 ISSN 0021-3640
Lu J Murai T Takaichi K Ueda K Yagi H Yanagitani T amp Kaminskii A (2001) Nd3+Y2O3 ceramic laser Jpn J Appl Phys Vol40 pp 1277-1279 ISSN 0021-4922
Lupei V Lupei A Tiseanu C Georgescu S Stoicescu C amp Nanau P (1995) High ndash resolution optical spectroscopy of YAG Nd A test for structural and distribution models Phys Rev B Vol51 No1 pp 8-17 ISSN 0003-6951
Mesyats G (1974) Generating of highpower nanosecond pulses The Soviet radio Moscow Russia
wwwintechopencom
Cathodoluminescence
50
Mesyats G Shpak V Yalandin M amp Shunailov S (1992) Compact RADAN electron accelerators for testing new radiation technologies and sterilization Radiat Phys Chem Vol46 pp 489-492 ISSN 0969-806X
Michailov S Osipov V amp Solomonov V (2001) Pulsed cathodoluminescent analyzer of materials Pribory i tekhnika eksperimenta No3 pp 164-165 ISSN 0032-8162
Osipov V Solomonov V Platonov V Snigireva O Ivanov V amp Lisenkov V (2005) Laser plume spectroscopy 2 Graphite yttrium ndash stabilized and zirconium oxide targets Quantum Electron Vol35 No7 pp 633-637 ISSN 0368-7147
Osipov V Rasuleva A amp Solomonov V (2008) Luminescence of pure yttria Optics and Spectroscopy Vol105 No4 pp 524-530 ISSN 0030-400X
Osipov V Solomonov V Spirina A Ivanov M amp Orlov A (2009) Luminescence of yttrium oxide doped with neodymium Optics and Spectroscopy Vol106 No1 pp 78-83 ISSN 0030-400X
Osipov V Solomonov V amp Spirina A (2011) Luminescent investigation of neodymium doped yttrium aluminates J of Optical Technology Vol78 No6 pp 81-87 ISSN 0030-4042
Pearse R amp Gaydon A (1949) The identification of molecular spectra Inostrannaya Literatura Moscow Russia
Petrov V (1996) Cathodoluminescent microscopy Physics - Uspekhi Vol39 pp 807-818 ISSN 0042-1294
Ramseyer K Fisher J Matter A Eberhardt P amp Geiss J (1989) A cathodoluminescence microscope for low intensity luminescence Journal of Sedimentary Research Vol59 pp 619-622 ISSN 0022-4472
Ramseyer K amp Millis J (1990) Factors influencing short-lived blue cathodoluminescence in
- quartz Journal of Sedimentary Research Vol59 pp 619-622 ISSN 0003-004X Schaak G amp Koningstein J (1970) Phonon and electronic raman spectra of cubic rare-earth
oxides and isomorphous ittrium oxide J Opt Soc Amer Vol60 No8 pp 1110-1115 ISSN 1551-2916
Solomonov V amp Michailov S (2003) Pulsed cathodoluminescence and its application for the analysis of condensed substances UB RAS ISBN 5-7691-1357-X Yekaterinburg Russia
Solomonv V (2003) Kinetics of pulsed cathodoluminescence Optics and Spectroscopy Vol95 pp 248-254 ISSN 0030-4034
Solomonv V Michailov S amp Deykun A (1996) About the mecanism of excitation and the structure of the pulsed cathodoluminescence bands of Cr3+ Mn2+ impurity ions into minerals Optics and Spectroscopy Vol80 pp 447-458 ISSN 0030-4034
Vaysburd D Semin B Tavanov E Matlis S Balichev I amp Gering G (1982) Highenergy electronics of solid Nauka Novosibirsk Russia
Yang B Luff B amp Townsend F (1992) Chatodoluminescence of natural zircons J Phys Condens Matter Vol4 pp 5617-5624 ISSN 0953-8984
wwwintechopencom
CathodoluminescenceEdited by Dr Naoki Yamamoto
ISBN 978-953-51-0362-2Hard cover 324 pagesPublisher InTechPublished online 28 March 2012Published in print edition March 2012
InTech EuropeUniversity Campus STeP Ri Slavka Krautzeka 83A 51000 Rijeka Croatia Phone +385 (51) 770 447 Fax +385 (51) 686 166wwwintechopencom
InTech ChinaUnit 405 Office Block Hotel Equatorial Shanghai No65 Yan An Road (West) Shanghai 200040 China
Phone +86-21-62489820 Fax +86-21-62489821
Cathodoluminescence (CL) is a non-destructive technique to characterize optical and electronic properties ofnanostructures in many kinds of materials Major subject is to investigate basic parameters in semiconductorsimpurities in oxides and phase determination of minerals CL gives information on carrier concentrationdiffusion length and life time of minority carriers in semiconductors and impurity concentration and phasecomposition in composite materials This book involves 13 chapters to present the basics in the CL techniqueand applications to particles thin films and nanostructures in semiconductors oxides and minerals Thechapters covered in this book include recent development of CL technique and applications to wide range ofmaterials used in modern material science
How to referenceIn order to correctly reference this scholarly work feel free to copy and paste the following
Vladimir Solomonov and Alfiya Spirina (2012) What is the Pulsed CathodoluminescenceCathodoluminescence Dr Naoki Yamamoto (Ed) ISBN 978-953-51-0362-2 InTech Available fromhttpwwwintechopencombookscathodoluminescencewhat-is-the-pulsed-cathodoluminescence-
copy 2012 The Author(s) Licensee IntechOpen This is an open access articledistributed under the terms of the Creative Commons Attribution 30License which permits unrestricted use distribution and reproduction inany medium provided the original work is properly cited

Cathodoluminescence
40
The spectrum of the powder with particle size of 1-3 m has a broad asymetric band peaked at 437 nm and long ndash wavelength wing shows local maxima (Fig 5 curve 1)
Fig 5 PCL spectra of commercial yttria powders with particle size 1-3 m (1) 5-10 m (2) and nanopowders with the average particle size of 10-12 nm (3)
In the spectrum of the powder with the particle size of 5-10 m almost all local maxima are transformed into narrow bands (Fig 5 curve 2) They are grouped into four series 435 ndash 510 nm (the blue series) 515 ndash 640 nm (the orange series) 645 ndash 700 nm (the red series) and 785 ndash 840 nm (the infrared series) The PCL spectra of nanopowders irrespective of the crystal
phase (either the -Y2O3 or the -Y2O3 phase) and of the initial coarse powder have a similar structures (Fig 3 curve 3) The broad band with the maximum at 485 nm dominates in these spectra The peak range of this band exhibits local maxima of the blue series Also the lines of orange series at 573 583 612 nm become apparent The red series is weak while the infrared series is hardly seen
The range of the band series observed in the spectra of pulsed cathodoluminescence corresponds to the range of intrinsic radiation of yttria which is identified as the radiation of associated donor-acceptor pairs Y3+ - O2- [Bordun 2002]
Since the luminescence wavelengths of narrow bands of commercial powders nanopowders coincide we can assume that these materials contain intrinsic luminescence centers of the same type
The series of PCL bands of yttria resemble the radiation of free YO radicals which is observed for example in laser plume of yttria-containing target [Osipov et al 2005] This radical has been fairly well studied [Pearse et al 1949] The Table 2 shows the wavelengths of the bands observed in PCL spectra and their identification In the second column of this table the wavelengths of the strongest bands are in boldface
wwwintechopencom
What is the Pulsed Cathodoluminescence
41
Intrinsic luminescence center
VrsquoVrsquorsquo nm
Blue band series the electronic transition B2X2
00 4538
22 4586
33 4611
01 4706
23 4752
02 4887
Orange band series the electronic transition A2X2
20+(Tg+Ag)=380 5428
10 5516
10+(Tg+Ag)=380 5635
00 5729
33 5836
01 6000
34 6122
02 6293
Red band series the electronic transition A2X2
03-(Tg+Ag)=162 6553
03 6624
03+(Tg+Ag)=162 6696
03+Tg=469 6838
Infrared band series the electronic transition A2X2
05+(Tg+Ag)=380 7608
06 7850
8011
8184
Table 2 Parameters of the PCL lines in the yttria spectrum
Based on these data we constructed the energy scheme of the intrinsic luminescence center (Fig 6) Qualitatively this scheme coincides with that of the YO free radicals In this scheme the configuration curves were calculated in the harmonic oscilator approximation as
216 20
0
210 ( )i
i i i
c mE E r
h
(11)
where i =X A and B denotes the electronic states X2 A2 and B2 E0i I and i are the minimal energy the equilibrium distance and the wavenumber of the vibration mode of ith electronic state respectively m0 is the mass of the oxygen atom c and h are the light speed
and Planckrsquos constant The energy E and wavenumbers i are expressed in (11) in reciprocal
centimetres the amplitudes of the (r-i) vibrations are given in nanometres
wwwintechopencom
Cathodoluminescence
42
Fig 6 Energy scheme of the intrinsic luminescence center
For the configuration curves of the X2 A2 and B2 states (Fig 6) E0i=0 17510 and 22090
cm-1 and i=786 675 and 675 cm-1 respectively With these parameters up to the measurement error the wavelengths of pulsed cathodoluminescence coincide with the wavelengths of the optical transitions shown in Table 2 The Franck ndash Condon principle for
molecular transitions is most precisely implemented at A=X+10870910-3 nm and
B=X+1235110-3 nm and X can be estimated as half of elementary cube edge X=01385 nm For electronic ndash vibration transitions for which one of the vibration quantum numbers V is large this principle is implemented only if these transitions involve the most strong phonons [Schaak et al 1970] Table 2 Under these parameters the configuration curves of
the electronic states A2 and B2 intersect at the point with E=25256 cm-1
The qualitative coincidence of the emission bands and the energy structure of intrinsic luminescence centres observed by us and YO free radicals allow us to conclude that intrinsic luminescence centres in yttria contain bound YO radicals [Osipov et al 2008] Consider the possibility of formation of such intrinsic luminescence centre It is known [Schaak et al 1970] that the cubic yttria has unit cell composed of 16 formula units Y2O3 Twenty four cations occupy positions with C2 symmetry and eight cations occupy the positions with C3i symmetry (Fig 7) Every cation is surrounded by six oxygen ions which are positioned on the corners of deformed cube with the edge size of 02702 nm at that two corners is unoccupied Thus in one-third of the cubes (YO6) two oxygen vacancies are located at the cube corners along the face diagonal while in the remaining cubes they are located along the body diagonal (Fig 7)
For such packing a structure presented in Fig 8 can be formed at the outer cube face that contains two oxygen vacancies and that is located at the crystal boundary In essence this structure is the YO radical bound to the crystal lattice by the yttriun ion On such surfaces
the fraction of faces with two oxygen vacancies is 1316=118 and the average distance
wwwintechopencom
What is the Pulsed Cathodoluminescence
43
between them is about 5 nm All of this leads to the dependence of the luminescence spectrum of such bound radicals on the particle size of yttria mainly via their shape
Fig 7 The unit cell of yttria The yttrium positions with C3i and C2 symmetry designated by red and pink balls respectively The oxygen and the vacant positions designated by blue and grey balls The vacant positions are associated by green dot line
Fig 8 The structure of intrinsic luminescence centre
The considered above intrinsic luminescence centre also presents in Nd3+Y2O3 However the presence of neodymium results in decrease of the intrinsic band intensity and distortion of its profile We studied the monoclinic and cubic Nd3+Y2O3 nanopowders The nanopowders
were prepared using a mixture of micropowder -Y2O3 phase and 1 mol Nd2O3 powder After evaporation of this mixture by CO2 laser Nd3+Y2O3 nanoparticles were crystallized into monoclinic phase To transfer nanopowders into cubic phase annealing in air was
carried out above 900C [Kotov et al 2002]
wwwintechopencom
Cathodoluminescence
44
The PCL spectra of all Nd3+Y2O3 samples contain emission lines of neodymium ions which have not been previously observed in photoluminescence Namely neodymium doped nanopowders exhibit a strong band peaking at 825 nm (Fig 9)
Fig 9 The PCL spectra of monoclinic (1) and cubic (2) Nd3+Y2O3 nanopowders
Its components correspond well to the 4F524I92 (825 811 834 nm) and 2H924I92 (818 nm) optical transitions between Nd3+ Starkrsquos sublevels with the energies in Y2O3 cubic lattice [Chang 1966] These components are resolved only in cubic samples (Fig 9) Therefore the splitting of Starkrsquos components allows us to conclude about the presence of the dominant phase into Nd3+Y2O3
To check this assumption the additional investigations were made In Fig 10 the PCL spectra of pressed nanopowders (compacts) are presented The compacts were annealed at
530 750 950 1100 and 1300C The X-ray analysis for this samples showed that the
unannealed compact and annealed compact at 530C have monoclinic phase all remaining compacts are cubic samples It is shown that the splitting of neodymium band at region of 800-840 nm only takes place in cubic samples and one component appears at 825 nm in monoclinic samples
In addition to the band in the region of 800-840 nm two emission bands of neodymium ions
arise in the Nd3+Y2O3 These are a weak band at 720 nm due to 4F924I92 transition and stronger band at 750 nm with the components due to the transitions between the Stark
sublevels 4F724I92 and 4S32 4I92
The intensity weaking of intrinsic band into Nd3+Y2O3 is associated with the quantitative decrease of this centres since the part of yttrium ions are replaced by the neodymium ions The distortion of the intrinsic band is determined by the neodymium absorption of it The most absorption is observed in region at 560-613 nm [Osipov et al 2009]
wwwintechopencom
What is the Pulsed Cathodoluminescence
45
In addition to the present bands into Nd3+Y2O3 the appearance of four well-resolved components in the range of 610-660 nm can be seen The specta of this band for compacts
annealed at 950 and 1300C are presented in Fig 11 The band contains the following four narrow lines at 6206 6306 6453 6556 nm which we identify using Raman spectra as
luminescence of oxygen molecular ion 2O [Solomonov et al 2011]
Fig 10 The PCL spectra of unannealed compact (1) and compacts annealed at 530C (2)
750C (3) 950C (4) 1100C (5) 1300C (6)
wwwintechopencom
Cathodoluminescence
46
The bands with the frequencies of 1615 and 1702 cm-1 correspond to vibrations of the molecular ion in the ground state while the frequencies at 966 and 993 cm-1 correspond to the excited state for the two sites of the oxygen molecular ion in the yttria lattice
Fig 12 demonstrates two sites of defects 2O taking into account the occurrence of two types
of natural vacancies about we talked earlier
Fig 11 The PCL of oxygen molecular ions
Fig 12 Two sites of oxygen molecular ions defects in lattice of cubic Y2O3
Fig 13 presents two potentional curves and formation of luminescence bands The lowest
excited state A2u of the oxygen molecular ion can be stabilized
The observed luminescence band results of the transition from the vibration level Vrsquo=0 of
the excited electronic state A2u to one vibration level Vrsquorsquo=3 of the ground state X2g The
wwwintechopencom
What is the Pulsed Cathodoluminescence
47
bands at 6306 and 6556 nm are formed due to the transition to the vibration level of the groun state with the participation of lattice phonons For the first curve the phonon energy is 255 cm while for the second curve it is 244 cm-1 These phonons are observed in the Raman spectrum The excited electronic state of the molecular ion is spaced from the ground state by 20660-21580 cm-1 [Solomonov et al 2011]
Fig 13 Configuration curves for two sites of oxygen molecular ions
On the basis of the qualitative luminescent analysis of Nd3+Y2O3 the determination of neodymium concentration by means of the calibration curve construction is possible
because of intensity of neodymium lines is proportional to it concentration INd(i)=aiCNd (for example 750 or 825 nm) However we canrsquot use this equation because PCL spectrum is characterized by the instability Therefore we also chose lightsums ratio as analytic parameter in regions of 730-840 nm and 350-840 nm The first region of Nd3+Y2O3 spectrum involves only neodymium bands but the second one includes in addition the intrinsic band which is distorted by the neodymium absorption and can be ascribed as follows
wwwintechopencom
Cathodoluminescence
48
0
1 exp( )( ) i Nd
YO i ii Nd
k C lI I
k C (12)
Here I0i l ki are the intensity of i ndash intrinsic band without absorption the thickness of samples coefficient of absorption of i ndash band respectively Hence relation of lightsums ratio (S(350-840)S(730-840)) with CNd has to include the equation (12) Really this relation is decribed by the following equation
2
1 exp( )(350 840)
(730 840)Nd
Nd
B CSA D
S C
(13)
Fig 14 demonstrates the calibration curve (r2gt099) for the determination of neodymium concentration in region of 011 ndash 107 at
Fig 14 The calibration curve for the determination of neodymium concentration in region of 011 ndash 107 at
4 Conclusion
Thus the possibility of realization of rapid nondestructive qualitative and quantitative luminescent analyses of laser materials in particular Nd3+Y3Al5O12 Nd3+Y2O3 with the help of pulsed cathodoluminescence was shown
5 References
Bagaev S Osipov V Ivanov M Solomonov V Platonov V Orlov A Rasuleva A amp Vatnik S (2009)Fabrication and characteristics of neodymium ndash activated yttrium oxide optical ceramics Optical Materials Vol31 pp 740-743 ISSN 0925-3467
wwwintechopencom
What is the Pulsed Cathodoluminescence
49
Bogdankevich O Darznik S amp Eliseev P (1975) Semiconductor lasers Nauka Moscow Russia
Bordun O Bordun I amp Novosad S (1995) Luminescence centres into Y2O3 Journal of applied spectroscopy Vol62 No6 pp 91-95 ISSN 0021-9037
Bordun O (2002) Influence of oxygen vacancies on the luminescence spectra of thin Y2O3 films Journal of applied spectroscopy Vol69 No3 pp 371-374 ISSN 0021-9037
Chang N (1966) Energy levels and crystal ndash field splittings of Nd3+ in yttrium oxide J Chem Phys Vol44 pp 4044-4050 ISSN 0021-9606
Chukichev M Sabri D Sokolov V amp Surcova T (1990) Cathodoluminescence of solid solution Zn1-xMnxSe Optics and Spectroscopy Vol68 pp 2000-2021 ISSN 0030-4034
Connor O (1964) A theory of thermoluminescence of fluorite (CaF2Y) Radiative recombination from highly associated electron ndash hole pairs Appl Phys Lett Vol4 No1 pp 126-129 ISSN 0003-6951
Galkin G (1981) The interband processes of the recombination into semiconductors at high excitation level Proceedings of the PN Lebedev Physical Institute (Trudi FIAN) Vol128 pp 3-64
Hoskins H amp Soffer B (1963) Stimulated emission from Y2O3Nd3+ Appl Phys Lett Vol4 pp 22-23 ISSN 0003-6951
Ikesue A Kinoshita T Kamata K amp Yoshida K (1995) Fabrication and optical properties of high-performance polycrystalline NdYAG ceramics for solid-state lasers J Amer Ceram Soc Vol78 pp 1033-1040 ISSN 1551-2916
Kolomiycev A Meylman M Volodina I Chukichev M Smagin A amp Bagdasarov H (1982) Luminescence of neodymium ndash activated yttrium ndash aluminum garnet crystals in ultra-violet and visible ranges at high energy excitation Deposition in VINITI No 5995-82 pp 1-15
Kolomiycev A Meylman M Volodina I Chukichev M Smagin A amp Bagdasarov H (1984) Luminescence of neodymium ndash activated yttrium ndash aluminum garnet crystals in ultra-violet and visible ranges at high energy excitation Optics and Spectroscopy Vol56 pp 365-367 ISSN 0030-4034
Koningstein J amp Geusic J (1964)Energy levels and crystal ndash field calculations of neodymium in yttrium aluminum garnet Phys Rev Vol136 No 3A pp 711-716 ISSN 1893-1912
Kotov Yu Osipov V Ivanov M Samatov O Platonov V Azarkevich E Murzakayev A amp Medvedev A (2002) Properties of oxide nanopowders prepared by target evaporation with a pulse ndash periodic CO2 laser Technical Physics Vol47 No11 pp 1420-1426 ISSN 1063-7842
Kuznetsov A Abramov V Rooze N amp Savikhina T (1978) Autolocalized excitons into Y2O3 JETP Letters Vol28 No10 pp 602-605 ISSN 0021-3640
Lu J Murai T Takaichi K Ueda K Yagi H Yanagitani T amp Kaminskii A (2001) Nd3+Y2O3 ceramic laser Jpn J Appl Phys Vol40 pp 1277-1279 ISSN 0021-4922
Lupei V Lupei A Tiseanu C Georgescu S Stoicescu C amp Nanau P (1995) High ndash resolution optical spectroscopy of YAG Nd A test for structural and distribution models Phys Rev B Vol51 No1 pp 8-17 ISSN 0003-6951
Mesyats G (1974) Generating of highpower nanosecond pulses The Soviet radio Moscow Russia
wwwintechopencom
Cathodoluminescence
50
Mesyats G Shpak V Yalandin M amp Shunailov S (1992) Compact RADAN electron accelerators for testing new radiation technologies and sterilization Radiat Phys Chem Vol46 pp 489-492 ISSN 0969-806X
Michailov S Osipov V amp Solomonov V (2001) Pulsed cathodoluminescent analyzer of materials Pribory i tekhnika eksperimenta No3 pp 164-165 ISSN 0032-8162
Osipov V Solomonov V Platonov V Snigireva O Ivanov V amp Lisenkov V (2005) Laser plume spectroscopy 2 Graphite yttrium ndash stabilized and zirconium oxide targets Quantum Electron Vol35 No7 pp 633-637 ISSN 0368-7147
Osipov V Rasuleva A amp Solomonov V (2008) Luminescence of pure yttria Optics and Spectroscopy Vol105 No4 pp 524-530 ISSN 0030-400X
Osipov V Solomonov V Spirina A Ivanov M amp Orlov A (2009) Luminescence of yttrium oxide doped with neodymium Optics and Spectroscopy Vol106 No1 pp 78-83 ISSN 0030-400X
Osipov V Solomonov V amp Spirina A (2011) Luminescent investigation of neodymium doped yttrium aluminates J of Optical Technology Vol78 No6 pp 81-87 ISSN 0030-4042
Pearse R amp Gaydon A (1949) The identification of molecular spectra Inostrannaya Literatura Moscow Russia
Petrov V (1996) Cathodoluminescent microscopy Physics - Uspekhi Vol39 pp 807-818 ISSN 0042-1294
Ramseyer K Fisher J Matter A Eberhardt P amp Geiss J (1989) A cathodoluminescence microscope for low intensity luminescence Journal of Sedimentary Research Vol59 pp 619-622 ISSN 0022-4472
Ramseyer K amp Millis J (1990) Factors influencing short-lived blue cathodoluminescence in
- quartz Journal of Sedimentary Research Vol59 pp 619-622 ISSN 0003-004X Schaak G amp Koningstein J (1970) Phonon and electronic raman spectra of cubic rare-earth
oxides and isomorphous ittrium oxide J Opt Soc Amer Vol60 No8 pp 1110-1115 ISSN 1551-2916
Solomonov V amp Michailov S (2003) Pulsed cathodoluminescence and its application for the analysis of condensed substances UB RAS ISBN 5-7691-1357-X Yekaterinburg Russia
Solomonv V (2003) Kinetics of pulsed cathodoluminescence Optics and Spectroscopy Vol95 pp 248-254 ISSN 0030-4034
Solomonv V Michailov S amp Deykun A (1996) About the mecanism of excitation and the structure of the pulsed cathodoluminescence bands of Cr3+ Mn2+ impurity ions into minerals Optics and Spectroscopy Vol80 pp 447-458 ISSN 0030-4034
Vaysburd D Semin B Tavanov E Matlis S Balichev I amp Gering G (1982) Highenergy electronics of solid Nauka Novosibirsk Russia
Yang B Luff B amp Townsend F (1992) Chatodoluminescence of natural zircons J Phys Condens Matter Vol4 pp 5617-5624 ISSN 0953-8984
wwwintechopencom
CathodoluminescenceEdited by Dr Naoki Yamamoto
ISBN 978-953-51-0362-2Hard cover 324 pagesPublisher InTechPublished online 28 March 2012Published in print edition March 2012
InTech EuropeUniversity Campus STeP Ri Slavka Krautzeka 83A 51000 Rijeka Croatia Phone +385 (51) 770 447 Fax +385 (51) 686 166wwwintechopencom
InTech ChinaUnit 405 Office Block Hotel Equatorial Shanghai No65 Yan An Road (West) Shanghai 200040 China
Phone +86-21-62489820 Fax +86-21-62489821
Cathodoluminescence (CL) is a non-destructive technique to characterize optical and electronic properties ofnanostructures in many kinds of materials Major subject is to investigate basic parameters in semiconductorsimpurities in oxides and phase determination of minerals CL gives information on carrier concentrationdiffusion length and life time of minority carriers in semiconductors and impurity concentration and phasecomposition in composite materials This book involves 13 chapters to present the basics in the CL techniqueand applications to particles thin films and nanostructures in semiconductors oxides and minerals Thechapters covered in this book include recent development of CL technique and applications to wide range ofmaterials used in modern material science
How to referenceIn order to correctly reference this scholarly work feel free to copy and paste the following
Vladimir Solomonov and Alfiya Spirina (2012) What is the Pulsed CathodoluminescenceCathodoluminescence Dr Naoki Yamamoto (Ed) ISBN 978-953-51-0362-2 InTech Available fromhttpwwwintechopencombookscathodoluminescencewhat-is-the-pulsed-cathodoluminescence-
copy 2012 The Author(s) Licensee IntechOpen This is an open access articledistributed under the terms of the Creative Commons Attribution 30License which permits unrestricted use distribution and reproduction inany medium provided the original work is properly cited
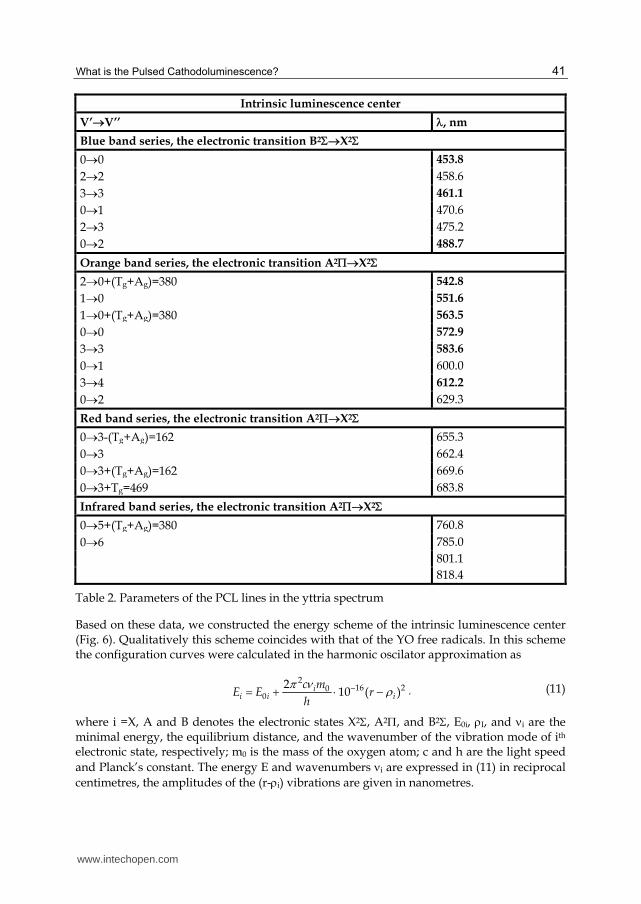
What is the Pulsed Cathodoluminescence
41
Intrinsic luminescence center
VrsquoVrsquorsquo nm
Blue band series the electronic transition B2X2
00 4538
22 4586
33 4611
01 4706
23 4752
02 4887
Orange band series the electronic transition A2X2
20+(Tg+Ag)=380 5428
10 5516
10+(Tg+Ag)=380 5635
00 5729
33 5836
01 6000
34 6122
02 6293
Red band series the electronic transition A2X2
03-(Tg+Ag)=162 6553
03 6624
03+(Tg+Ag)=162 6696
03+Tg=469 6838
Infrared band series the electronic transition A2X2
05+(Tg+Ag)=380 7608
06 7850
8011
8184
Table 2 Parameters of the PCL lines in the yttria spectrum
Based on these data we constructed the energy scheme of the intrinsic luminescence center (Fig 6) Qualitatively this scheme coincides with that of the YO free radicals In this scheme the configuration curves were calculated in the harmonic oscilator approximation as
216 20
0
210 ( )i
i i i
c mE E r
h
(11)
where i =X A and B denotes the electronic states X2 A2 and B2 E0i I and i are the minimal energy the equilibrium distance and the wavenumber of the vibration mode of ith electronic state respectively m0 is the mass of the oxygen atom c and h are the light speed
and Planckrsquos constant The energy E and wavenumbers i are expressed in (11) in reciprocal
centimetres the amplitudes of the (r-i) vibrations are given in nanometres
wwwintechopencom
Cathodoluminescence
42
Fig 6 Energy scheme of the intrinsic luminescence center
For the configuration curves of the X2 A2 and B2 states (Fig 6) E0i=0 17510 and 22090
cm-1 and i=786 675 and 675 cm-1 respectively With these parameters up to the measurement error the wavelengths of pulsed cathodoluminescence coincide with the wavelengths of the optical transitions shown in Table 2 The Franck ndash Condon principle for
molecular transitions is most precisely implemented at A=X+10870910-3 nm and
B=X+1235110-3 nm and X can be estimated as half of elementary cube edge X=01385 nm For electronic ndash vibration transitions for which one of the vibration quantum numbers V is large this principle is implemented only if these transitions involve the most strong phonons [Schaak et al 1970] Table 2 Under these parameters the configuration curves of
the electronic states A2 and B2 intersect at the point with E=25256 cm-1
The qualitative coincidence of the emission bands and the energy structure of intrinsic luminescence centres observed by us and YO free radicals allow us to conclude that intrinsic luminescence centres in yttria contain bound YO radicals [Osipov et al 2008] Consider the possibility of formation of such intrinsic luminescence centre It is known [Schaak et al 1970] that the cubic yttria has unit cell composed of 16 formula units Y2O3 Twenty four cations occupy positions with C2 symmetry and eight cations occupy the positions with C3i symmetry (Fig 7) Every cation is surrounded by six oxygen ions which are positioned on the corners of deformed cube with the edge size of 02702 nm at that two corners is unoccupied Thus in one-third of the cubes (YO6) two oxygen vacancies are located at the cube corners along the face diagonal while in the remaining cubes they are located along the body diagonal (Fig 7)
For such packing a structure presented in Fig 8 can be formed at the outer cube face that contains two oxygen vacancies and that is located at the crystal boundary In essence this structure is the YO radical bound to the crystal lattice by the yttriun ion On such surfaces
the fraction of faces with two oxygen vacancies is 1316=118 and the average distance
wwwintechopencom
What is the Pulsed Cathodoluminescence
43
between them is about 5 nm All of this leads to the dependence of the luminescence spectrum of such bound radicals on the particle size of yttria mainly via their shape
Fig 7 The unit cell of yttria The yttrium positions with C3i and C2 symmetry designated by red and pink balls respectively The oxygen and the vacant positions designated by blue and grey balls The vacant positions are associated by green dot line
Fig 8 The structure of intrinsic luminescence centre
The considered above intrinsic luminescence centre also presents in Nd3+Y2O3 However the presence of neodymium results in decrease of the intrinsic band intensity and distortion of its profile We studied the monoclinic and cubic Nd3+Y2O3 nanopowders The nanopowders
were prepared using a mixture of micropowder -Y2O3 phase and 1 mol Nd2O3 powder After evaporation of this mixture by CO2 laser Nd3+Y2O3 nanoparticles were crystallized into monoclinic phase To transfer nanopowders into cubic phase annealing in air was
carried out above 900C [Kotov et al 2002]
wwwintechopencom
Cathodoluminescence
44
The PCL spectra of all Nd3+Y2O3 samples contain emission lines of neodymium ions which have not been previously observed in photoluminescence Namely neodymium doped nanopowders exhibit a strong band peaking at 825 nm (Fig 9)
Fig 9 The PCL spectra of monoclinic (1) and cubic (2) Nd3+Y2O3 nanopowders
Its components correspond well to the 4F524I92 (825 811 834 nm) and 2H924I92 (818 nm) optical transitions between Nd3+ Starkrsquos sublevels with the energies in Y2O3 cubic lattice [Chang 1966] These components are resolved only in cubic samples (Fig 9) Therefore the splitting of Starkrsquos components allows us to conclude about the presence of the dominant phase into Nd3+Y2O3
To check this assumption the additional investigations were made In Fig 10 the PCL spectra of pressed nanopowders (compacts) are presented The compacts were annealed at
530 750 950 1100 and 1300C The X-ray analysis for this samples showed that the
unannealed compact and annealed compact at 530C have monoclinic phase all remaining compacts are cubic samples It is shown that the splitting of neodymium band at region of 800-840 nm only takes place in cubic samples and one component appears at 825 nm in monoclinic samples
In addition to the band in the region of 800-840 nm two emission bands of neodymium ions
arise in the Nd3+Y2O3 These are a weak band at 720 nm due to 4F924I92 transition and stronger band at 750 nm with the components due to the transitions between the Stark
sublevels 4F724I92 and 4S32 4I92
The intensity weaking of intrinsic band into Nd3+Y2O3 is associated with the quantitative decrease of this centres since the part of yttrium ions are replaced by the neodymium ions The distortion of the intrinsic band is determined by the neodymium absorption of it The most absorption is observed in region at 560-613 nm [Osipov et al 2009]
wwwintechopencom
What is the Pulsed Cathodoluminescence
45
In addition to the present bands into Nd3+Y2O3 the appearance of four well-resolved components in the range of 610-660 nm can be seen The specta of this band for compacts
annealed at 950 and 1300C are presented in Fig 11 The band contains the following four narrow lines at 6206 6306 6453 6556 nm which we identify using Raman spectra as
luminescence of oxygen molecular ion 2O [Solomonov et al 2011]
Fig 10 The PCL spectra of unannealed compact (1) and compacts annealed at 530C (2)
750C (3) 950C (4) 1100C (5) 1300C (6)
wwwintechopencom
Cathodoluminescence
46
The bands with the frequencies of 1615 and 1702 cm-1 correspond to vibrations of the molecular ion in the ground state while the frequencies at 966 and 993 cm-1 correspond to the excited state for the two sites of the oxygen molecular ion in the yttria lattice
Fig 12 demonstrates two sites of defects 2O taking into account the occurrence of two types
of natural vacancies about we talked earlier
Fig 11 The PCL of oxygen molecular ions
Fig 12 Two sites of oxygen molecular ions defects in lattice of cubic Y2O3
Fig 13 presents two potentional curves and formation of luminescence bands The lowest
excited state A2u of the oxygen molecular ion can be stabilized
The observed luminescence band results of the transition from the vibration level Vrsquo=0 of
the excited electronic state A2u to one vibration level Vrsquorsquo=3 of the ground state X2g The
wwwintechopencom
What is the Pulsed Cathodoluminescence
47
bands at 6306 and 6556 nm are formed due to the transition to the vibration level of the groun state with the participation of lattice phonons For the first curve the phonon energy is 255 cm while for the second curve it is 244 cm-1 These phonons are observed in the Raman spectrum The excited electronic state of the molecular ion is spaced from the ground state by 20660-21580 cm-1 [Solomonov et al 2011]
Fig 13 Configuration curves for two sites of oxygen molecular ions
On the basis of the qualitative luminescent analysis of Nd3+Y2O3 the determination of neodymium concentration by means of the calibration curve construction is possible
because of intensity of neodymium lines is proportional to it concentration INd(i)=aiCNd (for example 750 or 825 nm) However we canrsquot use this equation because PCL spectrum is characterized by the instability Therefore we also chose lightsums ratio as analytic parameter in regions of 730-840 nm and 350-840 nm The first region of Nd3+Y2O3 spectrum involves only neodymium bands but the second one includes in addition the intrinsic band which is distorted by the neodymium absorption and can be ascribed as follows
wwwintechopencom
Cathodoluminescence
48
0
1 exp( )( ) i Nd
YO i ii Nd
k C lI I
k C (12)
Here I0i l ki are the intensity of i ndash intrinsic band without absorption the thickness of samples coefficient of absorption of i ndash band respectively Hence relation of lightsums ratio (S(350-840)S(730-840)) with CNd has to include the equation (12) Really this relation is decribed by the following equation
2
1 exp( )(350 840)
(730 840)Nd
Nd
B CSA D
S C
(13)
Fig 14 demonstrates the calibration curve (r2gt099) for the determination of neodymium concentration in region of 011 ndash 107 at
Fig 14 The calibration curve for the determination of neodymium concentration in region of 011 ndash 107 at
4 Conclusion
Thus the possibility of realization of rapid nondestructive qualitative and quantitative luminescent analyses of laser materials in particular Nd3+Y3Al5O12 Nd3+Y2O3 with the help of pulsed cathodoluminescence was shown
5 References
Bagaev S Osipov V Ivanov M Solomonov V Platonov V Orlov A Rasuleva A amp Vatnik S (2009)Fabrication and characteristics of neodymium ndash activated yttrium oxide optical ceramics Optical Materials Vol31 pp 740-743 ISSN 0925-3467
wwwintechopencom
What is the Pulsed Cathodoluminescence
49
Bogdankevich O Darznik S amp Eliseev P (1975) Semiconductor lasers Nauka Moscow Russia
Bordun O Bordun I amp Novosad S (1995) Luminescence centres into Y2O3 Journal of applied spectroscopy Vol62 No6 pp 91-95 ISSN 0021-9037
Bordun O (2002) Influence of oxygen vacancies on the luminescence spectra of thin Y2O3 films Journal of applied spectroscopy Vol69 No3 pp 371-374 ISSN 0021-9037
Chang N (1966) Energy levels and crystal ndash field splittings of Nd3+ in yttrium oxide J Chem Phys Vol44 pp 4044-4050 ISSN 0021-9606
Chukichev M Sabri D Sokolov V amp Surcova T (1990) Cathodoluminescence of solid solution Zn1-xMnxSe Optics and Spectroscopy Vol68 pp 2000-2021 ISSN 0030-4034
Connor O (1964) A theory of thermoluminescence of fluorite (CaF2Y) Radiative recombination from highly associated electron ndash hole pairs Appl Phys Lett Vol4 No1 pp 126-129 ISSN 0003-6951
Galkin G (1981) The interband processes of the recombination into semiconductors at high excitation level Proceedings of the PN Lebedev Physical Institute (Trudi FIAN) Vol128 pp 3-64
Hoskins H amp Soffer B (1963) Stimulated emission from Y2O3Nd3+ Appl Phys Lett Vol4 pp 22-23 ISSN 0003-6951
Ikesue A Kinoshita T Kamata K amp Yoshida K (1995) Fabrication and optical properties of high-performance polycrystalline NdYAG ceramics for solid-state lasers J Amer Ceram Soc Vol78 pp 1033-1040 ISSN 1551-2916
Kolomiycev A Meylman M Volodina I Chukichev M Smagin A amp Bagdasarov H (1982) Luminescence of neodymium ndash activated yttrium ndash aluminum garnet crystals in ultra-violet and visible ranges at high energy excitation Deposition in VINITI No 5995-82 pp 1-15
Kolomiycev A Meylman M Volodina I Chukichev M Smagin A amp Bagdasarov H (1984) Luminescence of neodymium ndash activated yttrium ndash aluminum garnet crystals in ultra-violet and visible ranges at high energy excitation Optics and Spectroscopy Vol56 pp 365-367 ISSN 0030-4034
Koningstein J amp Geusic J (1964)Energy levels and crystal ndash field calculations of neodymium in yttrium aluminum garnet Phys Rev Vol136 No 3A pp 711-716 ISSN 1893-1912
Kotov Yu Osipov V Ivanov M Samatov O Platonov V Azarkevich E Murzakayev A amp Medvedev A (2002) Properties of oxide nanopowders prepared by target evaporation with a pulse ndash periodic CO2 laser Technical Physics Vol47 No11 pp 1420-1426 ISSN 1063-7842
Kuznetsov A Abramov V Rooze N amp Savikhina T (1978) Autolocalized excitons into Y2O3 JETP Letters Vol28 No10 pp 602-605 ISSN 0021-3640
Lu J Murai T Takaichi K Ueda K Yagi H Yanagitani T amp Kaminskii A (2001) Nd3+Y2O3 ceramic laser Jpn J Appl Phys Vol40 pp 1277-1279 ISSN 0021-4922
Lupei V Lupei A Tiseanu C Georgescu S Stoicescu C amp Nanau P (1995) High ndash resolution optical spectroscopy of YAG Nd A test for structural and distribution models Phys Rev B Vol51 No1 pp 8-17 ISSN 0003-6951
Mesyats G (1974) Generating of highpower nanosecond pulses The Soviet radio Moscow Russia
wwwintechopencom
Cathodoluminescence
50
Mesyats G Shpak V Yalandin M amp Shunailov S (1992) Compact RADAN electron accelerators for testing new radiation technologies and sterilization Radiat Phys Chem Vol46 pp 489-492 ISSN 0969-806X
Michailov S Osipov V amp Solomonov V (2001) Pulsed cathodoluminescent analyzer of materials Pribory i tekhnika eksperimenta No3 pp 164-165 ISSN 0032-8162
Osipov V Solomonov V Platonov V Snigireva O Ivanov V amp Lisenkov V (2005) Laser plume spectroscopy 2 Graphite yttrium ndash stabilized and zirconium oxide targets Quantum Electron Vol35 No7 pp 633-637 ISSN 0368-7147
Osipov V Rasuleva A amp Solomonov V (2008) Luminescence of pure yttria Optics and Spectroscopy Vol105 No4 pp 524-530 ISSN 0030-400X
Osipov V Solomonov V Spirina A Ivanov M amp Orlov A (2009) Luminescence of yttrium oxide doped with neodymium Optics and Spectroscopy Vol106 No1 pp 78-83 ISSN 0030-400X
Osipov V Solomonov V amp Spirina A (2011) Luminescent investigation of neodymium doped yttrium aluminates J of Optical Technology Vol78 No6 pp 81-87 ISSN 0030-4042
Pearse R amp Gaydon A (1949) The identification of molecular spectra Inostrannaya Literatura Moscow Russia
Petrov V (1996) Cathodoluminescent microscopy Physics - Uspekhi Vol39 pp 807-818 ISSN 0042-1294
Ramseyer K Fisher J Matter A Eberhardt P amp Geiss J (1989) A cathodoluminescence microscope for low intensity luminescence Journal of Sedimentary Research Vol59 pp 619-622 ISSN 0022-4472
Ramseyer K amp Millis J (1990) Factors influencing short-lived blue cathodoluminescence in
- quartz Journal of Sedimentary Research Vol59 pp 619-622 ISSN 0003-004X Schaak G amp Koningstein J (1970) Phonon and electronic raman spectra of cubic rare-earth
oxides and isomorphous ittrium oxide J Opt Soc Amer Vol60 No8 pp 1110-1115 ISSN 1551-2916
Solomonov V amp Michailov S (2003) Pulsed cathodoluminescence and its application for the analysis of condensed substances UB RAS ISBN 5-7691-1357-X Yekaterinburg Russia
Solomonv V (2003) Kinetics of pulsed cathodoluminescence Optics and Spectroscopy Vol95 pp 248-254 ISSN 0030-4034
Solomonv V Michailov S amp Deykun A (1996) About the mecanism of excitation and the structure of the pulsed cathodoluminescence bands of Cr3+ Mn2+ impurity ions into minerals Optics and Spectroscopy Vol80 pp 447-458 ISSN 0030-4034
Vaysburd D Semin B Tavanov E Matlis S Balichev I amp Gering G (1982) Highenergy electronics of solid Nauka Novosibirsk Russia
Yang B Luff B amp Townsend F (1992) Chatodoluminescence of natural zircons J Phys Condens Matter Vol4 pp 5617-5624 ISSN 0953-8984
wwwintechopencom
CathodoluminescenceEdited by Dr Naoki Yamamoto
ISBN 978-953-51-0362-2Hard cover 324 pagesPublisher InTechPublished online 28 March 2012Published in print edition March 2012
InTech EuropeUniversity Campus STeP Ri Slavka Krautzeka 83A 51000 Rijeka Croatia Phone +385 (51) 770 447 Fax +385 (51) 686 166wwwintechopencom
InTech ChinaUnit 405 Office Block Hotel Equatorial Shanghai No65 Yan An Road (West) Shanghai 200040 China
Phone +86-21-62489820 Fax +86-21-62489821
Cathodoluminescence (CL) is a non-destructive technique to characterize optical and electronic properties ofnanostructures in many kinds of materials Major subject is to investigate basic parameters in semiconductorsimpurities in oxides and phase determination of minerals CL gives information on carrier concentrationdiffusion length and life time of minority carriers in semiconductors and impurity concentration and phasecomposition in composite materials This book involves 13 chapters to present the basics in the CL techniqueand applications to particles thin films and nanostructures in semiconductors oxides and minerals Thechapters covered in this book include recent development of CL technique and applications to wide range ofmaterials used in modern material science
How to referenceIn order to correctly reference this scholarly work feel free to copy and paste the following
Vladimir Solomonov and Alfiya Spirina (2012) What is the Pulsed CathodoluminescenceCathodoluminescence Dr Naoki Yamamoto (Ed) ISBN 978-953-51-0362-2 InTech Available fromhttpwwwintechopencombookscathodoluminescencewhat-is-the-pulsed-cathodoluminescence-
copy 2012 The Author(s) Licensee IntechOpen This is an open access articledistributed under the terms of the Creative Commons Attribution 30License which permits unrestricted use distribution and reproduction inany medium provided the original work is properly cited
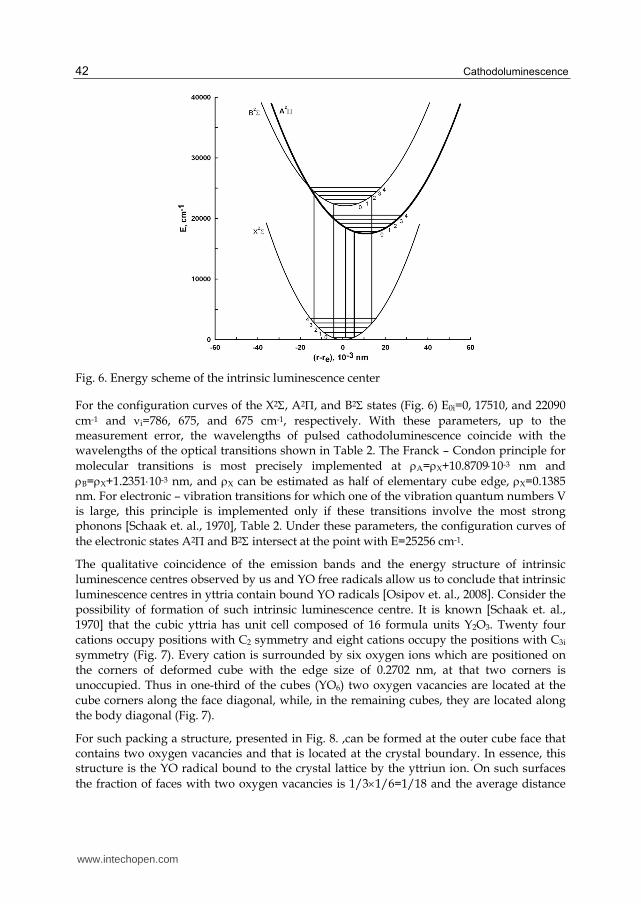
Cathodoluminescence
42
Fig 6 Energy scheme of the intrinsic luminescence center
For the configuration curves of the X2 A2 and B2 states (Fig 6) E0i=0 17510 and 22090
cm-1 and i=786 675 and 675 cm-1 respectively With these parameters up to the measurement error the wavelengths of pulsed cathodoluminescence coincide with the wavelengths of the optical transitions shown in Table 2 The Franck ndash Condon principle for
molecular transitions is most precisely implemented at A=X+10870910-3 nm and
B=X+1235110-3 nm and X can be estimated as half of elementary cube edge X=01385 nm For electronic ndash vibration transitions for which one of the vibration quantum numbers V is large this principle is implemented only if these transitions involve the most strong phonons [Schaak et al 1970] Table 2 Under these parameters the configuration curves of
the electronic states A2 and B2 intersect at the point with E=25256 cm-1
The qualitative coincidence of the emission bands and the energy structure of intrinsic luminescence centres observed by us and YO free radicals allow us to conclude that intrinsic luminescence centres in yttria contain bound YO radicals [Osipov et al 2008] Consider the possibility of formation of such intrinsic luminescence centre It is known [Schaak et al 1970] that the cubic yttria has unit cell composed of 16 formula units Y2O3 Twenty four cations occupy positions with C2 symmetry and eight cations occupy the positions with C3i symmetry (Fig 7) Every cation is surrounded by six oxygen ions which are positioned on the corners of deformed cube with the edge size of 02702 nm at that two corners is unoccupied Thus in one-third of the cubes (YO6) two oxygen vacancies are located at the cube corners along the face diagonal while in the remaining cubes they are located along the body diagonal (Fig 7)
For such packing a structure presented in Fig 8 can be formed at the outer cube face that contains two oxygen vacancies and that is located at the crystal boundary In essence this structure is the YO radical bound to the crystal lattice by the yttriun ion On such surfaces
the fraction of faces with two oxygen vacancies is 1316=118 and the average distance
wwwintechopencom
What is the Pulsed Cathodoluminescence
43
between them is about 5 nm All of this leads to the dependence of the luminescence spectrum of such bound radicals on the particle size of yttria mainly via their shape
Fig 7 The unit cell of yttria The yttrium positions with C3i and C2 symmetry designated by red and pink balls respectively The oxygen and the vacant positions designated by blue and grey balls The vacant positions are associated by green dot line
Fig 8 The structure of intrinsic luminescence centre
The considered above intrinsic luminescence centre also presents in Nd3+Y2O3 However the presence of neodymium results in decrease of the intrinsic band intensity and distortion of its profile We studied the monoclinic and cubic Nd3+Y2O3 nanopowders The nanopowders
were prepared using a mixture of micropowder -Y2O3 phase and 1 mol Nd2O3 powder After evaporation of this mixture by CO2 laser Nd3+Y2O3 nanoparticles were crystallized into monoclinic phase To transfer nanopowders into cubic phase annealing in air was
carried out above 900C [Kotov et al 2002]
wwwintechopencom
Cathodoluminescence
44
The PCL spectra of all Nd3+Y2O3 samples contain emission lines of neodymium ions which have not been previously observed in photoluminescence Namely neodymium doped nanopowders exhibit a strong band peaking at 825 nm (Fig 9)
Fig 9 The PCL spectra of monoclinic (1) and cubic (2) Nd3+Y2O3 nanopowders
Its components correspond well to the 4F524I92 (825 811 834 nm) and 2H924I92 (818 nm) optical transitions between Nd3+ Starkrsquos sublevels with the energies in Y2O3 cubic lattice [Chang 1966] These components are resolved only in cubic samples (Fig 9) Therefore the splitting of Starkrsquos components allows us to conclude about the presence of the dominant phase into Nd3+Y2O3
To check this assumption the additional investigations were made In Fig 10 the PCL spectra of pressed nanopowders (compacts) are presented The compacts were annealed at
530 750 950 1100 and 1300C The X-ray analysis for this samples showed that the
unannealed compact and annealed compact at 530C have monoclinic phase all remaining compacts are cubic samples It is shown that the splitting of neodymium band at region of 800-840 nm only takes place in cubic samples and one component appears at 825 nm in monoclinic samples
In addition to the band in the region of 800-840 nm two emission bands of neodymium ions
arise in the Nd3+Y2O3 These are a weak band at 720 nm due to 4F924I92 transition and stronger band at 750 nm with the components due to the transitions between the Stark
sublevels 4F724I92 and 4S32 4I92
The intensity weaking of intrinsic band into Nd3+Y2O3 is associated with the quantitative decrease of this centres since the part of yttrium ions are replaced by the neodymium ions The distortion of the intrinsic band is determined by the neodymium absorption of it The most absorption is observed in region at 560-613 nm [Osipov et al 2009]
wwwintechopencom
What is the Pulsed Cathodoluminescence
45
In addition to the present bands into Nd3+Y2O3 the appearance of four well-resolved components in the range of 610-660 nm can be seen The specta of this band for compacts
annealed at 950 and 1300C are presented in Fig 11 The band contains the following four narrow lines at 6206 6306 6453 6556 nm which we identify using Raman spectra as
luminescence of oxygen molecular ion 2O [Solomonov et al 2011]
Fig 10 The PCL spectra of unannealed compact (1) and compacts annealed at 530C (2)
750C (3) 950C (4) 1100C (5) 1300C (6)
wwwintechopencom
Cathodoluminescence
46
The bands with the frequencies of 1615 and 1702 cm-1 correspond to vibrations of the molecular ion in the ground state while the frequencies at 966 and 993 cm-1 correspond to the excited state for the two sites of the oxygen molecular ion in the yttria lattice
Fig 12 demonstrates two sites of defects 2O taking into account the occurrence of two types
of natural vacancies about we talked earlier
Fig 11 The PCL of oxygen molecular ions
Fig 12 Two sites of oxygen molecular ions defects in lattice of cubic Y2O3
Fig 13 presents two potentional curves and formation of luminescence bands The lowest
excited state A2u of the oxygen molecular ion can be stabilized
The observed luminescence band results of the transition from the vibration level Vrsquo=0 of
the excited electronic state A2u to one vibration level Vrsquorsquo=3 of the ground state X2g The
wwwintechopencom
What is the Pulsed Cathodoluminescence
47
bands at 6306 and 6556 nm are formed due to the transition to the vibration level of the groun state with the participation of lattice phonons For the first curve the phonon energy is 255 cm while for the second curve it is 244 cm-1 These phonons are observed in the Raman spectrum The excited electronic state of the molecular ion is spaced from the ground state by 20660-21580 cm-1 [Solomonov et al 2011]
Fig 13 Configuration curves for two sites of oxygen molecular ions
On the basis of the qualitative luminescent analysis of Nd3+Y2O3 the determination of neodymium concentration by means of the calibration curve construction is possible
because of intensity of neodymium lines is proportional to it concentration INd(i)=aiCNd (for example 750 or 825 nm) However we canrsquot use this equation because PCL spectrum is characterized by the instability Therefore we also chose lightsums ratio as analytic parameter in regions of 730-840 nm and 350-840 nm The first region of Nd3+Y2O3 spectrum involves only neodymium bands but the second one includes in addition the intrinsic band which is distorted by the neodymium absorption and can be ascribed as follows
wwwintechopencom
Cathodoluminescence
48
0
1 exp( )( ) i Nd
YO i ii Nd
k C lI I
k C (12)
Here I0i l ki are the intensity of i ndash intrinsic band without absorption the thickness of samples coefficient of absorption of i ndash band respectively Hence relation of lightsums ratio (S(350-840)S(730-840)) with CNd has to include the equation (12) Really this relation is decribed by the following equation
2
1 exp( )(350 840)
(730 840)Nd
Nd
B CSA D
S C
(13)
Fig 14 demonstrates the calibration curve (r2gt099) for the determination of neodymium concentration in region of 011 ndash 107 at
Fig 14 The calibration curve for the determination of neodymium concentration in region of 011 ndash 107 at
4 Conclusion
Thus the possibility of realization of rapid nondestructive qualitative and quantitative luminescent analyses of laser materials in particular Nd3+Y3Al5O12 Nd3+Y2O3 with the help of pulsed cathodoluminescence was shown
5 References
Bagaev S Osipov V Ivanov M Solomonov V Platonov V Orlov A Rasuleva A amp Vatnik S (2009)Fabrication and characteristics of neodymium ndash activated yttrium oxide optical ceramics Optical Materials Vol31 pp 740-743 ISSN 0925-3467
wwwintechopencom
What is the Pulsed Cathodoluminescence
49
Bogdankevich O Darznik S amp Eliseev P (1975) Semiconductor lasers Nauka Moscow Russia
Bordun O Bordun I amp Novosad S (1995) Luminescence centres into Y2O3 Journal of applied spectroscopy Vol62 No6 pp 91-95 ISSN 0021-9037
Bordun O (2002) Influence of oxygen vacancies on the luminescence spectra of thin Y2O3 films Journal of applied spectroscopy Vol69 No3 pp 371-374 ISSN 0021-9037
Chang N (1966) Energy levels and crystal ndash field splittings of Nd3+ in yttrium oxide J Chem Phys Vol44 pp 4044-4050 ISSN 0021-9606
Chukichev M Sabri D Sokolov V amp Surcova T (1990) Cathodoluminescence of solid solution Zn1-xMnxSe Optics and Spectroscopy Vol68 pp 2000-2021 ISSN 0030-4034
Connor O (1964) A theory of thermoluminescence of fluorite (CaF2Y) Radiative recombination from highly associated electron ndash hole pairs Appl Phys Lett Vol4 No1 pp 126-129 ISSN 0003-6951
Galkin G (1981) The interband processes of the recombination into semiconductors at high excitation level Proceedings of the PN Lebedev Physical Institute (Trudi FIAN) Vol128 pp 3-64
Hoskins H amp Soffer B (1963) Stimulated emission from Y2O3Nd3+ Appl Phys Lett Vol4 pp 22-23 ISSN 0003-6951
Ikesue A Kinoshita T Kamata K amp Yoshida K (1995) Fabrication and optical properties of high-performance polycrystalline NdYAG ceramics for solid-state lasers J Amer Ceram Soc Vol78 pp 1033-1040 ISSN 1551-2916
Kolomiycev A Meylman M Volodina I Chukichev M Smagin A amp Bagdasarov H (1982) Luminescence of neodymium ndash activated yttrium ndash aluminum garnet crystals in ultra-violet and visible ranges at high energy excitation Deposition in VINITI No 5995-82 pp 1-15
Kolomiycev A Meylman M Volodina I Chukichev M Smagin A amp Bagdasarov H (1984) Luminescence of neodymium ndash activated yttrium ndash aluminum garnet crystals in ultra-violet and visible ranges at high energy excitation Optics and Spectroscopy Vol56 pp 365-367 ISSN 0030-4034
Koningstein J amp Geusic J (1964)Energy levels and crystal ndash field calculations of neodymium in yttrium aluminum garnet Phys Rev Vol136 No 3A pp 711-716 ISSN 1893-1912
Kotov Yu Osipov V Ivanov M Samatov O Platonov V Azarkevich E Murzakayev A amp Medvedev A (2002) Properties of oxide nanopowders prepared by target evaporation with a pulse ndash periodic CO2 laser Technical Physics Vol47 No11 pp 1420-1426 ISSN 1063-7842
Kuznetsov A Abramov V Rooze N amp Savikhina T (1978) Autolocalized excitons into Y2O3 JETP Letters Vol28 No10 pp 602-605 ISSN 0021-3640
Lu J Murai T Takaichi K Ueda K Yagi H Yanagitani T amp Kaminskii A (2001) Nd3+Y2O3 ceramic laser Jpn J Appl Phys Vol40 pp 1277-1279 ISSN 0021-4922
Lupei V Lupei A Tiseanu C Georgescu S Stoicescu C amp Nanau P (1995) High ndash resolution optical spectroscopy of YAG Nd A test for structural and distribution models Phys Rev B Vol51 No1 pp 8-17 ISSN 0003-6951
Mesyats G (1974) Generating of highpower nanosecond pulses The Soviet radio Moscow Russia
wwwintechopencom
Cathodoluminescence
50
Mesyats G Shpak V Yalandin M amp Shunailov S (1992) Compact RADAN electron accelerators for testing new radiation technologies and sterilization Radiat Phys Chem Vol46 pp 489-492 ISSN 0969-806X
Michailov S Osipov V amp Solomonov V (2001) Pulsed cathodoluminescent analyzer of materials Pribory i tekhnika eksperimenta No3 pp 164-165 ISSN 0032-8162
Osipov V Solomonov V Platonov V Snigireva O Ivanov V amp Lisenkov V (2005) Laser plume spectroscopy 2 Graphite yttrium ndash stabilized and zirconium oxide targets Quantum Electron Vol35 No7 pp 633-637 ISSN 0368-7147
Osipov V Rasuleva A amp Solomonov V (2008) Luminescence of pure yttria Optics and Spectroscopy Vol105 No4 pp 524-530 ISSN 0030-400X
Osipov V Solomonov V Spirina A Ivanov M amp Orlov A (2009) Luminescence of yttrium oxide doped with neodymium Optics and Spectroscopy Vol106 No1 pp 78-83 ISSN 0030-400X
Osipov V Solomonov V amp Spirina A (2011) Luminescent investigation of neodymium doped yttrium aluminates J of Optical Technology Vol78 No6 pp 81-87 ISSN 0030-4042
Pearse R amp Gaydon A (1949) The identification of molecular spectra Inostrannaya Literatura Moscow Russia
Petrov V (1996) Cathodoluminescent microscopy Physics - Uspekhi Vol39 pp 807-818 ISSN 0042-1294
Ramseyer K Fisher J Matter A Eberhardt P amp Geiss J (1989) A cathodoluminescence microscope for low intensity luminescence Journal of Sedimentary Research Vol59 pp 619-622 ISSN 0022-4472
Ramseyer K amp Millis J (1990) Factors influencing short-lived blue cathodoluminescence in
- quartz Journal of Sedimentary Research Vol59 pp 619-622 ISSN 0003-004X Schaak G amp Koningstein J (1970) Phonon and electronic raman spectra of cubic rare-earth
oxides and isomorphous ittrium oxide J Opt Soc Amer Vol60 No8 pp 1110-1115 ISSN 1551-2916
Solomonov V amp Michailov S (2003) Pulsed cathodoluminescence and its application for the analysis of condensed substances UB RAS ISBN 5-7691-1357-X Yekaterinburg Russia
Solomonv V (2003) Kinetics of pulsed cathodoluminescence Optics and Spectroscopy Vol95 pp 248-254 ISSN 0030-4034
Solomonv V Michailov S amp Deykun A (1996) About the mecanism of excitation and the structure of the pulsed cathodoluminescence bands of Cr3+ Mn2+ impurity ions into minerals Optics and Spectroscopy Vol80 pp 447-458 ISSN 0030-4034
Vaysburd D Semin B Tavanov E Matlis S Balichev I amp Gering G (1982) Highenergy electronics of solid Nauka Novosibirsk Russia
Yang B Luff B amp Townsend F (1992) Chatodoluminescence of natural zircons J Phys Condens Matter Vol4 pp 5617-5624 ISSN 0953-8984
wwwintechopencom
CathodoluminescenceEdited by Dr Naoki Yamamoto
ISBN 978-953-51-0362-2Hard cover 324 pagesPublisher InTechPublished online 28 March 2012Published in print edition March 2012
InTech EuropeUniversity Campus STeP Ri Slavka Krautzeka 83A 51000 Rijeka Croatia Phone +385 (51) 770 447 Fax +385 (51) 686 166wwwintechopencom
InTech ChinaUnit 405 Office Block Hotel Equatorial Shanghai No65 Yan An Road (West) Shanghai 200040 China
Phone +86-21-62489820 Fax +86-21-62489821
Cathodoluminescence (CL) is a non-destructive technique to characterize optical and electronic properties ofnanostructures in many kinds of materials Major subject is to investigate basic parameters in semiconductorsimpurities in oxides and phase determination of minerals CL gives information on carrier concentrationdiffusion length and life time of minority carriers in semiconductors and impurity concentration and phasecomposition in composite materials This book involves 13 chapters to present the basics in the CL techniqueand applications to particles thin films and nanostructures in semiconductors oxides and minerals Thechapters covered in this book include recent development of CL technique and applications to wide range ofmaterials used in modern material science
How to referenceIn order to correctly reference this scholarly work feel free to copy and paste the following
Vladimir Solomonov and Alfiya Spirina (2012) What is the Pulsed CathodoluminescenceCathodoluminescence Dr Naoki Yamamoto (Ed) ISBN 978-953-51-0362-2 InTech Available fromhttpwwwintechopencombookscathodoluminescencewhat-is-the-pulsed-cathodoluminescence-
copy 2012 The Author(s) Licensee IntechOpen This is an open access articledistributed under the terms of the Creative Commons Attribution 30License which permits unrestricted use distribution and reproduction inany medium provided the original work is properly cited

What is the Pulsed Cathodoluminescence
43
between them is about 5 nm All of this leads to the dependence of the luminescence spectrum of such bound radicals on the particle size of yttria mainly via their shape
Fig 7 The unit cell of yttria The yttrium positions with C3i and C2 symmetry designated by red and pink balls respectively The oxygen and the vacant positions designated by blue and grey balls The vacant positions are associated by green dot line
Fig 8 The structure of intrinsic luminescence centre
The considered above intrinsic luminescence centre also presents in Nd3+Y2O3 However the presence of neodymium results in decrease of the intrinsic band intensity and distortion of its profile We studied the monoclinic and cubic Nd3+Y2O3 nanopowders The nanopowders
were prepared using a mixture of micropowder -Y2O3 phase and 1 mol Nd2O3 powder After evaporation of this mixture by CO2 laser Nd3+Y2O3 nanoparticles were crystallized into monoclinic phase To transfer nanopowders into cubic phase annealing in air was
carried out above 900C [Kotov et al 2002]
wwwintechopencom
Cathodoluminescence
44
The PCL spectra of all Nd3+Y2O3 samples contain emission lines of neodymium ions which have not been previously observed in photoluminescence Namely neodymium doped nanopowders exhibit a strong band peaking at 825 nm (Fig 9)
Fig 9 The PCL spectra of monoclinic (1) and cubic (2) Nd3+Y2O3 nanopowders
Its components correspond well to the 4F524I92 (825 811 834 nm) and 2H924I92 (818 nm) optical transitions between Nd3+ Starkrsquos sublevels with the energies in Y2O3 cubic lattice [Chang 1966] These components are resolved only in cubic samples (Fig 9) Therefore the splitting of Starkrsquos components allows us to conclude about the presence of the dominant phase into Nd3+Y2O3
To check this assumption the additional investigations were made In Fig 10 the PCL spectra of pressed nanopowders (compacts) are presented The compacts were annealed at
530 750 950 1100 and 1300C The X-ray analysis for this samples showed that the
unannealed compact and annealed compact at 530C have monoclinic phase all remaining compacts are cubic samples It is shown that the splitting of neodymium band at region of 800-840 nm only takes place in cubic samples and one component appears at 825 nm in monoclinic samples
In addition to the band in the region of 800-840 nm two emission bands of neodymium ions
arise in the Nd3+Y2O3 These are a weak band at 720 nm due to 4F924I92 transition and stronger band at 750 nm with the components due to the transitions between the Stark
sublevels 4F724I92 and 4S32 4I92
The intensity weaking of intrinsic band into Nd3+Y2O3 is associated with the quantitative decrease of this centres since the part of yttrium ions are replaced by the neodymium ions The distortion of the intrinsic band is determined by the neodymium absorption of it The most absorption is observed in region at 560-613 nm [Osipov et al 2009]
wwwintechopencom
What is the Pulsed Cathodoluminescence
45
In addition to the present bands into Nd3+Y2O3 the appearance of four well-resolved components in the range of 610-660 nm can be seen The specta of this band for compacts
annealed at 950 and 1300C are presented in Fig 11 The band contains the following four narrow lines at 6206 6306 6453 6556 nm which we identify using Raman spectra as
luminescence of oxygen molecular ion 2O [Solomonov et al 2011]
Fig 10 The PCL spectra of unannealed compact (1) and compacts annealed at 530C (2)
750C (3) 950C (4) 1100C (5) 1300C (6)
wwwintechopencom
Cathodoluminescence
46
The bands with the frequencies of 1615 and 1702 cm-1 correspond to vibrations of the molecular ion in the ground state while the frequencies at 966 and 993 cm-1 correspond to the excited state for the two sites of the oxygen molecular ion in the yttria lattice
Fig 12 demonstrates two sites of defects 2O taking into account the occurrence of two types
of natural vacancies about we talked earlier
Fig 11 The PCL of oxygen molecular ions
Fig 12 Two sites of oxygen molecular ions defects in lattice of cubic Y2O3
Fig 13 presents two potentional curves and formation of luminescence bands The lowest
excited state A2u of the oxygen molecular ion can be stabilized
The observed luminescence band results of the transition from the vibration level Vrsquo=0 of
the excited electronic state A2u to one vibration level Vrsquorsquo=3 of the ground state X2g The
wwwintechopencom
What is the Pulsed Cathodoluminescence
47
bands at 6306 and 6556 nm are formed due to the transition to the vibration level of the groun state with the participation of lattice phonons For the first curve the phonon energy is 255 cm while for the second curve it is 244 cm-1 These phonons are observed in the Raman spectrum The excited electronic state of the molecular ion is spaced from the ground state by 20660-21580 cm-1 [Solomonov et al 2011]
Fig 13 Configuration curves for two sites of oxygen molecular ions
On the basis of the qualitative luminescent analysis of Nd3+Y2O3 the determination of neodymium concentration by means of the calibration curve construction is possible
because of intensity of neodymium lines is proportional to it concentration INd(i)=aiCNd (for example 750 or 825 nm) However we canrsquot use this equation because PCL spectrum is characterized by the instability Therefore we also chose lightsums ratio as analytic parameter in regions of 730-840 nm and 350-840 nm The first region of Nd3+Y2O3 spectrum involves only neodymium bands but the second one includes in addition the intrinsic band which is distorted by the neodymium absorption and can be ascribed as follows
wwwintechopencom
Cathodoluminescence
48
0
1 exp( )( ) i Nd
YO i ii Nd
k C lI I
k C (12)
Here I0i l ki are the intensity of i ndash intrinsic band without absorption the thickness of samples coefficient of absorption of i ndash band respectively Hence relation of lightsums ratio (S(350-840)S(730-840)) with CNd has to include the equation (12) Really this relation is decribed by the following equation
2
1 exp( )(350 840)
(730 840)Nd
Nd
B CSA D
S C
(13)
Fig 14 demonstrates the calibration curve (r2gt099) for the determination of neodymium concentration in region of 011 ndash 107 at
Fig 14 The calibration curve for the determination of neodymium concentration in region of 011 ndash 107 at
4 Conclusion
Thus the possibility of realization of rapid nondestructive qualitative and quantitative luminescent analyses of laser materials in particular Nd3+Y3Al5O12 Nd3+Y2O3 with the help of pulsed cathodoluminescence was shown
5 References
Bagaev S Osipov V Ivanov M Solomonov V Platonov V Orlov A Rasuleva A amp Vatnik S (2009)Fabrication and characteristics of neodymium ndash activated yttrium oxide optical ceramics Optical Materials Vol31 pp 740-743 ISSN 0925-3467
wwwintechopencom
What is the Pulsed Cathodoluminescence
49
Bogdankevich O Darznik S amp Eliseev P (1975) Semiconductor lasers Nauka Moscow Russia
Bordun O Bordun I amp Novosad S (1995) Luminescence centres into Y2O3 Journal of applied spectroscopy Vol62 No6 pp 91-95 ISSN 0021-9037
Bordun O (2002) Influence of oxygen vacancies on the luminescence spectra of thin Y2O3 films Journal of applied spectroscopy Vol69 No3 pp 371-374 ISSN 0021-9037
Chang N (1966) Energy levels and crystal ndash field splittings of Nd3+ in yttrium oxide J Chem Phys Vol44 pp 4044-4050 ISSN 0021-9606
Chukichev M Sabri D Sokolov V amp Surcova T (1990) Cathodoluminescence of solid solution Zn1-xMnxSe Optics and Spectroscopy Vol68 pp 2000-2021 ISSN 0030-4034
Connor O (1964) A theory of thermoluminescence of fluorite (CaF2Y) Radiative recombination from highly associated electron ndash hole pairs Appl Phys Lett Vol4 No1 pp 126-129 ISSN 0003-6951
Galkin G (1981) The interband processes of the recombination into semiconductors at high excitation level Proceedings of the PN Lebedev Physical Institute (Trudi FIAN) Vol128 pp 3-64
Hoskins H amp Soffer B (1963) Stimulated emission from Y2O3Nd3+ Appl Phys Lett Vol4 pp 22-23 ISSN 0003-6951
Ikesue A Kinoshita T Kamata K amp Yoshida K (1995) Fabrication and optical properties of high-performance polycrystalline NdYAG ceramics for solid-state lasers J Amer Ceram Soc Vol78 pp 1033-1040 ISSN 1551-2916
Kolomiycev A Meylman M Volodina I Chukichev M Smagin A amp Bagdasarov H (1982) Luminescence of neodymium ndash activated yttrium ndash aluminum garnet crystals in ultra-violet and visible ranges at high energy excitation Deposition in VINITI No 5995-82 pp 1-15
Kolomiycev A Meylman M Volodina I Chukichev M Smagin A amp Bagdasarov H (1984) Luminescence of neodymium ndash activated yttrium ndash aluminum garnet crystals in ultra-violet and visible ranges at high energy excitation Optics and Spectroscopy Vol56 pp 365-367 ISSN 0030-4034
Koningstein J amp Geusic J (1964)Energy levels and crystal ndash field calculations of neodymium in yttrium aluminum garnet Phys Rev Vol136 No 3A pp 711-716 ISSN 1893-1912
Kotov Yu Osipov V Ivanov M Samatov O Platonov V Azarkevich E Murzakayev A amp Medvedev A (2002) Properties of oxide nanopowders prepared by target evaporation with a pulse ndash periodic CO2 laser Technical Physics Vol47 No11 pp 1420-1426 ISSN 1063-7842
Kuznetsov A Abramov V Rooze N amp Savikhina T (1978) Autolocalized excitons into Y2O3 JETP Letters Vol28 No10 pp 602-605 ISSN 0021-3640
Lu J Murai T Takaichi K Ueda K Yagi H Yanagitani T amp Kaminskii A (2001) Nd3+Y2O3 ceramic laser Jpn J Appl Phys Vol40 pp 1277-1279 ISSN 0021-4922
Lupei V Lupei A Tiseanu C Georgescu S Stoicescu C amp Nanau P (1995) High ndash resolution optical spectroscopy of YAG Nd A test for structural and distribution models Phys Rev B Vol51 No1 pp 8-17 ISSN 0003-6951
Mesyats G (1974) Generating of highpower nanosecond pulses The Soviet radio Moscow Russia
wwwintechopencom
Cathodoluminescence
50
Mesyats G Shpak V Yalandin M amp Shunailov S (1992) Compact RADAN electron accelerators for testing new radiation technologies and sterilization Radiat Phys Chem Vol46 pp 489-492 ISSN 0969-806X
Michailov S Osipov V amp Solomonov V (2001) Pulsed cathodoluminescent analyzer of materials Pribory i tekhnika eksperimenta No3 pp 164-165 ISSN 0032-8162
Osipov V Solomonov V Platonov V Snigireva O Ivanov V amp Lisenkov V (2005) Laser plume spectroscopy 2 Graphite yttrium ndash stabilized and zirconium oxide targets Quantum Electron Vol35 No7 pp 633-637 ISSN 0368-7147
Osipov V Rasuleva A amp Solomonov V (2008) Luminescence of pure yttria Optics and Spectroscopy Vol105 No4 pp 524-530 ISSN 0030-400X
Osipov V Solomonov V Spirina A Ivanov M amp Orlov A (2009) Luminescence of yttrium oxide doped with neodymium Optics and Spectroscopy Vol106 No1 pp 78-83 ISSN 0030-400X
Osipov V Solomonov V amp Spirina A (2011) Luminescent investigation of neodymium doped yttrium aluminates J of Optical Technology Vol78 No6 pp 81-87 ISSN 0030-4042
Pearse R amp Gaydon A (1949) The identification of molecular spectra Inostrannaya Literatura Moscow Russia
Petrov V (1996) Cathodoluminescent microscopy Physics - Uspekhi Vol39 pp 807-818 ISSN 0042-1294
Ramseyer K Fisher J Matter A Eberhardt P amp Geiss J (1989) A cathodoluminescence microscope for low intensity luminescence Journal of Sedimentary Research Vol59 pp 619-622 ISSN 0022-4472
Ramseyer K amp Millis J (1990) Factors influencing short-lived blue cathodoluminescence in
- quartz Journal of Sedimentary Research Vol59 pp 619-622 ISSN 0003-004X Schaak G amp Koningstein J (1970) Phonon and electronic raman spectra of cubic rare-earth
oxides and isomorphous ittrium oxide J Opt Soc Amer Vol60 No8 pp 1110-1115 ISSN 1551-2916
Solomonov V amp Michailov S (2003) Pulsed cathodoluminescence and its application for the analysis of condensed substances UB RAS ISBN 5-7691-1357-X Yekaterinburg Russia
Solomonv V (2003) Kinetics of pulsed cathodoluminescence Optics and Spectroscopy Vol95 pp 248-254 ISSN 0030-4034
Solomonv V Michailov S amp Deykun A (1996) About the mecanism of excitation and the structure of the pulsed cathodoluminescence bands of Cr3+ Mn2+ impurity ions into minerals Optics and Spectroscopy Vol80 pp 447-458 ISSN 0030-4034
Vaysburd D Semin B Tavanov E Matlis S Balichev I amp Gering G (1982) Highenergy electronics of solid Nauka Novosibirsk Russia
Yang B Luff B amp Townsend F (1992) Chatodoluminescence of natural zircons J Phys Condens Matter Vol4 pp 5617-5624 ISSN 0953-8984
wwwintechopencom
CathodoluminescenceEdited by Dr Naoki Yamamoto
ISBN 978-953-51-0362-2Hard cover 324 pagesPublisher InTechPublished online 28 March 2012Published in print edition March 2012
InTech EuropeUniversity Campus STeP Ri Slavka Krautzeka 83A 51000 Rijeka Croatia Phone +385 (51) 770 447 Fax +385 (51) 686 166wwwintechopencom
InTech ChinaUnit 405 Office Block Hotel Equatorial Shanghai No65 Yan An Road (West) Shanghai 200040 China
Phone +86-21-62489820 Fax +86-21-62489821
Cathodoluminescence (CL) is a non-destructive technique to characterize optical and electronic properties ofnanostructures in many kinds of materials Major subject is to investigate basic parameters in semiconductorsimpurities in oxides and phase determination of minerals CL gives information on carrier concentrationdiffusion length and life time of minority carriers in semiconductors and impurity concentration and phasecomposition in composite materials This book involves 13 chapters to present the basics in the CL techniqueand applications to particles thin films and nanostructures in semiconductors oxides and minerals Thechapters covered in this book include recent development of CL technique and applications to wide range ofmaterials used in modern material science
How to referenceIn order to correctly reference this scholarly work feel free to copy and paste the following
Vladimir Solomonov and Alfiya Spirina (2012) What is the Pulsed CathodoluminescenceCathodoluminescence Dr Naoki Yamamoto (Ed) ISBN 978-953-51-0362-2 InTech Available fromhttpwwwintechopencombookscathodoluminescencewhat-is-the-pulsed-cathodoluminescence-
copy 2012 The Author(s) Licensee IntechOpen This is an open access articledistributed under the terms of the Creative Commons Attribution 30License which permits unrestricted use distribution and reproduction inany medium provided the original work is properly cited
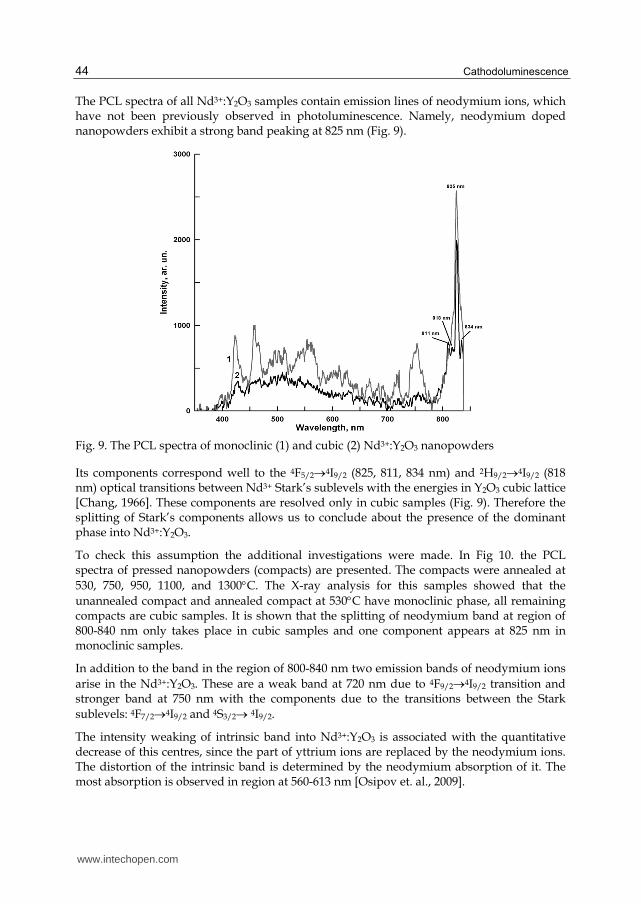
Cathodoluminescence
44
The PCL spectra of all Nd3+Y2O3 samples contain emission lines of neodymium ions which have not been previously observed in photoluminescence Namely neodymium doped nanopowders exhibit a strong band peaking at 825 nm (Fig 9)
Fig 9 The PCL spectra of monoclinic (1) and cubic (2) Nd3+Y2O3 nanopowders
Its components correspond well to the 4F524I92 (825 811 834 nm) and 2H924I92 (818 nm) optical transitions between Nd3+ Starkrsquos sublevels with the energies in Y2O3 cubic lattice [Chang 1966] These components are resolved only in cubic samples (Fig 9) Therefore the splitting of Starkrsquos components allows us to conclude about the presence of the dominant phase into Nd3+Y2O3
To check this assumption the additional investigations were made In Fig 10 the PCL spectra of pressed nanopowders (compacts) are presented The compacts were annealed at
530 750 950 1100 and 1300C The X-ray analysis for this samples showed that the
unannealed compact and annealed compact at 530C have monoclinic phase all remaining compacts are cubic samples It is shown that the splitting of neodymium band at region of 800-840 nm only takes place in cubic samples and one component appears at 825 nm in monoclinic samples
In addition to the band in the region of 800-840 nm two emission bands of neodymium ions
arise in the Nd3+Y2O3 These are a weak band at 720 nm due to 4F924I92 transition and stronger band at 750 nm with the components due to the transitions between the Stark
sublevels 4F724I92 and 4S32 4I92
The intensity weaking of intrinsic band into Nd3+Y2O3 is associated with the quantitative decrease of this centres since the part of yttrium ions are replaced by the neodymium ions The distortion of the intrinsic band is determined by the neodymium absorption of it The most absorption is observed in region at 560-613 nm [Osipov et al 2009]
wwwintechopencom
What is the Pulsed Cathodoluminescence
45
In addition to the present bands into Nd3+Y2O3 the appearance of four well-resolved components in the range of 610-660 nm can be seen The specta of this band for compacts
annealed at 950 and 1300C are presented in Fig 11 The band contains the following four narrow lines at 6206 6306 6453 6556 nm which we identify using Raman spectra as
luminescence of oxygen molecular ion 2O [Solomonov et al 2011]
Fig 10 The PCL spectra of unannealed compact (1) and compacts annealed at 530C (2)
750C (3) 950C (4) 1100C (5) 1300C (6)
wwwintechopencom
Cathodoluminescence
46
The bands with the frequencies of 1615 and 1702 cm-1 correspond to vibrations of the molecular ion in the ground state while the frequencies at 966 and 993 cm-1 correspond to the excited state for the two sites of the oxygen molecular ion in the yttria lattice
Fig 12 demonstrates two sites of defects 2O taking into account the occurrence of two types
of natural vacancies about we talked earlier
Fig 11 The PCL of oxygen molecular ions
Fig 12 Two sites of oxygen molecular ions defects in lattice of cubic Y2O3
Fig 13 presents two potentional curves and formation of luminescence bands The lowest
excited state A2u of the oxygen molecular ion can be stabilized
The observed luminescence band results of the transition from the vibration level Vrsquo=0 of
the excited electronic state A2u to one vibration level Vrsquorsquo=3 of the ground state X2g The
wwwintechopencom
What is the Pulsed Cathodoluminescence
47
bands at 6306 and 6556 nm are formed due to the transition to the vibration level of the groun state with the participation of lattice phonons For the first curve the phonon energy is 255 cm while for the second curve it is 244 cm-1 These phonons are observed in the Raman spectrum The excited electronic state of the molecular ion is spaced from the ground state by 20660-21580 cm-1 [Solomonov et al 2011]
Fig 13 Configuration curves for two sites of oxygen molecular ions
On the basis of the qualitative luminescent analysis of Nd3+Y2O3 the determination of neodymium concentration by means of the calibration curve construction is possible
because of intensity of neodymium lines is proportional to it concentration INd(i)=aiCNd (for example 750 or 825 nm) However we canrsquot use this equation because PCL spectrum is characterized by the instability Therefore we also chose lightsums ratio as analytic parameter in regions of 730-840 nm and 350-840 nm The first region of Nd3+Y2O3 spectrum involves only neodymium bands but the second one includes in addition the intrinsic band which is distorted by the neodymium absorption and can be ascribed as follows
wwwintechopencom
Cathodoluminescence
48
0
1 exp( )( ) i Nd
YO i ii Nd
k C lI I
k C (12)
Here I0i l ki are the intensity of i ndash intrinsic band without absorption the thickness of samples coefficient of absorption of i ndash band respectively Hence relation of lightsums ratio (S(350-840)S(730-840)) with CNd has to include the equation (12) Really this relation is decribed by the following equation
2
1 exp( )(350 840)
(730 840)Nd
Nd
B CSA D
S C
(13)
Fig 14 demonstrates the calibration curve (r2gt099) for the determination of neodymium concentration in region of 011 ndash 107 at
Fig 14 The calibration curve for the determination of neodymium concentration in region of 011 ndash 107 at
4 Conclusion
Thus the possibility of realization of rapid nondestructive qualitative and quantitative luminescent analyses of laser materials in particular Nd3+Y3Al5O12 Nd3+Y2O3 with the help of pulsed cathodoluminescence was shown
5 References
Bagaev S Osipov V Ivanov M Solomonov V Platonov V Orlov A Rasuleva A amp Vatnik S (2009)Fabrication and characteristics of neodymium ndash activated yttrium oxide optical ceramics Optical Materials Vol31 pp 740-743 ISSN 0925-3467
wwwintechopencom
What is the Pulsed Cathodoluminescence
49
Bogdankevich O Darznik S amp Eliseev P (1975) Semiconductor lasers Nauka Moscow Russia
Bordun O Bordun I amp Novosad S (1995) Luminescence centres into Y2O3 Journal of applied spectroscopy Vol62 No6 pp 91-95 ISSN 0021-9037
Bordun O (2002) Influence of oxygen vacancies on the luminescence spectra of thin Y2O3 films Journal of applied spectroscopy Vol69 No3 pp 371-374 ISSN 0021-9037
Chang N (1966) Energy levels and crystal ndash field splittings of Nd3+ in yttrium oxide J Chem Phys Vol44 pp 4044-4050 ISSN 0021-9606
Chukichev M Sabri D Sokolov V amp Surcova T (1990) Cathodoluminescence of solid solution Zn1-xMnxSe Optics and Spectroscopy Vol68 pp 2000-2021 ISSN 0030-4034
Connor O (1964) A theory of thermoluminescence of fluorite (CaF2Y) Radiative recombination from highly associated electron ndash hole pairs Appl Phys Lett Vol4 No1 pp 126-129 ISSN 0003-6951
Galkin G (1981) The interband processes of the recombination into semiconductors at high excitation level Proceedings of the PN Lebedev Physical Institute (Trudi FIAN) Vol128 pp 3-64
Hoskins H amp Soffer B (1963) Stimulated emission from Y2O3Nd3+ Appl Phys Lett Vol4 pp 22-23 ISSN 0003-6951
Ikesue A Kinoshita T Kamata K amp Yoshida K (1995) Fabrication and optical properties of high-performance polycrystalline NdYAG ceramics for solid-state lasers J Amer Ceram Soc Vol78 pp 1033-1040 ISSN 1551-2916
Kolomiycev A Meylman M Volodina I Chukichev M Smagin A amp Bagdasarov H (1982) Luminescence of neodymium ndash activated yttrium ndash aluminum garnet crystals in ultra-violet and visible ranges at high energy excitation Deposition in VINITI No 5995-82 pp 1-15
Kolomiycev A Meylman M Volodina I Chukichev M Smagin A amp Bagdasarov H (1984) Luminescence of neodymium ndash activated yttrium ndash aluminum garnet crystals in ultra-violet and visible ranges at high energy excitation Optics and Spectroscopy Vol56 pp 365-367 ISSN 0030-4034
Koningstein J amp Geusic J (1964)Energy levels and crystal ndash field calculations of neodymium in yttrium aluminum garnet Phys Rev Vol136 No 3A pp 711-716 ISSN 1893-1912
Kotov Yu Osipov V Ivanov M Samatov O Platonov V Azarkevich E Murzakayev A amp Medvedev A (2002) Properties of oxide nanopowders prepared by target evaporation with a pulse ndash periodic CO2 laser Technical Physics Vol47 No11 pp 1420-1426 ISSN 1063-7842
Kuznetsov A Abramov V Rooze N amp Savikhina T (1978) Autolocalized excitons into Y2O3 JETP Letters Vol28 No10 pp 602-605 ISSN 0021-3640
Lu J Murai T Takaichi K Ueda K Yagi H Yanagitani T amp Kaminskii A (2001) Nd3+Y2O3 ceramic laser Jpn J Appl Phys Vol40 pp 1277-1279 ISSN 0021-4922
Lupei V Lupei A Tiseanu C Georgescu S Stoicescu C amp Nanau P (1995) High ndash resolution optical spectroscopy of YAG Nd A test for structural and distribution models Phys Rev B Vol51 No1 pp 8-17 ISSN 0003-6951
Mesyats G (1974) Generating of highpower nanosecond pulses The Soviet radio Moscow Russia
wwwintechopencom
Cathodoluminescence
50
Mesyats G Shpak V Yalandin M amp Shunailov S (1992) Compact RADAN electron accelerators for testing new radiation technologies and sterilization Radiat Phys Chem Vol46 pp 489-492 ISSN 0969-806X
Michailov S Osipov V amp Solomonov V (2001) Pulsed cathodoluminescent analyzer of materials Pribory i tekhnika eksperimenta No3 pp 164-165 ISSN 0032-8162
Osipov V Solomonov V Platonov V Snigireva O Ivanov V amp Lisenkov V (2005) Laser plume spectroscopy 2 Graphite yttrium ndash stabilized and zirconium oxide targets Quantum Electron Vol35 No7 pp 633-637 ISSN 0368-7147
Osipov V Rasuleva A amp Solomonov V (2008) Luminescence of pure yttria Optics and Spectroscopy Vol105 No4 pp 524-530 ISSN 0030-400X
Osipov V Solomonov V Spirina A Ivanov M amp Orlov A (2009) Luminescence of yttrium oxide doped with neodymium Optics and Spectroscopy Vol106 No1 pp 78-83 ISSN 0030-400X
Osipov V Solomonov V amp Spirina A (2011) Luminescent investigation of neodymium doped yttrium aluminates J of Optical Technology Vol78 No6 pp 81-87 ISSN 0030-4042
Pearse R amp Gaydon A (1949) The identification of molecular spectra Inostrannaya Literatura Moscow Russia
Petrov V (1996) Cathodoluminescent microscopy Physics - Uspekhi Vol39 pp 807-818 ISSN 0042-1294
Ramseyer K Fisher J Matter A Eberhardt P amp Geiss J (1989) A cathodoluminescence microscope for low intensity luminescence Journal of Sedimentary Research Vol59 pp 619-622 ISSN 0022-4472
Ramseyer K amp Millis J (1990) Factors influencing short-lived blue cathodoluminescence in
- quartz Journal of Sedimentary Research Vol59 pp 619-622 ISSN 0003-004X Schaak G amp Koningstein J (1970) Phonon and electronic raman spectra of cubic rare-earth
oxides and isomorphous ittrium oxide J Opt Soc Amer Vol60 No8 pp 1110-1115 ISSN 1551-2916
Solomonov V amp Michailov S (2003) Pulsed cathodoluminescence and its application for the analysis of condensed substances UB RAS ISBN 5-7691-1357-X Yekaterinburg Russia
Solomonv V (2003) Kinetics of pulsed cathodoluminescence Optics and Spectroscopy Vol95 pp 248-254 ISSN 0030-4034
Solomonv V Michailov S amp Deykun A (1996) About the mecanism of excitation and the structure of the pulsed cathodoluminescence bands of Cr3+ Mn2+ impurity ions into minerals Optics and Spectroscopy Vol80 pp 447-458 ISSN 0030-4034
Vaysburd D Semin B Tavanov E Matlis S Balichev I amp Gering G (1982) Highenergy electronics of solid Nauka Novosibirsk Russia
Yang B Luff B amp Townsend F (1992) Chatodoluminescence of natural zircons J Phys Condens Matter Vol4 pp 5617-5624 ISSN 0953-8984
wwwintechopencom
CathodoluminescenceEdited by Dr Naoki Yamamoto
ISBN 978-953-51-0362-2Hard cover 324 pagesPublisher InTechPublished online 28 March 2012Published in print edition March 2012
InTech EuropeUniversity Campus STeP Ri Slavka Krautzeka 83A 51000 Rijeka Croatia Phone +385 (51) 770 447 Fax +385 (51) 686 166wwwintechopencom
InTech ChinaUnit 405 Office Block Hotel Equatorial Shanghai No65 Yan An Road (West) Shanghai 200040 China
Phone +86-21-62489820 Fax +86-21-62489821
Cathodoluminescence (CL) is a non-destructive technique to characterize optical and electronic properties ofnanostructures in many kinds of materials Major subject is to investigate basic parameters in semiconductorsimpurities in oxides and phase determination of minerals CL gives information on carrier concentrationdiffusion length and life time of minority carriers in semiconductors and impurity concentration and phasecomposition in composite materials This book involves 13 chapters to present the basics in the CL techniqueand applications to particles thin films and nanostructures in semiconductors oxides and minerals Thechapters covered in this book include recent development of CL technique and applications to wide range ofmaterials used in modern material science
How to referenceIn order to correctly reference this scholarly work feel free to copy and paste the following
Vladimir Solomonov and Alfiya Spirina (2012) What is the Pulsed CathodoluminescenceCathodoluminescence Dr Naoki Yamamoto (Ed) ISBN 978-953-51-0362-2 InTech Available fromhttpwwwintechopencombookscathodoluminescencewhat-is-the-pulsed-cathodoluminescence-
copy 2012 The Author(s) Licensee IntechOpen This is an open access articledistributed under the terms of the Creative Commons Attribution 30License which permits unrestricted use distribution and reproduction inany medium provided the original work is properly cited
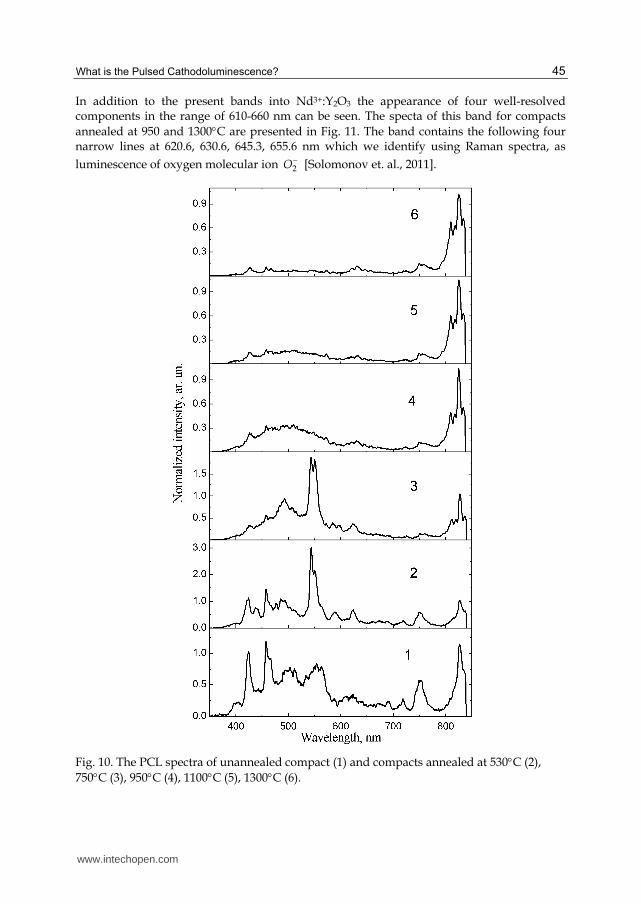
What is the Pulsed Cathodoluminescence
45
In addition to the present bands into Nd3+Y2O3 the appearance of four well-resolved components in the range of 610-660 nm can be seen The specta of this band for compacts
annealed at 950 and 1300C are presented in Fig 11 The band contains the following four narrow lines at 6206 6306 6453 6556 nm which we identify using Raman spectra as
luminescence of oxygen molecular ion 2O [Solomonov et al 2011]
Fig 10 The PCL spectra of unannealed compact (1) and compacts annealed at 530C (2)
750C (3) 950C (4) 1100C (5) 1300C (6)
wwwintechopencom
Cathodoluminescence
46
The bands with the frequencies of 1615 and 1702 cm-1 correspond to vibrations of the molecular ion in the ground state while the frequencies at 966 and 993 cm-1 correspond to the excited state for the two sites of the oxygen molecular ion in the yttria lattice
Fig 12 demonstrates two sites of defects 2O taking into account the occurrence of two types
of natural vacancies about we talked earlier
Fig 11 The PCL of oxygen molecular ions
Fig 12 Two sites of oxygen molecular ions defects in lattice of cubic Y2O3
Fig 13 presents two potentional curves and formation of luminescence bands The lowest
excited state A2u of the oxygen molecular ion can be stabilized
The observed luminescence band results of the transition from the vibration level Vrsquo=0 of
the excited electronic state A2u to one vibration level Vrsquorsquo=3 of the ground state X2g The
wwwintechopencom
What is the Pulsed Cathodoluminescence
47
bands at 6306 and 6556 nm are formed due to the transition to the vibration level of the groun state with the participation of lattice phonons For the first curve the phonon energy is 255 cm while for the second curve it is 244 cm-1 These phonons are observed in the Raman spectrum The excited electronic state of the molecular ion is spaced from the ground state by 20660-21580 cm-1 [Solomonov et al 2011]
Fig 13 Configuration curves for two sites of oxygen molecular ions
On the basis of the qualitative luminescent analysis of Nd3+Y2O3 the determination of neodymium concentration by means of the calibration curve construction is possible
because of intensity of neodymium lines is proportional to it concentration INd(i)=aiCNd (for example 750 or 825 nm) However we canrsquot use this equation because PCL spectrum is characterized by the instability Therefore we also chose lightsums ratio as analytic parameter in regions of 730-840 nm and 350-840 nm The first region of Nd3+Y2O3 spectrum involves only neodymium bands but the second one includes in addition the intrinsic band which is distorted by the neodymium absorption and can be ascribed as follows
wwwintechopencom
Cathodoluminescence
48
0
1 exp( )( ) i Nd
YO i ii Nd
k C lI I
k C (12)
Here I0i l ki are the intensity of i ndash intrinsic band without absorption the thickness of samples coefficient of absorption of i ndash band respectively Hence relation of lightsums ratio (S(350-840)S(730-840)) with CNd has to include the equation (12) Really this relation is decribed by the following equation
2
1 exp( )(350 840)
(730 840)Nd
Nd
B CSA D
S C
(13)
Fig 14 demonstrates the calibration curve (r2gt099) for the determination of neodymium concentration in region of 011 ndash 107 at
Fig 14 The calibration curve for the determination of neodymium concentration in region of 011 ndash 107 at
4 Conclusion
Thus the possibility of realization of rapid nondestructive qualitative and quantitative luminescent analyses of laser materials in particular Nd3+Y3Al5O12 Nd3+Y2O3 with the help of pulsed cathodoluminescence was shown
5 References
Bagaev S Osipov V Ivanov M Solomonov V Platonov V Orlov A Rasuleva A amp Vatnik S (2009)Fabrication and characteristics of neodymium ndash activated yttrium oxide optical ceramics Optical Materials Vol31 pp 740-743 ISSN 0925-3467
wwwintechopencom
What is the Pulsed Cathodoluminescence
49
Bogdankevich O Darznik S amp Eliseev P (1975) Semiconductor lasers Nauka Moscow Russia
Bordun O Bordun I amp Novosad S (1995) Luminescence centres into Y2O3 Journal of applied spectroscopy Vol62 No6 pp 91-95 ISSN 0021-9037
Bordun O (2002) Influence of oxygen vacancies on the luminescence spectra of thin Y2O3 films Journal of applied spectroscopy Vol69 No3 pp 371-374 ISSN 0021-9037
Chang N (1966) Energy levels and crystal ndash field splittings of Nd3+ in yttrium oxide J Chem Phys Vol44 pp 4044-4050 ISSN 0021-9606
Chukichev M Sabri D Sokolov V amp Surcova T (1990) Cathodoluminescence of solid solution Zn1-xMnxSe Optics and Spectroscopy Vol68 pp 2000-2021 ISSN 0030-4034
Connor O (1964) A theory of thermoluminescence of fluorite (CaF2Y) Radiative recombination from highly associated electron ndash hole pairs Appl Phys Lett Vol4 No1 pp 126-129 ISSN 0003-6951
Galkin G (1981) The interband processes of the recombination into semiconductors at high excitation level Proceedings of the PN Lebedev Physical Institute (Trudi FIAN) Vol128 pp 3-64
Hoskins H amp Soffer B (1963) Stimulated emission from Y2O3Nd3+ Appl Phys Lett Vol4 pp 22-23 ISSN 0003-6951
Ikesue A Kinoshita T Kamata K amp Yoshida K (1995) Fabrication and optical properties of high-performance polycrystalline NdYAG ceramics for solid-state lasers J Amer Ceram Soc Vol78 pp 1033-1040 ISSN 1551-2916
Kolomiycev A Meylman M Volodina I Chukichev M Smagin A amp Bagdasarov H (1982) Luminescence of neodymium ndash activated yttrium ndash aluminum garnet crystals in ultra-violet and visible ranges at high energy excitation Deposition in VINITI No 5995-82 pp 1-15
Kolomiycev A Meylman M Volodina I Chukichev M Smagin A amp Bagdasarov H (1984) Luminescence of neodymium ndash activated yttrium ndash aluminum garnet crystals in ultra-violet and visible ranges at high energy excitation Optics and Spectroscopy Vol56 pp 365-367 ISSN 0030-4034
Koningstein J amp Geusic J (1964)Energy levels and crystal ndash field calculations of neodymium in yttrium aluminum garnet Phys Rev Vol136 No 3A pp 711-716 ISSN 1893-1912
Kotov Yu Osipov V Ivanov M Samatov O Platonov V Azarkevich E Murzakayev A amp Medvedev A (2002) Properties of oxide nanopowders prepared by target evaporation with a pulse ndash periodic CO2 laser Technical Physics Vol47 No11 pp 1420-1426 ISSN 1063-7842
Kuznetsov A Abramov V Rooze N amp Savikhina T (1978) Autolocalized excitons into Y2O3 JETP Letters Vol28 No10 pp 602-605 ISSN 0021-3640
Lu J Murai T Takaichi K Ueda K Yagi H Yanagitani T amp Kaminskii A (2001) Nd3+Y2O3 ceramic laser Jpn J Appl Phys Vol40 pp 1277-1279 ISSN 0021-4922
Lupei V Lupei A Tiseanu C Georgescu S Stoicescu C amp Nanau P (1995) High ndash resolution optical spectroscopy of YAG Nd A test for structural and distribution models Phys Rev B Vol51 No1 pp 8-17 ISSN 0003-6951
Mesyats G (1974) Generating of highpower nanosecond pulses The Soviet radio Moscow Russia
wwwintechopencom
Cathodoluminescence
50
Mesyats G Shpak V Yalandin M amp Shunailov S (1992) Compact RADAN electron accelerators for testing new radiation technologies and sterilization Radiat Phys Chem Vol46 pp 489-492 ISSN 0969-806X
Michailov S Osipov V amp Solomonov V (2001) Pulsed cathodoluminescent analyzer of materials Pribory i tekhnika eksperimenta No3 pp 164-165 ISSN 0032-8162
Osipov V Solomonov V Platonov V Snigireva O Ivanov V amp Lisenkov V (2005) Laser plume spectroscopy 2 Graphite yttrium ndash stabilized and zirconium oxide targets Quantum Electron Vol35 No7 pp 633-637 ISSN 0368-7147
Osipov V Rasuleva A amp Solomonov V (2008) Luminescence of pure yttria Optics and Spectroscopy Vol105 No4 pp 524-530 ISSN 0030-400X
Osipov V Solomonov V Spirina A Ivanov M amp Orlov A (2009) Luminescence of yttrium oxide doped with neodymium Optics and Spectroscopy Vol106 No1 pp 78-83 ISSN 0030-400X
Osipov V Solomonov V amp Spirina A (2011) Luminescent investigation of neodymium doped yttrium aluminates J of Optical Technology Vol78 No6 pp 81-87 ISSN 0030-4042
Pearse R amp Gaydon A (1949) The identification of molecular spectra Inostrannaya Literatura Moscow Russia
Petrov V (1996) Cathodoluminescent microscopy Physics - Uspekhi Vol39 pp 807-818 ISSN 0042-1294
Ramseyer K Fisher J Matter A Eberhardt P amp Geiss J (1989) A cathodoluminescence microscope for low intensity luminescence Journal of Sedimentary Research Vol59 pp 619-622 ISSN 0022-4472
Ramseyer K amp Millis J (1990) Factors influencing short-lived blue cathodoluminescence in
- quartz Journal of Sedimentary Research Vol59 pp 619-622 ISSN 0003-004X Schaak G amp Koningstein J (1970) Phonon and electronic raman spectra of cubic rare-earth
oxides and isomorphous ittrium oxide J Opt Soc Amer Vol60 No8 pp 1110-1115 ISSN 1551-2916
Solomonov V amp Michailov S (2003) Pulsed cathodoluminescence and its application for the analysis of condensed substances UB RAS ISBN 5-7691-1357-X Yekaterinburg Russia
Solomonv V (2003) Kinetics of pulsed cathodoluminescence Optics and Spectroscopy Vol95 pp 248-254 ISSN 0030-4034
Solomonv V Michailov S amp Deykun A (1996) About the mecanism of excitation and the structure of the pulsed cathodoluminescence bands of Cr3+ Mn2+ impurity ions into minerals Optics and Spectroscopy Vol80 pp 447-458 ISSN 0030-4034
Vaysburd D Semin B Tavanov E Matlis S Balichev I amp Gering G (1982) Highenergy electronics of solid Nauka Novosibirsk Russia
Yang B Luff B amp Townsend F (1992) Chatodoluminescence of natural zircons J Phys Condens Matter Vol4 pp 5617-5624 ISSN 0953-8984
wwwintechopencom
CathodoluminescenceEdited by Dr Naoki Yamamoto
ISBN 978-953-51-0362-2Hard cover 324 pagesPublisher InTechPublished online 28 March 2012Published in print edition March 2012
InTech EuropeUniversity Campus STeP Ri Slavka Krautzeka 83A 51000 Rijeka Croatia Phone +385 (51) 770 447 Fax +385 (51) 686 166wwwintechopencom
InTech ChinaUnit 405 Office Block Hotel Equatorial Shanghai No65 Yan An Road (West) Shanghai 200040 China
Phone +86-21-62489820 Fax +86-21-62489821
Cathodoluminescence (CL) is a non-destructive technique to characterize optical and electronic properties ofnanostructures in many kinds of materials Major subject is to investigate basic parameters in semiconductorsimpurities in oxides and phase determination of minerals CL gives information on carrier concentrationdiffusion length and life time of minority carriers in semiconductors and impurity concentration and phasecomposition in composite materials This book involves 13 chapters to present the basics in the CL techniqueand applications to particles thin films and nanostructures in semiconductors oxides and minerals Thechapters covered in this book include recent development of CL technique and applications to wide range ofmaterials used in modern material science
How to referenceIn order to correctly reference this scholarly work feel free to copy and paste the following
Vladimir Solomonov and Alfiya Spirina (2012) What is the Pulsed CathodoluminescenceCathodoluminescence Dr Naoki Yamamoto (Ed) ISBN 978-953-51-0362-2 InTech Available fromhttpwwwintechopencombookscathodoluminescencewhat-is-the-pulsed-cathodoluminescence-
copy 2012 The Author(s) Licensee IntechOpen This is an open access articledistributed under the terms of the Creative Commons Attribution 30License which permits unrestricted use distribution and reproduction inany medium provided the original work is properly cited

Cathodoluminescence
46
The bands with the frequencies of 1615 and 1702 cm-1 correspond to vibrations of the molecular ion in the ground state while the frequencies at 966 and 993 cm-1 correspond to the excited state for the two sites of the oxygen molecular ion in the yttria lattice
Fig 12 demonstrates two sites of defects 2O taking into account the occurrence of two types
of natural vacancies about we talked earlier
Fig 11 The PCL of oxygen molecular ions
Fig 12 Two sites of oxygen molecular ions defects in lattice of cubic Y2O3
Fig 13 presents two potentional curves and formation of luminescence bands The lowest
excited state A2u of the oxygen molecular ion can be stabilized
The observed luminescence band results of the transition from the vibration level Vrsquo=0 of
the excited electronic state A2u to one vibration level Vrsquorsquo=3 of the ground state X2g The
wwwintechopencom
What is the Pulsed Cathodoluminescence
47
bands at 6306 and 6556 nm are formed due to the transition to the vibration level of the groun state with the participation of lattice phonons For the first curve the phonon energy is 255 cm while for the second curve it is 244 cm-1 These phonons are observed in the Raman spectrum The excited electronic state of the molecular ion is spaced from the ground state by 20660-21580 cm-1 [Solomonov et al 2011]
Fig 13 Configuration curves for two sites of oxygen molecular ions
On the basis of the qualitative luminescent analysis of Nd3+Y2O3 the determination of neodymium concentration by means of the calibration curve construction is possible
because of intensity of neodymium lines is proportional to it concentration INd(i)=aiCNd (for example 750 or 825 nm) However we canrsquot use this equation because PCL spectrum is characterized by the instability Therefore we also chose lightsums ratio as analytic parameter in regions of 730-840 nm and 350-840 nm The first region of Nd3+Y2O3 spectrum involves only neodymium bands but the second one includes in addition the intrinsic band which is distorted by the neodymium absorption and can be ascribed as follows
wwwintechopencom
Cathodoluminescence
48
0
1 exp( )( ) i Nd
YO i ii Nd
k C lI I
k C (12)
Here I0i l ki are the intensity of i ndash intrinsic band without absorption the thickness of samples coefficient of absorption of i ndash band respectively Hence relation of lightsums ratio (S(350-840)S(730-840)) with CNd has to include the equation (12) Really this relation is decribed by the following equation
2
1 exp( )(350 840)
(730 840)Nd
Nd
B CSA D
S C
(13)
Fig 14 demonstrates the calibration curve (r2gt099) for the determination of neodymium concentration in region of 011 ndash 107 at
Fig 14 The calibration curve for the determination of neodymium concentration in region of 011 ndash 107 at
4 Conclusion
Thus the possibility of realization of rapid nondestructive qualitative and quantitative luminescent analyses of laser materials in particular Nd3+Y3Al5O12 Nd3+Y2O3 with the help of pulsed cathodoluminescence was shown
5 References
Bagaev S Osipov V Ivanov M Solomonov V Platonov V Orlov A Rasuleva A amp Vatnik S (2009)Fabrication and characteristics of neodymium ndash activated yttrium oxide optical ceramics Optical Materials Vol31 pp 740-743 ISSN 0925-3467
wwwintechopencom
What is the Pulsed Cathodoluminescence
49
Bogdankevich O Darznik S amp Eliseev P (1975) Semiconductor lasers Nauka Moscow Russia
Bordun O Bordun I amp Novosad S (1995) Luminescence centres into Y2O3 Journal of applied spectroscopy Vol62 No6 pp 91-95 ISSN 0021-9037
Bordun O (2002) Influence of oxygen vacancies on the luminescence spectra of thin Y2O3 films Journal of applied spectroscopy Vol69 No3 pp 371-374 ISSN 0021-9037
Chang N (1966) Energy levels and crystal ndash field splittings of Nd3+ in yttrium oxide J Chem Phys Vol44 pp 4044-4050 ISSN 0021-9606
Chukichev M Sabri D Sokolov V amp Surcova T (1990) Cathodoluminescence of solid solution Zn1-xMnxSe Optics and Spectroscopy Vol68 pp 2000-2021 ISSN 0030-4034
Connor O (1964) A theory of thermoluminescence of fluorite (CaF2Y) Radiative recombination from highly associated electron ndash hole pairs Appl Phys Lett Vol4 No1 pp 126-129 ISSN 0003-6951
Galkin G (1981) The interband processes of the recombination into semiconductors at high excitation level Proceedings of the PN Lebedev Physical Institute (Trudi FIAN) Vol128 pp 3-64
Hoskins H amp Soffer B (1963) Stimulated emission from Y2O3Nd3+ Appl Phys Lett Vol4 pp 22-23 ISSN 0003-6951
Ikesue A Kinoshita T Kamata K amp Yoshida K (1995) Fabrication and optical properties of high-performance polycrystalline NdYAG ceramics for solid-state lasers J Amer Ceram Soc Vol78 pp 1033-1040 ISSN 1551-2916
Kolomiycev A Meylman M Volodina I Chukichev M Smagin A amp Bagdasarov H (1982) Luminescence of neodymium ndash activated yttrium ndash aluminum garnet crystals in ultra-violet and visible ranges at high energy excitation Deposition in VINITI No 5995-82 pp 1-15
Kolomiycev A Meylman M Volodina I Chukichev M Smagin A amp Bagdasarov H (1984) Luminescence of neodymium ndash activated yttrium ndash aluminum garnet crystals in ultra-violet and visible ranges at high energy excitation Optics and Spectroscopy Vol56 pp 365-367 ISSN 0030-4034
Koningstein J amp Geusic J (1964)Energy levels and crystal ndash field calculations of neodymium in yttrium aluminum garnet Phys Rev Vol136 No 3A pp 711-716 ISSN 1893-1912
Kotov Yu Osipov V Ivanov M Samatov O Platonov V Azarkevich E Murzakayev A amp Medvedev A (2002) Properties of oxide nanopowders prepared by target evaporation with a pulse ndash periodic CO2 laser Technical Physics Vol47 No11 pp 1420-1426 ISSN 1063-7842
Kuznetsov A Abramov V Rooze N amp Savikhina T (1978) Autolocalized excitons into Y2O3 JETP Letters Vol28 No10 pp 602-605 ISSN 0021-3640
Lu J Murai T Takaichi K Ueda K Yagi H Yanagitani T amp Kaminskii A (2001) Nd3+Y2O3 ceramic laser Jpn J Appl Phys Vol40 pp 1277-1279 ISSN 0021-4922
Lupei V Lupei A Tiseanu C Georgescu S Stoicescu C amp Nanau P (1995) High ndash resolution optical spectroscopy of YAG Nd A test for structural and distribution models Phys Rev B Vol51 No1 pp 8-17 ISSN 0003-6951
Mesyats G (1974) Generating of highpower nanosecond pulses The Soviet radio Moscow Russia
wwwintechopencom
Cathodoluminescence
50
Mesyats G Shpak V Yalandin M amp Shunailov S (1992) Compact RADAN electron accelerators for testing new radiation technologies and sterilization Radiat Phys Chem Vol46 pp 489-492 ISSN 0969-806X
Michailov S Osipov V amp Solomonov V (2001) Pulsed cathodoluminescent analyzer of materials Pribory i tekhnika eksperimenta No3 pp 164-165 ISSN 0032-8162
Osipov V Solomonov V Platonov V Snigireva O Ivanov V amp Lisenkov V (2005) Laser plume spectroscopy 2 Graphite yttrium ndash stabilized and zirconium oxide targets Quantum Electron Vol35 No7 pp 633-637 ISSN 0368-7147
Osipov V Rasuleva A amp Solomonov V (2008) Luminescence of pure yttria Optics and Spectroscopy Vol105 No4 pp 524-530 ISSN 0030-400X
Osipov V Solomonov V Spirina A Ivanov M amp Orlov A (2009) Luminescence of yttrium oxide doped with neodymium Optics and Spectroscopy Vol106 No1 pp 78-83 ISSN 0030-400X
Osipov V Solomonov V amp Spirina A (2011) Luminescent investigation of neodymium doped yttrium aluminates J of Optical Technology Vol78 No6 pp 81-87 ISSN 0030-4042
Pearse R amp Gaydon A (1949) The identification of molecular spectra Inostrannaya Literatura Moscow Russia
Petrov V (1996) Cathodoluminescent microscopy Physics - Uspekhi Vol39 pp 807-818 ISSN 0042-1294
Ramseyer K Fisher J Matter A Eberhardt P amp Geiss J (1989) A cathodoluminescence microscope for low intensity luminescence Journal of Sedimentary Research Vol59 pp 619-622 ISSN 0022-4472
Ramseyer K amp Millis J (1990) Factors influencing short-lived blue cathodoluminescence in
- quartz Journal of Sedimentary Research Vol59 pp 619-622 ISSN 0003-004X Schaak G amp Koningstein J (1970) Phonon and electronic raman spectra of cubic rare-earth
oxides and isomorphous ittrium oxide J Opt Soc Amer Vol60 No8 pp 1110-1115 ISSN 1551-2916
Solomonov V amp Michailov S (2003) Pulsed cathodoluminescence and its application for the analysis of condensed substances UB RAS ISBN 5-7691-1357-X Yekaterinburg Russia
Solomonv V (2003) Kinetics of pulsed cathodoluminescence Optics and Spectroscopy Vol95 pp 248-254 ISSN 0030-4034
Solomonv V Michailov S amp Deykun A (1996) About the mecanism of excitation and the structure of the pulsed cathodoluminescence bands of Cr3+ Mn2+ impurity ions into minerals Optics and Spectroscopy Vol80 pp 447-458 ISSN 0030-4034
Vaysburd D Semin B Tavanov E Matlis S Balichev I amp Gering G (1982) Highenergy electronics of solid Nauka Novosibirsk Russia
Yang B Luff B amp Townsend F (1992) Chatodoluminescence of natural zircons J Phys Condens Matter Vol4 pp 5617-5624 ISSN 0953-8984
wwwintechopencom
CathodoluminescenceEdited by Dr Naoki Yamamoto
ISBN 978-953-51-0362-2Hard cover 324 pagesPublisher InTechPublished online 28 March 2012Published in print edition March 2012
InTech EuropeUniversity Campus STeP Ri Slavka Krautzeka 83A 51000 Rijeka Croatia Phone +385 (51) 770 447 Fax +385 (51) 686 166wwwintechopencom
InTech ChinaUnit 405 Office Block Hotel Equatorial Shanghai No65 Yan An Road (West) Shanghai 200040 China
Phone +86-21-62489820 Fax +86-21-62489821
Cathodoluminescence (CL) is a non-destructive technique to characterize optical and electronic properties ofnanostructures in many kinds of materials Major subject is to investigate basic parameters in semiconductorsimpurities in oxides and phase determination of minerals CL gives information on carrier concentrationdiffusion length and life time of minority carriers in semiconductors and impurity concentration and phasecomposition in composite materials This book involves 13 chapters to present the basics in the CL techniqueand applications to particles thin films and nanostructures in semiconductors oxides and minerals Thechapters covered in this book include recent development of CL technique and applications to wide range ofmaterials used in modern material science
How to referenceIn order to correctly reference this scholarly work feel free to copy and paste the following
Vladimir Solomonov and Alfiya Spirina (2012) What is the Pulsed CathodoluminescenceCathodoluminescence Dr Naoki Yamamoto (Ed) ISBN 978-953-51-0362-2 InTech Available fromhttpwwwintechopencombookscathodoluminescencewhat-is-the-pulsed-cathodoluminescence-
copy 2012 The Author(s) Licensee IntechOpen This is an open access articledistributed under the terms of the Creative Commons Attribution 30License which permits unrestricted use distribution and reproduction inany medium provided the original work is properly cited
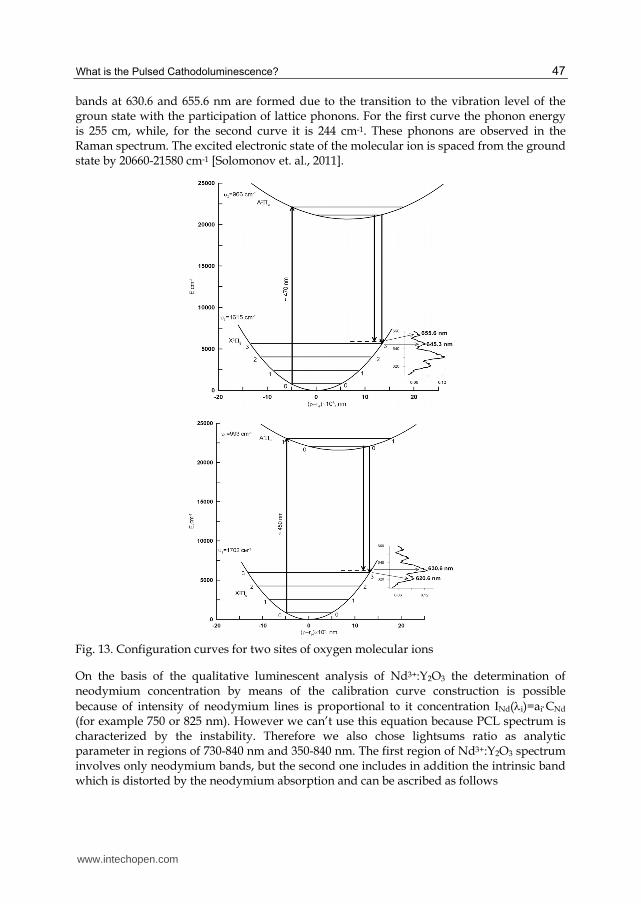
What is the Pulsed Cathodoluminescence
47
bands at 6306 and 6556 nm are formed due to the transition to the vibration level of the groun state with the participation of lattice phonons For the first curve the phonon energy is 255 cm while for the second curve it is 244 cm-1 These phonons are observed in the Raman spectrum The excited electronic state of the molecular ion is spaced from the ground state by 20660-21580 cm-1 [Solomonov et al 2011]
Fig 13 Configuration curves for two sites of oxygen molecular ions
On the basis of the qualitative luminescent analysis of Nd3+Y2O3 the determination of neodymium concentration by means of the calibration curve construction is possible
because of intensity of neodymium lines is proportional to it concentration INd(i)=aiCNd (for example 750 or 825 nm) However we canrsquot use this equation because PCL spectrum is characterized by the instability Therefore we also chose lightsums ratio as analytic parameter in regions of 730-840 nm and 350-840 nm The first region of Nd3+Y2O3 spectrum involves only neodymium bands but the second one includes in addition the intrinsic band which is distorted by the neodymium absorption and can be ascribed as follows
wwwintechopencom
Cathodoluminescence
48
0
1 exp( )( ) i Nd
YO i ii Nd
k C lI I
k C (12)
Here I0i l ki are the intensity of i ndash intrinsic band without absorption the thickness of samples coefficient of absorption of i ndash band respectively Hence relation of lightsums ratio (S(350-840)S(730-840)) with CNd has to include the equation (12) Really this relation is decribed by the following equation
2
1 exp( )(350 840)
(730 840)Nd
Nd
B CSA D
S C
(13)
Fig 14 demonstrates the calibration curve (r2gt099) for the determination of neodymium concentration in region of 011 ndash 107 at
Fig 14 The calibration curve for the determination of neodymium concentration in region of 011 ndash 107 at
4 Conclusion
Thus the possibility of realization of rapid nondestructive qualitative and quantitative luminescent analyses of laser materials in particular Nd3+Y3Al5O12 Nd3+Y2O3 with the help of pulsed cathodoluminescence was shown
5 References
Bagaev S Osipov V Ivanov M Solomonov V Platonov V Orlov A Rasuleva A amp Vatnik S (2009)Fabrication and characteristics of neodymium ndash activated yttrium oxide optical ceramics Optical Materials Vol31 pp 740-743 ISSN 0925-3467
wwwintechopencom
What is the Pulsed Cathodoluminescence
49
Bogdankevich O Darznik S amp Eliseev P (1975) Semiconductor lasers Nauka Moscow Russia
Bordun O Bordun I amp Novosad S (1995) Luminescence centres into Y2O3 Journal of applied spectroscopy Vol62 No6 pp 91-95 ISSN 0021-9037
Bordun O (2002) Influence of oxygen vacancies on the luminescence spectra of thin Y2O3 films Journal of applied spectroscopy Vol69 No3 pp 371-374 ISSN 0021-9037
Chang N (1966) Energy levels and crystal ndash field splittings of Nd3+ in yttrium oxide J Chem Phys Vol44 pp 4044-4050 ISSN 0021-9606
Chukichev M Sabri D Sokolov V amp Surcova T (1990) Cathodoluminescence of solid solution Zn1-xMnxSe Optics and Spectroscopy Vol68 pp 2000-2021 ISSN 0030-4034
Connor O (1964) A theory of thermoluminescence of fluorite (CaF2Y) Radiative recombination from highly associated electron ndash hole pairs Appl Phys Lett Vol4 No1 pp 126-129 ISSN 0003-6951
Galkin G (1981) The interband processes of the recombination into semiconductors at high excitation level Proceedings of the PN Lebedev Physical Institute (Trudi FIAN) Vol128 pp 3-64
Hoskins H amp Soffer B (1963) Stimulated emission from Y2O3Nd3+ Appl Phys Lett Vol4 pp 22-23 ISSN 0003-6951
Ikesue A Kinoshita T Kamata K amp Yoshida K (1995) Fabrication and optical properties of high-performance polycrystalline NdYAG ceramics for solid-state lasers J Amer Ceram Soc Vol78 pp 1033-1040 ISSN 1551-2916
Kolomiycev A Meylman M Volodina I Chukichev M Smagin A amp Bagdasarov H (1982) Luminescence of neodymium ndash activated yttrium ndash aluminum garnet crystals in ultra-violet and visible ranges at high energy excitation Deposition in VINITI No 5995-82 pp 1-15
Kolomiycev A Meylman M Volodina I Chukichev M Smagin A amp Bagdasarov H (1984) Luminescence of neodymium ndash activated yttrium ndash aluminum garnet crystals in ultra-violet and visible ranges at high energy excitation Optics and Spectroscopy Vol56 pp 365-367 ISSN 0030-4034
Koningstein J amp Geusic J (1964)Energy levels and crystal ndash field calculations of neodymium in yttrium aluminum garnet Phys Rev Vol136 No 3A pp 711-716 ISSN 1893-1912
Kotov Yu Osipov V Ivanov M Samatov O Platonov V Azarkevich E Murzakayev A amp Medvedev A (2002) Properties of oxide nanopowders prepared by target evaporation with a pulse ndash periodic CO2 laser Technical Physics Vol47 No11 pp 1420-1426 ISSN 1063-7842
Kuznetsov A Abramov V Rooze N amp Savikhina T (1978) Autolocalized excitons into Y2O3 JETP Letters Vol28 No10 pp 602-605 ISSN 0021-3640
Lu J Murai T Takaichi K Ueda K Yagi H Yanagitani T amp Kaminskii A (2001) Nd3+Y2O3 ceramic laser Jpn J Appl Phys Vol40 pp 1277-1279 ISSN 0021-4922
Lupei V Lupei A Tiseanu C Georgescu S Stoicescu C amp Nanau P (1995) High ndash resolution optical spectroscopy of YAG Nd A test for structural and distribution models Phys Rev B Vol51 No1 pp 8-17 ISSN 0003-6951
Mesyats G (1974) Generating of highpower nanosecond pulses The Soviet radio Moscow Russia
wwwintechopencom
Cathodoluminescence
50
Mesyats G Shpak V Yalandin M amp Shunailov S (1992) Compact RADAN electron accelerators for testing new radiation technologies and sterilization Radiat Phys Chem Vol46 pp 489-492 ISSN 0969-806X
Michailov S Osipov V amp Solomonov V (2001) Pulsed cathodoluminescent analyzer of materials Pribory i tekhnika eksperimenta No3 pp 164-165 ISSN 0032-8162
Osipov V Solomonov V Platonov V Snigireva O Ivanov V amp Lisenkov V (2005) Laser plume spectroscopy 2 Graphite yttrium ndash stabilized and zirconium oxide targets Quantum Electron Vol35 No7 pp 633-637 ISSN 0368-7147
Osipov V Rasuleva A amp Solomonov V (2008) Luminescence of pure yttria Optics and Spectroscopy Vol105 No4 pp 524-530 ISSN 0030-400X
Osipov V Solomonov V Spirina A Ivanov M amp Orlov A (2009) Luminescence of yttrium oxide doped with neodymium Optics and Spectroscopy Vol106 No1 pp 78-83 ISSN 0030-400X
Osipov V Solomonov V amp Spirina A (2011) Luminescent investigation of neodymium doped yttrium aluminates J of Optical Technology Vol78 No6 pp 81-87 ISSN 0030-4042
Pearse R amp Gaydon A (1949) The identification of molecular spectra Inostrannaya Literatura Moscow Russia
Petrov V (1996) Cathodoluminescent microscopy Physics - Uspekhi Vol39 pp 807-818 ISSN 0042-1294
Ramseyer K Fisher J Matter A Eberhardt P amp Geiss J (1989) A cathodoluminescence microscope for low intensity luminescence Journal of Sedimentary Research Vol59 pp 619-622 ISSN 0022-4472
Ramseyer K amp Millis J (1990) Factors influencing short-lived blue cathodoluminescence in
- quartz Journal of Sedimentary Research Vol59 pp 619-622 ISSN 0003-004X Schaak G amp Koningstein J (1970) Phonon and electronic raman spectra of cubic rare-earth
oxides and isomorphous ittrium oxide J Opt Soc Amer Vol60 No8 pp 1110-1115 ISSN 1551-2916
Solomonov V amp Michailov S (2003) Pulsed cathodoluminescence and its application for the analysis of condensed substances UB RAS ISBN 5-7691-1357-X Yekaterinburg Russia
Solomonv V (2003) Kinetics of pulsed cathodoluminescence Optics and Spectroscopy Vol95 pp 248-254 ISSN 0030-4034
Solomonv V Michailov S amp Deykun A (1996) About the mecanism of excitation and the structure of the pulsed cathodoluminescence bands of Cr3+ Mn2+ impurity ions into minerals Optics and Spectroscopy Vol80 pp 447-458 ISSN 0030-4034
Vaysburd D Semin B Tavanov E Matlis S Balichev I amp Gering G (1982) Highenergy electronics of solid Nauka Novosibirsk Russia
Yang B Luff B amp Townsend F (1992) Chatodoluminescence of natural zircons J Phys Condens Matter Vol4 pp 5617-5624 ISSN 0953-8984
wwwintechopencom
CathodoluminescenceEdited by Dr Naoki Yamamoto
ISBN 978-953-51-0362-2Hard cover 324 pagesPublisher InTechPublished online 28 March 2012Published in print edition March 2012
InTech EuropeUniversity Campus STeP Ri Slavka Krautzeka 83A 51000 Rijeka Croatia Phone +385 (51) 770 447 Fax +385 (51) 686 166wwwintechopencom
InTech ChinaUnit 405 Office Block Hotel Equatorial Shanghai No65 Yan An Road (West) Shanghai 200040 China
Phone +86-21-62489820 Fax +86-21-62489821
Cathodoluminescence (CL) is a non-destructive technique to characterize optical and electronic properties ofnanostructures in many kinds of materials Major subject is to investigate basic parameters in semiconductorsimpurities in oxides and phase determination of minerals CL gives information on carrier concentrationdiffusion length and life time of minority carriers in semiconductors and impurity concentration and phasecomposition in composite materials This book involves 13 chapters to present the basics in the CL techniqueand applications to particles thin films and nanostructures in semiconductors oxides and minerals Thechapters covered in this book include recent development of CL technique and applications to wide range ofmaterials used in modern material science
How to referenceIn order to correctly reference this scholarly work feel free to copy and paste the following
Vladimir Solomonov and Alfiya Spirina (2012) What is the Pulsed CathodoluminescenceCathodoluminescence Dr Naoki Yamamoto (Ed) ISBN 978-953-51-0362-2 InTech Available fromhttpwwwintechopencombookscathodoluminescencewhat-is-the-pulsed-cathodoluminescence-
copy 2012 The Author(s) Licensee IntechOpen This is an open access articledistributed under the terms of the Creative Commons Attribution 30License which permits unrestricted use distribution and reproduction inany medium provided the original work is properly cited

Cathodoluminescence
48
0
1 exp( )( ) i Nd
YO i ii Nd
k C lI I
k C (12)
Here I0i l ki are the intensity of i ndash intrinsic band without absorption the thickness of samples coefficient of absorption of i ndash band respectively Hence relation of lightsums ratio (S(350-840)S(730-840)) with CNd has to include the equation (12) Really this relation is decribed by the following equation
2
1 exp( )(350 840)
(730 840)Nd
Nd
B CSA D
S C
(13)
Fig 14 demonstrates the calibration curve (r2gt099) for the determination of neodymium concentration in region of 011 ndash 107 at
Fig 14 The calibration curve for the determination of neodymium concentration in region of 011 ndash 107 at
4 Conclusion
Thus the possibility of realization of rapid nondestructive qualitative and quantitative luminescent analyses of laser materials in particular Nd3+Y3Al5O12 Nd3+Y2O3 with the help of pulsed cathodoluminescence was shown
5 References
Bagaev S Osipov V Ivanov M Solomonov V Platonov V Orlov A Rasuleva A amp Vatnik S (2009)Fabrication and characteristics of neodymium ndash activated yttrium oxide optical ceramics Optical Materials Vol31 pp 740-743 ISSN 0925-3467
wwwintechopencom
What is the Pulsed Cathodoluminescence
49
Bogdankevich O Darznik S amp Eliseev P (1975) Semiconductor lasers Nauka Moscow Russia
Bordun O Bordun I amp Novosad S (1995) Luminescence centres into Y2O3 Journal of applied spectroscopy Vol62 No6 pp 91-95 ISSN 0021-9037
Bordun O (2002) Influence of oxygen vacancies on the luminescence spectra of thin Y2O3 films Journal of applied spectroscopy Vol69 No3 pp 371-374 ISSN 0021-9037
Chang N (1966) Energy levels and crystal ndash field splittings of Nd3+ in yttrium oxide J Chem Phys Vol44 pp 4044-4050 ISSN 0021-9606
Chukichev M Sabri D Sokolov V amp Surcova T (1990) Cathodoluminescence of solid solution Zn1-xMnxSe Optics and Spectroscopy Vol68 pp 2000-2021 ISSN 0030-4034
Connor O (1964) A theory of thermoluminescence of fluorite (CaF2Y) Radiative recombination from highly associated electron ndash hole pairs Appl Phys Lett Vol4 No1 pp 126-129 ISSN 0003-6951
Galkin G (1981) The interband processes of the recombination into semiconductors at high excitation level Proceedings of the PN Lebedev Physical Institute (Trudi FIAN) Vol128 pp 3-64
Hoskins H amp Soffer B (1963) Stimulated emission from Y2O3Nd3+ Appl Phys Lett Vol4 pp 22-23 ISSN 0003-6951
Ikesue A Kinoshita T Kamata K amp Yoshida K (1995) Fabrication and optical properties of high-performance polycrystalline NdYAG ceramics for solid-state lasers J Amer Ceram Soc Vol78 pp 1033-1040 ISSN 1551-2916
Kolomiycev A Meylman M Volodina I Chukichev M Smagin A amp Bagdasarov H (1982) Luminescence of neodymium ndash activated yttrium ndash aluminum garnet crystals in ultra-violet and visible ranges at high energy excitation Deposition in VINITI No 5995-82 pp 1-15
Kolomiycev A Meylman M Volodina I Chukichev M Smagin A amp Bagdasarov H (1984) Luminescence of neodymium ndash activated yttrium ndash aluminum garnet crystals in ultra-violet and visible ranges at high energy excitation Optics and Spectroscopy Vol56 pp 365-367 ISSN 0030-4034
Koningstein J amp Geusic J (1964)Energy levels and crystal ndash field calculations of neodymium in yttrium aluminum garnet Phys Rev Vol136 No 3A pp 711-716 ISSN 1893-1912
Kotov Yu Osipov V Ivanov M Samatov O Platonov V Azarkevich E Murzakayev A amp Medvedev A (2002) Properties of oxide nanopowders prepared by target evaporation with a pulse ndash periodic CO2 laser Technical Physics Vol47 No11 pp 1420-1426 ISSN 1063-7842
Kuznetsov A Abramov V Rooze N amp Savikhina T (1978) Autolocalized excitons into Y2O3 JETP Letters Vol28 No10 pp 602-605 ISSN 0021-3640
Lu J Murai T Takaichi K Ueda K Yagi H Yanagitani T amp Kaminskii A (2001) Nd3+Y2O3 ceramic laser Jpn J Appl Phys Vol40 pp 1277-1279 ISSN 0021-4922
Lupei V Lupei A Tiseanu C Georgescu S Stoicescu C amp Nanau P (1995) High ndash resolution optical spectroscopy of YAG Nd A test for structural and distribution models Phys Rev B Vol51 No1 pp 8-17 ISSN 0003-6951
Mesyats G (1974) Generating of highpower nanosecond pulses The Soviet radio Moscow Russia
wwwintechopencom
Cathodoluminescence
50
Mesyats G Shpak V Yalandin M amp Shunailov S (1992) Compact RADAN electron accelerators for testing new radiation technologies and sterilization Radiat Phys Chem Vol46 pp 489-492 ISSN 0969-806X
Michailov S Osipov V amp Solomonov V (2001) Pulsed cathodoluminescent analyzer of materials Pribory i tekhnika eksperimenta No3 pp 164-165 ISSN 0032-8162
Osipov V Solomonov V Platonov V Snigireva O Ivanov V amp Lisenkov V (2005) Laser plume spectroscopy 2 Graphite yttrium ndash stabilized and zirconium oxide targets Quantum Electron Vol35 No7 pp 633-637 ISSN 0368-7147
Osipov V Rasuleva A amp Solomonov V (2008) Luminescence of pure yttria Optics and Spectroscopy Vol105 No4 pp 524-530 ISSN 0030-400X
Osipov V Solomonov V Spirina A Ivanov M amp Orlov A (2009) Luminescence of yttrium oxide doped with neodymium Optics and Spectroscopy Vol106 No1 pp 78-83 ISSN 0030-400X
Osipov V Solomonov V amp Spirina A (2011) Luminescent investigation of neodymium doped yttrium aluminates J of Optical Technology Vol78 No6 pp 81-87 ISSN 0030-4042
Pearse R amp Gaydon A (1949) The identification of molecular spectra Inostrannaya Literatura Moscow Russia
Petrov V (1996) Cathodoluminescent microscopy Physics - Uspekhi Vol39 pp 807-818 ISSN 0042-1294
Ramseyer K Fisher J Matter A Eberhardt P amp Geiss J (1989) A cathodoluminescence microscope for low intensity luminescence Journal of Sedimentary Research Vol59 pp 619-622 ISSN 0022-4472
Ramseyer K amp Millis J (1990) Factors influencing short-lived blue cathodoluminescence in
- quartz Journal of Sedimentary Research Vol59 pp 619-622 ISSN 0003-004X Schaak G amp Koningstein J (1970) Phonon and electronic raman spectra of cubic rare-earth
oxides and isomorphous ittrium oxide J Opt Soc Amer Vol60 No8 pp 1110-1115 ISSN 1551-2916
Solomonov V amp Michailov S (2003) Pulsed cathodoluminescence and its application for the analysis of condensed substances UB RAS ISBN 5-7691-1357-X Yekaterinburg Russia
Solomonv V (2003) Kinetics of pulsed cathodoluminescence Optics and Spectroscopy Vol95 pp 248-254 ISSN 0030-4034
Solomonv V Michailov S amp Deykun A (1996) About the mecanism of excitation and the structure of the pulsed cathodoluminescence bands of Cr3+ Mn2+ impurity ions into minerals Optics and Spectroscopy Vol80 pp 447-458 ISSN 0030-4034
Vaysburd D Semin B Tavanov E Matlis S Balichev I amp Gering G (1982) Highenergy electronics of solid Nauka Novosibirsk Russia
Yang B Luff B amp Townsend F (1992) Chatodoluminescence of natural zircons J Phys Condens Matter Vol4 pp 5617-5624 ISSN 0953-8984
wwwintechopencom
CathodoluminescenceEdited by Dr Naoki Yamamoto
ISBN 978-953-51-0362-2Hard cover 324 pagesPublisher InTechPublished online 28 March 2012Published in print edition March 2012
InTech EuropeUniversity Campus STeP Ri Slavka Krautzeka 83A 51000 Rijeka Croatia Phone +385 (51) 770 447 Fax +385 (51) 686 166wwwintechopencom
InTech ChinaUnit 405 Office Block Hotel Equatorial Shanghai No65 Yan An Road (West) Shanghai 200040 China
Phone +86-21-62489820 Fax +86-21-62489821
Cathodoluminescence (CL) is a non-destructive technique to characterize optical and electronic properties ofnanostructures in many kinds of materials Major subject is to investigate basic parameters in semiconductorsimpurities in oxides and phase determination of minerals CL gives information on carrier concentrationdiffusion length and life time of minority carriers in semiconductors and impurity concentration and phasecomposition in composite materials This book involves 13 chapters to present the basics in the CL techniqueand applications to particles thin films and nanostructures in semiconductors oxides and minerals Thechapters covered in this book include recent development of CL technique and applications to wide range ofmaterials used in modern material science
How to referenceIn order to correctly reference this scholarly work feel free to copy and paste the following
Vladimir Solomonov and Alfiya Spirina (2012) What is the Pulsed CathodoluminescenceCathodoluminescence Dr Naoki Yamamoto (Ed) ISBN 978-953-51-0362-2 InTech Available fromhttpwwwintechopencombookscathodoluminescencewhat-is-the-pulsed-cathodoluminescence-
copy 2012 The Author(s) Licensee IntechOpen This is an open access articledistributed under the terms of the Creative Commons Attribution 30License which permits unrestricted use distribution and reproduction inany medium provided the original work is properly cited

copy 2012 The Author(s) Licensee IntechOpen This is an open access articledistributed under the terms of the Creative Commons Attribution 30License which permits unrestricted use distribution and reproduction inany medium provided the original work is properly cited