cause analysis of packet loss in underutilized enterprise network...
TRANSCRIPT

Cause Analysis of Packet Loss in Underutilized Enterprise Network Links
2005.12.21Thesis Defense
Deepali [email protected]
Distributed Processing & Network Management Lab.Department of Computer Science & Engineering
POSTECH

2POSTECHDP&NM Lab.
ContentsIntroduction
Related Work
Traffic Monitoring and Loss Detection
Cause Analysis Method
Traffic Data Collection
Analysis Tools
Cause Analysis of Packet Loss
Conclusion and Future Work
3POSTECHDP&NM Lab.
IntroductionISPs Employ Overprovisioning
Increasing number of users and applications
Performance ProblemsPacket loss, delay and jitterNetwork applications: VoIP, multimedia, games and P2P
Goal Study traffic and packet loss characteristicsDetermine the root cause of packet loss phenomenon
ApproachDeveloped a root cause analysis methodDeveloped set of tools to execute the methodology

4POSTECHDP&NM Lab.
Related Work
Most of the studies focus on packet delay analysisPacket loss and delay are closely related
Network Performance Monitoring at Small Time ScalesPapagiannaki et. al. (IMC 2003)Attributed high delays to congestion in the routers
Origins of Microcongestion in an Access RouterPapagiannaki et. al. (PAM 2004)Identified and discussed causes of microcongestion: link bandwidth, multiplexing and traffic burstiness
Detection and Analysis of Packet Loss on Underutilized Enterprise Networks
Chung et al. (E2EMON 2005)Indicated that only bursty packets affect the packet loss

5POSTECHDP&NM Lab.
Traffic Monitoring and Loss Detection
Packet Capture Module
1Gbits DAG
SNMP PollingModule
100Mbits NIC
Linux Traffic Monitor System
This module captures packet trace using DAG API
Packet Capture Module
This module polls Cisco standard MIB II and private MIB variables
SNMP Polling Module
DescriptionModule Name

6POSTECHDP&NM Lab.
SNMP Polling
Monitor traffic and switch statusBy polling standard MIB II variables at 1 second granularity
The total number of octets transmitted out of the interface, including framing characters
1.3.6.1.2.1.2.2.1.16ifOutOctets
The total number of octets receive on the interface,including framing characters
1.3.6.1.2.1.2.2.1.10ifInOctets
The total number of packets that higher-level protocolsrequested be transmitted to a subnetwork-unicast
address,including those that were discarded or not sent
1.3.6.1.2.1.2.2.1.17ifOutUcastPkts
The number of subnetwork-unicast packet delivered to a higher-layer protocol
1.3.6.1.2.1.2.2.1.11ifInUcastPkts
DescriptionOIDObject

7POSTECHDP&NM Lab.
Packet Loss Detection Using SNMP
Packet loss informationUsing Cisco enterprise MIB variables
Each interface owns input queue and output queue
Packet Loss = Input Queue Drops + Output Queue Drops
CPU Utilization (5 sec avg.)1.3.6.1.4.1.9.2.1.56cpuLoad
The number of packets dropped because the output queue was full
1.3.6.1.4.1.9.2.2.1.1.27 locIfOutputQueueDrops
The number of packets dropped because theinput queue was full
1.3.6.1.4.1.9.2.2.1.1.26 locIfInputQueueDrops
DescriptionOIDObject

8POSTECHDP&NM Lab.
Packet Capture Using Network TAP
SNMPInaccuracies due to high response loss rateTime granularity not satisfactory enough
Need finer time analysis for cause detection
Optical TAPPacket trace capture using DAG cardGuaranteed lossless performance in gigabit linkHigh precision time stamps
Packet Capture ModuleImplemented using C API of DAGProvides highest performance

9POSTECHDP&NM Lab.
Traffic Data Collection
Overall switch status and traffic flow
Protocol Based Analysis
IP Traffic Non-IP Traffic
Inter-domain Traffic Intra-domain Traffic
TCP UDP Other UDPTCP Other
Broadcast Packet Analysis
Loss Correlation Analysis
TCP Flow Analysis
Count Sizes LifetimeDistinct Destinations New and Terminated Flows Large TCP Flow
Throughput Sequence Number Loss Rate
Cause Analysis Method
SNMP Tools
SNMP Tools

10POSTECHDP&NM Lab.
Traffic Data Collection
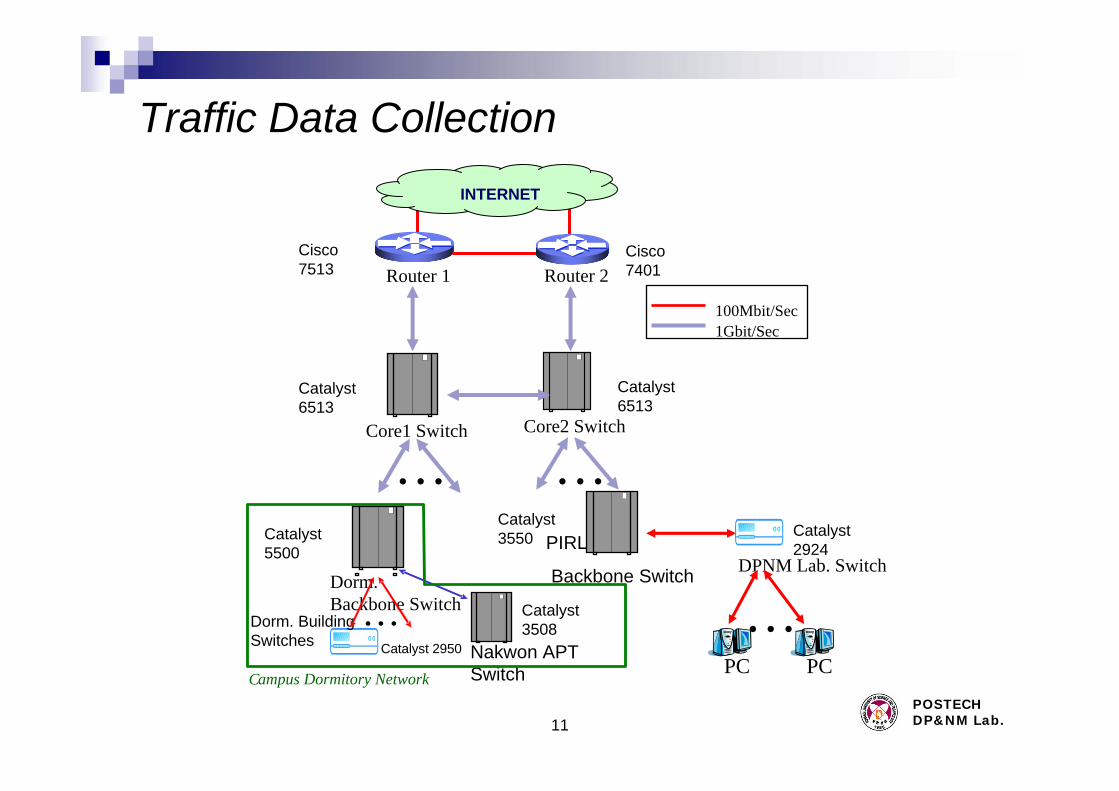
POSTECH campus networkComposed of two IP routers, two core backbone switches, dozes ofgigabit switches and hundreds of 100mbps switches
Monitored LinkAlways underutilizedConvey traffic composed of many internet application
Link located in campus dormitory network
11POSTECHDP&NM Lab.
Traffic Data Collection
Router 1
100Mbit/Sec1Gbit/Sec
INTERNET
Core1 Switch Core2 Switch
… …
Dorm.Backbone Switch
DPNM Lab. Switch
PC PC
…
Router 2Cisco 7513
Cisco 7401
Catalyst 6513
Catalyst 6513
Catalyst 5500
Dorm. Building Switches Catalyst 2950
Catalyst 3508
Nakwon APT Switch
PIRL
Backbone Switch
Catalyst 3550 Catalyst
2924
Campus Dormitory Network
…

12POSTECHDP&NM Lab.
POSTECH Dormitory Network OverviewMonitored link connecting Nakwon Apt to dormitory backbone switchData collection over 4 months, interleaved with analysis
Catalyst 5500
Catalyst 3508
Nakwon APT #1
BayStack420T
BayStack420T
BayStack420T
BayStack420T
BayStack420T
BayStack420T
Catalyst 6513
CoreSwitches
…
SiSi
100Mbit/Sec1Gbit/Sec
Nakwon APT #2
Nakwon APT #3
Nakwon APT #4
Nakwon APT #5
Nakwon APT #6
Dorm #1
Dorm #2
Dorm #20
SNMP MIB Polling
Traffic Monitor System

13POSTECHDP&NM Lab.
Analysis ToolsSNMP Logs Processing Tools
Total count across all ports Text fileSNMP Log fileTotal
Averaged values for specified seconds Text fileSNMP Log fileAverage
Time in Unix seconds when the SNMP response is not received
Text fileSNMP Log fileResponse Loss Rate
Index of interfaces those experience losses simultaneously
Text fileSNMP Log fileInterface Index
Count of interfaces those experience losses simultaneously
Text fileSNMP Log fileInterface Count
Function OutputInputTool Name (Perl Script)

14POSTECHDP&NM Lab.
Analysis ToolsDAG Logs Processing Tools
Count of non-IP packets and ARP packets (at 1s, 1ms and 1us scales)DAG logsNon-IP packets
Count of IP level broadcast packets (at 1s, 1ms and 1us scales) DAG logsBroadcast packets
run-length magnitudes and interval between two run-lengths in microsecond
Binary Flow file & DAG logs
Run length and loss rate
pps and BPS of the selected flow (at 1s, 1ms and 1us scales) Binary Flow file & DAG logs
Data Rate
flows of size in the specified rangeBinary Flow fileTop_n_flow
Count of distinct destinations to which each source IP connectsBinary Flow fileDistinct destination
New and terminated flow counts and sum of their sizes per secondBinary Flow fileNew and Exit Flow
Inter/intra domain flow lifetime and sizesBinary Flow fileFlow lifetime and size
Inter/intra domain flow counts per second Binary Flow file Flow count
Generate 4 (src/dst IP, src/dst port) tuple based TCP flowsBinary and asciiflow file
Flow generator
Inter & intra domain Bit Counts : TCP, UDP and Other (1s, 1ms & 1us )DAG LogsProtocol Analysis
Inter domain and intra domain bit counts (at 1s, 1ms and 1us scale)DAG LogsUtilization measure
Function InputTool Name(C programs)

15POSTECHDP&NM Lab.
Analysis Tools
Generating complete diagnosis documentDiagnosis Script: Process data to get useful informationGnuplot Script: Generate plotsLatex script: Arrange plots in document
SNMP Logs
DAG Logs
Diagnosis Tool
Complete
Diagnosis
Document

16POSTECHDP&NM Lab.
Dorm Backbone SwitchUnderutilized Links
6.11.761.8227.417.4411(Nakwon Link)
14.25.828.5816.711.6910
24.22.048.5113.04.139
29.19.458.3129.918.848
18.827.037.7710.154.077
48.215.396.4644.530.606
9832.9196.0794.265.865
16.66.233.2418.312.494
43.512.987.1038.225.853
82.926.5829.61399.42652 (Backbone Link)
000001
Max Utilization(Max/BW)%
Avg. Utilization (AVG/BW) %
Max(Mbps)
StandardDeviation
(Mbps)
MeanIngress Bits
(Mbps)
Interface Number

17POSTECHDP&NM Lab.
Dorm Backbone SwitchBackbone VS Non-backbone Traffic
Switch have single backbone link
Total ingress traffic across all non-backbone link is equivalent to backbone egress traffic

18POSTECHDP&NM Lab.
Protocol Based AnalysisIP Traffic
0.01%0.39%96.7%Inter Domain
0.003%0.02%2.8%Intra Domain
OtherUDP TCPNak-won link Traffic

19POSTECHDP&NM Lab.
Protocol Based AnalysisNon-IP Traffic

20POSTECHDP&NM Lab.
Broadcast Packet Analysis
IP level broadcast packets
Tie up system resources
Broadcast packets and packet loss correlation coefficient: -0.009

21POSTECHDP&NM Lab.
Loss Correlation
500 1000 1500 2000
Packet Loss1sec scale Over 30mins
Losses are highly correlated

22POSTECHDP&NM Lab.
Flow Analysis - Distinct Destinations
4 Tuple-based TCP Flow (Src/Dst IP Address, Src/Dst Port)
Max number of distinct destinationsLoss period: 492No loss period: 460
Number of distinct sources are 63
No IP spoofing

23POSTECHDP&NM Lab.
Flow Analysis - Flow Count
More number of flows during loss period
26.669 111316 240.490 Rare
26.277197393300.11Heavy
Standard deviationMinMaxMeanPacket Loss

24POSTECHDP&NM Lab.
Flow Analysis – Flow Size
Pr [x = a] ~= c x^ {-alpha}
4.583 241.228 400.233 Rare
6.06436.61400.24Heavy
Standard deviationMaxMin (Bytes)MeanPacket Loss

25POSTECHDP&NM Lab.
Flow Analysis – Flow Lifetime
Flows are longer during loss period
177.64450200036.51392Rare
196.69260200042.25034Heavy
Standard deviationMinMaxMeanLoss

26POSTECHDP&NM Lab.
Flow Analysis – New &Terminated Flows
Number of flows initiated and terminated every second are comparable
5.7330637.081Terminated Flow5.7530837.081New flow
5.6240737.660Loss- Terminated Flow
6.03901167.660Loss - New Flow
Standard deviationMinMaxMean

27POSTECHDP&NM Lab.
Flow Analysis - Large TCP Flows
Sum of top 50 flows size: 83% of total traffic

28POSTECHDP&NM Lab.
Flow Analysis - Large TCP Flows Throughput
Flow sizes: 179Mbytes and 140Mbytes

29POSTECHDP&NM Lab.
Flow Analysis - Large TCP FlowsSequence Number
SNMP Loss Rate: 40 packets/second
Flow Loss Rate: 37 packets/second

30POSTECHDP&NM Lab.
ConclusionStudy traffic and packet Loss characteristics
To determine root cause
Cause AnalysisCollected data from a underutilized link (2%)Defined a complete methodologyDeveloped tools to execute methodologyAnalyzed data using our tools
ResultsTCP protocol is present in highest percentageNo malicious or spurious traffic is present in our linkBroadcast packets do not affect packet lossLosses are strongly correlatedNumber of flows are higher during loss periodTCP large flows are suspected as one of the possible reasons
Complicated to verify due to SNMP inaccuracies
ContributionDeveloped a cause analysis methodDeveloped set of tools to execute the analysis

31POSTECHDP&NM Lab.
Future Work
Detail study of TCP characterization by monitoring and analyzing both ingress/egress directions and backbone link traffic
Collecting data sets from various networks including IPv6
Studying packet loss characteristics at core switch or router
Checking if losses occur only on the links that convey large TCP flows
If large TCP flows are responsible for lossesNeed to determine remedy to avoid these losses
32POSTECHDP&NM Lab.
Questions?