causes and effects of n-terminal codon bias in bacterial...
TRANSCRIPT
/ http://www.sciencemag.org/content/early/recent / 26 September 2013 / Page 1 / 10.1126/science.1241934
Codon usage is biased in natural genes and can strongly affect heterolo-gous expression (1). Many organisms are enriched for poorly-adapted codons at the N terminus of genes (2–5). Several studies suggest that these codons slow ribosomal elongation during initiation and lead to increased translational efficiency (2, 4, 6). Most organisms also display reduced mRNA secondary structure at the N terminus (7), and studies using synthetic codon gene variants have resulted in conflicting theories on which mechanisms are causal for expression changes (REF ALL) (8). Information about the causes and effects of codon bias has been restrict-ed to relationships inferred from natural sequences using genome-wide correlation (2, 3, 5, 9, 10), conservation among species (4), or relatively small libraries of synthetic genes with synonymous codon changes (3, 8, 11–15). Here, we separate and quantify the factors controlling expres-sion at the N terminus of genes in E. coli by building and measuring expression from a large synthetic library of defined sequences.
We used array-based oligonucleotide libraries (16) to generate 14,234 combinations of promoters, ribosome binding sites (RBSs), and 11 N-terminal codons in front of super-folder GFP (sfGFP) on a plasmid that constitutively co-expresses mCherry (fig. S1) (17–19). The se-quences for the N-terminal peptides correspond to the first 11 amino acids (including the initiating methionine) of 137 endogenous E. coli essential genes (20) that utilize the entire codon repertoire (fig. S2). We expressed these sfGFP fusions from two promoters and three RBSs of varying strengths (19). We also included the natural RBS for each en-dogenous gene. For each combination of promoter, RBS, and peptide sequence, we designed a set of 13 codon variants to represent a wide range of codon usages and secondary structure free energies across the translation initiation region. We studied the interactions between the 5′ untranslated region (UTR) and N-terminal codon usage because initia-tion is thought to be the rate-limiting step for translation (1), this region has been previously implicated in determining most expression variation (8), N-terminal codons are more highly conserved (21), and rare codons are enriched at the N terminus of natural genes and especially those that are highly expressed (2).
We measured DNA, RNA, and protein levels from the entire library using a multiplex assay (Fig. 1C and figs. S3 and S4) (19). DNA and
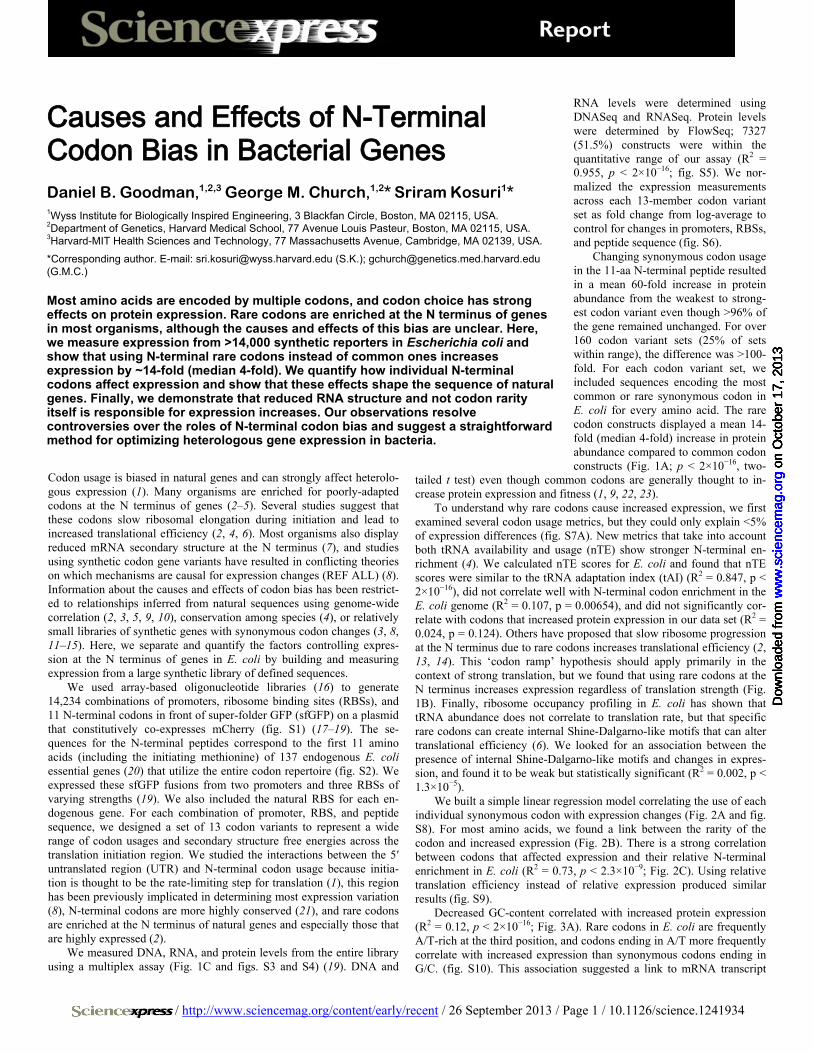
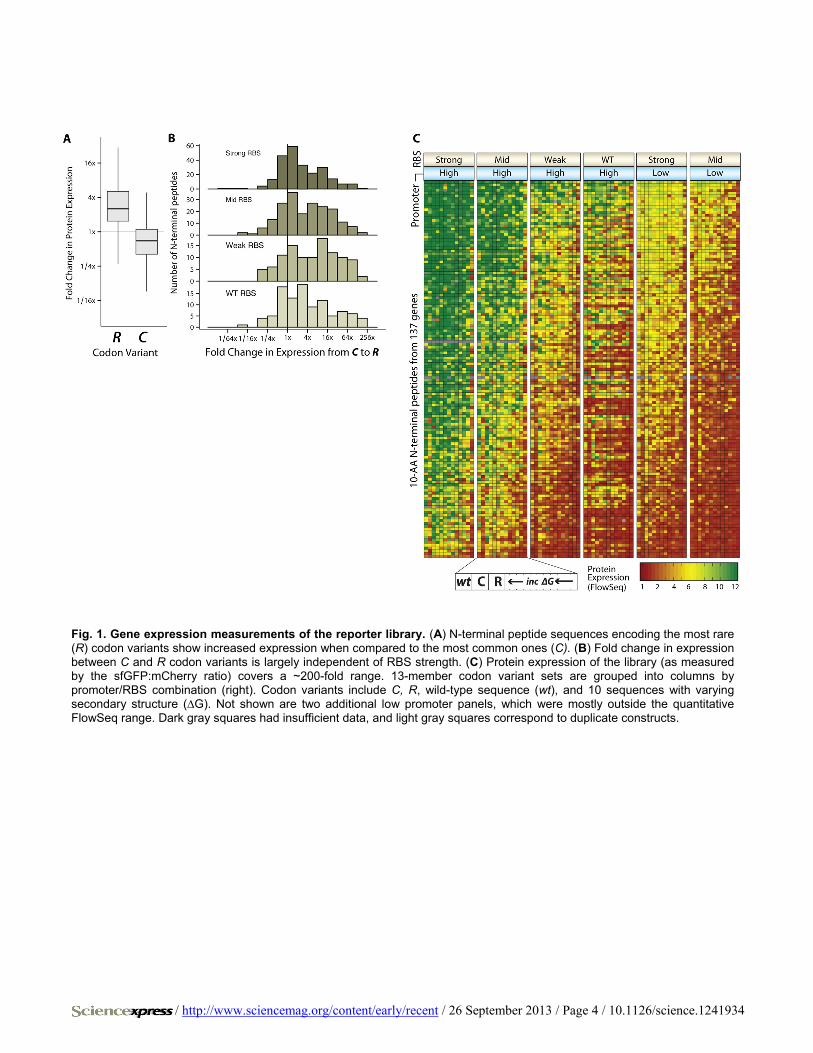
RNA levels were determined using DNASeq and RNASeq. Protein levels were determined by FlowSeq; 7327 (51.5%) constructs were within the quantitative range of our assay (R2 = 0.955, p < 2×10⁻¹⁶; fig. S5). We nor-malized the expression measurements across each 13-member codon variant set as fold change from log-average to control for changes in promoters, RBSs, and peptide sequence (fig. S6).
Changing synonymous codon usage in the 11-aa N-terminal peptide resulted in a mean 60-fold increase in protein abundance from the weakest to strong-est codon variant even though >96% of the gene remained unchanged. For over 160 codon variant sets (25% of sets within range), the difference was >100-fold. For each codon variant set, we included sequences encoding the most common or rare synonymous codon in E. coli for every amino acid. The rare codon constructs displayed a mean 14-fold (median 4-fold) increase in protein abundance compared to common codon constructs (Fig. 1A; p < 2×10⁻¹⁶, two-
tailed t test) even though common codons are generally thought to in-crease protein expression and fitness (1, 9, 22, 23).
To understand why rare codons cause increased expression, we first examined several codon usage metrics, but they could only explain <5% of expression differences (fig. S7A). New metrics that take into account both tRNA availability and usage (nTE) show stronger N-terminal en-richment (4). We calculated nTE scores for E. coli and found that nTE scores were similar to the tRNA adaptation index (tAI) (R2 = 0.847, p < 2×10⁻¹⁶), did not correlate well with N-terminal codon enrichment in the E. coli genome (R2 = 0.107, p = 0.00654), and did not significantly cor-relate with codons that increased protein expression in our data set (R2 = 0.024, p = 0.124). Others have proposed that slow ribosome progression at the N terminus due to rare codons increases translational efficiency (2, 13, 14). This ‘codon ramp’ hypothesis should apply primarily in the context of strong translation, but we found that using rare codons at the N terminus increases expression regardless of translation strength (Fig. 1B). Finally, ribosome occupancy profiling in E. coli has shown that tRNA abundance does not correlate to translation rate, but that specific rare codons can create internal Shine-Dalgarno-like motifs that can alter translational efficiency (6). We looked for an association between the presence of internal Shine-Dalgarno-like motifs and changes in expres-sion, and found it to be weak but statistically significant (R2 = 0.002, p < 1.3×10⁻⁵).
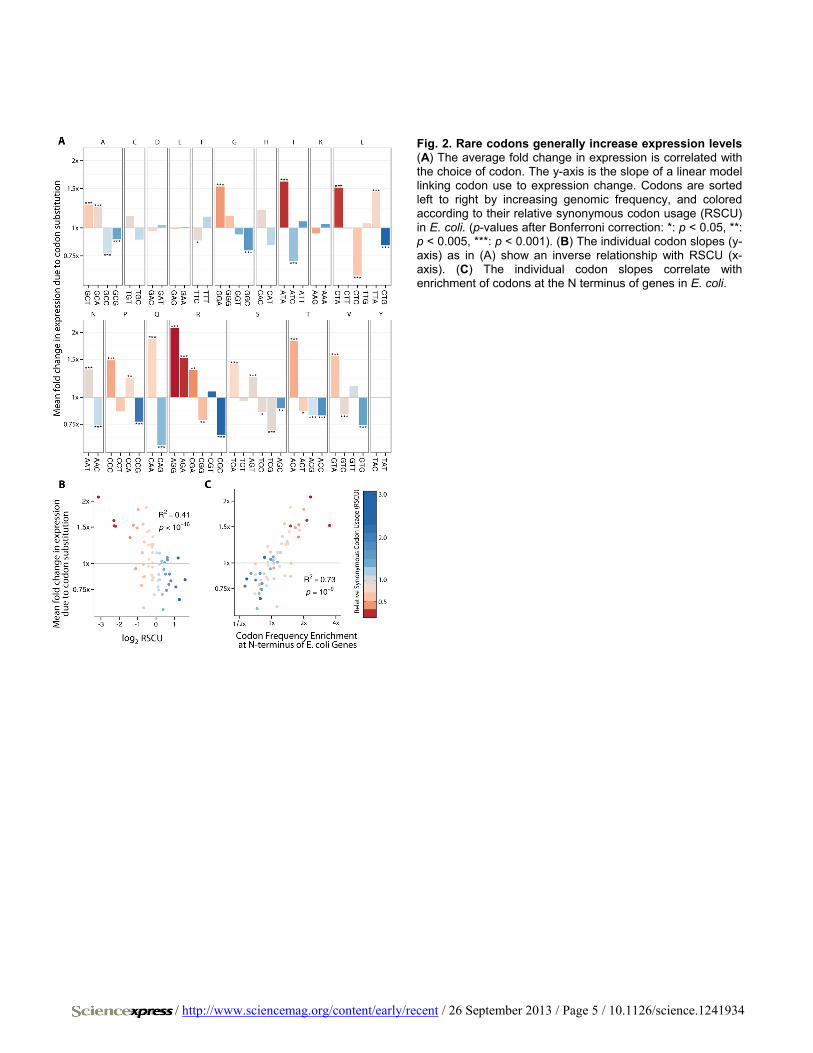
We built a simple linear regression model correlating the use of each individual synonymous codon with expression changes (Fig. 2A and fig. S8). For most amino acids, we found a link between the rarity of the codon and increased expression (Fig. 2B). There is a strong correlation between codons that affected expression and their relative N-terminal enrichment in E. coli (R2 = 0.73, p < 2.3×10⁻⁹; Fig. 2C). Using relative translation efficiency instead of relative expression produced similar results (fig. S9).
Decreased GC-content correlated with increased protein expression (R2 = 0.12, p < 2×10⁻¹⁶; Fig. 3A). Rare codons in E. coli are frequently A/T-rich at the third position, and codons ending in A/T more frequently correlate with increased expression than synonymous codons ending in G/C. (fig. S10). This association suggested a link to mRNA transcript
Causes and Effects of N-Terminal Codon Bias in Bacterial Genes Daniel B. Goodman,1,2,3 George M. Church,1,2* Sriram Kosuri1* 1Wyss Institute for Biologically Inspired Engineering, 3 Blackfan Circle, Boston, MA 02115, USA. 2Department of Genetics, Harvard Medical School, 77 Avenue Louis Pasteur, Boston, MA 02115, USA. 3Harvard-MIT Health Sciences and Technology, 77 Massachusetts Avenue, Cambridge, MA 02139, USA.
*Corresponding author. E-mail: [email protected] (S.K.); [email protected] (G.M.C.)
Most amino acids are encoded by multiple codons, and codon choice has strong effects on protein expression. Rare codons are enriched at the N terminus of genes in most organisms, although the causes and effects of this bias are unclear. Here, we measure expression from >14,000 synthetic reporters in Escherichia coli and show that using N-terminal rare codons instead of common ones increases expression by ~14-fold (median 4-fold). We quantify how individual N-terminal codons affect expression and show that these effects shape the sequence of natural genes. Finally, we demonstrate that reduced RNA structure and not codon rarity itself is responsible for expression increases. Our observations resolve controversies over the roles of N-terminal codon bias and suggest a straightforward method for optimizing heterologous gene expression in bacteria.
on
Oct
ober
17,
201
3w
ww
.sci
ence
mag
.org
Dow
nloa
ded
from
o
n O
ctob
er 1
7, 2
013
ww
w.s
cien
cem
ag.o
rgD
ownl
oade
d fr
om
on
Oct
ober
17,
201
3w
ww
.sci
ence
mag
.org
Dow
nloa
ded
from
o
n O
ctob
er 1
7, 2
013
ww
w.s
cien
cem
ag.o
rgD
ownl
oade
d fr
om
on
Oct
ober
17,
201
3w
ww
.sci
ence
mag
.org
Dow
nloa
ded
from
o
n O
ctob
er 1
7, 2
013
ww
w.s
cien
cem
ag.o
rgD
ownl
oade
d fr
om
on
Oct
ober
17,
201
3w
ww
.sci
ence
mag
.org
Dow
nloa
ded
from
/ http://www.sciencemag.org/content/early/recent / 26 September 2013 / Page 2 / 10.1126/science.1241934
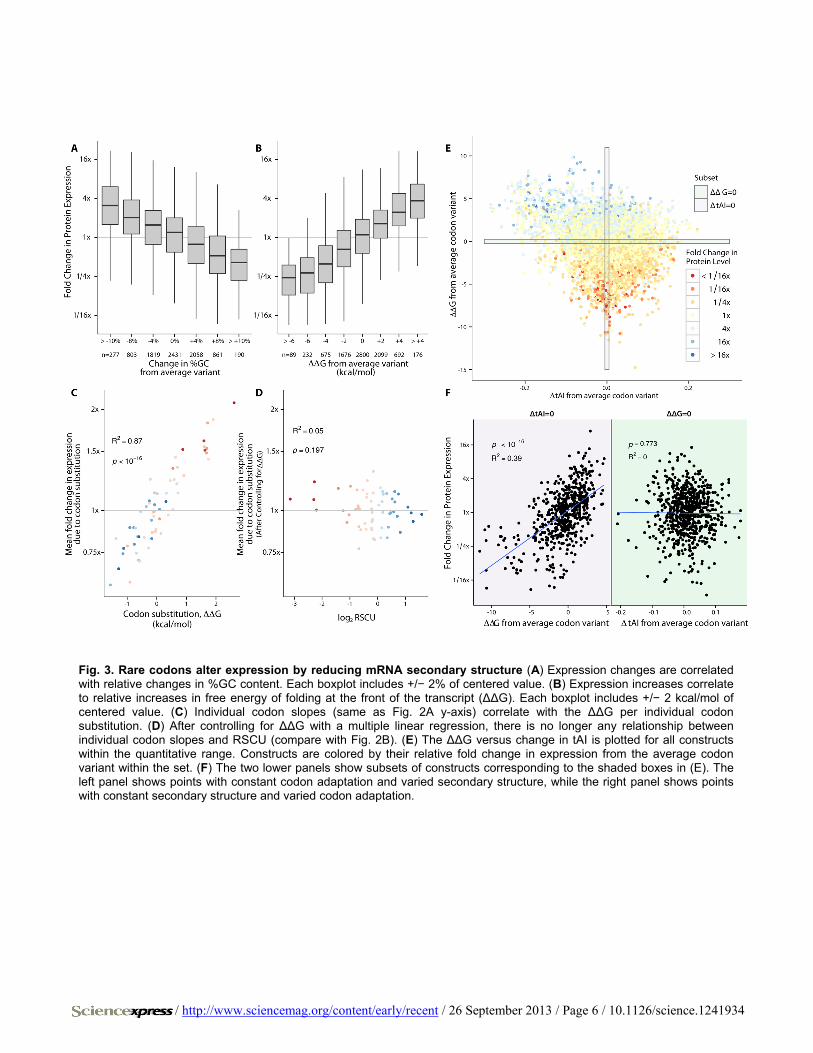
secondary structure (8), and so we computationally predicted RNA structure over the first 120 bases of each transcript using NUPACK (24). We found that increased secondary structure was correlated with de-creased expression, explaining more variation than any other variable we measured (R2 = 0.34, p < 2×10⁻¹⁶; Fig. 3A). We made a similar linear regression model relating individual codon substitution to change in secondary structure free energy rather than expression levels, and found a strong correlation between codons that decreased secondary structure and those that increased protein expression (R2 = 0.87, p < 2×10⁻¹⁶; Fig. 3B). Additionally, codon adaptation metrics at the N terminus correlate as well to change in secondary structure free energy as they do to change in protein expression (fig. S7B).
We used multiple regression to control for the secondary structure changes between codon variants and found that no relationship remained between N-terminal codon adaptation and increased expression (R2 = 0.05, p = 0.197; Fig. 3D). Additionally, constructs with constant tAI still show a correlation between expression and secondary structure, but con-structs with constant secondary structure have no correlation between tAI and expression. (Fig. 3, E and F). Finally, if secondary structure is the dominant factor, we would expect a disproportionate enrichment of A over T due to G-U wobble pairing. Indeed, nucleotide triplets with A at the wobble position were more consistently correlated with expression our dataset and with enrichment at the N terminus of E. coli genes (fig. S11).
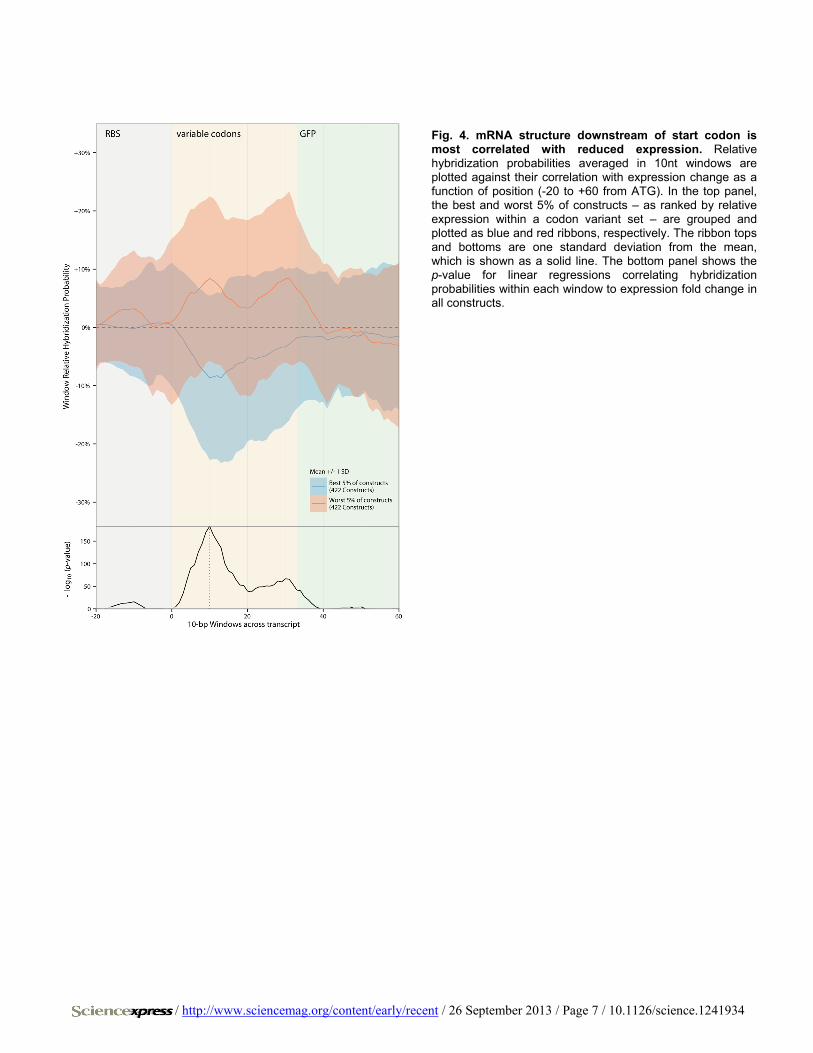
Kudla et al. show that local RNA structure in the region between -4 to +38 of translation start is most correlated with expression change (8). Our data indicate that the region centered on +10 is most correlated with expression changes (Fig. 4 and figs. S12 to S14), closely matching in-vitro translation studies (25). This region remained the most correlated for the subset of constructs with no change in total free energy of folding across the N-terminal region (figs. S15 and S16). While secondary struc-ture is known to affect the RBS (26), when altering only codon usage, RNA structure after the start codon, and not at the RBS, is the major contributor to expression differences. A multiple linear regression model that combines promoter and RBS choice, as well as N-terminal second-ary structure and GC content still explains only 54% of variation in ex-pression levels. Amino acid composition effects on sfGFP folding and inadequacies in computational RNA structure prediction could be par-tially responsible. However, there are likely additional effects left to uncover, and the extent to which codon usage beyond the N-terminal region alters gene expression remains unresolved (8, 14).
The N terminus of genes in almost all bacteria display reduced sec-ondary structure, but enrichment of poorly-adapted N-terminal codons are only found in bacteria with GC content of at least 50% (3). Recent work further shows that AT-rich codons as opposed to rare codons them-selves are preferentially selected, thus implicating secondary structure as the driving force for N-terminal codon selection in most bacteria (5). Despite mechanistic differences in translation between prokaryotes and eukaryotes, both single- and multi-cell eukaryotes also have reduced N-terminal secondary structure (7). For synthetic GFP templates in yeast, secondary structure is more correlated with expression changes than codon adaptation metrics (10). Here, we do not examine other factors that might shape natural sequence such as codon pair bias (1, 27), co-translational folding (4, 12, 28), or growth conditions (11, 15). Natural genomic sequence is often not suited to distinguish between conflicting hypotheses of how sequence affects function; multiplexed assays of large synthetic DNA libraries provide a powerful method to examine such hypotheses in a controlled manner.
References and Notes 1. J. B. Plotkin, G. Kudla, Synonymous but not the same: the causes and
consequences of codon bias. Nat. Rev. Genet. 12, 32–42 (2011). Medline doi:10.1038/nrg2899
2. T. Tuller, A. Carmi, K. Vestsigian, S. Navon, Y. Dorfan, J. Zaborske, T. Pan, O. Dahan, I. Furman, Y. Pilpel, An evolutionarily conserved mechanism for controlling the efficiency of protein translation. Cell 141, 344–354 (2010). Medline doi:10.1016/j.cell.2010.03.031
3. M. Allert, J. C. Cox, H. W. Hellinga, Multifactorial determinants of protein expression in prokaryotic open reading frames. J. Mol. Biol. 402, 905–918 (2010). Medline doi:10.1016/j.jmb.2010.08.010
4. S. Pechmann, J. Frydman, Evolutionary conservation of codon optimality reveals hidden signatures of cotranslational folding. Nat. Struct. Mol. Biol. 20, 237–243 (2013). Medline doi:10.1038/nsmb.2466
5. K. Bentele, P. Saffert, R. Rauscher, Z. Ignatova, N. Blüthgen, Efficient translation initiation dictates codon usage at gene start. Mol. Syst. Biol. 9, 675 (2013). Medline doi:10.1038/msb.2013.32
6. G.-W. Li, E. Oh, J. S. Weissman, The anti-Shine-Dalgarno sequence drives translational pausing and codon choice in bacteria. Nature 484, 538–541 (2012). Medline doi:10.1038/nature10965
7. W. Gu, T. Zhou, C. O. Wilke, A universal trend of reduced mRNA stability near the translation-initiation site in prokaryotes and eukaryotes. PLOS Comput. Biol. 6, e1000664 (2010). Medline doi:10.1371/journal.pcbi.1000664
8. G. Kudla, A. W. Murray, D. Tollervey, J. B. Plotkin, Coding-sequence determinants of gene expression in Escherichia coli. Science 324, 255–258 (2009). Medline doi:10.1126/science.1170160
9. M. dos Reis, R. Savva, L. Wernisch, Solving the riddle of codon usage preferences: a test for translational selection. Nucleic Acids Res. 32, 5036–5044 (2004). Medline doi:10.1093/nar/gkh834
10. P. Shah, Y. Ding, M. Niemczyk, G. Kudla, J. B. Plotkin, Rate-limiting steps in yeast protein translation. Cell 153, 1589–1601 (2013). Medline doi:10.1016/j.cell.2013.05.049
11. M. Welch, S. Govindarajan, J. E. Ness, A. Villalobos, A. Gurney, J. Minshull, C. Gustafsson, Design parameters to control synthetic gene expression in Escherichia coli. PLoS ONE 4, e7002 (2009). Medline doi:10.1371/journal.pone.0007002
12. M. Zhou, J. Guo, J. Cha, M. Chae, S. Chen, J. M. Barral, M. S. Sachs, Y. Liu, Non-optimal codon usage affects expression, structure and function of clock protein FRQ. Nature 495, 111–115 (2013). Medline doi:10.1038/nature11833
13. S. Navon, Y. Pilpel, The role of codon selection in regulation of translation efficiency deduced from synthetic libraries. Genome Biol. 12, R12 (2011). Medline doi:10.1186/gb-2011-12-2-r12
14. T. Tuller, Y. Y. Waldman, M. Kupiec, E. Ruppin, Translation efficiency is determined by both codon bias and folding energy. Proc. Natl. Acad. Sci. U.S.A. 107, 3645–3650 (2010). Medline doi:10.1073/pnas.0909910107
15. A. R. Subramaniam, T. Pan, P. Cluzel, Environmental perturbations lift the degeneracy of the genetic code to regulate protein levels in bacteria. Proc. Natl. Acad. Sci. U.S.A. 110, 2419–2424 (2013). Medline doi:10.1073/pnas.1211077110
16. E. M. LeProust, B. J. Peck, K. Spirin, H. B. McCuen, B. Moore, E. Namsaraev, M. H. Caruthers, Synthesis of high-quality libraries of long (150mer) oligonucleotides by a novel depurination controlled process. Nucleic Acids Res. 38, 2522–2540 (2010). Medline doi:10.1093/nar/gkq163
17. J.-D. Pédelacq, S. E. P. Cabantous, T. Tran, T. C. Terwilliger, G. S. Waldo, Engineering and characterization of a superfolder green fluorescent protein. Nat. Biotechnol. 24, 79–88 (2006). Medline doi:10.1038/nbt1172
18. N. C. Shaner, R. E. Campbell, P. A. Steinbach, B. N. Giepmans, A. E. Palmer, R. Y. Tsien, Improved monomeric red, orange and yellow fluorescent proteins derived from Discosoma sp. red fluorescent protein. Nat. Biotechnol. 22, 1567–1572 (2004). Medline doi:10.1038/nbt1037
19. S. Kosuri, D. B. Goodman, G. Cambray, V. K. Mutalik, Y. Gao, A. P. Arkin, D. Endy, G. M. Church, Composability of regulatory sequences controlling transcription and translation in Escherichia coli. Proc. Natl. Acad. Sci. U.S.A. 110, 14024–14029 (2013). 10.1073/pnas.1301301110 Medline doi:10.1073/pnas.1301301110
20. Y. Yamazaki, H. Niki, J.-I. Kato, Profiling of Escherichia coli Chromosome database. Methods Mol. Biol. 416, 385–389 (2008). Medline doi:10.1007/978-1-59745-321-9_26
21. D. L. Hartl, E. N. Moriyama, S. A. Sawyer, Selection intensity for codon bias. Genetics 138, 227–234 (1994). Medline
22. M. Gouy, C. Gautier, Codon usage in bacteria: correlation with gene expressivity. Nucleic Acids Res. 10, 7055–7074 (1982). Medline doi:10.1093/nar/10.22.7055
/ http://www.sciencemag.org/content/early/recent / 26 September 2013 / Page 3 / 10.1126/science.1241934
23. P. M. Sharp, W. H. Li, The codon Adaptation Index—a measure of directional synonymous codon usage bias, and its potential applications. Nucleic Acids Res. 15, 1281–1295 (1987). Medline doi:10.1093/nar/15.3.1281
24. J. N. Zadeh, C. D. Steenberg, J. S. Bois, B. R. Wolfe, M. B. Pierce, A. R. Khan, R. M. Dirks, N. A. Pierce, NUPACK: Analysis and design of nucleic acid systems. J. Comput. Chem. 32, 170–173 (2011). Medline doi:10.1002/jcc.21596
25. D. Voges, M. Watzele, C. Nemetz, S. Wizemann, B. Buchberger, Analyzing and enhancing mRNA translational efficiency in an Escherichia coli in vitro expression system. Biochem. Biophys. Res. Commun. 318, 601–614 (2004). Medline doi:10.1016/j.bbrc.2004.04.064
26. M. H. de Smit, J. van Duin, Secondary structure of the ribosome binding site determines translational efficiency: a quantitative analysis. Proc. Natl. Acad. Sci. U.S.A. 87, 7668–7672 (1990). Medline doi:10.1073/pnas.87.19.7668
27. J. R. Coleman, D. Papamichail, S. Skiena, B. Futcher, E. Wimmer, S. Mueller, Virus attenuation by genome-scale changes in codon pair bias. Science 320, 1784–1787 (2008). Medline doi:10.1126/science.1155761
28. A. A. Komar, A pause for thought along the co-translational folding pathway. Trends Biochem. Sci. 34, 16–24 (2009). Medline doi:10.1016/j.tibs.2008.10.002
29. R. S. Cox, 3rd, M. J. Dunlop, M. B. Elowitz, A synthetic three-color scaffold for monitoring genetic regulation and noise. J Biol Eng 4, 10 (2010). Medline doi:10.1186/1754-1611-4-10
30. F. R. Blattner, G. Plunkett, 3rd, C. A. Bloch, N. T. Perna, V. Burland, M. Riley, J. Collado-Vides, J. D. Glasner, C. K. Rode, G. F. Mayhew, J. Gregor, N. W. Davis, H. A. Kirkpatrick, M. A. Goeden, D. J. Rose, B. Mau, Y. Shao, The complete genome sequence of Escherichia coli K-12. Science 277, 1453–1462 (1997). Medline doi:10.1126/science.277.5331.1453
31. N. R. Markham, M. Zuker, UNAFold: software for nucleic acid folding and hybridization. Methods Mol. Biol. 453, 3–31 (2008). Medline doi:10.1007/978-1-60327-429-6_1
32. J. St. John, SeqPrep; https://github.com/jstjohn/. 33. B. Langmead, C. Trapnell, M. Pop, S. L. Salzberg, Ultrafast and memory-
efficient alignment of short DNA sequences to the human genome. Genome Biol. 10, R25 (2009). Medline doi:10.1186/gb-2009-10-3-r25
34. K. Shiroguchi, T. Z. Jia, P. A. Sims, X. S. Xie, Digital RNA sequencing minimizes sequence-dependent bias and amplification noise with optimized single-molecule barcodes. Proc. Natl. Acad. Sci. U.S.A. 109, 1347–1352 (2012). Medline doi:10.1073/pnas.1118018109
35. P. Lu, C. Vogel, R. Wang, X. Yao, E. M. Marcotte, Absolute protein expression profiling estimates the relative contributions of transcriptional and translational regulation. Nat. Biotechnol. 25, 117–124 (2007). Medline doi:10.1038/nbt1270
Acknowledgments: We thank J. C. Way, E. R. Daugharthy, and R. T. Sauer for comments. The research was supported by the U.S. Department of Energy (DE-FG02-02ER63445 to G.M.C.), NSF SynBERC (SA5283-11210 to G.M.C.), Office of Naval Research (N000141010144 to G.M.C. and S.K.), Agilent Technologies, Wyss Institute, and an NSF Graduate Research Fellowship to D.B.G. Data can be accessed on the National Center for Biotechnology Information , NIH, Sequence Read Archive (SRA) (SRP029609). pGERC reporter can be obtained from AddGene (#47441). Accession numbers: The project ID at the SRA (BioProject) is PRJNA218159. The Project accession is SRP029609. The sample accession is SRS477429. There are three experiments, one for DNA, one for RNA, one for FlowSeq. They are FlowSeq: SRX346268; DNA: SRX346944; RNA: SRX346948.
Supplementary Materials www.sciencemag.org/cgi/content/full/science.1241934/DC1 Materials and Methods Supplementary Text Figs. S1 to S16 Table S1 References (29–35)
14 June 2013; accepted 13 September 2013 Published online 26 September 2013 10.1126/science.1241934
/ http://www.sciencemag.org/content/early/recent / 26 September 2013 / Page 4 / 10.1126/science.1241934
Fig. 1. Gene expression measurements of the reporter library. (A) N-terminal peptide sequences encoding the most rare (R) codon variants show increased expression when compared to the most common ones (C). (B) Fold change in expression between C and R codon variants is largely independent of RBS strength. (C) Protein expression of the library (as measured by the sfGFP:mCherry ratio) covers a ~200-fold range. 13-member codon variant sets are grouped into columns by promoter/RBS combination (right). Codon variants include C, R, wild-type sequence (wt), and 10 sequences with varying secondary structure (∆G). Not shown are two additional low promoter panels, which were mostly outside the quantitative FlowSeq range. Dark gray squares had insufficient data, and light gray squares correspond to duplicate constructs.
/ http://www.sciencemag.org/content/early/recent / 26 September 2013 / Page 5 / 10.1126/science.1241934
Fig. 2. Rare codons generally increase expression levels (A) The average fold change in expression is correlated with the choice of codon. The y-axis is the slope of a linear model linking codon use to expression change. Codons are sorted left to right by increasing genomic frequency, and colored according to their relative synonymous codon usage (RSCU) in E. coli. (p-values after Bonferroni correction: *: p < 0.05, **: p < 0.005, ***: p < 0.001). (B) The individual codon slopes (y-axis) as in (A) show an inverse relationship with RSCU (x-axis). (C) The individual codon slopes correlate with enrichment of codons at the N terminus of genes in E. coli.
/ http://www.sciencemag.org/content/early/recent / 26 September 2013 / Page 6 / 10.1126/science.1241934
Fig. 3. Rare codons alter expression by reducing mRNA secondary structure (A) Expression changes are correlated with relative changes in %GC content. Each boxplot includes +/− 2% of centered value. (B) Expression increases correlate to relative increases in free energy of folding at the front of the transcript (ΔΔG). Each boxplot includes +/− 2 kcal/mol of centered value. (C) Individual codon slopes (same as Fig. 2A y-axis) correlate with the ΔΔG per individual codon substitution. (D) After controlling for ΔΔG with a multiple linear regression, there is no longer any relationship between individual codon slopes and RSCU (compare with Fig. 2B). (E) The ΔΔG versus change in tAI is plotted for all constructs within the quantitative range. Constructs are colored by their relative fold change in expression from the average codon variant within the set. (F) The two lower panels show subsets of constructs corresponding to the shaded boxes in (E). The left panel shows points with constant codon adaptation and varied secondary structure, while the right panel shows points with constant secondary structure and varied codon adaptation.
/ http://www.sciencemag.org/content/early/recent / 26 September 2013 / Page 7 / 10.1126/science.1241934
Fig. 4. mRNA structure downstream of start codon is most correlated with reduced expression. Relative hybridization probabilities averaged in 10nt windows are plotted against their correlation with expression change as a function of position (-20 to +60 from ATG). In the top panel, the best and worst 5% of constructs – as ranked by relative expression within a codon variant set – are grouped and plotted as blue and red ribbons, respectively. The ribbon tops and bottoms are one standard deviation from the mean, which is shown as a solid line. The bottom panel shows the p-value for linear regressions correlating hybridization probabilities within each window to expression fold change in all constructs.