cco - edwards lifesciencesht.edwards.com/presentationvideos/powerpointslides/cco/cco_speaker... ·...
TRANSCRIPT

1

2

3

4

5

6

7

8

9

10

11

12
13
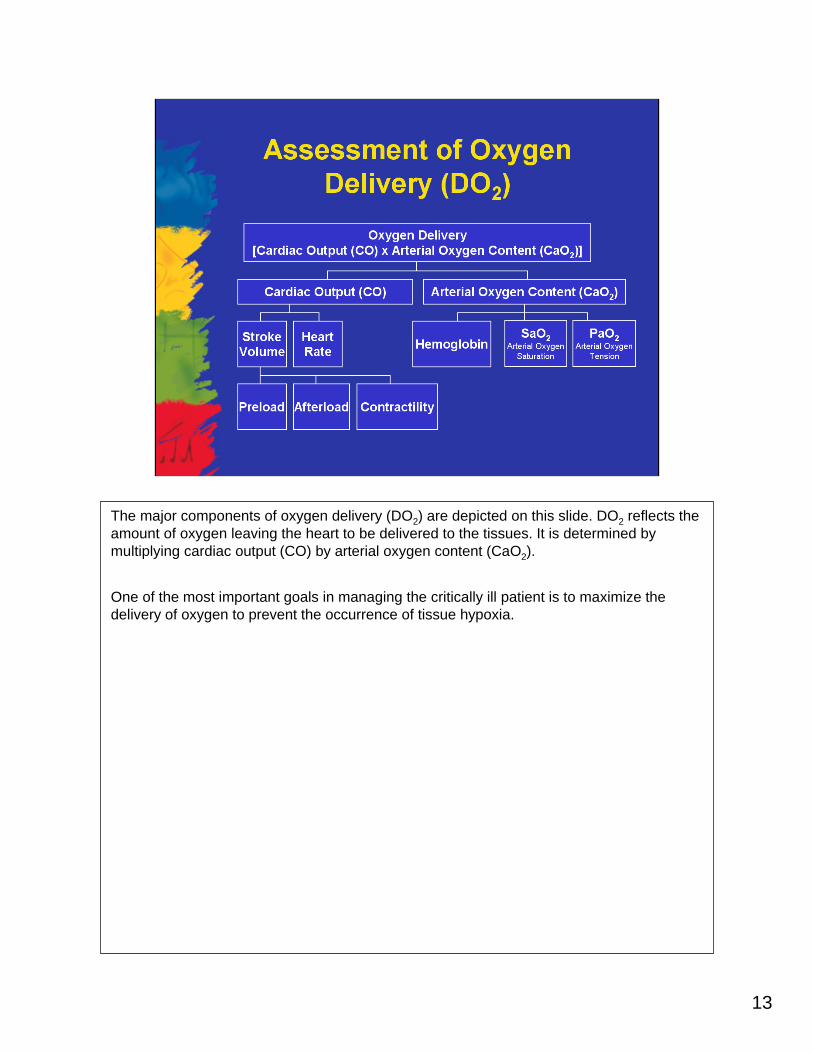
The major components of oxygen delivery (DO2) are depicted on this slide. DO2 reflects the amount of oxygen leaving the heart to be delivered to the tissues. It is determined by multiplying cardiac output (CO) by arterial oxygen content (CaO2).
One of the most important goals in managing the critically ill patient is to maximize the delivery of oxygen to prevent the occurrence of tissue hypoxia.
14
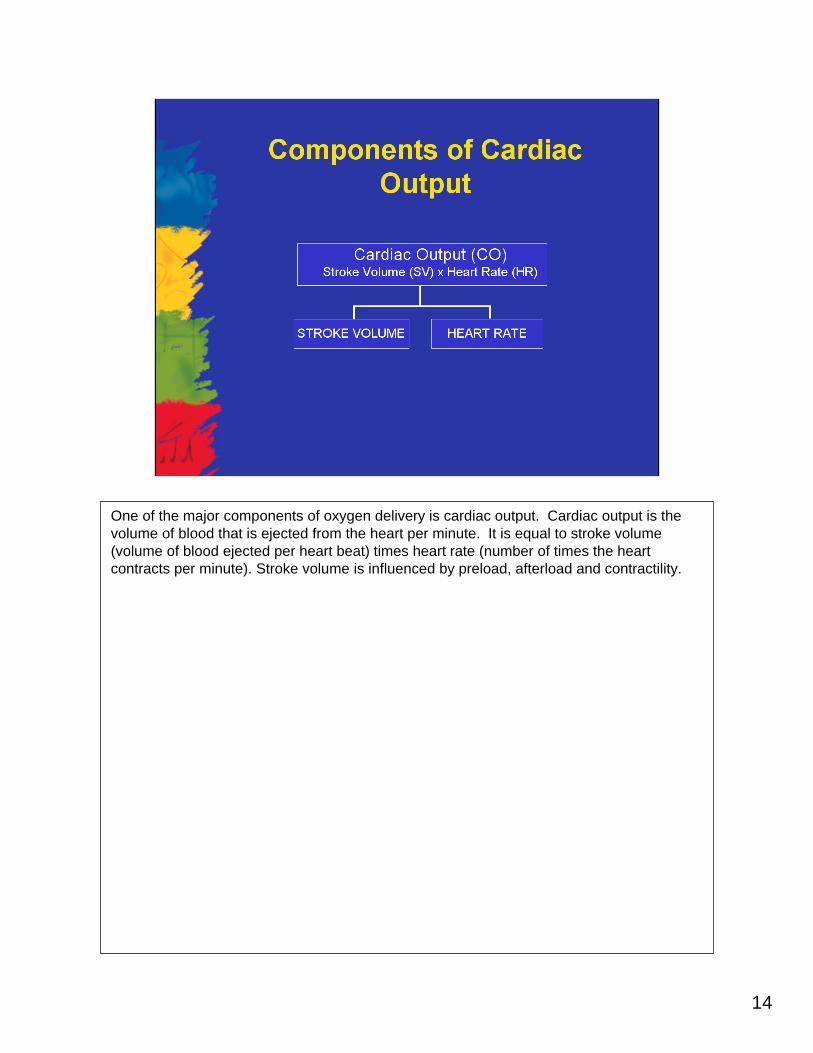
One of the major components of oxygen delivery is cardiac output. Cardiac output is the volume of blood that is ejected from the heart per minute. It is equal to stroke volume (volume of blood ejected per heart beat) times heart rate (number of times the heart contracts per minute). Stroke volume is influenced by preload, afterload and contractility.
15
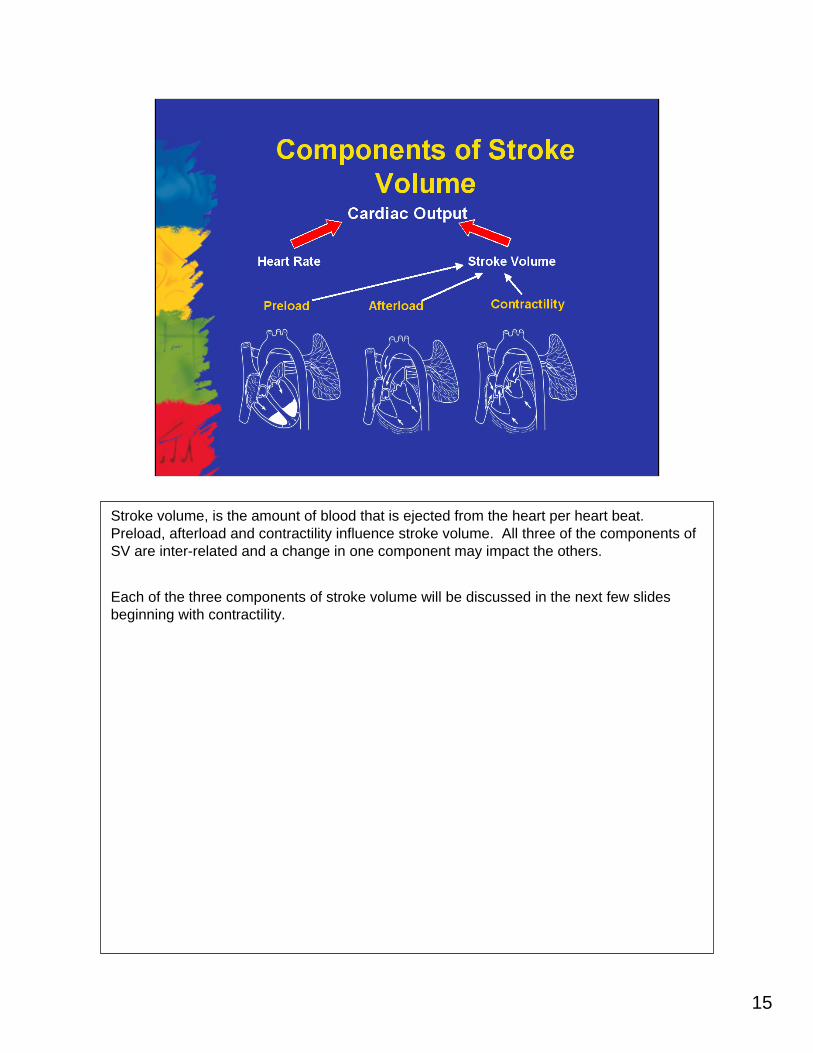
Stroke volume, is the amount of blood that is ejected from the heart per heart beat. Preload, afterload and contractility influence stroke volume. All three of the components ofSV are inter-related and a change in one component may impact the others.
Each of the three components of stroke volume will be discussed in the next few slides beginning with contractility.
16
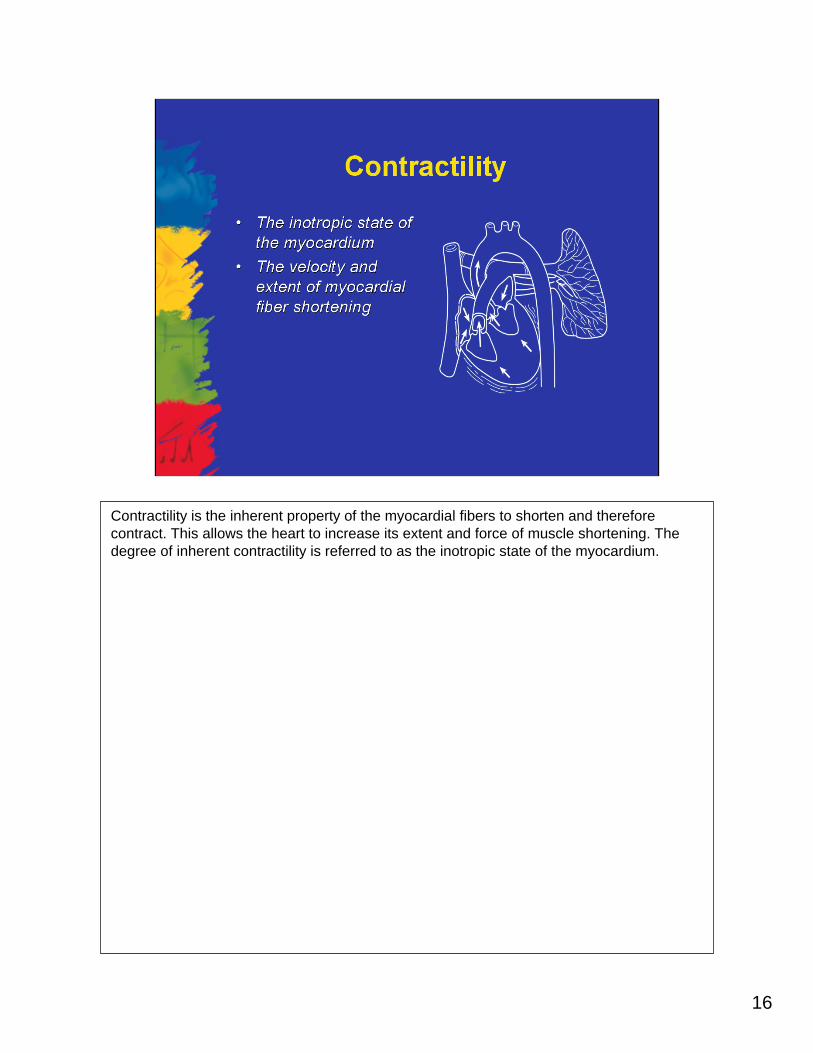
Contractility is the inherent property of the myocardial fibers to shorten and therefore contract. This allows the heart to increase its extent and force of muscle shortening. The degree of inherent contractility is referred to as the inotropic state of the myocardium.

17
Several different parameters are used to reflect contractility. These include stroke volume (SV), stroke volume index (SVI), left ventricular stroke work index (LVSWI) and right ventricular stroke work index (RVSWI).
The normal values and formulas for each of the measures is found on this slide.
18
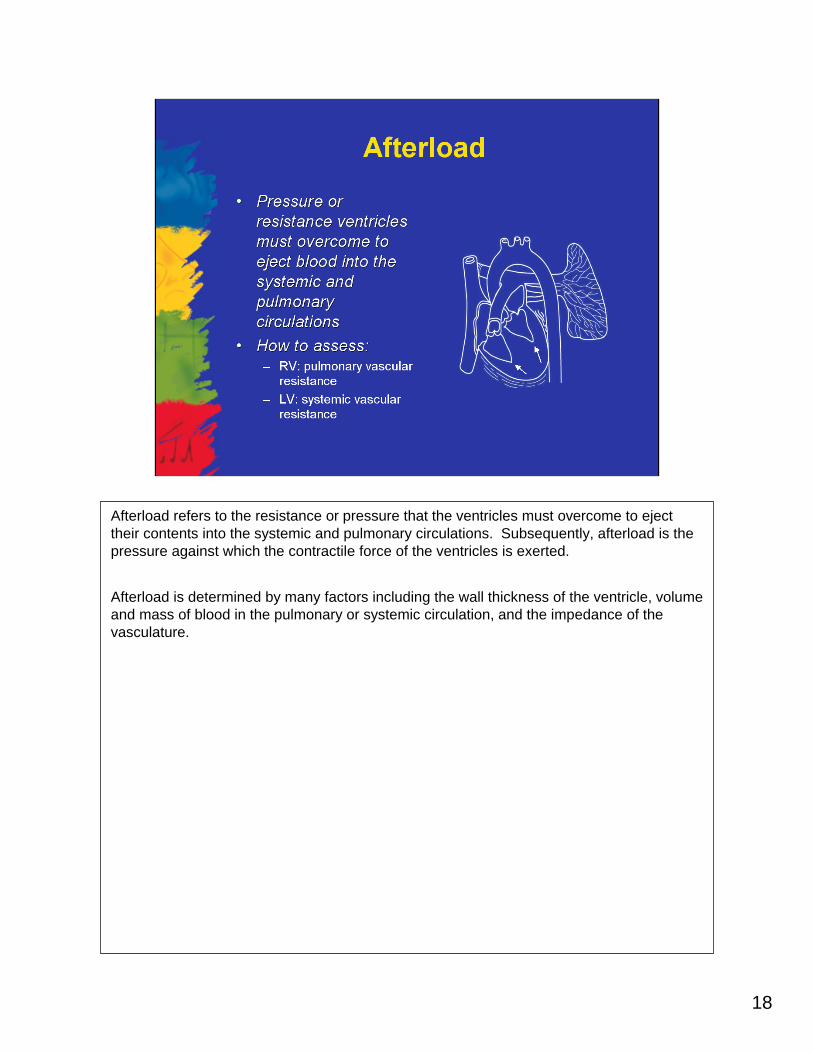
Afterload refers to the resistance or pressure that the ventricles must overcome to eject their contents into the systemic and pulmonary circulations. Subsequently, afterload is the pressure against which the contractile force of the ventricles is exerted.
Afterload is determined by many factors including the wall thickness of the ventricle, volume and mass of blood in the pulmonary or systemic circulation, and the impedance of the vasculature.
19
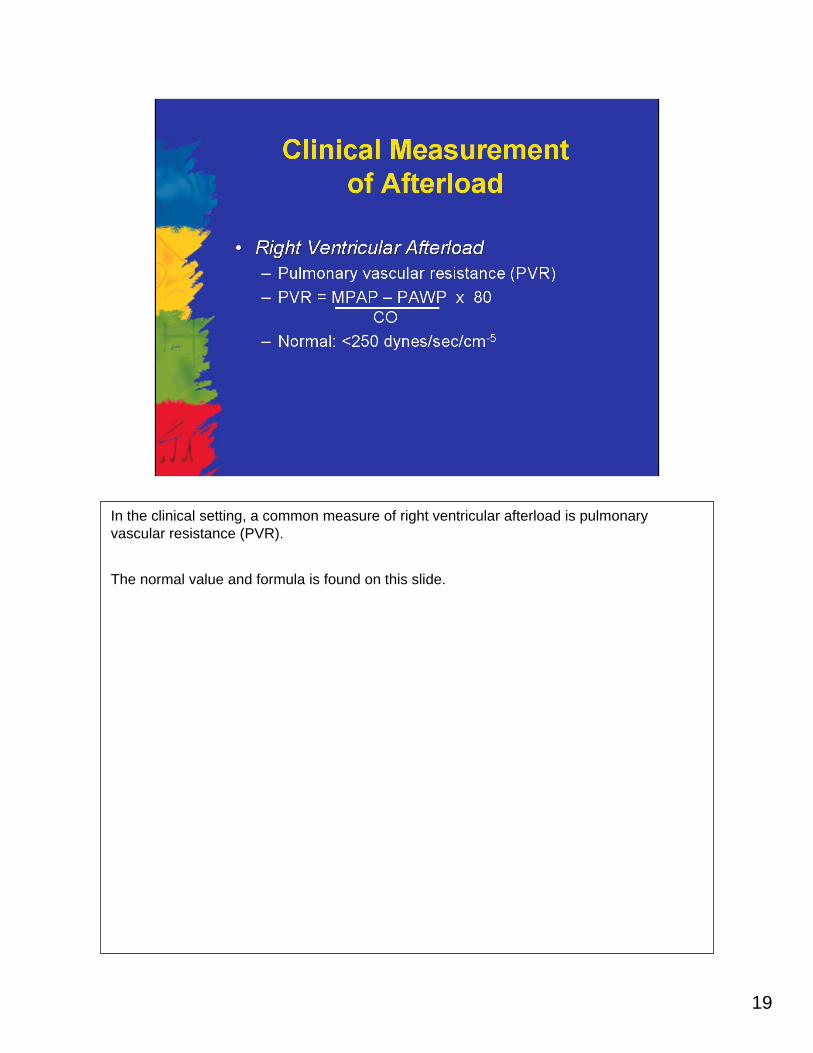
In the clinical setting, a common measure of right ventricular afterload is pulmonary vascular resistance (PVR).
The normal value and formula is found on this slide.
20
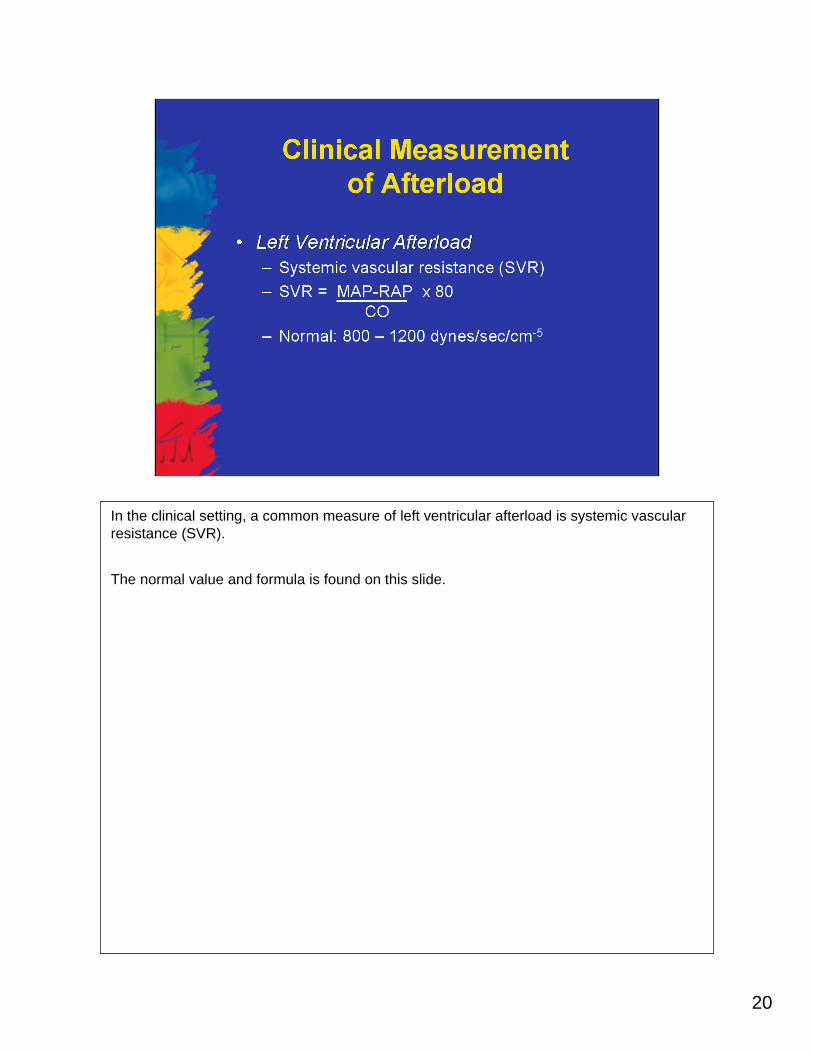
In the clinical setting, a common measure of left ventricular afterload is systemic vascular resistance (SVR).
The normal value and formula is found on this slide.
21
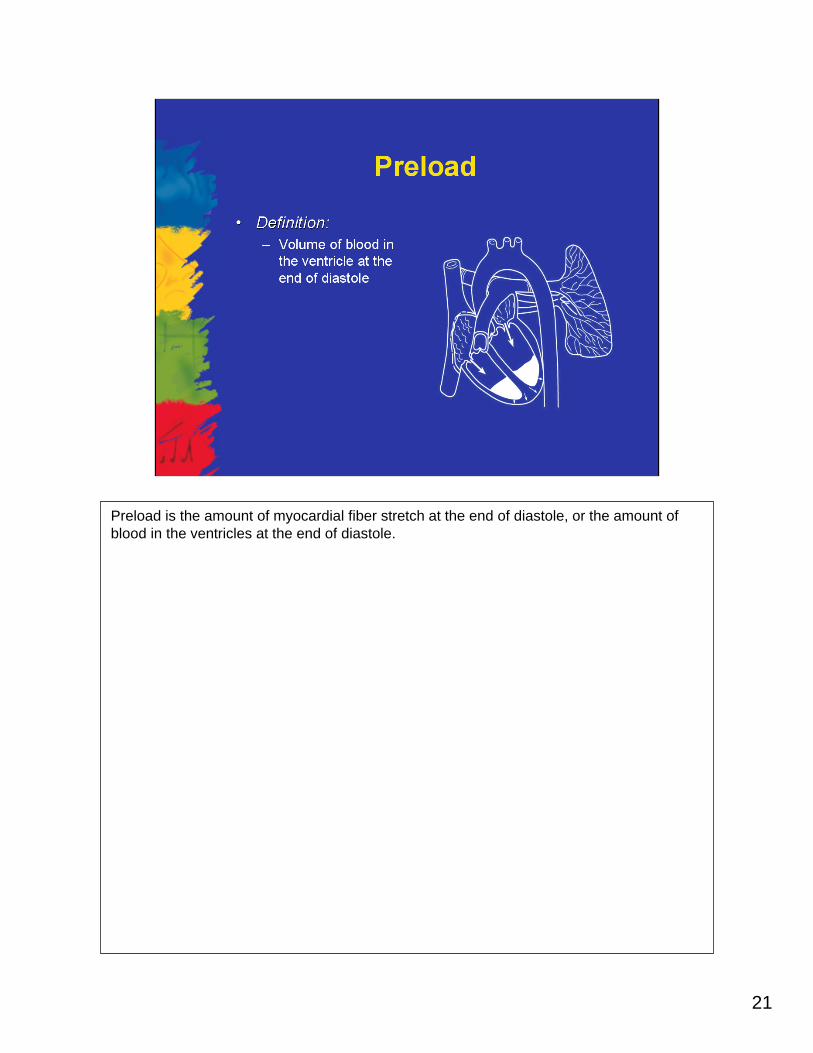
Preload is the amount of myocardial fiber stretch at the end of diastole, or the amount of blood in the ventricles at the end of diastole.

22
The Frank-Starling Law describes the relationship between myocardial fiber length and the force of contraction. This law states that the greater the diastolic volume or fiber stretch at the end of diastole, the stronger the subsequent force of contraction during systole.
This phenomenon will occur until a physiological limit has been reached. Once this limit is reached, the force of contraction will begin to decline, regardless of the increase in fiber stretch.
Manipulating of preload influences stroke volume and subsequently cardiac output.
23
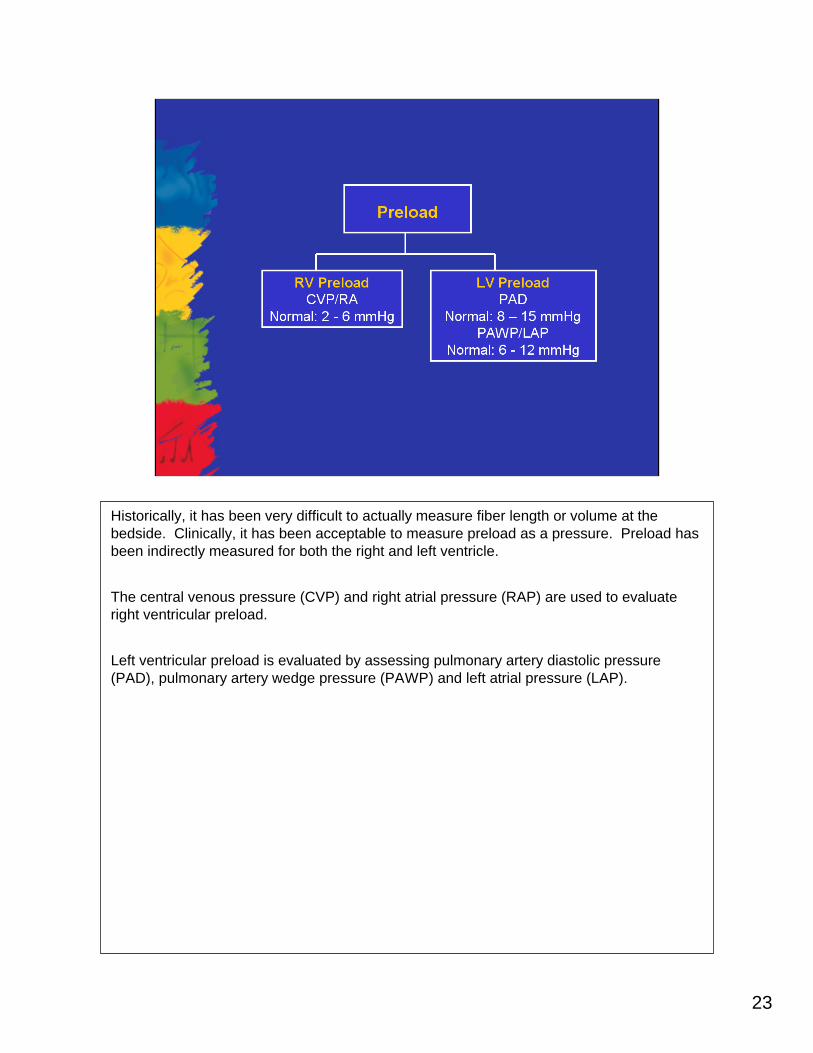
Historically, it has been very difficult to actually measure fiber length or volume at the bedside. Clinically, it has been acceptable to measure preload as a pressure. Preload has been indirectly measured for both the right and left ventricle.
The central venous pressure (CVP) and right atrial pressure (RAP) are used to evaluate right ventricular preload.
Left ventricular preload is evaluated by assessing pulmonary artery diastolic pressure (PAD), pulmonary artery wedge pressure (PAWP) and left atrial pressure (LAP).

24
25
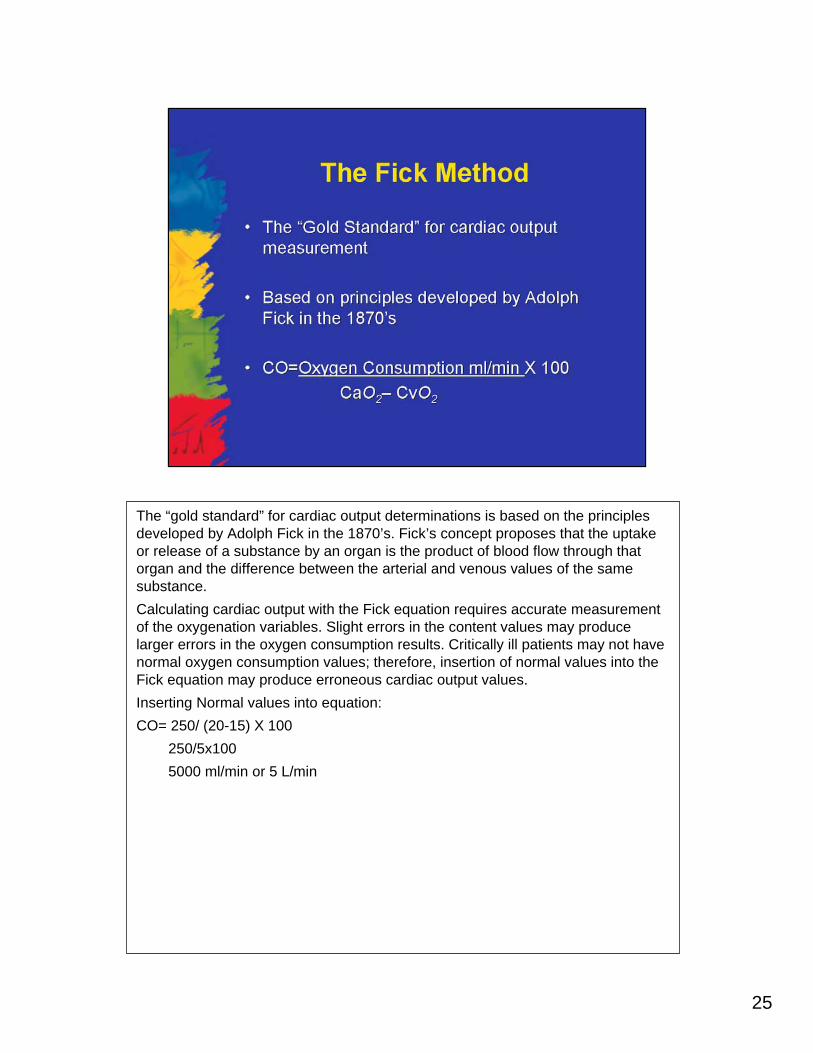
The “gold standard” for cardiac output determinations is based on the principles developed by Adolph Fick in the 1870’s. Fick’s concept proposes that the uptake or release of a substance by an organ is the product of blood flow through that organ and the difference between the arterial and venous values of the same substance. Calculating cardiac output with the Fick equation requires accurate measurement of the oxygenation variables. Slight errors in the content values may produce larger errors in the oxygen consumption results. Critically ill patients may not have normal oxygen consumption values; therefore, insertion of normal values into the Fick equation may produce erroneous cardiac output values. Inserting Normal values into equation:CO= 250/ (20-15) X 100
250/5x1005000 ml/min or 5 L/min
26
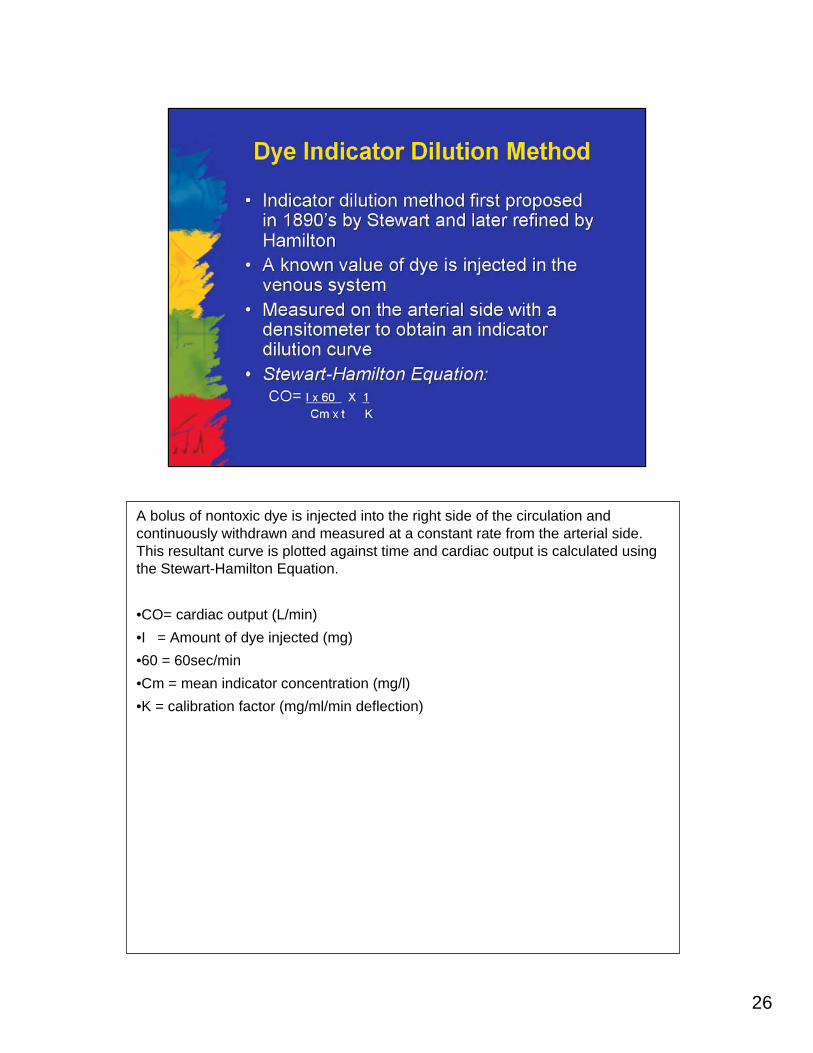
A bolus of nontoxic dye is injected into the right side of the circulation and continuously withdrawn and measured at a constant rate from the arterial side. This resultant curve is plotted against time and cardiac output is calculated using the Stewart-Hamilton Equation.
•CO= cardiac output (L/min)•I = Amount of dye injected (mg)•60 = 60sec/min•Cm = mean indicator concentration (mg/l)•K = calibration factor (mg/ml/min deflection)
27
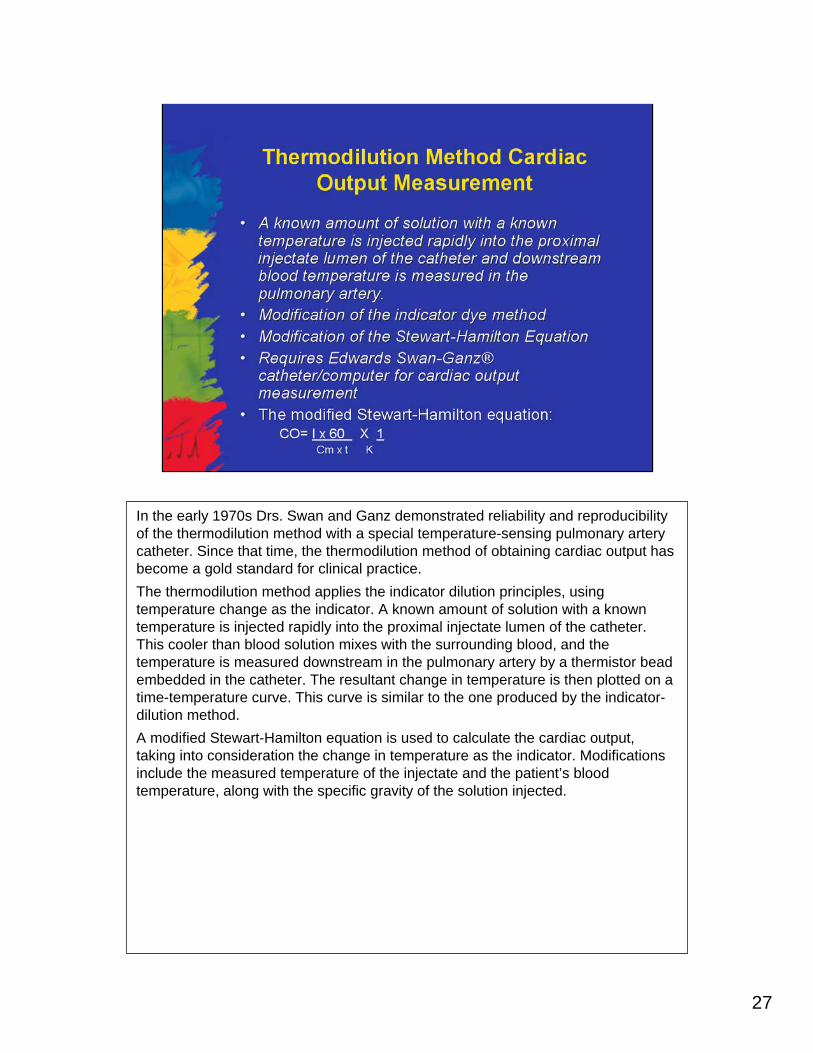
In the early 1970s Drs. Swan and Ganz demonstrated reliability and reproducibility of the thermodilution method with a special temperature-sensing pulmonary artery catheter. Since that time, the thermodilution method of obtaining cardiac output has become a gold standard for clinical practice. The thermodilution method applies the indicator dilution principles, using temperature change as the indicator. A known amount of solution with a known temperature is injected rapidly into the proximal injectate lumen of the catheter. This cooler than blood solution mixes with the surrounding blood, and the temperature is measured downstream in the pulmonary artery by a thermistor bead embedded in the catheter. The resultant change in temperature is then plotted on a time-temperature curve. This curve is similar to the one produced by the indicator-dilution method. A modified Stewart-Hamilton equation is used to calculate the cardiac output, taking into consideration the change in temperature as the indicator. Modifications include the measured temperature of the injectate and the patient’s blood temperature, along with the specific gravity of the solution injected.
28

29
Accuracy of the thermodilution method is based on the presence of several technical and physiological principles. These include the importance of forward blood flow and the adequate mixing of the blood and the indicator. Situations that can affect forward blood flow and mixing include: intracardiac shunts, low cardiac output states, severe tricuspid regurgitation, and a proximal injectate port located in the introducer sheath.
In addition, there must be a temperature difference or gradient between the indicator and the pulmonary artery in order to produce a measurable cardiac output using the thermodilution technique.
A steady baseline pulmonary artery temperature is also necessary to provide reproducible cardiac output determinations by the thermodilution technique.
If any of these abnormalities are present, then the accuracy of the cardiac output determination is limited.
30
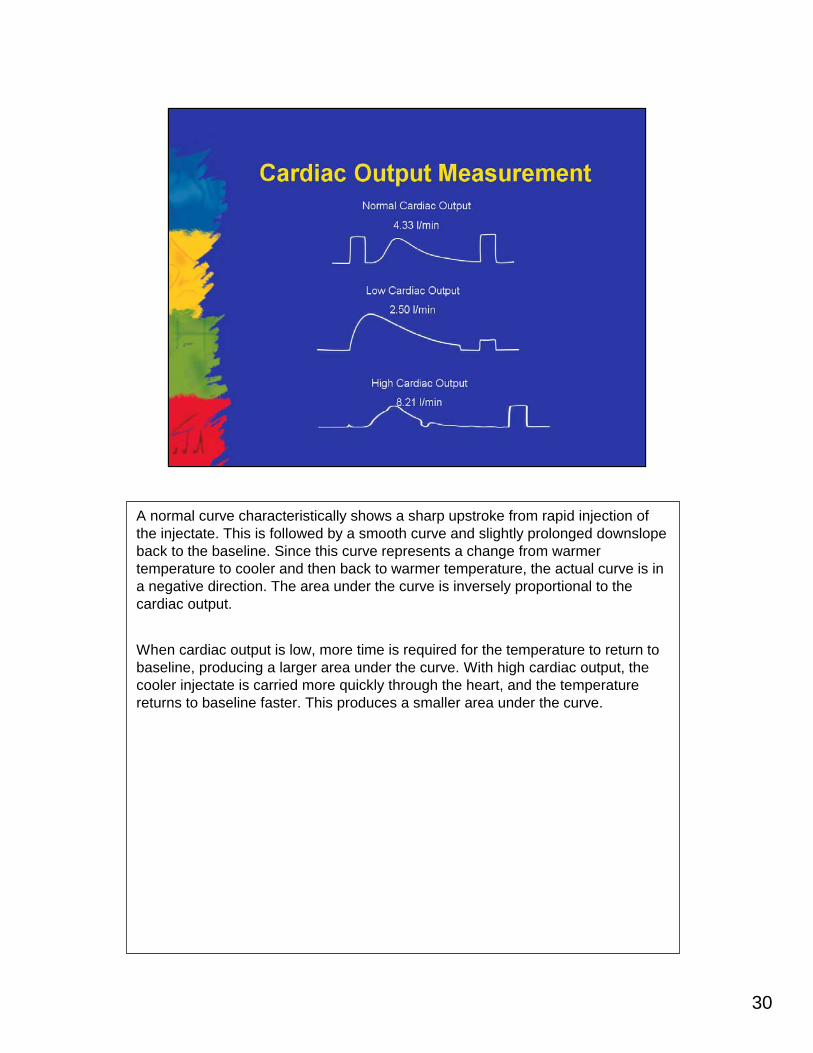
A normal curve characteristically shows a sharp upstroke from rapid injection of the injectate. This is followed by a smooth curve and slightly prolonged downslopeback to the baseline. Since this curve represents a change from warmer temperature to cooler and then back to warmer temperature, the actual curve is in a negative direction. The area under the curve is inversely proportional to the cardiac output.
When cardiac output is low, more time is required for the temperature to return to baseline, producing a larger area under the curve. With high cardiac output, the cooler injectate is carried more quickly through the heart, and the temperature returns to baseline faster. This produces a smaller area under the curve.

31
32
33

34
As noted, factors that influence pulmonary artery baseline temperature may have an affect on the accuracy of the cardiac output as determined by the thermodilutiontechnique.
• Changes in venous return: Changes in intrathoracic pressure or excessive patient movement due to restlessness or agitation
• Concurrent intravenous fluid administration: Rapid peripheral volume infusions have been shown to effect CO measurements
• Changing patient conditions: The rewarming phase post cardiopulmonary bypass can influence the temperature in the pulmonary artery.

35
Intracardiac shunts (atrial septal defects and ventricular septal defects) and tricuspid regurgitation are two conditions that result in reduced accuracy of thermodilution CO measurements. In both cases, the indicator is abnormally recirculated.

36

37
38
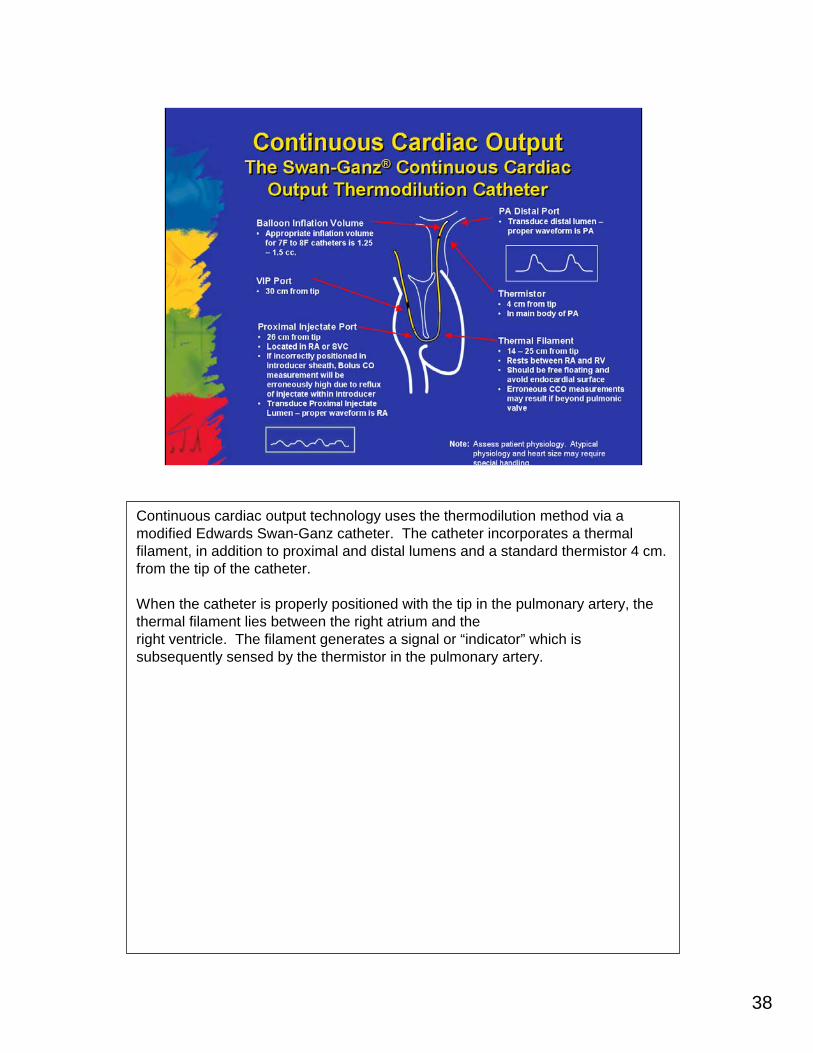
Continuous cardiac output technology uses the thermodilution method via a modified Edwards Swan-Ganz catheter. The catheter incorporates a thermal filament, in addition to proximal and distal lumens and a standard thermistor 4 cm. from the tip of the catheter.
When the catheter is properly positioned with the tip in the pulmonary artery, the thermal filament lies between the right atrium and the right ventricle. The filament generates a signal or “indicator” which is subsequently sensed by the thermistor in the pulmonary artery.
39
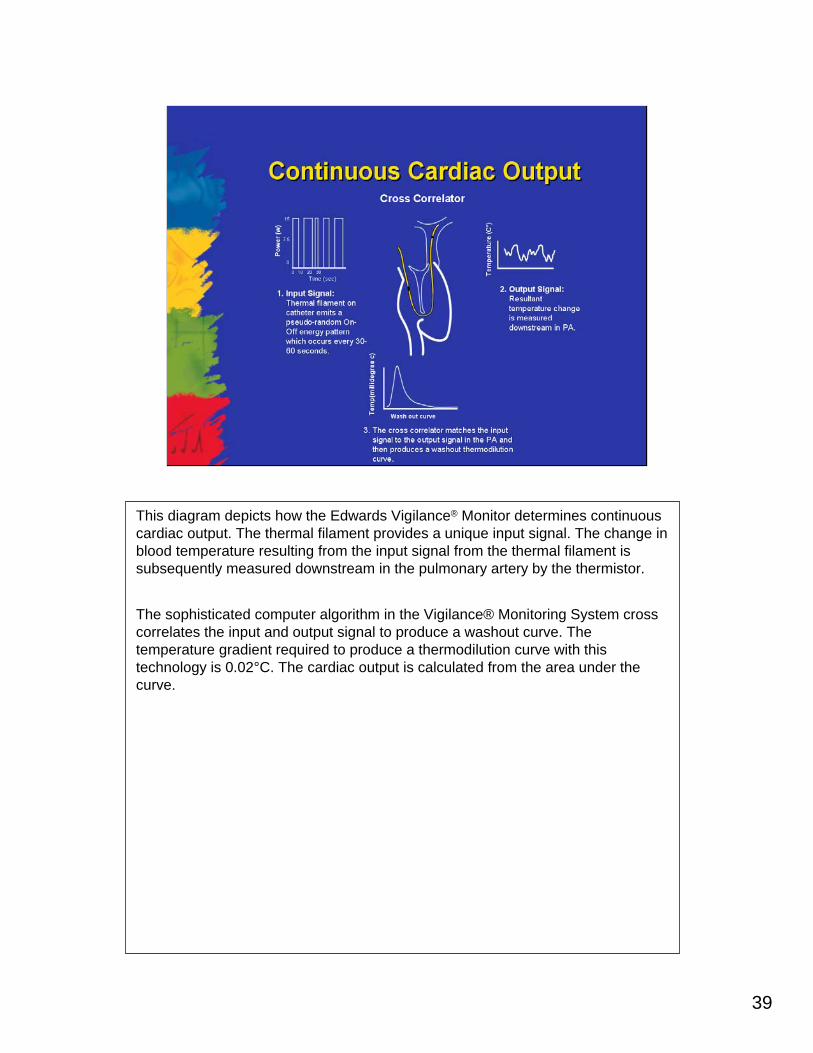
This diagram depicts how the Edwards Vigilance® Monitor determines continuous cardiac output. The thermal filament provides a unique input signal. The change in blood temperature resulting from the input signal from the thermal filament is subsequently measured downstream in the pulmonary artery by the thermistor.
The sophisticated computer algorithm in the Vigilance® Monitoring System cross correlates the input and output signal to produce a washout curve. The temperature gradient required to produce a thermodilution curve with this technology is 0.02°C. The cardiac output is calculated from the area under the curve.

40
The thermistor can measure the many fluctuations in temperature in the pulmonary artery. The Vigilance® Monitor displays pulmonary artery temperature changes to the 10th of a degree centigrade.

41
This method of displaying the CCO value is called STAT Mode or “time averaging”. It is similar to obtaining several intermittent thermodilution bolus measurements and then manually averaging the values to obtain the cardiac output.
The most recent value obtained is displayed in the top left box (3.5 in this example) and the oldest value obtained is in the bottom right box (5.8 in this example). The most recent value is accompanied by a time stamp. All other values are accompanied by the duration of time that has passed since that value was obtained and the most current value was first displayed. A countdown timer in the middle of the screen indicates when the next value is expected (in seconds).
Values are updated approximately every 60 seconds depending on the patient’s condition.

42
The following cases will show how CCO can be used to assist in the management of the critically ill.
43
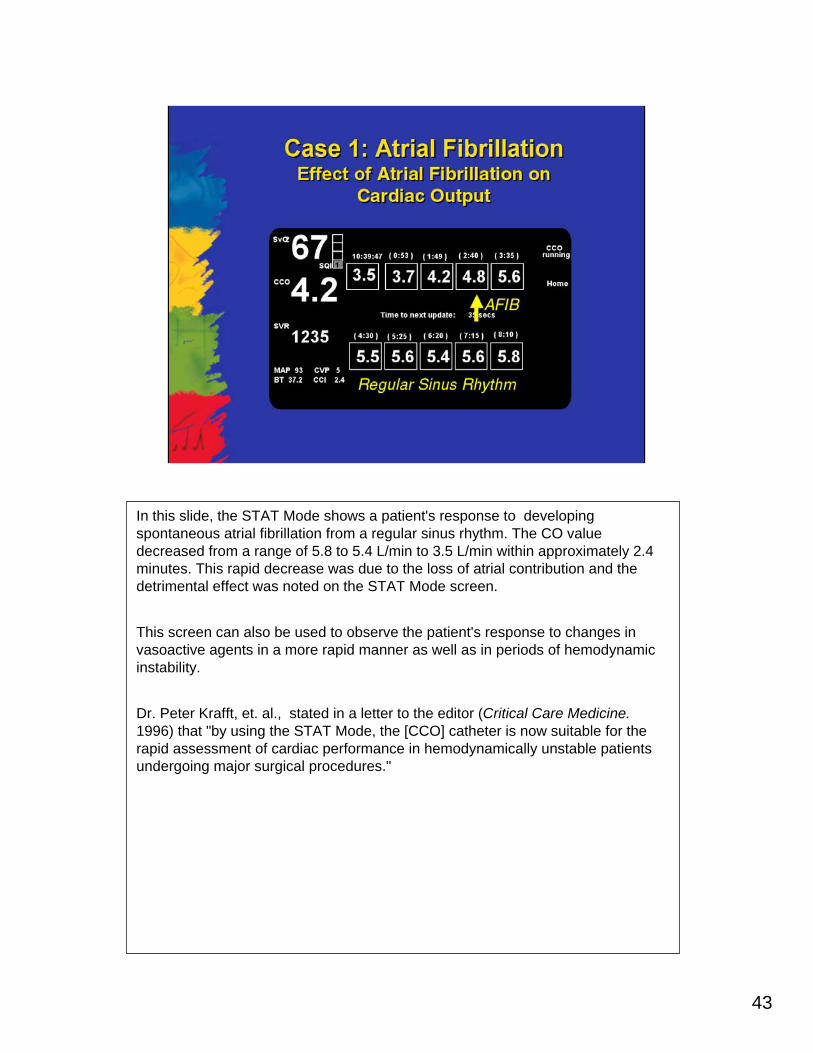
In this slide, the STAT Mode shows a patient's response to developing spontaneous atrial fibrillation from a regular sinus rhythm. The CO value decreased from a range of 5.8 to 5.4 L/min to 3.5 L/min within approximately 2.4 minutes. This rapid decrease was due to the loss of atrial contribution and the detrimental effect was noted on the STAT Mode screen.
This screen can also be used to observe the patient's response to changes in vasoactive agents in a more rapid manner as well as in periods of hemodynamicinstability.
Dr. Peter Krafft, et. al., stated in a letter to the editor (Critical Care Medicine.1996) that "by using the STAT Mode, the [CCO] catheter is now suitable for the rapid assessment of cardiac performance in hemodynamically unstable patients undergoing major surgical procedures."
44
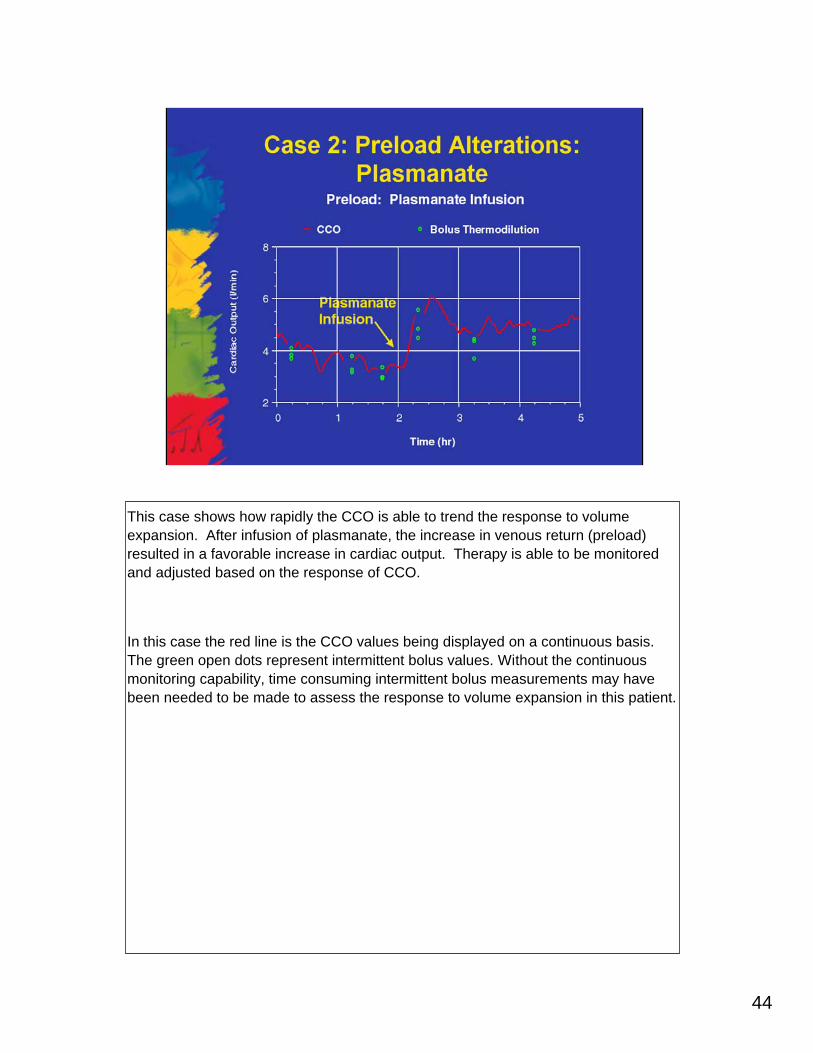
This case shows how rapidly the CCO is able to trend the response to volume expansion. After infusion of plasmanate, the increase in venous return (preload) resulted in a favorable increase in cardiac output. Therapy is able to be monitored and adjusted based on the response of CCO.
In this case the red line is the CCO values being displayed on a continuous basis. The green open dots represent intermittent bolus values. Without the continuous monitoring capability, time consuming intermittent bolus measurements may have been needed to be made to assess the response to volume expansion in this patient.
45
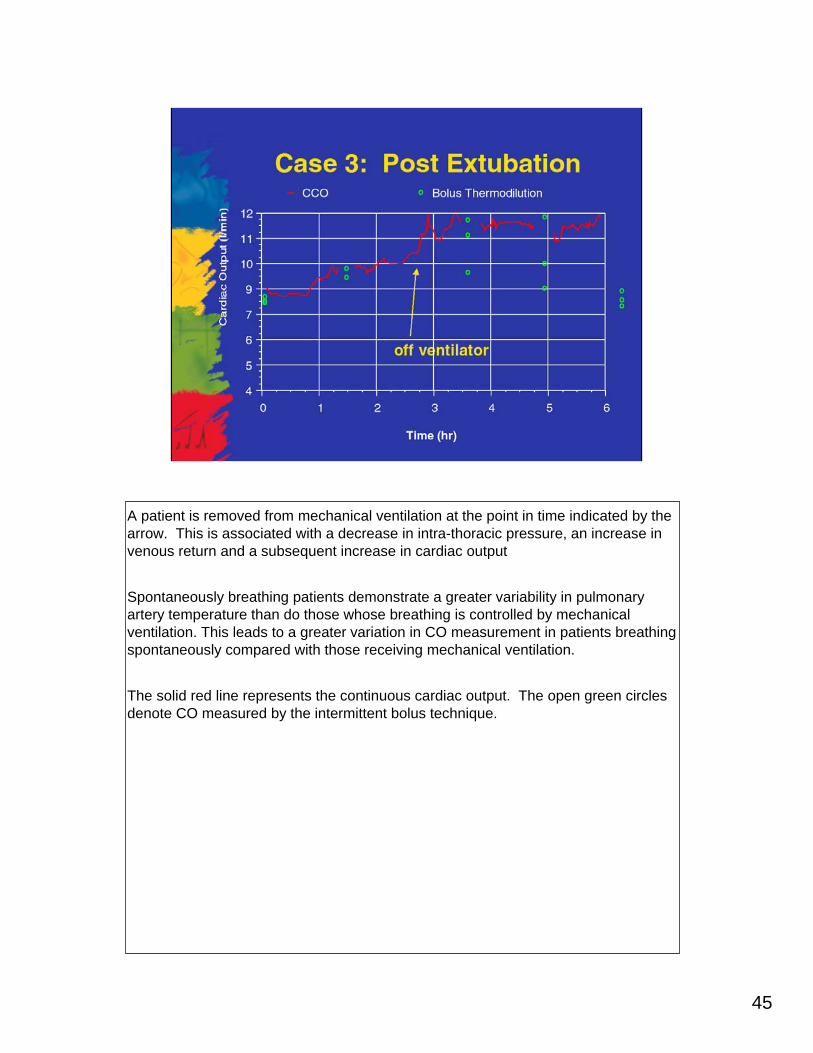
A patient is removed from mechanical ventilation at the point in time indicated by the arrow. This is associated with a decrease in intra-thoracic pressure, an increase in venous return and a subsequent increase in cardiac output
Spontaneously breathing patients demonstrate a greater variability in pulmonary artery temperature than do those whose breathing is controlled by mechanical ventilation. This leads to a greater variation in CO measurement in patients breathing spontaneously compared with those receiving mechanical ventilation.
The solid red line represents the continuous cardiac output. The open green circles denote CO measured by the intermittent bolus technique.

46
47
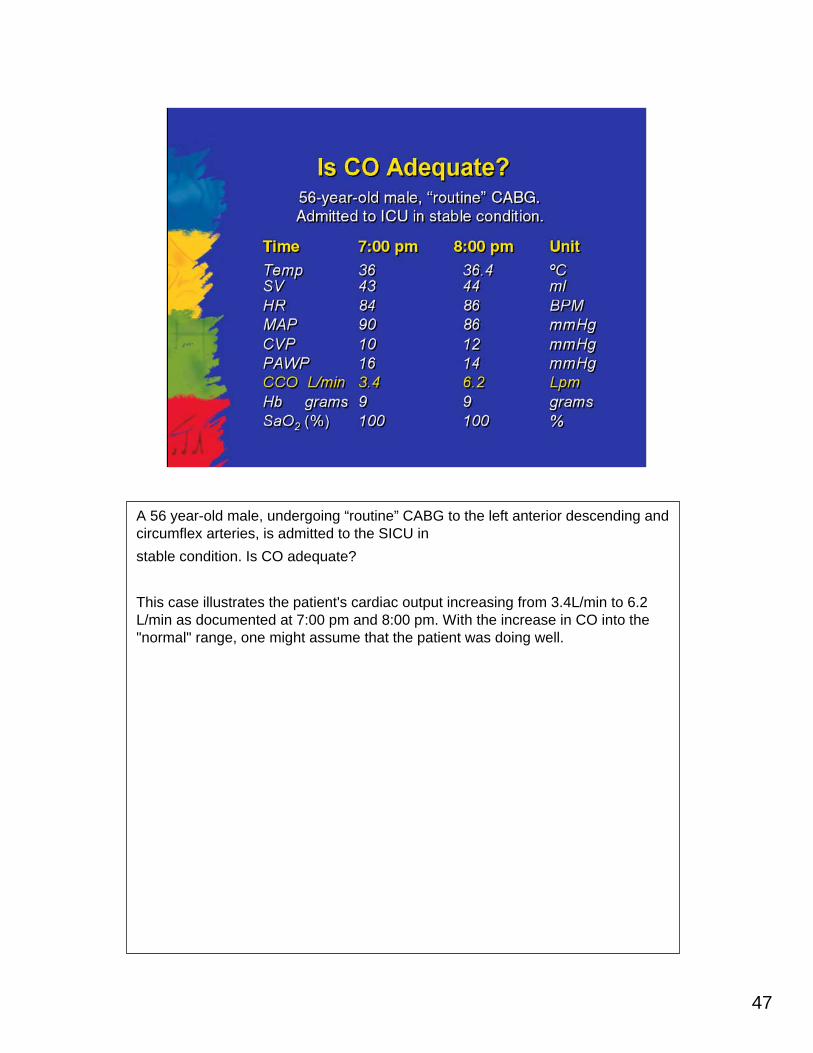
A 56 year-old male, undergoing “routine” CABG to the left anterior descending and circumflex arteries, is admitted to the SICU in stable condition. Is CO adequate?
This case illustrates the patient's cardiac output increasing from 3.4L/min to 6.2 L/min as documented at 7:00 pm and 8:00 pm. With the increase in CO into the "normal" range, one might assume that the patient was doing well.
48
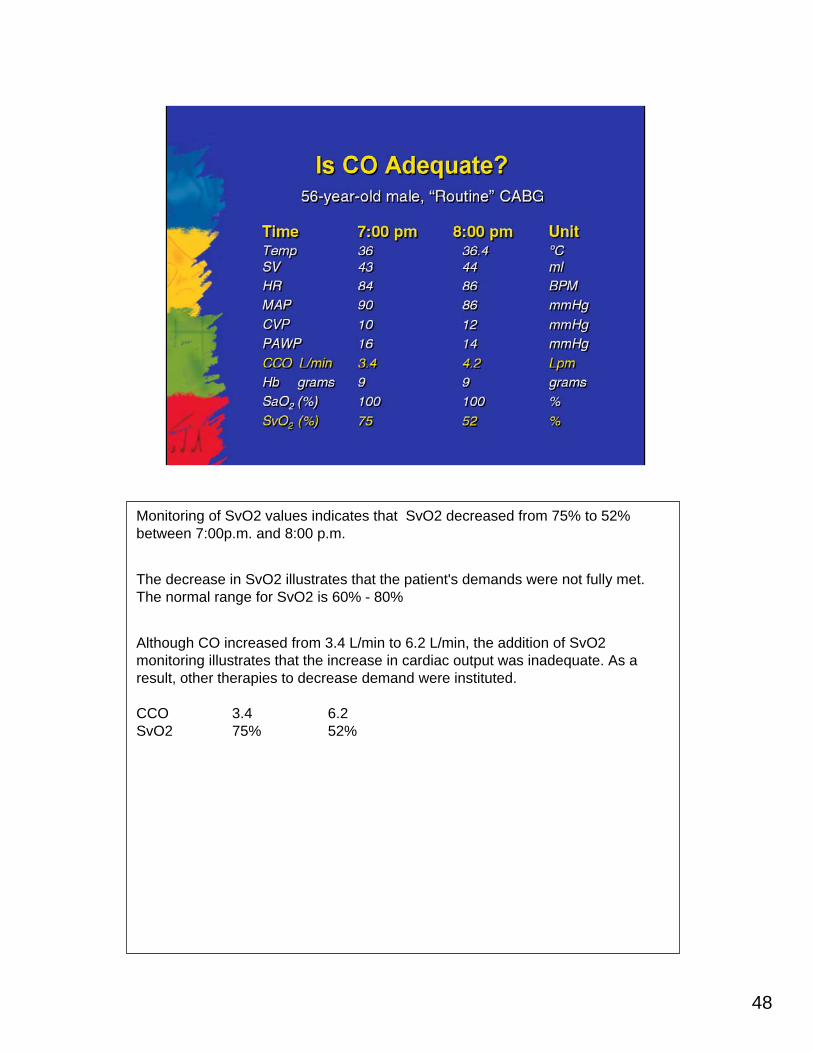
Monitoring of SvO2 values indicates that SvO2 decreased from 75% to 52% between 7:00p.m. and 8:00 p.m.
The decrease in SvO2 illustrates that the patient's demands were not fully met. The normal range for SvO2 is 60% - 80%
Although CO increased from 3.4 L/min to 6.2 L/min, the addition of SvO2 monitoring illustrates that the increase in cardiac output was inadequate. As a result, other therapies to decrease demand were instituted.
CCO 3.4 6.2SvO2 75% 52%
49
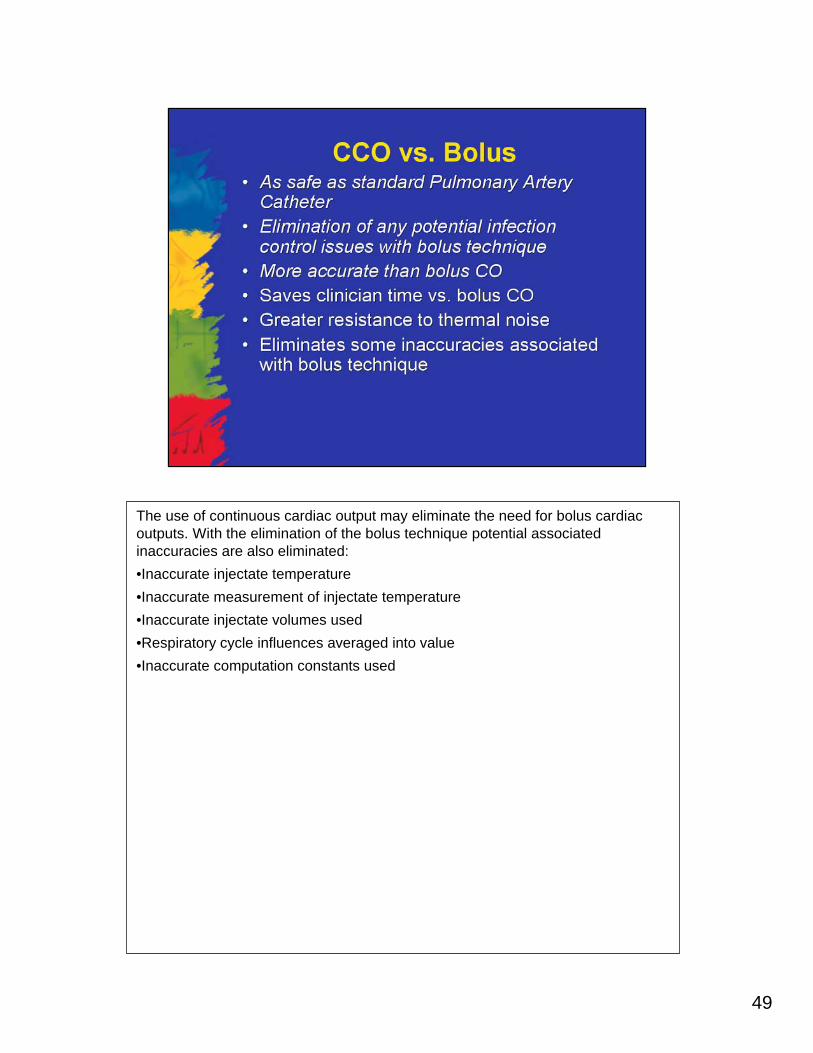
The use of continuous cardiac output may eliminate the need for bolus cardiac outputs. With the elimination of the bolus technique potential associated inaccuracies are also eliminated:•Inaccurate injectate temperature•Inaccurate measurement of injectate temperature•Inaccurate injectate volumes used•Respiratory cycle influences averaged into value•Inaccurate computation constants used
50
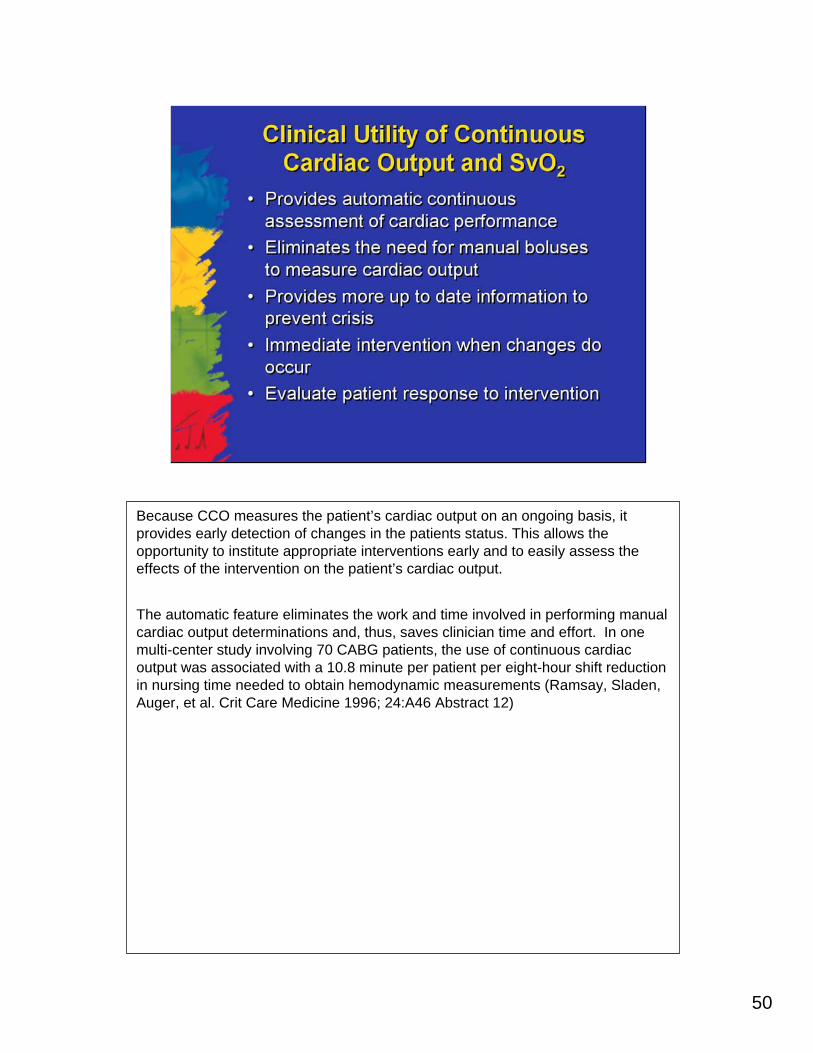
Because CCO measures the patient’s cardiac output on an ongoing basis, it provides early detection of changes in the patients status. This allows the opportunity to institute appropriate interventions early and to easily assess the effects of the intervention on the patient’s cardiac output.
The automatic feature eliminates the work and time involved in performing manual cardiac output determinations and, thus, saves clinician time and effort. In one multi-center study involving 70 CABG patients, the use of continuous cardiac output was associated with a 10.8 minute per patient per eight-hour shift reduction in nursing time needed to obtain hemodynamic measurements (Ramsay, Sladen, Auger, et al. Crit Care Medicine 1996; 24:A46 Abstract 12)
51
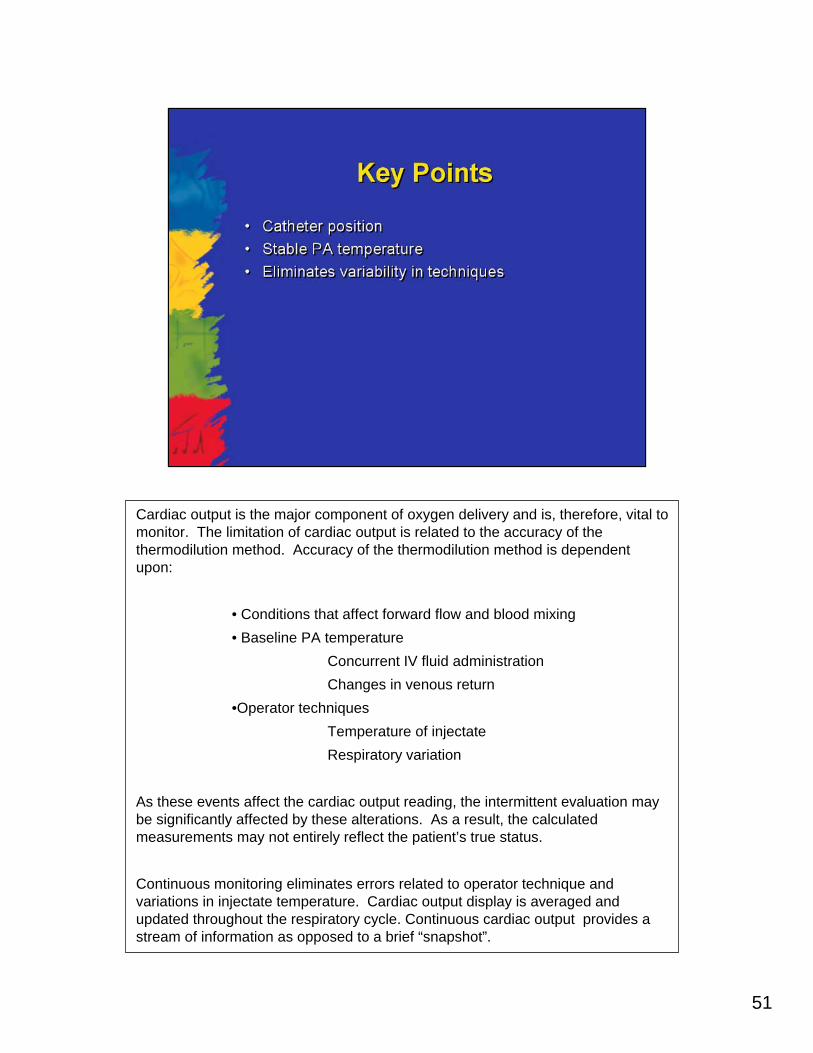
Cardiac output is the major component of oxygen delivery and is, therefore, vital to monitor. The limitation of cardiac output is related to the accuracy of the thermodilution method. Accuracy of the thermodilution method is dependent upon:
• Conditions that affect forward flow and blood mixing• Baseline PA temperature
Concurrent IV fluid administrationChanges in venous return
•Operator techniquesTemperature of injectateRespiratory variation
As these events affect the cardiac output reading, the intermittent evaluation may be significantly affected by these alterations. As a result, the calculated measurements may not entirely reflect the patient’s true status.
Continuous monitoring eliminates errors related to operator technique and variations in injectate temperature. Cardiac output display is averaged and updated throughout the respiratory cycle. Continuous cardiac output provides a stream of information as opposed to a brief “snapshot”.

52

53

54

55

56

57

58

59

60

61
62
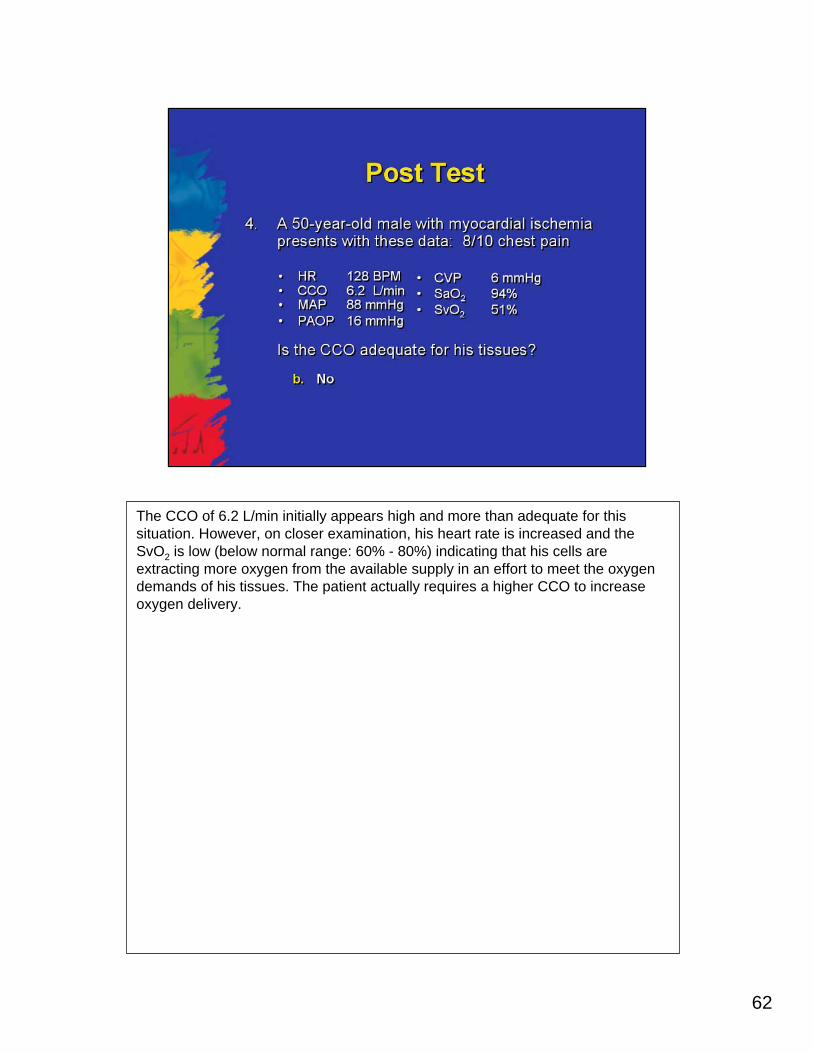
The CCO of 6.2 L/min initially appears high and more than adequate for this situation. However, on closer examination, his heart rate is increased and the SvO2 is low (below normal range: 60% - 80%) indicating that his cells are extracting more oxygen from the available supply in an effort to meet the oxygen demands of his tissues. The patient actually requires a higher CCO to increase oxygen delivery.

63
After receiving the morphine and nitroglycerin, the patient’s stress level is lower as indicated by the slowing of his heart rate. The SvO2 has increased, indicating that oxygen extraction has decreased.
64
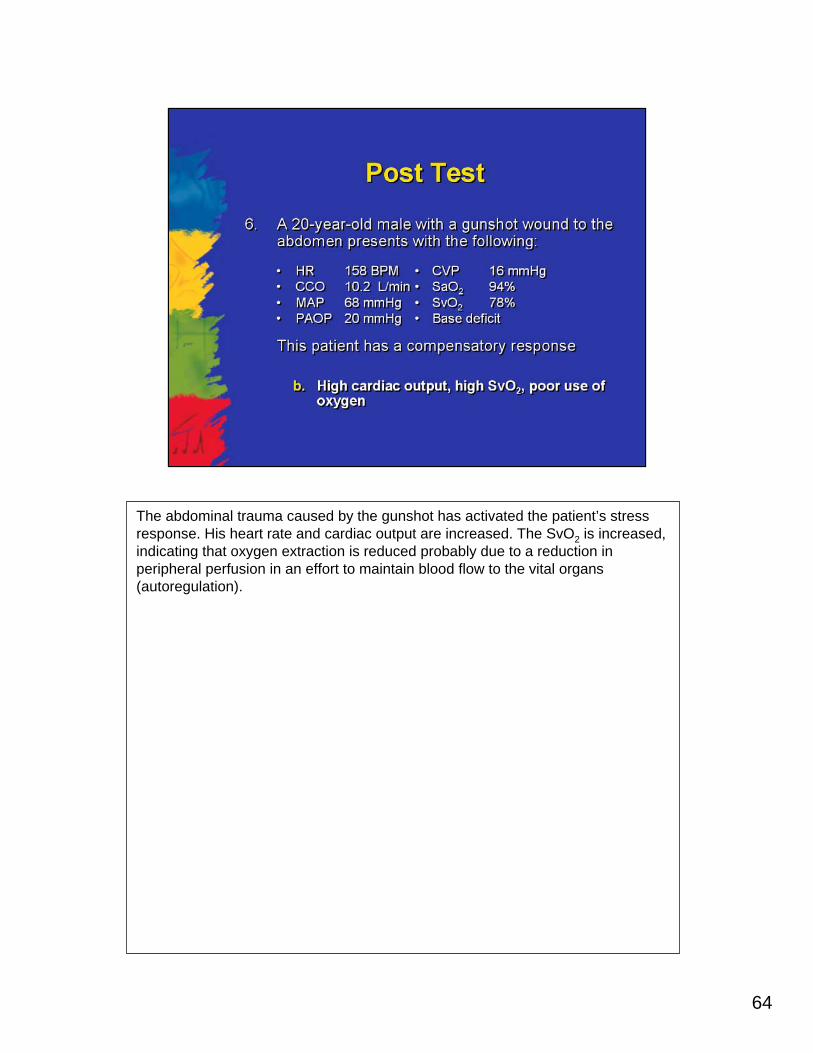
The abdominal trauma caused by the gunshot has activated the patient’s stress response. His heart rate and cardiac output are increased. The SvO2 is increased, indicating that oxygen extraction is reduced probably due to a reduction in peripheral perfusion in an effort to maintain blood flow to the vital organs (autoregulation).

65

66

67

68