ceilingsee: device-free occupancy inference through lighting infrastructure based · pdf...
TRANSCRIPT

CeilingSee: Device-Free Occupancy Inferencethrough Lighting Infrastructure Based LED Sensing
Yanbing Yang1 Jie Hao2 Jun Luo1 Sinno Jialin Pan1School of Computer Science and Engineering, Nanyang Technological University, Singapore1
College of Computer Science and Technology, Nanjing University of Aeronautics and Astronautics, China2
Email: yyang017,junluo,[email protected] [email protected]
Abstract—As a key component of building management andsecurity, occupancy inference through smart sensing has attracteda lot of research attentions for nearly two decades. Nevertheless,existing solutions mostly rely on either pre-deployed infrastruc-tures or user device participation, thus hampering their wideadoption. This paper presents CeilingSee, a dedicated occupancyinference system free of heavy infrastructure deployments anduser involvements. Building upon existing LED lighting systems,CeilingSee converts part of the ceiling-mounted LED luminairesto act as sensors, sensing the variances in diffuse reflectioncaused by occupants. In realizing CeilingSee, we first re-designthe LED driver to leverage LED’s photoelectric effect so as totransform a light emitter to a light sensor. In order to produceaccurate occupancy inference, we then engineer efficient learningalgorithms to fuse sensing information gathered by multiple LEDluminaires. We build a testbed covering a 30m2 office area;extensive experiments show that CeilingSee is able to achievevery high accuracy in occupancy inference.
I. INTRODUCTION
The awareness of (indoor) occupancy is crucial to manyaspects of smart building management; these include, amongothers, controlling the HVAC (Heating, Ventilation, and AirConditioning) and lighting systems for the sake of energyconservation, choosing the right information service based oncongestion level, as well as safely evacuating people underlife-threatening circumstances. In the past two decades, varioussmart sensing technologies have been dedicated1 to inferoccupancy for indoor facilities, and most of them requiredeploying certain sensing infrastructure with mainly threetypical sensors: passive infra-red (PIR) [5], [6], [7], [8],acoustic/ultrasonic [9], [10], [11], and camera [12], [13], [14],[8]. Other solutions attempt to infer occupancy indirectly bymonitoring the usage of existing services (e.g., Wi-Fi [15]and power grid [16]). Whereas the former method requiresinstallations of extra infrastructure and hence incurs both highcost for building management and potential infringement ofuser privacy, the latter approach can hardly be accurate: whatif some occupants simply do not use any services?
Our key observation is that, in any human occupied indoorspaces, lighting is a necessity while the resulting diffusereflection can be “perturbed” by the presence of occupants. Atthe meantime, Visible Light Sensing (VLS), as a variance of
1Though occupancy information can be derived from an indoor localizationsystem (e.g., [1], [2], [3], [4]), few practical indoor localization systems havebeen widely adopted so far. Moreover, relying on user location tracking to“count” occupancy is highly inefficient and may infringe privacy.
(a) Sensing coverage of LED array. (b) Occupant under the coverage.
0 5 10 150.78
0.8
0.82
0.84
0.86
Time(s)
LED
Rea
ding
(V)
(c) Variances in LED readings due to absence/presence of occupant.
Fig. 1. Inferring occupancy by LED sensing.
heavily studied Visible Light Communication (VLC) [18], [19],[20], [21], has started to show its potential in many sensing-intensive applications [2], [22]. Therefore, a natural questionis: can we apply VLS to build an occupancy inference systemthat is free of reliance on both heavy infrastructures and userinvolvements? In this paper, we intend to provide readers witha positive answer through our CeilingSee system.
The first idea of CeilingSee is very intuitive: from the ceilingpoint of view, the diffuse reflection (consisting of mainlyreflections from the floor and various fixed furnitures on thefloor) is bounded to be affected by the presence of occupants.Therefore, sensing such perturbations could allow us to inferoccupancy. While simply installing an array of light sensors onthe ceiling could be a solution, it would introduce yet anotherinfrastructure. Fortunately, the increasing popularity of LEDlighting systems and the readily verifiable photoelectric effectof LED [23], [19] have motivated our novel idea: re-designingthe driver of a Commercial Off-The-Shelf (COTS) LED couldenable it to serve as both a light emitter and a light sensor.Consequently, CeilingSee simply leverages the existing LEDlighting systems and borrows a fraction of LED chips to sensethe variance in diffuse reflection. We illustrate these ideas inFig. 1; it clearly demonstrates the potential and effectivenessof VLS-based occupancy inference.
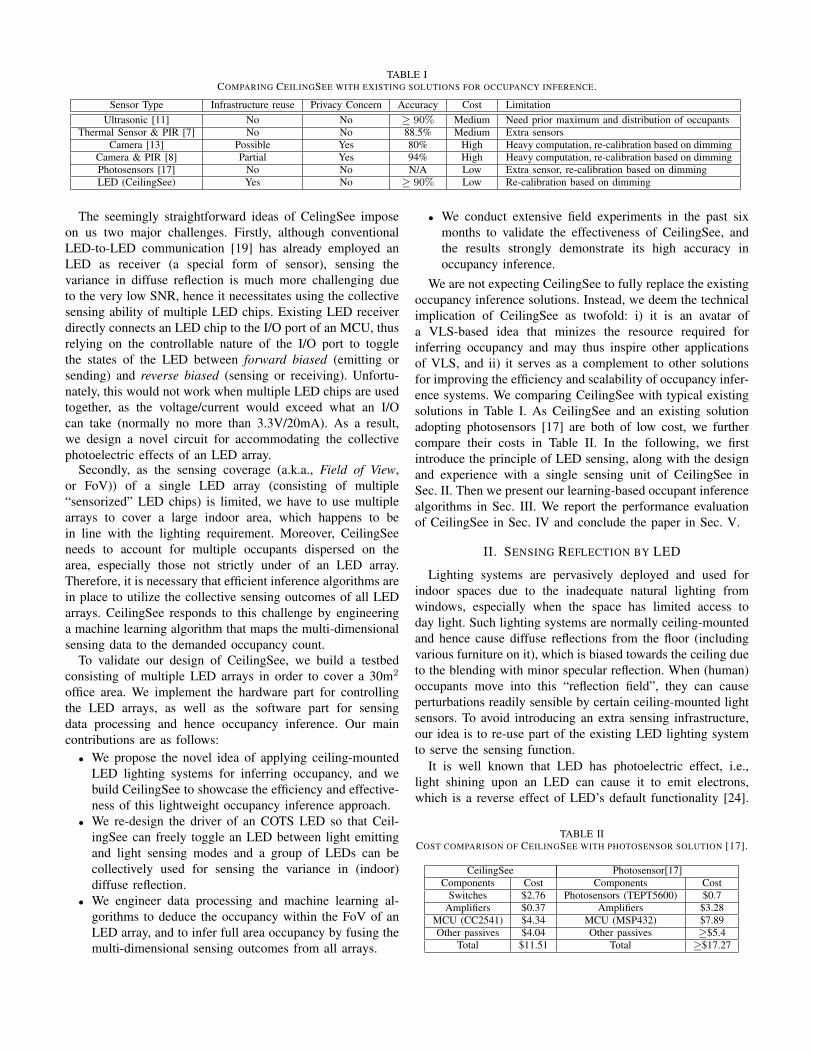
TABLE ICOMPARING CEILINGSEE WITH EXISTING SOLUTIONS FOR OCCUPANCY INFERENCE.
Sensor Type Infrastructure reuse Privacy Concern Accuracy Cost LimitationUltrasonic [11] No No ≥ 90% Medium Need prior maximum and distribution of occupants
Thermal Sensor & PIR [7] No No 88.5% Medium Extra sensorsCamera [13] Possible Yes 80% High Heavy computation, re-calibration based on dimming
Camera & PIR [8] Partial Yes 94% High Heavy computation, re-calibration based on dimmingPhotosensors [17] No No N/A Low Extra sensor, re-calibration based on dimmingLED (CeilingSee) Yes No ≥ 90% Low Re-calibration based on dimming
The seemingly straightforward ideas of CelingSee imposeon us two major challenges. Firstly, although conventionalLED-to-LED communication [19] has already employed anLED as receiver (a special form of sensor), sensing thevariance in diffuse reflection is much more challenging dueto the very low SNR, hence it necessitates using the collectivesensing ability of multiple LED chips. Existing LED receiverdirectly connects an LED chip to the I/O port of an MCU, thusrelying on the controllable nature of the I/O port to togglethe states of the LED between forward biased (emitting orsending) and reverse biased (sensing or receiving). Unfortu-nately, this would not work when multiple LED chips are usedtogether, as the voltage/current would exceed what an I/Ocan take (normally no more than 3.3V/20mA). As a result,we design a novel circuit for accommodating the collectivephotoelectric effects of an LED array.
Secondly, as the sensing coverage (a.k.a., Field of View,or FoV)) of a single LED array (consisting of multiple“sensorized” LED chips) is limited, we have to use multiplearrays to cover a large indoor area, which happens to bein line with the lighting requirement. Moreover, CeilingSeeneeds to account for multiple occupants dispersed on thearea, especially those not strictly under of an LED array.Therefore, it is necessary that efficient inference algorithms arein place to utilize the collective sensing outcomes of all LEDarrays. CeilingSee responds to this challenge by engineeringa machine learning algorithm that maps the multi-dimensionalsensing data to the demanded occupancy count.
To validate our design of CeilingSee, we build a testbedconsisting of multiple LED arrays in order to cover a 30m2
office area. We implement the hardware part for controllingthe LED arrays, as well as the software part for sensingdata processing and hence occupancy inference. Our maincontributions are as follows:• We propose the novel idea of applying ceiling-mounted
LED lighting systems for inferring occupancy, and webuild CeilingSee to showcase the efficiency and effective-ness of this lightweight occupancy inference approach.
• We re-design the driver of an COTS LED so that Ceil-ingSee can freely toggle an LED between light emittingand light sensing modes and a group of LEDs can becollectively used for sensing the variance in (indoor)diffuse reflection.
• We engineer data processing and machine learning al-gorithms to deduce the occupancy within the FoV of anLED array, and to infer full area occupancy by fusing themulti-dimensional sensing outcomes from all arrays.
• We conduct extensive field experiments in the past sixmonths to validate the effectiveness of CeilingSee, andthe results strongly demonstrate its high accuracy inoccupancy inference.
We are not expecting CeilingSee to fully replace the existingoccupancy inference solutions. Instead, we deem the technicalimplication of CeilingSee as twofold: i) it is an avatar ofa VLS-based idea that minizes the resource required forinferring occupancy and may thus inspire other applicationsof VLS, and ii) it serves as a complement to other solutionsfor improving the efficiency and scalability of occupancy infer-ence systems. We comparing CeilingSee with typical existingsolutions in Table I. As CeilingSee and an existing solutionadopting photosensors [17] are both of low cost, we furthercompare their costs in Table II. In the following, we firstintroduce the principle of LED sensing, along with the designand experience with a single sensing unit of CeilingSee inSec. II. Then we present our learning-based occupant inferencealgorithms in Sec. III. We report the performance evaluationof CeilingSee in Sec. IV and conclude the paper in Sec. V.
II. SENSING REFLECTION BY LED
Lighting systems are pervasively deployed and used forindoor spaces due to the inadequate natural lighting fromwindows, especially when the space has limited access today light. Such lighting systems are normally ceiling-mountedand hence cause diffuse reflections from the floor (includingvarious furniture on it), which is biased towards the ceiling dueto the blending with minor specular reflection. When (human)occupants move into this “reflection field”, they can causeperturbations readily sensible by certain ceiling-mounted lightsensors. To avoid introducing an extra sensing infrastructure,our idea is to re-use part of the existing LED lighting systemto serve the sensing function.
It is well known that LED has photoelectric effect, i.e.,light shining upon an LED can cause it to emit electrons,which is a reverse effect of LED’s default functionality [24].
TABLE IICOST COMPARISON OF CEILINGSEE WITH PHOTOSENSOR SOLUTION [17].
CeilingSee Photosensor[17]Components Cost Components Cost
Switches $2.76 Photosensors (TEPT5600) $0.7Amplifiers $0.37 Amplifiers $3.28
MCU (CC2541) $4.34 MCU (MSP432) $7.89Other passives $4.04 Other passives ≥$5.4
Total $11.51 Total ≥$17.27

(a) (b) (c)
Fig. 2. Conventional bidirectional interface between LED and MCU. (a)Normal I/O configuration for light emitting. (b) Reverse bias for light sensing.(c) I/O as input for reading sensed signal.
This effect has motivated a few proposals to use an LED notonly as a sender but also as a receiver in VLC [23], [19].However, converting an LED receiver to an LED sensor isalmost impossible as the light signal sent by an LED has amuch higher Signal-to-Noise-Ratio (SNR) than the variancein reflection. Moreover, as we only “borrow” part of the LEDlighting system for the sensing purpose, we want to togglethe LEDs between light emitting and light sensing modeswhen either is in need. Therefore, we present the details ofCeilingSee’s hardware implementation in this section, aimingto address the aforementioned issues.
A. From LED Receiving to LED Sensing
We briefly describe the conventional design of an LEDreceiver, and then we explain why and how the design of LEDsensing for CeilingSee should be different.
1) Bidirectional Setting of LED Receiver: In a conventionaldesign for light receiving in the LED-LED communication, abidirectional interface to an LED is created by connecting theLED directly between the two I/O pins of a micro-controller(MCU) [23], as shown in Fig. 2. Fig. 2(a) shows that the LEDemits lighting when its anode and cathode are connected toVCC and GND, respectively, via a simple I/O configuration.Reverting the I/O configuration sets the LED in reverse biasmode as in Fig. 2(b); it charges the inner stray capacitanceof the LED and prepares the LED for light sensing. Fig. 2(c)further illustrates the actual measurement phase: MCU readsthe voltage changes on LED’s cathode and times how longit takes for the photocurrent to discharge the capacitanceto the I/O pin’s digital input threshold, as the dischargingtime is inversely proportional to the amount of incident light.The simplicity of this LED receiving circuit stems from thematching voltages between an MCU and an LED, which doesnot work if one wishes to drive more LEDs with one MCU.
2) Collective Sensing with Multiple LEDs: Compared withthe LED-LED communication, the signal for our reflectionsensing scenario is much weaker.2 As a result, if we used thesame circuit as described in Section II-A1, we would eitherfail to sense the signal due to the too weak photocurrent orexperience a huge sensing delay thanks to the long dischargingtime. Whereas using multiple LEDs to collectively sense the
2The signal could also be weaker in LED-LED communication if the trans-mission distance goes beyond the centimeter testing scenarios in [23], [19].As a practical sensing system, CeilingSee has to work under a “transmissiondistance” (that from floor to ceiling) of several meters.
(a)
(b) (c) (d)
(e)
Fig. 3. Architecture of the LED array driver. (a) Circuit schematic. (b)The equivalent circuit during light emitting. (c) The equivalent circuit fordischarging. (d) The equivalent circuit during light sensing. (d) Duty-cycledcontrol signal sequence for toggling between lighting and sensing.
weak signal appears to be a straightforward solution, the muchhigher voltage level caused by aggregating multiple LEDsrenders the existing I/O-based circuit design invalid. Also,reverse biasing an array of LED is almost impossible for anormal MCU with limited absolute maximum voltage.3
Therefore, our intention is to use an LED array as one lightsensing unit without the need for reverse biasing it. Accordingto the LED’s equivalent circuit model [23], an LED can bedeemed as a current source with a shunt capacitor, while thecurrent source is driven by incident light to generate tinyphotocurrent. Whereas the current produced by one LED istoo weak to be measurable (even through an amplifier), theaggregated current of the LED array (with a sufficient amountof LEDs) would suffice for the sensing purpose.
Based on the aforementioned ideas, we re-design the driverof COTS LED luminaires to control the LED state toggling, sothat CeilingSee can duty-cycle part of the luminaire betweenlight emitting (for normal lighting) and light sensing (foroccupancy inference). Fig. 3 shows the architecture of thisdriver circuit and also its functionalities under different modes.The five switches in Fig. 3(a) are key components for thedriver. The LED array emits light (lighting phase) if both S1and S2 are ON and other switches are OFF, as shown by
3Though this could be made possible by using special high-power compo-nents, e.g. high reverse voltage MOSFET, the high cost would compromiseour purpose of building a lightweight occupancy inference system.
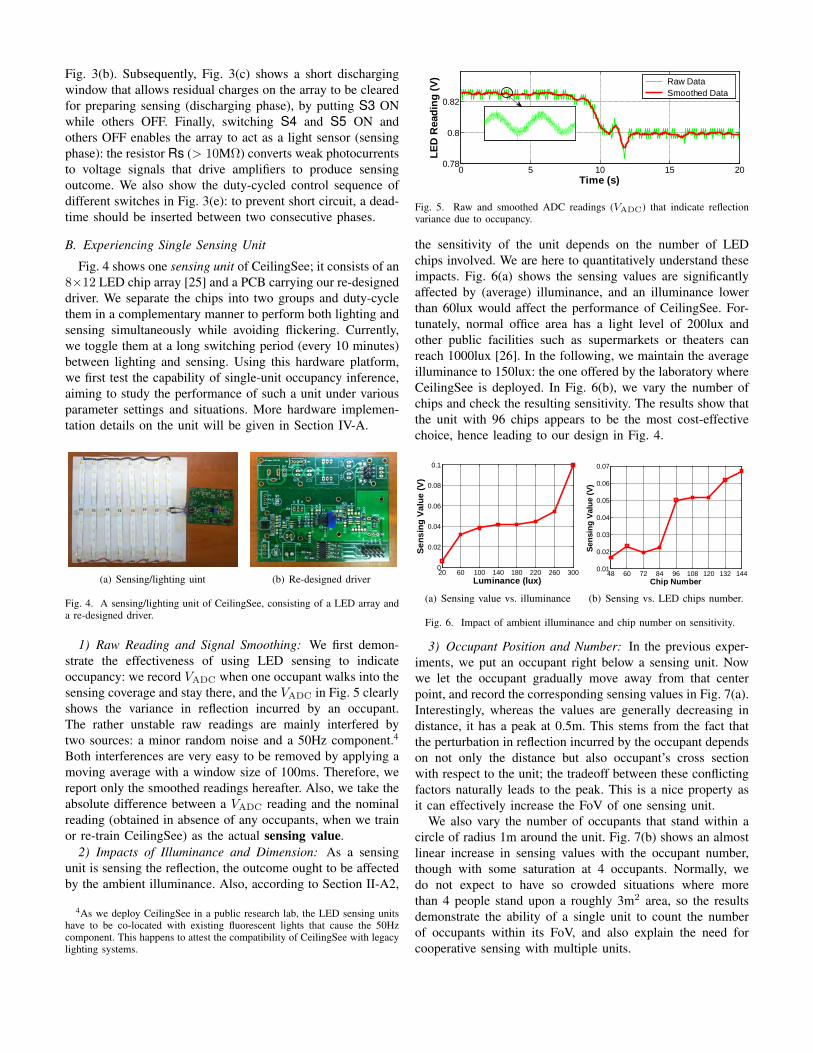
Fig. 3(b). Subsequently, Fig. 3(c) shows a short dischargingwindow that allows residual charges on the array to be clearedfor preparing sensing (discharging phase), by putting S3 ONwhile others OFF. Finally, switching S4 and S5 ON andothers OFF enables the array to act as a light sensor (sensingphase): the resistor Rs (> 10MΩ) converts weak photocurrentsto voltage signals that drive amplifiers to produce sensingoutcome. We also show the duty-cycled control sequence ofdifferent switches in Fig. 3(e): to prevent short circuit, a dead-time should be inserted between two consecutive phases.
B. Experiencing Single Sensing Unit
Fig. 4 shows one sensing unit of CeilingSee; it consists of an8×12 LED chip array [25] and a PCB carrying our re-designeddriver. We separate the chips into two groups and duty-cyclethem in a complementary manner to perform both lighting andsensing simultaneously while avoiding flickering. Currently,we toggle them at a long switching period (every 10 minutes)between lighting and sensing. Using this hardware platform,we first test the capability of single-unit occupancy inference,aiming to study the performance of such a unit under variousparameter settings and situations. More hardware implemen-tation details on the unit will be given in Section IV-A.
(a) Sensing/lighting uint (b) Re-designed driver
Fig. 4. A sensing/lighting unit of CeilingSee, consisting of a LED array anda re-designed driver.
1) Raw Reading and Signal Smoothing: We first demon-strate the effectiveness of using LED sensing to indicateoccupancy: we record VADC when one occupant walks into thesensing coverage and stay there, and the VADC in Fig. 5 clearlyshows the variance in reflection incurred by an occupant.The rather unstable raw readings are mainly interfered bytwo sources: a minor random noise and a 50Hz component.4
Both interferences are very easy to be removed by applying amoving average with a window size of 100ms. Therefore, wereport only the smoothed readings hereafter. Also, we take theabsolute difference between a VADC reading and the nominalreading (obtained in absence of any occupants, when we trainor re-train CeilingSee) as the actual sensing value.
2) Impacts of Illuminance and Dimension: As a sensingunit is sensing the reflection, the outcome ought to be affectedby the ambient illuminance. Also, according to Section II-A2,
4As we deploy CeilingSee in a public research lab, the LED sensing unitshave to be co-located with existing fluorescent lights that cause the 50Hzcomponent. This happens to attest the compatibility of CeilingSee with legacylighting systems.
0 5 10 15 200.78
0.8
0.82
Time (s)
LED
Rea
ding
(V)
Raw Data Smoothed Data
Fig. 5. Raw and smoothed ADC readings (VADC) that indicate reflectionvariance due to occupancy.
the sensitivity of the unit depends on the number of LEDchips involved. We are here to quantitatively understand theseimpacts. Fig. 6(a) shows the sensing values are significantlyaffected by (average) illuminance, and an illuminance lowerthan 60lux would affect the performance of CeilingSee. For-tunately, normal office area has a light level of 200lux andother public facilities such as supermarkets or theaters canreach 1000lux [26]. In the following, we maintain the averageilluminance to 150lux: the one offered by the laboratory whereCeilingSee is deployed. In Fig. 6(b), we vary the number ofchips and check the resulting sensitivity. The results show thatthe unit with 96 chips appears to be the most cost-effectivechoice, hence leading to our design in Fig. 4.
20 60 100 140 180 220 260 3000
0.02
0.04
0.06
0.08
0.1
Luminance (lux)
Sens
ing
Valu
e (V
)
(a) Sensing value vs. illuminance
48 60 72 84 96 108 120 132 1440.01
0.02
0.03
0.04
0.05
0.06
0.07
Chip NumberSe
nsin
g Va
lue
(V)
(b) Sensing vs. LED chips number.
Fig. 6. Impact of ambient illuminance and chip number on sensitivity.
3) Occupant Position and Number: In the previous exper-iments, we put an occupant right below a sensing unit. Nowwe let the occupant gradually move away from that centerpoint, and record the corresponding sensing values in Fig. 7(a).Interestingly, whereas the values are generally decreasing indistance, it has a peak at 0.5m. This stems from the fact thatthe perturbation in reflection incurred by the occupant dependson not only the distance but also occupant’s cross sectionwith respect to the unit; the tradeoff between these conflictingfactors naturally leads to the peak. This is a nice property asit can effectively increase the FoV of one sensing unit.
We also vary the number of occupants that stand within acircle of radius 1m around the unit. Fig. 7(b) shows an almostlinear increase in sensing values with the occupant number,though with some saturation at 4 occupants. Normally, wedo not expect to have so crowded situations where morethan 4 people stand upon a roughly 3m2 area, so the resultsdemonstrate the ability of a single unit to count the numberof occupants within its FoV, and also explain the need forcooperative sensing with multiple units.

0 1 2 3 40
0.01
0.02
0.03
0.04
0.05
Distance (m)
Sens
ing
Valu
e (V
)
(a) Sensing values vs. distance
1 2 3 40
0.05
0.1
0.15
Occupant Count
Sens
ing
Valu
e (V
)
(b) Sensing values vs. occupancy
Fig. 7. Changes in sensing value caused by the occupant position and number.
4) Postures and Gestures of an Occupant: An occupantmay have different postures and we consider three typicalones: standing, seating, and squatting (rare). We study theimpact of these postures on the sensing values when theoccupant is at various distances from a sensing unit. Fig. 8(a)shows that, though squatting does lead to rather low sensingvalues, standing and sitting cause very close sensing values.This is explained by the fact that the sensing value incurred bythe occupant depends on occupant’s cross section. So certainoccupants may “hide” from CeilingSee by squatting, but thisis such a rare posture indoors that it would not cause muchtrouble to the overall inference performance. An occupant mayalso change gestures without leaving the monitored area, andsuch interference should not be responded by CeilingSee. InFig. 8(b), we show that CeilingSee is virtually insensitive togesture changes (e.g., waving arms) of an occupant, implyingthat the occupancy inference function is robust against suchan interference. Due to page limit, we omit the demonstrationson robustness against the color and height of an occupant, aswell as ambient light variance.
0 1 2 3 40
0.01
0.02
0.03
0.04
0.05
Distance (m)
Sens
ing
Valu
e (V
)
squattingseatingstanding
(a) Effect of occupants’ postures
0 1 2 3 40
0.01
0.02
0.03
0.04
0.05
Distance (m)
Sens
ing
Valu
e (V
)
Arms upArms down
(b) Effect of occupants’ gesture
Fig. 8. Changes in sensing value caused by different postures and gestures.
III. OCCUPANCY INFERENCE
As illustrated in Fig. 9, the LED sensing readings are firstsmoothed and sampled to obtain vectors of sensing values(termed snapshots hereafter) as described in Section II-B. Thesnapshots are either directly taken or further differentiated toextract temporal features, and these inputs are fed to a fine-tuned regression module trained for occupancy inference.
A. Spatial Distribution of Sensing Values
When multiple occupants exist in an area monitored byCeilingSee, each sensing unit will produce a sensing value
Sensing Unit
Sensing Unit
Signal Processing
Feature Extraction
Spatial-Temporal Correlated Regression
Occupancy
MCU
Driver
LED Array
Fig. 9. System architecture. CeilingSee gathers data from all sensing units,pre-processes them to remove noise, and then passes them to the regressionmodule for inferring occupancy.
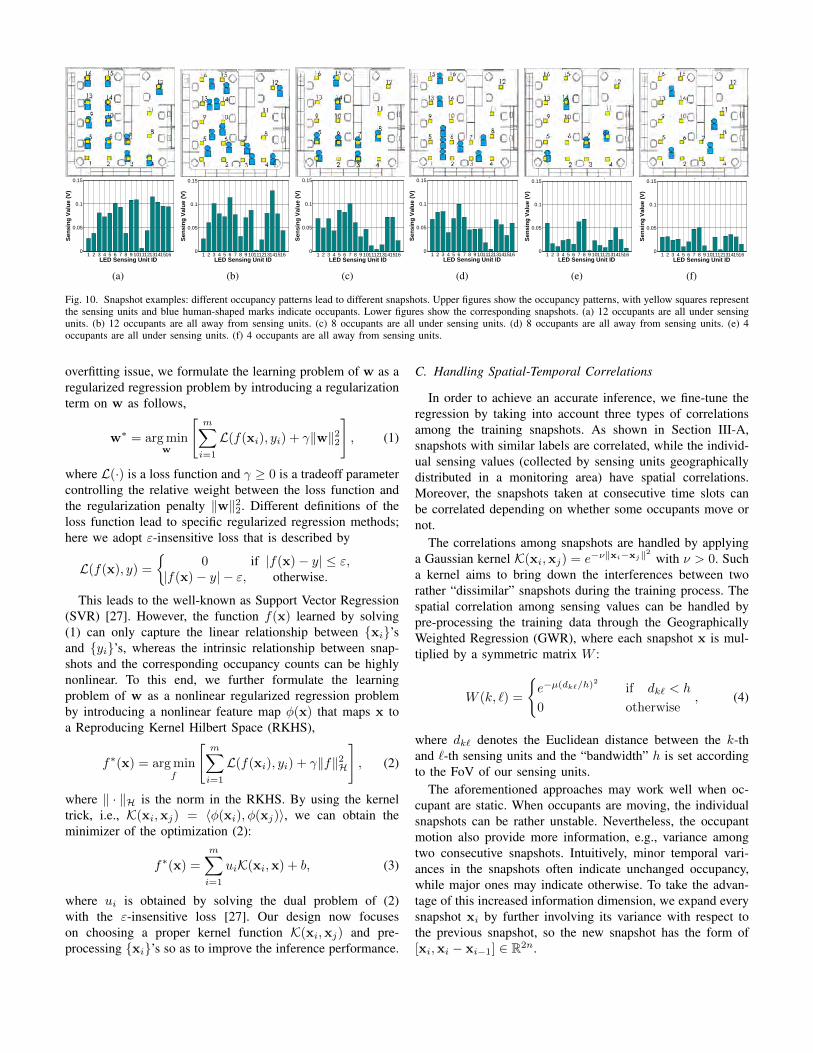
depending on the spatial distribution of the occupants aroundit (as studied in Section II-B). We denote the sensing valueof a unit by x`(t), where ` is the index of the unit and tis the time instant when the value is sampled. Combiningall the values produced by the whole system, we end upwith a time-varying vector x(t) = [x1(t), x2(t), · · · , xn(t)],where n is the number of sensing units. As we always samplex(t) in a discrete manner, we actually use xi to denote asnapshot at the i-th time slot, and the spatial distributionof the individual components of a xi is correlated withthat of the occupants during that time slot. We illustrate afew typical snapshots using our deployment in Fig. 11 ofSection IV-A. In Fig. 10, we show 8 snapshots capturedwhen there are 4, 8, 12 occupants and each with two spatialdistribution patterns, namely all standing under the sensingunits and away from them. A direct observation is that, ingeneral, more occupants usually yield higher overall sensingvalues and a higher sensing value indicates more occupantsaround that unit. These observations agree with impact ofdistance/occupant number on sensing value shown in Fig. 7.More detailed inspections show that, with the same numberof occupants at different positions, locating occupants rightbelow the LED sensing units actually leads to lower overallsensing values than moving them away from the units. Thisstems from our finding in Fig. 7(a). Nevertheless, directlyinferring occupancy from individual snapshots through linearregression may yield rather coarse-grained estimations with alow accuracy.
B. Regularized Regression
Given a training set D = xi, yii=1,··· ,m where xi ∈ Rndenotes the input snapshots, yi ∈ R is the corresponding label(i.e. the occupant count), and m is the cardinality of (sensory)data-label pairs, we need to find a function f(x) : Rn → R inthe form of f(x) = 〈w,x〉+ b to fit the relationship betweenxi’s and yi’s, where w ∈ Rn is the vector of weightparameters and b is a bias factor (they are to be learned fromthe training set), and 〈·, ·〉 is the inner product. To avoid the
1 2 3 4 5 6 7 8 9 101112131415160
0.05
0.1
0.15
LED Sensing Unit ID
Sens
ing
Valu
e (V
)
12 Under LED
(a)
1 2 3 4 5 6 7 8 9 101112131415160
0.05
0.1
0.15
LED Sensing Unit ID
Sens
ing
Valu
e (V
)12 Away from LED arrays
(b)
1 2 3 4 5 6 7 8 9 101112131415160
0.05
0.1
0.15
LED Sensing Unit ID
Sens
ing
Valu
e (V
)
8 under LED arrays
(c)
1 2 3 4 5 6 7 8 9 101112131415160
0.05
0.1
0.15
LED Sensing Unit ID
Sens
ing
Valu
e (V
)
8 away LED arrays
(d)
1 2 3 4 5 6 7 8 9 101112131415160
0.05
0.1
0.15
LED Sensing Unit ID
Sens
ing
Valu
e (V
)
4 under LED arrays
(e)
1 2 3 4 5 6 7 8 9 101112131415160
0.05
0.1
0.15
LED Sensing Unit ID
Sens
ing
Valu
e (V
)
4 away LED arrays
(f)
Fig. 10. Snapshot examples: different occupancy patterns lead to different snapshots. Upper figures show the occupancy patterns, with yellow squares representthe sensing units and blue human-shaped marks indicate occupants. Lower figures show the corresponding snapshots. (a) 12 occupants are all under sensingunits. (b) 12 occupants are all away from sensing units. (c) 8 occupants are all under sensing units. (d) 8 occupants are all away from sensing units. (e) 4occupants are all under sensing units. (f) 4 occupants are all away from sensing units.
overfitting issue, we formulate the learning problem of w as aregularized regression problem by introducing a regularizationterm on w as follows,
w∗ = arg minw
[m∑i=1
L(f(xi), yi) + γ‖w‖22
], (1)
where L(·) is a loss function and γ ≥ 0 is a tradeoff parametercontrolling the relative weight between the loss function andthe regularization penalty ‖w‖22. Different definitions of theloss function lead to specific regularized regression methods;here we adopt ε-insensitive loss that is described by
L(f(x), y) =
0 if |f(x)− y| ≤ ε,
|f(x)− y| − ε, otherwise.
This leads to the well-known as Support Vector Regression(SVR) [27]. However, the function f(x) learned by solving(1) can only capture the linear relationship between xi’sand yi’s, whereas the intrinsic relationship between snap-shots and the corresponding occupancy counts can be highlynonlinear. To this end, we further formulate the learningproblem of w as a nonlinear regularized regression problemby introducing a nonlinear feature map φ(x) that maps x toa Reproducing Kernel Hilbert Space (RKHS),
f∗(x) = arg minf
[m∑i=1
L(f(xi), yi) + γ‖f‖2H
], (2)
where ‖ · ‖H is the norm in the RKHS. By using the kerneltrick, i.e., K(xi,xj) = 〈φ(xi), φ(xj)〉, we can obtain theminimizer of the optimization (2):
f∗(x) =
m∑i=1
uiK(xi,x) + b, (3)
where ui is obtained by solving the dual problem of (2)with the ε-insensitive loss [27]. Our design now focuseson choosing a proper kernel function K(xi,xj) and pre-processing xi’s so as to improve the inference performance.
C. Handling Spatial-Temporal Correlations
In order to achieve an accurate inference, we fine-tune theregression by taking into account three types of correlationsamong the training snapshots. As shown in Section III-A,snapshots with similar labels are correlated, while the individ-ual sensing values (collected by sensing units geographicallydistributed in a monitoring area) have spatial correlations.Moreover, the snapshots taken at consecutive time slots canbe correlated depending on whether some occupants move ornot.
The correlations among snapshots are handled by applyinga Gaussian kernel K(xi,xj) = e−ν‖xi−xj‖2 with ν > 0. Sucha kernel aims to bring down the interferences between tworather “dissimilar” snapshots during the training process. Thespatial correlation among sensing values can be handled bypre-processing the training data through the GeographicallyWeighted Regression (GWR), where each snapshot x is mul-tiplied by a symmetric matrix W :
W (k, `) =
e−µ(dk`/h)
2
if dk` < h
0 otherwise, (4)
where dk` denotes the Euclidean distance between the k-thand `-th sensing units and the “bandwidth” h is set accordingto the FoV of our sensing units.
The aforementioned approaches may work well when oc-cupant are static. When occupants are moving, the individualsnapshots can be rather unstable. Nevertheless, the occupantmotion also provide more information, e.g., variance amongtwo consecutive snapshots. Intuitively, minor temporal vari-ances in the snapshots often indicate unchanged occupancy,while major ones may indicate otherwise. To take the advan-tage of this increased information dimension, we expand everysnapshot xi by further involving its variance with respect tothe previous snapshot, so the new snapshot has the form of[xi,xi − xi−1] ∈ R2n.

(a) Testbed in photo
1 3 4
11
12
13 14
16
5 6 78
9 10
2
(b) Sensing units layout
Fig. 11. CeilingSee testbed overview. Sixteen sensing units are deployed onthe ceiling covering a 5m×6m indoor area.
D. Incremental Inference
Due to dynamics of a real-world environment, the learning-based system set up using training data pre-collected offlinemay be out-of-date, and thus perform poorly online. To adaptthe system to environmental dynamics, a few training dataneed to be collected online periodically (normally every week).We also implement an incremental or online algorithm toupdate the trained SVR model whenever a new training sampleis collected in real time [28], which entails a very efficientadaptation to a dynamic environment without the need forretraining from scratch.
IV. SYSTEM EVALUATION
In this section, we evaluate the performance of CeilingSeein terms of inference accuracy, latency and power consumptionthrough extensive field experiments.
A. Experimental Setup
We deploy a CeilingSee testbed in one of our universitylaboratories; it covers an area of 5m×6m. The testbed consistsof 16 LED lighting/sensing units mounted on the ceiling witha height of 2.5m above the floor as shown in Fig. 11(a). Wetry to deploy the units in 1.25m×1.25m grid, but we have toslightly adjust the positions of some units adapting to the officelayout. As briefly presented in Section II-B, each sensing unitincludes a 8×12 LED chips array and a re-designed driver. Weconnect all drivers to a Lenovo ThinkPad laptop computer viaserial port, so the laptop acts as a lightweight server processingthe sensing data to produce occupancy inferences.
The MCU of our driver, CC2541, is a low-cost power-optimized system-on-chip module, running on up to 32MHzand supporting 12-bit analog-to-digital conversions [29]. Mostimportantly, CC2541 is designed for Bluetooth Low Energy(BLE). Therefore, although we currently use serial port toconnect sensor units to the server, we plan to make CeilingSeea full wireless system by using TI’s BLE-STACK [30] toupload sensing data. In our testbed, we run the MCU at 16MHzand let its ADC samples at 500Hz, and the low-pass filterdiscussed in Section II-B1 is performed by the MCU so thatthe snapshots are uploaded to the server only at 10Hz, giventhe low variation rate of the reflection.
This testbed has been running for about 6 months, duringwhich we have kept monitoring the regular occupancy of the
deployment site, and we have also invited groups with up to20 volunteers to perform specific experiments on the system.All the experiments are performed based on two occupancypatterns: i) static pattern where occupants stand or sit atarbitrary locations, and 2) dynamic pattern where all occupantswalk or even run freely in the lab. For each pattern, thenumber of occupants varies from 1 to 20, and we encouragethe occupants to change their postures between standing andsitting, as well as to perform other daily activities during thetests. We gather more than 10,000 snapshots for each pattern;they are all labeled manually.
B. Impact of Sensor Density and Training Intensity
Before evaluating the performance of CeilingSee, we firstlyexperimentally study the two design parameters of CeilingSee,namely how dense the sensing units should be deployed andhow much training is needed. For the first aspect, we select 4(i.e. unit 6, 8, 14 and 12), 8 (i.e. unit 3, 6, 8, 9, 11, 12, 14 and16 ), and 12 (i.e. unit 2, 4, 5, 8, 9, 10, 11, 12, 13, 14, 15 and16) readings out of each snapshot to derive new snapshots,so that we can evaluate the impact of sensor density. For thesecond aspect, we take a substantial fraction of the labeleddata as testing data while using the remaining fraction forthe training purpose. We vary the Test to Total Ratio (TTR)from 90% to 99%, where TTR indicates the fraction of datachosen for testing the regression model. To better understandthe accuracy performance, we introduce a new accuracy metricthat allows for a certain number of miscounts indicated by anon-negative integer τ . In particular, we define accuracy withmiscount tolerance as
(∑ci=1 I|f∗(xi)−yi|≤τ
)/c, where I is
the indicator function and c is the cardinality..Fig. 12 shows the impact of the number of sensing units.
While 8 units appear to already offer very good accuracy forstatic pattern, 12 units perform the best in both cases andthey would be necessary to cope with dynamic situations.
85
90
95
100
4 8 12 16Sensor Number
Acc
urac
y (%
)
StaticData(TTR=0.9) e0 with SN
(a) Static pattern, τ = 0.
60
65
70
75
80
85
90
4 8 12 16Sensor Number
Acc
urac
y (%
)
DynamicData(TTR=0.9) e0 with SN
(b) Dynamic pattern, τ = 0.
99.2
99.4
99.6
99.8
100
4 8 12 16Sensor Number
Acc
urac
y (%
)
StaticData(TTR=0.9) e1 with SN
(c) Static pattern, τ = 1.
85
90
95
100
4 8 12 16Sensor Number
Acc
urac
y (%
)
DynamicData(TTR=0.9) e1 with SN
(d) Dynamic pattern, τ = 1.
Fig. 12. Accuracy vs. varying number of sensing units with τ = 1.

Denser deployments beyond 12 units are clearly not beneficial,because it yields a higher dimension of sensed data andcomplicates the training procedure of the inference model.Fig. 12 further shows the statistics given τ = 1. The relativelylow accuracy for dynamic pattern with τ = 0 is mostly dueto a single miscount, as raising τ to 1 would allow even4 units to almost always achieve an accuracy beyond 90%under both patterns, although the better performance of staticpattern and the superiority of 12 units still remain. We willcontinue observing the performance difference between thesetwo patterns, which shall be further explained in Section IV-D.To get the highest accuracy, we will keep using 12 units forthe remaining experiments.
Fig. 13 evaluates the impact of training intensity by varyingTTR from 90% to 99%. As expected, the higher the TTR(hence less training), the worse the performance (in termsof the mean and variance) is, but the performance degradesin a rather graceful manner. In fact, if one miscount can betolerated, only 2% training data would be needed for staticpattern and 5% for dynamic one. Given our abundant trainingdata, we stick to 90% TTR for the remaining experiments toobtain the best performance.
C. Breakdown of Inference Accuracy
We now study the occupancy inference accuracy with re-spect to varying occupancy counts; the statistics are reportedfor both static and dynamic patterns in Fig. 14. We observe thatthe accuracy based on static pattern is always higher than 97%for all occupancy counts, and tolerating one miscount bringsalmost all of them to 100%. Though the accuracy for dynamicpattern appears to be rather disappointing, the majority of themiscounting cases involve only one miscount, because settingτ = 1 causes drastic improvements to all occupancy counts.
Under static pattern, the inference accuracy is relativelystable with various occupancy counts, while it is generally
60
70
80
90
100
90 91 92 93 94 95 96 97 98 99Test to Total Ratio (%)
Acc
urac
y (%
)
StaticData e0 with TTR change
(a) Static pattern, τ = 0.
30
40
50
60
70
80
90
90 91 92 93 94 95 96 97 98 99Test to Total Ratio (%)
Acc
urac
y (%
)
DynamicData e0 with TTR change
(b) Dynamic pattern, τ = 0.
92
94
96
98
100
90 91 92 93 94 95 96 97 98 99Test to Total Ratio (%)
Acc
urac
y (%
)
StaticData e1 with TTR change
(c) Static pattern, τ = 1.
50
60
70
80
90
100
90 91 92 93 94 95 96 97 98 99Test to Total Ratio (%)
Acc
urac
y (%
)
DynamicData e1 with TTR change
(d) Dynamic pattern, τ = 1.
Fig. 13. Accuracy with varying TTR given τ = 0 and τ = 1.
1 2 3 4 5 6 7 8 9 101112131415161718192095
96
97
98
99
100
Occupant Count
Acc
urac
y (%
)
(a) Static pattern, τ = 0.
1 2 3 4 5 6 7 8 9 101112131415161718192060
70
80
90
100
Occupant Count
Acc
urac
y (%
)
(b) Dynamic pattern, τ = 0.
1 2 3 4 5 6 7 8 9 101112131415161718192095
96
97
98
99
100
Occupant Count
Acc
urac
y (%
)
(c) Static pattern, τ = 1.
1 2 3 4 5 6 7 8 9 101112131415161718192090
92
94
96
98
100
Occupant Count
Acc
urac
y (%
)
(d) Dynamic pattern, τ = 1.
Fig. 14. Accuracy with varying number of occupants.
degrading as the occupancy count increases for both τ = 0and τ = 1 under dynamic pattern. This can be largelyattributed to the drastic increase in transient states when moreoccupants are constantly moving, as we shall elaborate inSection IV-D. All in all, if we simply allow one miscount, theinference accuracy based on both static and dynamic patterncan be maintained above 90% for all tested occupancy counts.Therefore, CeilingSee achieves a very promising inferenceaccuracy by using only existing lighting infrastructure. Werefrain from comparing CeilingSee with existing proposals atthe system level, because, on one hand, it is unfair as they arebased on very different technologies, and on the other hand,CeilingSee is not meant to replace other systems, but ratheracts as a lightweight complementary solution.
D. Responsiveness and Real Life Scenarios
As CeilingSee may serve as input to indoor energy man-agement systems (e.g., for HVAC), its responsiveness is aconcern and hence entails the need for evaluating how quicklyCeilingSee can respond to changes in occupancy count. Ceil-ingSee’s sensing units configure their sample rates of ADCas 500Hz. A moving average filter in the MCU processes
0 5 10 15 20
0.76
0.78
0.8
0.82
Time (s)
LED
Rea
ding
(V)
Unit 5Unit 9Unit 13Unit 16
(a) Variations in LED readings
0 60 120 180 240 30011121314151617181920
Staircase
Time (s)
Occ
upan
ts
Inferred CountGround Truth
(b) Oscillations under dynamics
Fig. 15. Dynamic response of CeilingSee.

9:00 10:00 11:00 12:00 13:00 14:00 15:00 16:00 17:00 18:00 19:00 20:00 21:00 22:000
5
10
15
Time
Occ
upan
ts
(a) Occupancy count monitored through a day.
9:00 10:00 11:00 12:00 13:00 14:00 15:00 16:00 17:00 18:00 19:00 20:00 21:00 22:000.68
0.73
0.78
0.83
Time
LED
Rea
ding
(V)
Unit 8Unit 10Unit 16
(b) Selected LED readings during the same period.
Fig. 16. A real life monitoring scenario for one day.
the output of ADC and produces snapshots at 10Hz, whichcauses a 100ms delay. The transmissions of snapshots tothe CeilingSee’s server via serial port are done at a baudrate of 115,200, consuming less than 1ms. The server takesless than 1ms on average to figure out the occupancy countsby operating our regression algorithm. Therefore, inferencelatency is about 100ms in total which is mainly consumedby sampling and preliminary data processing on MCU. Wecould further reduce this delay by running the filter with asmaller window size, but it does not appear to be necessary,because the variations in LED readings take a much slowerpace (in seconds), as shown by Fig. 15(a) when an occupantpasses by 4 units and stops at the last. In fact, the current highlevel of responsiveness is one of the main reasons that causemiscounts under dynamic pattern. As shown in Fig. 15(b),the occupancy counts reported by CeilingSee may oscillatebetween two actual count changes if occupants keep moving.This causes miscounts as shown earlier, but it is the price thesystem has to pay for instantaneously detecting count changes.
In order to put the performance of CeilingSee into a prac-tical perspective, we choose to report a whole day monitoringdata (for 18 February, 2016) among several-month operationof the system. In Fig. 16(a), we plot the inferred occupancycount (without ground truth) from 9am to 22pm. The reporteddata exhibit a rather plausible pattern: occupants start to arrivein the early morning, they leave for lunch during the noonbut come back after lunch; more occupants show up in theafternoon, but most of them leave around 6pm, leaving only afew working till late evening. Between two occupancy countchanges, the actual daily activity pattern is a mixture of bothstatic and dynamic patterns: it can be rather stable while mostof the occupants are sitting (presumably working), while itfluctuates from time to time due to the activities such as takinga short break, mingling with other colleagues, and so on.
We also arbitrarily choose three sensing units, unit 8, 10, 16,
to plot their readings in Fig. 16(b). The trends of these readingsare consistent with that of occupancy count. In particular, sen-sor readings vary only slightly when there are less occupants inthe morning, lunch time and off work time, whereas it changesmore actively when there are relatively more occupants inthe afternoon (as the chance of they being moving becomeshigher). If we further look into these readings, for examplethose around 14:00 and 15:00, fluctuations are so intensethat the sampled snapshots can vary rapidly. The resultinglarge variations in snapshots reduce the effectiveness of re-gression and hence the inference accuracy. This explains whyCeilingSee performs less accurately under dynamic patternas reported in Section IV-B and IV-C. Fortunately, as wehave shown, the miscounts caused by such fluctuations arelargely negligible. We could apply Hidden Markov Models(HMMs) [31] to maintain the temporal consistency of occu-pancy count so as to improve the inference accuracy underdynamic pattern. Nevertheless, it would certainly retard theresponse of CeilingSee to count actual changes.
E. Energy Consumption
Since CeilingSee utilizes existing lighting infrastructure aslight sources, we do not count in the energy consumptionfor illumination. Consequently, the energy consumption ofCeilingSee mainly involves the energy consumed by the drivercircuits and microcontrollers of the LED sensing units. Thedriver circuit of one sensing unit works at a DC voltage of± 5V. It consumes 10.1mW when it works in the sensingstate, and at most 50mW when working in illuminating state.The energy consumption of the MCU is 24mW. Therefore, thetotal energy consumption is 34.1mW for a typical CeilingSeesensing unit under its sensing state. As MCUs and drivers aredefault components in general LED illumination devices, theextra power consumption of our CeilingSee sensing unit isonly 10.1mW. This extra power consumption is incurred bythe amplifier circuits on re-designed driver. Moreover, sincedata transmission of sensed data can also be integrated intoVLC or Power Line Communication (PLC) [32], the powerconsumption for data transmission can be neglected. Theenergy consumption caused by computations on the laptopcan also be ignored given that the laptop is working onmany other tasks at the same time. In summary, CeilingSeeis energy efficient for occupancy inference. We list the powerconsumptions in Table III.
TABLE IIIENERGY CONSUMPTION OF ONE SENSING UNIT.
Sensing Sensing & illuminatingDriver 10.1mW 50.0mWMCU 24.0mW 24.1mWTotal 34.1mW 74.1mW
V. CONCLUSIONS
In this paper, to efficiently estimate indoor occupancy, wehave developed a device-free system, CeilingSee, that pig-gybacks on existing LED lighting infrastructure. The system

consists of two main components: 1) a re-designed LEDdriver, which leverages LED’s photoelectric effect to transforma light emitter to a light sensor, so as to obtain variancesin ambient reflection in the form of snapshots in any time,and 2) a machine-learning-based algorithm to infer indooroccupancy using the snapshots as input in real time. To verifythe efficiency and effectiveness of the developed system, wehave conducted extensive experiments in a testbed covering a30m2 laboratory area. The experiment results have shown verypromising performance of CeilingSee and hence demonstratedits great potentials to be applied to many smart buildingapplications. In our future work, we plan to further improvethe performance of CeilingSee, to develop various intelligentsystems that provide personalized services or security moni-toring on top of this system, as well as to extend its applicationto outdoor environments.
REFERENCES
[1] P. Bahl and V. Padmanabhan, “RADAR: an In-building RF-based UserLocation and Tracking System,” in Proc. of 19th IEEE INFOCOM, 2000,pp. 775–784.
[2] Y. Kuo, P. Pannuto, K. Hsiao, and P. Dutta, “Luxapose: Indoor Posi-tioning with Mobile Phones and Visible Light,” in Proc. of 20th ACMMobiCom, 2014, pp. 447–458.
[3] C. Zhang, F. Li, J. Luo, and Y. He, “iLocScan: Harnessing Multipathfor Simultaneous Indoor Source Localization and Space Scanning,” inProc. of the 12th ACM SenSys, 2014, pp. 91–104.
[4] C. Zhang, K. Subbu, J. Luo, and J. Wu, “GROPING: Geomagnetism andcROwdsensing Powered Indoor NaviGation,” IEEE Trans. on MobileComputing, vol. 14, no. 2, pp. 387–400, 2015.
[5] L. Audin, Occupancy Sensors: Promise and Pitfalls, ser. Tech Update,Tu-93-8. Boulder, CO: E Source, Inc., 1999.
[6] R. Dodier, G. Henze, D. Tiller, and X. Guo, “Building Occupancy De-tection Through Sensor Belief Networks,” Elsevier Energy and Building,vol. 38, no. 9, pp. 1033–1043, 2006.
[7] A. Beltran, V. L. Erickson, and A. E. Cerpa, “ThermoSense: OccupancyThermal Based Sensing for HVAC Control,” in Proc. of the 5th ACMBuildSys, 2013, pp. 11:1–11:8.
[8] V. L. Erickson, S. Achleitner, and A. E. Cerpa, “POEM: Power-EfficientOccupancy-based Energy Management System,” in Proc. of the 12thACM/IEEE IPSN, 2013, pp. 203–216.
[9] S. P. Tarzia, R. P. Dick, P. A. Dinda, and G. Memik, “Sonar-basedMeasurement of User Presence and Attention,” in Proc. of the 11thACM UbiComp 2009, 2009, pp. 89–92.
[10] T. W. Hnat, E. Griffiths, R. Dawson, and K. Whitehouse, “Doorjamb:Unobtrusive Room-level Tracking of People in Homes Using DoorwaySensors,” in Proc. of the 10th ACM SenSys, 2012, pp. 309–322.
[11] O. Shih and A. Rowe, “Occupancy Estimation Using Ultrasonic Chirps,”in Proc. of the 6th ACM/IEEE ICCPS, 2015, pp. 149–158.
[12] D. Yang, H. Gonzalez-Banos, and L. Guibas, “Counting People inCrowds with a Real-Time Network of Simple Image Sensors,” in Proc.of the 9th IEEE ICCV, 2003, pp. 122–129.
[13] V. Erickson, M. Carreira-Perpinan, and A. Cerpa, “OBSERVE:Occupancy-Based System for Efficient Reduction of HVAC Energy,”in Proc. of the 10th ACM/IEEE IPSN, 2011, pp. 258–269.
[14] C. L. Chen, S. Gong, and T. Xiang, “From Semi-Supervised to TransferCounting of Crowds,” in Proc. of the 14th IEEE ICCV, 2013, pp. 2256–2263.
[15] B. Balaji, J. Xu, A. Nwokafor, R. Gupta, and Y. Agarwal, “Sentinel:Occupancy Based HVAC Actuation Using Existing WiFi InfrastructureWithin Commercial Buildings,” in Proc. of the 11th ACM SenSys, 2013,pp. 17:1–17:14.
[16] L. Yang, K. Ting, and M. Srivastava, “Inferring Occupancy fromOpportunistically Available Sensor Data,” in Proc. of the 12th IEEEPerCom, 2014, pp. 60–68.
[17] M. Ibrahim, V. Nguyen, S. Rupavatharam, M. Jawahar, M. Gruteser,and R. Howard, “Visible Light Based Activity Sensing Using CeilingPhotosensors,” in Proc. of the 3rd ACM VLCS Workshop, 2016, pp. 43–48.
[18] T. Komine and M. Nakagawa, “Fundamental Analysis for Visible-LightCommunication System using LED Lights,” IEEE Trans. on ConsumerElectronics, vol. 50, no. 1, pp. 100–107, 2004.
[19] S. Schmid, G. Corbellini, S. Mangold, and T. R. Gross, “LED-to-LEDVisible Light Communication Networks,” in Proc. of the 14th ACMMobiHoc, 2013, pp. 1–10.
[20] H.-Y. Lee, H.-M. Lin, Y.-L. Wei, H.-I. Wu, H.-M. Tsai, and K. C.-J.Lin, “RollingLight: Enabling Line-of-Sight Light-to-Camera Communi-cations,” in Proc. of the 13th ACM MobiSys, 2015, pp. 167–180.
[21] J. Hao, Y. Yang, and J. Luo, “CeilingCast: Energy Efficient andLocation-Bound Broadcast Through LED-Camera Communication,” inProc. of the 35th IEEE INFOCOM, 2016, pp. 1629–1637.
[22] T. Li, C. An, Z. Tian, A. T. Campbell, and X. Zhou, “Human SensingUsing Visible Light Communication,” in Proc. of the 21st ACM Mobi-Com, 2015, pp. 331–344.
[23] P. Dietz, W. Yerazunis, and D. Leigh, “Very Low-Cost Sensing andCommunication Using Bidirectional LEDs,” in Proc. of the 5th ACMUbiComp 2003, 2003, pp. 175–191.
[24] F. M. Mims, Siliconnections: Coming of Age in the Electronic Era. NewYork: McGraw-Hill, 1986.
[25] LUXEON XF-3535L, “http://www.lumileds.com/products/matrix-platform/luxeon-xf-3535l.”
[26] Illuminance, “http://www.engineeringtoolbox.com/light-level-rooms-d 708.html.”
[27] A. J. Smola and B. Scholkopf, “A Tutorial on Support Vector Regres-sion,” Statistics and Computing, vol. 14, no. 3, pp. 199–222, 2004.
[28] J. Ma, J. Theiler, and S. Perkins, “Accurate On-line Support VectorRegression,” Neural Computation, vol. 15, no. 11, pp. 2683–2703, 2003.
[29] CC2541, “http://www.ti.com/lit/ds/symlink/cc2541.pdf.”[30] BLE-STACK, “http://www.ti.com/product/CC2541/toolssoftware.”[31] L. R. Rabiner, “A Tutorial on Hidden Markov Models and Selected
Applications in Speech Recognition,” Proceedings of the IEEE, vol. 77,no. 2, pp. 257–286, 1989.
[32] H. Ma, L. Lampe, and S. Hranilovic, “Integration of Indoor VisibleLight and Power Line Communication Systems,” in Proc. of 17th IEEEISPLC, 2013, pp. 291–296.